estimating functional brain maturity in very and … · we developed an automated measure of eeg...
TRANSCRIPT

See discussions, stats, and author profiles for this publication at: https://www.researchgate.net/publication/309430114
ESTIMATING THE GESTATIONAL AGE OF PRETERM INFANTS WITH EEG
Conference Paper · October 2016
CITATIONS
0
5 authors, including:
Some of the authors of this publication are also working on these related projects:
Neonatal Brain Research View project
Prenatal Maternal SRI use affecting infant brain maturation View project
John M. O' Toole
University College Cork
64 PUBLICATIONS 380 CITATIONS
SEE PROFILE
Elena Pavlidis
Child Neuropsychiatry - AUSL Carpi, Modena
49 PUBLICATIONS 106 CITATIONS
SEE PROFILE
Sampsa Vanhatalo
University of Helsinki
205 PUBLICATIONS 4,072 CITATIONS
SEE PROFILE
Nathan Stevenson
Queensland Institute of Medical Research
79 PUBLICATIONS 683 CITATIONS
SEE PROFILE
All content following this page was uploaded by Sampsa Vanhatalo on 14 November 2016.
The user has requested enhancement of the downloaded file.

Clinical Neurophysiology 127 (2016) 2910–2918
Contents lists available at ScienceDirect
Clinical Neurophysiology
journal homepage: www.elsevier .com/locate /c l inph
Estimating functional brain maturity in very and extremely pretermneonates using automated analysis of the electroencephalogram
http://dx.doi.org/10.1016/j.clinph.2016.02.0241388-2457/� 2016 International Federation of Clinical Neurophysiology. Published by Elsevier Ireland Ltd. All rights reserved.
⇑ Corresponding author at: BABA Center, Children’s Hospital, Helsinki UniversityCentral Hospital, P.O. Box 280, 00029 HUS, Finland. Tel.: +358 294 1911; fax: +3582941 26638.
E-mail address: [email protected] (N.J. Stevenson).
J.M. O’Toole a, G.B. Boylan a, S. Vanhatalo b, N.J. Stevenson a,c,⇑aNeonatal Brain Research Group, Irish Centre for Fetal and Neonatal Translational Research, University College Cork, IrelandbDepartment of Clinical Neurophysiology, Children’s Hospital, HUS Medical Imaging Center, University of Helsinki and Helsinki University Hospital, Helsinki, FinlandcClinicum, University of Helsinki, Finland
See Editorial, pages 2908–2909
a r t i c l e i n f o
Article history:Accepted 12 February 2016Available online 16 April 2016
Keywords:Preterm neonateAutomated EEG analysisSupport vector regressionClinical neurophysiologyDysmaturity
h i g h l i g h t s
� Automated analysis of the EEG provides a widely accessible, noninvasive and continuous assessmentof brain activity.
� We developed an automated measure of EEG maturational age in the very and extremely prematureneonate.
� Automated estimates of EEG maturational age are correlated with gestational age.
a b s t r a c t
Objective: To develop an automated estimate of EEG maturational age (EMA) for preterm neonates.Methods: The EMA estimator was based on the analysis of hourly epochs of EEG from 49 neonates withgestational age (GA) ranging from 23 to 32 weeks. Neonates had appropriate EEG for GA based on visualinterpretation of the EEG. The EMA estimator used a linear combination (support vector regression) of asubset of 41 features based on amplitude, temporal and spatial characteristics of EEG segments.Estimator performance was measured with the mean square error (MSE), standard deviation of the esti-mate (SD) and the percentage error (SE) between the known GA and estimated EMA.Results: The EMA estimator provided an unbiased estimate of EMA with a MSE of 82 days (SD = 9.1 days;SE = 4.8%) which was significantly lower than a nominal reading (the mean GA in the dataset; MSE of267 days, SD of 16.3 days, SE = 8.4%: p < 0.001). The EMA estimator with the lowest MSE used amplitude,spatial and temporal EEG characteristics.Conclusions: The proposed automated EMA estimator provides an accurate estimate of EMA in early pre-term neonates.Significance: Automated analysis of the EEG provides a widely accessible, noninvasive and continuousassessment of functional brain maturity.� 2016 International Federation of Clinical Neurophysiology. Published by Elsevier Ireland Ltd. All rights
reserved.
1. Introduction
Every year, over two million babies are born very or extremelypremature, less than 32 weeks gestational age (GA), and willrequire admission to a neonatal intensive care unit (NICU)(Blencowe et al., 2012). Neurological complications fromprematurity can result in a 10–25 fold increase in annual health-care costs (Kancherla et al., 2012). While recent progress in

J.M. O’Toole et al. / Clinical Neurophysiology 127 (2016) 2910–2918 2911
cardio-respiratory intensive care has increased the numbers of sur-viving neonates, the proportion of survivors with lifelong neu-rocognitive disabilities has not significantly declined (Saigal andDoyle, 2008; Sellier et al., 2010). This developmental compromisemay originate from neurological complications associated withconditions such as infection, cerebral haemorrhage and lung dis-ease which are acquired during a stay in the NICU (Volpe, 2001).Many of these issues can be treated or prevented by prompt cot-side recognition. It is, therefore, important that the neurologicalfunction of preterm neonates is carefully monitored in the NICU.
Currently available, noninvasive, tools for monitoring brainfunction in the NICU include electroencephalography (EEG) andnear infrared spectroscopy which can be supplemented with struc-tural information from imaging methods such as cranial ultra-sound and magnetic resonance imaging. Clinical work in the1970’s, mostly based on visual EEG interpretation, has establishedwell recognised developmental changes in EEG activity (Andréet al., 2010; Aminoff, 2012). These visually observed changes inEEG waveforms can be explained in the context of early develop-mental changes in neuronal networks and their molecular expres-sions (Vanhatalo and Kaila, 2006). This has informed clinical EEGreview of preterm neonates which is based on detecting deviancesin EEG maturational age (EMA) from what is expected at a givenconceptual or maturational age (MA) (Scher, 1997). A well trainedclinical electroencephalographer may be able to visually detectdelayed maturation or dysmaturity of approximately two weeks(Parmelee et al., 1968). Such analysis is, however, challenged byseveral caveats: (1) it is qualitative, (2) the required expertiseand access to facilities are limited and (3) assessment is rarely per-formed in a spatial context.
A device that provides a computational means of tracking EEGbrain maturation in preterm neonates, allowing comparison ofthe recorded and expected EEG maturation, would be a useful toolfor clinicians in the NICU (Scher, 1997). Quantitative analyses havesuggested a wide variety of signal properties, estimated from auto-mated segmentations of the EEG and measurements of spectralpower, amplitude and connectivity, that correlate with MA(Holthausen et al., 2000; Niemarkt et al., 2011; O’Reilly et al.,2012; Koolen et al., 2014; Meijer et al., 2014; Murphy et al.,2015; Saji et al., 2015; Schumacher et al., 2015). These analysesprovide a candidate feature set for use in an automated EMA esti-mator in the very and extremely premature neonate.
In the present work, we developed an ‘‘EMA estimator” for pre-term neonates, with appropriate EEG for GA, based on automatedanalysis of the EEG. We used a combination of well studied fea-tures that have been shown to correlate with MA extracted fromdifferent segments of the EEG recording. The performance of ourEMA estimator was then evaluated on a relatively large databaseof preterm neonates to provide proof of concept evidence for thedesign of a novel automated EEG maturity index.
2. Method
2.1. Database
2.1.1. SubjectsA database of EEG recordings from 49 preterm neonates with
appropriate EEG for GA was used to develop the automated EMAestimator. Neonates with a range of GA from 23 weeks plus 3 daysto 32 weeks plus 0 days (164–224 days) were included in the data-base. The distribution of GA in the database is shown in Fig. 1(A);the mean GA was 28.6 weeks (198 days) with a standard deviationof 16 days. Neonates were enrolled for EEG monitoring from theNICU of the Cork University Maternity Hospital, Ireland from Jan-uary 2009 to October 2011. Approval for the study was obtained
from the Clinical Research Ethics Committees of the Cork Teachinghospitals, Ireland. Written, informed consent was received from atleast one parent of each neonate included in the study.
2.1.2. EEG recordingMulti-channel, conventional video-EEG recording was com-
menced on enrolment (within 72 h of birth) and continued for upto 3 days. A Nicolet One EEG machine (Natus Medical Inc., Pleasan-ton, CA, USA) was used to acquire the EEG. An array of 10 scalpelectrodes were placed according to the International 10–20 sys-tem of electrode placement modified for neonates: frontal (F3,F4), central (C3, C4, Cz), temporal (T3, T4), occipital (O1, O2), anda reference. A bipolar montage of 8 channels was used in thisstudy: C4–O2, C3–O1, C4–T4, C3–T3, C4–Cz, Cz–C3, F4–C4, F3–C3. Electrode to scalp impedance was maintained below 5 kΩwhen possible. EEGs were recorded with a sampling frequency of256 Hz. After each EEG was recorded, all identifiable patient infor-mation was removed from the recording and the EEG was storedwith a unique study number.
2.1.3. EEG reviewThe EEGs were examined by an experienced neonatal neuro-
physiologist (GBB) and were included if the EEG was judged tobe appropriate for MA (André et al., 2010; Aminoff, 2012) and noclear abnormalities were present on the EEG (Watanabe et al.,1999; André et al., 2010). This resulted in the inclusion of theEEG recordings of 49 out of a possible 80 preterm neonates. TheEEG recordings from these neonates were then segmented intothree, hour long epochs (147 epochs in total) that were predomi-nantly free of significant artefact.
2.1.4. MA assignmentThe EMA estimator was developed with the aim of minimising
the error between the EMA and GA. The GA was assigned using thebest obstetric estimate, an estimate based on the mother’s reportof the first day of their last menstrual period (LMP) as well as ultra-sound (US) assessment at approximately 12 weeks GA (Engle et al.,2004). The LMP was used as the primary method of attributing aGA unless there was significant (greater than 7 days) deviationbetween reported LMP and US assessment at which point the USdate was used. For analysis, we considered this definition of GAas the MA because the EEG was recorded so close to birth; themedian postnatal age of EEG recording was 15 h (interquartilerange, IQR: 6–19). More specifically, we assumed that GA wasapproximately post-menstrual age (PMA) which is a biased esti-mate of MA, see Fig. 1(B). This minimised any confounding effectsfrom differences between intra-uterine and extra-uterine matura-tion on the EEG (Nunes et al., 2014; Shany et al., 2014).
2.2. Automated EEG analysis
The automated analysis of the EEG was based on the extractionof features or characteristics of the EEG that have been shown tocorrelate with MA. These features include spectral power, inter-hemispheric synchrony and inter-burst interval (Aminoff, 2012).Example epochs of preterm EEG are shown in Fig. 2. These featureswere extracted from segments of EEG that relate to underlyingphysiological activity. The segmentation of the EEG was based onthe model of preterm EEG proposed by Vanhatalo and Kaila(2006), see Fig. 2(C) in the text and Fig. 3 in Vanhatalo and Kaila(2006) for more details. During early brain development, cortical(EEG) activity consists of unique intermittent activity that is con-sidered crucial for brain maturation. This activity is readilyobserved in the EEG as spontaneous activity transients (SAT),which alternate with periods of gradually increasing continuouscortical activity (inter-SAT). The intrinsic properties of these two
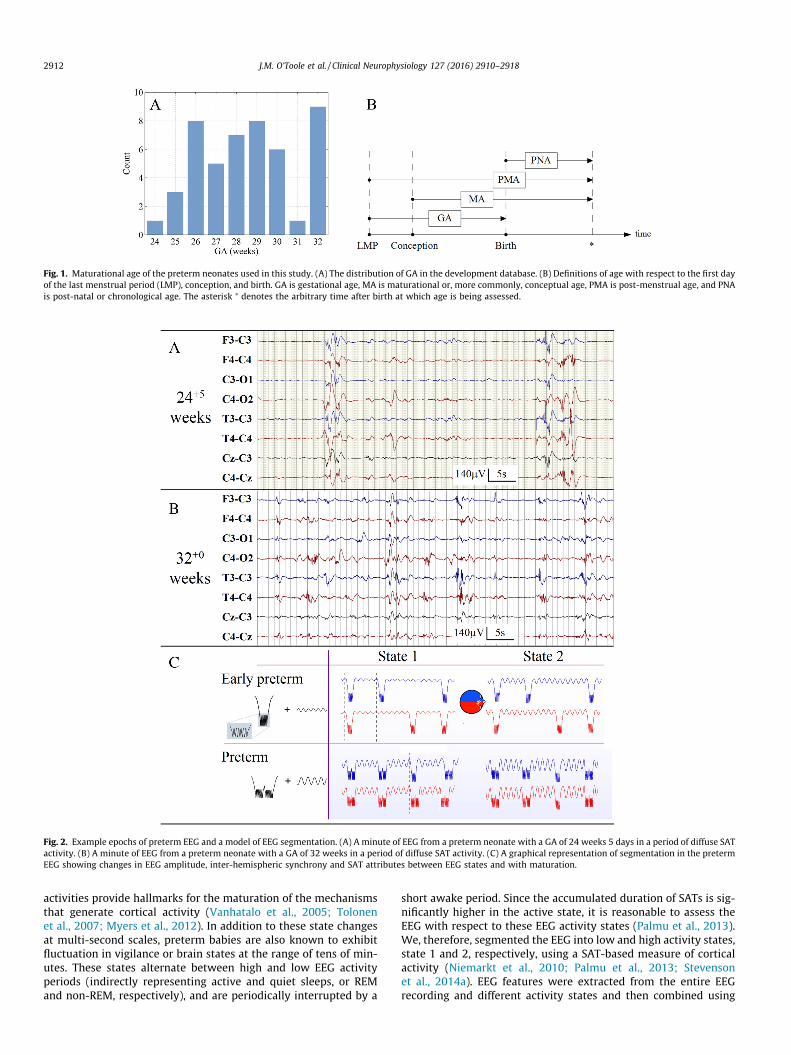
Fig. 1. Maturational age of the preterm neonates used in this study. (A) The distribution of GA in the development database. (B) Definitions of age with respect to the first dayof the last menstrual period (LMP), conception, and birth. GA is gestational age, MA is maturational or, more commonly, conceptual age, PMA is post-menstrual age, and PNAis post-natal or chronological age. The asterisk ⁄ denotes the arbitrary time after birth at which age is being assessed.
Fig. 2. Example epochs of preterm EEG and a model of EEG segmentation. (A) A minute of EEG from a preterm neonate with a GA of 24 weeks 5 days in a period of diffuse SATactivity. (B) A minute of EEG from a preterm neonate with a GA of 32 weeks in a period of diffuse SAT activity. (C) A graphical representation of segmentation in the pretermEEG showing changes in EEG amplitude, inter-hemispheric synchrony and SAT attributes between EEG states and with maturation.
2912 J.M. O’Toole et al. / Clinical Neurophysiology 127 (2016) 2910–2918
activities provide hallmarks for the maturation of the mechanismsthat generate cortical activity (Vanhatalo et al., 2005; Tolonenet al., 2007; Myers et al., 2012). In addition to these state changesat multi-second scales, preterm babies are also known to exhibitfluctuation in vigilance or brain states at the range of tens of min-utes. These states alternate between high and low EEG activityperiods (indirectly representing active and quiet sleeps, or REMand non-REM, respectively), and are periodically interrupted by a
short awake period. Since the accumulated duration of SATs is sig-nificantly higher in the active state, it is reasonable to assess theEEG with respect to these EEG activity states (Palmu et al., 2013).We, therefore, segmented the EEG into low and high activity states,state 1 and 2, respectively, using a SAT-based measure of corticalactivity (Niemarkt et al., 2010; Palmu et al., 2013; Stevensonet al., 2014a). EEG features were extracted from the entire EEGrecording and different activity states and then combined using

Fig. 3. Automated estimation of EEG maturational age (EMA). The thin connectinglines defines a single channel output and the thick connecting lines define an 8-channel output. ES is medium duration EEG state, SAT is spontaneous activitytransient and SVR is support vector regression.
J.M. O’Toole et al. / Clinical Neurophysiology 127 (2016) 2910–2918 2913
support vector regression (SVR) to generate an EMA estimate, seeFig. 3.
2.2.1. Pre-processing and segmentationThe EEG signals were initially filtered with a Butterworth, 1st
order, high-pass filter with a cut-off frequency of 0.5 Hz and thendown-sampled, with anti-aliasing low pass filtering, to 64 Hz.
Periods of SAT and inter-SAT were segmented on each channelusing the SAT detection algorithm of Palmu et al. (2010). We used aslight modification to the post-processing stage. In our case, we usea threshold of 5 lV2, rather than 1.5 lV2, in order to account fordifferences in the frequency response of the nonlinear energy oper-ator applied to the EEG at a reduced sampling frequency. The out-put of this algorithm was a binary time-series where 1 denotes thepresence of SAT and 0 the presence of inter-SAT and the minimumSAT duration was one second.
This automated annotation was utilised in two further pre-processing stages: EEG activity state segmentation and artefactdetection.
The SAT annotations were used to determine EEG activity statesvia the SAT%, defined as,
SAT%ðtÞ ¼ 1T
Z tþT=2
t�T=2SATðt0Þdt0 ð1Þ
where t is time in seconds, T is 300 s (5 min) and SAT(t) is the binarySAT annotation, see Fig. 4(D). This signal was then de-trended usinga linear function and then segmented using an adaptive threshold.The threshold was chosen to ensure that the accumulated durationof each EEG activity state was approximately equal. The assumptionof such a threshold is that changes in EEG activity states wereapparent in every recording and the accumulated duration of eachEEG state was approximately equal. A final stage was implementedto ensure a minimum EEG activity state duration of 5 min.
Two forms of artefact were present in the EEG recordings of ourdataset: high amplitude artefacts and low amplitude artefacts.Simple methods of detecting each artefact were implemented.High amplitude artefacts are typically caused by patient movementor disruption to the recording by clinical staff. In order to detectlarge amplitude artefacts the SAT periods were investigated. Dis-crete SAT events where the maximum absolute EEG valueexceeded 500 lV on at least 2 out of 8 channels were assumed tobe artefactual, see Fig. 4(B). Any detection of high amplitude arte-fact resulted in all 8 channels of EEG being eliminated from subse-quent analysis. Low amplitude artefacts are typically caused bybridging between electrodes resulting in low activity on distinctchannels of a bipolar montage (see Fig. 4A). Low amplitude wasdefined as an order of magnitude less (10�1) than the median abso-lute amplitude of the entire EEG recording across all EEG channels.
Any detection of low amplitude artefact resulted in the detectedEEG channels being ignored in subsequent analysis.
2.2.2. Feature extractionSeveral features, expected to correlate with EMA, were
extracted from the EEG. These measures can be generalised intothree classes: amplitude, spatial organisation and temporalorganisation.
Amplitude features represent the raw EEG voltage. We used twotypes of amplitude estimate: the signal envelope based on the ana-lytic associate of a signal and the range EEG (rEEG) (O’Reilly et al.,2012). The signal envelope is |z(t)| = |x(t) + jH{x(t)}| where H is theHilbert transform, j denotes a complex number and x(t) is the EEGsignal. The rEEG is defined as maximum EEG value minus the min-imum EEG value within a non-overlapping 2 s window (O’Reillyet al., 2012).
The amplitude was further measured across different frequencybands using the power spectral density. A periodogram with nosmoothing was used to estimate the power spectral density. Thefrequency bands used in analysis were 0.5–3, 3–8, 8–15, and 15–30 Hz. These were modified from traditional band definitions tobetter suit the distribution of EEG energy with respect to frequencyin preterm neonates (Tokariev et al., 2012). Relative band measureswere defined by dividing the power in a specific frequency band bythe total power in all frequency bands of interest.
RB ¼RB jXðf Þj2dfRW jXðf Þj2df
ð2Þ
where RB is the relative spectral power in band B, B is the range ofthe band of interest, W ranges on [0.5, 30] Hz and X(f) is the Fouriertransform of the EEG signal. The implementation of the SAT detec-tor means that amplitude features were estimated on data from theentire EEG recording and on each SAT. When estimating spectralband power on a SAT by SAT basis, only SATs with a minimum dura-tion of two seconds were used to ensure a minimum frequency res-olution of 0.5 Hz.
Measures of the temporal organisation of the EEG were basedon the SAT detection output. The algorithm was run independentlyon each channel of the EEG. The resultant annotation was sum-marised with measures such as SAT duration, inter-SAT interval(also referred to as inter-burst interval), and number of SATs perhour.
Measures of the spatial organisation of the EEG assessed theinter-hemispheric synchrony between EEG channels. We used animplementation of the activation symmetry index (Räsänen et al.,2013) and Pearson’s correlation between channel envelopes(|z(t)|). These measures were applied to 3 channel pairs (F3–C3/F4–C4, C4–T4/C3–T3, and C4–O2/C3–O1).
All measures were estimated on each channel, where applica-ble, and summarised over time or SAT segments. These values werethen summarised across EEG channels using the median. In orderto account for possible rapid postnatal adaption we also used thetime after birth of the EEG recording as a feature. A summary ofthe features used are shown in Table 1. These features were sum-marised with a variety of statistics such as percentiles or the rootmean square. Amplitude measures were estimated on all availabledata (12 features) or on SAT and inter-SAT periods (18 features). Alltemporal features were estimated directly from the automated SATannotation (9 features). Only two spatial features were used. These41 features were estimated on three different segmentations: (1)the entire EEG recording, (2) S1 (low activity or quiet sleep) or(3) S2 (high activity or active sleep); resulting in a total of 124 fea-tures (including postnatal age of EEG recording).
We assessed several combinations of feature class extractedfrom different data segments, selected a priori, in order to assess
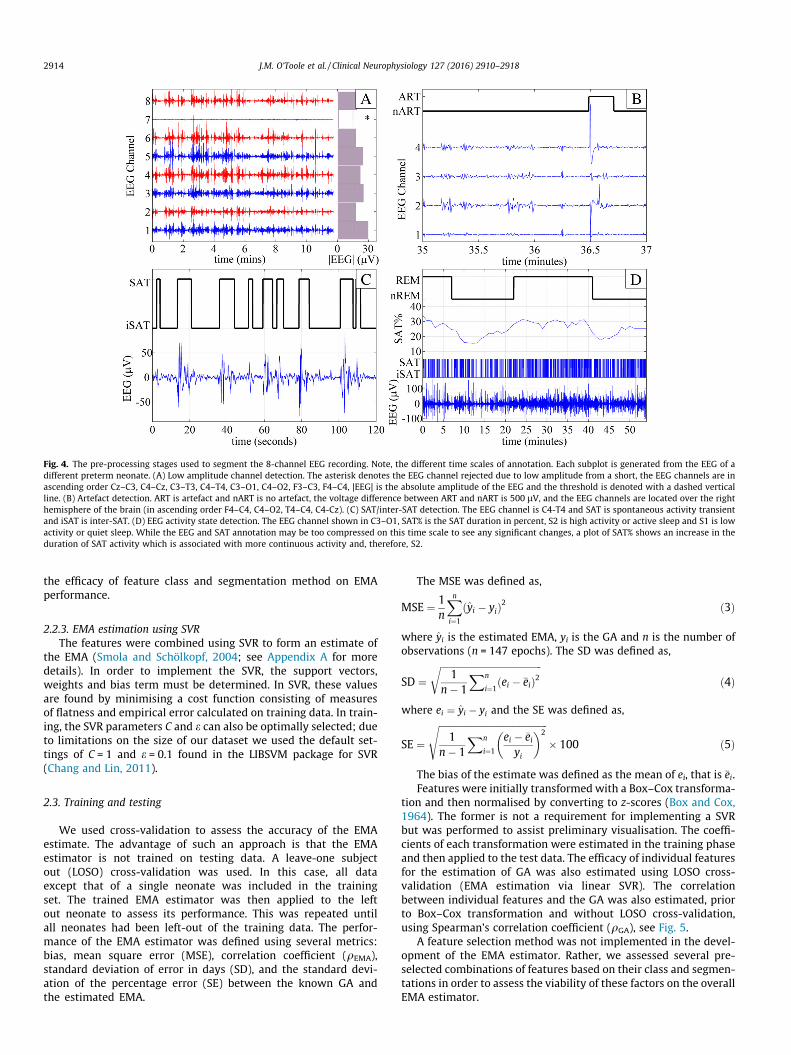
Fig. 4. The pre-processing stages used to segment the 8-channel EEG recording. Note, the different time scales of annotation. Each subplot is generated from the EEG of adifferent preterm neonate. (A) Low amplitude channel detection. The asterisk denotes the EEG channel rejected due to low amplitude from a short, the EEG channels are inascending order Cz–C3, C4–Cz, C3–T3, C4–T4, C3–O1, C4–O2, F3–C3, F4–C4, |EEG| is the absolute amplitude of the EEG and the threshold is denoted with a dashed verticalline. (B) Artefact detection. ART is artefact and nART is no artefact, the voltage difference between ART and nART is 500 lV, and the EEG channels are located over the righthemisphere of the brain (in ascending order F4–C4, C4–O2, T4–C4, C4-Cz). (C) SAT/inter-SAT detection. The EEG channel is C4-T4 and SAT is spontaneous activity transientand iSAT is inter-SAT. (D) EEG activity state detection. The EEG channel shown in C3–O1, SAT% is the SAT duration in percent, S2 is high activity or active sleep and S1 is lowactivity or quiet sleep. While the EEG and SAT annotation may be too compressed on this time scale to see any significant changes, a plot of SAT% shows an increase in theduration of SAT activity which is associated with more continuous activity and, therefore, S2.
2914 J.M. O’Toole et al. / Clinical Neurophysiology 127 (2016) 2910–2918
the efficacy of feature class and segmentation method on EMAperformance.
2.2.3. EMA estimation using SVRThe features were combined using SVR to form an estimate of
the EMA (Smola and Schölkopf, 2004; see Appendix A for moredetails). In order to implement the SVR, the support vectors,weights and bias term must be determined. In SVR, these valuesare found by minimising a cost function consisting of measuresof flatness and empirical error calculated on training data. In train-ing, the SVR parameters C and e can also be optimally selected; dueto limitations on the size of our dataset we used the default set-tings of C = 1 and e = 0.1 found in the LIBSVM package for SVR(Chang and Lin, 2011).
2.3. Training and testing
We used cross-validation to assess the accuracy of the EMAestimate. The advantage of such an approach is that the EMAestimator is not trained on testing data. A leave-one subjectout (LOSO) cross-validation was used. In this case, all dataexcept that of a single neonate was included in the trainingset. The trained EMA estimator was then applied to the leftout neonate to assess its performance. This was repeated untilall neonates had been left-out of the training data. The perfor-mance of the EMA estimator was defined using several metrics:bias, mean square error (MSE), correlation coefficient (qEMA),standard deviation of error in days (SD), and the standard devi-ation of the percentage error (SE) between the known GA andthe estimated EMA.
The MSE was defined as,
MSE ¼ 1n
Xni¼1
yi � yið Þ2 ð3Þ
where yi is the estimated EMA, yi is the GA and n is the number ofobservations (n = 147 epochs). The SD was defined as,
SD ¼ffiffiffiffiffiffiffiffiffiffiffiffiffiffiffiffiffiffiffiffiffiffiffiffiffiffiffiffiffiffiffiffiffiffiffiffiffiffiffiffiffiffiffiffi1
n� 1
Xn
i¼1ðei � �eiÞ2
rð4Þ
where ei ¼ yi � yi and the SE was defined as,
SE ¼ffiffiffiffiffiffiffiffiffiffiffiffiffiffiffiffiffiffiffiffiffiffiffiffiffiffiffiffiffiffiffiffiffiffiffiffiffiffiffiffiffiffiffiffiffiffiffi1
n� 1
Xn
i¼1
ei � �eiyi
� �2s
� 100 ð5Þ
The bias of the estimate was defined as the mean of ei, that is �ei.Features were initially transformed with a Box–Cox transforma-
tion and then normalised by converting to z-scores (Box and Cox,1964). The former is not a requirement for implementing a SVRbut was performed to assist preliminary visualisation. The coeffi-cients of each transformation were estimated in the training phaseand then applied to the test data. The efficacy of individual featuresfor the estimation of GA was also estimated using LOSO cross-validation (EMA estimation via linear SVR). The correlationbetween individual features and the GA was also estimated, priorto Box–Cox transformation and without LOSO cross-validation,using Spearman’s correlation coefficient (qGA), see Fig. 5.
A feature selection method was not implemented in the devel-opment of the EMA estimator. Rather, we assessed several pre-selected combinations of features based on their class and segmen-tations in order to assess the viability of these factors on the overallEMA estimator.

Table 1Features used in analysis. N/A implies that summarising is inherent in the calculation of the feature, SAT is spontaneous activity transient and RMS is root mean square. Thespectral features estimated on the entire EEG segment produced a single value; however, when estimated on SATs the 5th, 50th and 95th percentiles were generated.
Feature class Feature Summary statistics Segments Number
Amplitude Envelope 5th, 50th, 95th EEG, SAT, inter-SAT 9rEEG 5th, 50th, 95th EEG 3Total power (0.5–30 Hz) N/A EEG 1Relative delta power (0.5–3 Hz) N/A, 5th, 50th, 95th EEG, SAT 4Relative theta power (3–8 Hz) N/A, 5th, 50th, 95th EEG, SAT 4Relative alpha power (8–15 Hz) N/A, 5th, 50th, 95th EEG, SAT 4Relative beta power (15–30 Hz) N/A, 5th, 50th, 95th EEG, SAT 4Temporal theta power (3–8 Hz) N/A EEG 1
Temporal Number of SATs per hour N/A EEG 1SAT duration 5th, 50th, 95th, RMS EEG 4Inter-SAT duration 5th, 50th, 95th, RMS EEG 4
Spatial Correlation of the envelope N/A EEG 1Activation symmetry index N/A EEG 1
Other Postnatal age of EEG recording N/A N/A 1
Fig. 5. Scatter plots of the relative beta power (RBP) with respect to gestational age. (A) The raw RBP value. (B) RBP after Box–Cox transformation using cross-validation. (C)RBP after Box–Cox transformation and support vector regression using cross-validation – the estimate of EEG maturational age (EMA).
J.M. O’Toole et al. / Clinical Neurophysiology 127 (2016) 2910–2918 2915
Comparisons between different EMA estimates were performedusing a paired t-test. Repeated measures in each neonate werereduced to a single summary measure per neonate using an aver-age so that n = 49. The intra-patient variability was estimatedusing the standard deviation between three EMA estimates perneonate which were then summarised across neonates with amedian and inter-quartile range.
3. Results
The artefact detection system eliminated high amplitude por-tions of EEG in 58 out of 147 EEG epochs. The median amount ofdata eliminated in these 58 epochs was 0.67% (IQR: 0.35–1.28).Channel shorting resulted in the removal of EEG channels in 22out of 147 EEG epochs; no more than 2 channels were removedin a single EEG epoch.
Features with the lowest MSE between the estimated and actualEMA are shown in Table 2 (only one summary statistic and seg-mentation is included for each feature). The 5th percentile of therelative beta power calculated across all SATs in the EEG recordinghad the lowest MSE. An EMA estimator based this feature had aSD = 11.05 days (SE = 5.79%). The median absolute error of thisestimator was 3.47% (IQR: 1.59–6.47%), which corresponds to acorrelation of 0.739 (95%CI: 0.656–0.805; Pearson’s correlationcoefficient), see Fig. 5.
The results of several combinations of features via linear SVRare shown in Table 3. The EMA estimator with the lowest MSE(referred to as the best EMA estimator) was based on a featureset that combined temporal, spatial and amplitude features andwere calculated in the low activity EEG state (quite sleep). The
median absolute error of this estimator was 2.69% (IQR: 1.17–4.91%), which corresponds to a correlation of 0.833 (95%CI:0.775–0.876; Pearson’s correlation coefficient), see Fig. 6.
The performance of the EMA estimator based on a combina-tion of features was significantly higher than the performanceof a single feature (SD = 9.08 vs. SD = 11.05: p = 0.019, n = 49;paired t-test) and the mean GA in the dataset which provides alower limit of possible performance (SD = 9.08 vs. SD = 16.30:p < 0.001, n = 49; paired t-test). The performance of the bestEMA estimator features was significantly higher than an estima-tor based on only spatial or temporal features (p < 0.001 andp < 0.001, respectively, n = 49; paired t-test), but was not signifi-cantly higher than an estimator based on only amplitude features(p = 0.292, n = 49; paired t-test).
The median intra-patient variability was 4.42 days (IQR: 2.79–6.40). Re-evaluating the performance of the estimator by usingan EMA averaged across the three time points per neonate reducedthe error to SD = 7.85 days (SE = 4.22%) and resulted in a correla-tion 0.889 (95% CI: 0.811–0.936) between known GA and esti-mated EMA.
The performance of the EMA estimator with respect to weeklyclassification intervals is shown in Table 4. The visual interpreta-tion of the EEG, the gold standard of EEG assessment of MA, hasa reported accuracy of approximately SD = 12.42 days(SE = 5.35%) (Parmelee et al., 1968). EMA estimates deviated bymore than two weeks from the GA in all three epochs of two neo-nates (neonates 8 and 32), two epochs from three neonates (neo-nates 4, 28 and 38) and one epoch in six neonates (neonates 3, 5,6, 24, 29 and 35). Visual interpretation of the EEG in the two out-liers (neonates 8 and 32) showed no obvious characteristics to
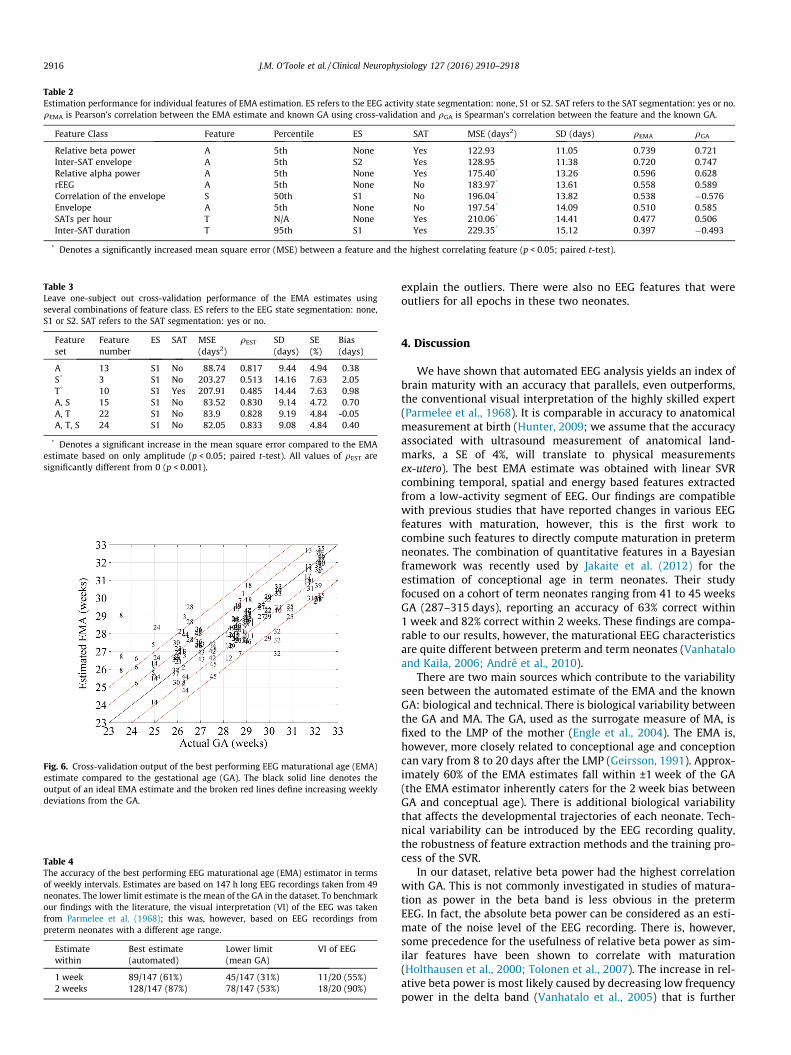
Table 2Estimation performance for individual features of EMA estimation. ES refers to the EEG activity state segmentation: none, S1 or S2. SAT refers to the SAT segmentation: yes or no.qEMA is Pearson’s correlation between the EMA estimate and known GA using cross-validation and qGA is Spearman’s correlation between the feature and the known GA.
Feature Class Feature Percentile ES SAT MSE (days2) SD (days) qEMA qGA
Relative beta power A 5th None Yes 122.93 11.05 0.739 0.721Inter-SAT envelope A 5th S2 Yes 128.95 11.38 0.720 0.747Relative alpha power A 5th None Yes 175.40* 13.26 0.596 0.628rEEG A 5th None No 183.97* 13.61 0.558 0.589Correlation of the envelope S 50th S1 No 196.04* 13.82 0.538 �0.576Envelope A 5th None No 197.54* 14.09 0.510 0.585SATs per hour T N/A None Yes 210.06* 14.41 0.477 0.506Inter-SAT duration T 95th S1 Yes 229.35* 15.12 0.397 �0.493
* Denotes a significantly increased mean square error (MSE) between a feature and the highest correlating feature (p < 0.05; paired t-test).
Table 3Leave one-subject out cross-validation performance of the EMA estimates usingseveral combinations of feature class. ES refers to the EEG state segmentation: none,S1 or S2. SAT refers to the SAT segmentation: yes or no.
Featureset
Featurenumber
ES SAT MSE(days2)
qEST SD(days)
SE(%)
Bias(days)
A 13 S1 No 88.74 0.817 9.44 4.94 0.38S* 3 S1 No 203.27 0.513 14.16 7.63 2.05T* 10 S1 Yes 207.91 0.485 14.44 7.63 0.98A, S 15 S1 No 83.52 0.830 9.14 4.72 0.70A, T 22 S1 No 83.9 0.828 9.19 4.84 -0.05A, T, S 24 S1 No 82.05 0.833 9.08 4.84 0.40
* Denotes a significant increase in the mean square error compared to the EMAestimate based on only amplitude (p < 0.05; paired t-test). All values of qEST aresignificantly different from 0 (p < 0.001).
Fig. 6. Cross-validation output of the best performing EEG maturational age (EMA)estimate compared to the gestational age (GA). The black solid line denotes theoutput of an ideal EMA estimate and the broken red lines define increasing weeklydeviations from the GA.
Table 4The accuracy of the best performing EEG maturational age (EMA) estimator in termsof weekly intervals. Estimates are based on 147 h long EEG recordings taken from 49neonates. The lower limit estimate is the mean of the GA in the dataset. To benchmarkour findings with the literature, the visual interpretation (VI) of the EEG was takenfrom Parmelee et al. (1968); this was, however, based on EEG recordings frompreterm neonates with a different age range.
Estimatewithin
Best estimate(automated)
Lower limit(mean GA)
VI of EEG
1 week 89/147 (61%) 45/147 (31%) 11/20 (55%)2 weeks 128/147 (87%) 78/147 (53%) 18/20 (90%)
2916 J.M. O’Toole et al. / Clinical Neurophysiology 127 (2016) 2910–2918
explain the outliers. There were also no EEG features that wereoutliers for all epochs in these two neonates.
4. Discussion
We have shown that automated EEG analysis yields an index ofbrain maturity with an accuracy that parallels, even outperforms,the conventional visual interpretation of the highly skilled expert(Parmelee et al., 1968). It is comparable in accuracy to anatomicalmeasurement at birth (Hunter, 2009; we assume that the accuracyassociated with ultrasound measurement of anatomical land-marks, a SE of 4%, will translate to physical measurementsex-utero). The best EMA estimate was obtained with linear SVRcombining temporal, spatial and energy based features extractedfrom a low-activity segment of EEG. Our findings are compatiblewith previous studies that have reported changes in various EEGfeatures with maturation, however, this is the first work tocombine such features to directly compute maturation in pretermneonates. The combination of quantitative features in a Bayesianframework was recently used by Jakaite et al. (2012) for theestimation of conceptional age in term neonates. Their studyfocused on a cohort of term neonates ranging from 41 to 45 weeksGA (287–315 days), reporting an accuracy of 63% correct within1 week and 82% correct within 2 weeks. These findings are compa-rable to our results, however, the maturational EEG characteristicsare quite different between preterm and term neonates (Vanhataloand Kaila, 2006; André et al., 2010).
There are two main sources which contribute to the variabilityseen between the automated estimate of the EMA and the knownGA: biological and technical. There is biological variability betweenthe GA and MA. The GA, used as the surrogate measure of MA, isfixed to the LMP of the mother (Engle et al., 2004). The EMA is,however, more closely related to conceptional age and conceptioncan vary from 8 to 20 days after the LMP (Geirsson, 1991). Approx-imately 60% of the EMA estimates fall within ±1 week of the GA(the EMA estimator inherently caters for the 2 week bias betweenGA and conceptual age). There is additional biological variabilitythat affects the developmental trajectories of each neonate. Tech-nical variability can be introduced by the EEG recording quality,the robustness of feature extraction methods and the training pro-cess of the SVR.
In our dataset, relative beta power had the highest correlationwith GA. This is not commonly investigated in studies of matura-tion as power in the beta band is less obvious in the pretermEEG. In fact, the absolute beta power can be considered as an esti-mate of the noise level of the EEG recording. There is, however,some precedence for the usefulness of relative beta power as sim-ilar features have been shown to correlate with maturation(Holthausen et al., 2000; Tolonen et al., 2007). The increase in rel-ative beta power is most likely caused by decreasing low frequencypower in the delta band (Vanhatalo et al., 2005) that is further

J.M. O’Toole et al. / Clinical Neurophysiology 127 (2016) 2910–2918 2917
accentuated by increases in absolute beta power with maturation(Tolonen et al., 2007). These findings support a flattening of theEEG frequency spectrum with early brain maturation, a trajectorythat continues beyond the neonatal period (Vanhatalo et al.,2005; Fransson et al., 2013; Chu et al., 2014).
The majority of high correlating features were measures of theextremes of the distribution of EEG amplitude in the recording.There is evidence, from other quantitative analyses, that measuresof amplitude have the strongest association with EEG maturation(Holthausen et al., 2000; Niemarkt et al., 2011; O’Reilly et al.,2012). This is interesting as EEG amplitude is not used in the con-ventional visual interpretation of the EEG which relies on estimat-ing features of temporal EEG behaviour such as interburst interval(inter-SAT duration) and burst/SAT duration, or specific waveformsand interhemispheric synchrony (André et al., 2010; Aminoff,2012). This may be due to physical differences in neonatal andadult EEG. In neonates, the EEG is highly focal and not, therefore,strongly affected by volume conduction as seen in adult EEG(Odabaee et al., 2013). This implies that neonatal EEG amplitudemay be a more accurate measure of underlying EEG cortical activ-ity and may reflect changes in the spatial constellation of EEGsource activity, which arise from the maturation of cortex/sub-plate activities, cortical folding, as well as intra-cortical networking(Vanhatalo and Kaila, 2006; Kostovic and Judas, 2010; Kilb et al.,2011; Iyer et al., 2015). Measures of amplitude summarised overtime are also not entirely independent of temporal changes ofthe EEG and the presence of specific waveforms such as temporaltheta and delta waves will alter relative spectral measures ofamplitude with respect to frequency bands.
Our best performing EMA estimate was based on the amplitude,spatial and temporal characteristics of the EEG, although this com-bination was not significantly better than an estimate based ononly amplitude features. This suggests that temporal and spatialcharacteristics provide minimal support to the EMA estimator. Apoint which is supported by the fact that spatial and temporalbased characteristics assessed independently provided a poor esti-mate of EMA in the very and extremely premature neonate. TheEMA estimator was improved when EEG activity state was takeninto account and when multiple estimates from each neonate wereaveraged.
A limitation of this study is the relatively small amount of dataused to optimise the EMA estimator (three 1 hour epochs from 49neonates), even though the current database represents a signifi-cant effort of data acquisition (approximately 2 years of collectionfrom a maternity services that averages 9000 deliveries per year).Furthermore, current research protocols in our NICU are limitedto the collection of EEG from very and extremely premature neo-nates less than 32 weeks GA. When generating the database, weopted for more subjects rather than more epochs from each sub-ject. In order to keep the number of epochs equal from each neo-nate we were limited by the neonates with the shortest,‘predominantly artefact free’, recording duration which in this casewas 3 hours. We aim to expand the number of neonates, number ofepochs and the range of GA in the future. A dataset with a highernumber of EEG epochs taken from a larger cohort of neonates overa greater range of EMA has potential for improving feature selec-tion and the training of the EMA estimator. An additional relativelimitation is that our benchmark for EEG normality was based onthe visual interpretation by an expert. We have not included mea-sures such as neurodevelopmental outcome or the results of imag-ing. Prior studies have used normal neurodevelopmental outcomeor absence of neurological deficits as indirect signs of EEG normal-ity (Holthausen et al., 2000; Niemarkt et al., 2010). While theoret-ically intriguing, these measures cannot exclude abnormality in theEEG, just as the presences of acute illness at the time of EEG record-ing does not always imply EEG abnormality. In essence, visual
interpretation of the EEG is the only currently available methodof determining EEG normality. Indeed, the use of automated andobjective measures as developed in the present work hold promisefor creating such normative, quantitative criteria when applied tolarge well defined EEG datasets.
Further improvements will aim to reduce both interpatient andintrapatient variability. While general improvements in estimatorperformance will be reflected in both forms of variability, theremay be features that improve one aspect of the overall variabilityover the other. Improvements in inter-patient variability requirethe development of EEG features that are better correlated withthe MA of the brain. Features such as complexity and inter-connectivity are potentially applicable (Stevenson et al., 2007;Janjarasjitt et al., 2008; Tokariev et al., 2012; Koolen et al., 2014;Meijer et al., 2014). Improvements in intra-patient variabilityrequire features that are robust to changes in time of recordingafter birth and EEG recording environment. Features such as signalto noise ratio, impedance and others that respond to the presenceof several artefacts are potentially applicable (Stevenson et al.,2014b). Once the development of the EMA is finalised it must bevalidated on a cohort of preterm neonates with normal and abnor-mal EEG for age across a range of aetiologies. This will determine ifthe EMA estimator can generate a measure of dysmaturity that cor-relates with the presence of abnormality in the EEG; a correlationthat will be clinically useful.
5. Conclusion
We developed an automated method of estimating functionalbrain maturation in very and extremely premature neonatesbased on analysis of the EEG. The estimator generated an EMAthat was within 2 weeks of GA in 87% of all EEG epochs in ourdevelopment dataset. Features of EEG amplitude had the highestcorrelation between EMA and GA. The EMA estimator wasimproved by targeting feature extraction to periods of low EEGactivity (quiet sleep) and averaging estimates across multipleepochs per neonate. The proposed EMA estimator is an impor-tant first stage in the development of a novel automated EEGmaturity index for use as a neurological monitoring tool in theNICU. It is also provides a simple summary measure of a com-plex interpretation of the EEG.
Acknowledgements
The authors acknowledge the support of Science FoundationIreland (12/IP/1369). Data collection was supported by the Well-come Trust UK (085249). JMOT was supported by the IrishResearch Council (GOIPD/2014/396). GBB was supported byScience Foundation Ireland (12/RC/2272) and the Wellcome TrustUK (098983). SV was supported by the Academy of Finland(276523 and 288220), and the Sigrid Juselius Foundation. NJSwas supported by Science Foundation Ireland (12/IP/1369) andthe EU Framework Programme for Research and Innovation(H2020-MCSA-IF-656131).
Conflict of interest: None of the authors have potential conflictsof interest to be disclosed.
Appendix A
The EMA estimate equation for the ith hour long epoch of EEGwhich is summarised by a feature vector x, containing m features,is defined as,
yi ¼XPp¼1
ða�p � apÞKðxp;xiÞ
!þ b ðA1Þ
2918 J.M. O’Toole et al. / Clinical Neurophysiology 127 (2016) 2910–2918
where yi is the EMA estimate, ða�p;apÞ are weights derived from
Lagrangian multipliers, xp is a m by P matrix containing P supportvectors, which are a subset of the training data, K(xp, xi) is the kernelfunction, and b is a bias term (Smola and Schölkopf, 2004). In thecase of linear SVR, the kernel function is the inner product betweenthe feature and support vector. The EMA estimation equation can,therefore, be written as a standard linear predictor,
yi ¼ a1x1 þ a2x2 þ � � � þ amxm þ b ðA2Þ
where a ¼PPp¼1ða�
p � apÞxp is a vector of length m.
References
Aminoff MJ. Aminoff’s electrodiagnosis in clinical neurology. 6thed. Amsterdam: Elsevier Saunders; 2012.
André M, Lamblin M-D, d’Allest A-M, Curzi-Dascalova L, Moussalli-Salefranque F,Nguyen The Tich S, et al. Electroencephalography in premature and full-terminfants. Developmental features and glossary. Neurophysiol Clin2010;40:59–124.
Blencowe H, Cousens S, Oestergaard MZ, Chou D, Moller A-B, Narwal R, et al.National, regional, and worldwide estimates of preterm birth rates in the year2010 with time trends since 1990 for selected countries: a systematic analysisand implications. Lancet 2012;379:2162–72.
Box GEP, Cox DR. An analysis of transformations. J R Stat Soc B 1964;26:211–52.Chang CC, Lin CJ. LIBSVM: a library for support vector machines. ACM Trans Intell
Syst Technol 2011;2:1–27. Article 27.Chu CJ, Leahy J, Pathmanathan J, Kramer MA, Cash SS. The maturation of cortical
sleep rhythms and networks over early development. Clin Neurophysiol2014;125:1360–70.
Engle WA, Blackman LR, Batton DG, Bell EF, Denson SE, Kanto Jr WP. Ageterminology during the perinatal period. Pediatrics 2004;114:1362–4. Policystatement reaffirmed for 5 years in July 2014.
Fransson P, Metsäranta M, Blennow M, Åden U, Lagercrantz H, Vanhatalo S. Earlydevelopment of spatial patterns of power-law frequency scaling in fMRIresting-state and EEG data in the newborn brain. Cereb Cortex2013;23:638–46.
Geirsson RT. Ultrasound instead of last menstrual period as the basis of gestationalage assignment. Ultrasound Obstet Gynecol 1991;1:212–9.
Holthausen K, Breidbach O, Scheidt B, Frenzel J. Brain dysmaturity index forautomatic detection of high risk infants. Pediatr Neurol 2000;22:187–91.
Hunter LA. Issues in pregnancy dating: revisiting the evidence. J Midwifery WomensHealth 2009;54:184–90.
Iyer KK, Roberts JA, Hellström-Westas L, Wikström S, Hansen Pupp I, Ley D, et al.Cortical burst dynamics predict clinical outcome early in extremely preterminfants. Brain 2015;138:2206–18.
Jakaite L, Schetinin V, Maple C. Bayesian assessment of newborn brain maturityfrom two-channel sleep electroencephalograms. Comput Math Methods Med2012. http://dx.doi.org/10.1155/2012/629654. Article ID 629654, 7 pages.
Janjarasjitt S, Scher MS, Loparo KA. Nonlinear dynamical analysis of the neonatalEEG time series: the relationship between neurodevelopment and complexity.Clin Neurophysiol 2008;119:822–36.
Kancherla V, Amendah DD, Grosse SD, Yeargin-Allsopp M, Van Naarden Braun K.Medical expenditures attributable to cerebral palsy and intellectual disabilityamong Medicaid-enrolled children. Res Dev Disabil 2012;33:832–40.
Kilb W, Kirischuk S, Luhmann HJ. Electrical activity patterns and the functionalmaturation of the neocortex. Eur J Neurosci 2011;34:1677–86.
Koolen N, Jansen K, Vervisch J, Matic V, De Vos M, Naulaers G, et al. Line length as arobust method to detect high-activity events: automated burst detection inpremature EEG recordings. Clin Neurophysiol 2014;125:1985–94.
Kostovic I, Judas M. The development of the subplate and thalamocorticalconnections in the human foetal brain. Acta Paediatr 2010;99:1119–27.
Meijer EJ, Hermans KH, Zwanenburg A, Jennekens W, Niemarkt HJ, Cluitmans PJM,et al. Functional connectivity in preterm infants derived from EEG coherenceanalysis. Eur J Paediatr Neurol 2014;18:780–9.
Murphy K, Stevenson NJ, Goulding RM, Lloyd RO, Korotchikova I, Livingstone V,et al. Automated analysis of multi-channel EEG in preterm infants. ClinNeurophysiol 2015;126:1692–702.
View publication statsView publication stats
Myers MM, Grieve PG, Izraelit A, Fifer WP, Isler JR, Darnall RA, et al. Developmentalprofiles of infant EEG: overlap with transient cortical circuits. Clin Neurophysiol2012;123:1502–11.
Niemarkt HJ, Andriessen P, Peters CHL, Pasman JW, Zimmermann LJ, BambangOetomo S. Quantitative analysis of maturational changes in EEG backgroundactivity in very preterm infants with a normal neurodevelopment at 1 year ofage. Early Hum Dev 2010;86:219–24.
Niemarkt HJ, Jennekens W, Pasman JW, Katgert T, van Pul C, Gavilanes AWD, et al.Maturational changes in automated EEG spectral power analysis in preterminfants. Pediatr Res 2011;70:529–34.
Nunes ML, Khan RL, Filho IG, Booij L, da Costa JC. Maturational changes of neonatalelectroencephalogram: a comparison between intra uterine and extra uterinedevelopment. Clin Neurophysiol 2014;125:1121–8.
O’Reilly D, Navakatikyan MA, Filip M, Greene D, Van Marter LJ. Peak-to-peakamplitude in neonatal brain monitoring of premature infants. Clin Neurophysiol2012;123:2139–53.
Odabaee M, FreemanWJ, Colditz PB, Ramon C, Vanhatalo S. Spatial patterning of theneonatal EEG suggests a need for a high number of electrodes. NeuroImage2013;68:229–35.
Palmu K, Stevenson N, Wikström S, Hellström-Westas L, Vanhatalo S, Palva JM.Optimization of an NLEO based algorithm for automated detection ofspontaneous activity transients in early preterm EEG. Physiol Meas 2010;31:N85–93.
Palmu K, Kirjavainen T, Stjerna S, Salokivi T, Vanhatalo S. Sleep wake cycling in earlypreterm infants: Comparison of polysomnographic recordings with a novelEEG-based index. Clin Neurophysiol 2013;124:1807–14.
Parmelee Jr AH, Schulte FJ, Akiyama Y, Wenner WH, Schultz MA, Stern E. Maturationof EEG activity during sleep in premature infants. Electroencephalogr ClinNeurophysiol 1968;24:319–29.
Räsänen O, Metsäranta M, Vanhatalo S. Development of a novel robust measure forinterhemispheric synchrony in the neonatal EEG: activation synchrony index(ASI). NeuroImage 2013;69:256–66.
Saigal S, Doyle LW. An overview of mortality and sequelae of preterm birth frominfancy to adulthood. Lancet 2008;371:261–9.
Saji R, Hirasawa K, Ito M, Kusuda S, Konishi Y, Taga G. Probability distributions ofthe electroencephalogram envelope of preterm infants. Clin Neurophysiol2015;126:1132–40.
Scher MS. Neurophysiological assessment of brain function and maturation II. Ameasure of brain dysmaturity in healthy preterm neonates. Pediatr Neurol1997;16:287–95.
Schumacher EM, Stiris TA, Larsson PG. Effective connectivity in long-term EEGmonitoring in preterm infants. Clin Neurophysiol 2015;126:2261–8.
Sellier E, Surman G, Himmelmann K, Andersen G, Colver A, Krägeloh-Mann I, et al.Trends in prevalence of cerebral palsy in children born with a birthweight of2,500 g or over in Europe from 1980 to 1998. Eur J Epidemiol 2010;25:635–42.
Shany E, Meledin I, Gilat S, Yogev H, Golan A, Berger I. In and ex utero maturation ofpremature infants with electroencephalographic indices. Clin Neurophysiol2014;125:270–6.
Smola AJ, Schölkopf B. A tutorial on support vector regression. Stat Comput2004;14:199–222.
Stevenson N, Mesbah M, Boashash B. Modelling newborn EEG background using atime-varying fractional Brownian process. Proc 15th European Signal Proc Conf(EUSIPCO) 2007;1:1246–50.
Stevenson NJ, Palmu K, Wikström S, Hellström-Westas L, Vanhatalo S. Measuringbrain activity cycling (BAC) in long term EEG monitoring of preterm babies.Physiol Meas 2014a;35:1493–508.
Stevenson NJ, O’Toole JM, Korotchikova I, Boylan GB. Artefact detection in neonatalEEG. Conf Proc IEEE Eng Med Biol Soc 2014b;2014:926–9.
Tokariev A, Palmu K, Lano A, Metsäranta M, Vanhatalo S. Phase synchrony in theearly preterm EEG: development of methods for estimating synchrony in bothoscillations and events. NeuroImage 2012;60:1562–73.
Tolonen M, Palva JM, Andersson S, Vanhatalo S. Development of the spontaneousactivity transients and ongoing cortical activity in human preterm babies.Neuroscience 2007;145:997–1006.
Vanhatalo S, Kaila K. Development of neonatal EEG activity: from phenomenologyto physiology. Semin Fetal Neonatal Med 2006;11:471–8.
Vanhatalo S, Palva MJ, Andersson S, Rivera C, Voipio J, Kaila K. Slow endogenousactivity transients and developmental expression of K+–Cl- cotransporter 2 inthe immature human cortex. Eur J Neurosci 2005;22:2799–804.
Volpe JJ. Neurology of the newborn. 4th ed. Philadelphia: Saunders; 2001.Watanabe K, Hayakawa F, Okumura A. Neonatal EEG: a powerful tool in the
assessment of brain damage in preterm infants. Brain Dev 1999;21:361–72.