estimating deformation demands on steel ebf systems
TRANSCRIPT
Paper 115
NZSEE 2020 Annual Conference
Estimating deformation demands on steel EBF systems F. Yu, R. Huang & T.J. Sullivan University of Canterbury, Christchurch.
ABSTRACT The deformation capacity of a steel eccentrically braced frame (EBF) structure is typically governed by the chord rotation capacity of the EBF links. Codes allow these chord rotation demands to be estimated a variety of ways, from simplified hand calculations through to advanced non-linear analyses. Recent studies have suggested that the elastic analysis approach recommended by the New Zealand steel industry may be non-conservative. Consequently, this paper compares the deformations predicted by current industry recommendations with the results obtained from non-linear static pushover analyses for a series of multi-storey EBF structures. To better estimate the actual link rotation demands in design, a simplified displacement-based method is also used, identifying three deformation components (links, braces and columns) and their contributions to storey drifts. Through a series of case studies, the deformation-component method is shown to perform well, giving more accurate predictions of the actual displacement profiles and link rotation demands of multi-storey EBF structures compared to the current industry guidelines. Therefore, it is recommended that the industry consider replacing current guidelines for estimation of rotation demands on EBF links with a deformation component approach.
1 INTRODUCTION
1.1 Background
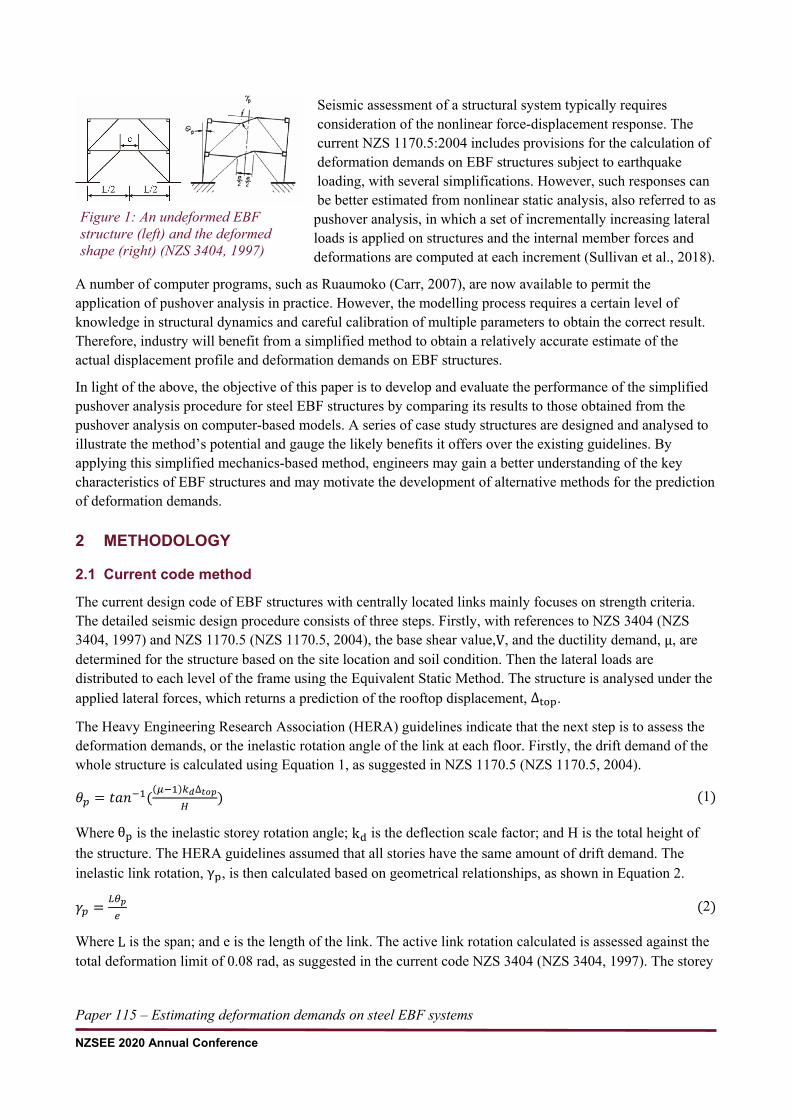
Investigations into the seismic behaviour of eccentrically braced frame (EBF) structures such as that shown in Figure 1, were first began in Japan during the 1970’s (O’Reilly and Sullivan, 2015). An EBF structure is treated as a ductile lateral load resisting system that is desirable for use in regions of high seismicity, as shown in Figure 1. Links are designed to yield under intense shaking, either in shear, flexure or a combination of the two. The hysteretic response of the links dissipates large amounts of energy in comparison to a similar concentrically braced frame configuration (O’Reilly and Sullivan, 2015). Numerous experiments were performed to investigate the seismic behaviour of these links in the 1980’s and demonstrated that well-detailed EBF systems possess good ductility capacity and are capable of sustaining large inelastic deformation demands (Sullivan, 2013).
Paper 115 – Estimating deformation demands on steel EBF systems
NZSEE 2020 Annual Conference
Seismic assessment of a structural system typically requires consideration of the nonlinear force-displacement response. The current NZS 1170.5:2004 includes provisions for the calculation of deformation demands on EBF structures subject to earthquake loading, with several simplifications. However, such responses can be better estimated from nonlinear static analysis, also referred to as pushover analysis, in which a set of incrementally increasing lateral loads is applied on structures and the internal member forces and deformations are computed at each increment (Sullivan et al., 2018).
A number of computer programs, such as Ruaumoko (Carr, 2007), are now available to permit the application of pushover analysis in practice. However, the modelling process requires a certain level of knowledge in structural dynamics and careful calibration of multiple parameters to obtain the correct result. Therefore, industry will benefit from a simplified method to obtain a relatively accurate estimate of the actual displacement profile and deformation demands on EBF structures.
In light of the above, the objective of this paper is to develop and evaluate the performance of the simplified pushover analysis procedure for steel EBF structures by comparing its results to those obtained from the pushover analysis on computer-based models. A series of case study structures are designed and analysed to illustrate the method’s potential and gauge the likely benefits it offers over the existing guidelines. By applying this simplified mechanics-based method, engineers may gain a better understanding of the key characteristics of EBF structures and may motivate the development of alternative methods for the prediction of deformation demands.
2 METHODOLOGY
2.1 Current code method
The current design code of EBF structures with centrally located links mainly focuses on strength criteria. The detailed seismic design procedure consists of three steps. Firstly, with references to NZS 3404 (NZS 3404, 1997) and NZS 1170.5 (NZS 1170.5, 2004), the base shear value,V, and the ductility demand, μ, are determined for the structure based on the site location and soil condition. Then the lateral loads are distributed to each level of the frame using the Equivalent Static Method. The structure is analysed under the applied lateral forces, which returns a prediction of the rooftop displacement, ∆top.
The Heavy Engineering Research Association (HERA) guidelines indicate that the next step is to assess the deformation demands, or the inelastic rotation angle of the link at each floor. Firstly, the drift demand of the whole structure is calculated using Equation 1, as suggested in NZS 1170.5 (NZS 1170.5, 2004).
𝜃𝜃𝑝𝑝 = 𝑡𝑡𝑡𝑡𝑡𝑡−1((𝜇𝜇−1)𝑘𝑘𝑑𝑑∆𝑡𝑡𝑡𝑡𝑡𝑡
𝐻𝐻) (1)
Where θp is the inelastic storey rotation angle; kd is the deflection scale factor; and H is the total height of the structure. The HERA guidelines assumed that all stories have the same amount of drift demand. The inelastic link rotation, γp, is then calculated based on geometrical relationships, as shown in Equation 2.
𝛾𝛾𝑝𝑝 = 𝐿𝐿𝜃𝜃𝑡𝑡𝑒𝑒
(2)
Where L is the span; and e is the length of the link. The active link rotation calculated is assessed against the total deformation limit of 0.08 rad, as suggested in the current code NZS 3404 (NZS 3404, 1997). The storey
Figure 1: An undeformed EBF structure (left) and the deformed shape (right) (NZS 3404, 1997)
Paper 115 – Estimating deformation demands on steel EBF systems
NZSEE 2020 Annual Conference
drift calculated earlier is also compared with the serviceability criteria specified in NZS 1170.5 (NZS 1170, 2004).
The last design step is to conduct force-based analysis and capacity design to identify the shear force and bending moment demand on each member. The members and connections are then designed to meet these strength criteria.
2.2 Ruaumoko modelling
To estimate the actual displacement profile of EBF structures under lateral loading, a series of structural models of EBF systems were created in Ruaumoko to conduct 2D force-based pushover analysis, with a constant triangle force distribution profile over the building height. Several assumptions were made during this stage to ensure the models created could represent the corresponding EBF structures proposed.
The floor diaphragms were assumed to be rigid, which led to all nodes at the same height above the ground level being constrained in the X-direction displacement. The vertical shear area, Av, of all links were assumed to be the effective web area calculated using Equation 3.
𝐴𝐴𝑣𝑣,𝑙𝑙𝑙𝑙𝑙𝑙𝑘𝑘 = (𝑑𝑑 − 𝑡𝑡𝑓𝑓)𝑡𝑡𝑤𝑤 (3)
Where d is the depth of the section; tf is the thickness of the flange; and tw is the thickness of the web. The links were modelled using a bilinear hysteretic shape, with a post-yield stiffness of 0.05 as suggested by O’Reilly and Sullivan (2015). Their yielding moments were set to be equal to the bending moments on the links corresponding to the development of their shear capacities calculated using Equation 4, to ensure the links fail in shear as expected from the short link assumption.
𝑉𝑉𝑙𝑙𝑙𝑙𝑙𝑙𝑘𝑘,𝑙𝑙 = 0.577𝐹𝐹𝑦𝑦,𝑙𝑙𝑙𝑙𝑙𝑙𝑘𝑘,𝑙𝑙𝐴𝐴𝑣𝑣,𝑙𝑙𝑙𝑙𝑙𝑙𝑘𝑘,𝑙𝑙 (4)
Where Fy,link,i is the shear yield stress of the link at level i. The storey drift values obtained from the Ruaumoko output file were later used to calculate the overall displacement profile. The link rotations from the Ruaumoko pushover analysis, γRMK,link,i, were obtained by summing the vertical displacements of the two end nodes of the link and dividing by the length of the link.
2.3 Deformation components method
2.3.1 Criteria to assess yielding
The deformation of EBF structure was assessed by first identifying the storey drifts at yield, θy,i, at level i. It was estimated by considering three deformation components, as shown in Equation 5.
𝜃𝜃𝑦𝑦,𝑙𝑙 = 𝜃𝜃𝑙𝑙𝑙𝑙𝑙𝑙𝑘𝑘,𝑙𝑙 + 𝜃𝜃𝑏𝑏𝑏𝑏,𝑙𝑙 + 𝜃𝜃𝑐𝑐𝑐𝑐𝑙𝑙𝑐𝑐,𝑙𝑙 (5)
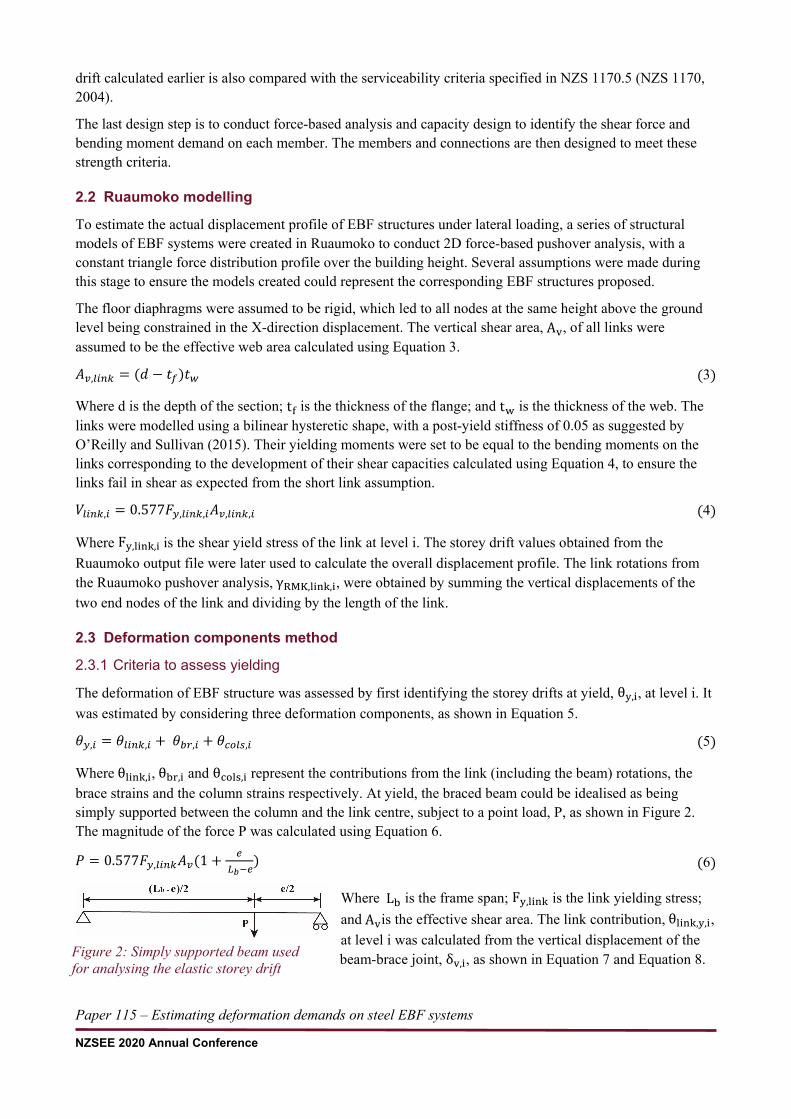
Where θlink,i, θbr,i and θcols,i represent the contributions from the link (including the beam) rotations, the brace strains and the column strains respectively. At yield, the braced beam could be idealised as being simply supported between the column and the link centre, subject to a point load, P, as shown in Figure 2. The magnitude of the force P was calculated using Equation 6.
𝑃𝑃 = 0.577𝐹𝐹𝑦𝑦,𝑙𝑙𝑙𝑙𝑙𝑙𝑘𝑘𝐴𝐴𝑣𝑣(1 + 𝑒𝑒 𝐿𝐿𝑏𝑏−𝑒𝑒
) (6)
Where Lb is the frame span; Fy,link is the link yielding stress; and Avis the effective shear area. The link contribution, θlink,y,i, at level i was calculated from the vertical displacement of the beam-brace joint, δv,i, as shown in Equation 7 and Equation 8. Figure 2: Simply supported beam used
for analysing the elastic storey drift
Paper 115 – Estimating deformation demands on steel EBF systems
NZSEE 2020 Annual Conference
𝛿𝛿𝑣𝑣,𝑙𝑙 = 0.577𝐹𝐹𝑦𝑦,𝑙𝑙𝑙𝑙𝑙𝑙𝑘𝑘,𝑙𝑙𝐴𝐴𝑣𝑣,𝑙𝑙(𝑒𝑒𝑖𝑖2(𝐿𝐿𝑏𝑏,𝑖𝑖−𝑒𝑒𝑖𝑖)24𝐸𝐸𝐼𝐼𝑖𝑖
+ 𝑒𝑒𝑖𝑖2𝐺𝐺𝐴𝐴𝑣𝑣,𝑖𝑖
) (7)
𝜃𝜃𝑙𝑙𝑙𝑙𝑙𝑙𝑘𝑘,𝑦𝑦,𝑙𝑙 = 2𝛿𝛿𝑣𝑣,𝑖𝑖𝐿𝐿𝑏𝑏,𝑖𝑖−𝑒𝑒𝑖𝑖
(8)
Where E is the elastic modulus; G is the shear modulus; I is the second moment of inertia of the beam and all the other symbols have been defined earlier. The brace and column components were calculated from the brace strains, εbr,i, and the column strains, εcol,i (obtained as dividing the axial forces acting on them by their cross-sectional area), as shown in Equation 9 and Equation 10.
𝜃𝜃𝑏𝑏𝑏𝑏,𝑦𝑦,𝑙𝑙 = 2𝜀𝜀𝑏𝑏𝑏𝑏,𝑖𝑖𝑐𝑐𝑙𝑙𝑙𝑙(2𝛼𝛼𝑖𝑖)
(9)
𝜃𝜃𝑐𝑐𝑐𝑐𝑙𝑙,𝑦𝑦,𝑙𝑙 = 2𝜀𝜀𝑐𝑐𝑡𝑡𝑐𝑐,𝑖𝑖(ℎ𝑖𝑖−ℎ𝑠𝑠,𝑖𝑖)𝐿𝐿𝑏𝑏/2 (10)
Where αi is the angle between the brace and the beam; hi is the height to the top of storey i; and hs,i is the inter-storey height at level i.
2.3.2 Elastic displacement profiles
The storey shear capacity (resistance) at level i, VR,i, was calculated by analysing the force equilibrium when the link was yielding in shear, as shown in Equation 11.
𝑉𝑉𝑅𝑅,𝑙𝑙 = 𝑉𝑉𝑙𝑙𝑙𝑙𝑙𝑙𝑘𝑘,𝑙𝑙𝐿𝐿𝑏𝑏ℎ𝑠𝑠,𝑖𝑖
(11)
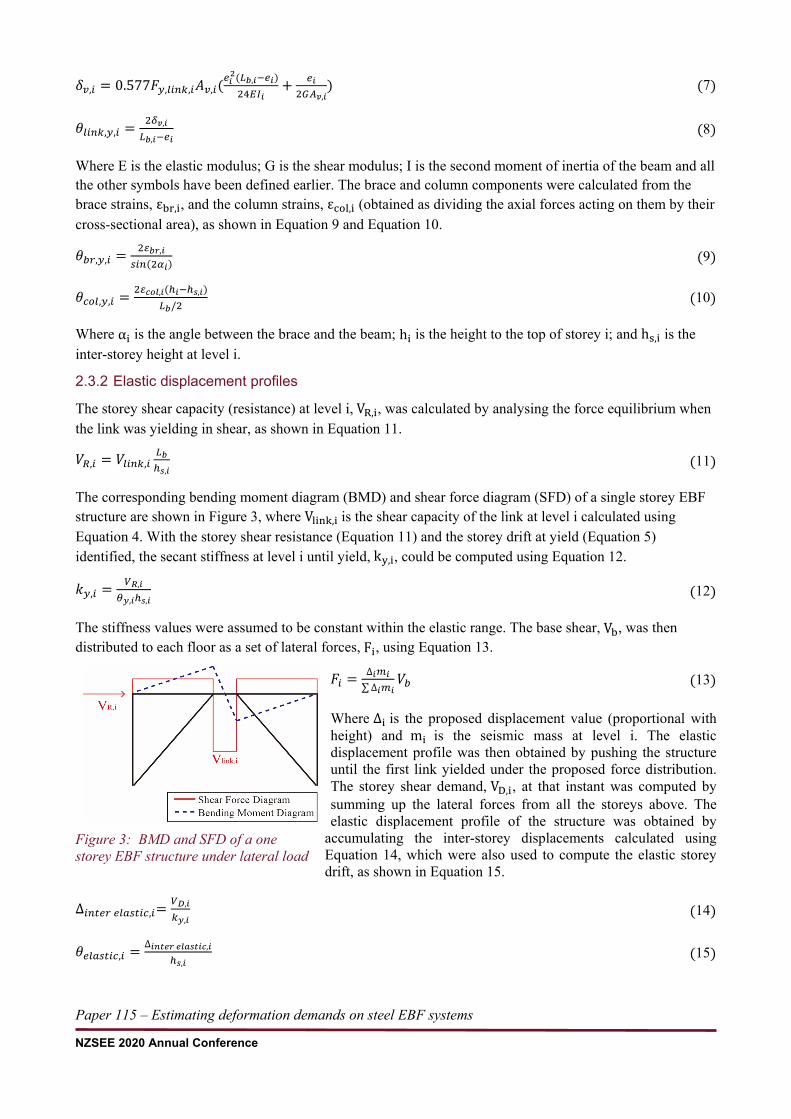
The corresponding bending moment diagram (BMD) and shear force diagram (SFD) of a single storey EBF structure are shown in Figure 3, where Vlink,i is the shear capacity of the link at level i calculated using Equation 4. With the storey shear resistance (Equation 11) and the storey drift at yield (Equation 5) identified, the secant stiffness at level i until yield, ky,i, could be computed using Equation 12.
𝑘𝑘𝑦𝑦,𝑙𝑙 = 𝑉𝑉𝑅𝑅,𝑖𝑖𝜃𝜃𝑦𝑦,𝑖𝑖ℎ𝑠𝑠,𝑖𝑖
(12)
The stiffness values were assumed to be constant within the elastic range. The base shear, Vb, was then distributed to each floor as a set of lateral forces, Fi, using Equation 13.
𝐹𝐹𝑙𝑙 = ∆𝑖𝑖𝑚𝑚𝑖𝑖∑∆𝑖𝑖𝑚𝑚𝑖𝑖
𝑉𝑉𝑏𝑏 (13)
Where ∆i is the proposed displacement value (proportional with height) and mi is the seismic mass at level i. The elastic displacement profile was then obtained by pushing the structure until the first link yielded under the proposed force distribution. The storey shear demand, VD,i, at that instant was computed by summing up the lateral forces from all the storeys above. The elastic displacement profile of the structure was obtained by
accumulating the inter-storey displacements calculated using Equation 14, which were also used to compute the elastic storey drift, as shown in Equation 15.
∆𝑙𝑙𝑙𝑙𝑖𝑖𝑒𝑒𝑏𝑏 𝑒𝑒𝑙𝑙𝑒𝑒𝑐𝑐𝑖𝑖𝑙𝑙𝑐𝑐,𝑙𝑙=𝑉𝑉𝐷𝐷,𝑖𝑖𝑘𝑘𝑦𝑦,𝑖𝑖
(14)
𝜃𝜃𝑒𝑒𝑙𝑙𝑒𝑒𝑐𝑐𝑖𝑖𝑙𝑙𝑐𝑐,𝑙𝑙 = ∆𝑖𝑖𝑖𝑖𝑡𝑡𝑖𝑖𝑏𝑏 𝑖𝑖𝑐𝑐𝑒𝑒𝑠𝑠𝑡𝑡𝑖𝑖𝑐𝑐,𝑖𝑖ℎ𝑠𝑠,𝑖𝑖
(15)
Figure 3: BMD and SFD of a one storey EBF structure under lateral load
Paper 115 – Estimating deformation demands on steel EBF systems
NZSEE 2020 Annual Conference
2.3.3 Post-yield displacement profiles
Since the sway mechanism employed into the design of EBF structures sees the deformation demands spread over the building height, their post-yield displacement shapes were proposed based on the beam sway mechanism in moment resisting frames. According to Sullivan et al. (2018), the total displacement profile is taken by uniformly scaling profile from the elastic displacement profile to the target drift level, as shown in Equation 16.
𝜃𝜃𝑢𝑢,𝑙𝑙 = 𝑘𝑘𝑖𝑖𝑒𝑒𝜃𝜃𝑒𝑒𝑙𝑙𝑒𝑒𝑐𝑐𝑖𝑖𝑙𝑙𝑐𝑐,𝑙𝑙 (16)
Where θu,i is the ultimate post-yield storey drift at the target displacement; and kta is a constant scale factor for all stories to obtain that target displacement.
Theoretically, it is assumed that all post-yield deformation in the EBF structure will concentrate at links (O’Reilly and Sullivan, 2015). This means that the values of the drift components from braces and columns at the ultimate displacement profile are the same as those at the storey yielding limit. Therefore, the ultimate link component, θlink,u,i, was calculated using Equation 17.
𝜃𝜃𝑙𝑙𝑙𝑙𝑙𝑙𝑘𝑘,𝑙𝑙 = 𝜃𝜃𝑢𝑢,𝑙𝑙 − 𝜃𝜃𝑏𝑏𝑏𝑏,𝑙𝑙 − 𝜃𝜃𝑐𝑐𝑐𝑐𝑙𝑙𝑐𝑐,𝑙𝑙 (17)
Once the link drift component was known, the vertical displacement of the beam-brace joint could be calculated by rearranging Equation 8, as shown in Equation 18.
𝛿𝛿𝑣𝑣,𝑙𝑙 = 𝜃𝜃𝑙𝑙𝑙𝑙𝑙𝑙𝑘𝑘,𝑢𝑢,𝑙𝑙(𝐿𝐿𝑏𝑏−𝑒𝑒𝑖𝑖)
2 (18)
The ultimate link rotation at level i, γDC,link,i, was then calculated as shown in Equation 19.
𝛾𝛾𝐷𝐷𝐷𝐷,𝑙𝑙𝑙𝑙𝑙𝑙𝑘𝑘,𝑙𝑙 = 2𝛿𝛿𝑣𝑣,𝑖𝑖𝑒𝑒𝑖𝑖
(19)
Where γDC,link,i represents the link rotation demand at the ultimate displacement profile calculated using the deformation components method.
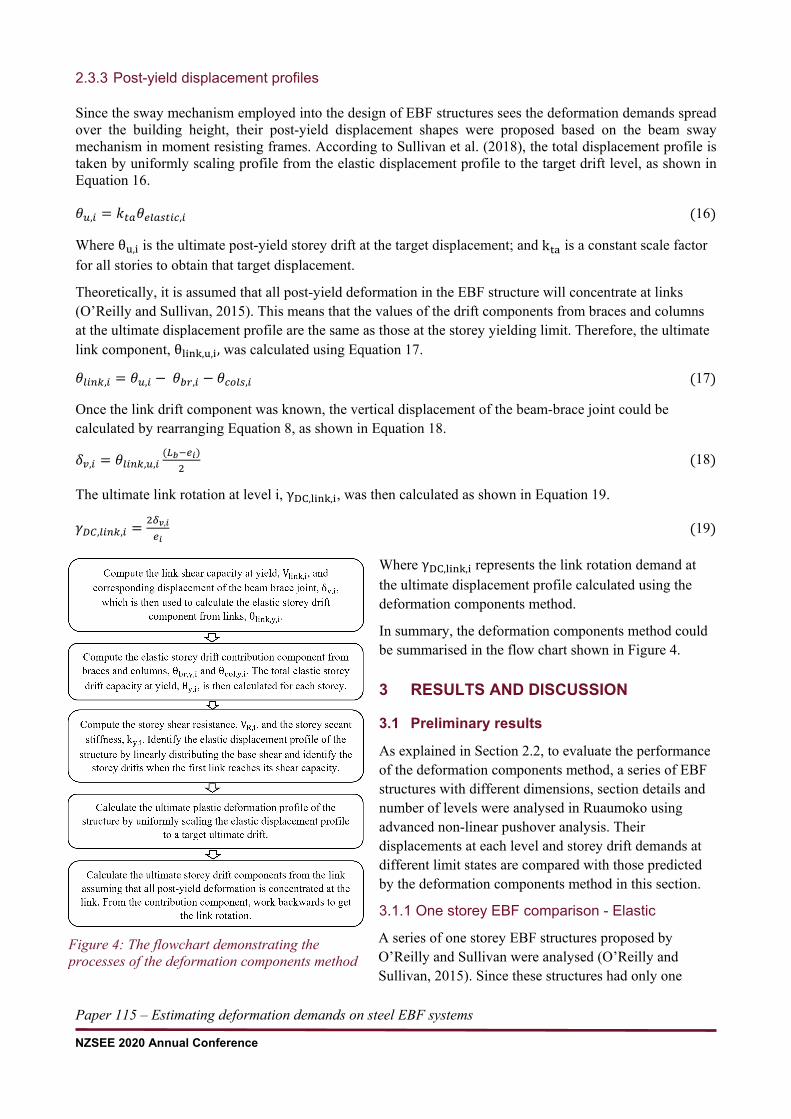
In summary, the deformation components method could be summarised in the flow chart shown in Figure 4.
3 RESULTS AND DISCUSSION
3.1 Preliminary results
As explained in Section 2.2, to evaluate the performance of the deformation components method, a series of EBF structures with different dimensions, section details and number of levels were analysed in Ruaumoko using advanced non-linear pushover analysis. Their displacements at each level and storey drift demands at different limit states are compared with those predicted by the deformation components method in this section.
3.1.1 One storey EBF comparison - Elastic
A series of one storey EBF structures proposed by O’Reilly and Sullivan were analysed (O’Reilly and Sullivan, 2015). Since these structures had only one
Figure 4: The flowchart demonstrating the processes of the deformation components method
Paper 115 – Estimating deformation demands on steel EBF systems
NZSEE 2020 Annual Conference
storey, the column axial deformations were assumed to be negligible. Therefore, these comparisons could be used to verify whether the link and brace component in the deformation components method were giving accurate predictions.
During the Ruaumoko modelling stage, all nodes at the top were constrained in the X-direction displacement considering the rigid floor diaphragm assumption. They were pushed under an incremental lateral load at the top until the link yielded. The shear forces on the links obtained from the Ruaumoko output file were used to check whether it reached its elastic shear capacity.
For the deformation components method, as introduced above, the force and the vertical displacement of the link at yield were calculated using Equation 6 and Equation 7 respectively. The yield drift of the EBF structure was determined as the sum of the brace and link components. The column component in this case was equal to zero as hi = hs,i for all one storey structures. The calculated storey drifts at yield were compared with the Ruaumoko results for a total number of 10 cases. The errors between the deformation components method’s predictions and the Ruaumoko results were all within 1%. Therefore, the proposed deformation components method has sufficient accuracy in estimating the storey drifts at yield for single storey EBF structures.
3.1.1 Multi-storey EBF comparison
The performance of the deformation components method on multi-storey EBF structures was evaluated using a series of case study buildings consisting of regular 5, 10 and 15 storey EBF systems. The structures used were designed by Sullivan (2013). Static pushover analyses were conducted on their corresponding Ruaumoko models and two limit states were identified. The elastic limit state (ELS) was at the first link yielding, and the ultimate limit state (ULS) was at the first appearance of a total link rotation of 0.08 rad, based on the suggestion on link rotation capacities in NZS 3404 (NZS 3404, 1997).
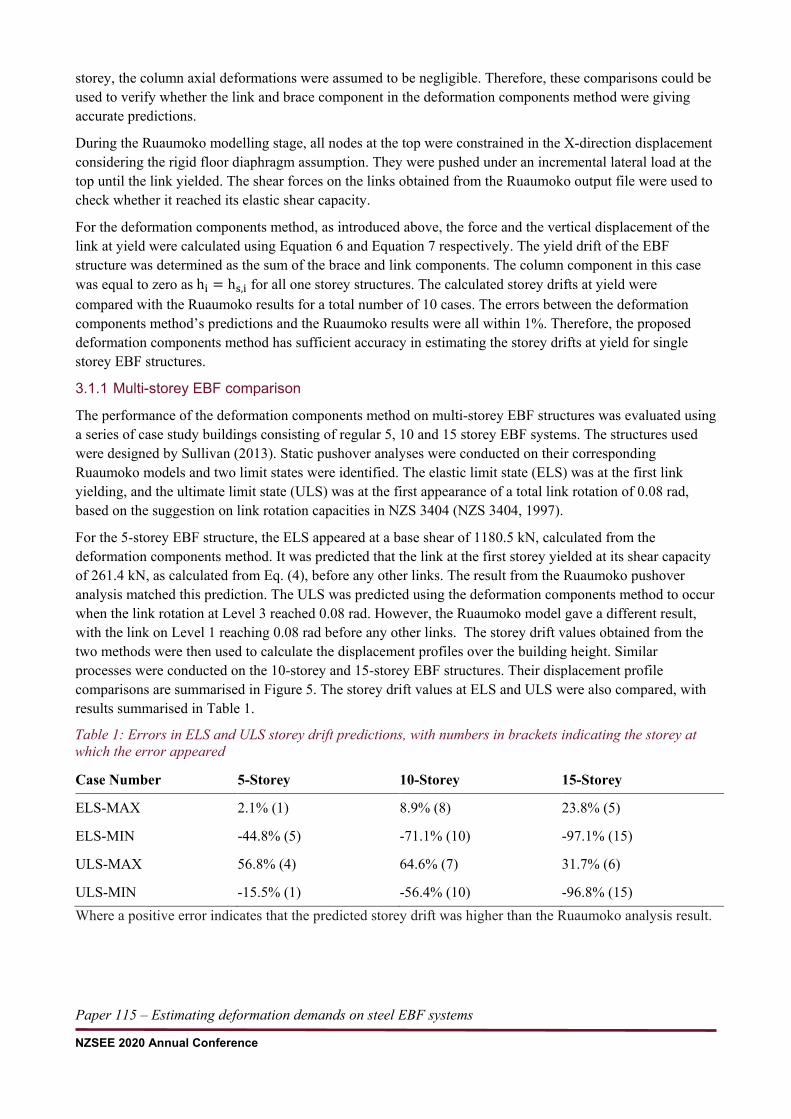
For the 5-storey EBF structure, the ELS appeared at a base shear of 1180.5 kN, calculated from the deformation components method. It was predicted that the link at the first storey yielded at its shear capacity of 261.4 kN, as calculated from Eq. (4), before any other links. The result from the Ruaumoko pushover analysis matched this prediction. The ULS was predicted using the deformation components method to occur when the link rotation at Level 3 reached 0.08 rad. However, the Ruaumoko model gave a different result, with the link on Level 1 reaching 0.08 rad before any other links. The storey drift values obtained from the two methods were then used to calculate the displacement profiles over the building height. Similar processes were conducted on the 10-storey and 15-storey EBF structures. Their displacement profile comparisons are summarised in Figure 5. The storey drift values at ELS and ULS were also compared, with results summarised in Table 1.
Where a positive error indicates that the predicted storey drift was higher than the Ruaumoko analysis result.
Case Number 5-Storey 10-Storey 15-Storey
ELS-MAX 2.1% (1) 8.9% (8) 23.8% (5)
ELS-MIN -44.8% (5) -71.1% (10) -97.1% (15)
ULS-MAX 56.8% (4) 64.6% (7) 31.7% (6)
ULS-MIN -15.5% (1) -56.4% (10) -96.8% (15)
Table 1: Errors in ELS and ULS storey drift predictions, with numbers in brackets indicating the storey at which the error appeared
Paper 115 – Estimating deformation demands on steel EBF systems
NZSEE 2020 Annual Conference
Overall, the performance of the deformation components method was good at predicting the displacement profile at lower stories (< 5), with most of errors less than 5%. At higher levels, the error tended to increase especially at the top two floors. On the contrary, the deformation components method did not predict the storey drift well in the three proposed structures at both ELS and ULS. Large underestimations of storey drifts were commonly seen at higher levels.
After comparing the predicted member forces with those obtained from the Ruaumoko output file, two potential sources of errors were identified. The first one was that the deformation components method tends to underestimate the storey shear at the two limit states. For example, in the 5-storey EBF case, the storey shear force at Level 5 was underestimated by 8% compared to the actual shear force used in Ruaumoko. This was suspected to be the result of the error in the column axial force prediction, which had a greater effect on top stories.
The second source of error came from the storey stiffness estimation. This was caused by the underestimation of the vertical displacement at link ends, δv,i, compared with the Ruaumoko analysis results, which resulted in the storey drift at yield being underestimated, and a stiffer storey being predicted.
3.2 Case study
One of the motivations of this project was to investigate potential limitations with the current New Zealand loading standard (NZS1170.5:2004) in terms of predicting the deformation demands on EBF structures subject to earthquake loading. To evaluate whether the code is providing a reliable estimation of the link rotation demands, an 8-storey EBF case study structure was selected. This proposed structure was designed by HERA (Clifton and Cowie, 2013) based on the current NZS 1170.5:2004 code requirements.
3.2.1 Assessing the link rotation demand - HERA
Following the design example provided by HERA, the design ductility μ was set at 4 for this case study structure, with a design base shear 𝑉𝑉 of 1000 kN. Since it was an 8-storey building, the deflection scale factor kd was set to 0.85 according to NZS1170.5:2004. The total height of the structure was 29 m. The rooftop displacement, ∆8, was obtained from the lateral load analysis as 46 mm. Therefore, the ultimate storey drift, θp, was calculated to be 0.004 rad using Equation 1.
In the current code approach recommended by Clifton and Cowie (2013), the storey drift was assumed to be the same for all levels. The inelastic rotation angle between the active link and adjacent beam, γp, was calculated using Equation 2 to be 0.06 rad for the case sturdy structure, which was the same for all levels.
The rooftop displacement that could be expected at the ultimate limit state was calculated to be 0.1173 m by multiplying the ultimate drift angle using the total height. To permit a consistent comparison with other
Figure 5: The displacement profiles at ELS (left) and ULS (right) as predicted by the deformation components method and pushover analysis in Ruaumoko for a 5-storey (top), a 10-storey (middle) and a 15-storey EBF structure (bottom)
Paper 115 – Estimating deformation demands on steel EBF systems
NZSEE 2020 Annual Conference
analysis methods, this rooftop displacement value was also used in the Ruaumoko pushover analysis and the deformation components method prediction as a target displacement at ULS.
3.2.2 Assessing the link rotation demand - Ruaumoko
A corresponding Ruaumoko model of the proposed 8-storey EBF structure was created to study the real deformation behaviour of the structure. The model was analysed using inelastic pushover analysis, with an output file produced at the ELS and ULS.
The drift values at each level were extracted from the output file. The link rotations at each level, γRMK,link,i, were calculated by extracting the vertical displacements of the two end nodes of the link and dividing their sum by the original link length.
3.2.3 Assessing the link rotation demand – Deformation Components Method
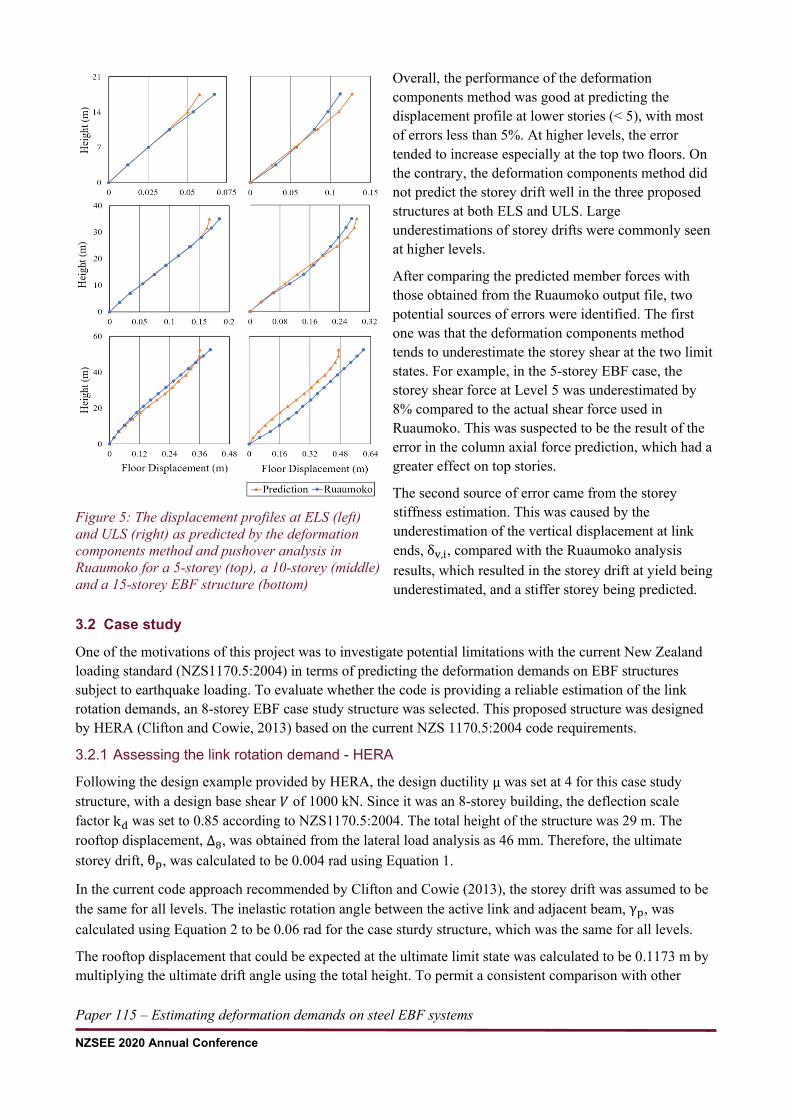
The deformation demands at ELS and ULS were also assessed using the deformation components method. The displacement profile at ELS was plotted against the one obtained from Ruaumoko, as shown in Figure 6.
It was found that the link on ground level yielded first at a base shear of 1221 kN. The maximum difference between the prediction and the Ruaumoko analysis result regarding the displacement at each storey was 14.9% and 60.4% in terms of storey drifts.
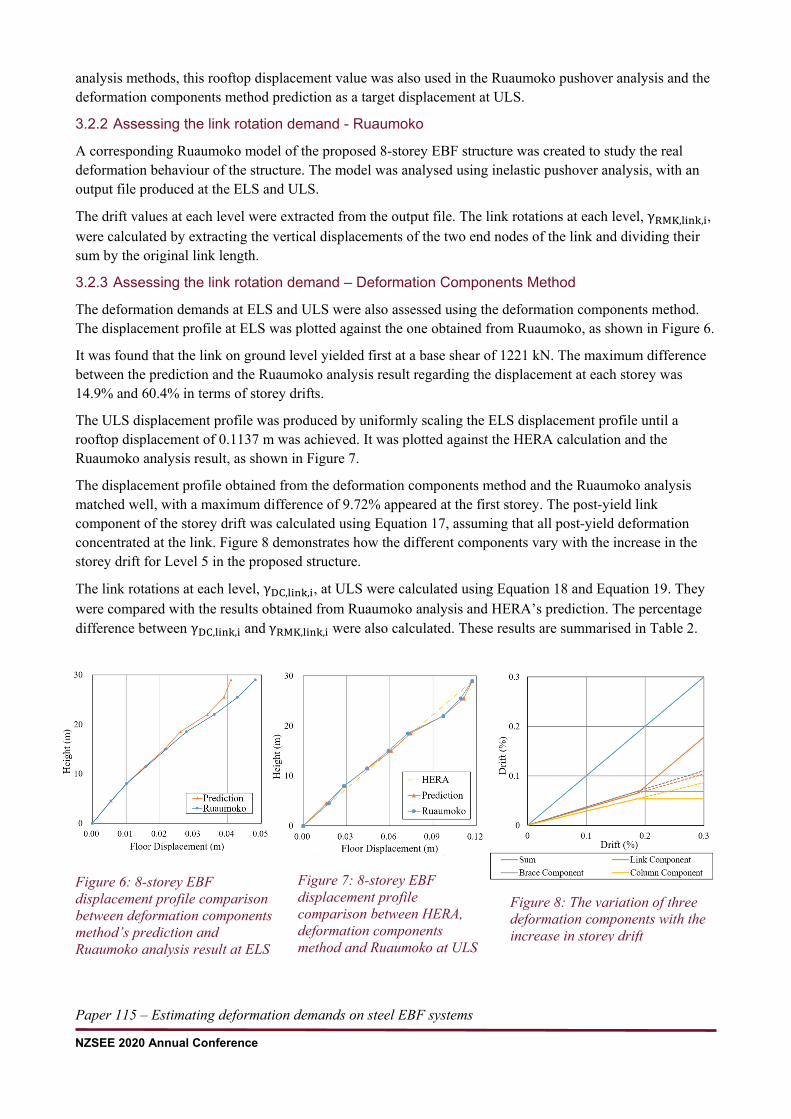
The ULS displacement profile was produced by uniformly scaling the ELS displacement profile until a rooftop displacement of 0.1137 m was achieved. It was plotted against the HERA calculation and the Ruaumoko analysis result, as shown in Figure 7.
The displacement profile obtained from the deformation components method and the Ruaumoko analysis matched well, with a maximum difference of 9.72% appeared at the first storey. The post-yield link component of the storey drift was calculated using Equation 17, assuming that all post-yield deformation concentrated at the link. Figure 8 demonstrates how the different components vary with the increase in the storey drift for Level 5 in the proposed structure.
The link rotations at each level, γDC,link,i, at ULS were calculated using Equation 18 and Equation 19. They were compared with the results obtained from Ruaumoko analysis and HERA’s prediction. The percentage difference between γDC,link,i and γRMK,link,i were also calculated. These results are summarised in Table 2.
Figure 6: 8-storey EBF displacement profile comparison between deformation components method’s prediction and Ruaumoko analysis result at ELS
Figure 7: 8-storey EBF displacement profile comparison between HERA, deformation components method and Ruaumoko at ULS
Figure 8: The variation of three deformation components with the increase in storey drift
Paper 115 – Estimating deformation demands on steel EBF systems
NZSEE 2020 Annual Conference
Storey 𝛄𝛄𝐃𝐃𝐃𝐃,𝐥𝐥𝐥𝐥𝐥𝐥𝐥𝐥,𝐥𝐥 (rad) 𝛄𝛄𝐑𝐑𝐑𝐑𝐑𝐑,𝐥𝐥𝐥𝐥𝐥𝐥𝐥𝐥,𝐥𝐥 (rad) HERA (rad) Difference (%)
8 0.014 0.006 0.060 -132.2
7 0.041 0.018 0.060 -124.4
6 0.071 0.066 0.060 -7.5
5 0.036 0.025 0.060 -43.9
4 0.047 0.033 0.060 -41.5
3 0.049 0.040 0.060 -21.5
2 0.034 0.020 0.060 -65.1
1 0.039 0.039 0.060 -0.4
3.2.4 Limitations with current guidelines
In the design example provided by HERA, the inelastic link rotation angle between the active link and the adjacent beam should be less than 0.08 rad. The maximum possible link rotation in the proposed structure was calculated to be 0.06 rad using HERA’s method (Clifton and Cowie, 2013), which stayed within the safe range. However, the inelastic pushover analysis results obtained from Ruaumoko indicated that the maximum link rotation was 0.066 rad, which exceeded the HERA approach by 10%. This suggested that the current code provisions underestimated the actual link rotations of the EBF structures. This could lead to the members being designed with insufficient deformation capacity under earthquake loading. The results also indicated that the link rotation demands vary significantly between different stories, which was not captured in the current code approach.
By applying the deformation components method, the maximum link rotation was predicted to be 0.071 rad, which agreed closely with the inelastic pushover analysis results obtained from Ruaumoko with a 7% error. Therefore, the deformation components method provided a more accurate and conservative prediction of the inelastic link rotation demand for the proposed 8-storey EBF structure and can be used to replace the results obtained from inelastic pushover analysis at preliminary design stage.
3.3 One storey coupled EBF structure
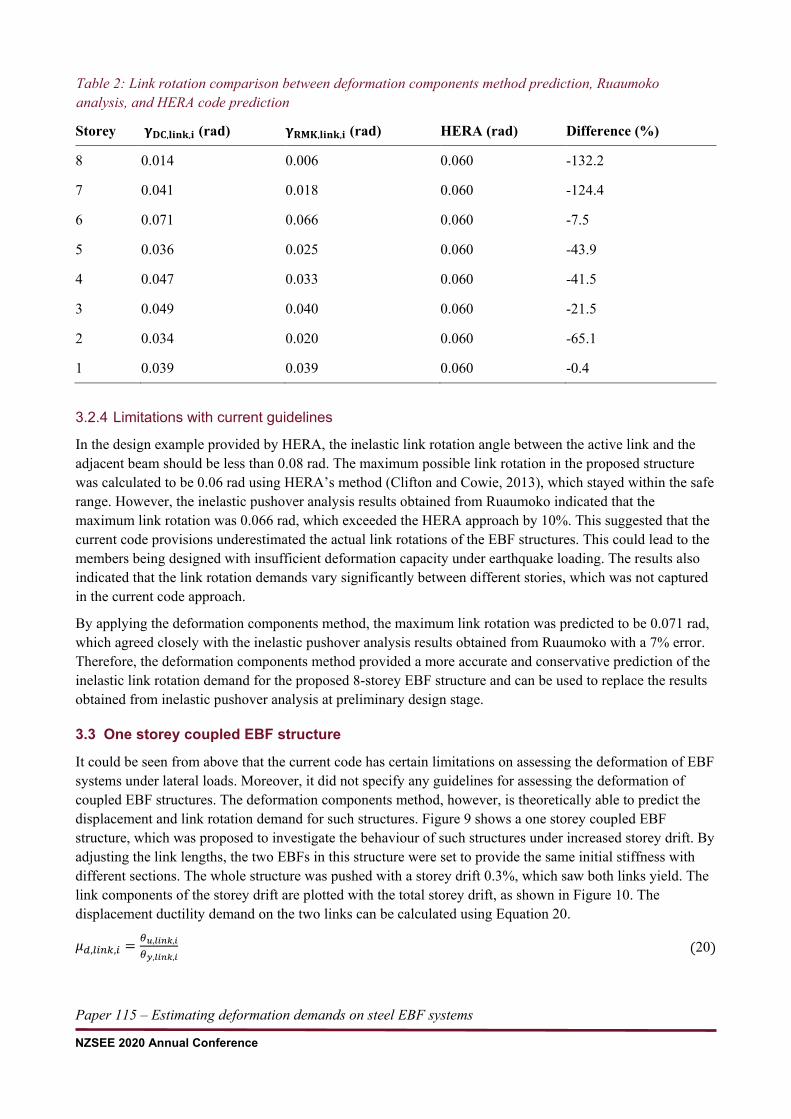
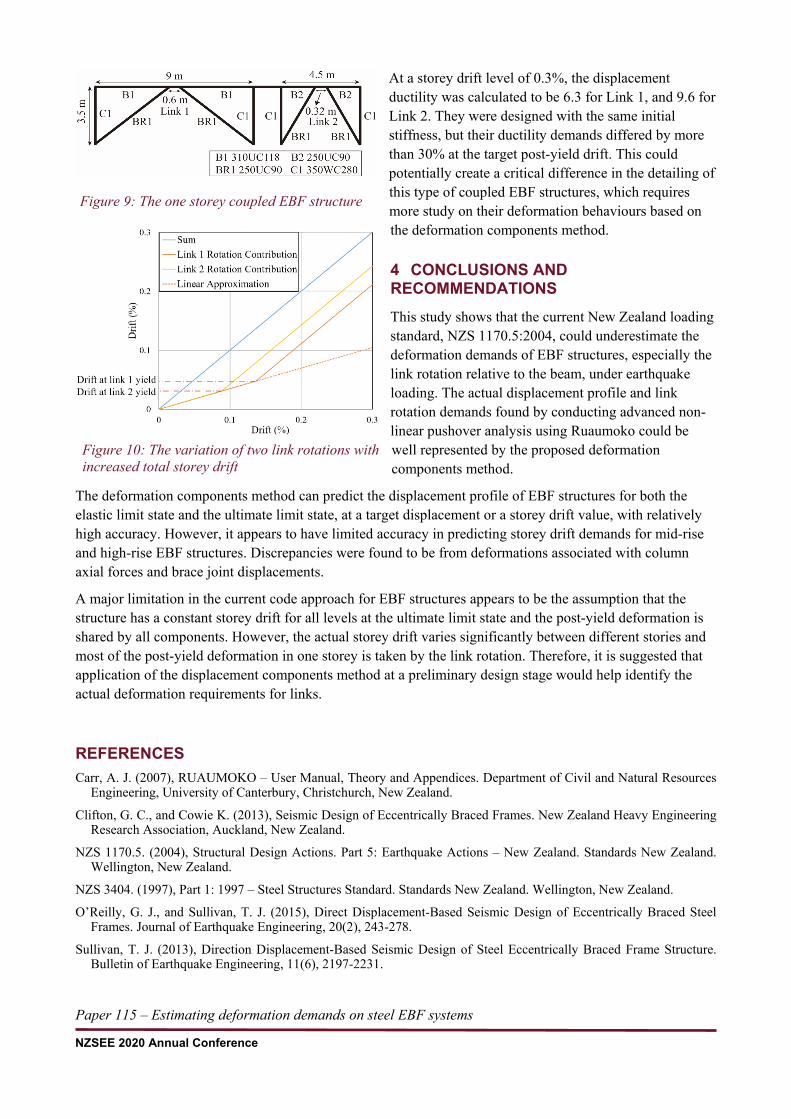
It could be seen from above that the current code has certain limitations on assessing the deformation of EBF systems under lateral loads. Moreover, it did not specify any guidelines for assessing the deformation of coupled EBF structures. The deformation components method, however, is theoretically able to predict the displacement and link rotation demand for such structures. Figure 9 shows a one storey coupled EBF structure, which was proposed to investigate the behaviour of such structures under increased storey drift. By adjusting the link lengths, the two EBFs in this structure were set to provide the same initial stiffness with different sections. The whole structure was pushed with a storey drift 0.3%, which saw both links yield. The link components of the storey drift are plotted with the total storey drift, as shown in Figure 10. The displacement ductility demand on the two links can be calculated using Equation 20.
𝜇𝜇𝑑𝑑,𝑙𝑙𝑙𝑙𝑙𝑙𝑘𝑘,𝑙𝑙 = 𝜃𝜃𝑢𝑢,𝑐𝑐𝑖𝑖𝑖𝑖𝑙𝑙,𝑖𝑖𝜃𝜃𝑦𝑦,𝑐𝑐𝑖𝑖𝑖𝑖𝑙𝑙,𝑖𝑖
(20)
Table 2: Link rotation comparison between deformation components method prediction, Ruaumoko analysis, and HERA code prediction
Paper 115 – Estimating deformation demands on steel EBF systems
NZSEE 2020 Annual Conference
At a storey drift level of 0.3%, the displacement ductility was calculated to be 6.3 for Link 1, and 9.6 for Link 2. They were designed with the same initial stiffness, but their ductility demands differed by more than 30% at the target post-yield drift. This could potentially create a critical difference in the detailing of this type of coupled EBF structures, which requires more study on their deformation behaviours based on the deformation components method.
4 CONCLUSIONS AND RECOMMENDATIONS This study shows that the current New Zealand loading standard, NZS 1170.5:2004, could underestimate the deformation demands of EBF structures, especially the link rotation relative to the beam, under earthquake loading. The actual displacement profile and link rotation demands found by conducting advanced non-linear pushover analysis using Ruaumoko could be well represented by the proposed deformation components method.
The deformation components method can predict the displacement profile of EBF structures for both the elastic limit state and the ultimate limit state, at a target displacement or a storey drift value, with relatively high accuracy. However, it appears to have limited accuracy in predicting storey drift demands for mid-rise and high-rise EBF structures. Discrepancies were found to be from deformations associated with column axial forces and brace joint displacements.
A major limitation in the current code approach for EBF structures appears to be the assumption that the structure has a constant storey drift for all levels at the ultimate limit state and the post-yield deformation is shared by all components. However, the actual storey drift varies significantly between different stories and most of the post-yield deformation in one storey is taken by the link rotation. Therefore, it is suggested that application of the displacement components method at a preliminary design stage would help identify the actual deformation requirements for links.
REFERENCES Carr, A. J. (2007), RUAUMOKO – User Manual, Theory and Appendices. Department of Civil and Natural Resources
Engineering, University of Canterbury, Christchurch, New Zealand.
Clifton, G. C., and Cowie K. (2013), Seismic Design of Eccentrically Braced Frames. New Zealand Heavy Engineering Research Association, Auckland, New Zealand.
NZS 1170.5. (2004), Structural Design Actions. Part 5: Earthquake Actions – New Zealand. Standards New Zealand. Wellington, New Zealand.
NZS 3404. (1997), Part 1: 1997 – Steel Structures Standard. Standards New Zealand. Wellington, New Zealand.
O’Reilly, G. J., and Sullivan, T. J. (2015), Direct Displacement-Based Seismic Design of Eccentrically Braced Steel Frames. Journal of Earthquake Engineering, 20(2), 243-278.
Sullivan, T. J. (2013), Direction Displacement-Based Seismic Design of Steel Eccentrically Braced Frame Structure. Bulletin of Earthquake Engineering, 11(6), 2197-2231.
Figure 9: The one storey coupled EBF structure
Figure 10: The variation of two link rotations with increased total storey drift
Paper 115 – Estimating deformation demands on steel EBF systems
NZSEE 2020 Annual Conference
Sullivan, T. J., Saborio-Romano, D., O’Reilly, G. J., Welch, D. P., and Landi, L. (2018), Simplified Pushover Analysis of Moment Resisting Frame Structures. Journal of Earthquake Engineering, 1-28.