estimating allele frequencies and inbreeding coefficients ...pg2113/index_files/gorroochurn &...
TRANSCRIPT

Estimating Allele Frequencies and InbreedingCoefficients in K-Allele Models
Prakash GorroochurnDivision of Statistical Genetics, Department of Biostatistics,Mailman School of Public Health, Columbia University, New York,New York, USA
Susan E. HodgeDivision of Statistical Genetics, Department of Biostatistics, MailmanSchool of Public Health, Columbia University, and Clinical-GeneticEpidemiology Unit, New York State Psychiatric Institute, New York,New York, USA
Some of the methods of estimation of allele frequencies and inbreeding coefficientsin a K-allele model are examined. A result that has long been assumed to be true isproved. That is, in the presence of inbreeding, the maximum likelihood estimatorsof the allele frequencies and of the inbreeding coefficient f do not in general equaltheir observed (or sample) values (except when K ¼ 2). A least-squares way oflooking at the estimation problem is presented, and simulations are used tocompare the three types of estimators (sample, maximum likelihood, and least-squares) in a 3-allele model. Probability generating functions are used to deriveexact expressions for the bias of the sample estimator of f in a 2-allele model forany sample size, and those biases are calculated for a number of situations.Finally, an approximately unbiased estimator of the inbreeding coefficient whenan allele is rare or common is proposed, and its bias is compared with that ofthe sample estimator and with that of an estimator proposed by Weir (1996).
Keywords: Hardy-Weinberg equilibrium; maximum likelihood; least-squares; prob-ability generating function
INTRODUCTION
Inbreeding coefficients have played a prominent role in the populationgenetics literature. These coefficients were first put forward by Wright
Address correspondence to P Gorroochurn, Columbia University, Department ofBiostatistics, Rm 620, 722 W 168th Street, New York, NY 10032. E-mail: [email protected]
Mathematical Population Studies, 13:83–103, 2006
Copyright # Taylor & Francis Group, LLC
ISSN: 0889-8480 print=1543-5253 online
DOI: 10.1080/08898480600620027
83

(1922) as measures of ‘‘relatedness’’ between individuals in a referencepopulation. Usually, inbreeding arises from nonrandom mating betweenclosely related individuals and results in an excess of homozygotes overheterozygotes, relative to proportions under Hardy-Weinberg equilib-rium (HWE); however, allele frequencies are not changed. Moreover,mating between close relatives is not the only cause for inbreeding.In fact, any small population has some degree of inbreeding associatedwith it, due to the sharing of common ancestors.
Wright (1922) originally defined the inbreeding coefficient withrespect to a single locus as the correlation between two genes in a unit-ing gamete by assigning numerical values to the genes. An alternativedefinition was given by Haldane and Moshinsky (1939), Cotterman(1940), and Malecot (1948), who used the concept of identity by descent(IBD). Two homologous alleles at a locus are said to be IBD if they areboth derived from the same allele copy in a common ancestor (assumingthat the common ancestor is so recent in the past that there are nointervening mutations). The inbreeding coefficient f is then definedas the probability that two homologous alleles are IBD. We shall definef as the proportionate reduction in heterozygozity relative to HWE:
f ¼ 1�Pði;jÞ:i<j Pij
1�P
i p2i
; ð1Þ
where pi is the proportion of allele i, and Pij is the frequency of genotypeAiAj, such that
Pði;jÞ:i�j Pij ¼
Pi pi ¼ 1. For two alleles, A1 and A2 hav-
ing respective frequencies p and qð¼ 1� pÞ, Eq. (1) is equivalent to:
P11 ¼ p2 þ pqf ;
P12 ¼ 2pq� 2pqf ;
P22 ¼ q2 þ pqf ;
ð2Þ
where P11 þ P12 þ P22 ¼ 1. Eq. (2) suggests that we can also view f as astandardized measure of the deviation from HWE proportions (Nagylaki,1998). For a general K-allele with inbreeding coefficient f, we thus have
Pij ¼p2
i þ pið1� piÞf ; i ¼ j;
2pipj � 2pipjf ; i 6¼ j;
(ð3Þ
From Eq. (3), we see that �pi=ð1� piÞ � f � 1 for i ¼ 1; 2; . . . ;K .Another approach is to view f as genotype-specific (i.e., there are asmany fij’s as there are genotypes), but it is often reasonable to use (aswe do here) a single inbreeding coefficient as the loci are unlikely tobe under the influence of selection (Weir, 2001). Both here and in whatfollows, we assume that the alleles are co-dominant.
84 P. Gorroochurn and S. E. Hodge

In general, any deviation from HWE (whether due to inbreeding ornot) is measured by the fixation index (F ), a term first introduced byWright (1951, 1965). Even more generally, Wright’s three fixationindices (FIS;FIT and FST), or F- statistics, have been used to quantifydeviations from HWE when populations are hierarchically structured(e.g., Excoffier (2001)). In such a framework, FIS corresponds to theinbreeding coefficient f considered here.
Early authors have done much work involving estimation, includingLi and Horvitz (1953), Yasuda (1968), and Robertson and Hill (1984),and Rousset and Raymond (1995). For example, Li and Horvitz pro-pose five methods for estimating f. They show that, in a 2-allele modelwith inbreeding, the maximum likelihood estimates (MLEs) of p and fare equal to their sample (or observed) values; however, they do notprovide explicit expressions for the pi’s and f when K � 3. They alsoconjecture that the MLEs of the pi’s do not equal their sample values.The same conjecture has been made by other Curie-Cohen (1982),Robertson and Hill (1984), and others, but has not to our knowledgebeen proven.
We prove that the MLEs of the pi’s do not equal their sample valuesin the section Maximum Likelihood Estimation. We also examine someof the methods of estimation of the pi’s and f . In the section, A Least-Squares Approach to the Estimation Problem, we evaluate a least-squares method of estimation of the pi’s and f , and we use simulationsin the next section to compare the three estimators (sample, MLE andLSE) in a 3-allele model. In the section on exact bias, we use prob-ability generating functions to derive exact expressions for the biasof the sample estimator of f in a two-allele model for any sample size.In the final section, we derive an approximately unbiased estimator off when p is very small (or very large) and compare its performancewith other estimators.
STATISTICAL MODEL AND ESTIMATION
In general, for a K-allele model, suppose the genotype AiAj hasobserved count xij and true proportion Pij in the population, where1 � i � j � K . Then the joint distribution of the vector x ¼ xij; 1 �
�i � j � Kg is given by the multinomial distribution:
pðxÞ ¼ n!Qði;jÞ:i�j xij!
Yði;jÞ:i�j
Pxij
ij ; ð4Þ
where n ¼Pði;jÞ:i�j xij is the sample size (or total number of genotypes),
the Pij’s are given in Eq. (3) andPði;jÞ:i�j Pij ¼ 1. The distribution in
Estimating Allele Frequencies and Inbreeding Coefficients 85

Eq. (4) is strictly valid only for an infinitely large population. From stan-dard statistical theory, marginally each xij has a binomial distribution:
xij � bino n;Pij
� �: ð5Þ
Moreover, the population proportion of allele i is
pi ¼ Pii þ1
2
Xj:j 6¼i
Pij;
where we defineP
j:j6¼i ð�Þij �P
j:j<i ð�Þji þP
j:j>i ð�Þij. The estimation ofthe parameters pi and f has been a central and natural problem in theliterature. The pi’s are usually estimated by using the sample (i.e.,observed) proportions:
pðsÞi ¼
2xii þP
j:j6¼i xij
2n: ð6Þ
The estimator pðsÞi is actually a moment estimator and is unbiased:
EpðsÞi ¼ pi:
This comes from Eq. (3), (5) and (6). The estimation of f is more diffi-cult since it is a function of a ratio of parameters. A simple estimator of fcould be obtained by replacing sample values in Eq. (1), resulting inwhat we denote as the sample estimator:
f ðsÞ ¼ 1�Pði;jÞ:i<j xij=n
1�P
i pðsÞi
� �2
8><>:9>=>;: ð7Þ
The latter estimator is biased. An alternative approach is to obtainunbiased estimators for both the numerator and denominator of f (Weir,1996), resulting in the estimator:
f ðweirÞ ¼
Xi
xii
n� p
ðsÞi
� �2� �
þ 1
2n1�
Xi
xii
n
� �1�
Xi
pðsÞi
� �2� �
� 1
2n1�
Xi
xii
n
� � ð8Þ
Both estimators in Eqs. (7) and (8) are consistent, meaning that boththeir bias and variance decrease with increasing sample size.
MAXIMUM LIKELIHOOD ESTIMATION
The method of maximum likelihood has been the most popular method ofestimation in statistical theory. Maximum likelihood estimators (MLEs)
86 P. Gorroochurn and S. E. Hodge

enjoy many optimal properties, such as consistency and large-sampleefficiency (Silvey, 1971: 73). To obtain the MLEs of the pi’s and f in themultinomial model in Eq. (4), we start by writing the log-likelihood as:
lðp; f Þ �Xði;jÞ:i�j
xij ln Pij þ C1
¼XKi¼1
xii ln p2i þ pi 1� pið Þf
� �þXði;jÞ:i<j
xij ln 2pipjð1� f Þ� �
þ C1;
ð9aÞwhere C1 ¼ lnðn!=
Qði;jÞ:i�j xij!Þ is a constant, the vector p ¼ pi; i ¼f
1; . . . ;K � 1g and pK � 1�PK�1
i¼1 pi. Eq. (9a) can be simplified to:
lðp; f Þ ¼XKi¼1
xi ln pi þXKi¼1
xii ln pi þ 1� pið Þff g
þXði;jÞ:i<j
xij lnð1� f Þ þ C2; ð9bÞ
where xi � xii þP
j:j6¼i xij and C2 is a constant. The next step is to set thefirst partial derivatives of Eq. (9b) with respect to p1; . . . ;pK�1 and f (theso-called score functions) to zero and solve for the K parameters.
Considerable simplification occurs in one special case, when thenumber of independent parameters equals the number of independentcounts (or the number of degrees of the freedom (d.f.) in the model).This happens when K ¼ 2 and yields a saturated model in which theMLEs of the parameters can be obtained by simply equating theobserved cell counts with the expected ones; that is, the MLEs are thenequal to the sample estimators, Bailey’s Rule (Bailey, 1951). Althoughthe condition of equality in the number of d.f. and the number of para-meters is sufficient, it is not necessary. To illustrate this, we take the2-allele model with inbreeding (see Eq. (2)). This has 2 d.f. and 2 inde-pendent parameters (p and f ) so that Bailey’s Rule gives the MLEs:
pðmleÞ ¼ pðsÞ ¼ 2x11 þ x12
2n;
f ðmleÞ ¼ f ðsÞ ¼ 1� x12=n
2pðsÞqðsÞ;
where qðsÞ � 1� pðsÞ. However, for any K-allele model under HWE ( f � 0in Eq. (3)), the MLEs are still equal to the sample estimators, eventhough the number of d.f. exceeds the number of independent parameters:
pðmleÞi ¼ p
ðsÞi ¼
2xii þP
j:j 6¼i xij
2n; i ¼ 1;2; . . . ;K : ð10Þ
Estimating Allele Frequencies and Inbreeding Coefficients 87

There exist two sufficient conditions for the sample estimators to equalthe MLEs. One condition is that the population must be in HWE (f � 0),and the other is that there should be only two alleles (K ¼ 2). However,when neither condition holds, the sample estimators do not in generalmaximize the likelihood (except in the rare case of a ‘‘perfect fit’’; see Con-clusion), as we now show:
Theorem 1: For the K-allele model with inbreeding coefficient f(where f 6¼ 0), having multinomial distribution given in Eq. (4) and cellprobabilities Pij’s defined in Eq. (3), the MLEs of the parameterspiði ¼ 1; . . . ;KÞ and f do not in general equal the sample estimatorspðsÞi and f ðsÞ (given in Eqs. (6) and (7)) for K � 3.
Proof. Differentiating the log-likelihood in Eq. (9b) with respect topiði ¼ 1; . . . ;K � 1Þ and f, and setting to zero, we obtain
@l
@pi¼ xi
piþ xiið1� f Þ
pi þ ð1� piÞf� xK
pK� xKKð1� f Þ
pK þ ð1� pKÞf¼ 0; ð11Þ
@l
@f¼XKi¼1
xii 1� pið Þpi þ ð1� piÞf
� ��Pði;jÞ:i<j xij
1� f¼ 0: ð12Þ
For Eq. (11) to be valid, we need, for i ¼ 1; . . . ;K � 1,
xi
piþ xiið1� f Þ
pi þ ð1� piÞf¼ xK
pKþ xKKð1� f Þ
pK þ ð1� pKÞf:
It follows from the above that, for all i ¼ 1; . . . ;K;
xi
piþ xiið1� f Þ
pi þ ð1� piÞf¼ C3; ð13Þ
where C3 is a constant. We now replace pi and f by their sample valuesin Eqs. (6) and (7), and show that Eq. (13) cannot in general be satis-fied when K � 3. Let pi ¼ p
ðsÞi ¼ 2xii þ
Pj:j 6¼i xij
� �=ð2nÞ and f ¼ f ðsÞ so
that Eq. (13) becomes, for i ¼ 1; . . . ;K,
xii
pðsÞi
� �2þpðsÞi 1� p
ðsÞi
� �f ðsÞ¼ C4; ð14Þ
where C4 is a constant. If the sample estimators did equal the MLEs,then Eq. (14) would be valid for all possible xij’s and the correspondingpðsÞi ’s and f ðsÞ. However, this is not the case, in general. We construct a
88 P. Gorroochurn and S. E. Hodge

simple counterexample: For K � 3, let x11=n ¼ 1=K ; let xii=n ¼ 1=ð2KÞfor i ¼ 2; . . . ;K ; let x1j ¼ 0 for j ¼ 2; . . . ;K ; and let xij=n ¼ 1=fKðK � 2Þgfor 2 � i < j � K. Then from Eq. (6), p
ðsÞi ¼ 1=K for all i ¼ 1; . . . ;K . This
example shows that it is possible to have all pðsÞi ’s the same even
though not all the xii’s are the same. Therefore, no one value of f ðsÞ
can possibly satisfy Eq. (14) for all i. Thus the sample estimators donot in general equal the MLEs when K � 3 and f 6¼ 0. On the otherhand, when K ¼ 2, p
ðsÞ1 ¼ p
ðsÞ2 implies x11 ¼ x22 and vice-versa, so that
Eq. (14) is always valid. This completes the proof.
Remarks:
(i) For a model assuming HWE (i.e. f � 0), Eq. (13) is valid for anyK-allele model when pi is replaced by p
ðsÞi , showing that the sample
estimators are indeed the MLEs, as previously stated (Li andHorvitz, 1953).
(ii) If the value of f is fixed, then Eq. (11) can be solved for the MLEsof the pi’s. Similarly, the values of pi’s could be fixed at their sam-ple values p
ðsÞi , and Eq. (12) could be solved for the MLE of f
(Curie-Cohen, 1982). However, the MLEs would still not equalthe sample values of the respective parameters, in general.
For a K � 3 allele model with inbreeding, we must obtain the MLEsby a numerical technique such as the method of scoring, or Newton’smethod with numerical or analytical derivatives (Monahan, 2001)(see section 5 for some numerical experiments).
In the next section, we evaluate a method of estimating the para-meters pi and f that has been popular in regression problems and goesback to the times of Legendre (1752–1833) and Gauss (1777–1855) (forexample, Stigler (1986)).
A LEAST-SQUARES APPROACH TO THE ESTIMATIONPROBLEM
The method of least-squares has the advantage over the method ofmaximum likelihood in that it does not require any distributional (orstatistical) assumptions for the estimation itself and, in many cases,is more computationally tractable (especially with the use of matrixalgebra) than the method of maximum likelihood. However, in gen-eral, MLEs have more attractive properties than least-squares estima-tors (LSEs) and are more widely used. For large samples, MLEs arenearly unbiased and have variances nearly equal to the Cramer-Raolower bound (Silvey, 1971:77).
Estimating Allele Frequencies and Inbreeding Coefficients 89

To obtain the LSEs of the pi’s and f for a general K-allele model,we need only the observed genotype counts x ¼ fxij; 1 � i � j � Kgand the expected genotype counts nPij, where Pij is given in Eq. (3).The function that needs to be minimized here is called the error sumof squares and is given by:
SSE �Xði;jÞ:i�j
xij � nPij
� �2 ¼XKi¼1
xii � np2i � npið1� piÞf
� �2
þXði;jÞ:i<j
xij � 2npipjð1� f Þ�
g2; ð15Þ
where pK � 1�PK�1
i¼1 pi, as before. Eq. (15) is non-linear and thecorresponding LSEs do not, in general, have the attractive propertiesof the linear case, namely unbiasedness and minimum variance (of alllinear unbiased estimators). However, the LSEs of Eq. (15) are asymp-totically unbiased and have minimum variance (Myers, 1990: 426).
To obtain the LSEs in Eq. (15), the usual approach is to set the firstpartial derivatives of SSE to zero, as in the MLE case. If the pi’s arefixed (say to their sample values), then f can be obtained analyticallysince the score equations for Eq. (15) are linear in f. Again, there is asimplification in the 2-allele case: The LSEs are simply the sampleestimators, since the number of independent parameters is equal tothe number of d.f. (i.e., there is no d.f. for the error and the model issaturated). So for K ¼ 2, we have:
pðlseÞ ¼ pðmleÞ ¼ pðsÞ ¼ 2x11 þ x12
2n;
f ðlseÞ ¼ f ðmleÞ ¼ f ðsÞ ¼ 1� x12=n
2pðsÞqðsÞ;
Substituting these LSEs into Eq. (15) yields a sum of zero terms, thusminimizing SSE.
For a K � 3 allele model, the LSEs are biased. They should beobtained using numerical techniques such as the Gauss-Newtonprocedure (Monahan, 2001).
NUMERICAL RESULTS
Using the delta method (Casella and Berger, 2001), Curie-Cohen(1982) shows that the expected value of f ðsÞ is
Ef ðsÞ ¼ f þO1
n
;
90 P. Gorroochurn and S. E. Hodge

and its variance is
var f ðsÞ ¼ð1� f Þ 1� 2pq 1� fð Þ � p� qð Þ2 1� fð Þ2
n o2pqn
þO1
n2
:
Moments of several other related estimators have also been given inRobertson and Hill (1984). We use simulations to numerically comparethe three types of estimators (sample, MLE and LSE) for a 3-allelemodel with p1 ¼ :2, p2 ¼ :5, f ¼ :05 for various sample sizes n, andwe investigate their biases and standard deviations (see Table 1).We observe that the biases of both the MLEs and LSEs of f are quitesmall in magnitude, decreasing as n gets larger. Theoretically, thebiases of the sample estimators of the pi’s are zero, but since our simu-lations are based on a finite number of simulations the biases are notexactly zero. Moreover, in most cases, the MLEs outperform the LSEsboth in terms of bias and standard deviation. Finally, as n gets larger,the standard deviations of the MLEs become slightly smaller thanthose of the sample estimators. In many cases, the sample estimatorsare better than both the MLEs and LSEs both in terms of bias andstandard deviation. Table 2 shows more results with different allele-and f-combinations, with similar results to those of Table 1.
THE EXACT BIAS OF f (s) IN A 2-ALLELE MODEL
In this section, we investigate the bias of f ðsÞ, as defined in Eq. (7), forthe 2-allele model and an arbitrary sample size n. We start by obtain-ing an algebraic expression for the expectation E � E x12=nð Þ=f2pðsÞqðsÞ� �
g.
Theorem 2: For the 2-allele model with inbreeding coefficient f, andx11; x12; x22 as the number of genotypes A1A1; A1A2; A2A2, respect-ively, such that x11 þ x12 þ x22 ¼ n, we have
E ¼ 2� 2n
Z 1
z¼0
hp�z�
p�z2 þ ð1� p� � q�Þzþ q��n�1
þ q�z�
q�z2þð1� p� � q�Þzþ p�gn�1idz; ð16Þ
where p� ¼ p2ð1� f Þ þ pf , q� ¼ q2ð1� f Þ þ qf , pðsÞ ¼ 2x11 þ x12ð Þ=ð2nÞand qðsÞ ¼ 1� pðsÞ.
Proof: Substituting pðsÞ ¼ ð2x11 þ x12Þ=ð2nÞ and x12 ¼ n� x11 � x22,we have
x12=n
2pðsÞqðsÞ¼ 2 1� x11
nþ x11 � x22� x22
n� x11 þ x22
; ð17Þ
Estimating Allele Frequencies and Inbreeding Coefficients 91

TA
BL
E1
Bia
san
dS
tan
dard
Dev
iati
on(S
D)
ofS
am
ple
Est
imate
s(S
am
),M
axim
um
Lik
elih
ood
Est
imate
s(M
LE
),an
dL
east
-Squ
are
sE
stim
ate
s(L
SE
)of
p1,
p2
an
df
for
Vari
ous
Sam
ple
Siz
esin
a3-A
llel
eM
odel
wit
hp
1¼
.2
p1
p2
f
bia
sS
Dbia
sS
Dbia
sS
D
n¼
10
sam¼�:
00030
sam¼:0
9212
sam¼�:
00105
sam¼:1
1412
sam¼�:0
5627
sam¼:2
4461
mle¼:0
0296
mle¼:1
4338
mle¼�:
00512
mle¼:1
8701
mle¼�:
07264
mle¼:3
0792
lse¼�:
00436
lse¼:1
0089
lse¼:0
0629
lse¼:1
2031
lse¼�:
08023
lse¼:2
7441
n¼
20
sam¼:0
0042
sam¼:0
6550
sam¼�:
00015
sam¼:0
8204
sam¼�:0
2458
sam¼:1
7020
mle¼:0
0005
mle¼:0
8629
mle¼:0
0116
mle¼:0
9206
mle¼�:
03355
mle¼:1
9470
lse¼�:
00305
lse¼:0
7168
lse¼:0
0518
lse¼:0
8448
lse¼�:
03793
lse¼:1
8922
n¼
30
sam¼:0
0102
sam¼:0
5319
sam¼�:
00061
sam¼:0
6579
sam¼�:
02069
sam¼:1
3639
mle¼:0
0015
mle¼:0
6870
mle¼:0
0015
mle¼:0
6902
mle¼�:
02601
mle¼:1
4861
lse¼�:
00157
lse¼:0
5852
lse¼:0
0335
lse¼:0
6742
lse¼�:
03015
lse¼:1
5053
n¼
40
sam¼:0
0016
sam¼:0
4619
sam¼�:
00028
sam¼:0
5716
sam¼�:
01359
sam¼:1
1901
mle¼� :
00009
mle¼:0
4928
mle¼�:
00001
mle¼:0
5790
mle¼�:
01673
mle¼:1
2316
lse¼�:
00179
lse¼:0
5077
lse¼:0
0288
lse¼:0
5820
lse¼�:
02083
lse¼:1
3127
n¼
100
sam¼:0
0023
sam¼:0
2886
sam¼�:
00031
sam¼:0
3622
sam¼�:
00015
sam¼:0
7476
mle¼:0
0019
mle¼:0
2894
mle¼�:
00031
mle¼:0
3623
mle¼�:
00555
mle¼:0
7362
lse¼�:
00065
lse¼:0
3228
lse¼:0
0115
lse¼:0
3668
lse¼�:
00821
lse¼:0
8201
n¼
200
sam¼�:
00015
sam¼:0
2047
sam¼�:
00009
sam¼:0
2569
sam¼�:
00188
sam¼:0
5290
mle¼�:
00014
mle¼:0
2047
mle¼�:
00009
mle¼:0
2569
mle¼�:
00220
mle¼:0
5193
lse¼�:
00052
lse¼:0
2305
lse¼�:
00067
lse¼:0
2604
lse¼�:
00317
lse¼:0
5787
p2¼
.5an
df¼
.05,fr
omco
mp
ute
rsi
mu
lati
ons.
For
each
sam
ple
size
,w
ith
the
giv
envalu
esof
p1,p
2an
df,
mu
ltin
omia
lob
serv
ati
ons
wer
egen
erate
dacc
ord
ing
toE
q.
(4),
usi
ng
Map
leV
Rel
ease
4.0
0a.
Th
esa
mp
lees
tim
ate
sw
ere
calc
ula
ted
usi
ng
Eqs.
(6)
an
d(7
).T
he
ML
Es
an
dL
SE
sw
ere
obta
ined
by
usi
ng
the
met
hod
ofsc
orin
gan
dth
eG
au
ss-N
ewto
np
roce
du
re,
resp
ecti
vel
y.
All
thre
ees
tim
ato
rsof
fw
ere
ass
ign
edth
evalu
eze
row
hen
the
sam
ple
sw
ere
mon
omor
ph
ic.
Bia
ses
an
dst
an
dard
dev
iati
ons
wer
eca
lcu
late
dov
er10,0
00
sim
ula
tion
sfo
rea
chsa
mp
lesi
ze.
92

TA
BL
E2
Bia
san
dS
tan
dard
Dev
iati
on(S
D)
ofS
am
ple
Est
imate
s(s
am
),M
axim
um
Lik
elih
ood
Est
imate
s(M
LE
),an
dL
east
-Squ
are
sE
stim
ate
s(L
SE
)of
p1,
p2,
an
df
for
Vari
ous
Sam
ple
Siz
esin
a3-A
llel
eM
odel
from
Com
pu
ter
Sim
ula
tion
s
p1
p2
f
bia
sS
Dbia
sS
Dbia
sS
D
(a)
p1¼
.2,
p2¼
.5an
df¼
.01
n¼
20
sam¼�:
00068
sam¼:0
6420
sam¼�:
00069
sam¼:0
7907
sam¼�:
04270
sam¼:1
8613
mle¼:0
0044
mle¼:1
0224
mle¼:0
0119
mle¼:0
9830
mle¼�:
03777
mle¼:2
0778
lse¼�:
00312
lse¼:0
7105
lse¼:0
0439
lse¼:0
8174
lse¼�:
04264
lse¼:1
8611
n¼
40
sam¼:0
0085
sam¼:0
4506
sam¼�:
00047
sam¼:0
5619
sam¼�:
01992
sam¼:1
3034
mle¼:0
0032
mle¼:0
4606
mle¼�:
00019
mle¼:0
5631
mle¼�:
01597
mle¼:1
2066
lse¼�:
00142
lse¼:0
5042
lse¼:0
0280
lse¼:0
5731
lse¼�:
01989
lse¼:1
3031
(b)
p1¼:2;
p2¼:5
an
df¼:0
5(f
rom
the
Table
1)
n¼
20
sam¼:0
0042
sam¼:0
6550
sam¼�:
00015
sam¼:0
8204
sam¼�:
02458
sam¼:1
7020
mle¼:0
0005
mle¼:0
8629
mle¼:0
0116
mle¼:0
9206
mle¼�:
03355
mle¼:1
9470
lse¼�:
00305
lse¼:0
7168
lse¼:0
0518
lse¼:0
8448
lse¼�:
03793
lse¼:1
8922
n¼
40
sam¼:0
0016
sam¼:0
4619
sam¼�:
00028
sam¼:0
5716
sam¼�:
01359
sam¼:1
1901
mle¼�:
00009
mle¼:0
4928
mle¼�:
00001
mle¼:0
5790
mle¼� :
01673
mle¼:1
2316
lse¼�:
00179
lse¼:0
5077
lse¼:0
0288
lse¼:0
5820
lse¼�:
02083
lse¼:1
3127
(c)
p1¼:4;
p2¼:5
an
df¼:0
1n¼
20
sam¼�:
00003
sam¼:0
7774
sam¼:0
0022
sam¼:0
7862
sam¼�:
02157
sam¼:1
8318
mle¼:0
0211
mle¼:1
1449
mle¼:0
0255
mle¼:1
0831
mle¼�:
04372
mle¼:2
3114
lse¼�:
00010
lse¼:0
8086
lse¼:0
0155
lse¼:0
8088
lse¼�:
02445
lse¼:2
0809
n¼
40
sam¼:0
0084
sam¼:0
5534
sam¼�:
00033
sam¼:0
5626
sam¼�:
01205
sam¼:1
2932
mle¼:0
0173
mle¼:0
7707
mle¼:0
0053
mle¼:0
7379
mle¼� :
02944
mle¼:1
8129
lse¼:0
0073
lse¼:0
5684
lse¼:0
0035
lse¼:0
5782
lse¼�:
01308
lse¼:1
4863
(Con
tin
ued
)
93

TA
BL
E2
Con
tin
ued
p1
p2
f
bia
sS
Dbia
sS
Dbia
sS
D
(d)
p1¼
.4,
p2¼
.5an
df¼
.05
n¼
20
sam¼�:
00078
sam¼:0
8025
sam¼:0
0101
sam¼:0
8114
sam¼�:
02288
sam¼:2
0858
mle¼�:
00069
mle¼:1
1540
mle¼:0
0083
mle¼:1
1654
mle¼�:
04210
mle¼:2
2889
lse¼�:
00040
lse¼:0
8308
lse¼:0
0229
lse¼:0
8313
lse¼�:
02278
lse¼:2
0873
n¼
40
sam¼:0
0093
sam¼:0
5669
sam¼�:
00082
sam¼:0
5725
sam¼�:
01103
sam¼:1
4848
mle¼:0
0163
mle¼:0
7302
mle¼�:
00176
mle¼:0
8933
mle¼�:
02207
mle¼:1
5633
lse¼:0
0100
lse¼:0
5834
lse¼:0
0002
lse¼:0
5883
lse¼�:
01103
lse¼:1
4848
94

by partial fractions. Now ðx11; x22Þ has a multinomial distribution:
ðx11; x22Þ � multiðn;p�; q�Þ ) E zx11
1 zx22
2
� �¼ p�z1 þ q�z2 þ 1� p� � q�ð Þn:
E zx11
1 zx22
2
� �is the joint probability generating function of x11; x22ð Þ.
Differentiating it partially with respect to z1,
E x11zx11�11 zx22
2
� �¼ np� p�z1 þ q�z2 þ 1� p� � q�ð Þn�1;
so that
E x11znþx11�11 zx22
2
� �¼ np�zn
1 p�z1 þ q�z2 þ 1� p� � q�ð Þn�1:
Setting z2 ¼ 1=z1 and integrating with respect to z1,
Ex11znþx11�x22
1
nþ x11 � x22
¼ np�
Zz1 p�z2
1 þ q� þ 1� p� � q�ð Þz1
� �n�1dz1:
Therefore,
Ex11
nþ x11 � x22
¼ np�
Z 1
z1¼0
z1 p�z21 þ q� þ 1� p� � q�ð Þz1
� �n�1dz1:
ð18Þ
Similarly,
Ex22
n� x11 þ x22
¼ nq�
Z 1
z2¼0
z2 p� þ q�z22 þ 1� p� � q�ð Þz2
� �n�1dz2:
ð19Þ
Using Eq. (17), (18) and (19), we get the required expression inEq. (16). This completes the proof.
From Eq. (16), we have
Ef ðsÞ ¼ 1� E:
Thus, the bias of f ðsÞ is given by
bias f ðsÞn o
¼ Ef ðsÞ � f ¼ 1� E � f : ð20Þ
Remembering that, for the 2-allele case, f ðsÞ ¼ f ðmleÞ ¼ f ðlseÞ, Eq. (20)also gives the bias for both the MLE and LSE of f.
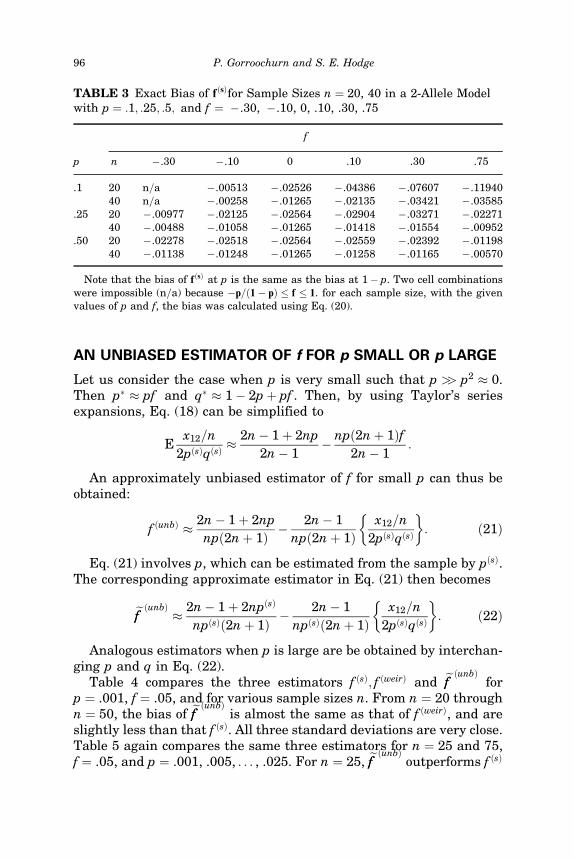
In Table 3, we compute the bias of f ðsÞ for various sample sizes n inthe 2-allele case with p ¼ .1, .25 and .5, f ¼ �:30;�:10; 0; :10; :30 and.75, and n ¼ 20 and 40. In all cases, f ðsÞ underestimates the inbreedingcoefficient f.
Estimating Allele Frequencies and Inbreeding Coefficients 95
AN UNBIASED ESTIMATOR OF f FOR p SMALL OR p LARGE
Let us consider the case when p is very small such that p >> p2 � 0.Then p� � pf and q� � 1� 2pþ pf . Then, by using Taylor’s seriesexpansions, Eq. (18) can be simplified to
Ex12=n
2p sð Þq sð Þ �2n� 1þ 2np
2n� 1� np 2nþ 1ð Þf
2n� 1:
An approximately unbiased estimator of f for small p can thus beobtained:
f ðunbÞ � 2n� 1þ 2np
npð2nþ 1Þ �2n� 1
npð2nþ 1Þx12=n
2pðsÞqðsÞ
� �: ð21Þ
Eq. (21) involves p, which can be estimated from the sample by pðsÞ.The corresponding approximate estimator in Eq. (21) then becomes
eff ðunbÞ� 2n� 1þ 2npðsÞ
npðsÞð2nþ 1Þ �2n� 1
npðsÞð2nþ 1Þx12=n
2pðsÞqðsÞ
� �: ð22Þ
Analogous estimators when p is large are be obtained by interchan-ging p and q in Eq. (22).
Table 4 compares the three estimators f ðsÞ; f ðweirÞ and eff ðunbÞfor
p ¼ .001, f ¼ .05, and for various sample sizes n. From n ¼ 20 throughn ¼ 50, the bias of eff ðunbÞ
is almost the same as that of f ðweirÞ, and areslightly less than that f ðsÞ. All three standard deviations are very close.Table 5 again compares the same three estimators for n ¼ 25 and 75,f ¼ .05, and p ¼ .001, .005, . . . , .025. For n ¼ 25, eff ðunbÞ
outperforms f ðsÞ
TABLE 3 Exact Bias of fðsÞfor Sample Sizes n ¼ 20, 40 in a 2-Allele Modelwith p ¼ :1; :25; :5; and f ¼ �.30, �.10, 0, .10, .30, .75
f
p n �.30 �.10 0 .10 .30 .75
.1 20 n=a �.00513 �.02526 �.04386 �.07607 �.1194040 n=a �.00258 �.01265 �.02135 �.03421 �.03585
.25 20 �.00977 �.02125 �.02564 �.02904 �.03271 �.0227140 �.00488 �.01058 �.01265 �.01418 �.01554 �.00952
.50 20 �.02278 �.02518 �.02564 �.02559 �.02392 �.0119840 �.01138 �.01248 �.01265 �.01258 �.01165 �.00570
Note that the bias of fðsÞ at p is the same as the bias at 1� p. Two cell combinationswere impossible (n=a) because �p=ð1� pÞ � f � 1. for each sample size, with the givenvalues of p and f, the bias was calculated using Eq. (20).
96 P. Gorroochurn and S. E. Hodge

TA
BL
E4
Bia
san
dS
tan
dard
Dev
iati
on(S
D)
offð
sÞ(s
am
),fð
wei
rÞ(w
eir)
an
de ffðunb
Þ(u
nb)
ina
2-A
llel
eM
odel
wit
hn¼
20,25,30,
40,
50,
75,
100,
125,
150,
f¼
.05,
an
dp¼
.001
from
Com
pu
ter
Sim
ula
tion
s
n¼
20
n¼
25
n¼
30
Bia
sS
Dbia
sS
Dbia
sS
D
sam¼�:0
4974
sam¼:0
3565
sam¼�:0
4952
sam¼:0
3758
sam¼�:0
5001
sam¼:0
3099
wei
r¼�:0
4876
wei
r¼:0
3524
wei
r¼�:0
4863
wei
r¼:0
3740
wei
r¼�:0
4866
wei
r¼:0
3071
un
b¼�:0
4876
un
b¼:0
3492
un
b¼�:0
4860
un
b¼:0
3739
un
b¼�:0
4866
un
b¼:0
3032
n¼
35
n¼
40
n¼
50
Bia
sS
Dbia
sS
Dbia
sS
D
sam¼�:0
4964
sam¼:0
3680
sam¼�:0
4890
sam¼:0
4593
sam¼�:0
4855
sam¼:0
4830
wei
r¼�:0
4866
wei
r¼:0
3664
wei
r¼�:0
4795
wei
r¼:0
4578
wei
r¼�:0
4766
wei
r¼:0
4823
un
b¼�:0
4866
un
b¼:0
3631
un
b¼�:0
4790
un
b¼:0
4578
un
b¼�:0
4767
un
b¼:0
4749
n¼
75
n¼
100
n¼
125
Bia
sS
Dbia
sS
Dbia
sS
D
sam¼�:0
4789
sam¼:0
5514
sam¼�:0
4625
sam¼:0
6721
sam¼�:0
4557
sam¼:0
7037
wei
r¼�:0
4700
wei
r¼:0
5509
wei
r¼�:0
4537
wei
r¼:0
6717
wei
r¼�:0
4472
wei
r¼:0
7035
un
b¼�:0
4696
un
b¼:0
5487
un
b¼�:0
4547
un
b¼:0
6577
un
b¼�:0
4502
un
b¼:0
6723
For
each
sam
ple
size
,w
ith
the
giv
envalu
esof
p1,
p2
an
df,
mu
ltin
omia
lob
serv
ati
ons
wer
egen
erate
dacc
ord
ing
toE
q.
(4),
usi
ng
Map
leV
Rel
ease
4.0
0a.T
he
thre
ees
tim
ate
sw
ere
calc
ula
ted
usi
ng
Eqs.
(7),
(8)
an
d(2
2),
resp
ecti
vel
y.A
llth
ree
esti
mato
rsof
fw
ere
ass
ign
edth
evalu
eze
row
hen
the
sam
ple
sw
ere
mon
omor
ph
ic.
Bia
ses
an
dst
an
dard
dev
iati
ons
wer
eca
lcu
late
dov
er10,0
00
sim
ula
tion
sfo
rea
chsa
mp
lesi
ze.
97

and f ðweirÞ both in terms of bias and standard deviation. However, for
n ¼ 75, f ðweirÞ is the best in terms with respect to bias, while eff ðunbÞstill
remains the best with respect to standard deviation.
CONCLUSION
We have investigated some of the methods of estimation of allele fre-quencies and inbreeding coefficients in a K-allele model. We haveproved that in a K � 3 allele model with inbreeding, the sample valuesof the allele frequencies and inbreeding coefficient differ from their
TABLE 5 Bias and Standard Deviation (SD) of fðsÞ (sam), fðweirÞ (weir) andeff ðunbÞ
(unb) in a 2-Allele Model with p ¼ .001, .005, .009, .013, .017, .021, .025, f ¼ :05,and n ¼ 25, 75 from Computer Simulations
n ¼ 25 n ¼ 75
Bias SD Bias SD
p ¼ .001 sam ¼ �:04924 sam ¼ :04121 sam ¼ �:04787 sam ¼ :05502weir ¼ �:04831 weir ¼ :04104 weir ¼ �:04698 weir ¼ :05498unb ¼ �:04831 unb ¼ :04048 unb ¼ �:04697 unb ¼ :05432
p ¼ .005 sam ¼ �:04948 sam ¼ :07159 sam ¼ �:04041 sam ¼ :10937weir ¼ �:04521 weir ¼ :07112 weir ¼ �:03700 weir ¼ :10919unb ¼ �:04493 unb ¼ :06928 unb ¼ �:03789 unb ¼ :09868
p ¼ .009 sam ¼ �:04759 sam ¼ :10173 sam ¼ �:03124 sam ¼ :14257weir ¼ �:04044 weir ¼ :10093 weir ¼ �:02645 weir ¼ :14216unb ¼ �:03972 unb ¼ :09640 unb ¼ �:02929 unb ¼ :11977
p ¼ .013 sam ¼ �:04540 sam ¼ :12313 sam ¼ �:02854 sam ¼ :14770weir ¼ �:03606 weir ¼ :12218 weir ¼ �:02309 weir ¼ :14731unb ¼ �:03490 unb ¼ :11386 unb ¼ �:02763 unb ¼ :11328
p ¼ .017 sam ¼ �:04326 sam ¼ :13681 sam ¼ �:02434 sam ¼ :15324weir ¼ �:03226 weir ¼ :13570 weir ¼ �:01862 weir ¼ :15301unb ¼ �:03108 unb ¼ :12258 unb ¼ �:02526 unb ¼ :11067
p ¼ .021 sam ¼ �:04245 sam ¼ :15081 sam ¼ �:02133 sam ¼ :15435weir ¼ �:02940 weir ¼ :14950 weir ¼ �:01537 weir ¼ :15445unb ¼ �:02737 unb ¼ :13168 unb ¼ �:02491 unb ¼ :09985
p ¼ .025 sam ¼ �:04299 sam ¼ :15335 sam ¼ �:01915 sam ¼ :15614weir ¼ �:02877 weir ¼ :15189 weir ¼ �:01285 weir ¼ :15653unb ¼ �:02621 unb ¼ :12924 unb ¼ �:02413 unb ¼ :09593
For each sample size, with the given values of p1, p2 and f, multinomial observationswere generated according to Eq. (4), using Maple V Release 4.00a. The three estimateswere calculated using Eqs. (7), (8) and (22), respectively. All three estimators of f wereassigned the value zero when the samples were monomorphic. Biases and standarddeviations were calculated over 10,000 simulations.
98 P. Gorroochurn and S. E. Hodge

maximum likelihood estimates. We have introduced and evaluated aleast-squares way of looking at the estimation problem. For theK ¼ 3 allele case, we have numerically compared the sample,maximum likelihood, and least-squares estimates of the parametersin our model. We have shown that, while the biases are relativelysmall for all three estimators, the standard deviations are slightlysmaller for the MLEs than for the sample estimators with increasingsample size. We have used probability generating functions to calcu-late the exact bias of the sample estimator of the inbreeding coefficientin a K ¼ 2 allele model for any sample size n. Finally, we have derivedan approximately unbiased estimator of f when p is very small (or verylarge) and have shown that it outperforms f ðsÞ and f ðweirÞ both in termsof bias and standard deviation when p is very small (� .001) and n ismoderate (�25).
Is it surprising that the sample estimators of the parameters do notequal their MLEs, when K � 3? This fact is perhaps less surprising forthe inbreeding coefficient f, but it seems counterintuitive for the allelefrequencies. After all, the actual count of Ai alleles in the sample isindeed given by Eq. (10), the sample estimator. On the other hand,one can realize that in the presence of inbreeding, homozygotes withalleles IBD yield only half the information of homozygotes whosealleles are not autozygous. In any case, the sample estimators do notmaximize the likelihood for any of the parameters when K � 3 andf 6¼ 0. The only exception occurs when there is a ‘‘perfect fit,’’ that is,if and only if the KðK þ 1Þ=2 equations nPij ¼ xij (where Pij is definedin Eq. (3)) yield a unique solution for p and f. Li and Horvitz (1953) didstate this result, which they regarded as reasonable; however, they didnot prove it. What we provide here is a rigorous mathematical proof.
Additionally, three observations can be made from the proof of The-orem 1. First, no one value of f ðsÞ satisfies Eqs. (14) for all i ¼ 1, 2,. . .,K; thus, no matter what the value of f, p ¼ pðsÞ does not maximize thelikelihood in general. Second, the proof does not involve the actualvalue of f ðsÞ; thus even if the true value of f were known, so that fdid not need to be estimated, it would still follow from Eqs. (14) thatthe sample estimators of the pi’s would not maximize the likelihood.Third, even if the true value of the pi’s were known, so that they didnot need to be estimated, it would still follow from Eqs. (14) that thesample estimates of f would not maximize the likelihood.
The least-squares approach shows an interesting way of looking atthe estimation problem, that of fitting the KðK þ 1Þ=2 genotypecounts, or data points, xij to their expected values. The least-squaressolutions thus obtained represent the estimates that best fit the sys-tem of equations nPij ¼ xij. When K � 3 and f 6¼ 0, these estimates
Estimating Allele Frequencies and Inbreeding Coefficients 99

are also different from both the sample values and the MLEs (except inthe case of a perfect fit). Since least-squares are not as widely used asmaximum likelihood, we did not dwell too much on the theoreticalproperties of the former.
The numerical calculations in the section, Numerical Results, showthat, at least for the cases we have considered, the biases of both theMLEs and LSEs are quite small in magnitude, decreasing as n getslarger. The MLEs are slightly better than the LSEs both in terms ofbias and standard deviation. For larger n, the standard deviations ofthe MLEs become slightly smaller than those of the sample estimates.
In the subsequent section, we give an exact algebraic expression forE ðx12=nÞ= 2pðsÞqðsÞ
� �� �in integral form for any sample size n in a K ¼ 2
allele model with inbreeding. This enables not only the exact bias off ðsÞ to be calculated, but also the exact bias of any estimator of f whichis of the form 1� jðx12=nÞ=ð2pðsÞqðsÞÞ, where j is a constant.
We use the results from that section to derive an approximatelyunbiased estimator of f when p is very small (or very large), and wecompare its performance with other estimators. We show that thisestimator outperforms f ðsÞ and f ðweirÞ both in terms of bias and stan-dard deviation when p is very small (� .001) and n is moderate (�25).
Our primary aim in this paper was to investigate the performancesof various estimators (SAM, MLE, LSE). Therefore, we have refrainedfrom giving clear-cut guidelines on the ‘‘best’’ estimator based on biasand standard deviation, but rather have left it to the reader to makethat choice. Moreover, we would like to point out that, although mostof the biases seem to be small, they are on average only one order ofmagnitude smaller than the corresponding standard deviations, andtherefore unlikely to be insignificant.
A final interesting point arises serendipitously from the expressionfor Ef ðsÞ derived in Theorem 2. Consider the extreme situation inwhich either x11 ¼ n or x22 ¼ n (i.e., all observed genotypes are homo-zygous for one particular allele). What value should one assign to f ðsÞ
in that case? One cannot simply use the usual expression for f ðsÞ (seeEq. 17) because that expression, viewed as a function of x11 and x22,gðx11; x22Þ, has a singularity at the points (n, 0) and (0, n). Moreover,applying L’Hopital’s rule does not resolve the indeterminacy becausethe value of gðx11; x22Þ near each singularity differs, depending onhow one approaches the singularity.
The question of what value to assign to f ðsÞ when x11 ¼ n or x22 ¼ nbecomes relevant if, for example, one wishes to calculate the exactEf ðsÞ in some finite sample. Hartl and Clark (1997:112), imply thatf ðsÞ equals zero in this situation, based on the reasoning that, ‘‘thegenotype frequencies, though extreme, still satisfy the Hardy-Weinberg
100 P. Gorroochurn and S. E. Hodge

principle.’’ We can derive the same value (0), based on a mathematicalargument, namely that the PGF implicitly assigns that value to f ðsÞ inthat situation. See the Appendix for details.
APPENDIX
Proof that the probability generating function, as formulated in The-orem 2, implicitly assigns the value 0 to f ðsÞ when ðx11; x22Þ ¼ ð0;nÞ orwhen ðx11; x22Þ ¼ ðn; 0Þ.
We write Eq. (17) as
1� f ðsÞ ¼ x12=n
2pðsÞqðsÞ¼ 2� 2U1ðx11; x22Þ � 2U2ðx11; x22Þ;
where
U1ðx11; x22Þ �x11
nþ x11 � x22; U2ðx11; x22Þ �
x22
n� x11 þ x22:
Let us consider the case when ðx11; x22Þ ¼ ð0;nÞ. Then U2ð0;nÞ ¼1=2, so
1� f ðsÞ ¼ 1� 2U1ð0;nÞ ) f ðsÞ ¼ 2U1ð0;nÞ: ð23Þ
Now U1ð0;nÞ is indeterminate and cannot be evaluated even byapplying L’Hopital’s rule. For example, if we approach U1ð0;nÞ alongthe line x11þ x22 ¼ n, then lim
x22!nU1ð0;nÞ ¼ 1=2; if along the line
2x11þ x22 ¼ n, then limx22!n
U1ð0;nÞ ¼ 1=3; if along the line x11 ¼ 0, then
limx22!n
U1ð0;nÞ ¼ 0; etc. Thus, the value of U1ðx11; x22Þ at (0, n) represents
a true singularity. However, we can write
EU1 x11; x22ð Þ ¼Xn
x11¼0
Xn�x11
x22¼0
U1 x11; x22ð Þ n!
x11 ! x22 ! n� x11 � x22ð Þ!
p�ð Þx11 q�ð Þx22 1� p� � q�ð Þn�x11�x22
¼ U1 0;nð Þ þXn
x11¼1
Xn�x11
x22¼0
x11
nþ x11 � x22
n!
x11 ! x22 ! n� x11 � x22ð Þ!
p�ð Þx11 q�ð Þx22
1� p� � q�ð Þn�x11�x22 ; ð24Þ
Estimating Allele Frequencies and Inbreeding Coefficients 101

since ðx11; x22Þ � multiðn;p�; q�Þ. But also, using the PGF to findexpected values, as in Eq. (18), we know
EU1 x11;x22ð Þ ¼ np�Z 1
z¼0
z p�z2þ q� þ 1� p� � q�ð Þz� �n�1
dz
¼ np�Z 1
z¼0
zXn�1
i¼0
Xn�1�i
j¼0
n� 1ð Þ!i! j! n� 1� i� jð Þ! p�z2
� �iq�ð Þj
1� p� � q�ð Þzf gn�1�i�jdz
¼ np�Z 1
z¼0
zXn
i¼1
Xn�i
j¼0
n� 1ð Þ!i� 1ð Þ!j! n� i� jð Þ! p�z2
� �i�1q�ð Þj
1� p� � q�ð Þzf gn�i�jdz
¼ np�Xn
i¼1
Xn�i
j¼0
n� 1ð Þ!i� 1ð Þ!j! n� i� jð Þ! p�ð Þi�1 q�ð Þj
1� p� � q�ð Þn�i�jZ 1
z¼0
zn�1þi�jdz
¼Xn
i¼1
Xn�i
j¼0
n!i
i!j! n� i� jð Þ! p�ð Þi q�ð Þj 1� p� � q�ð Þn�i�jZ 1
z¼0
zn�1þi�jdz
¼Xn
i¼1
Xn�i
j¼0
i
nþ i� j
n!
i!j! n� i� jð Þ!
p�ð Þi q�ð Þj 1� p� � q�ð Þn�i�j: ð25Þ
Clearly Eq. (24) is equal to Eq. (25) if and only if
U1ð0;nÞ � 0:
That is, if we accept that the PGF does yield the expected value ofU1ðx11;x22Þ, then perforce U1ð0;nÞ must be set to zero. Eq. (23) meansthat when ðx11;x22Þ ¼ ð0;nÞ, then f ðsÞ � 0. Similarly, whenðx11;x22Þ ¼ ð _nn;0Þ, then f ðsÞ � 0.
102 P. Gorroochurn and S. E. Hodge

ACKNOWLEDGEMENTS
We acknowledge helpful comments from two reviewers that led to amuch-improved manuscript. This work was supported in part bygrants DK31813, AA13654, MH48858, DK31775, NS27941.
REFERENCES
Bailey, N.T.J. (1951). Testing the solubility of maximum likelihood equations in the rou-tine application of scoring methods. Biometrics 7(3): 268–274.
Casella, G. and Berger, R.L. (2001). Statistical Inference (2nd Edition). Brooks: Cole.Cotterman, C.W. (1940). A Calculus for Statistico-Genetics. PhD Dissertation Ohio
University, Columbus, Ohio.Curie-Cohen, M. (1982). Estimates of inbreeding in a natural population: a comparison
of sampling properties. Genetics 100(2): 339–358.Excoffier, L. (2001). Analysis of population subdivision. In D.J. Balding, M. Bishop, and
C. Cannings (Eds.), Handbook of Statistical Genetics. Chichester: Wiley.Haldane, J.B.S. and Moshinsky, P. (1939). Inbreeding in Mendelian populations with
special reference to human cousin marriage. Annals of Eugenics 9: 321–340.Li, C.C. and Horvitz, D.G. (1953). Some methods of estimating the inbreeding coefficient.
American Journal of Human Genetics 5(2): 107–117.Malecot, G. (1948). Les Mathematiques de l’Heredite. Paris: Masson et Cie.Monahan, J.F. (2001). Numerical Methods of Statistics. Cambridge: Cambridge Univer-
sity Press.Myers, R.M. (1990). Classical and Modern Regression with Applications (2nd Edition).
Kent: PWS.Nagylaki, T. (1998). Fixation indices in subdivided populations. Genetics 148(3): 1325–
1332.Robertson, A. and Hill, W.G. (1984). Deviations from Hardy-Weinberg proportions: sam-
pling variances and use in estimation of inbreeding coefficients. Genetics 107(4):703–718.
Rousset, F. and Raymond, M. (1995). Testing heterozygosity excess and deficiency.Genetics 140: 1413–1419.
Silvey, S.D. (1971). Statistical Inference. Duxbury Press.Stigler, S.M. (1986). The History of Statistics: The Measurement of Uncertainty Before
1900. Cambridge: Harvard University Press.Weir, B.S. (1996). Genetic Data Analysis 2. Sinauer Associates, Sunderland, MA.Weir, B.S. (2001). Forensics. In D.J. Balding, M. Bishop, and C. Cannings (Eds.), Hand-
book of Statistical Genetics. Chichester: Wiley.Wright, S. (1922). Coefficients of inbreeding and relationship. The American Naturalist
56: 330–338.Wright, S. (1951). The genetical structure of populations. Annals of Eugenics 15: 323–354.Wright, S. (1965). The interpretation of population structure by F-statistics with special
regard to systems of mating. Evolution 19(3): 395–420.Yasuda, N. (1968). Estimation of the inbreeding coefficient from phenotype frequencies
by a method of maximum likelihood scoring. Biometrics 24(4): 915–935.
Estimating Allele Frequencies and Inbreeding Coefficients 103