estimates of krebs cycle activity and contributions of
TRANSCRIPT

Diabetologia (1995) 38:831-838 Diabetologia �9 Springer-Verlag 1995
Estimates of Krebs cycle activity and contributions of gluconeogenesis to hepatic glucose production in fasting healthy subjects and IDDM patients B.R. Landau 1, V. Chandramouli 1, W.C. Schumann 1, K. Ekberg 2, K. Kumaran 1, S.C. Kalhan 3, J. Wahren 2
1 Department of Medicine, Case Western Reserve University, Cleveland, Ohio, USA 2 Department of Clinical Physiology, Karolinska Hospital, Stockholm, Sweden 3 Department of Pediatrics, Case Western Reserve University, Cleveland, Ohio, USA
Summary Normal subjects, fasted 60 h, and patients with insulin-dependent diabetes mellitus (IDDM), withdrawn from insulin and fasted overnight, were given phenylacetate orally and intravenously infused with [3-14C]lactate and 13C-bicarbonate. Rates of he- patic gluconeogenesis relative to Krebs cycle rates were estimated from the 14C distribution in gluta- mate from urinary phenylacetylglutamine. Assuming the 13C enrichment of breath CO 2 was that of the CO 2 fixed by pyruvate, the enrichment to be expect- ed in blood glucose, if all hepatic glucose production had been by gluconeogenesis, was then estimated. That estimate was compared with the actual enrich- ment in blood glucose, yielding the fraction of glu- cose production due to gluconeogenesis. Relative rates were similar in the 60-h fasted healthy subjects and the diabetic patients. Conversion of oxaloace- tate to phosphoenolpyruvate was two to eight times
Krebs cycle flux and decarboxylation of pyruvate to acetyl-CoA, oxidized in the cycle, was less than one- 30th the fixation by pyruvate of CO2. Thus, in esti- mating the contribution of a gluconeogenic substrate to glucose production by measuring the incorpora- tion of label from the labelled substrate into glucose, dilution of label at the level of oxaloacetate is rela- tively small. Pyruvate cycling was as much as one- half the rate of conversion of pyruvate to oxaloace- tate. Glucose and glutamate carbons were derived from oxaloacetate formed by similar pathways if not from a common pool. In the 60-h fasted subjects, over 80 % of glucose production was via gluconeo- genesis. In the diabetic subjects the percentages aver- aged about 45 %. [Diabetologia (1995) 38: 831-838]
Key words Gluconeogenesis, Krebs cycle, fasting, in- sulin-dependent diabetes mellitus, liver.
It is a continuing challenge to develop a method for reliably estimating the contribution of gluconeoge- nesis to glucose production in humans, so that it can be applied under both physiological and pathologi- cal conditions [1, 2]. Measurements of incorporation of label into glucose on administration of a labelled gluconeogenic substrate are limited by the need to
Received: 12 October 1994 and in revised form: 13 January 1995
Corresponding author: Dr. B.R. Landau, Division of Molecu- lar and Clinical Endocrinology, Case Western Reserve Univer- sity School of Medicine, 10900 Euclid Avenue, Cleveland, Ohio 44106-4951, USA Abbreviations: IDDM, Insulin-dependent diabetes mellitus; PEE phosphoenolpyruvate.
know the amount of label in the substrate entering the gluconeogenic process and the extent of dilution of label during that process, notably at the level of ox- aloacetate, an intermediate common to the Krebs cy- cle and gluconeogenesis.
Phosphoenolpyruvate (PEP) is the necessary in- termediate formed from oxaloacetate via pyruvate in the production of glucose (Fig. 1). We therefore gave l~C-labelled bicarbonate to fasted normal sub- jects, assuming the specific activity of expired 14CO2 to be the specific activity of 14C fixed in the conver- sion of oxaloacetate to pyruvate [3]. We did that be- cause of evidence that expired 14CO2 is a good mea- sure of mitochondrial t4CO2. We estimated the ex- tent of dilution at the level of oxaloacetate from the distribution of 14C from [3-14C]lactate in hepatic et- ketoglutarate, estimated from the distribution of 14C

832 B. R. Landau et al.: Krebs cycle and gluconeogenesis in fasting and IDDM
Glucose Lactate l Vl /
v. i , V7 Fatty PEP Pyruvate ~ , V=~ acids
\ .V. cco ' v, CO,/ w= f _ A~tyF- COA
, ~ [ , c , , , = ~
Fumarate V ~ = . ~ V~
CO n - Katoglutarnte COs
Fig. 1 Scheme of pathways of gluconeogenesis and Krebs cycle metabolism in the liver. Rates are designated V 1, V 2, etc. in keeping with previous usage [4]
in glutamine conjugated to phenylacetate. Our meth- od, while time consuming, provides details on the me- tabolic rates occurring in liver while offering a direct measure of the contribution of gluconeogenesis. We have now used that approach to examine the rate of gluconeogenesis relative to Krebs cycle flux and the contribution of gluconeogenesis to glucose produc- tion in insulin-dependent diabetic (IDDM) patients, withdrawn from insulin so as to develop mild ketosis. These findings have been compared with those ob- served in fasted normal subjects also in mild ketosis.
Subjects, materials and methods
Subjects. A healthy man and woman, ages 35 and 28 years, with body mass indices 26.0 and 22.0 kg/m 2, respectively, and fasted for 60 h, were studied. Five males with IDDM, ages 19 to 23 years, with a mean body mass index of 22.9 kg/m 2 (range 18.0 to 26.8) were also studied. The haemoglobin Ale concen- tration in four of the diabetic subjects ranged from 6.9 to 8.0 % and in one subject, MP, it was 13.9 %. Insulin was with- drawn 24 h before the study and food was withheld for 12 h. The diabetic subjects were encouraged to drink water through- out the period of insulin withdrawal. Approval for the study was obtained from the Human Investigation Committees at the Karolinska Hospital, Stockholm and University Hospitals of Cleveland. Informed consent was obtained from each subject.
stant rate for the next 6 h. Labelled bicarbonate (5 g) was in- fused at a constant rate over the 6-h period. In the other two diabetic subjects infusion was for 8 h. Eighty ~Ci of the [3- 14C]lactate was given, 14 ixCi as a bolus and the rest at a con- stant rate over the 8 h. Phenylacetate (4.8 g), was ingested in divided portions between the second and third hour. Five grams of the labelled bicarbonate was infused, but the rate of infusion for the first hour was 55 % and the second hour 90 % of the rate over the next 6 h.
Blood (5 to 10 ml) was drawn at hourly intervals for deter- minations of plasma glucose and D-fl-hydroxybutyrate concen- trations. Blood for the isolation of glucose (70 to 110 ml), was drawn 90 min before and at the end of the infusion. Urine, for the isolation of urea and glutamate from excreted phenylace- tyl-glutamine, was collected at 90-min intervals over the last 3 h of infusion. Respiratory CO 2 was collected at hourly inter- vals by having the subjects breathe into balloons. Subjects were encouraged to drink 180--240 ml of water hourly during the infusion.
Measurements. Blood glucose, urinary urea, and glutamate from the excreted phenylacetylglutamine were isolated and degraded as previously described [4]. The urea carbon was col- lected as BaCO3 by using urease. Portions of the glucose and glutamate were diluted with known quantities of unlabelled glucose and glutamate. Portions of these were then combusted to CO 2 and the remainder degraded to yield each of the car- bons of the glucose and glutamate as CO 2 that was also collect- ed as BaCO 3. Carbon 1 of the undiluted glutamate was isolated as BaCO 3 by treatment of a portion of the glutamate with chloramine T. Carbons 3 and 4 of the undiluted glucose were isolated as BaCO 3 by incubating the glucose with Lactobacil- lus delbrueckii to form lactate and decarboxylating the lac- tate. Respiratory CO2 was collected as barium carbonate by bubbling the expired breath through carbonate-free sodium hydroxide and then adding barium chloride.
~4C-specific activities of the barium carbonates from urea, from the combustion of the diluted glucose and the diluted and undiluted glutamate, from the individual carbons of the di- luted glucose and glutamate, and from breath CO 2 were deter- mined by liquid scintillation spectrometry. The excess enrich- ment of 1~C in the BaCOa from urea, carbon 1 of the undiluted glutamate, the carboxyl group of lactate formed from the undi- luted glucose and breath CO 2 was determined by mass spectro- metry [5]. Barium carbonates from glucose, urea glutamate and respiratory CO 2 collected at zero time were assayed for the measure of ~aC natural abundance.
Materials. [3-x4C]Lactate was prepared as previously described [4] from D-[6J4C]glucose (purchased from Dupont-New Eng- land Nuclear, Boston, Mass., USA). 13C-labelled sodium bicar- bonate, 99 % enriched, was purchased from Merck Isotopes Inc., St. Louis, Mo., USA. The [3-14C]lactate infused was dis- solved in 50 or 100 ml of a sterile 0.154 mold sodium chloride solution. The 5 g of bicarbonate infused was dissolved in 500 ml of a sterile 0.077 mold sodium chloride solution. The lac- tate and bicarbonate solutions were shown to be pyrogen-free.
Experimental protocol. The protocol was similar to that pre- viously used [3, 4] except that the subjects were given 13C-la- belled bicarbonate together with [3Ja]lactate. The two normal subjects and three of the diabetic subjects ingested 4.8 g of phe- nylacetate, divided into three 1.6-g portions, at 30-min inter- vals. At the time the second portion was ingested (designated zero time) an infusion was begun of the labelled lactate and bi- carbonate. The [3J4C]lactate (40 ~tCi) was infused in trace quantity, 8 l~Ci as a bolus and then the rest infused at a con-
Calculations. Correction was made for the portion of the 14C incorporated into glutamate that was due to the fixation of 14CO2 formed from the [3JaC]lactate. The method for estimat- ing the portion is based upon evidence that the bicarbonate utilized in urea formation and formation of oxaloacetate from pyruvate derive from the same pool of CO2 in hepatic mito- chondria [3]. Carbon in CO 2 fixed by pyruvate becomes car- bon 1 of ct-ketoglutarate and hence carbon 1 of glutamate. 14CO2 from [3J4C]lactate should then be incorporated into car- bon 1 of glutamate relative to its incorporation into urea in the same ratio as for 13C-bicarbonate. Therefore, for a given col- lection period: Specific Activity in Carbon 1 of Glutamate due to 14CO2 Fixation/Specific Activity in Urea = 13C Excess in Glutamate/laC Excess in Urea. The enrichment in carbon 1 of glutamate and urea having been measured as well as the 14C specific activity of urea, the specific activity in carbon 1 of glutamate due to 14COz fixation was calculated. Because breath CO2 would be expected to reflect hepatic mitochon- drial CO 2, its specific activity and enrichment were also used

B. R. Landau et al.: Krebs cycle and gluconeogenesis in fasting and IDDM
Table 1. Specific activity and distribution of 14C in glutamate corrected for 14C incorporation from 14CO2 into carbon 1
833
Subject qSme Specific activity Recovery Correction to % 14C in carbon (h) (dpm/~tmol) (%) carbon 1 (%) 1 2 3 4 5
Carbon 2
Carbon 1
Normal subjects HJ 3~1/2 17.3 103.1 30.5 (24.3) 5.5 45.2 41.9 5.9 1.5 8.2
4~/2-6 12.9 108.1 32.6 (32.1) 6.3 43.7 40.9 7.8 1.5 6.9
JE 3-41/2 21.7 92.7 26.8 (23.1) 8.8 44.2 42.1 3.9 1.1 5.0 41/245 24.1 97.1 28.6 (30.5) 7.0 44.8 41.7 5.2 1.3 6.4
IDDM subjects KR 41/2-6 15.1 91.6 33.7 (26.8) 6.6 49.7 36.1 6.4 1.2 7.5
MP 3-41/2 8.6 80.4 40.0 (27.2) 6.2 49.7 37.8 4.9 1.4 8.0 4~/2-6 9.0 90.1 37.5 (30.1) 5.8 53.8 34.0 4.9 1.7 9.3
RL 3-4~/2 16.3 95.0 15.7 (9.1) 7.3 50.5 34.9 7.0 0.4 8.2 41/2-6 22.5 96.5 20.3 (16.7) 7.2 49.7 35.6 6.8 0.6 6.9
JG a 61/2-8 22.6 96.4 57.5 (53.2) 3.7 48.0 41.6 4.9 1.8 13.0
TS 5-61/2 21.8 101.4 33.8 (29.3) 9.5 51.2 32.5 5.9 0.9 5.4 61/2-8 11.4 90.0 31.8 (27.9) 8.6 52.6 32.8 4.9 1.1 6.1
a JG was unable to provide a urine for collection from 5-61/2 h. The specific activity of glutamate from phenylacetylglutamine ex- creted from 6-61/2 h was 25.1 dpm/~mol
to calculate the correction due to 14CO 2 fixation. Thus, Specific Activity in Carbon 1 of Glutamate due to 14CO2 Fixation/Spe- cific Activity in Breath CO2 = 13C Excess in Glutamate/13C Ex- cess in Breath CO 2.
For the estimation of the incorporation of 14C from 14CO2 into carbon 3 and 4 of glucose, the measurements of the speci- fic activity and excess enrichment of urea were again em- ployed along with the measurement of the excess enrichment
13 of C in glucose. Since carbon from CO2 that is fixed is only in- corporated into carbons 3 and 4 of glucose [4]: Specific Activ- ity of Carbons 3 and 4 of Glucose due to 14CO2 fixation/Speci- fic Activity of Urea = 13C Excess in Glucose/13C Excess in Urea. Corrections were similarly made using the specific activ- ities and enrichments in breath CO 2 rather than those for urea.
From the distribution of 14C from [3-14C]lactate in the car- bons of glutamate from urinary phenylacetylglutamine, as- sumed to be an adequate reflection of the distribution in he- patic a-ketoglutarate, relative rates were estimated for the re- actions in gluconeogenesis and the Krebs cycle (Fig.l), i.e. pyruvate to acetyl-CoA, fatty acids to acetyl-CoA, fumarate to oxaloacetate, oxaloacetate to fumarate, oxaloacetate to PEP, PEP to pyruvate, lactate to pyruvate and PEP to glu- cose. The equations expressing those relationships, as well as an examination of the assumptions made in their derivation, have been presented [4].
The 13C enrichment of carbon 1 of PEP, designated E 1, rela- tive to that of the CO2 fixed by pyruvate, depends upon the equilibration of oxaloacetate with fumarate, the rate of gluco- neogenesis relative to Krebs cycle flux and the extent of pyru- vate cycling, i.e. pyruvate --* oxaloacetate ~ PEP ~ pyru- vate, and/or Cori cycling, i.e. pyruvate -o glucose --) pyruvate [3]. The equation, previously derived [3], used to estimate E 1, assuming no pyruvate or Cori cycling, is
E l = 0.5 VsVrD
(V 4 -~- V6) 2 - (V4V 5 -~ V5V6)
and in the presence of significant pyruvate and/or Cori cycling
V6 [0.5 DV5 + P1 (Va + V6 - 0.5 Vs)] E 1 = (V 4 -~- V6) 2 - (V4V 5 -~- WsW6)
where W 4 is the rate of conversion of fumarate to oxaloacetate, V 5 that of the conversion of oxaloacetate to fumarate and V 6 that of the conversion of oxaloacetate to PEP (Fig. 1), all rela- tive to the rate of Krebs cycle flux. P1 is the enrichment of car- bon 1 of pyruvate, equal to V7EI/(V 7 4- Ws) where V 7 is the re- lative rate of the conversion of PEP to pyruvate and V a that of the conversion of lactate to pyruvate. D is the enrichment of the CO2 fixed by the pyruvate, assumed to be that in breath CO2. The enrichment in carbon 1 of PEP is then half the en- richment to be expected in glucose, i. e. in its carbons 3 and 4, if all glucose production were from gluconeogenesis via PEP. Then 100(13C Excess Enrichment in Glucose)/2E1 equals the% of glucose production by gluconeogenesis [3]. That equals 100(Enrichment in Carbon 1 of Lactate obtained by in- cubating the glucose with Lactobacillus delbrueckii)/E 1.
Results
Distribution of 14C in glutamate. Carb o n 1 of the glu- t ama te f rom the 61/2--8 h col lect ion of subject had a x3C excess en r i chmen t abou t one-ha l f tha t f rom the 5-61/2 h col lect ion (Table 1). Howeve r , the specific activities and enr ichments of his b rea th CO2, reflect- ing the enr ichments in the CO 2 f ixed in the incorpora- t ion of 13C into ca rbon 1 of the g lu tamate were almost the same in the two periods. There fo re , there was di- lut ion of phenylace ty lg lu tamine or g lu tamate be- tween the t ime of the 61/2--8 h ur ine was col lec ted and the total combust ion , bu t we have b een unable to de t e rmine how that occurred.
The distr ibutions of 14C in the g lu tamate carbons have b een co r rec ted for the incorpora t ion of 14C into ca rbon 1 of g lu tamate due to f ixat ion of 14C f rom 14CO2 fo rmed f rom the [3-14C]lactate. The percen t - age correc t ions not in pa ren theses are those est imat- ed using the specific activity of urea. It was those per- centages tha t were used in calculating the distribu-

834 B.R. Landau et al.: Krebs cycle and gluconeogenesis in fasting and IDDM
Table 2. Glucose and hydroxybutyrate concentrations, glucose specific activity, and distribution of 14C in glucose corrected for 14C incorporation from 14CO2 into carbons 3 and 4
Sub- Time Glucose Hydroxybu- Specific Reco- Correction %14C in carbons Carbons ject (h) concen- tyrate con- activity very to carbons 1 + 6
tration centration (dpm/~tmol) (%) 3 and 4 (%) 1 2 3 4 5 6 Carbons (mmol/1) (mmol/1) 3 + 4
Normal subjects HJ 6 4.0(3.3) 2.8 152.3 96.0 29.0(27.6) 25.6 21.3 2.6 2.6 21.7 26.1 9.9 JE 6 3.8(3.3) 3.1 155.9 a 93.8 33.3(34.8) 24.8 22.7 2.5 2.4 21.0 26.4 10.4
IDDM subjects KR 41/2 13.1(13.9) 45.5 100.3 12.7(19.1) 22.2 18.3 2.8 3.1 23.1 30.6 8.9
6 63.6 99.2 12.1(19.1) 22.8 18.9 2.8 2.1 23.9 28.5 8.7
MP 41/2 18.4(20.1) 1.1 27.3 100.2 11.9(16.6) 19.4 17.4 3.7 4.4 25.2 30.0 6.1 6 32.4 98.3 12.4(20.4) 20.3 16.6 3.2 4.3 25.1 30.5 6.8
RL 41/2 14.8(20.4) 3.1 69.5 98.6 31.4(18.2) 22.7 18.6 2.1 2.5 23.6 30.6 11.6 6 93.4 99.4 21.2(17.5) 23.6 18.4 2.8 3.0 23.3 29.0 9.1
JG 61/2 19.6(15.7) 2.3 107.9 94.6 31.4(26.6) 24.0 20.5 2.8 3.1 23.4 26.0 8.5 8 123.5 98.0 33.2(29.6) 24.0 20.4 2.7 3.0 22.1 27.8 9.1
TS 61/2 17.7(20.2) 1.5 64.8 97.2 35.3(30.6) 22.2 17.9 2.1 2.7 24.7 30.3 10.9 8 85.5 97.7 34.0(29.8) 23.3 18.8 2.4 2.7 23.5 29.1 9.9
a 144.3 dpm/~tmol at 41/2 h
tions. Thus, for the glutamate from subject HJ collec- ted at 3-41/2 h, 30.5 % of the 14C formed in its carbon 1 was due to 14CO2 fixation. Therefore, the% of 14C in carbon 1 before correction was 7.9 % and after cor- rection the 5.5 % recorded. The% corrections in par- entheses are those calculated using the specific activ- ities and enrichments in breath CO2 rather than urea. The corrections calculated using the average specific activities and enrichments in breath CO 2 dur- ing the period of the collection are about 15 % lower on average than those using urea.
The 14C in each of the five carbons of glutamate are recorded as a% of the sum of the 14C in the five carbons. The distributions in different collection peri- ods for a given subject are similar. Over 80 % of the 14C in glutamate was in carbons 2 and 3. The ratios of 14C in carbon 3 to carbon 2 of glutamate from the diabetic patients, except JG, range from 0.63 to 0.76. The ratios for JG and the subjects fasted for 60 h range from 0.86 to 0.95.
Distribution of 14C in glucose. After 60 h of fasting, normal subjects, as in our previous experience [3, 4], had plasma glucose concentrations of about 4.0 mmol/1 and 6 h later about 3.3 mmol/1 (Table 2). The plasma concentration of fl-hydroxybutyrate at the completion of infusion provides evidence for mild ketosis in all the subjects, except in subject KR for whom the concentration was not determined.
Specific activities of glucose were highest in the normal subjects fasted for 60 h and next in subject JG. The specific activity of glucose 11/2 h before com- pleting the infusion was 72 to 84 % of that at its com- pletion. For the correction for the incorporation of 14C into carbon 3 and 4 of glucose, the measurements
of the specific activity and excess enrichment of urea were again employed along with the measurement of the excess enrichment of 13C in glucose. The values in parentheses are the corresponding% corrections using the specific activities and enrichments in breath CO2. Percent corrections estimated using breath CO 2 are generally somewhat lower than those using urea except for subjects KR and MP where the corrections using urea are about one-third less than those using breath CO2.
Over 90 % of the 14C in glucose was in its carbons 1,2,5 and 6, with about 80 % as much 14C in carbon 2 as 1 and in carbon 5 as 6. The difference in the% of 14C in carbon 6 to carbon 1 among the subjects is low- est for the two normal fasted subjects and next lowest for subject JG. Similarly, the differences are smallest between carbons 5 and 2 for the normal subjects and then subject JG. While the percentages of 14C in car- bons 3 and 4 are small, only in the normal subjects is the activity in carbon 3 equal to that in carbon 4. Thus, in the diabetic subjects, 14C in carbon 4 exceeds that in carbon 3, except for subject KR at 6 h and that is undoubtedly in error, since 14C in carbon 6 exceeds that in carbon 1 and in carbon 5 that in carbon 2.
Relative rates and gluconeogenesis. Rates estimated from the distributions in Table 1 are presented in Ta- ble 3. These rates are relative to the rate of Krebs cy- cle flux set to 1.0, i.e. the rate acetyl-CoA condensed with oxaloacetate to form citrate. More than nine times as much of the acetyl-CoA condensing with ox- aloacetate was from fatty acids as from pyruvate in both the fasted normal and the diabetic subject~ The rate of the conversion of oxaloacetate to fumarate in the 60-h fasted subjects was more than 50 times the

B. R. Landau et al.: Krebs cycle and gluconeogenesis in fasting and IDDM
Table 3. Rates of reactions in gluconeogenesis and the Krebs cycle relative to Krebs cycle flux
835
Subject Time Pyruvate--4 Fatty acids --, Fumarate Oxaloacetate Oxaloacetate PEP ~ Lactate ~ PEP (h) acetyl-CoA acetyl-CoA --4 oxaloacetate ~ fumarate ~ PEP pyruvate pyruvate glucose
Normal subjects HJ 3-41/2 0.08 0.92 68.4 67.4 4.18 1.99 2.37 2.19
41/2-6 0.10 0.90 70.2 69.2 3.16 1.23 2.20 1.93
JE 3-41/2 0.05 0.95 57.9 56.9 2.14 1.20 0.99 0.94 41/2-6 0.07 0.93 54.4 53.4 2.97 1.45 1.58 1.52
IDDM subjects KR 41/2-6 0.08 0.92 13.6 12.6 3.46 1.52 2.02 1.94
MP 3-41/2 0.06 0.94 14.8 13.8 4.11 2.42 1.76 1.70 41/2-6 0.07 0.93 7.1 6.1 5.16 3.85 1.37 1.31
RL 3-4a/2 0.07 0.93 12.8 11.8 2.65 0.43 2.29 2.22 41/2-6 0.07 0.93 13.7 12.7 2.75 0.65 2.17 2.10
JG 61/2-8 0.07 0.93 46.8 45.8 7.98 4.94 3.11 3.04
TS 5-61/2 0.06 0.94 6.5 5.5 2.06 0.91 1.21 1.15 61/2-8 0.06 0.94 6.1 5.1 2.67 1.57 1.15 1.09
Table 4. Comparison of breath CO 2 14C specific activities and 13C enrichments at 3 h relative to 6 h into the infusions of [3- a4C] lactate and 13C-labelled bicarbonate
Subject Ratio at 3 h to 6 h
14C Specific activity 13C Excess enrichment
HJ 0.81 0.88 JE 0.71 0.91 KR 0.75 0.80 MP 0.78 0.83 RL 0.79 0.85 JG 0.84 0.92 TS 0.81 0.85
Table 5. Ratio of the incorporation of 14C into carbons 2 and 5 to carbons 1 and 6 of glucose divided by the ratio of the incor- poration into carbons 3 to 2 of glutamate
Subject Time (h) Glucose ratio Glucose/Glutamate Glutamate ratio
Normal subjects HG 6/41/2-6 0.83/0.94 = 0.88
JE 6/41/2-6 0.85/0.93 = 0.91
MH a 41/2/3-41/2 0.82/0.71 = 1.15 6/41/2-6 0.83/0.81 --- 1.02
AK a 41/2/3-41/2 0.83/0.81 = 1.02 6/41/2-6 0.84/0.70 -- 1.20
IDDM subjects KR
MP
RL
JG
TS
6/41/2-6 0.83/0.73 = 1.14
41/2/3-41/2 0.86/0.76 = 1.13 6/41/2-6 0.82/0.63 = 1.30
41/2/3-41/2 0.79/0.69 = 1.14 6/4a/2-6 0.79/0.72 = 1.10
8/61/2-8 0.81/0.90 = 0.90
61/2/5-61/2 0.81/0.63 = 1.29 8/61/2-8 0.81/0.63 = 1.31
a From reference 4
rate of Krebs cycle flux. In the diabetic subjects, again with the exception of JG, it was 5 to 14 times more. The rate of conversion of oxaloacetate to PEP was two to five times more, except for JG where it was eight times more, and with no discernible difference between the groups. About half of the PEP was con- verted to glucose and the remainder to pyruvate and again with no discernible difference between the groups. Thus, the rate of carboxylation of pyruvate to oxaloacetate, equal to the rate of conversion of ox- aloacetate to PEP, was 30 times or more than the rate of its decarboxylation to acetyl-CoA. About 50 % of the PEP formed was cycled.
The specific activity and enrichment in breath CO; approached a plateau by the third hour (Table 4). At 5 h, the specific activity of the breath CO 2 was 88 % or more and of 13C 93 % or more of that at 6 h. Thus, while it was only a small difference, the specific activ- ity of breath CO 2 approached a plateau more slowly than its enrichment.
The ratio of incorporation of 14C into carbons 2 and 5 to carbons 1 and 6 of glucose (Table 2) divided by the ratios of the incorporations of 14C into car- bons 3 to 2 of glutamate (Table 1) are about 1.0 (Ta- ble 5). The ratios for the diabetic subjects average 1.16.
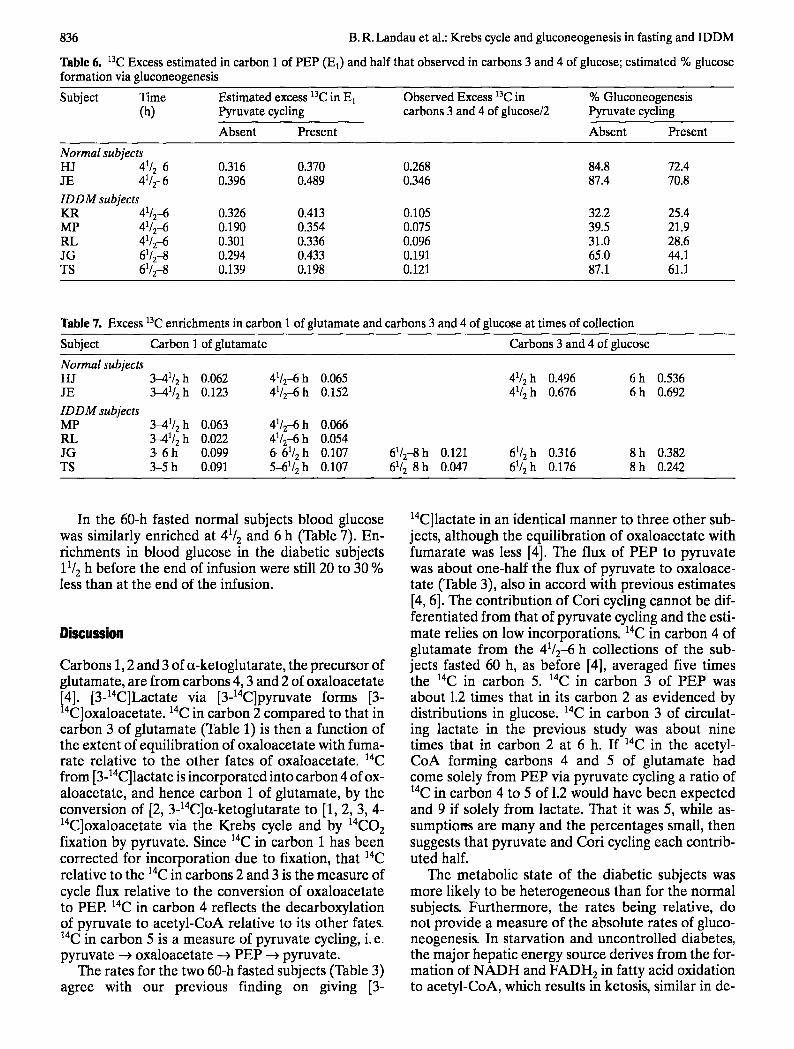
Estimates of Ea during the last 11/2 h of infusion, using for D the average a3C enrichment in breath CO2 for that period, are recorded in columns 3 and 4 of Table 6. The mean of the enrichments in carbon 3 and 4 of circulating glucose, determined by conver- sion of the glucose to lactate and decarboxylation of the lactate, is recorded in the fifth column. The esti- mated percentage of glucose production due to glu- coneogenesis is then 100 times E 1 divided by the mean of the enrichments in carbons 3 and 4 of the glucose. Those estimates are recorded in the last two columns of Table 6.
836 B.R. Landau et al.: Krebs cycle and gluconeogenesis in fasting and IDDM
Table 6. 13C Excess estimated in carbon 1 of PEP (El) and half that observed in carbons 3 and 4 of glucose; estimated % glucose formation via gluconeogenesis
Subject Time Estimated excess 13C in E 1 Observed Excess 13C in % Gluconeogenesis (h) Pyruvate cycling carbons 3 and 4 of glucose/2 Pyruvate cycling
Absent Present Absent Present
Normal subjects HJ 41/2-6 0.316 0.370 0.268 84.8 72.4 JE 41/2-6 0.396 0.489 0.346 87.4 70.8 IDDM subjects KR 41/2-6 0.326 0.413 0.105 32.2 25.4 MP 41/245 0.190 0.354 0.075 39.5 21.9 RL 41/2-6 0.301 0.336 0.096 31.0 28.6 JG 61/2-8 0.294 0.433 0.191 65.0 44.1 TS 61/2-8 0.139 0.198 0.121 87.1 61.1
Table 7. Excess 13C enrichments in carbon 1 of glutamate and carbons 3 and 4 of glucose at times of collection
Subject Carbon 1 of glutamate Carbons 3 and 4 of glucose
Normal subjects HJ 3-41/2 h 0.062 41/2-6 h 0.065 JE 3--41/2 h 0.123 41/2-6 h 0.152
ID D M subjects MP 3-41/2 h 0.063 41/2-6 h 0.066 RL 3-41/2 h 0.022 41/2-6 h 0.054 JG 3-6 h 0.099 6-61/2 h 0.107 TS 3-5 h 0.091 5-61/2 h 0.107
41/2h 0.496 6h 0.536 41/2 h 0.676 6 h 0.692
61/2-8h 0.121 61/2h 0.316 8h 0.382 61/2-8 h 0.047 61/2 h 0.176 8 h 0.242
In the 60-h fasted normal subjects blood glucose was similarly enriched at 41/2 and 6 h (Table 7). En- r ichments in blood glucose in the diabetic subjects 11/2 h before the end of infusion were still 20 to 30 % less than at the end of the infusion.
Discussion
Carbons 1, 2 and 3 of et-ketoglutarate, the precursor of glutamate, are f rom carbons 4, 3 and 2 of oxaloacetate
14 14 [4]. [3- C]Lactate via [3- C]pyruvate forms [3- 14 14 C]oxaloacetate. C in carbon 2 compared to that in carbon 3 of glutamate (Table 1) is then a function of the extent of equilibration of oxaloacetate with fuma- rate relative to the other fates of oxaloacetate, aac f rom [3-14C]lactate is incorporated into carbon 4 of ox- aloacetate, and hence carbon 1 of glutamate, by the conversion of [2, 3-14C]a-ketoglutarate to [1, 2, 3, 4- 14C]oxaloacetate via the Krebs cycle and by 14CO2 fixation by pyruvate. Since 14C in carbon 1 has been corrected for incorporat ion due to fixation, that 14C relative to the 14C in carbons 2 and 3 is the measure of cycle flux relative to the conversion of oxaloacetate to PEP. 14C in carbon 4 reflects the decarboxylation of pyruvate to acetyl-CoA relative to its other fates. 14C in carbon 5 is a measure of pyruvate cycling, i.e. pyruvate ~ oxaloacetate ---) PEP ---) pyruvate.
The rates for the two 60-h fasted subjects (Table 3) agree with our previous finding on giving [3-
14C]lactate in an identical manner to three other sub- jects, al though the equilibration of oxaloacetate with fumarate was less [4]. The flux of PEP to pyruvate was about one-half the flux of pyruvate to oxaloace- tate (Table 3), also in accord with previous estimates [4, 6]. The contribution of Cori cycling cannot be dif- ferentiated from that of pyruvate cycling and the esti- mate relies on low incorporations. 14C in carbon 4 of glutamate f rom the 41/2-6 h collections of the sub- jects fasted 60 h, as before [4], averaged five times the 14C in carbon 5. aac in carbon 3 of PEP was about 1.2 times that in its carbon 2 as evidenced by distributions in glucose. 14C in carbon 3 of circulat- ing lactate in the previous study was about nine times that in carbon 2 at 6 h. If a4C in the acetyl- CoA forming carbons 4 and 5 of glutamate had come solely from PEP via pyruvate cycling a ratio of 14C in carbon 4 to 5 of 1.2 would have been expected and 9 if solely f rom lactate. That it was 5, while as- sumptiorrs are many and the percentages small, then suggests that pyruvate and Cori cycling each contrib- uted half.
The metabolic state of the diabetic subjects was more likely to be heterogeneous than for the normal subjects. Fur thermore, the rates being relative, do not provide a measure of the absolute rates of gluco- neogenesis. In starvation and uncontrol led diabetes, the major hepatic energy source derives f rom the for- mat ion of N A D H and F A D H 2 in fatty acid oxidation to acetyl-CoA, which results in ketosis, similar in de-

B. R. Landau et al.: Krebs cycle and gluconeogenesis in fasting and
gree in the two groups. Krebs cycle activity is inhib- ited by the reduced state of those nucleotides.
Corrections for 14CO2 incorporation from the [3- 14C]lactate averaged about 30 % (Table 1). The rela- tive specific activity and 13C enrichment in urea is as- sumed to reflect the relative specific activity and en- richments of hepatic mitochondrial CO2. Similar per- centage corrections using urea and breath CO2 sup- port that assumption (Table 1). The reason the cor- rections estimated using breath CO2 are about 15 % less than those using urea is unknown, but those cor- rections would result in only a small change in the es- timated rates.
Comparisons are for breath CO2 and urea specific activities and 13C enrichments arising from 14C label- led bicarbonate formed by the intracellular metabo- lism of [3J4C]lactate and 13C-labelled bicarbonate in- fused intravenously. For the comparisons changes in specific activities within tissues should then parallel those of enrichment. This was reasonably achieved (Table 4).
Support for use of the phenylacetylglutamine deri- vative is found in similar distributions of 14C in the carbons of glucose and glutamate derived from oxa- loacetate [4]. Since the glucose carbons arise from he- patic oxaloacetate, presumably the glutamate car- bons were also derived from the same oxaloacetate source. That could only occur by the conversion of hepatic a-ketoglutarate to glutamine that conjugates with phenylacetate. Further evidence is found in a correction of about 30 % for the contribution of 14CO2 fixation to the 14C in carbon 1 of glutamate and carbons 3 and 4 of glucose. Additional support comes from similar distributions of 14C from [2, 3- 14C]succinate, [2-14C]propionate and [3-14C]lactate in phenylacetylglutamine from normal subjects fasted 60 h coupled with evidence for extensive metabolism of [2, 3-14C]succinate and [3-14C]lactate in liver [7]. Still further support comes from estimates similar to ours from the distribution of 13C in glutamate on per- fusing liver from fasted rats with [3-13C]lactate [8] and on isotopomer analysis of liver glutamate from rats given [U-13C]lactate and [2, 3-13C]lactate [9].
Correction for CO 2 fixation in the normal subjects was again generally about 30 % for both glutamate and glucose (Tables 1 and 2). For subjects KR and MP, corrections were less for glucose than gluta- mate. However, those were the subjects in whom cor- rections using breath CO 2 specific activities and en- richments were higher than those using urea. While that raised concern about the urea measurements, no error was found.
Ratios of 14C in the carbons of glutamate and glu- cose derived from carbons 2 and 3 of oxaloacetate are similar for the normal subjects fasted 60 h (Ta- ble 5), but in the diabetic subjects, the average ratio of 1.16 suggests less isotopic equilibration of carbons 3 and 2 of the oxaloacetate used in the formation of
IDDM 837
the glutamate than glucose. There is evidence for two pools of oxaloacetate in the liver [7-10]. One would then be mitochondrial, with relatively incom- plete isotopic equilibration and the source of the glu- tamate carbons. The other would arise by transport of mitochondrial oxaloacetate into the cytosol and then further isotopic equilibration before conversion to glucose. Alternatively, some labelled a-ketoglutarate converted in the diabetic subjects to glutamine was not from the liver, or the difference could reflect a heterogeneity in hepatocytes [11].
The possibility of cytosolic and mitochondrial pools of oxaloacetate is tempered by the suggestion of less isotopic equilibration in the carbons from oxa- loacetate in glucose than glutamate when individuals fasted overnight were infused with glucose and given [3-14C]lactate and phenylacetate [4]. Lower specific activities in glutamate from glutamine (Table 1) than in glucose (Table 2) are in accord with much of the glutamine used in the conjugation of phenylacetate being unlabelled and coming from muscle [12, 13].
14C in carbon 2 to 1 of glutamate overlap 14C in car- bons 1 and 6 to 14C in carbons 3 and 4 of glucose (Ta- bles 1 and 2), i.e. 5.0 to 9.3, excluding subject JG, compared to 5.0 to 11.6, but glucose ratios tend to be more, as was previously observed [4]. This again sug- gests some difference in the source of the carbons of oxaloacetate for glucose and glutamate formation. The difference in range increases, if the incorpora- tion of 14C in carbon 2 of citrate, the source of which is carbon 3 of oxaloacetate, relative to that in carbon 6 of citrate, the source of which is carbon 1 of oxalo- acetate, is taken into account. The range is then 4.9 to 8.0 rather than 5.0 to 9.3.
A major reservation in estimates of rates of gluco- neogenesis from the incorporation of label from a la- belled substrate into glucose is uncertainty as to the extent of dilution of label at the level of oxaloacetate [1, 3, 4]. That the rate of gluconeogenesis is 2 or more times the rate of Krebs cycle flux in the uncontrolled diabetic patient means that dilution of the labelled substrate is relatively small. We previously estimated that in the 60-h fasted human, in the conversion of [3-14Clpyruvate to glucose, the specific activity of PEP would be about five-sixths the specific activity of intracellular pyruvate [4]. Label is assumed for the estimates [4] only to be lost in significant quanti- ty from the cycle in the conversion of oxaloacetate to PEP (Fig.l). The same pattern in glutamate formed by livers of fasted rats perfused with [3- 13C]lactate in vitro and by livers of fasted rats infused with [3-~3C]lactate in vivo supports that assumption [131.
Inability to determine the specific activity or en- richment of intracellular pyruvate has in the past pre- vented quantitation. The use of breath C02 elimi- nates that problem, since its specific activity or en- richment appears to be a good measure of that in in-

838 B. R. Landau et al.: Krebs cycle and gluconeogenesis in fasting and IDDM
tracellular CO 2 [3]. However, when (1-13C)leucine was infused into 60-h fasted humans, enrichment of breath CO 2 was about 15 % less than CO2 in arterial and hepatic vein blood (14).
As in our previous study [3], in the normal subjects fasted 60 h, 80 % or more of the glucose produced (assuming no cycling) was by gluconeogenesis (Ta- ble 6). This is in accord with gluconeogenesis being the only source of circulating glucose after prolong- ed fasting, except for small amounts from glycogen [15] and glycerol [16]. In the diabetic subjects the contribution of gluconeogenesis varied, but except for subject TS was much less, averaging about 45 %. Uptake of gluconeogenic substrates across the splanchnic bed in IDDM subjects, withdrawn from in- sulin, has accounted for 32-40 % of splanchnic glu- cose output [17, 18].
Glycogen stores remaining during the period of in- sulin withdrawal may explain the lower contributions of gluconeogenesis to glucose production in the first three diabetic subjects. We expected the higher con- tribution in subject JG because the distribution of 14C and specific activity in his blood glucose were si- milar to that in the normal subjects fasted 60 h. The almost symmetrical labelling of glucose carbons, evi- dence of nearly complete isotopic equilibration be- tween dihydroxyacetone-3-P and glyceraldehyde-3- P, has been observed when glycogen is depleted [4].
Since enrichment (Table 7) and specific activities (Table 2) in glucose 11/2 h before the end of infusion was less than at the end of the infusion, steady state was not achieved. However, as the contribution of glycogen to glucose production decreases, the speci- fic activity of glucose would be expected to increase. A limitation in achieving steady-state in circulating glucose enrichment in the diabetic subjects was prob- ably their large glucose pool. Until steady-state is achieved, gluconeogenesis may be low because a sig- nificant portion of glucose in the blood is in the circu- lation prior to the administration of laC-bicarbonate. In the two 60-h fasted normal subjects, steady-state was approached as evidenced by the similar enrich- ments in glucose at 41/2 and 6 h. In the three 60-h fast- ed subjects in the previous study [4], glucose and glu- tamate specific activities are in accord with the re- suits for the two subjects in the present study. The achieving of steady-state for the estimate of relative rates is not a determinant as long as the distribution of 14C in glutamate is not changing. The enrichment of 13C in carbon 1 of glutamate would be expected to increase in time with increasing enrichment in breath CO2.
Acknowledgements. This study was supported by National In- stitutes of Health grants DK 14507 and P50 HDl1089, Fogar- ty International Center Senior Fellowship Award O 1986, and grant 89-0418 from the Bank of Sweden Tercentenary Founda- tion.
References
1. Landau BR (1993) Estimating gluconeogenic rates in NIDDM. Adv Exp Med Biol 334:209-220
2. Gay I_2, Schneiter Ph, Schutz Y, Di Vetta V, Jrquier E, Tap- py L (1994) A non-invasive assessment of hepatic glycogen kinetics and post-absorptive gluconeogenesis in man. Dia- betologia 37:517-523
3. Ensemo E, Chandramouli V, Schumann WC, Kumaran K, Wahren J, Landau, BR (1992) Use of 14CO 2 in estimating rates of gluconeogenesis. Am J Physiol 263:E36-E41
4. Magnusson I, Schumann WC, Bartsch GE et al. (1991) Noninvasive tracing of Krebs cycle metabolism in liver. J Biol Chem 266:697545984
5. Kosugi K, Scofield RF, Chandramouli V, Kumaran K, Schu- mann WC, Landau BR (1986) Pathways of acetone's meta- bolism in the rat. J Biol Chem 261:3952-3957
6. Petersen KF, Cline GW, Blair JB, Shulman GI (1994) Sub- strate cycling between pyruvate and oxaloacetate in awake normal and 3,3 '-5-triodo-L-thyronine-treated rats. Am J Physiol 267:E273-E277
7. Landau BR, Schumann WC, Chandramouli V, Magnusson I, Kumaran K, Wahren J (1993) 14C-labeled propionate metabolism in vivo and estimates of hepatic gluconeoge- nesis relative to Krebs cycle flux. Am J Physiol 265: E636- E647
8. Di Donato L, Des Rosiers C, Montgomery JA, David F, Garneau M, Brunengraber H (1993) Rates of gluconeoge- nesis and citric acid cycle in perfused livers, assessed from the mass spectrometric assay of the 13C labelling pattern of glutamate. J Biol Chem 268:4170-4180
9. Katz J, Wals P, Lee W-N P (1993) Isotopomer studies of glu- coneogenesis and the Krebs cycle with 13C-labeled lactate. J Biol Chem 268:25509-25521
10. Baranyai JM, Blum JJ (1989) Quantitative analysis of in- termediary metabolism in rat hepatocytes incubated in the presence and absence of ethanol with a substrate mixture including ketoleucine. Biochem J 258:121-140
11. Jungermann K, Katz N (1989) Functional specialization of different hepatocyte populations. Physiol Rev 69:708-764
12. Schumann WC, Magnusson I, Chandramouli V, Kumaran K, Wahren J, Landau BR (1991) Metabolism of [2- t4C]acetate and its use in assessing hepatic Krebs cycle ac- tivity and gluconeogenesis. J Biol Chem 266:6985-6990
13. Beylot M, Soloviev MV, David F, Landau BR, Brunengra- ber H (1995) Tracing hepatic gluconeogenesis relative to ci- tric acid cycle activity in vitro and in vivo. J Biol Chem 270: 1509-1514
14. Nair KS, Ebenstein DB, Wahren J (1993) 13CO2 enrichment in hepatic vein versus arterial, peripheral venous and breath samples during L-(1-13C)leucine infusion. Clin Res 41: 124A (Abstract)
15. Rothman DL, Magnusson I, Katz LD, Shulman RG, Shul- man GI (1991) Quantitation of hepatic glycogenolysis and gluconeogenesis in fasting humans with 13C NMR. Science 254:573-576
16. Wahren J, Efendic S, Luft R, Hagenfeldt L, Bjorkman O, Felig P (1977) Influence of somatostatin on splanchnic me- tabolism in postabsorptive and 60-h fasted humans. J Clin Invest 59:299-307
17. Wahren J, Felig P, Cerasi E, Luft R (1972) Splanchnic and peripheral glucose and amino acid metabolism in diabetes mellitus. J Clin Invest 51:1870-1878
18. Wahren J, Hagenfeldt L, Felig P (1975) Splanchnic and leg exchange of glucose, amino acids, and free fatty acids dur- ing exercise in diabetes mellitus. J Clin Invest 55: 1303- 1314