estimated cropland and pastureland use values using the
TRANSCRIPT

Estimated Cropland and Pastureland Use Values using the Capitalized Cash Rental Rate Method – Tax Year 2020
USDA National Agricultural Statistical Service (NASS) released the third series of cash rental rates for irrigated and non-irrigated cropland and pastureland for Virginia counties and cities. These rental-rate values provide additional information for jurisdictions regarding agricultural land use-value assessment. Capitalized cash rental rates and the capitalized net income approach are both State Land Evaluation Advisory Council (SLEAC) approved methods for jurisdictions to consider when setting annual Agricultural and Horticultural Values. Below please find: • Table 1 – Use-values1 by jurisdiction for non-irrigated and irrigated cropland and
pastureland (listed in alphabetic order). • Table 2 – listing of counties and cities in each NASS crop reporting district
Values in Table 1 are derived from the existing methods for determining capitalization rates as described in the “Tax Year 2014: Methods and Procedures” found on the Virginia's Use Value Assessment Program web site at http://usevalue.agecon.vt.edu/procedures.htm. Rental rates as described below are divided by the capitalization rate for each jurisdiction to arrive at a per acre value for crop and/or pasture land. NASS rental rates are annual values in $/acre per year summarized from NASS surveys for the crop year 2017 and the data can be found at this NASS site: http://quickstats.nass.usda.gov/. If there are sufficient number of responses to meet NASS nondisclosure requirements for a jurisdiction then that value is published. For example, in Table 1 the specific rental rate for cropland in Accomack is $80.00 per acre. When there are not enough responses in a jurisdiction to meet NASS nondisclosure requirements, then all the data for the non-disclosed jurisdictions within a crop reporting district is summarized and published as a Combined Counties value. For example, in Table 1 the rental rate for pastureland in Accomack is $37.50 per acre, the combined county value for Eastern District counties. A note of caution: Combined Counties rental rates cut across jurisdictional lines and may not reflect all local market conditions. Additional information, past year’s estimates, and publications on Virginia's Use Value Assessment Program can be found at http://usevalue.agecon.vt.edu/. Contacts: Virginia Department of Taxation Theresa Born ([email protected]) Property Tax Unit P.O. Box 565 Richmond, VA 23218-0565 Phone (804) 786-4091
VA Tech Department of Agricultural and Applied Economics Patrick Kayser ([email protected]) Phone (540) 231-4441 Jennifer Friedel ([email protected]) Phone (540) 231-4178 Mail Code 0401 Blacksburg, VA 24061
1Capitalized cash rental rate values are calculated for all jurisdictions regardless of their use value assessment status.
SLEAC Approved 9/11/2019
SLEAC estimates apply to Tax Year 2020 1

Table 1: 2017 cropland and pastureland values based on NASS1capitalized rental rates (see end of table for footnotes)
Jurisdictions
Counties
Capitalization Rate TY20202
------- Cropland -------- Irrigated cropland ----- Pastureland ------ Rental Rate
$/acre1 Value $/acre3
Rental Rate $/acre1
Value $/acre3
Rental Rate $/acre1
Value $/acre3
Accomack 0.0586 80 1,366 115 1,963 37.5ep 640 Albemarle 0.0607 25 412 -- -- 17.5 288 Alleghany 0.0596 27.5wc 461 -- -- 14wp 235 Amelia 0.0573 37.5 654 -- -- 24 419 Amherst 0.0587 24 409 -- -- 16.5 281 Appomattox 0.0591 27 457 -- -- 18.5 313 Augusta 0.0584 56 959 -- -- 23 394 Bath 0.0581 27 464 -- -- 11 189 Bedford 0.0582 21 361 -- -- 17.5 301 Bland 0.0592 37.5swc 633 -- -- 19 321 Botetourt 0.0603 30 498 -- -- 14.5 241 Campbell 0.0581 23 396 -- -- 14 241 Caroline 0.0607 73 1,203 -- -- 28 461 Carroll 0.0597 37.5 628 -- -- 26 435 Chesapeake 0.0630 84 1,332 -- -- 20sep 317 Chesterfield 0.0623 49cc 787 -- -- 17.5cp 281 Clarke 0.0600 35 583 -- -- 17.5 292 Culpeper 0.0600 42 700 -- -- 16 267 Cumberland 0.0605 29.5 488 -- -- 17.5 289 Dinwiddie 0.0609 38.5sec 632 -- -- 17 279 Essex 0.0616 72 1,170 -- -- 37.5ep 609 Fairfax 0.0630 40.5nc 643 -- -- 32.5 516 Fauquier 0.0620 49 791 -- -- 17.5 282 Floyd 0.0583 36.5 626 -- -- 23 394 Fluvanna 0.0614 49cc 798 -- -- 17.5cp 285 Franklin 0.0584 38 650 -- -- 16.5sp 282 Frederick 0.0583 32.5 557 -- -- 17 291 Giles 0.0589 25 424 -- -- 13.5 229 Gloucester 0.0599 64.5ec 1,078 -- -- 37.5ep 626
SLEAC Approved 9/11/2019
SLEAC estimates apply to Tax Year 2020 2

Jurisdictions
Counties
Capitalization Rate TY20202
------- Cropland -------- Irrigated cropland ----- Pastureland ------ Rental Rate
$/acre1 Value $/acre3
Rental Rate $/acre1
Value $/acre3
Rental Rate $/acre1
Value $/acre3
Goochland 0.0582 49cc 841 -- -- 20 343 Greene 0.0603 49cc 812 -- -- 17.5cp 290 Greensville 0.0590 74 1,255 -- -- 20sep 339 Halifax 0.0579 35.5 613 -- -- 14 242 Hanover 0.0607 62.5 1,029 -- -- 17.5 288 Henrico 0.0613 49cc 799 -- -- 17.5cp 285 Henry 0.0578 21 363 -- -- 14.5 251 Isle of Wight 0.0604 74 1,225 -- -- 20sep 331 James City 0.0609 64.5ec 1,059 -- -- 37.5ep 616 King George 0.0587 64.5ec 1,098 -- -- 37.5ep 638 King William 0.0611 67 1,096 -- -- 37.5ep 614 Lancaster 0.0583 64.5ec 1,106 -- -- 37.5ep 643 Loudoun 0.0640 49 766 -- -- 21 328 Louisa 0.0599 32 535 -- -- 20.5 342 Madison 0.0602 48 798 -- -- 19 316 Middlesex 0.0581 64.5ec 1,109 -- -- 37.5ep 645 Montgomery 0.0615 36 586 -- -- 22.5 366 Nelson 0.0604 32.5 538 -- -- 12 199 New Kent 0.0611 64.5ec 1,055 -- -- 37.5ep 614 Northampton 0.0606 92 1,519 150 2,477 37.5ep 619 Northumberland 0.0579 74 1,278 -- -- 37.5ep 648 Nottoway 0.0575 34 591 -- -- 17 295 Orange 0.0607 58 955 -- -- 28.5 469 Page 0.0601 35 582 -- -- 22 366 Pittsylvania 0.0589 30.5 518 -- -- 20 340 Powhatan 0.0617 49cc 794 -- -- 17.5cp 284 Prince Edward 0.0578 24 416 -- -- 18.5 320 Prince George 0.0612 38.5sec 629 -- -- 20sep 327 Prince William 0.0633 40.5nc 640 -- -- 32.5np 513 Pulaski 0.0592 35 592 -- -- 23 389 Rappahannock 0.0602 17 282 -- -- 32.5np 540
SLEAC Approved 9/11/2019
SLEAC estimates apply to Tax Year 2020 3

Jurisdictions
Counties
Capitalization Rate TY20202
------- Cropland -------- Irrigated cropland ----- Pastureland ------ Rental Rate
$/acre1 Value $/acre3
Rental Rate $/acre1
Value $/acre3
Rental Rate $/acre1
Value $/acre3
Richmond 0.0599 77 1,286 -- -- 37.5ep 626 Roanoke 0.0635 27.5wc 433 -- -- 14wp 220 Rockbridge 0.0599 32 534 -- -- 19.5 325 Rockingham 0.0593 71 1,197 133 2,242 32.5np 548 Russell 0.0588 32.5 553 -- -- 19 323 Shenandoah 0.0588 47 800 -- -- 21 357 Smyth 0.0597 46 771 -- -- 20 335 Southampton 0.0609 79 1,297 100 1,641 27.5 451 Spotsylvania 0.0606 35 578 -- -- 17.5 289 Stafford 0.0622 40.5nc 652 -- -- 32.5np 523 Suffolk 0.0632 85 1,344 -- -- 20sep 316 Tazewell 0.0587 35.5 604 -- -- 20 340 Virginia Beach 0.0618 84 1,359 -- -- 20sep 324 Warren 0.0589 29 492 -- -- 15.5 263 Washington 0.0588 47 799 -- -- 22swp 374 Westmoreland 0.0583 75 1,286 -- -- 37.5ep 643 Wise 0.0585 37.5swc 641 -- -- 22swp 376 Wythe 0.0576 40.5 703 -- -- 27.5 477 York 0.0605 64.5ec 1,066 -- -- 37.5ep 620 VA Average Rental Rates $/Acre 58 105 20 1National Agricultural Statistics Service (NASS) County-Level Cash Rent Data http://quickstats.nass.usda.gov/.
Accessed 6/07/2019. 2Capitalization Rate (without risk) is a sum of the average interest rate component (interest rate component is 7-year
state average (2 year lag) (from AgFirst)) and average property tax rate (property tax component is 7-year jurisdiction average (3-year lag) (from Department of Taxation)).
3Values $/acre = Land Rental Rate $/ac ÷ Capitalization Rate.
SLEAC Approved 9/11/2019
SLEAC estimates apply to Tax Year 2020 4

Jurisdictions
Counties
Capitalization Rate TY20202
------- Cropland -------- Irrigated cropland ----- Pastureland ------ Rental Rate
$/acre1 Value $/acre3
Rental Rate $/acre1
Value $/acre3
Rental Rate $/acre1
Value $/acre3
ccCentral District Cropland cpCentral District Pasture
ecEastern District Cropland epEastern District Pasture ncNorthern District Cropland npNorthern District Pasture
secSoutheastern District Cropland sepSoutheastern District Pasture
scSouthern District Cropland spSouthern District Pasture swcSouthwestern District Cropland swpSouthwestern District Pasture wcWestern District Cropland wpWestern District Pasture
NASS Districts
Average Non-Irrigated Cropland $/acre
Average Irrigated Cropland $/acre Average Pastureland $/acre
Combined Counties District
Combined Counties District
Combined Counties District
Central 49 48 106 106 17.5 19 Eastern 64.5 72.5 97 127 37.5 37.5 Northern 40.5 49 98 116 32.5 22 Southeastern 38.5 70 81 79 20 19.5 Southern -- 33.5 59 59 16.5 17 Southwestern 37.5 38.5 -- -- 22 21 Western 27.5 39.5 100 100 14 17.5
SLEAC Approved 9/11/2019
SLEAC estimates apply to Tax Year 2020 5
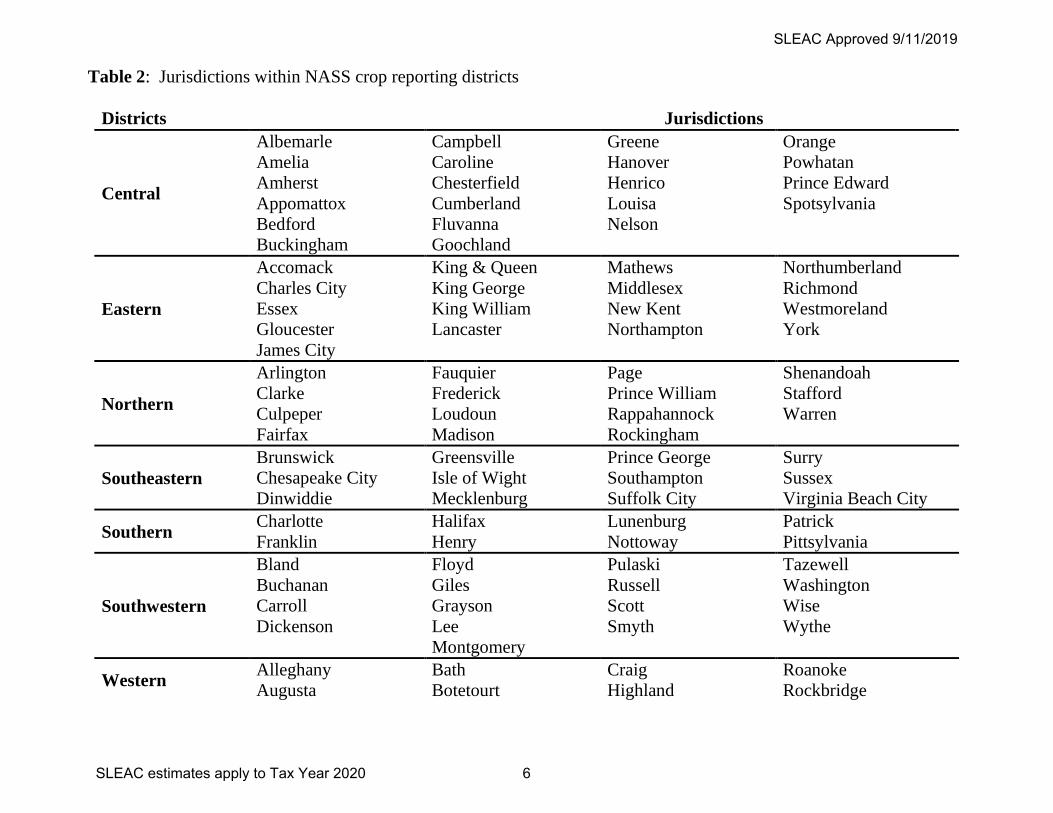
Table 2: Jurisdictions within NASS crop reporting districts
Districts Jurisdictions
Central
Albemarle Amelia Amherst Appomattox Bedford Buckingham
Campbell Caroline Chesterfield Cumberland Fluvanna Goochland
Greene Hanover Henrico Louisa Nelson
Orange Powhatan Prince Edward Spotsylvania
Eastern
Accomack Charles City Essex Gloucester James City
King & Queen King George King William Lancaster
Mathews Middlesex New Kent Northampton
Northumberland Richmond Westmoreland York
Northern
Arlington Clarke Culpeper Fairfax
Fauquier Frederick Loudoun Madison
Page Prince William Rappahannock Rockingham
Shenandoah Stafford Warren
Southeastern Brunswick Chesapeake City Dinwiddie
Greensville Isle of Wight Mecklenburg
Prince George Southampton Suffolk City
Surry Sussex Virginia Beach City
Southern Charlotte Franklin
Halifax Henry
Lunenburg Nottoway
Patrick Pittsylvania
Southwestern
Bland Buchanan Carroll Dickenson
Floyd Giles Grayson Lee Montgomery
Pulaski Russell Scott Smyth
Tazewell Washington Wise Wythe
Western Alleghany Augusta
Bath Botetourt
Craig Highland
Roanoke Rockbridge
SLEAC Approved 9/11/2019
SLEAC estimates apply to Tax Year 2020 6