estimated cost of emission reduction technologies for light-duty
TRANSCRIPT

Estimated Cost of Emission Reduction Technologies for Light-Duty Vehicles
www.theicct.org
March 2012
Francisco Posada sanchez
anuP Bandivadekar
John GerMan

Written by Francisco Posada Sanchez, Anup Bandivadekar, and John German.
The authors thank Tim Johnson and Joe Kubsh for their invaluable help in gathering
information and reviewing this report.
The International Council on Clean Transportation
1225 I Street NW, Suite 900
Washington DC 20005 USA
www.theicct.org
© 2012 The International Council on Clean Transportation
Funding for this work was generously provided by the ClimateWorks Foundation and the
William and Flora Hewlett Foundation.
i
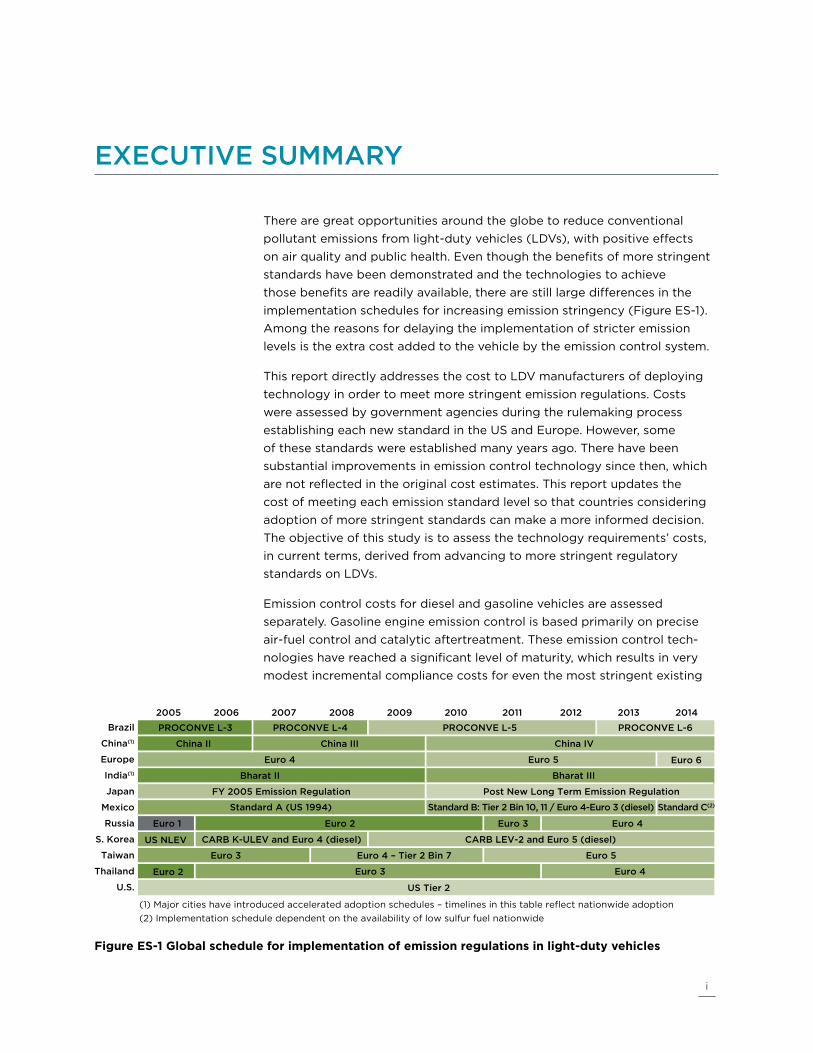
There are great opportunities around the globe to reduce conventional pollutant emissions from light-duty vehicles (LDVs), with positive effects on air quality and public health. Even though the benefits of more stringent standards have been demonstrated and the technologies to achieve those benefits are readily available, there are still large differences in the implementation schedules for increasing emission stringency (Figure ES-1). Among the reasons for delaying the implementation of stricter emission levels is the extra cost added to the vehicle by the emission control system.
This report directly addresses the cost to LDV manufacturers of deploying technology in order to meet more stringent emission regulations. Costs were assessed by government agencies during the rulemaking process establishing each new standard in the US and Europe. However, some of these standards were established many years ago. There have been substantial improvements in emission control technology since then, which are not reflected in the original cost estimates. This report updates the cost of meeting each emission standard level so that countries considering adoption of more stringent standards can make a more informed decision. The objective of this study is to assess the technology requirements’ costs, in current terms, derived from advancing to more stringent regulatory standards on LDVs.
Emission control costs for diesel and gasoline vehicles are assessed separately. Gasoline engine emission control is based primarily on precise air-fuel control and catalytic aftertreatment. These emission control tech-nologies have reached a significant level of maturity, which results in very modest incremental compliance costs for even the most stringent existing
ExECuTiVE SummaRy
2005 2006 2007 2008 2009 2010 2011 2012 2013 2014
Euro 6
Standard C(2)
Euro 1 Euro 3
US NLEV
Euro 2
(1) Major cities have introduced accelerated adoption schedules – timelines in this table reflect nationwide adoption(2) Implementation schedule dependent on the availability of low sulfur fuel nationwide
Euro 5
Euro 4
US Tier 2
Euro 3 Euro 4 – Tier 2 Bin 7
Euro 3
Standard A (US 1994) Standard B: Tier 2 Bin 10, 11 / Euro 4-Euro 3 (diesel)
Euro 2 Euro 4
CARB K-ULEV and Euro 4 (diesel) CARB LEV-2 and Euro 5 (diesel)
Euro 4 Euro 5
Bharat II Bharat III
FY 2005 Emission Regulation Post New Long Term Emission Regulation
PROCONVE L-3 PROCONVE L-4 PROCONVE L-5 PROCONVE L-6
China II China IV
Brazil
China(1)
Europe
India(1)
Japan
Mexico
Russia
S. Korea
Taiwan
Thailand
U.S.
China III
Figure es‑1 Global schedule for implementation of emission regulations in light‑duty vehicles

ii
ExEcutivE Summary
standards. Nitrogen oxides (NOX) and particulate matter (PM) emission control from diesel engines is far more complex and requires the imple-mentation of relatively new technologies involving air management, fuel injection control, aftertreatment and system integration. The implementation of new technologies for diesel engine emissions control has a significant impact compared with the cost associated with gasoline engine emissions control. Emission control technologies for gasoline and diesel vehicles are presented first, and later the technology requirements for each regulatory level and its cost are estimated.
It should be noted that the US and EU regulatory programs were used to estimate costs because sources of information and technical literature about them is more widely available than that for other country-specific regulatory programs. In addition, most countries/regions have modeled their regula-tory programs using the European and the US as regulatory models, so the technology steps are very similar. This implies that cost findings from this report can be used as benchmarks in other countries/regions.
ES-1. EmiSSion REDuCTion TEChnoLogiESTechnologies required for control of regulated pollutants are presented below for gasoline and diesel vehicles. Emissions control technologies can be divided into two groups: in-cylinder control and aftertreatment control. A brief description of each technology, including operational principle, appli-cability, reduction capabilities and special conditions, is provided.
ES-1.1 gaSoLinE VEhiCLESAlmost all gasoline, spark-ignited (SI) engines run at stoichiometric conditions, which is the point where available oxygen from the air is completely consumed, oxidizing the fuel delivered to the engine. Stoichiometric SI engines use a homogenous air-fuel mixture with early fuel introduction for good fuel vapor-ization. Gasoline fuel delivery systems have evolved from carbureted systems to throttle body injection (TBI), multipoint fuel injection (MPFI), and sequential MPFI. The latest evolutionary step, stoichiometric direct injection, represents a significant improvement for spark-ignited engines and when combined with turbocharging and engine downsizing makes them competitive with diesel engines in terms of fuel economy and performance.
Air-fuel control has a major impact on the formation of hydrocarbons (HC), or unburned fuel, and carbon monoxide (CO), which is partially oxidized fuel. In contrast, NOX is a byproduct of combustion, created when nitrogen and oxygen in the air combine during the combustion process. The higher the cylinder temperature, the more NOX is formed. Thus, the primary strategy to reduce the formation of NOX in the engine is to reduce combus-tion temperatures, using faster burn combustion chamber design and exhaust gas recirculation (EGR).

coSt of EmiSSion rEduction tEchnologiES
iii
Aftertreatment emissions control for stoichiometric engines is based on the three-way catalytic converter (TWC). The TWC is capable of oxidizing HC and CO, and simultaneously reducing NOX if the air-fuel ratio is controlled very precisely at stoichiometry. Improvements in SI emission control have focused on extreme precision in air-fuel control, maintenance of stoichio-metric conditions at all times, and catalyst improvements. The latest systems can simultaneously reduce all three pollutants by more than 99% after the catalyst has reached normal operating temperature. Catalyst improvements have focused on ways to quickly bring the catalyst to operating temperature and minimize emissions following cold starts, while significantly reducing the amount of precious metals required for proper operation.
ES-1.2 DiESEL VEhiCLES Unlike gasoline SI engines, which always control both the amount of air and the amount of fuel close to complete combustion conditions, the diesel engine runs unthrottled with an excess of air (lean operation). HC and CO emissions are not usually a concern with diesel engines, as the lean operation reduces engine-out HC and CO emissions and enables high oxidation efficiency in simple oxidation catalysts. PM and NOX emissions are more challenging to control and are the main focus of diesel emissions control research, as well as the main source of technology costs.
Engine-out PM emissions are also much higher than on SI engines due to direct in-cylinder fuel injection. The timing of fuel combustion is controlled when fuel is injected and the fuel ignites almost immediately after injection. This allows little time for the fuel to vaporize and mix with air, creating flame plumes. During this combustion process, carbonaceous particulates grow by aggregating with other organic and inorganic particles. Thus, particulate matter (both mass and number) is also much more challenging to control in a CI diesel engine.
In-cylinder emission control of NOX and PM in CI diesel engines is associ-ated with three systems: fuel injection, air handling, and EGR. Fuel injection system improvements involve the use of high-pressure fuel injection with variable injection fuel timing and metering, as well as redesigned nozzle and piston bowl. The fuel injection pressure and the rate of fuel injection are used to control both NOX and PM. The high-pressure injection improves diesel fuel penetration and atomization, improving the mixing of air and fuel.
Advancing fuel injection timing increases combustion pressures and temperatures, improving efficiency and reducing PM, but increasing NOX emissions. Delaying the injection of fuel has the opposite effect. Multiple injections of fuel, including pilot, main and post injections, minimize the trade-off between NOX and PM emissions. Multiple fuel injection strategies can only be performed with high-pressure unit injectors or common-rail fuel

iv
injectors. Electronically controlled fuel metering and timing are also required for aftertreatment devices with active regeneration.
Air handling is focused on the use of variable geometry turbochargers to provide the right amount of air under specific engine operational conditions. The availability of additional air reduces PM emissions, and has positive effects on power output.
EGR is the most significant technology for in-cylinder NOX reduction in diesel-powered engines. The EGR fraction is tailored for each engine operating condition and may vary from zero up to 40% of the incoming air in the latest systems. The EGR system requires fuel sulfur level below 500 parts per million (ppm) to avoid pipe corrosion with sulfur compounds.
Aftertreatment of NOX can be accomplished using lean NOX traps (LNT) or selective catalytic reduction (SCR) with ammonia. PM aftertreatment control relies on diesel oxidation catalyst (DOC) and diesel particulate filters (DPF).
LNT is based on materials that can adsorb NOX during normal lean operation, and then releases them during periodic rich periods of operation. The NOx adsorber requires a sophisticated air-fuel management system in order to create rich operation and regenerate the trap. NOx adsorbers are capable of 70-90% NOx reduction, but require ultra-low-sulfur diesel fuels (< 15 ppm).
SCR systems use a urea solution to provide ammonia to reduce the nitrogen oxides on a catalytic surface, even during normal lean operation. SCR systems can achieve high conversion efficiencies regardless of the engine-out NOx. This allows for the engine to be tuned at high engine-out NOx levels for higher engine efficiency and lower PM generation. However, the urea must be refilled periodically, which is both a consumer and an enforcement concern. The urea will also freeze at low ambient temperatures, generally requiring heating the urea tank and heating or draining the lines.
The diesel oxidation catalyst (DOC) oxidizes HC, CO and the soluble organic fraction (SOF) of PM. In conventional heavy-duty vehicles, the conversion efficiency of these components is high, but the contribution to total PM reduction can be only around 20-25%. DOCs are not effective for PM control in high temperature cycles due to the low SOF in PM at high temperatures. DOCs require 500 ppm or lower sulfur in diesel fuel.
Diesel particulate filter (DPF) substrates physically trap solid particulate matter, including soot. Wall flow filters achieve PM reduction efficiencies higher than 95% due to their ability to accumulate the solid fraction of PM, including ultrafine particles. The process of removing the accumulated PM is called filter regeneration, and it can be passive or active. Passive regen-eration burns the deposited material using NO2 formed from NOx on an oxidation catalyst located upstream of the DPF. Active regeneration requires
ExEcutivE Summary

coSt of EmiSSion rEduction tEchnologiES
v
late fuel injections or fuel burners upstream of the DPF to regenerate the trap, increasing fuel consumption modestly. DPFs require a fuel sulfur level of 50 ppm or lower to be effective.
ES-2. TEChnoLogiES REquiRED foR EaCh of ThE REguLaToRy LEVELSThe technologies described in the previous chapter have been incorporated in passenger vehicles as a response to emission regulations. As emission standards tend to be tightened in a series of steps, the use of emission control technologies can be tracked to specific regulatory levels. The technologies used for each regulatory level were gathered from governmen-tal agencies reports, technical journals (SAE Technical Papers), industrial association reports and commercial literature.
The specific set of technologies required for light-duty vehicles is presented for each set of regulations (European and US) by compliance level and by fuel type. Euro 1 level technology is used in this document as the baseline for the Euro pathway, and Tier 1 for the US pathway. It should be noted that for regions/countries other than the EU and the US, the schedule for adopting technologies might slightly differ, given that some regulatory components are temporally waived; one example is the adoption of on-board diagnostics (OBD), which is often delayed with respect to the corresponding European or US regulatory timeline.
ES-2.1 EuRopEan REguLaTionSThe light-duty vehicle category studied here comprises gasoline and diesel passenger and light commercial vehicles (categories M1 and N1, respectively).1
es‑2.1.1 Gasoline technologies
Emission control technologies for gasoline-powered vehicles have been focused on stoichiometric air-fuel control, TWC system improvements, and system integration through electronic sensing and control.
euro 1 and 2: Technologies required for compliance with Euro 1 emission levels are based on the universal application of TWC systems for gasoline vehicles. The TWC system requires the use of oxygen sensors and electronic control. Electronic ignition substitutes electromechanical distributors used in older models. Euro 2 standards are accompanied by a shift towards MPFI. EGR is introduced for NOx control in some of the Euro 2 larger vehicles and light commercial vehicles. Today, it is assumed that Euro 1 and 2 vehicles have MPFI technologies, a basic engine control unit (ECU), and
1 M1 passenger vehicles have a gross vehicle mass (GVM) of less than 3,500 kg and carry fewer than nine passen-gers. N1 vehicles are commercial vehicles (goods transport) with a GVM up to 3,500 kg.

vi
TWC operating with a single oxygen sensor; EGR might not be required in today’s Euro 2 vehicles because of advances in engine tuning and electronic integration between the air-fuel management and the TWC system, but the technology is included here as a conservative measure.
euro 3: Emissions control systems for LDVs evolve significantly from Euro 2 systems due to the elimination of the warm-up period (40 seconds) during tests on the New European Driving Cycle (NEDC) that was implemented starting in 2000. Thus, cold start emission control become the main focus of pollutant control for Euro 3-compliant vehicles.
Regarding in-cylinder control technologies, air-fuel management and EGR are the main tools. Air-fuel control systems for gasoline vehicles are improved with electronic controls for fuel injection and ignition spark timing. As a result, MPFI technology is positioned as the main technology for fuel delivery across all gasoline vehicle classes. Tighter controls on NOx values require the use of EGR systems for most gasoline LDVs.
Aftertreatment improvements for Euro 3 gasoline vehicles focus on TWC systems. The elimination of the warm-up period and tighter standards for HC and CO emissions require the use of a close-coupled (CC) catalyst for cold start, in addition to the underfloor catalyst. Cold start requirements also prompt the use of low thermal capacity manifolds to improve CC catalyst warm-up. Oxygen sensor technology evolve into more responsive heated oxygen sensors (HO2S). On-board diagnostics (OBD) systems, required in Europe for Euro 3 vehicles, prompt the use of secondary oxygen sensors after the catalyst to monitor its performance.
euro 4: Emission levels requiring 50% reduction in NOx and HC compared to Euro 3 require improvements in fueling strategy, EGR control, and changes in the TWC formulation. Cold start testing requires the use of flexible fueling MPFI systems with CC catalyst. The ignition and fueling strategy are adjusted during the initial cold start to deliver exhaust gases at higher temperature, warming up the catalyst rapidly for cold start emissions control. NOx is controlled during combustion with EGR.
euro 5/6: Gasoline standards change little from Euro 4 to Euro 5, with only a 25% reduction in NOx, and Euro 6 is identical to Euro 5. The mild NOx reduction is met with combustion improvements through engine calibra-tion and incremental improvements in air-fuel management and EGR. The increased costs of platinum group metals (PGM) for catalytic converters have promoted significant changes in TWC formulation on washcoat and PGM formulations. Sensing capabilities were also improved with the adoption of universal wide range oxygen sensors.
Euro 5 and 6 emission control technologies are strongly influenced by CO2 emission standards that aim to reach a target of 95 grams per kilometer
ExEcutivE Summary

coSt of EmiSSion rEduction tEchnologiES
vii
in 2020. One significant vehicle technology shift caused by CO2 emission regulations is demonstrated by the market growth of stoichiometric ignition direct injection (SIDI) technology, known commercially as gasoline direct injection (GDI). Given that direct injection would tend to produce higher amounts of PM than port fuel-injected engines, specific emission standards regulating particulate mass have been set for Euro 5 and 6 GDI engines; a particulate number (PN) emission standard for Euro 6 GDI is still under discussion as of writing of this report. Although GDI technology is not covered by the scope of this report, it is expected that PN standards would require the use of a combination of advanced fuel injection strategies and aftertreatment through wall-flow particulate filters. The cost of gasoline particulate filters (GPF) for GDI vehicles has been addressed and made public by the ICCT (ICCT, 2011).
es‑2.1.2 diesel technologies
Light-duty diesel vehicles have steadily gained market share in Europe, from about 23% in 1994 (Euro 1) to more than 50% in 2006 (ACEA, 2010). A similar trend is seen in India. The shift in emission control technology is more complex than the gasoline case, including improvements and adoption of new technologies for in-cylinder control and aftertreatment systems.
euro 1 and 2: Technologies required for compliance with Euro 1 emission levels are based on mechanical fuel injection systems, mostly indirect fuel injection. Air management is naturally aspirated (not turbocharged). Mechanically activated EGR circuits are introduced in vehicles that meet these standards. Euro 2 regulations started the shift from mechanical injection to electromechanical that eventually led to the phasing out of mechanical injectors altogether to meet Euro 3 requirements. Electronic fuel timing and metering becomes the dominant technology. Turbocharging start spreading among the larger size light-duty diesel engines.
Historically, aftertreatment through oxidation catalyst was introduced as a commercial tool for odor (hydrocarbons) control in Euro 1 and 2 diesel vehicles, which were mainly IDI engines (Koltsakis and Stamatelos, 1997). For current Euro 2 vehicles, advances in direct fuel injection technology are expected to provide PM engine-out emission levels compliant with Euro 2 standards without the need for aftertreatment. Thus, for the purposes of this report, fuel injection technology for current Euro 2 vehicles is based on a rotary pump with electronic assistance for fuel metering. NOx emission is controlled with cooled EGR.
euro 3: The elimination of the warm-up period (40 seconds) during tests on the NEDC makes cold start emissions the main focus of pollutants control for Euro 3-compliant diesel vehicles. To achieve pollution compliance, the focus is on improving fuel injection systems with electronic control and higher injection pressures. Electronically controlled Euro 3 diesel injection

viii
systems improve air-fuel mixing and reduce PM emissions. Particulate matter reductions obtained in-cylinder is combined with aftertreatment based only on oxidation catalysts. NOx emissions are controlled with cooled and electronically controlled EGR.
euro 4: Emission levels requiring 50% reduction in NOx and PM for diesel vehicles require new technological developments for Euro 4 compliance levels. Compliance for diesel vehicles is achieved primarily with incremental improvements on emission control strategies used for Euro 3 plus the introduction of turbochargers with intercoolers for better air-fuel mixing. Euro 4 vehicles use flexible fuel timing and metering strategies based on high-pressure common-rail fuel injection systems. These technologies are integrated to improve the mixing of air and fuel. Improving air and fuel mixing allows for reducing engine-out PM emissions. In-cylinder NOx emissions are controlled with cooled EGR. Engine-out PM is controlled with DOC technology.
euro 5: The mandated 80% reduction by mass in PM emission levels with respect to Euro 4 levels requires the use of a combination of in-cylinder measures and a combination of DOC and DPF in all passenger vehicle size classes. NOx emission levels were reduced by 28%, which was controlled with combustion improvements and cooled EGR.
As emission control becomes more stringent, technologies such as variable fuel timing is adopted and integrated with the aftertreatment system. Variable fuel injection timing is used for DPF active regeneration through injection delay.
euro 6: The introduction of particulate matter control by number (PN) for Euro 6 requires the use of wall-flow DPF for PM control. In-cylinder control measures require continuous research and development in combustion, including multimode fuel injection strategies at higher injection pressures and variable geometry turbocharger (VGT) to deliver tailored amounts o fuel and air at specific engine operational conditions.
NOx emission levels are reduced by 66% from Euro 5, requiring the use of NOx aftertreatment devices in addition to in-cylinder measures such as cooled EGR. LNTs have shown good NOx reduction performance and durability. On the other hand, SCR, while offering also good NOx reduction performance, offers more flexibility for fuel economy and reduction of CO2 emissions. Manufacturers will likely choose the NOx aftertreatment technol-ogy based on a combination of cost, reliability, fuel economy, and consumer
acceptance.
ES-2.2 uniTED STaTES REguLaTionThis set of standards applies to new light duty vehicles (LDVs) such as passenger vehicles, light-duty trucks, sport utility vehicles (SUV), minivans
ExEcutivE Summary

coSt of EmiSSion rEduction tEchnologiES
ix
and pick-up trucks of less than 8,500 lbs GVWR.2 Emission control for LD gasoline vehicles is discussed for NLEV and Tier 2 emission levels. However, emission control for LD diesel vehicles is discussed only for Tier 2 levels due to the low market share of diesel LDVs in the US (below 2% since 1985).
es‑2.2.1 Gasoline vehicles
us Tier 1: Gasoline-powered Tier 1 vehicles are similar to Euro 3 vehicles. They require the use of multipoint injection systems for accurately control-ling the amount of fuel to the cylinders. MPFI systems require the assistance of an oxygen sensor for proper operation with the TWC. Federal OBD regulations adopted with the Tier 1 regulations made mandatory the use of secondary oxygen sensors for TWC performance monitoring for durability.
us national Low emission vehicle (nLev): The shift to NLEV focused on improving traditional technologies, such as catalysts, with faster warm-up capabilities and better durability. Fuel metering was enhanced with sequen-tial fuel injection techniques, allowing for better regulated amounts of fuel during cold start and low to mid-load speed. Faster data processing was required for better response to changing conditions. The steep reduction of emissions limits for non-methane hydrocarbons (NMHC) by 71%, required that the TWC be separated into close-coupled and underfloor catalysts for most vehicles. EGR was introduced in many six- and eight-cylinder vehicles for control of NOx during low to mid-loads. In addition to air-fuel and TWC work, improvements were made to base engine designs. Reduction of combustion chamber crevice volumes and oil consumption are examples of improvements targeting reduction in engine-out HC emissions.
us Tier 2: Improved integration of engine-out controls, fuel metering, and aftertreatment systems was found to be a key element for reducing NOx emissions 70% below NLEV levels. Sequential fuel injection and variable spark timing was required for all engine sizes. Late ignition was introduced during cold starts to increase exhaust temperatures for faster catalyst light-off. EGR systems are used on virtually all Tier 2 vehicles, and the technology has been evolving towards internal trapping of exhaust gases in vehicles with variable valve actuation. Regarding TWC systems, there is an intense research on formulations and the deposition of PGMs in specific layers, to avoid metal to metal sintering derived from thermal aging and to optimize the oxidation/reduction function. The number and location of
oxygen sensors in the vehicle depends on engine size and configuration (I4, V6, V8). Engine with double bank of cylinders such as some large six-cylin-der and most eight-cylinder engines require a double-bank catalyst system: one CC catalyst and one under-floor (UF) catalyst per bank of cylinders. In addition, the number of oxygen sensors is doubled to cover each leg of
2 Gross vehicle weight rating (GVWR) is defined as the vehicle weight plus rated cargo capacity.

x
catalysts. Although some double-bank systems use one UF catalyst after the juncture of the exhaust pipe, the conservative cost approach in this report considers one UF catalyst and oxygen sensor per bank.
es‑2.2.2 diesel technologies
Tier 2‑Bin 5: The set of technologies required for compliance are, in general, the same as the technologies expected in Euro 6 vehicles. Tier 2-Bin 5 diesel engines for LD vehicles require electronically controlled common-rail fuel injection systems very high with injection pressures, improving engine-out PM emissions. In-cylinder NOx control is being addressed with cooled high-pressure or low pressure EGR systems. All diesel engines require turbocharging, most likely fitted with variable geometry capabilities and/or intercooling. This is a key part of the air-fuel management strategy for low PM emissions, which reduces the requirements for aftertreatment. The stringent compliance levels of PM and NOx require both a PM filter and a NOx aftertreatment system. The DPF is required for compliance, and its regeneration can be accomplished via passive regeneration (require catalyzed DPF) or via late fuel injections (active regeneration). NOx aftertreatment requires the use of LNT or SCR systems. The US regulation include a separate standard for high engine loads, so NOx compliance using only in-cylinder controls is currently not an option in the United States as it is in Europe.
ES-3. EmiSSion REDuCTion TEChnoLogy CoSTSAfter identifying the set of technologies required for each regulatory level, an indirect cost assessment was performed. It is an indirect assessment, because the technology cost is only known by auto manufacturers, who are understandably unwilling to share cost information because of competitive concerns. Beyond that, there are only a few scattered sources of informa-tion. Thus, our main sources of cost information are official estimates from regulatory agencies. Unfortunately, the cost information in those reports, especially for the earlier standards, is old and does not reflect recent improvements in emission control technology. The cost values for emission control technologies found in those reports were corrected by inflation and complemented with in-house developed estimates of the cost of the most recent technology. For technologies that are being introduced in passenger vehicles, such as PM and NOx aftertreatment systems for diesel cars, the costs were reduced by a factor accounting for learning reduction costs. Experts from the manufacturer and supplier sector reviewed the final cost estimates in this report. While they were not able to provide specific dollar estimates, they identified places where the original cost estimates were too high or too low. This final expert check provides some assurance that the costs estimates in this report are reasonable.
ExEcutivE Summary

coSt of EmiSSion rEduction tEchnologiES
xi
Tables ES-1 and ES-2 present the incremental cost for meeting the next more stringent emission standard for Europe and the United States, respectively. The tables present the cost of technology for different engine size and for each regulatory level. Included in the table are variable costs (hardware) and fixed cost (R&D, tooling, certification).
Table es–1 incremental costs for Ldvs meeting european standards (2010 dollars)
enGine TyPe
vehicLe cLass
euro 1 (BaseLine)
euro 1 To euro 2
euro 2 To euro 3
euro 3 To euro 4
euro 4 To euro 5
euro 5 To euro 6
no conTroL To euro 6
Gasoline 4 cylinders Vd= 1.5 L $142 $63 $122 $25 $10 -- $362
Gasoline 4 cylindersVd = 2.5 L $232 $3 $137 $15 $30 -- $417
diesel 4 cylindersVd = 1.5 L $56 $84 $337 $145 $306 $471 $1,399
diesel 4 cylindersVd = 2.5 L $56 $89 $419 $164 $508 $626 $1,862
The base cost for Euro 1 gasoline vehicles includes the installation of throttle or port fuel injection system, oxygen sensor and three-way catalytic convert-ers. Small vehicles require throttle body injection (TBI), while large vehicles are fitted with the more costly MPFI systems. The cost increase from Euro 1 to Euro 2 in small vehicles is primarily caused by the implementation of MPFI fuel systems, while in large vehicles the incremental cost is relatively small. From Euro 2 to 3, the cost increase is due to use of CC catalysts on large engines, required for cold start emissions control, and to the extra cost due to OBD requirements. Cost increases from Euro 3 to Euro 4 are due to requirements for CC catalyst in all engine sizes and implementation of EGR and manifold material improvements (low thermal capacity). Cost increase from Euro 4 to Euro 5 and Euro 6 is very modest. This is because the emission levels only mandated a 25% reduction in NOx for Euro 5 and no change in levels for Euro 6. Euro 6 technologies for gasoline port fuel-injected vehicles are focused on fuel economy and CO2 emissions, and therefore no extra costs are associated with conventional pollutant reduction. Stoichiometric GDI emission control technologies are not covered in this report.
Note that the light-duty emissions standards in Europe are different for gasoline and diesel vehicles. Euro 1 gasoline vehicles require aftertreatment, and port fuel injection which is more expensive than the basic Euro 1 diesel emission control based only on EGR. Despite the more stringent standards for gasoline vehicles, once the TWC system is in place, including the port fuel injection system, the oxygen sensors and the ECU, the cost increase per regulatory level is lower compared to diesel technology.
Diesel vehicle cost increases are dependent on a combination of costs asso-ciated with air and fuel management and aftertreatment systems. Significant

xii
increases in cost are required from Euro 2 to 3 due to the need for common rail fuel injection systems, which deliver performance and emissions improvements, and aftertreatment with DOC. The cost increase for diesel vehicles when moving from Euro 4 to 5 levels is due to the use of DPF. The extra cost incurred to reach Euro 6 levels is higher in larger vehicles. According to comments expressed by experts from emission control associations and manufacturers it is possible that small diesel engines would be able to achieve Euro 6 emission levels with advanced combustion techniques and air-fuel management strategies, and might not need NOx aftertreatment control, only DPF for PM control. Larger diesel engines, most likely will require LNT or SCR and a DPF. Due to cost differences, LNT is expected in diesel engines with displacement volumes below 2.5 to 3.0 liters, while SCR will likely be used in engines with larger displacements.
The incremental cost of moving forward on tighter US-based emission levels is presented in Table ES–2. The estimated cost of technology employed in Tier 1 compliant vehicles included the cost of the MPFI system, one oxygen sensor, and a single UF catalyst. The cost increase to move to the NLEV level is generated mainly by the implementation of a CC catalyst to comply with more stringent standards for NMHCs, which are emitted primarily during cold-start operation. The cost effect of requiring CC catalyst is intensified in eight-cylinder engines, which need a double set of CC catalysts. Adopting Tier 2 emission levels require 76% reduction in NOx emissions compared to NLEV requirements. The additional cost is due to increased catalyst volume, improved manifold design, and R&D. For medium size engines, the large increase in cost is due to the implementation of a double set of CC catalysts (one per bank of cylinders).
Table es–2 incremental costs for Ldvs meeting us standards
enGine TyPe
vehicLe cLass
Tier 1 (BaseLine)
Tier 1 TonLev
nLev ToTier 2
Tier 1 ToTier 2
no conTroL To Tier 2
Gasoline 4-cylinders Vd=2.3 L $260 $80 $65 $145 $405
Gasoline 6-cylindersVd= 3.2 L $313 $115 $81 $197 $510
Gasoline 8-cylindersVd= 4.5L $381 $185 $124 $309 $690
diesel 4-cylinders Vd=2.0 L - - - - $1,609
diesel 4-cylinders Vd=3.0 L - - - - $2,086
The emission control technology for diesel engines is similar to that for meeting Euro 6, and the cost is well within the range of the total incremental cost of Euro 1 to Euro 6, which adds up to around $1,800 for the 2.5L European diesel engine.
ExEcutivE Summary

coSt of EmiSSion rEduction tEchnologiES
xiii
The cumulative cost of emission reduction technologies is presented in Figure ES-2 for gasoline and diesel vehicles assuming a 2.0L engine. It is clear that the incremental emission control costs for gasoline vehicles are much more favorable than those for diesel vehicles. Control of gasoline vehicle pollutants is based on improving air-fuel control using faster oxygen sensors and better control logic, combined with improvements in TWC technology. The TWC technology has undergone extensive R&D work and improvements, substantially reducing the manufacturing cost. Therefore, the cost impact of emission control technologies in gasoline vehicles is minimal.
On the other hand, diesel vehicles, due to their inherently lean combustion process and direct fuel injection, require much deeper system modifications to achieve the emission targets. Diesel vehicles require the implementation of high-pressure fuel injection systems (common-rail), more responsive turbocharging systems (VGT), more complex cooled-EGR systems (larger heat exchange surface) and sophisticated aftertreatment devices developed in parallel with in-cylinder control through engine tuning.
$-
$200
$400
$600
$800
$1,000
$1,200
$1,400
$1,600
$1,800
Euro 1 Euro 2 Euro 3 Euro 4 Euro 5 Euro 6
Em
issi
on
Co
ntro
l Co
st, $
USD
EU Regulations
Gasoline
Diesel
Diesel w/o deNOX
Tier 1 NLEV Tier 2 B5
US Regulations
Figure es‑2 estimated cumulative emission control technology cost for gasoline and diesel light‑duty vehicles assuming a 2.0 L engine


xv
executive summary ................................................................................................ iES-1. Emission reduction technologies ....................................................................... iiES-1.1 Gasoline vehicles ..................................................................................................... iiES-1.2 Diesel vehicles ....................................................................................................... iiiES-2. Technologies required for each of the regulatory levels ..........................vES-2.1 European regulations ...........................................................................................v
ES-2.1.1 Gasoline technologies ....................................................................................vES-2.1.2 Diesel technologies ......................................................................................vii
ES-2.2 United States regulation .................................................................................viiiES-2.2.1 Gasoline vehicles ...........................................................................................ixES-2.2.2 Diesel technologies ......................................................................................x
ES-3. Emission reduction technology costs .............................................................x
Glossary ..............................................................................................................xvii
1. introduction .........................................................................................................11.1 Overview of LDV emission regulations in the EU and US ..............................2
2. emission reduction Technologies ..................................................................52.1 Gasoline vehicles ..........................................................................................................6
2.1.1 Gasoline in-cylinder control ................................................................................62.1.2 Gasoline aftertreatment systems ....................................................................9
2.2 Diesel vehicles ............................................................................................................102.2.1 In-cylinder control of diesel combustion emissions ...............................102.2.2 Aftertreatment of diesel combustion emissions .................................... 13
3. Technologies required for each of the regulatory Levels ....................... 173.1 European regulations ............................................................................................... 17
3.1.1 Gasoline technologies ......................................................................................... 183.1.2 Diesel technologies ............................................................................................20
3.2 US regulation ............................................................................................................. 233.2.1 Gasoline vehicles ................................................................................................ 243.2.2 Diesel technologies .......................................................................................... 25
3.3 Technology summary ............................................................................................. 26
4. emission reduction Technology costs ....................................................... 314.1 Sources of information ........................................................................................... 314.2 Methodology .......................................................................................................... 324.3 Gasoline vehicles estimated emissions control costs .............................34
4.3.1 Gasoline hardware costs ...............................................................................344.3.2 Fixed costs: R&D, tooling and certification ...........................................44
4.4 Diesel vehicles estimated emissions control costs ...................................504.4.1 Hardware costs .................................................................................................504.4.2 R&D, tooling and certification ....................................................................664.4.3 Cost summary for diesel vehicles ............................................................. 67
TabLE of ConTEnTS

xvi
5. summary ...........................................................................................................735.1 European regulations .............................................................................................. 73
5.1.1 Gasoline vehicles ................................................................................................. 735.1.2 Diesel vehicles ..................................................................................................... 74
5.2 US regulations ........................................................................................................... 745.2.1 Gasoline vehicles ................................................................................................ 745.2.2 Diesel vehicles .................................................................................................... 75
5.3 Comparing emission costs: US vs. EU ............................................................. 76
6. comparisons with available sources ..........................................................796.1 Comparison for gasoline technologies ........................................................... 796.2 Comparison for diesel technologies ................................................................ 81
7. conclusions ......................................................................................................85Gasoline vehicles ............................................................................................................ 85Diesel vehicles ..................................................................................................................86
Bibliography .........................................................................................................89
appendix a. emission standards for eu and us regulations ......................95A.1 European Union ........................................................................................................95A.2 United States ...........................................................................................................96
Tier 1 ..................................................................................................................................96National Low Emission Vehicle (NLEV) standards ......................................... 97Tier 2 ................................................................................................................................. 97
appendix B. historic costs of PGM Loadings ................................................ 99B.1 PGM consumption in North America and market prices ........................100B.2 PGM catalyst cost model .................................................................................... 102B.3 PGM catalyst loading literature review ......................................................... 106B.4 PGM catalyst loading ......................................................................................... 109
appendix c. estimated cost of emission control Technology for 2.0 L engine, Gasoline and diesel ....................................................................111

xvii
common rail fuel injection: Type of fuel injection system used in diesel engines.
diesel particulate filter (dPF): Diesel aftertreatment technology used for trapping particulate matter on the exhaust gas stream.
direct injection (di): Related to fuel delivered inside the combustion chamber.
indirect injection (idi): Type of fuel injection technology for diesel engines that delivers fuel to an antechamber before the combustion chamber.
Lean combustion: type of combustion where fuel reacts with excess air, resulting in some oxygen remaining after combustion.
Lean nox trap (LnT): Aftertreatment technology used in lean-burn engines, diesel mostly and lean GDI, for controlling tailpipe emissions of NOX.
Multipoint fuel injection (MPFi): Fuel injection system used in port fuel-injected gasoline engines. It uses one injector per cylinder.
on‑board diagnostics (oBd): electronic system of sensors governed by the on-board computer that continuously check the status of the emission control system and engine components that affect the emissions of a vehicle.
oxidation catalyst (oc): Aftertreatment technology used for controlling tailpipe emissions of hydrocarbons, carbon monoxides and some components of particulate matter.
oxygen sensor: Electrochemical sensor that detects and in some cases measure the concentration of oxygen in the exhaust of a vehicle.
Port fuel injection (PFi): type of fuel injection technology for gasoline engines that delivers fuel at the engine intake manifold, usually nearby the intake valves.
rich combustion: type of combustion where excess fuel reacts with air, resulting in some fuel remaining after combustion.
selective catalytic reduction (scr): Aftertreatment technology used in diesel vehicles for controlling emissions of NOX.
stoichiometric combustion: type of combustion where all the fuel reacts with a specific (stoichiometric) amount of air, resulting in no oxygen or fuel remaining after combustion.
gLoSSaRy

xviii
Three‑way catalyst (TWc): Aftertreatment technology used in stoichiometric gasoline vehicles for controlling tailpipe emissions of HC, CO, and NOX.
Turbocharger: Air management technology designed to increase the mass of air into the engine by using a compressor powered by a turbine propelled by the exhaust gas stream.
variable geometry turbocharger (vGT): A turbocharger fitted with a mechanism that allows for adapting its turbine geometry to a wide range of exhaust gas flow rates, enabling its use at most engine operational conditions.
Wastegate turbocharger: A turbocharger designed to bypass excessive amount of exhaust gases, limiting its response to certain engine operational conditions.

1
Governments around the globe are committed to setting cleaner standards for their national light-duty vehicle (LDV) fleets through the implementa-tion of increasingly stringent regulations. These emission levels and their corresponding regulatory framework vary widely among countries.
Most countries have initially adopted the European or US emission regulation levels as a starting point. Using these regulations as models, countries such as China and India have developed their national regula-tions according to specific local conditions. Figure 1-1 presents a general perspective for some of the countries following the European and US pathways over a 10-year span.
There are great opportunities around the globe to reduce conventional pollutant emissions from LDVs, with positive effects on air quality and public health. Even though these benefits have been demonstrated and the technologies to achieve these benefits are already available, there are still large gaps between the implementation schedules for increas-ing the emission levels stringency. Among the reasons for delaying the implementation of stricter emission levels is the extra cost that emissions control systems add to vehicles.
The fundamental question this cost assessment seeks to answer is how much it costs vehicle manufacturers to implement the technology needed to meet more stringent emission regulations. Costs were assessed by government agencies during the rulemaking process establishing each new standard in the United States and Europe. However, the standards were established many years ago, and the substantial improvements in emission control technology since then are not reflected in the original cost estimates. The objective of this study is to assess the technology requirements costs, in current terms, derived from advancing to more stringent regulatory standards on LDVs. This report updates the cost of meeting each progressively higher emission standard so that countries considering adoption of more stringent standards can make a more informed decision.
1. inTRoDuCTion

2
introduction
2005 2006 2007 2008 2009 2010 2011 2012 2013 2014
Euro 6
Standard C(2)
Euro 1 Euro 3
US NLEV
Euro 2
(1) Major cities have introduced accelerated adoption schedules – timelines in this table reflect nationwide adoption(2) Implementation schedule dependent on the availability of low sulfur fuel nationwide
Euro 5
Euro 4
US Tier 2
Euro 3 Euro 4 – Tier 2 Bin 7
Euro 3
Standard A (US 1994) Standard B: Tier 2 Bin 10, 11 / Euro 4-Euro 3 (diesel)
Euro 2 Euro 4
CARB K-ULEV and Euro 4 (diesel) CARB LEV-2 and Euro 5 (diesel)
Euro 4 Euro 5
Bharat II Bharat III
FY 2005 Emission Regulation Post New Long Term Emission Regulation
PROCONVE L-3 PROCONVE L-4 PROCONVE L-5 PROCONVE L-6
China II China IV
Brazil
China(1)
Europe
India(1)
Japan
Mexico
Russia
S. Korea
Taiwan
Thailand
U.S.
China III
Figure 1‑1. Global schedule for implementation of emission regulations in Ldvs
The scope of this project covers passenger vehicles and commercial vehicles (categories M1 and N1) according to the EU classification, and LDVs, light duty trucks (LDT) and multipurpose vehicles (MPV) according to the US classifica-tion. Out of scope of this report are lean-burn gasoline direct injection (GDI) vehicles, electric vehicles, and two- and three-wheelers. Stoichiometric GDI vehicle emissions’ control technology costs will be studied by the ICCT and presented in a future report.
The report is structured as follows. Chapter 2 of this report describes the tech-nologies available for light-duty vehicle emission control; Chapter 3 defines the required set of technology per regulatory level; and Chapter 4 estimates the cost per technology for different engine sizes and presents the summation of cost for gasoline and diesel engine technology under each regulatory program.
1.1 oVERViEw of LDV EmiSSion REguLaTionS in ThE Eu anD uS
The control of pollutants has a long history of regulatory work since the mid-1960s in both the United States and the European Union. In the US the first emission regulations were established in 1966 by California, where air pollution was a major public concern, forcing the control of hydrocarbons (HC) and carbon monoxide (CO) from passenger vehicles. Similar controls were required two years later by the US federal government. In Europe, initiatives to implement national emission regulations independently by Germany and France were seen as barriers to free trade by other members of the European Community and thus opposed. In consequence, implementation of European emission regulations was delayed until the early 1990s (Walsh, 2010).
The decades that followed are each notable for major new policy develop-ments. The US Clean Air Act in the early 1970s required 60% reduction in HC and CO emissions from passenger motor vehicles, and introduced the control

coSt of EmiSSion rEduction tEchnologiES
3
of nitrogen oxide (NOX) emissions. During the 1980s, Clean Air Act amend-ments mandating additional 75% reductions in HC and CO and 70% reduction in NOX required the introduction of the three-way catalytic (TWC) system for gasoline LDVs, a significant technological milestone in emission control technol-ogies. The first set of European emission standards, Euro 1, was implemented during the early 1990s for gasoline and diesel LDVs.
Each set of regulations has its specific set standards by fuel type and vehicle characteristics. European regulations for passenger car (M1) and light commer-cial vehicles (N1) have specific standards by fuel type, either gasoline or diesel. The regulations for US LDVs used to differentiate by fuel type, but since Tier 2 (2004) the standard is universal. Tier 2 standards in the US extended the regulation to heavier vehicles, medium-duty passenger vehicles (SUVs) that were not regulated under the Tier 1 standards.
Figure 1-2 shows the historic development of emission limit values for regulated species in the EU and the US for gasoline-powered passenger cars and LDVs, respectively. Figure 1-3 shows the historic changes on emission limits for diesel-powered passenger cars and LDVs. It should be noted that the emission limits for the US and the EU are not directly comparable because the limits are set under different vehicle emissions test cycles.3 Details on emission standards limits are presented in Appendix A.
0
0.1
0.2
0.3
0.4
0.5
0.6
0.7
0.8
0.9
1
1994 1996 1998 2000 2002 2004 2006 2008 2010 2012 2014 2016
Em
issi
on
Lim
its,
g/k
m
EU – NOx US – NOx
EU – PM x10 US – PM x10
Euro 1 PM x10 = 1.4
Euro 1 Euro 2 Euro 3 Euro 4 Euro 5 Euro 6
Tier 1 NLEV Tier 2 T2-B5
0
0.05
0.10
0.15
0.20
0.25
0.30
0.35
0.40
1994 1996 1998 2000 2002 2004 2006 2008 2010 2012 2014 2016
Em
issi
on
Lim
its,
g/k
m
EU – NOx US – NOx
EU – NMHC US – NMHC
Euro 1 Euro 2 Euro 3 Euro 4 Euro 5 Euro 6
Tier 1 NLEV Tier 2 T2-B5
Figure 1‑2 emission Limits for Gasoline Powered Ldvs, nox and nMhc in the us (Light‑duty vehicles and Trucks) and the eu (Passenger cars and Light commercial vehicles)
3 EU emission standards are based on the Urban (ECE) plus Extra-Urban Driving Cycle (EUDC), while the US emission standards are based on the Federal Test Procedure (FTP). Both test cycles differ in test length, dura-tion, max speed and acceleration, average speed, and percentage of time idling.

4
0
0.1
0.2
0.3
0.4
0.5
0.6
0.7
0.8
0.9
1
1994 1996 1998 2000 2002 2004 2006 2008 2010 2012 2014 2016
Em
issi
on
Lim
its,
g/k
m
EU – NOx US – NOx
EU – PM x10 US – PM x10
Euro 1 PM x10 = 1.4
Euro 1 Euro 2 Euro 3 Euro 4 Euro 5 Euro 6
Tier 1 NLEV Tier 2 T2-B5
0
0.05
0.10
0.15
0.20
0.25
0.30
0.35
0.40
1994 1996 1998 2000 2002 2004 2006 2008 2010 2012 2014 2016
Em
issi
on
Lim
its,
g/k
m
EU – NOx US – NOx
EU – NMHC US – NMHC
Euro 1 Euro 2 Euro 3 Euro 4 Euro 5 Euro 6
Tier 1 NLEV Tier 2 T2-B5
Figure 1‑3 emission Limits for diesel‑Powered Ldvs: nox and PM in the us (Ldvs and trucks) and eu (Passenger cars and Light commercial vehicles)
introduction

5
Light-duty vehicles are powered by a growing diversity of fuels, including conventional gasoline and diesel; renewable fuels such as biodiesel and ethanol; and alternative HC such as compressed natural gas (CNG) and liquefied petroleum gas (LPG).
Although renewable and alternative fuel LDVs are gaining market share, the conventional options, gasoline and diesel, retain by far the largest share of the new vehicle sales market. Many of the technologies used in gasoline and diesel engines also apply to other fuels, because the combustion process fundamentally evolves in a similar fashion, with some specific differences. In general, gasoline fuel is used in spark-ignited engines and diesel fuel in compression-ignited engines.
Spark ignition (SI) combustion of gasoline can be achieved in both lean and stoichiometric conditions. Stoichiometric combustion is defined as the theoretical or ideal combustion process in which fuel and oxygen are matched in such a way that should result in no unburned fuel or oxygen left in the exhaust. Lean burn combustion, on the other hand, is accomplished with excess air in the combustion chamber, and the resulting exhaust contains significant amounts of oxygen. Lean SI combustion implies direct fuel injection, and stoichiometric SI combustion can use either port fuel injection or direct fuel injection, both with premixed air-fuel. This report is focused on stoichiometric port-fuel injected gasoline engines. Most SI direct-injection vehicles also run under stoichiometric conditions for reasons of emission control. Lean-burn gasoline engines are rare due to the difficulty in controlling NOX and are not covered in this report.
Diesel combustion technology is defined as compression ignition (CI). Air is compressed, raising its temperature to create suitable conditions for autoignition of fuel when it is injected into the cylinder. Diesel combustion is almost always lean. Diesel vehicles consume less fuel than gasoline vehicles. Fuel savings are derived primarily from thermal and volumetric efficiency generated through higher compression ratios and leaner air-fuel mixtures. Higher compression ratios translate into more work per stroke and lower exhaust temperatures, where less energy is wasted. Diesel vehicles also benefit from zero throttling losses. Throttling, which reduces efficiency at small loads, regulates air intake into the engine cylinder and is necessary in gasoline stoichiometric engines to control power output.
Each type of fuel and combustion technology undergoes a characteristic combustion process, producing a unique spectrum of pollutants that require specific in-cylinder and aftertreatment technologies to control. PM, NOx, HC and CO are the main pollutants targeted for control.
2. EmiSSion REDuCTion TEChnoLogiES

6
PM emissions are not significant in stoichiometric SI engines because air and fuel are mixed homogenously before combustion starts, but they are an issue in both CI diesel engines and lean SI engines, where the fuel is non-homogeneously mixed because it is injected just before ignition.
Engine-out NOX emissions are higher in stoichiometric engines than in lean engines (diesel and gasoline), but the high engine-out NOX levels of stoichio-metric engines are relatively easy to control with aftertreatment devices. Aftertreatment of NOX is far more difficult in lean-burn engines. Unburned HC and CO are also higher in stoichiometric engines because there is less availability of oxygen to complete the HC oxidation.
The set of technologies required for control of regulated pollutants is presented below for each technology: diesel vehicles and gasoline vehicles. A brief description is provided, including operational principle, applicability, reduction capabilities, and special conditions.
2.1 gaSoLinE VEhiCLESEmission reduction technologies for gasoline-powered vehicles are focused on controlling HC, CO and NOX emissions. HC emissions come mostly from unburned gasoline, while CO emissions are the result of incomplete combustion. The way air and fuel interact during the combus-tion process has a major impact on these two pollutants. In contrast, NOx is a byproduct of combustion, produced when nitrogen and oxygen in the air combine during the combustion process. Technologies for controlling these pollutants fall into one of two main groups: in-cylinder emission control and aftertreatment control.
2.1.1 Gasoline in‑cylinder control
In-cylinder emissions reduction is achieved through improvements in the air-fuel management system, engine design, and exhaust gas recirculation (EGR). Aftertreatment control in stoichiometric SI engines is done through catalytic converter systems.
air‑fuel management systemThe air-fuel management system is a key element in controlling emissions and improving both engine and aftertreatment performance. A gasoline engine requires precise control of the ratio of air and fuel that flows into the engine for complete combustion. When the driver presses the accelerator pedal demanding more engine power output, the throttle valve opens, allowing more air to be drawn into the engine. The main function of the air-fuel management system is to deliver a specific amount of fuel according to the amount of air that is being drawn into the engine.
EmiSSion rEduction tEchnologiES

coSt of EmiSSion rEduction tEchnologiES
7
There are two types of fuel delivery for stoichiometric SI engines: premixed and direct injection. Premixed fuel control technology evolved from carburetors to TBI and MPFI systems. Today, most gasoline vehicles use port-injected systems, although increased interest in fuel economy and increased power demands is driving direct injection into mass markets.4
The carburetor’s operation principle for fuel metering is based on the Venturi effect. Air drawn by the engine flows into the carburetor venturi (or throat), where the section reduction creates a low-pressure condition. As a result of this low pressure, fuel flows into the venturi from the fuel reservoir, mixing with the airflow. The ratio is thus controlled by fluid-dynamic condi-tions set on the throttle. The carburetor was adopted around 1910 and improved throughout the 20th century to perform at all engine speed-load conditions and achieve good response at low temperatures. However, its limitation for controlling the air-fuel ratio for all cylinders in a close range, which was needed for NOX emission control on the three-way catalyst, forced its demise in the US by the mid-1980s and in the EU by the early 1990s, leading to the adoption of electronically controlled fueling systems. The carburetor used in passenger cars was abandoned in most markets during the early 2000s.
TBI was introduced in the US around 1980 as the first commercial electronic air-fuel control system in gasoline engines. Rather than relying on fluid-dynamic effects as the carburetor does, the TBI system reacts to commands by the engine control unit and injects the exact amount of fuel the engine requires at each speed-load condition. Although cheaper than more sophis-ticated multi-point systems, the throttle body injection was abandoned because the cost differences were outweighed by performance benefits obtained with multi-point injection systems. Ultimately, TBI was phased out because it had the same fundamental flaw of the carburetor: the inability to control fuel-air distribution for all cylinders at all times.
The stoichiometric SI engine requires a homogenous air-fuel mixture at stoichiometric conditions with early fuel mixing for good fuel vaporiza-tion. The air-fuel management system based on electronically controlled MPFI employs low-pressure fuel injectors to deliver the fuel nearby the intake valve(s) of each cylinder rather than at the throttle. Gasoline is thus precisely supplied to each cylinder intake valve and quickly evaporated before being drawn into the engine.
MPFI is the most widely used method of air-fuel control in current gasoline vehicles. The electronic system requires information from mass airflow measurements to calculate the amount of fuel that is needed for each load–speed condition. One improvement is the use of sequential MPFI
4 According to ICCT data, stoichiometric gasoline direct injection engines account for 14% of all gasoline passen-ger vehicle sold in the EU-27 in 2010.

8
(SMPFI). In conventional MPFI, the fuel is injected at the same time in a bank of cylinders, so the fuel remains inside the manifold until one of the intake valves is open and draws the fuel in and mixes it with air. In sequential mode, the injector delivers the fuel individually to each cylinder while the intake valve is open for better mixing. This is useful during low-rpm idling conditions, to reduce HC and CO emissions, but is not used at high-load/high-speed operation.
Direct fuel injection offers much better volumetric and thermodynamic efficiency than premixed gasoline engines. Instead of delivering the fuel based on air intake, the direct injection directly controls the amount of fuel into the engine, in the same way the diesel engine is controlled. Because power output is controlled directly with fuel supply, there is no need for throttle and therefore, volumetric efficiency is improved. Injecting the fuel directly on the cylinder reduces the mixture temperature and allows for higher compression ratios, resulting in improved thermodynamic efficiency. Although lean operation is possible, most manufacturers are operating at stoichiometric conditions in order to use the same catalytic converters as premixed engines, while avoiding the use of lean-NOX aftertreatment. GDI engines offer better fuel economy and torque than port fuel-injected engines, which is increasing the market share and helping reduce its cost.
engine design Engine design is concerned with technologies to reduce engine out-emissions, especially HC and NOX. Excessive HC emissions are related to unburned fuel, while NOX is related to high in-cylinder temperatures. HC emission improvements are achieved through reducing crevice volumes in the combustion chamber, reformulating lubricants and by variable valve timing and variable ignition timing for cold start control. NOX emissions can be reduced by improving mixture circulation though variable valve timing, fast-burn combustion chambers, and multiple intake and exhaust valves (EPA, 1999).
Intake valve timing and lift affects the way air fuel mixes during the intake stroke, and it can be tailored if variable valve timing technology (VVT) is available, according to engine speed conditions. Variable valve timing can also be used to increase the amount of trapped EGR. VVT technology is used along with variable ignition timing to control emissions during cold start. By delaying the combustion using variable spark timing it is possible to obtain hotter gases that can be used during the cold-start period to warm up the catalytic converter faster for proper aftertreatment operation.
exhaust gas recirculation EGR is an in-cylinder NOX emission control technology used in both gasoline and diesel vehicles. NOX is formed during combustion when gases reach
EmiSSion rEduction tEchnologiES

coSt of EmiSSion rEduction tEchnologiES
9
high temperatures; the higher the cylinder temperature, the more NOX is formed. Thus, the primary strategy to reduce the formation of NOX in the engine is to reduce combustion temperatures using EGR. Inert exhaust gases in the cylinder slow down the combustion process and reduce peak combustion temperatures. Exhaust recirculation can be achieved by recir-culating gases from the exhaust pipe into the intake, or by internal trapping with valve timing. External EGR systems were initially used on most gasoline vehicles in the mid-1970s, and the concept has evolved towards internal trapping of exhaust gases in vehicles with variable valve timing.
2.1.2 Gasoline aftertreatment systems
Aftertreatment emissions control for stoichiometric engines is based on the TWC. A catalyst converter is a ceramic honeycomb structure which walls have been coated with a highly porous material (alumina oxide), containing the precious metals required to activate the desired catalytic reactions.
The TWC is a special kind of converter whose operation is extremely sensitive to air-fuel ratio. The catalyst oxidizes HC and CO into water and CO2, which requires that free oxygen be present in the exhaust gas. However, NOX is reduced by splitting it into nitrogen and oxygen. This process will not proceed if there is excess oxygen already present in the exhaust gases. Thus, the catalyst can handle all three pollutants simultane-ously only at stoichiometric conditions. Minor variations on the rich side can be tolerated, as the catalyst can store oxygen and use it during brief rich variations to maintain efficiency.
Older emission control designs used to deliberately cycle the air-fuel ratio between rich and lean conditions to take advantage of the oxygen storage in the catalyst for HC and CO oxidation. However, any variation on the lean side, no matter how small or short, immediately stops NOX reduction in the catalyst. Thus, modern emission control strategies focus on maintain-ing a stoichiometric air-fuel ratio at all times and minimizing all variations (German, 1995).
Aftertreatment emission control through air-fuel management is based on an integrated system managed by an ECU. The ability of the ECU to deliver the right amount of fuel according to real-time readings of air into the intake system (regulated by throttle position, which is controlled by the driver) depends in evaluating how much excess oxygen is left after combustion. This information is provided by an oxygen sensor, installed downstream of the exhaust manifold. The oxygen sensor determines whether the combus-tion is rich or lean and provides the signal for fuel delivery adjustments. The result is an engine operating much closer to stoichiometric conditions that relies only on fuel delivery based on airflow calculations.

10
Another improvement found in later vehicles is the use of fast response oxygen sensors (also known as heated sensors, HO2S). These sensors allow for better closed-loop control of the air-fuel ratio and can be successfully used to regulate fueling rates during engine cold starts. Cold start periods are one of the most critical for HC and CO emissions, which are easily controllable when the catalytic converter is already warm.
Modern TWCs operating with a stoichiometric air-fuel ratio are highly efficient (more than 95%) but must reach certain temperature to operate properly. Thus, it is extremely important to warm up the catalytic converter quickly (known as the process of reaching catalyst light-off temperatures). One method for fast light-off is delay the ignition timing. Delaying the start of combustion sends burning gases into the exhaust manifold. Once the catalyst is warm enough for proper operation, the spark timing is set for optimized engine performance (Kishi, Kikuchi, Suzuki, & Hayashi, 1999), (Muitsuishi, Mori, Nishizawa, & Yamamoto, 1999).
2.2 DiESEL VEhiCLESNOx and PM are the most challenging pollutants to control in a CI engine. This is due to the use of combustion via compression ignition CI. Diesel lean combustion precludes the use of the TWC to control NOx as on SI engines, due to the excess of oxygen in the exhaust gas stream. Engine-out NOx on the diesel engine is much lower than on SI engines because of lean dilution, but NOx emissions at the tailpipe are much lower on SI engines due to the 99% plus NOx reduction of the modern TWC system. Diesel engine-out PM emissions are much higher than on SI due to the late fuel injection, resulting in relatively poor fuel mixing and vaporization. HC and CO emissions are not usually of concern with diesel engines, as the lean operation reduces engine-out HC and CO emissions and enables high oxidation efficiency in simple oxidation catalysts.
A review of the most important commercial technologies for NOx and PM control includes in-cylinder and aftertreatment technologies. In-cylinder control technologies are used to reduce both NOx and PM emissions. Typical engine-out and aftertreatment technologies for NOx control are: EGR, lean NOx traps (LNT) and selective catalytic reduction (SCR). PM aftertreatment control relies on diesel oxidation catalyst (DOC) and diesel particulate filters (DPF). A brief description of each technology is presented below.
2.2.1 in‑cylinder control of diesel combustion emissions
In-cylinder emission control can be associated in three systems: fuel injection, air handling, and EGR.
EmiSSion rEduction tEchnologiES
coSt of EmiSSion rEduction tEchnologiES
11
Fuel injection systemThe advent of more stringent PM emission levels became one of the main drivers for development of fuel injection systems capable of better fuel metering and timing, while providing improved fuel atomization for better mixing with air. Fuel injection systems evolved from indirect diesel injection (IDI) with mechanically pressurized systems and electric fuel delivery control to high-pressure common rail and unit injectors for direct fuel injection. Improving the fuel injection system for CI direct injection engines involve the use of high-pressure fuel injection with variable injection fuel timing and metering and a redesigned nozzle and piston bowl.
The fuel injection pressure and the rate of fuel injection have been used to control both NOx and PM. Mechanical fuel injection used in pre-Euro 3 vehicles, with fuel injection pressure around 700-800 bar, was discontinued in favor of more precise and flexible electronically controlled unit injectors and common-rail injectors, with injection pressures ranging from 1,300 bar (Euro 3) to 2,000 bar (Euro 5). The high-pressure injection is needed to improve diesel fuel penetration and atomization, and mixing of air and fuel near the nozzle (Su, 1995). The use of EGR also requires an increase in fuel injection pressure to compensate for lower oxygen concentration and reduce the risk of increasing PM emissions (Majewski & Jaaskelainen, 2009).
Fuel injection timing is one of the main initial tools used for NOx control in Euro 1 and Euro 2 vehicles and is still used in advanced engine tuning. The basic concept of injection timing is that advancing fuel injection timing promotes premixed combustion, leading to higher combustion pressures and temperatures, as well as more efficient engine performance and fuel consumption. Higher combustion temperatures lead to higher NOx and lower PM and HC emissions. Delaying the injection of fuel has the complete inverse effect, resulting in higher fuel consumption, lower NOx and higher PM and HC emissions.
NOx, PM and fuel consumption tradeoffs can be minimized by using multiple-injection fuel systems that allow for pilot, main, and late injection of fuel. Multiple fuel-injection strategies can only be performed with high-pressure unit injectors or common-rail injectors. These two injection systems represent the most flexible and most suited for emission control in light duty vehicles.
Electronic unit injectors can be defined as a unit that combines both pump and injector. The engine camshaft powers the pump and the injector timing is controlled electronically. These injectors are capable of pilot and main injections, but are challenged with post injections, which make them deficient for active regeneration of aftertreatment devices (Majewski & Jaaskelainen, 2009).

12
The common rail injection system is composed of a pump that pressurizes a manifold that acts as a feeder for all the fuel injectors. The injection timing and metering is controlled by solenoids, which provides great flexibility for pilot, main, and post injections regardless of engine operational conditions (Majewski & Jaaskelainen, 2009).
Majewski & Jaaskelainen (2009) summarized the multiple injection strate-gies as follows:
• Pilot injection at low pressure is used for NOx and noise control.
• Main injection at high pressure, including rate shaping, can be used to promote fuel burning, reducing PM emissions.
• Late post injections are used to increase exhaust gas temperature for active regeneration of aftertreatment devices (Salvat, 2000).
Electronically controlled fuel metering and timing are fundamental for aftertreatment devices that require active regeneration, such as the DPFs and LNTs. Common-rail systems are the most commonly used in light duty diesel vehicles and hence, the cost of fuel injection systems is focused on the common-rail system.
air handlingAir intake tuning and turbocharger tuning have been used to gain control of the combustion process (Johnson, 2000). Intake air tuning includes special design of swirl and tumble in the combustion chamber; turbocharger tuning is focused on the use of variable geometry turbochargers to provide the right amount of air under specific engine operational conditions.
A turbocharger increases the amount of air delivered into the cylinder. By increasing its density, smaller displacement engines and improved combus-tion efficiency are enabled. Besides the positive effects in power output, the availability of air induces a reduction of PM emissions. Early LDVs (pre-Euro 3) were equipped with wastegate turbochargers, which allowed for good response at high load and low speed. Wastegate turbochargers are designed for low-end torque; at high-load and high-speed conditions, the excess exhaust gas has to be bypassed to the tailpipe through the wastegate valve. More stringent emission standards (Euro 6 and Tier 2-Bin 5) likely require the use of variable geometry turbochargers (VGT), where the turbine geometry, either the nozzle or the turbine ring area, is changed to account for changes in engine speed. The VGT is electronically actuated and requires proper tuning and close integration with the engine ECU.
exhaust gas recirculationEGR is the most significant technology for in-cylinder NOx reduction in diesel-powered engines and is also used in gasoline and natural gas engines.
EmiSSion rEduction tEchnologiES

coSt of EmiSSion rEduction tEchnologiES
13
EGR’s ability to reduce NOx is based on its diluting effect, which works in two ways: principally by reducing the peak temperatures during combustion (NOx formation is proportional to combustion temperatures) and second-arily by reducing the concentration of O2 available for NOx formation.
In CI engines, the EGR fraction is tailored during engine calibration at specific engine operational conditions and may vary from zero up to 30%. At higher load demands the NOx reduction can reach up to 80%. Its application requires careful control of side effects in PM emissions and fuel economy. Niemmi et al. (2004) found that increased EGR fraction cause an increase in particulate numbers and particulate sizes (Niemi, Paanu, & Laur, 2004). Increased nanoparticles emissions (10-50 nm) were reported with EGR addition (Bertola, 2001). The EGR system requires fuel sulfur level below 500 ppm to avoid pipe corrosion with sulfur compounds. Although sulfuric acid condensates in EGR coolers at much lower sulfur levels, the extra cost of special acid-resistant materials prohibit its use beyond that level.
2.2.2 aftertreatment of diesel combustion emissions
Tighter emission levels for NOx and PM are difficult to meet with EGR and in-cylinder emission reduction strategies, requiring aftertreatment control in most engines. The options for aftertreatment NOx control are lean-NOx catalysts, lean NOx traps and SCR with ammonia. PM aftertreatment devices for LDV are diesel oxidation catalysts (DOC) and diesel particulate filters (DPF). Lean NOx catalysts, although significantly researched, have never been commercialized in LD applications and therefore it will not be addressed here.
Lean nox trapsThe LNT is based on materials that can adsorb NOx during periods of low temperature, or lean periods, and then release them during minimal periods (5% of operational time) of rich operation during which they are reduced in a TWC function. According to Majweski (2007) the catalyst washcoat combines three active components, very similar to those found in the TWC: an oxidation catalyst (platinum), a NOx adsorbent (barium oxide, BaO), and a reduction catalyst (rhodium). Low temperature performance (250°-350°C) is critical for LDVs, while heavy-duty LNTs are challenged by high NOx flow at high load-high temperature (Johnson, 2006). Because the regenera-tion period requires available HC in the exhaust stream, the NOx adsorber requires a sophisticated air-fuel management system and tight integration with the engine control unit. Commercial LDV applications of this technol-ogy are found in the Dodge Ram 2007 and VW Jetta TDI in the US and in the Mercedes-Benz E320 in Europe. NOx adsorbers require ultra-low-sulfur diesel (ULSD) fuels, allowing for 70-90% emission reduction levels.

14
selective catalytic reduction SCR systems use ammonia to reduce the exhaust NOx on a catalytic surface. On vehicles, the ammonia comes from the dissociation of a urea-water solution, commercially known as aqueous urea solution (AUS 32) in India, AdBlue in Europe and diesel exhaust fluid (DEF) in the US. Urea is an organic compound synthesized at industrial scale from hydrocarbons. The aqueous solution of urea is injected into the exhaust gas stream, where it evaporates and decomposes into ammonia before the SCR catalyst. Vanadium oxide and zeolite are used as the main base metal catalysts for wide operating temperature. Zeolite has been reported by several research groups as more promising due to its better low-temperature efficiency and high-temperature durability (Johnson, 2006).
The primary advantages of SCR systems are high conversion efficiencies regardless of the engine-out NOx and tolerance for sulfur content above ULSD for vanadium oxide and some zeolite catalysts. It should be noted that some zeolite catalysts are susceptible to poisoning from sulfur levels above 30 ppm (Girard, 2008). Because SCR systems can reach NOx emission reduction efficiencies up to 95%, it allows for the engine to be tuned at higher engine-out NOx levels for higher engine efficiency and lower PM generation.
Several European manufacturers of heavy-duty (HD) engines have selected SCR systems for NOx control under Euro IV and V emission levels. In Japan all four major engine manufacturers of HD diesel vehicles use SCR for NOx emission control. In the light duty sector the low-tem-perature performance (cold start) is the main focus of research, and has proven critical for Euro 6 application, where the low exhaust temperature during the NEDC requires the use of ammonia storage capabilities in the substrate (Grumbrecht, 2007).
Generally, SCR systems developed for vehicle applications in Europe, China and India employ a catalyst based on vanadium oxide, which are not very effective at low exhaust temperatures found during low load operation. If a DPF with active regeneration is used with an SCR system, the catalyst is generally required to be based on zeolites (more expensive than vanadium oxide) due to its ability to withstand the extra thermal load from the DPF regeneration process (Johnson, 2009).
The main drawback of using SCR for NOx emission control is the in-use compliance and enforcement. Failure to keep the DEF levels and proper concentration during normal vehicle operation will render the SCR ineffec-tive. Under this circumstance there will be high NOx output, especially if the vehicle has been tuned for maximum fuel economy and high-NOx, low-PM emissions. The European regulation has approached this problem with warnings and controls that impose an engine torque limiter if the DEF level or composition falls outside requirements. Another concern with SCR is that
EmiSSion rEduction tEchnologiES

coSt of EmiSSion rEduction tEchnologiES
15
the urea will freeze in cold weather, generally requiring heating for the urea tank and heating or draining for the lines.
A collateral effect of using SCR systems in engines tuned for low PM emissions is that the in-cylinder measures for PM control are enough for Euro 4 and 5 without using particulate filters. Although these engines may be able to comply with PM levels, ultrafine particles, which have been the focus of many studies due to suspected high toxicity, are not controlled (HEI, 2002; Araujo, 2008).
diesel oxidation catalyst The DOC uses precious metals such as platinum and platinum-palladium (Pt/Pd) to oxidize HC, CO and the soluble organic fraction (SOF) of PM. PM emission reduction is highly dependent on the relative fraction of SOF to total PM. During low load driving cycles, the SOF fraction is large and the PM reduction can reach 50%, but DOCs are not effective in PM control in high temperature cycles due to low SOF fraction in the PM (<10%).
DOCs are also used to increase the NO2 fraction in the exhaust to enable continuous DPF regeneration and provide better SCR low-temperature efficiency. NO is oxidized in the DOC into NO2, and therefore the fraction of NOx, which is normally around 90% NO before the DOC, changes to 50% after the DOC under medium to high load conditions.
DOCs were the first commercial technology for PM abatement implemented in Europe for light-duty Euro 3 levels (in 2000). Use of DOCs was possible due to the introduction of 500 ppm sulfur diesel in 1996 (DieselNet, 2003). For HD applications in the United States, the DOC was introduced in 1994 but later discontinued with the advent of electronically controlled engines. DOCs are in many cases an integral part of the DPF.
diesel particulate filterDPF technology is based on the ability of the DPF substrate to physi-cally trap the solid fraction of PM, including soot. The substrate can be configured as a flow trough or a wall flow device. Flow-trough PM filters do not accumulate as much solid PM as wall- flow filters and therefore render PM reduction efficiencies around 40-70%. Thus, they are also commonly referred to as partial or open filters. Flow-through PM filters are mainte-nance free without interacting with engine functions, which render them ideal for retrofit applications (Majewski W. A., 2002).
Wall-flow PM filters achieve PM reduction efficiencies higher than 95% due to its ability to accumulate the solid fraction of PM, including ultrafine particles (Majewski, 2002). The accumulation of PM solid fraction needs to be carefully monitored to avoid increasing exhaust backpressure, which directly reduces engine performance.

16
The process of removing the accumulated PM is called filter regenera-tion, and it can be passive (also known as continuous regeneration) or active. Passive regeneration is achieved through constant oxidation of the deposited material using NO2 generated in a DOC located upstream the filter. For active regeneration the emission control system uses late fuel injections—if available—or fuel burners upstream from the DPF. In light-duty applications, the DPF was first introduced (voluntarily) in the EU for Euro 3 regulations. It was a PM filter with active regeneration based on late injection strategies and fuel additives (Salvat, 2000).
EmiSSion rEduction tEchnologiES

17
The information presented in this section was gathered from governmental agencies, technical journals (SAE technical papers), industrial associations and commercial literature. Regulatory agencies gather all the relevant documents associated with each specific regulation, including impact assessments and responses from stakeholders and the industry, to evaluate the technical feasibility of more stringent emission limits. The set of technologies from these impact assessment and response documents were used to define a first draft of technologies required for each of the regulatory requirement levels. Journal articles and available literature from industrial and technical associations and manufacturers were later used to refine the set of technologies for each compliance level and fuel type. Expert representatives from Honda, Corning, Johnson Matthey, and European and American manufacturers’ associations provided invaluable inputs that helped us define the technology pathways for each regulatory program.5
The set of technologies required for LDVs is presented for each set of regula-tions (EU and US) by compliance level (Euro 1 to 6 and US Tier 1 to 2) and by fuel type (diesel or gasoline).
3.1 euroPean reGuLaTionsThe light-duty vehicle category studied here is comprised of passenger vehicles and light commercial vehicles (categories M1 and N1, respectively). M1 passenger vehicles have a vehicle mass not exceeding 3,500 kg and carry fewer than nine passengers. N1 vehicles are commercial vehicles (goods transport) with a mass not exceeding 3,500 kg.6
The technologies required for each of the European stages, Euro 1 through Euro 4, were partially taken from a summary of a Ricardo report found on the website of France’s Interprofessional Technical Center for the Study of Air Pollution, or CITEPA (CITEPA, 2009). Euro 5 and 6 required emission control technologies were found in the Euro 5 impact assessment document presented by the commission staff to the European Parliament (EU, 2005). That document also incorporates comments and reviews from the European industry and other stakeholders. The set of technologies for these regulations
5 Personal communications with Dirk Bosteels of the Association for Emission Control by Catalyst (AECC) on emission control technologies for European regulations; Ichiro Sakai of Honda on gasoline emission control technologies; Tim Johnson of Corning and Joe Kubsh of the Manufacturer Emission Control Association (MECA) on diesel emission control technologies; and Michael J. Russ of Johnson Matthey on catalyst technologies.
6 Commercial vehicles weight categories are defined using the term reference mass (RW), defined as the mass of the vehicle in running order less the mass of the driver of 75 kg and increased by a mass of 100 kg.
3. TEChnoLogiES REquiRED foR EaCh of ThE REguLaToRy LEVELS

18
tEchnologiES rEquirEd
was verified and corrected with relevant technical papers and commercial literature. A summary of the findings is presented below.
3.1.1 Gasoline technologies
The shift from carbureted engines to electronically controlled fuel injection systems requires the use of mass air flow (MAF) or manifold absolute pressure (MAP) sensors for air-flow measurement and an integrated ECU. The cost of ECU and air-flow measurement sensors is not accounted for in the emission cost evaluation, because the improvements in electronics (ECU and sensors) are considered as improvements in performance, reliability, and drivability of the vehicle.
Emission control technologies for gasoline-powered vehicles are focused on stoichiometric air-fuel control and three-way catalytic (TWC) system improvements. One characteristic that defines the evolution of the TWC is the amount of platinum group metals (PGMs) used in the catalyst.7 Information about PGM loading for each regulatory level in terms of historic and current (estimated) catalyst loadings is presented here for each emission level. Details on historic PGM loadings for TWC are presented in Appendix B.
EuRo 1 anD 2
Technologies required for compliance with Euro 1 emission levels are based on the universal application of TWC for gasoline vehicles. The TWC require the use of a single oxygen sensor for keeping the time-averaged concentration of oxygen in the exhaust atmosphere around stoichiometric conditions (exhaust oxygen concentration around zero). Electronic ignition substituted for the use of electromechanical distributors used in older models.
Euro 2 standards are accompanied by a shift towards MPFI. EGR is introduced for NOx control in some of the Euro 2 larger vehicles and light duty trucks (CITEPA, 2003). Today, it is expected that Euro 1 and 2 vehicles will have MPFI technologies, a basic ECU and TWC operating with a single O2 sensor; EGR might not be required in today’s Euro 2 vehicles given advances in engine tuning and electronic integration between the air-fuel management and the TWC system, but the technology is included here as a conservative measure.
EuRo 3
Emissions control systems for LDVs have evolved significantly from Euro 2 systems due to the elimination of the warm-up period (40 seconds) during tests on the New European Driving Cycle (NEDC) that was implemented starting in 2000. Thus, cold start emission control becomes the main focus of pollutants control for Euro 3-compliant vehicles.
7 Platinum (Pt), palladium (Pd), and rhodium (Rh) are the most used PGMs for autocatalyst applications.

coSt of EmiSSion rEduction tEchnologiES
19
In response to these conditions, in-cylinder and aftertreatment control technol-ogies change from Euro 2 (CITEPA, 2003). Regarding in-cylinder technologies, air-fuel control and EGR are the main tools. Air-fuel control systems for gasoline vehicles are improved with electronic controls for fuel injection and ignition-spark timing. As a result, MPFI technology is positioned as the main technology for fuel delivery across all gasoline vehicle classes. Tighter controls on NOx values require the use of EGR systems for most gasoline LDVs.
Aftertreatment improvements for Euro 3 gasoline vehicles focus on TWC and oxygen sensors. The elimination of the warm-up period and tighter standards for HC and CO emissions require the addition of a close-coupled (CC) catalyst for cold start, in addition to the underfloor (UF) catalyst. The CC catalyst composition demands higher palladium loading than the UF catalyst (see Appendix B). Cold start requirements also prompted the use of low thermal capacity manifolds to improve CC catalyst warm-up. Oxygen sensor technology has evolved into more responsive heated oxygen sensors (HO2S). On-board diagnostics (OBD) systems required in Europe for Euro 3 vehicles, prompt the use of secondary oxygen sensors after the catalyst to monitor its performance.
EuRo 4
Emission standards requiring 50% reduction in NOx and HC from Euro 3 levels require technological developments for Euro 4 compliance levels of gasoline vehicles. Manufacturers meet the Euro 4 emission levels challenge with improvements in fueling strategy, EGR control strategies, and changes in the TWC formulation. Cold-start emissions become critical for Euro 4 applications because of the reduction in emissions levels and the lack of a warming period during the test cycle. Cold-start issues are corrected by combining the use of flexible fueling MPFI systems with a CC catalyst with improved formulations. Details on TWC formulation changes are detailed in Appendix B. The ignition and fueling strategy are adjusted following the engine start-up to deliver more heat and warm-up the catalyst rapidly for cold-start emissions control. NOx is controlled during combustion with EGR during low-load operation.
EuRo 5/6
Gasoline standards change little from Euro 4 to Euro 5, with only a 25% reduction in NOx and no change in HC and CO standards. The mild reduction in NOx emissions is met with combustion improvements through engine calibra-tion and incremental improvements in air-fuel management and EGR control. Sensing capabilities were also improved with the adoption of universal wide-range oxygen sensors.
Euro 6 emission limits for gasoline vehicles were not changed from Euro 5 values for port fuel-injected gasoline vehicles. Therefore, the technologies for emission control remain the same as for Euro 5 vehicles. However, the adoption of mandatory fuel economy (FE) standards, fuel price escalation, and the body of incentives derived from environmental policies caused the market to shift

20
towards more fuel efficient vehicles and has provided a fertile soil for new fuel efficient technologies.
One significant vehicle technology shift caused by CO2 emission regulations is demonstrated by the market growth of stoichiometric ignition direct injection (SIDI) technology, commercially known as gasoline direct injection (GDI). Given that direct injection would tend to produce higher amounts of PM than port fuel injected engines, specific emission standards for Euro 5 and 6 GDI engines regulating particulate mass have been placed; a particulate number emission standard for Euro 6 GDI is still under discussion as of writing of this report. Although GDI technology is not covered by the scope of this report, it is expected that PN standards would require the use of a combination of advanced fuel injection strategies and aftertreatment through wall-flow particu-late filters. The cost of gasoline particulate filters (GDF) for GDI vehicles has been addressed and made public by the ICCT (ICCT, 2011).
3.1.2 diesel technologies
Diesel technologies for LDVs have steadily gained market share in Europe, from about 23% in 1994 (Euro 1) to surpassing the 50% mark in 2006 (ACEA, 2010). The shift in emission control technology is more complex than the gasoline case, including improvements and adoption of new technologies for in-cylinder control and aftertreatment systems. In-cylinder control developments involved new technologies for fuel injection control, air management, exhaust gas recirculation, and redesigns in geometry of nozzles, cylinder bowl, valves and intake manifolds. Aftertreatment emissions control included a series of new technologies that were progressively employed and combined in light-duty diesels, such as DOC, DPF, LNT, and SCR.
EuRo 1 anD 2
Technologies required for compliance with Euro 1 emission levels are based on mechanical rotary pump fuel injection systems, indirect fuel injection and exhaust gas recirculation. Historically, most of the Euro 1 European engine fleet was naturally aspirated (not turbocharged); mechanically activated EGR circuits were introduced in those vehicles for NOx control.
During the Euro 2 regulations, manufacturers started the shift from mechani-cal injection to electromechanical that eventually led to the phasing out of mechanical injectors altogether to meet Euro 3 requirements. Electronic fuel timing and metering became the dominant technology. Indirect injection was still a significant technology for Euro 2 light-duty diesel engines. Turbocharging started spreading among the larger size light-duty diesel engines.
Historically, aftertreatment through oxidation catalyst was introduced as a commercial tool for odor and hydrocarbon emissions control on Euro 1 and 2 diesel vehicles, which were mainly IDI engines (Koltsakis and Stamatelos, 1997). For current Euro 2 vehicles, advances in direct fuel injection technology
tEchnologiES rEquirEd

coSt of EmiSSion rEduction tEchnologiES
21
are expected to provide PM engine-out emission levels compliant with Euro 2 standards. Thus, for the purposes of this report, the fuel injection technol-ogy for current Euro 2 vehicles is based on a rotary pump with electronic assistance for fuel metering and less than 900 bar of injection pressure. The use of oxidation catalysts is not expected, as improvements in rotary pumps and in-cylinder control have presented significant advances in the last decade. NOx emission is controlled with cooled EGR.
EuRo 3
The elimination of the warm-up period (40 seconds) during tests on the new European driving cycle (NEDC) makes evident that cold start emission had become the main focus of pollutants control for Euro 3 diesel compliant vehicles. To achieve pollution compliance, the focus has been placed on improving fuel injection systems with electronic control and actuation and higher injection pressures.
Euro 3 diesel vehicles require fuel injectors capable of electronic fuel metering and timing, a significant improvement compared to cam-controlled injectors that are part of the rotary fuel injection system. The main characteristic of Euro 3 fuel injection systems, whether common-rail or unit-injector systems, is the high fuel pressure delivered by the injector (1,300 bar), which improves air-fuel mixing and reduces PM emissions. Historically, the first generation of common-rail fuel injection system started gaining market share in Europe among larger passenger vehicles.
PM reductions obtained in-cylinder with higher fuel injection pressure in combi-nation with aftertreatment based only on oxidation catalysts allowed passenger vehicles to achieve PM emissions compliance. NOx emissions are controlled with cooled, electronically controlled and solenoid-operated EGR.
EuRo 4
Emission levels requiring 50% reduction in NOx and PM for diesel vehicles demanded new technological developments for Euro 4 compliance levels. The answer to achieving these emission levels lay for improvements in fuel injection technology and the addition of air management technologies for improving air-fuel mixing without requiring the use of aftertreatment beyond a simple oxidation catalyst.
Euro 4 vehicles are fitted mainly with common-rail systems with injection pressure in the range 1,300-1,600 bar. These fuel injection systems have variable fuel timing and metering strategies. Turbocharging with intercooling is used in combination with common-rail to improve the mixing of air and fuel, allowing for reducing engine-out PM emissions. Intercoolers are required to reduce the intake air temperature for better performance and to reduce combustion temperatures for lower NOx.

22
NOX emissions are controlled with cooled EGR. The EGR system, high-pressure type, is improved over Euro 3 technologies, with a DC motor actuator for improved flow metering according to specific engine operational conditions (Johnson, 2011).
Aftertreatment with oxidation catalysts is employed for treating the soluble organic fraction of engine-out PM. The Euro 4 diesel standard for PM does not require the use of particulate filters for compliance. However, some manufactur-ers have offered the additional DPF as a positive environmental incentive.8
EuRo 5
Diesel vehicles’ compliance with Euro 5 standards, facing an 80% reduction by mass in PM emission from Euro 4 levels, requires a combination of in-cylinder and aftertreatment control. In-cylinder PM control is based on high-pressure fuel injection, air management, and EGR. Aftertreatment systems are developed in parallel with engine tuning for an integral system solution to the emission problem.
In-cylinder control is technically demanding, as low engine-out NOX and, especially, low PM emissions have to be achieved in order to reduce the after-treatment system requirements. Common rail fuel injection at 1,600-1,900 bar, with variable injection timing and metering, is used to provide low engine-out PM; the fuel injection flexibility provided by the common rail is used on the aftertreatment system regeneration with late fuel injections. The flexibility of the common-rail system is matched with a variable geometry turbocharger (VGT) for improved air-fuel management in large vehicles.
NOX emission levels, reduced by 28% from Euro 4, are controlled with combus-tion improvements stemmed from pilot injection and with cooled high-pressure EGR. The cooler system was made larger and a bypass system for temperature control was added to it.
Aftertreatment control is based on using a combination of DOC and DPF with active regeneration. As emission control becomes more stringent, technologies such as variable fuel timing is adopted and integrated with the aftertreatment system. Variable fuel injection timing is used for DPF active regeneration through injection delay.
EuRo 6
Reductions of PM by 10% and the introduction of particulate matter control by number (PN), starting early for Euro 5 since 2011, requires the use of a combination of in-cylinder and aftertreatment measures. In-cylinder control measures require continuous research and development in combustion, including multimode fuel injection strategies at higher injection pressures
8 Although not required by emission standards, Peugeot and Citroën offered diesel vehicles in France with DPF. In Germany, the “No Diesel without Filter” environmental campaign resulted in manufacturers voluntarily fitting DPFs on all new diesel passenger cars.
tEchnologiES rEquirEd
coSt of EmiSSion rEduction tEchnologiES
23
(around 1,900-2,100 bar) and VGT to deliver tailored amounts or fuel and air at specific operational conditions. Aftertreatment is based on DOC and wall-flow DPF. Engine and aftertreatment require full integration, from design to testing and tuning, for achieving the right balance on perfor-mance, fuel economy and emissions.
Very low NOX emission levels, reduced by 66% from Euro 5 increase the attrac-tiveness of NOX aftertreatment devices, in addition to in-cylinder measures such as cooled EGR. Aftertreatment NOX control for Euro 6 light-duty vehicles will likely be based whether on LNT or SCR technology. LNTs, used currently in light duty diesels in the US, have shown good NOX reduction performance and durability, at the level of SCR systems (Johnson, 2009); LNT requires diesel sulfur concentration below 15 ppm. SCR has been widely used since 2005 in European HDVs and has been adopted in LDVs with large engines.
The advantage of LNT compared to SCR is that it may be more economical for engines with displacements below 2.5-3.0 liters (Kubsh, 2007) and may be more acceptable to customers, as it does not require periodic filling of urea. The specific technology used (SCR or LNT) depends also on fuel economy strategies that are covered under CO2 emission or fuel economy standards. As an example, SCR may be used to improve fuel economy and CO2 emissions, through engine tuning for low PM and high NOX in-cylinder emissions. Manufacturers will likely choose the NOX aftertreatment technol-ogy based on a combination of cost, expertise, reliability, fuel economy, and consumer acceptance.
According to personal communications with experts on this field, it is possible to achieve Euro 5/6 levels for NOX with in-cylinder control (Bosteels, 2010; T. Johnson, 2010). This is done with aggressive EGR strategies and by reducing the engine compression ratio. NOX formation is directly related to combustion temperatures; thus, combining EGR with low compression ratio (around 13) keeps combustion pressure and temperature below the threshold for NOX formation. This kind of technology is currently promoted by Mazda (Popular Mechanics, 2010). However, it should be noted that engine-out NOX emissions rise rapidly at higher engine loads. Thus, an in-cylinder NOX control strategy without aftertreatment could lead to high in-use NOX emissions, as NOX emissions during high engine loads might not be captured during the NEDC test cycle.
3.2 uS REguLaTionEmission control technology has evolved rapidly since the federal Clean Air Act (CAA) amendments of 1990. Emission standards applicable to 1990 model year vehicles, commonly referred to as Tier 0, required roughly 90% reductions in exhaust HC and CO emissions and a 75 percent reduction in NOX emissions compared to uncontrolled emissions. Tier 1 standards were published in June 1991 and phased in between 1994 and 1997. In 1999, the National Low Emission

24
Vehicle standard (NLEV) was adopted, based on California emission regula-tions. Tier 2 standards were phased in from 2004 to 2009.
These sets of standards apply to new LDVs including passenger vehicles, light duty trucks, sport utility vehicles (SUVs), minivans and pick-up trucks with a gross vehicle weight rating (GVWR) of less than 8,500 pounds.9
Emission control for diesel vehicles is discussed only for Tier 2 levels due to the low market share of diesel LDVs in the US before 2007 (below 2% since 1985).
3.2.1 Gasoline vehicles
us Tier 1Gasoline Tier 1 vehicles are similar to Euro 3 vehicles. Gasoline powered Tier 1 vehicles require the use of multipoint injection systems for accurately control-ling the amount of fuel to the cylinders. Federal OBD regulations adopted with Tier 1 regulations made mandatory the use of secondary oxygen sensors for TWC performance monitoring for durability. Tier 1 vehicles only need one set of oxygen sensors, regardless of engine configuration.
us national Low emission vehicle standardThe most significant technologies to achieve low emission levels in gasoline-powered vehicles were improvements in traditional catalysts, with faster warm-up capabilities and substantially more durable than earlier technologies. Fuel metering was enhanced with sequential fuel injection techniques, allowing for regulated amounts of fuel during cold start and low to mid load-speed. Faster data processing, dependent on ECU processing speed, was required for better response to changing conditions.
The steep reduction on NMHC emission levels (71%) required that the TWC be separated in CC and UF positions for most vehicles. The CC catalyst is designed to control high HC emissions during cold start operation while withstanding high temperatures due to its proximity with the engine. Special washcoats were developed for high temperature operation. PGM loading was distributed between CC and UF catalyst. The CC catalyst was loaded mainly with relatively large amounts of Pd for HC oxidation. The UF catalyst was loaded with Pt for further oxidation of HC and CO, and Rh for NOx reduction (Heck, Farrauto, & Gulati, 2009).
EGR was introduced in many six- and eight-cylinder LD vehicles for control of NOx during low to mid loads. Current gasoline systems do not require EGR cooling for proper operation due to the relatively small amount of EGR used.
9 GVWR is defined as the vehicle weight plus rated cargo capacity.
tEchnologiES rEquirEd

coSt of EmiSSion rEduction tEchnologiES
25
In addition to air-fuel and TWC work, improvements were made to base engine designs, which resulted in lower engine-out emissions. Reduction of combustion chamber crevice volumes and oil consumption are examples of improvements targeting reduction in HC emissions.
us Tier 2Emission control technologies for Tier 2 vehicles require continuous improve-ment with respect to previous NLEV vehicles; the technology used in these vehicles was based on air-fuel and aftertreatment improvements. Emission control calibration was found to be a key element as an integrator of engine-out, air-fuel management and the aftertreatment system for reducing NOx by 70% below NLEV levels.
Sequential fuel injection and variable spark timing was required for all engine sizes. The air-fuel monitoring function was integrated with O2 sensor-based closed-loop operation for improved HC emissions, which may increase with EGR addition. EGR systems were used on virtually all vehicles, as manufacturers were able to improve efficiency and emissions at the same time.
Regarding TWC systems, there was an intense research on formulations and the deposition of PGMs in specific layers, to avoid metal to metal sintering derived from thermal aging and to optimize the oxidation/reduction function. According to historic records, the use of Pt was reduced in favor of Pd, which was more available and less expensive. The improvements on oxygen storage components (OSC) not only reduced the thermal impact on emission reduction deterioration, but also increased the air-fuel operational window, especially for Pd.
The configuration (number and location) of oxygen sensors in the vehicle depends on engine size and configuration (I4, V6, V8). Engine with double bank of cylinders such as some large six-cylinder and most eight-cylinder engines require a double bank catalyst system: one CC catalyst and UF catalyst per bank of cylinders. In addition, the number of oxygen sensor (heated) is doubled to cover each leg of catalysts.
3.2.2 diesel technologies
Tier 2‑Bin 5New diesel LDVs have been gaining market share in the United States, growing from 0.1% in 2007 to 2.0% in 2009, according to the Transportation Energy Data Book (US Department of Energy, 2010). The few models available in the US market are used here to define the technology requirements for US compli-ance. The set of technologies required for compliance in these vehicles is very similar to technologies assumed for Euro 6 diesel vehicles.
Tier 2-Bin 5 diesel engines for LDVs require electronically controlled common-rail fuel injection systems with injection pressures around 1,800-
26
2,100 bar. Good fuel atomization due to high-pressure fuel injection and good mixing with air improves PM emissions. Cooled EGR systems are used for low in-cylinder NOx emissions.
All diesel engines require turbocharging, but depending on engine size, it is fitted with variable geometry capabilities and/or intercooling. This is a key part of the air-fuel management strategy for low PM emissions, which reduces the requirements for aftertreatment.
NOx aftertreatment is a requirement for current US Tier 2-Bin 5 LD vehicles. DOC is required for oxidation of HC and the SOF fraction of PM, while additionally is the source of NO2 for PM regeneration. The DPF is a fundamental requirement, and its regeneration can be accomplished via passive regeneration (requiring catalyzed DPF) or via late fuel injections (active regeneration). The systems currently in the market combine the catalyzed DPF with regeneration via late injection of fuel. LNT or SCR systems are used for NOx aftertreatment.
Engines with four cylinders, below 2.5 liters displacement, most likely use LNT systems, which have proven effective and durable in HD applications. For larger engines, high PGM loading increases the cost of LNT above the cost of SCR systems due to the linear dependence of PGM cost on engine displacement, as will be presented in the cost section.
In the US market, the VW Jetta TDI, 2.0 L, is an example of aftertreatment emission control technology for Tier 2-Bin 5 requirements. The MY2009 TDI has a DOC, DPF, LNT, and a post-H2S oxidation catalyst after the LNT. The operation of the aftertreatment section is tightly integrated with the air-fuel management system and the EGR system. DPF is regenerated via in-cylinder fuel post-injec-tion, which is governed by the ECU. The system is equipped with several sensors, including two temperature sensors, one pre-DOC and pre-DPF; a heated oxygen sensor on the DOC and a wide-range universal gas exhaust oxygen (UEGO) sensor after the LNT; and a pressure differential sensor for the DPF (VW, 2009).
Diesel vehicles with six-cylinder engines and engine displacement of 3.0 liters or more are using SCR systems for emission control of NOx. Mercedes-Benz, is offering three different models with AdBlue (urea solution) technology for 3.0 liters-plus diesel vehicles (Mercedes-Benz, 2010). A set of sensors similar to the Jetta TDI is needed in this kind of vehicles, plus additional sensors and hardware needed in the urea injection system.
3.3 TEChnoLogy SummaRyTable 3–1 and Table 3–2 summarize the basic technologies required for gasoline and diesel vehicles, respectively, to comply with Euro 1 trough Euro 6 emission levels of conventional pollutants. The tables are structured to show the tech-nologies required to advance to the next emission level. Table 3–3 and Table 3–4 show the technology requirements for US regulations for gasoline and diesel vehicles, respectively.
tEchnologiES rEquirEd

coSt of EmiSSion rEduction tEchnologiES
27
Table 3–1 Gasoline Ldv technology requirements for control of conventional pollutants. eu regulations
GasoLinePassenGer cars and coMMerciaL vehicLes (M1, n1), Max WeiGhT < 3500 kG
euro 1 To euro 2 euro 2 To euro 3 euro 3 To euro 4 euro 4 To euro 5 euro 5 To euro 6
regulated pollutants
CO / HC+NOX CO / NOX / HC CO / NOX / HC CO/ NOX / HC/ (PM*)
CO/ NOX / HC/ (PM*)
emissions target, g/km
2.2 / 0.5 2.3 / 0.15 / 0.2 1.0 / 0.08 / 0.1 1.0/ 0.06 / 0.1 / (0.005)
1.0/ 0.06 / 0.1/ (0.005)
emissions reduction
20% / 50% -5% / 25% / 33% 57% / 50% / 50% 0 / 25% / 0 / - 0 / 0 / 0 / -
Base technology and comments
Basic euro 1: • Three-way catalyst
located underfloor (UF)
• O2 sensor (non-heated)
• Electronic injection • Electronic ignition• Multi-point fuel
injection (MPFI)• Some vehicles
(small ones) achieve Euro 1 with throttle body injection (TBI). Larger vehicles may require MPFI
Based on euro 2 technology • Introduction of OBD
requirements
Note: Elimination of first 40-second warm-up period during the test cycle (NEDC 2000) presents cold start challenges
Based on euro 3 technology
Based on euro 4 technology• Increased market
share of gas direct injection (GDI) lean combustion- forces regulation to include PM emissions levels for GDI vehicles
Based on euro 5 technology• Conventional
pollutants control same as Euro 5 technologies.
• Improvements focused on fuel economy (FE)
engine‑out emissions, air‑fuel management
• TBI to MPFI requires the use of fuel injectors (one per cylinder), improved sensor response and control algorithms (ECU)
• Some vehicles (larger ones) require using EGR for NOX control at mid-loads.
Note: Today, the use of EGR for Euro 1-2 vehicles might be waived depending on the air-fuel and TWC system performance.
• Heated O2 sensors (HO2S) required for improved response during cold start
• A second O2 sensor is required for OBD
• Use of EGR is extended to most vehicles
• Improved controller and hardware
• Low thermal capacity manifolds for cold start.
• Improved fueling strategy to keep close-coupled (CC) catalyst at right temperature range for cold start emissions control
• Increased use of electronically controlled EGR for NOX control during mid-low load operation
• Some vehicles (midsize to large and luxury models) may require the use of UEGO sensors
• Combustion system improvements (R&D)
• Variable valve timing (VVT)
same as euro 5• UEGO sensors
might be used for improved A/F control and FE
• Combustion system improvements (R&D)
• Turbocharging and downsizing (FE)
• Hybridization (FE)
• Weight reduction (FE)
aftertreatment system, TWc
• Higher catalyst PGM loading or increase in catalyst volume with respect to Euro 1 technologies
• The elimination of warm-up period and increased restriction on HC and CO emissions required the addition of a close-coupled (CC) catalyst; cold start catalyst in some vehicles
• Increased use of Pd for CC catalysts.
• Highercatalyst PGM loading or increase in total catalyst volume CC+UF
• Improvements in washcoat technology allows for PGM reduction
• Increased oxygen storage components (OSC) capacity allows for PGM reduction
• Improved coating techniques (double-layer TWC)
same as euro 5 for port fuel injected gasoline engines. GDIs will require particulate filters (GPF).
*PM standards for gasoline direct injection (GDI) engines only

28
Tab
le 3
‑2 d
iese
l Ld
v t
echn
olo
gy
req
uire
men
ts f
or
cont
rol o
f co
nven
tio
nal p
ollu
tant
s. e
u r
egul
atio
ns
die
seL
Pass
enG
er c
ar
s a
nd
co
MM
erc
iaL
veh
icLe
s (M
1, n
1),
Ma
x W
eiG
hT
< 35
00
kG
eur
o 1
To
eu
ro
2eu
ro
2 T
o e
ur
o 3
eur
o 3
To
eu
ro
4eu
ro
4 T
o e
ur
o 5
eur
o 5
To
eu
ro
6
reg
ulat
ed p
ollu
tant
sH
C+N
OX /
PM
/ C
ON
OX /
PM
/ C
O /
HC
*N
OX /
PM
/ C
O /
HC
*N
OX /
PM
/ C
O /
HC
*N
OX /
PM
/ C
O /
HC
*
emis
sion
s ta
rget
, g/k
m0
.7 /
0.0
8 /
10
.5/
0.0
5/ 0
.64
/ 0
.06
0.2
5/ 0
.025
/ 0
.5/
0.0
50
.18/
0.0
05/
0.5
/ 0
.05
0.0
8/0
.00
45/
0.5
/ 0
.09
emis
sion
s re
duct
ion
38%
/ 5
5% /
%68
- /
37.5
% /
36%
/-50
% /
50
% /
22%
28%
/ 8
0%
/ 0
66%
/ 10
%/
0
Bas
e te
chno
logy
and
co
mm
ents
Bas
ic e
uro
1:•
Fue
l inj
ectio
n sy
stem
s:
bas
ed o
n R
otar
y or
d
istr
ibut
or p
ump
. Fue
l m
eter
ing
and
tim
ing
are
m
ech.
op
erat
ed. F
uel
met
erin
g/t
imin
g v
aria
tion
was
lim
ited
to
spec
ific
load
-sp
eed
con
diti
ons.
•
Mec
hani
cal o
r el
ectr
ical
fuel
co
ntro
l
•In
dire
ct d
iese
l inj
ectio
n (I
DI)
co
mb
ustio
n•
Low
pre
ssur
e in
ject
ion
(70
0-8
00
bar
)•
EG
R b
ased
mos
tly o
n lo
w-p
ress
ure
mec
hani
c op
erat
ion
Bas
ed o
n eu
ro 2
te
chno
logy
•So
me
vehi
cles
stil
l use
ID
I (30
% o
f PC
mar
ket)
, m
ostly
sm
alle
r d
iese
l ve
hicl
es.
Not
e: E
limin
atio
n of
firs
t 4
0-s
econ
d w
arm
-up
per
iod
d
urin
g t
he t
est
cycl
e (N
ED
C
200
0)
pre
sent
s co
ld s
tart
ch
alle
nges
Bas
ed o
n eu
ro 3
te
chno
logy
•
DI b
ecom
es t
he s
tand
ard
te
chno
log
y
Bas
ed o
n eu
ro 4
te
chno
logy
Em
issi
on c
ontr
ol h
eavi
ly
focu
sed
on:
•
Air-
fuel
man
agem
ent
and
com
bus
tion
syst
em
imp
rove
men
ts (
R&
D)
•E
ngin
e tu
ning
and
m
app
ing
Bas
ed o
n eu
ro 5
tech
nolo
gy•
PM
con
trol
will
like
ly
follo
w t
he u
se o
f DO
C +
D
PF.
•N
OX c
ontr
ol w
ill d
epen
d
hig
hly
on in
-cyl
ind
er
com
bus
tion
and
CO
2 em
issi
on r
equi
rem
ents
. U
sing
SC
R m
ay b
e b
enefi
cial
for
larg
e en
gin
es (
Vd
~3 li
ters
) b
ecau
se t
he e
ngin
e ca
n b
e tu
ned
for
hig
h F
E a
nd
low
PM
em
issi
ons.
engi
ne ‑o
ut e
mis
sion
s,
a/F
man
agem
ent
•E
CU
bas
ed c
ontr
ol•
Rot
ary/
dis
trib
utor
pum
p
with
ele
ctro
nic
assi
stan
ce.
•E
lect
roni
cally
con
trol
led
ID
I and
DI i
ncor
por
ate
sole
noid
-op
erat
ed v
alve
s fo
r im
pro
ved
fuel
met
erin
g
and
tim
ing
.•
Coo
led
EG
R r
equi
red
in
som
e ve
hicl
es.
•R
otar
y p
ump
inje
ctio
n tim
ing
con
trol
imp
rove
d
(for
col
d s
tart
and
fast
id
le)
•C
omm
on-r
ail s
yste
ms
bec
ame
avai
lab
le fo
r E
uro
3 ve
hicl
es.
•D
I com
b+
hig
h-p
ress
ure
fuel
inje
ctio
n (H
PF
I).
•P
ress
ure
900
-1,3
00
bar
•C
oole
d E
GR
. The
EG
R
syst
em is
ele
ctro
nica
lly
oper
ated
and
inte
gra
ted
w
ith t
he E
CU
.
•H
igh
pre
ssur
e fu
el
inje
ctio
n 13
00
-160
0 b
ar•
Air-
fuel
man
agem
ent
and
com
bus
tion
syst
em
(noz
zle,
val
ves,
pis
ton,
he
ads
geo
met
ry)
imp
rove
men
ts (
R&
D)
•E
ngin
e tu
ning
and
m
app
ing
•Fo
ur v
alve
s p
er c
ylin
der
•
Turb
ocha
rgin
g w
ith
inte
rcoo
ling
•*C
oole
d E
GR
with
DC
m
otor
act
uato
r
•H
igh
pre
ssur
e fu
el
inje
ctio
n 16
00
-190
0 b
ar•
Var
iab
le g
eom
etry
tur
bo.
(V
GT)
for
imp
rove
d a
ir-fu
el m
anag
emen
t fo
r la
rge
vehi
cles
.•
Var
iab
le fu
el in
ject
ion
timin
g fo
r D
PF
act
ive
reg
ener
atio
n th
roug
h in
ject
ion
del
ay•
Var
iab
le v
alve
tim
ing
(V
VT)
may
als
o b
e us
ed
for
DP
F r
egen
erat
ion
and
imp
rove
d F
E
•H
igh
pre
ssur
e fu
el
inje
ctio
n 18
00
-210
0 b
ar•
Dua
l loo
p, c
oole
d E
GR
sy
stem
s w
ith m
otor
ac
tuat
or•
Com
bus
tion
rese
arch
P
CC
I, LT
C•
Var
iab
le g
eom
etry
tu
rboc
harg
er (
VG
T) m
ay
be
used
in m
ost
pas
seng
er
cars
and
com
mer
cial
ve
hicl
es. I
mp
rove
s fu
el
econ
omy
(FE
)
aft
ertr
eatm
ent s
yste
ms
•D
OC
for
PM
red
uctio
n (S
OF
frac
tion)
sam
e as
eur
o 3
•A
lthou
gh
not
req
uire
d
for
Eur
o 4
com
plia
nce,
so
me
vehi
cles
wer
e fit
ted
with
DP
F in
ad
vanc
e of
Eur
o 5
reg
ulat
ions
.
•D
OC
+ D
PF
•
DP
F is
reg
ener
ated
th
roug
h ac
tive
or p
assi
ve
reg
ener
atio
n w
ith h
igh-
tem
per
atur
e ex
haus
t d
owns
trea
m t
he D
OC
an
d t
akin
g a
dva
ntag
e of
its
NO
2 yie
ld.
stro
ngly
dep
ends
on
Fe
appr
oach
•D
OC
+DP
F+L
NT
•
if 1.4
< V
d <
2.5
L•
DO
C+D
PF
+SC
R
•if
Vd
> 2.
5-3.
0L
* E
stim
ated
fro
m N
OX a
nd N
OX+
HC
sta
ndar
ds
diff
eren
ces.
tEchnologiES rEquirEd

coSt of EmiSSion rEduction tEchnologiES
29
Table 3‑3 Gasoline Ldv technology requirements for control of conventional pollutants. us regulations
GasoLineLiGhT duTy vehicLes, GvW < 3500 kG
Tier 1 To nLev nLev To Tier 2‑Bin 5
regulated pollutants CO / NOX / NMHC CO/ NOX / NMHC
emissions target, g/km 2.6/0.186/0.056 2.6/0.043/0.056
emissions reduction - / 76% / 70% - / 76% /-
Base technology and comments Basic Tier 1: (stoichiometric combustion)• Three-way catalyst located under-
floor (UF)• Heated O2 sensor (HO2 sensor)• Electronic injection • Electronic ignition• Multi-point fuel injection (MPFI)
Based on NLEV technology
engine ‑out emissions a/F management
• Sequential MPFI evolved from continuous MPFI
• Electronic EGR• Engine modifications and Engine
calibration• Secondary O2 sensor (HO2S) for
OBD requirements is also used for closed loop during start-up and cold start.
• Some vehicles (larger ones) require using EGR for NOX control at low and mid loads
• Improved controller and Hardware• Closed loop control• Some vehicle (midsize to large and
luxury models) may require the use of UEGO sensors
• Large vehicles (six- to eight-cylinder) require one set of O2 sensors per bank of cylinders.
• Combustion system improvements (R&D)
• EGR for NOX control at low and mid-loads for all vehicles
• Variable valve timing (VVT)
aftertreatment system, TWc • Close-coupled and underfloor catalyst.
• Exhaust system was thermally and leak improved
• Higher cat. PGM loading or increase in catalyst volume
• A set of CC and UF catalysts per bank of cylinders is required in larger vehicles (6-8 cylinders)
• Higher cat. PGM loading or increase in catalyst volume
• Improvements in washcoat technology and increased oxygen storage components (OSC) capacity allows for PGM reduction
• Improved coating techniques (double-layer TWC)

30
Table 3‑4 diesel Ldv technology requirements for control of conventional pollutants. us regulations
dieseL
LiGhT duTy vehicLes, GvW < 3500 kG
nLev To Tier 2‑Bin 5
regulated pollutants NOX / PM / CO
emissions target, g/km 0.04/ 0.006 /2.5
emissions reduction 88% / 83% / -
Base technology and comments
Based on Tier 1 technology:• High-pressure unit injector systems and turbocharging.
Distributor pump is not used due to PM emission limitations.• Electronically controlled EGR with intercooling for
NOX control.• DOC for HC control. No DPF required.
emission control heavily focused on: • Air-fuel management and combustion system
improvements (R&D)• Engine tuning and mapping
engine ‑out emissions a/F management
• Electronically controlled high-pressure common-rail fuel injection 1,900-2,100 bar, with flexible fuel injection timing/rate.
• Tumble and swirl control (electronic operated valve)• Variable geometry turbo. (VGT) for improved air-fuel
management for large vehicles.• Variable fuel injection timing for DPF active regeneration
through injection delay• Variable valve timing may also be used for DPF regeneration,
and improved FE
aftertreatment systems aftertreatment bundles by engine size:• DOC + DPF, Vd < 1.4 L• DOC+DPF +LNT 1.4 < Vd < 2.5 L• DOC+DPF+SCR, Vd~3.0L
The selection of each technology bundle depends on performance and Fe approach• DPF is regenerated through active regeneration (late fuel
injection) or through passive regeneration with NO2 yield from the DOC.
tEchnologiES rEquirEd

31
The previous section defined the set of technologies required, in general terms, for the control of criteria pollutants in each of the regulatory levels according to EU and US emission levels. This section presents an indirect cost assessment of those technologies. It is an indirect cost assessment because the total cost of technologies is only known to manufacturers. Government agencies can request specific cost information under confiden-tiality agreements for regulatory purposes. Usually the regulatory agency hires a consulting company for estimating the cost; the consulting company estimates the technology required and obtains prices from suppliers. Suppliers only know the pricing of their particular components. Beyond that, there are only a very few scattered sources of information. Manufacturers are understandably unwilling to share cost information because of competi-tive concerns. The primary source of cost data for this report was, therefore, found in public reports from government agencies.
However, the technology cost assessment that regulatory agencies do is a projection into the future, and therefore its accuracy is limited. In most cases the estimated technology requirements from regulatory impact assessments are not able to account for future technology developments and improvements, meaning that the final summation for technology cost is often inflated. This is especially true for catalyst technology, which has seen previously unimagined improvements. A detailed review for each source was required for more accurate results.
It should be noted that the cost of technologies would vary over time and geographic location. It is universally accepted that this cost tends to fall due to increases in volume and improvements in manufacturing. Cost reduction would be expected in countries where regulatory programs allows for reduced durability or where some regulatory components are temporally waived; one example is the technology required for OBD, which is often delayed with respect to the corresponding EU or US regulation timeline.
4.1 SouRCES of infoRmaTionThe costs of technologies associated with emission regulation compli-ance in the US and EU was initially estimated from information obtained from regulatory impact assessment studies performed by environmental agencies, for the US and the EU regulations. Information from US agencies was much more detailed than that from the EU, so the US cost structure and relative values were used to supplement the cost information from the EU in cases where it was not available.
4. EmiSSion REDuCTion TEChnoLogy CoSTS

32
For the US regulations, the sources of values for emission reduction costs were found mostly in the US Environmental Protection Agency (EPA) and the California Environmental Protection Agency Air Resources Board (CARB) regulatory impact analysis (RIA) documents. Each RIA correspond-ing to each amendment of the CAA assessed technical feasibility and its corresponding cost and cost effectiveness. The purpose of each RIA is to examine the technical feasibility of controlling the vehicle emission beyond the level of control provided by the existing regulation with the existing technology. The reports analyze the emission reduction achieved by the actual regulation with the available technology, propose new limit values, and assess the corresponding set of technologies that help achieve the proposed values. This process of technology and cost analysis involves vehicle manufacturers, emission reduction technology manufacturers, the academy, and government agencies.
The expected costs of implementation of technologies for Tier 1, NLEV and Tier 2 regulations from corresponding RIA documents were used in this report as the base for final actual estimates
The information available for estimating the cost of implementing regula-tions in Europe was found only in the Euro 5 impact assessment document presented by the commission staff to the European Parliament (EU, 2005). Besides that document, some detailed information was found for LDVs in a doctoral thesis comparing the environmental impact of new on-road technologies (Kolke, 2004).
4.2 mEThoDoLogy The methodology employed in this report is as follows. First, the set of technologies and its cost figures were extracted from previously described impact assessment studies and organized by engine/vehicle size. Second, the set of technologies depicted on those forecast studies were compared against technologies that were actually required for each of the regulatory levels of compliance, for each of the engine/vehicle categories. The source of information for this post-evaluation was found in technical papers (SAE Technical Papers principally) and public documents and websites from manufacturers associations and other academic sources. Third, the cost of each of the technologies identified was converted to 2011 US dollars and, when possible, compared and averaged with scattered information found in public literature and on websites. Fourth, the cost figures inferred from such a wide spectrum of sources were condensed into a table, which was reviewed by a small group of representatives of emission control industries and vehicle manufacturers.
The assessed cost figures were structured based on the cost method followed in US regulatory agencies. This method indicates that the cost of emission reduction technologies can be divided into variable and indirect
EmiSSion rEduction tEchnology coStS

coSt of EmiSSion rEduction tEchnologiES
33
costs. The former are due to hardware costs. The latter include support costs, such as research and development, administrative and legal costs; and other costs related to machinery investments, vehicle development, and operations.
Technology cost values used in this assessment covered several sources. In some cases, the values were available from RIAs, which were updated and treated according to the US cost methodology. In other cases, values were found as a single number in public domain documents or provided by reviewers without any specific details or detailed cost structure. In those cases, the figure was treated as a hardware cost, and some indirect costs were added following good engineering judgment.
Cost values for certain emission control technology were not available from previously described sources, so an alternative approach was taken. Average commercial prices were obtained from several auto parts or supplier websites and then corrected by dividing the number by a fixed factor. This fixed factor scales the commercial price to the manufacturer cost. The factor should be at least equal to the retail price equivalent (RPE) value used by the automotive industry.10
The fixed factor used in this cost assessment was 2.5. This value closely matched the cost of some specific items found in RIAs with commercial prices cited on auto parts retailers’ websites. In addition, the same 2.5 value was used in the non-road diesel engines impact assessment to set the warranty cost of spare parts (commercial value) based on manufacturing costs (EPA, 2004).
Another important methodological issue faced in this assessment exercise is the treatment of technologies that are used not only for emission control but also for vehicle operation or performance. Those technologies, such as fuel injectors and turbochargers, received a special cost treatment. The estimated cost for these technologies was divided between emission control cost and performance and operation. For diesel vehicles, the fraction assigned to cost for fuel injection systems and turbochargers was 50%; for gasoline vehicles, given that the port fuel injection does not have a role as significant as the common rail for the diesel engine, the fraction for emission was assigned as 33%. These cases are clearly identified in the cost tables.
It is evident that the cost of emission control devices depends on specific vehicle technologies. Diesel and gasoline LDVs were analyzed indepen-dently according to their specific emission reduction technologies. Special
10 The RPE is defined as the share of direct manufacturing costs and all other items that affect the bussines of auto manufacturing (EPA, 2009). According to the EPA report, RPE values range between 1.46 and 1.49 across different manufacturers. The same report cites RPE values from different authors ranging from 1.5 for outsourced components manufactured up to 2.0 for products manufactured and produced internally by vehicle manufacturers (EPA, 2009). The values for RPE presented before are describing cost associated with large volume manufacturing. The values obtained from auto parts retailer websites clearly do not enjoy the cost benefits of large manufacturing volumes, and for this reason a larger factor was used in this report.

34
attention was paid to aftertreatment devices used in gasoline and diesel vehicles: TWC, DOC, DPF, LNT and SCR. For these technologies, a special structure was employed to calculate their costs.
In addition, the assessment includes discounts for technologies that will likely experience cost reductions due to process learning and volume sales. It is universally accepted that technologies that are entering the market tend to experience a quick drop in manufacturing costs due to increases in volume sales and constant improvements in the production process. The US EPA uses in its cost analysis volume and learning reduction factors ranging form 10% per doubling of production volume to 1-3% per year of manufacturing cost reduction from learning (EPA, 2010). Thus, technologies such as DOC, DPF, LNT, and SCR benefit from 10-20% reduction assuming long-term costs assessment; in contrast, the TWC cost does not receive cost reduction given that that technology is mature, and that the small reduction by process improvement, or learning, fall within the uncertainties of this cost assessment.
4.3 gaSoLinE VEhiCLES ESTimaTED EmiSSionS ConTRoL CoSTS
The technology required for gasoline vehicles for each of the regulatory levels was presented in the previous section (Table 3–1 and Table 3–3). In this section, the cost of each gasoline technology is presented. In-cylinder control technology cost is presented first, and then the cost of aftertreat-ment devices. The cost of in-cylinder control technologies is presented in terms of variable (hardware) costs and indirect, fixed costs (R&D, tooling and certification).
4.3.1 Gasoline hardware costs
in‑cylinder controlFor gasoline-powered vehicles the most important element for control-ling both in-cylinder emissions and catalyst efficiency rests in the air-fuel management system. Besides air-fuel control, the in-cylinder control also involves EGR control and ignition timing. The hardware required for in-cyl-inder control is composed of oxygen sensors, fuel injectors and physical components of the control system, physical changes in engine components, the EGR system and the ignition system.
CoST of oxygEn SEnSoRS
The study covers three different type of oxygen sensor: unheated (O2S), heated (HO2S) and universal oxygen (UEGO) sensors. A typical 4-cylinder vehicle has an O2 sensor before the TWC. Six and eight cylinder vehicles usually require one O2 sensor for each bank of cylinders, depending on the emission level. The use of O2 sensors improves air-fuel control and hence also improves fuel economy and performance. The use of additional O2
EmiSSion rEduction tEchnology coStS

coSt of EmiSSion rEduction tEchnologiES
35
sensors downstream of the catalyst was mandated by OBD requirements implemented with Tier 1 vehicles in the US and Euro 3 in the EU. The selection of HO2S or UEGO sensors for air-fuel control depends on manu-facturer’s control strategies.
O2S are legacy sensors, not used currently in new vehicles for American or European markets. The cost used in this report was obtained by averaging auto parts retailers’ prices for O2S used in popular older vehicles, and dividing that number by 2.5.11 The estimated cost was $16 each. This number matches the cost figures reported by Kolke (2004). The cost of HO2S was found in RIAs corresponding to NLEV and Tier II regulations. The values reported in those documents were verified with the auto parts retailer method. The estimated cost for HO2S was $20. The cost for UEGO sensors was obtained by taking the auto parts retailers’ costs for high-sales vehicles, and dividing that number by 2.5, resulting in a cost of $33. In this report a minimum set of oxygen sensors required for emissions control is presented for each engine size and regulatory level, including OBD sensors.
CoST of fuEL injECTion SySTEm
Euro 1 standards were achieved with TBI systems in small vehicles. A single injector for TBI was assumed for engines with a displacement volume of less than 2.0 liters. MPFI became dominant in Euro 2 vehicles for all vehicle sizes. Individual fuel injectors by cylinder are required for MPFI systems, which also require a fuel rail, which conveys fuel to each injector and assures that enough is available for all cylinders at the time the injectors are open. There are one or two rails per engine depending on engines configuration: one rail for in-line engines (four-cylinder) and two rails for V-engines (six- and eight-cylinder engines). Fuel injector costs for MPFI systems were estimated to be $15 each; the number comes from an average of commercial auto parts prices corrected by the method explained earlier, and from technical reviewers’ data (Johnson, 2011). The single fuel-rail cost for MPFI systems was estimated to be $31, from commercial auto parts prices. The summation of injectors and rail assembly were estimated to be $91, $152 and $182 for four-, six-, and eight-cylinder engines, respectively. However, this is only a partial account of the gasoline fueling system, which also includes airflow sensors, air pressure sensors, and other components that were nonexistent in carbureted engines and that were added for cold start enrichment. An extra 30% is added to each engine type, accounting for additional components for an approximated total fuel system estimate of $120, $200, and $240. Additional information on total fuel injection system costs was provided by Johnson (2011), who suggested $250 for Euro 3-compliant four-cylinder vehicles, including cold-start capabilities. The average of estimated and suggested costs is used as the baseline cost. Given that the
11 The 2.5 factor is used throughout this report to estimate the cost to manufacturer from auto parts retailers’ prices as explained in the methodology section.

36
fuel injection system is not devoted exclusively to emission control, but also to performance (drivability) and fuel economy, only 33% of the cost is allocated to emission control. Thus, the costs allocated in this report to emission control for I-4, V-6 and V-8 vehicles were $65, $93, and $123, respectively. A 20% discount was applied to Euro 1, 2 and Tier 1 vehicles, as those vehicles do not require cold start controls. The cost for TBI systems, $16, was assumed as one-fourth of the cost corresponding to MPFI vehicles.
CoST of inDiViDuaL CyLinDER fuEL ConTRoL anD faSTER miCRopRoCESSoR
MPFI requires the right amount of fuel being injected at the right time. Besides the cost of hardware, proper fuel injection techniques require engine calibration and tuning with the air management system. The cost associated with engine calibration and tuning is charged in the fixed cost section, under R&D. However, improving individual fuel control requires faster processing capacities for the ECU, which was included in the hardware cost as faster microprocessing. The cost of faster microprocessing, $4, was obtained from Tier 1, NLEV, and Tier 2 RIAs.
CoST of EnginE moDifiCaTionS
Engine modification costs include improved hardware for emissions control by changes in geometry and materials of engine parts such as pistons, piston rings, valves, and cylinder crevices; and additional hardware, such as air-injection, swirl control valves, or additional spark plugs. The assessment of hardware improvement costs for this report was found to be extremely chal-lenging, and therefore the values used for the final estimates correspond to data found in regulatory documents. Engine modifications costs range from $15 to $20 per vehicle, based on inflation-corrected values from California’s LEV program impact assessment (California Air Resources Board, 1996).
CoST of EgR SySTEm
The cost of the basic EGR system includes a mechanically operated (vacuum-assisted) valve and piping. The cost of the mechanical EGR system was estimated on $25 after correcting auto parts commercial prices for a 1996 US vehicle (Rockauto, 2010). This kind of technology for EGR systems was assumed in the cost assessment for Euro 1 and 2 vehicles. More stringent regulations required the redesign of the mechanical EGR valve and the adoption of electronic controls through solenoid valves. The cost of EGR system modifications was estimated to be $14, based on inflation-corrected values from the LEV program impact assessment (CARB, 1996).
CoST of DELaying SpaRk Timing
Delayed spark timing was implemented to increase exhaust temperatures for faster catalyst light-off as part of combustion strategies for emission control. It requires an electronic ignition system, instead of the electro-mechanical distributor, which provides a unique set of ignition timing. The
EmiSSion rEduction tEchnology coStS

coSt of EmiSSion rEduction tEchnologiES
37
electronic ignition system offers improved reliability and flexibility. The electronic ignition system cost was not included in the cost study because it was considered as a fundamental part of modern vehicle operation, and its implementation was driven not by emission control requirements but by vehicle improvements. The spark timing adjustment for emission control was considered in the study as part of the engine calibration. Costs associated with spark timing delay were included in engine tuning R&D.
aftertreatmentThe cost of aftertreatment systems for gasoline stoichiometric engines covers the cost of the three-way catalyst and required accessories.
CoST of ThREE-way CaTaLyST
The TWC cost was assessed based on analyses of PGM loadings and manu-facturing costs for TWCs, including substrate, washcoat, canning, and other manufacturing costs. A summary of the estimated TWC cost is presented here for each regulatory level. Details regarding the TWC cost estimation are presented in Appendix B.
The first step was to perform a technical literature survey on TWC technolo-gies adopted for European and US emission standards. The information gathered covered PGM loading, ratio of engine displacement to catalyst volume, and other technical specifications. The values obtained from literature sources reflect the characteristics of TWC used for each set of standards at the time of publication.
The literature survey allowed identifying historic PGM loadings along the years of applications of different regulatory levels in the US and EU. In addition, the study helped identify the catalyst volume (CV) ratio and its configuration on the vehicle, i.e., CC or UF. Additional information on catalyst washcoat technology and manufacturing was used to understand the cost reduction associated with constant improvements along these years of using TWC for emission control in gasoline passenger vehicles
The PGM loading figures presented in Table 4–1 represent an average by regulatory level found in technical literature. Details are provided on Appendix B. These values are considered as historic PGM loading. It is notable that the cost of PGM loading decreases over time, even though the stringency level increases. This trend suggests that continuous improve-ments in technology allow for cheaper and more efficient TWC. If fuel sulfur levels below 50 ppm are provided, recent technical literature suggests that ultralow PGM loading is possible, with adequate durability, due to major improvements in OSC formulation, washcoat layering, and PGM zoning (Aoki, et al., 2009; Iwakuni, Miyoshi, & Takami, 2009; Pfahl, Rice, Kramer, & Bruestle, 2009).

38
Table 4–1 historic PGM loading for TWc systems based on sae Technical Papers survey
PGM LoadinG us reGuLaTions eu reGuLaTions
g/L Tier 1 NLEV Tier 2 Euro 1 Euro 2 Euro 3 Euro 4 Euro 5 Euro 6
Pt 1.0-1.4 0.15-0.90 0.10 1.00 1.00 0.6-0.7 - - -
Pd 0.7-2.5 1.8-4.0 1.3-2.6 - - - 0.60 0.60 0.60
rh 0.20 0.1-0.2 0.1-0.2 0.20 0.20 0.10-0.15 0.10-0.15 0.13-0.18 0.13-0.18
However, historic PGM loading data do not provide direct information on the cost of present-time TWC systems. The purpose of the study is to set a cost base for implementing new regulations at today’s costs, which requires using 2011 prices instead of the prices that correspond to the year of implementation. In countries where the current emission level is Euro 2 or 3 but regulators are planning to move towards Euro 4 or 5/6, the cost associated with the TWC should be assessed with today’s technologies.
The increased costs of PGM for catalytic converters have promoted signifi-cant changes in TWC formulation along the last 30 years. Literature surveys on TWC technologies show that significant efforts were made to improve oxygen storage components and washcoating techniques that allow the most efficient use of low PGM loading at increased durability. Details are provided in Appendix B. Current PGM loading is presented in this report as the estimated PGM loading of a TWC produced with today’s technology and improvements on washcoat formulation and sulfur tolerance.
Current PGM loadings for Euro 5/6 and Tier 2 catalyst were kept within historic values. Current PGM loading for pre-Euro 5 and pre-Tier 2, which are less stringent, were estimated to be less than Euro 5/6 and Tier 2 PGM values, respectively. Note that the use of Pd was not cited in literature for Euro 1-3 TWC technologies, but reducing the Pt values for those standards and replacing them with Pd was the technology option for Euro 4 catalysts, and therefore the use of Pd was likewise assumed as a viable option for current Euro 1-3 technologies. According to literature on catalyst technol-ogy, the reduction of lead content in gasoline allowed the use of Pd, which is very sensitive to lead poisoning (Heck, Farrauto, & Gulati, 2009).
Table 4–2 shows the estimated PGM loading used in this report for gasoline LDVs. Note that Pd replaces Pt in Euro 1 to Euro 3, as gasoline lead content has been reduced in almost all countries. However, even though Pt seems to be not used in recent European TWC developments, it is kept in the PGM mixture given that other literature sources still consider Pt use in some CC catalysts (Heck, Farrauto, & Gulati, 2009).
EmiSSion rEduction tEchnology coStS

coSt of EmiSSion rEduction tEchnologiES
39
Table 4‑2 estimated current PGM loading for TWc systems
PGM LoadinG us reGuLaTion eu reGuLaTion
g/L Tier 1 NLEV Tier 2 Euro 1 Euro 2 Euro 3 Euro 4 Euro 5 Euro 6
Pt 0.10 0.10 0.10 0.10 0.10 0.10 0.10 0.10 0.10
Pd 1.00 1.30 1.60 0.50 0.50 0.60 0.60 0.70 0.70
rh 0.10 0.10 0.10 0.10 0.10 0.10 0.10 0.10 0.10
Based on the estimated current loading, the cost of PGM for a TWC produced with today’s PGM price can be calculated. Given that the prices of PGMs oscillate constantly, the figures used in this report are based on a five-year average price (2006-10). The price data was obtained from the Johnson Matthey website Platinum Today (Jonhson Matthey, 2011). The five-year average prices were calculated as Pt: $43/g, Pd: $11/g, Rh: $135/g.12
The cost of PGM loading for a vehicle with an engine displacement volume (Vd) depends on a catalyst design parameter known as swept volume ratio (SVR). The SVR is the ratio between CV and Vd. Catalyst technical literature shows that SVR values vary from 0.8 to 1.2 (see Appendix B for more details). Although SVR numbers are currently around 0.8 for Tier 2 and Euro 5/6 vehicles (Johnson, 2011), this report assumes a conservative SVR equal to 1.0. It was also assumed that earlier regulatory stages currently in place in some countries/regions would require smaller and less expensive systems. Therefore, SVR was decreased by 5% for each preceding European level and by 10% for each US level. Table 4–3 presents the estimated cost of PGM loading for US and EU regulations, assuming a Vd of 2.0L. The PGM cost per liter of engine displacement was estimated to be between $20 and $25 for European standards, and around $25 and $35 for US standards. It should be noted that the catalyst industry adjusts the relative PGM formulation (Pt/Pd/Rh) according to market price variations, aiming for constant PGM cost per liter of catalyst.
12 Nominal market prices over the last five years have steadily increased for Pt and Pd, and have been highly vola-tile for Rh. The nominal price per gram of Pt and Pd increased from $37 and $10, respectively, in 2006 to $52 and $17 in 2010. The price per gram of Rh went from $146 in 2006 to $210 in 2008, then fell to $79 in 2010.

40
Table 4‑3 estimated PGM loading and cost for each regulatory level for current technology, vd= 2.0 L
TWc cosT uniTsus reGuLaTions eu reGuLaTions
Tier 1 nLev T2‑B5 euro 1 euro 2 euro 3 euro 4 euro 5 euro 6
Pt average loading g/L 0.10 0.10 0.10 0.10 0.10 0.10 0.10 0.10 0.10
Pd average loading g/L 1.00 1.30 1.60 0.50 0.50 0.60 0.60 0.70 0.70
rh average loading g/L 0.10 0.10 0.10 0.10 0.10 0.10 0.10 0.10 0.10
engine volume, vd L 2.0 2.0 2.0 2.0 2.0 2.0 2.0 2.0 2.0
svr - 0.65 0.9 1.0 0.8 0.85 0.90 0.95 1.0 1.0
catalyst volume, cv L 1.6 1.8 2.0 1.6 1.7 1.8 1.9 2.0 2.0
cost of PGM loading US$ $47 $58 $71 $38 $40 $45 $47 $51 $51
Other costs associated with the TWC are: substrate, washcoat, canning and other manufacturing costs. The cost functions for substrate, washcoat and canning, respectively, were $Substrate= 6.0*Vd+1.92, $Washcoat= 5.0*Vd, and $caning= 2.4*Vd. Sources of cost figures for these items were adapted from informa-tion about oxidation catalysts found in the RIA for emissions control in non-road vehicles (EPA, 2004). The information, corrected for inflation, was analyzed and averaged with information provided by reviewers (Johnson, 2011), (Kubsh, 2011). The cost of the substrate and washcoat was presented as a function of Vd under the same assumptions of the PGM cost. Although these costs vary among manufacturers and between regulatory levels, they were kept constant for each case in this study. Labor cost for TWC was assumed equal for each case. Table 4–4 presents the TWC cost figures found in the study for a 2.0L engine gasoline LDV.
EmiSSion rEduction tEchnology coStS

coSt of EmiSSion rEduction tEchnologiES
41
Table 4‑4 catalyst costs used in light‑duty vehicles, us and eu regulations, vd=2.0 L
cosT iTeMus reGuLaTions eu reGuLaTions
Tier 1 nLev Tier 2 euro 1 euro 2 euro 3 euro 4 euro 5 euro 6
PGM loading $47 $58 $71 $38 $40 $45 $47 $51 $51
substrate $12 $13 $14 $12 $12 $13 $13 $14 $14
Washcoat $8 $9 $10 $8 $9 $9 $10 $10 $10
canning $4 $4 $5 $4 $4 $4 $5 $5 $5
Labor (w. overhead @40%) $6 $6 $6 $6 $6 $6 $6 $6 $6
catalyst cost $77 $90 $106 $68 $71 $77 $80 $86 $86
The catalyst values presented in Table 4–4 correspond to the catalyst as a unit, without differentiating between CC and UF catalysts. It should be noted that this approximation was made to simplify the cost estimation, even though the PGM loading distribution generally varies between the CC catalyst and the UF catalyst. Some vehicles, in particular NLEV, Euro 3 and later models, require the use of a CC catalyst for cold start operation control of HC and CO. The PGM loading of the CC catalyst is composed principally of Pd for HC control during cold start, while the UF catalyst is loaded with Pt and Rh for CO and NOx abatement (Heck, Farrauto, & Gulati, 2009).
The TWC system is configured according to engine size and regulatory level. Small I-4 vehicles generally are fitted with a single UF catalyst, but some, under new regulations, may require an additional CC catalyst (CC+UF). TWC system configurations used for six- and eight-cylinder engines include one CC catalyst per bank of cylinders plus UF (2CC+UF), or double UF (2CC+2UF), mostly for US Tier 2 regulations.
The cost for the CC catalyst was assumed as 40% of the total catalyst cost, and the remaining amount was assigned to the UF catalyst. This is practical simplification, as some of the catalyst component cost would likely vary by the number and size of catalyst, especially canning and substrate costs.
The TWC system, composed of the CC and UF catalyst, was charged with the cost of fitting elements, such as gaskets, flanges and O2-sensor housing parts, and special sheet metal work in the CC catalyst. These extra charge ranged from $5 for single UF TWC up to $30 for vehicles with dual banks of CC catalysts, which require intricate exhaust manifold design to accom-modate the catalyst. The cost of oxygen sensors was not included here but in the air-fuel control cost section.

42
Table 4–5 presents the costs for I-4 European-regulated LDVs and Table 4–6 presents the estimated cost for US-regulated vehicles, including the eight-cylinder vehicle with double exhaust manifold configuration. It should be noted that warranty cost was not included for gasoline control; the reason is that this technology is mature enough and its claim rate was assumed within the uncertainty of this cost exercise.
Table 4‑5 TWc system costs for eu vehicles with four‑cylinder engines
cosT iTeM
vd = 1.5 L vd = 2.5 L
euro 1
euro 2
euro 3
euro 4
euro 5/6
euro 1
euro 2
euro 3
euro 4
euro 5/6
TWc sysTeM conFiGuraTion uF uF cc+uF cc+uF cc+uF uF uF cc+uF cc+uF cc+uF
1. catalyst cost
Close-coupled catalyst (a) - - $24 $25 $27 - - $38 $39 $42
Underfloor catalyst (b) $53 $55 $36 $37 $40 $83 $87 $57 $59 $63
2. Fitting
CC accessories - - $10 $10 $10 - - $10 $10 $10
UF accessories $5 $5 $5 $5 $5 $5 $5 $5 $5 $5
3. catalyst + fitting costs [1+2]
Single CC - - $34 $35 $37 - - $49 $51 $55
Single UF $58 $60 $41 $42 $45 $88 $92 $64 $67 $73
Dual CC - - - - - - - - - -
Dual UF - - - - - - - - - -
4. Total TWc system (d) $58 $60 $75 $77 $82 $88 $92 $109 $113 $120
(a) CC catalyst = 0.4*Catalyst cost. Catalyst cost includes only PGM, substrate, washcoat and canning.
(b) UF catalyst = 0.6*Catalyst cost. Catalyst cost includes only PGM, substrate, washcoat and canning.
(c) Fitting accessories includes gaskets, flanges and O2-sensor housing parts and integration with exhaust manifold.
(d) Total TWC system cost depends upon system configuration and includes combination of single CC and UF catalysts and their respective fitting accessories costs.
EmiSSion rEduction tEchnology coStS

coSt of EmiSSion rEduction tEchnologiES
43
Table 4‑6 TWc system costs for us vehicles with four‑, six‑, and eight‑cylinder engines
cosT iTeM
4‑cyL, vd = 2.3 L 6‑cyL, vd = 3.2 L 8‑cyL, vd = 4.5 L
Tier 1 nLev Tier 2 Tier 1 nLev Tier 2 Tier 1 nLev Tier 2
TWc sysTeM conFiGuraTion uF cc+uF cc+uF uF cc+uF cc+uF uF 2cc+uF 2cc+2uF
1. catalyst costs
Close-coupled catalyst (a) - $41 $48 - $56 $66 - $77 $91
Underfloor catalyst (b) $87 $62 $72 $118 $84 $99 $162 $116 $137
2. Fitting accessories (c)
CC accessories - $10 $10 - $10 $10 - $20 $20
UF accessories $5 $5 $5 $5 $5 $5 $5 $5 $10
3. catalyst + fitting costs [1+2]
Single CC - $51 $58 - $66 $76 - - -
Single UF $92 $67 $77 $123 $89 $104 $167 $121 -
Dual CC - - - - - - - $97 $111
Dual UF - - - - - - - - $147
4. Total TWc system (d) $92 $118 $136 $128 $155 $180 $167 $218 $258
(a) CC catalyst = 0.4*Catalyst cost. Catalyst cost includes only PGM, substrate, washcoat and canning.
(b) UF catalyst = 0.6*Catalyst cost. Catalyst cost includes only PGM, substrate, washcoat and canning.
(c) Fitting accessories includes gaskets, flanges and O2-sensor housing parts and integration with exhaust manifold.
(d) Total TWC system cost depends upon system configuration and includes combination of single CC and UF catalysts and their respective fitting accessories costs.
CoST of ExhauST SySTEm impRoVEmEnTS
Improvements in the exhaust system usually cover the control of exhaust leakage and heat losses. Better welding and unions are used for leakage control, while the control of heat loss is achieved through improving exhaust system isolation.
Leakage control has been accomplished through the use of corrosion-free flexible couplings and steel piping and improving catalyst welding. The cost associated with this modification was estimated by the EPA at $12-$24 (CPI-corrected), depending on vehicle size (EPA, 1999).
Heat loss control is important because it helps in the warming-up process of the catalyst during cold start operation. Laminated, thin-walled exhaust

44
pipes and doubled walled low thermal capacity manifolds are used for this case. The cost of improved exhaust pipes was estimated by the EPA as $1.20 per foot (CPI-corrected), and improved manifolds’ cost was estimated at $24 to $48 (EPA, 1999).
4.3.2 Fixed costs: r&d, Tooling and certification
Fixed costs in this report cover research and development, tooling, and certification associated with in-cylinder emission control, following the methodology from the EPA for this kind of cost assessment (EPA, 1999). The method assumes around $6 million per vehicle line, which is composed of 100,000 vehicles. R&D cost primarily covers an estimated number of engineering staff and development vehicles. The $6 million figure covers 25 engineer-years (at $60 per hour) and about 20 vehicles (at $100,000 per vehicle).
Information about tooling and certification is scarce. The only example available that covers the topic was found in the RIA for US Tier 2 (EPA, 1999). The estimated figure for industry-wide certification for new regulatory levels (NLEV to Tier 2) was about $17.9 million, corrected for inflation. From that report, it can be inferred that the EPA estimated the cost of tooling and certification at $11 to $14. It was assumed that these costs are similar regard-less of regulatory step, as certification costs are ongoing and tooling costs are amortized, so a flat cost of $12 was used for all regulatory steps.
The costs of some R&D projects for emission control, taken from regulatory impact analysis corresponding to LEV and Tier 2 regulations, are presented in Table 4–7. Those values were adapted in this report as a way to account for fixed costs associated with technology development.
EmiSSion rEduction tEchnology coStS

coSt of EmiSSion rEduction tEchnologiES
45
Table 4
‑7 r&
d increm
ental costs fo
r light‑d
uty vehicles in the us fo
r nLe
v and
Tier 2 levels
Tier
1 To
nLe
v (19
94
)
en
Gin
ee
rin
G sTa
FF r
&d
en
Gin
ee
rin
G
sTaFF c
osT
r&
d v
eh
icLe
c
osT
ad
diTio
na
L e
qu
iPM
en
TTo
TaL c
osT
r&
dTo
TaL c
osT
r&
dd
isTriB
uTe
d
ov
er
:To
TaL
Pe
r c
ar
Pe
rso
n‑
yr
Pe
rso
n‑
hr
usd
(Th
ou
san
d)
usd
(Th
ou
san
d)
usd
(Th
ou
san
d)
usd
(Th
ou
san
d)
@ u
sd 20
11 (Th
ou
san
d)
100
,00
0
ca
rs*5
ye
ar
s@
usd
20
11
imp
roved
precisio
n fuel co
ntrol
816
,64
09
98
00
99
814
3750
0,0
00
2.88
aF
develo
pm
ent9
18,720
112330
06
014
2320
49
500
,00
04
.10
ad
vanced P
d
catalysts12
24,9
60
149
710
00
024
97
3596
500
,00
07.19
catalyst
durab
ility &
develo
p.
1531,20
018
72150
00
33724
855
500
,00
09
.71
Total
549
128
00
60
829
1119
3950
0,0
00
23.88
nLe
v To
Tie
r 2
(199
9)
en
Gin
ee
rin
G sTa
FF r
&d
e
nG
ine
er
inG
sTa
FF co
sT r
&d
ve
hic
Le
co
sT a
dd
iTion
aL
eq
uiP
Me
nT
ToTa
L co
sT r
&d
ToTa
L co
sT r
&d
disTr
iBu
Ted
o
ve
r:
ToTa
L P
er
ca
r
Pe
rso
n‑
yr
Pe
rso
n‑
hr
usd
(Th
ou
san
d)
usd
(Th
ou
san
d)
usd
(Th
ou
san
d)
usd
(Th
ou
san
d)
@ u
sd 20
11 (Th
ou
san
d)
100
,00
0
ca
rs*5
ye
ar
s@
usd
20
11
catalyst
evaluation
48
,3204
99
40
00
89
91178
500
,00
02.36
eng
ine m
od
ificatio
n6
12,48
074
950
00
1249
1636
500
,00
03.27
individ
ual cylind
er co
ntrol
48
,3204
99
500
09
99
1309
500
,00
02.6
2
Low therm
al cap
acity m
anifold
48
,3204
99
40
00
89
91178
500
,00
02.36
Total
386
9270
0 0
48
95
64
1250
0,0
00
10.6
1

46
Adding the cost of tooling and certification to these two examples, the estimated fixed R&D cost was estimated to be between $24 and $38 per vehicle, with variations depending on the type of engine improvements presented in the technology inventory section. As R&D costs are tied to introduction of specific technologies, they vary depending on the type of engine improvements presented in the technology inventory section.
US Tier 1 R&D costs, besides tooling and certification costs, include the cost of air-fuel development ($7) and catalyst evaluation ($3) and engine modification ($2), for a total of $24. NLEV R&D costs add $24 presented in Table 4–7 with tooling and certification cost for a total of $36. Tier 2 R&D costs for gasoline vehicles were estimated as the added cost of tooling and certification, AF development, advanced catalysts, catalyst durability and development, engine modifications, individual cylinder control, and low thermal capacity manifold, for a total of $42.
Information describing the cost incurred by European manufacturers on R&D for emission control technologies was not available, so the R&D cost associated with US standards was adopted. Euro 1 and 2 R&D costs were assumed equal to the cost of US Tier 1 R&D costs. For Euro 3 gasoline vehicles the extra cost of advanced catalyst development was added for a total of $31. R&D costs for Euro 4, 5 and 6 gasoline vehicles were assumed equal to the cost of Tier 2 vehicles.
4.3.3 CoST SummaRy foR gaSoLinE VEhiCLES
Based on the information gathered describing the technology required for each of the regulatory levels according to EU and US regulations, a summary table was crafted where the cost of technology is presented for each regula-tory level. Included in the table are variable costs (hardware) and fixed cost (R&D, tooling, certification). Because the passenger car market in the EU and light-duty market in the US have different characteristics of engine size and power, the cost summary was divided into three tables.
The first two tables cover the cost of emission control technologies for gasoline vehicles in the EU. Table 4–8 shows the summary for four-cylinder engines with displacement volume below 2.0 liters, and Table 4–9 for four-cyl-inder engines with displacement volume above 2.0 liters. Table 4–10 presents the cost of emission control technologies for LDVs for each regulatory US level according to engine configuration (four, six, and eight cylinders).
EmiSSion rEduction tEchnology coStS
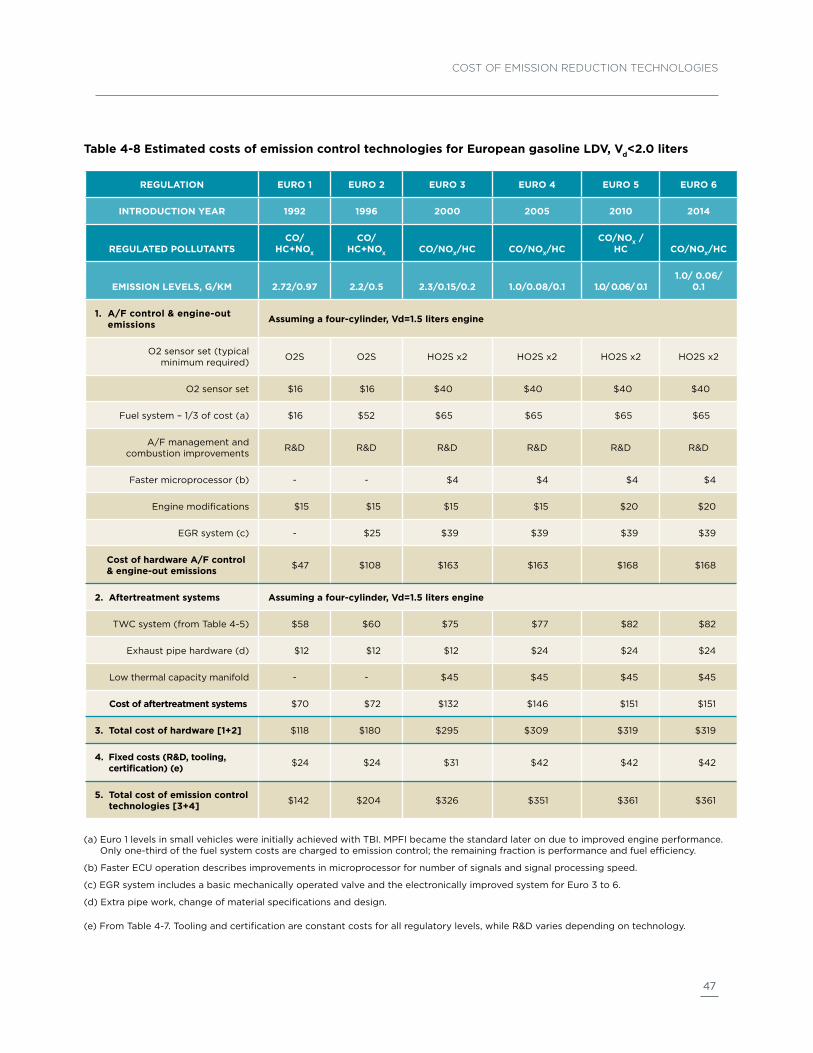
coSt of EmiSSion rEduction tEchnologiES
47
Table 4‑8 estimated costs of emission control technologies for european gasoline Ldv, vd<2.0 liters
reGuLaTion euro 1 euro 2 euro 3 euro 4 euro 5 euro 6
inTroducTion year 1992 1996 2000 2005 2010 2014
reGuLaTed PoLLuTanTsco/
hc+nox
co/hc+nox co/nox/hc co/nox/hc
co/nox /hc co/nox/hc
eMission LeveLs, G/kM 2.72/0.97 2.2/0.5 2.3/0.15/0.2 1.0/0.08/0.1 1.0/ 0.06/ 0.11.0/ 0.06/
0.1
1. a/F control & engine‑out emissions assuming a four‑cylinder, vd=1.5 liters engine
O2 sensor set (typical minimum required) O2S O2S HO2S x2 HO2S x2 HO2S x2 HO2S x2
O2 sensor set $16 $16 $40 $40 $40 $40
Fuel system – 1/3 of cost (a) $16 $52 $65 $65 $65 $65
A/F management and combustion improvements R&D R&D R&D R&D R&D R&D
Faster microprocessor (b) - - $4 $4 $4 $4
Engine modifications $15 $15 $15 $15 $20 $20
EGR system (c) - $25 $39 $39 $39 $39
cost of hardware a/F control & engine‑out emissions $47 $108 $163 $163 $168 $168
2. aftertreatment systems assuming a four‑cylinder, vd=1.5 liters engine
TWC system (from Table 4-5) $58 $60 $75 $77 $82 $82
Exhaust pipe hardware (d) $12 $12 $12 $24 $24 $24
Low thermal capacity manifold - - $45 $45 $45 $45
cost of aftertreatment systems $70 $72 $132 $146 $151 $151
3. Total cost of hardware [1+2] $118 $180 $295 $309 $319 $319
4. Fixed costs (r&d, tooling, certification) (e) $24 $24 $31 $42 $42 $42
5. Total cost of emission control technologies [3+4] $142 $204 $326 $351 $361 $361
(a) Euro 1 levels in small vehicles were initially achieved with TBI. MPFI became the standard later on due to improved engine performance. Only one-third of the fuel system costs are charged to emission control; the remaining fraction is performance and fuel efficiency.
(b) Faster ECU operation describes improvements in microprocessor for number of signals and signal processing speed.
(c) EGR system includes a basic mechanically operated valve and the electronically improved system for Euro 3 to 6.
(d) Extra pipe work, change of material specifications and design.
(e) From Table 4-7. Tooling and certification are constant costs for all regulatory levels, while R&D varies depending on technology.

48
Table 4‑9 estimated costs of emission control technologies for european gasoline Ldv, vd >2.0 liters
reGuLaTion euro 1 euro 2 euro 3 euro 4 euro 5 euro 6
inTroducTion year 1992 1996 2000 2005 2010 2014
reGuLaTed PoLLuTanTs co/hc+nox
co/hc+nox
co/nox/hc co/nox/hc co/nox/hc co/nox/hc
eMission LeveLs, G/kM 2.72/0.97 2.2/0.5 2.3/0.15/0.2 1.0/0.08/0.1 1.0/ 0.06/ 0.1 1.0/ 0.06/ 0.1
1. a/F control & engine‑out emissions assuming a four‑cylinder, vd=2.5 liters engine
Oxygen sensor set (typical minimum required) O2S O2S HO2S x2 HO2S x2 UEGO+O2S UEGO+HO2S
Oxygen sensor set $16 $16 $40 $40 $53 $53
Fuel system – 1/3 of cost (a) $52 $52 $65 $65 $65 $65
A/F management and combustion improvements R&D R&D R&D R&D R&D R&D
Faster microprocessor (b) - - $4 $4 $8 $8
Engine modifications $15 $15 $15 $15 $20 $20
EGR system (c) $25 $25 $39 $39 $39 $39
cost of hardware a/F control & engine‑out emissions $108 $108 $163 $163 $185 $185
2. aftertreatment systems assuming a four‑cylinder, vd=2.5 liters engine
TWC system (from Table 4-5) $88 $92 $109 $113 $120 $120
Exhaust pipe hardware (d) $12 $12 $24 $24 $24 $24
Low thermal capacity manifold - - $45 $45 $45 $45
cost of aftertreatment systems $100 $104 $178 $182 $189 $189
3. Total cost of hardware [1+2] $208 $212 $341 $345 $374 $374
4. Fixed costs (r&d, tooling, certification) (e) $24 $24 $31 $42 $42 $42
5. Total cost of emission control technologies [3+4] $232 $236 $372 $387 $416 $416
(a) Euro 1 levels in small vehicles were initially achieved with TBI. MPFI became the standard later on due to improved engine performance. Only one-third of the fuel system costs are charged to emission control; the remaining fraction is performance and fuel efficiency.
(b) Faster ECU operation describes improvements in microprocessor for number of signals and signal processing speed.
(c) EGR system includes a basic mechanically operated valve and the electronically improved system for Euro 3 to 6.
(d) Extra pipe work, change of material specifications and design.
(e) From Table 4-7. Tooling and certification are constant costs for all regulatory levels, while R&D varies depending on technology.
EmiSSion rEduction tEchnology coStS

coSt of EmiSSion rEduction tEchnologiES
49
Table 4
‑10 e
stimated
costs o
f emissio
n contro
l technolo
gies fo
r us g
asoline Ld
v
Ga
soLin
eLd
v 4
‑cy
L (1.8‑2.5 LiTers)
Ldv
6‑cy
L (2.5‑3.5 LiTers)
Ldv
8‑cy
L (vd>3.5 LiTers)
reG
uLa
Tion
Tier 1
nLev
Tier 2‑B
in 5
Tier 1
nLev
Tier 2‑B
in 5
Tier 1
nLev
Tier 2‑B
in 5
inTr
od
uc
Tion
yea
r1994
200
120
04
‑200
71994
200
120
04
‑200
71994
200
120
04
‑200
7
reG
uLa
Ted Po
LLuTa
nTs
co
/no
x /n
Mh
cc
o/n
ox /n
Mh
cc
o/n
ox /n
Mh
cc
o/n
ox /
nM
hc
co
/no
x /nM
hc
co
/no
x /nM
hc
co
/no
x /n
Mh
cc
o/n
ox /n
Mh
cc
o/n
ox /n
Mh
c
eMissio
n Lev
eLs, G/k
M2.6/0
.77/0.19
2.6/0.186/0
.056
2.6/0.0
43/0
.056
2.6/0.77/0
.192.6/0
.186/0.0
562.6/0
.04
3/0.0
562.6/0
.77/0.19
2.6/0.186/0
.056
2.6/0.0
43/0
.056
1. a/F control &
engine‑out em
issionsvd= 2.3 L
vd= 3.2 Lvd= 4
.5 L
Oxyg
en sensor set (typical
minim
um req
uired)
HO
2S x2H
O2S x2
UE
GO
+HO
2SH
O2S x2
HO
2S x22xU
EG
O+H
O2S
HO
2S x2H
O2S x4
UE
GO
x 2 + HO
2S x2
Oxyg
en sensor set$4
0$4
0$53
$40
$40
$86$4
0$80
$106
Fuel system
– 1/3 of cost (a)$52
$65$65
$74$93
$93$98
$123$123
A/F
manag
ement and
com
bustion im
provem
entsR
&D
R&
DR
&D
R&
DR
&D
R&
DR
&D
R&
DR
&D
Faster microp
rocessor (b)-
$4$8
-$4
$8-
$4$8
Eng
ine mod
ifications$15
$20$20
$15$20
$20$15
$30$30
EG
R system
(c)$25.0
0$39
$39$25
$39$39
$25$39
$39
cost of hardw
are a/F
control & engine‑out
emissions
$132$168
$185$154
$196$24
6$178
$276$30
6
2. aftertreatm
ent systems
vd= 2.3 Lvd= 3.2 L
vd= 4.5 L
TWC
system (from
Table
4-6)
$92$118
$136$123
$155$180
$167$218
$258
Exhaust p
ipe hard
ware (d
)$12
$18$18
$12$18
$18$12
$36$36
Low therm
al capacity
manifold
-
-$24
-$24
$24-
-$4
8
cost of aftertreatm
ent system
s$10
4$136
$178$135
$197$222
$179$254
$342
3. Total cost of hardware [1+2]
$236$30
4$363
$289$393
$468
$357$530
$648
4. Fixed costs (r
&d
, tooling, certification) (e)
$24$36
$42
$24$36
$42
$24$36
$42
5. Total cost of emission
control tech. [3+4]
$260$34
0$4
05
$313$4
29$510
$381$566
$690
(a) Euro
1 levels in small vehicles w
ere initially achieved w
ith TB
I. MP
FI b
ecame the stand
ard later o
n due im
proved
engine p
erform
ance. Only o
ne-third o
f the fuel system co
sts are charg
ed to
emissio
n contro
l; the remaining
fraction is p
erform
ance and fuel effi
ciency.
(b) F
aster EC
U o
peratio
n describ
es imp
rovements in m
icrop
rocesso
r for num
ber o
f signals and
signal p
rocessing
speed
.
(c) EG
R system
includes a b
asic mechanically o
perated
valve and the electro
nically imp
roved system
for E
uro 3 to
6.
(d) E
xtra pip
e wo
rk, change o
f material sp
ecificatio
ns and d
esign.
(e) Fro
m E
rror! R
eference source no
t found
.. Too
ling and
certificatio
n are constant co
sts for all reg
ulatory levels, w
hile R&
D varies d
epend
ing o
n technolo
gy.

50
4.4 DiESEL VEhiCLES ESTimaTED EmiSSionS ConTRoL CoSTS
4.4.1 hardware costs
in-CyLinDER ConTRoL
Proper fuel injection control (timing and metering) in addition to adequate air induction management (to properly match the fuel quantity) and mixing was identified in the technology assessment section as the most important aspect of controlling in-cylinder emissions from diesel-powered vehicles. Besides air-fuel control, the in-cylinder control also involves NOx control using cooled EGR.
CoST of fuEL injECTion SySTEmS
The two main injection fuel systems used in light-duty applications are rotary/distributor pump and common-rail fuel injection. Rotary/distributor pump, used widely in Euro 1 diesel vehicles, is assumed as the baseline for comparisons. For Euro 2, the adoption of electronic assistance and solenoid valves has an additional cost, assumed as $50.
Common-rail fuel injection is the most commonly used system in Euro 3-compliant diesel LDVs. Fuel injection systems cost presented in this report was obtained directly form third party reviewers. The cost figure obtained from reviewers for common-rail systems used in Euro 3 vehicles is $600 (Johnson, 2010). Half of this value was assigned to emission control, because common-rail also provides better engine performance and fuel economy when combined with proper air management.
The cost of the Euro 5/6 common-rail system was estimated by correcting the Euro 3 proportionally with injection pressure, which increased from 1,300 bar to 2,000 bar. A 10% increase in cost with respect to the previous technology was applied for Euro 4, 5 and 6; the cost of US Tier 2 technology was assumed to be equal to Euro 6. This cost increase is conservative, as in many cases technology tends to provide better performance at the same cost along time. Cost figures used in the 2.5L engine were found by inflating the 1.5L engine cost values by 15%, which is equivalent to cost differences between fuel systems for two different size engines, 2.0L and 3.5L, found in the report by the US National Academy of Sciences (US NAS, 2010).
The fuel injection costs allocated in this report to emission control corre-spond to half the total costs above. The other 50% is allocated to engine operation and performance.13
13 This share of fuel system costs to emissions is larger in diesel (one-half) than in gasoline vehicles (one-third) be-cause the large impact of fuel injection characteristics (i.e. pressure, timing, duration, spray angle, penetration) on PM and NOX emissions. In gasoline engines, the number of parameters involved in stoichiometric combustion is lower.
EmiSSion rEduction tEchnology coStS

coSt of EmiSSion rEduction tEchnologiES
51
CoST of TuRboChaRgER, inTERCooLER anD VgT
For diesel engines, turbochargers are key elements for achieving high performance and low emission levels. The first turbochargers commercially offered were wastegate turbochargers, limited to operate properly at mid-loads. These turbos dominated the European market for most vehicles (high performance and luxury excluded) until the advent of Euro 5 regula-tions. VGTs, which include a mechanism for varying the turbine geometry, increased their market share because this technology allows for better PM and NOx control and increased fuel economy due to proper air delivery during most of the operating engine envelope (speed-load map).
The cost figure provided covers a wastegate turbocharger and intercooler. The turbocharger and cost information was estimated as $150 for a 2.0L diesel engine; an electrically actuated VGT adds $125 (Johnson, 2011). The method followed in size scaling for fuel injection technologies was used in this case for scaling from 2.0L cost to that for 1.5L and 2.5L engines. The 1.5L engine requires a 7% reduction in cost, while the 2.5L engine requires the cost to be scaled by the same factor, which results in figures of $140 and $160, respectively. VGT used for Euro 6 and Tier 2 applications adds $116 and $134 for each engine size; the VGT cost for the 3.0L Tier 2 engine was increased by a factor of 13% with respect to the 2.0L cost. As in previous cases, only 50% of the costs are charged to emissions control.
The intercooler commercial price was found on an auto-parts retailer website for a Vauxhall Vectra passenger car, $150 (eBay UK, 2011). The intercooler cost, $60, was estimated by dividing the commercial price by 2.5. The cost figures used for other engine sizes were found following the methodology described in the turbocharger section. Half of the cost of the intercooler was charged to emissions control.
CoST of EgR VaLVE anD CooLing
EGR systems used in early European models were operated with the pressure difference that is created between the intake and exhaust of a turbocharged vehicle. If the vehicle is not turbocharged, the system requires the use of mechanically complex vacuum reservoirs or amplifiers. Mechanically operated legacy systems have been replaced with simple valves operated with solenoids and electronically governed.
According to Johnson (2011) the EGR system evolved in European diesel vehicles as follows: Euro 3 required a high-pressure (HP) loop EGR system with solenoid valve and small cooler; Euro 4 vehicles were fitted with a valve operated by a DC motor, which provides better flow control, and a larger cooler; Euro 5 vehicles required a larger bypass cooler, which requires an additional valve, and a DC motor actuator EGR valve. It is expected that Euro 6 diesel vehicles that will not use SCR for NOx control require dual loop

52
EGR systems, which in turn require a double set of EGR valves (high and low pressure) and a low pressure loop cooler (Johnson, 2011).
The cost figures used in this report for the EGR valve are based on CPI corrected figures presented by R. Kolke during his study of diesel engine technology cost (Kolke, 2004), and averaged with data provided by Johnson (2011). The final EGR valve cost, for a 2.0L engine, was $30 for solenoid operated models and $38 for DC motor actuated EGR vales.
The cost of EGR intercooler was obtained from the cost assessment developed by R. Kolke (2004) for pre-Euro 4, and from T. Johnson (2011). Coolers for a 2.0L diesel engine were priced at $35 for Euro 3, $42 for Euro 4, $50 for Euro 5 and $56 for Euro 6 models. The cost of EGR intercoolers changes with regulations because the amount of EGR needed by the engine increases with tighter NOx standards and its temperature has to be reduced to avoid negative effects on PM emissions and fuel economy. The cost figures used in the 1.5L and 2.5L engines were scaled following the method-ology described in the turbocharger section.
CoST of EnginE mapping anD Tuning
The integration of the fuel injection system and the air management system is done through engine tuning and calibration. It requires a special team of engineers working in a properly conditioned laboratory to draw the most optimum map of speed-load looking for the best tradeoff between fuel economy, performance and emissions. The cost associated with this activity is included in the R&D cost section for diesel vehicles.
aftertreatmentThe cost of aftertreatment systems for diesel engines covers the cost of DOC, DPF, LNT, SCR and the required accessories. The cost structure for most aftertreatment devices was obtained from the RIA corresponding to the non-road diesel engine regulations (EPA, 2004) and adjusted with infor-mation provided by Kolke (2004) and from the Manufacturers Emissions Control Association (MECA) (Kubsh, 2007). The basic components that are common to almost every aftertreatment system are: an oxidation catalyst based on precious metals, primarily Pt or Pd; a reduction catalyst based on Rh; an alkaline earth to provide O2, HC or NOx storage capabilities; a substrate where the catalyst washcoat is applied; and a stainless-steel can for mechanical support (EPA, 2004).
The EPA’s final RIA from 2004 gives some insight into the production cost and markup for catalyzed emission control technologies (which also apply to TWC systems). According to the report, the markup value for catalyzed devices comes form the washcoat (EPA, 2004). It was explained in that report that the cost of PGM, substrates, and canning materials are all well known to buyers and producers because of their commodity status. The
EmiSSion rEduction tEchnology coStS
coSt of EmiSSion rEduction tEchnologiES
53
washcoat preparation and application is where the know-how of the manu-facturer is located and therefore it includes the cost of R&D.
Specific assumptions and costs for each diesel aftertreatment control device are presented below.
CoST of DiESEL oxiDaTion CaTaLyST (DoC)
The implementation of high-pressure fuel injection techniques and engine tuning allowed for Euro 3 diesel LDVs to pass Euro 3 emission levels by using only diesel oxidation catalyst as aftertreatment. The costs of DOC include the cost of hardware (oxidation catalyst, substrate, washcoat, canning and labor with overhead), warranty cost, and some adjustments also included and explained below.
The DOC sweep volume ratio has typically ranged from 0.8 to 1.5 times the engine displacement (Phillips, 1999). Current developments have dropped the SVR to about 0.5-0.75 (Johnson, 2011). In this cost exercise, the catalyst volume was estimated with a SVR of 0.75, as a conservative number.
Regarding PGM cost, DOCs are designed for oxidation of HC, specifically the soluble organic fraction (SOF) of PM, and Pt and Pd are used as a catalyst for the oxidation to occur at low temperatures. Average PGM loading on a DOC, according to Heck et al. (2009), was Pt=0.66 g/L and Pd=0.33 g/L. The total amount was obtained by multiplying the PGM loading by the catalyst volume, CV. The cost of PGM was then obtained by multiplying by the market price of PGM (Pt=$43/g and Pd=$11/g).
The cost of the substrate was estimated based on the estimated cost of flow-through substrates for Otto-cycle vehicles reported in the CPI corrected data from the on-highway HD RIA (EPA, 2000). The cost estima-tion, corresponding to ceramic flow-through substrate, used in this report is: 6.0*CV + 1.92, where CV is the catalyst volume in liters. The previous formula was obtained from a substrate cost formula presented in on-highway HD RIA (EPA, 2000) and corrected for inflation. This formula was used in this report to calculate ceramic substrates for other flow-through aftertreatment devices, including the TWC substrate cost.
Following the cost structure presented in the RIA corresponding to the US 2007 regulations for highway vehicles (EPA, 2000), the cost of washcoat, without including the cost of PGM and after CPI correction, is $5.10 per liter of catalyst. It was assumed that the costs of R&D, overhead, marketing, and profits are included in this number.
The packing can is assumed to be made of 18-gauge (1.2 mm thick) 409 stainless steel, assuming the commercial price of SS409-18GA in $100/m2 (MetalsDepot, 2010). Assuming a catalyst brick face area of 100 cm2, the can length was calculated based on the catalyst volume. This exercise was

54
also applied to all other aftertreatment devices in this section. The material cost of the can was estimated then as $2.4 per liter of catalyst; assuming additional costs for welding and processing, the canning cost was assumed as $5 per liter of catalyst.
The cost of accessories was estimated as $5.0 for Vd≤2.0L and $10 for larger engines.
Labor and overhead costs are assumed equal to TWC costs, i.e. $6 per catalyst. The reason for this assumption is the similarity between both technologies. Oxidation catalysts were the first to be used for tailpipe emission control in vehicles and then enhanced with the reduction function for NOx control.
Adding together the preceding cost items results in the estimated total direct cost to manufacturing.
To figure warranty costs, this report included the cost estimate in the RIA corresponding to the regulatory document on Control of Emissions from Non Road Diesel Engines (EPA, 2004) . In that report, a 3% rate claim and parts and labor cost per incident was assumed. The same values were used in this report.
Baseline cost includes the total direct cost to manufacturers and the warranty cost. Long-term cost depends on technological progress, experi-ence (learning by doing), and volume produced. One of the latest reports on vehicle technologies for fuel economy by the EPA (2010) predicts 10% to 20% reductions in the long term for new technologies. As DOC is not a new technology, a 10% discount would be applied for long-term costs.
Table 4–11 summarizes the previously detailed cost information for four different engine sizes. Based on this data, a DOC cost equation as a function of Vd was developed:
$DOC(Vd)=37*V
d+6
EmiSSion rEduction tEchnology coStS

coSt of EmiSSion rEduction tEchnologiES
55
Table 4‑11 doc cost estimates by engine size
no cosT iTeM
1 Engine displacement, Vd (L) 1.50 2.00 2.50 3.00
2 Catalyst volume, CV (SVR=0.75), liters 1.13 1.50 1.88 2.25
3 Pd cost, 0.66 g/L x CV x $35/g $32 $43 $53 $64
4 Pd cost, 0.33 g/L x CV x $7/g $3 $3 $4 $5
5 Total PGM ([3]+[4]) $35 $46 $57 $69
6 Substrate ($6.0*CV+1.92) $10 $12 $15 $17
7 Washcoat ($5.10*CV) $6 $8 $10 $11
8 Total PGMs+ washcoat + substrate ([5]+[6]+[7]) $51 $66 $82 $97
9 Canning ($5*CV) $6 $8 $9 $11
10 Accessories $5 $5 $10 $10
11 Total manufacturing ([8]+[9]+[10]) $62 $79 $101 $118
12 Labor with overhead @ 40% $6 $6 $6 $6
13 Total direct costs to manufacturing ([11]+[12]) $68 $85 $107 $124
14 Warranty costs (3% claim rate) $2 $3 $3 $4
15 Baseline costs ([13]+[14]) $70 $88 $110 $128
16 Long Term costs (0.9*baseline cost) $62 $78 $99 $116
CoST of DiESEL paRTiCuLaTE fiLTER (Dpf)
DPFs were introduced in Europe as voluntary measures to reduce PM emissions for some Euro 4 vehicles. Euro 5 emission regulations for passenger vehicles and some commercial vehicles required the use of DPFs. The cost structure for DPF follows the same sequence as for DOC. It includes the cost of hardware (oxidation catalyst, substrate, washcoat, canning, and labor with overhead), warranty cost, and some adjustments included and explained below. In addition to those cost, an active regenera-tion system is needed as part of the DPF device.
It was assumed that for LDVs the regenerating mechanism is based on late fuel injection when the signal from a differential pressure sensor detects DPF clogging. Hence, it is assumed that the only extra requirement for the DPF system is a differential pressure sensor and ECU calibration for late injection, which also requires common-rail fuel injection systems (included in Section 4.4.1 on in-cylinder emission control). No extra fuel lines or burners

56
for active regeneration are expected in diesel LDVs, according to our technical review.
The DPF catalyst volume in HD applications typically ranges from 1.5 to 2.5 times the engine displacement for cordierite filters (EPA, 2004). In this cost exercise for LDVs, the catalyst volume was estimated as 2.0 times the engine displacement. This volume factor was verified against technical papers on DPF performance and emissions for light-duty (Blanchard, Colignon, Griard, Rigaudeau, Salvat, & Seguelong, 2002) and medium-duty vehicles (Kai, et al., 2009).
PGMs are required in a DPF as a catalyst to reduce the temperature threshold for soot oxidation during regeneration. The reduction of the soot oxidation temperature reduces the extra fuel consumption required for DPF regeneration. Pt and Pd are used as catalysts. The typical PGM loading on a DPF was 1.0 g/L with at a ratio Pt:Pd=3:1, according to the non-road RIA (EPA, 2004), literature reviews on DPF technologies (Heck, Farrauto, & Gulati, 2009), and personal communication with experts in this field (Johnson, 2011). The cost of PGM was calculated using the same method as in the DOC section.
The cost corresponding to ceramic wall-flow substrate was obtained from reviewers and adjusted to match final DPF estimated cost with the cost found in literature. The cost for diesel substrates is $30*CV, where CV is the catalyst volume (Johnson, 2010).
The washcoat cost was estimated as $10*CV, which is higher that the cost for DOC. The reason for this increased cost is that the DPF is a more complex emission system in which the washcoat plays an important role to reduce the amount of fuel needed for regeneration. The slope of the cost function (10, $/liter) was obtained to match final estimated DPF cost with known cost. The values used as “known DPF costs” were obtained from auto-parts commercial prices and later corrected with the 2.5 reduction factor.
The cost of canning and accessories was calculated using the CV corre-sponding to DPF, while applying the estimates developed for DOCs.
The cost of accessories was estimated as $10 per catalyst for Vd≤2.0 liters and $15 for larger engines.
Regarding the regeneration system cost, the active regeneration process on a DPF requires a differential pressure sensor (0-2.0kPa), a temperature sensor, additional cables, ECU programming, and in some cases an addi-tional heated oxygen sensor (VW, 2009). The active regeneration system also requires the use of flexible fuel injection timing, but these costs are associated with in-cylinder cost and are not accounted for in this section. The average price of DPF differential pressure sensors in auto-parts catalogs
EmiSSion rEduction tEchnology coStS

coSt of EmiSSion rEduction tEchnologiES
57
was $75 (BMW dealership, 2010). This price was divided by the 2.5 factor to calculate a harmonized cost of $30 for this assessment. Regarding the temperature sensor, it was assumed that it is composed of a K-type thermocouple and a transmitter.14 The commercial price for each element was $2.50 per meter of thermocouple wire (1 meter required) and $50 for the transmitter (Omega, 2010). These prices were added and then divided by 2.5 to calculate the value used in the cost assessment, $21. The total cost, assuming additional HO2S, wiring, and ECU processing capability, was assumed at $61. As a reference, the non-road study (EPA, 2004) assessed the cost of a heavy-duty DPF pressure sensor as $46.
Labor cost and overhead for DPF was assumed higher than the DOC estimates. The reason for increasing this number is that the non-road study (EPA, 2004) doubles the manufacturing time for DPF. Thus, labor costs will be assumed as $12 for all engine sizes.
Adding together the previous cost items results in the estimated total direct cost to manufacturing.
Warranty costs, as explained for DOCs, were assumed as 3% (EPA, 2004).
Baseline costs are treated the same as for DOC, but long-term costs are calculated differently, by reducing baseline estimates by 20%. This is because the DPF technology is being constantly improved, and there are opportunities for reducing the costs of new materials, PGM formulation, and increased production volume.
The summary of these costs is presented in Table 4–12 for different engine sizes. Based on the previous data, the DPF cost was defined as a function of engine displacement:
$DPF(Vd)=135*V
d+63
14 The transmitter is used to amplify the week voltage signal from the thermocouple and send the improved signal to the control system.

58
Table 4‑12 dPF cost estimates by engine size
no cosT iTeM
1 engine displacement, vd (L) 1.50 2.00 2.50 3.00
2 Catalyst volume, CV (SVR=2.0), liters 3.00 4.00 5.00 6.00
3 Pt cost, 0.75 g/L x CV x $35/g $97 $129 $161 $194
4 Pd cost, 0.25 g/L x CV x $11/g $8 $11 $14 $17
5 Total PGM $105 $140 $175 $211
6 Substrate ($30*CV) $90 $120 $150 $180
7 Washcoat ($10*CV) $30 $40 $50 $60
8 Total PGMs + substrate+ washcoat ([5]+[6]+[7]) $225 $300 $375 $451
9 Canning ($5*CV) $15 $20 $25 $30
10 Accessories $10 $10 $15 $15
11 Regeneration system $61 $61 $61 $61
12 Total Manufacturing ([8]+[9]+[10]+[11]) $311 $391 $476 $557
13 Labor costs and overhead $12 $12 $12 $12
14 Total direct costs to Mfr. ([12]+[13]) $323 $403 $488 $569
15 Warranty costs (3%claim rate) $10 $12 $15 $17
16 Baseline costs ([14]+[15]) $333 $415 $503 $586
17 Long‑term costs (0.8*baseline) $266 $332 $402 $468
CoST of LEan nox TRap (LnT)
The cost structure for LNT follows the same sequence as the DOC. The cost of LNTs includes the cost of hardware (oxidation and reduction catalyst, substrate, washcoat, canning, and labor with overhead), warranty cost and some adjustments explained below. Although the LNT requires the use of DOC upstream to provide oxidation capabilities during its regeneration, the DOC cost is not included in the LNT cost. Details are presented in Table 4–13.
The LNT CV typically ranges from 1.0 to 1.5 times the engine displacement for cordierite substrates used in light-duty applications (Xu, McCabe, Dearth, & Ruona, 2010). In this cost exercise, the catalyst volume was estimated as equivalent to 1.25 times the volume corresponding to the engine displace-ment for LDVs.
Pt and Rh are required in LNTs as a catalyst to reduce the temperature threshold for NOx reduction. The typical PGM loading on a LNT, based on
EmiSSion rEduction tEchnology coStS

coSt of EmiSSion rEduction tEchnologiES
59
averaging values from Xu et al. (2010) and (Hoard & Hammerle, 2004), is 2.5 g/L, with Pt representing 80% and Rh 20%. The cost of PGM was calculated using the same method as in the DOC section.
The cost estimate corresponding to ceramic flow-through substrate, used in this report for diesel systems is: $6*CV + $1.92.
The washcoat cost was estimated as $15 per CV, or about three times the cost estimates for DOC, for two reasons. LNT mass production in the US and EU began only recently (for model-year 2009 diesel LDVs). Second, the values for LNT obtained from reviewers of this document suggest that the washcoat cost needed to be increased substantially.
The cost of canning and accessories was calculated using the CV corre-sponding to the LNT, while applying the estimates developed for DOC. The cost of accessories was estimated as $5 per catalyst for Vd≤2.0 liters and $10 for larger engines.
The LNT requires a wide range O2 sensor or UEGO to control regeneration periods and minimize the fuel penalty associated with the oxygen storage and regeneration cycle. The cost assigned to LNT is the same as the UEGO cost used for gasoline vehicles, i.e., $33.
Labor and overhead cost for LNT was assumed equal to DPF estimates. The reason is that that the non-road impact assessment report (EPA, 2004) assumes the same labor time for both DPF and LNT systems. Thus, labor costs will be assumed as $12 for all engine sizes.
Adding together the previous cost items results in the estimated total direct cost to manufacturing.
As explained for DOC, warranty costs were estimated assuming a 3% rate claim and parts and labor cost per incident (EPA, 2004).
Baseline and long-term costs are treated the same way as for DPF.
Based on this data, a LNT cost equation as a function of Vd was developed:
$LNT(Vd)=188*V
d+37

60
Table 4‑13 LnT cost estimates by engine size
no cosT iTeM
1 engine displacement, vd (L) 1.50 2.00 2.50 3.00
2 Catalyst volume, CV (SVR=1.25), liters 1.88 2.50 3.13 3.75
3 Pt cost, 2.0 g/L x CV x $43/g $161 $215 $269 $323
4 Rh cost, 0.5 g/L x CV x $135/g $127 $169 $211 $253
5 Total PGM ([3]+[4]) $288 $384 $480 $576
6 Substrate ($6*CV+1.92) $13 $17 $21 $24
7 Washcoat ($15*CV) $28 $38 $47 $56
8Total PGMs + substrate + washcoat ([5]+[6]+[7]) $329 $439 $548 $656
9 Filter can housing ($5*CV) $9 $13 $16 $19
10 Accessories $5 $5 $10 $10
11 Wide-range oxygen sensor (UEGO) $33 $33 $33 $33
12 Total manufacturing cost ([8]+[9]+[10]+[11]) $376 $490 $607 $718
13 Labor costs $12 $12 $12 $12
14 Total direct cost to mfr. ([12]+[13]) $388 $502 $619 $730
15 Warranty costs (3% claim rate) $12 $15 $19 $22
16 Baseline costs ([14]+[15]) $400 $517 $638 $752
17 Long‑term cost (0.8*Baseline) $320 $413 $509 $602
CoST of SELECTiVE CaTaLyTiC REDuCTion (SCR)
The hardware cost of SCR systems includes the catalyst, urea tank, urea pump and injector, urea-exhaust mixer, temperature sensor, urea level sensor and housing. It was assumed that the urea injection control was based on engine maps, instead of on NOx sensors, which may be required in Euro 6 HD applications but not included here in the cost study. NH3 sensors were not included either. It should be noted that SCR systems do not require PGM for NOx reduction, relying on base metals such as vanadium and zeolites for catalytic activity, for which the market prices are orders of magnitude lower than for PGM (Lambert, 2004).
The SCR cost estimation follows the same structure as previous aftertreat-ment devices, but it also requires estimating the additional cost of the urea tank and urea injection system. Details are presented in Table 4–14.
EmiSSion rEduction tEchnology coStS

coSt of EmiSSion rEduction tEchnologiES
61
The catalyst volume for SCR systems in LDV applications in Europe has been reported similar to the engine Vd (Hoard & Hammerle, 2004). Given the differences in test cycle and durability required by emission control systems, in the US, the SCR system for Tier 2-Bin 5 applications is expected to have a sweep volume ratio close to 2.0. Thus, cost estimates for SCR systems assume an SVR of 1:1 and 2:1 for EU and US applications, respectively.
SCR systems do not require precious metals for NOx reduction. An addi-tional NH3 slip control catalyst is installed downstream of the SCR to avoid excess urea and ammonia to be released from the exhaust. The NH3 slip catalyst volume is about one-fifth of the engine displacement and requires around 1 g/L of PGMs (Kubsh, 2007).
The SCR system does not require PGM; instead, a base metal is used for the NOx reduction to occur. Given that vanadium-based SCR systems are not very effective at low exhaust temperatures found during low-load operation typical of city driving, it was decided to assume the SCR catalyst as based on copper-zeolite (Cu-Ze) and estimate its costs thus.15 The information concerning Cu-Ze catalyst composition was found in US Patent No. 20100172814 (BASF, 2010). The catalyst is prepared from zeolites and copper sulfate pentahydrate (1:7 by weight) and is applied to the substrate at approximately 140 g per liter (Johnson, 2011). The cost of bulk zeolite and copper sulfate was found in Internet sources as $40 per kg and $2.00 per kg, respectively (Aliexpress, 2011). This resulted in an estimated materials cost between 2 and 5 cents per gram of catalyst,16 or $2.40-$6 per liter of substrate, which is orders of magnitude below the cost of PGM-based catalyst systems. However, this estimation covers only materials and does not include the process itself and other additives required in obtaining the final Cu-Ze catalyst. Due to the lack of other direct sources to estimate the cost of an SCR catalyst, a flat value found in literature was used. The cost of substrate and washcoat, including the Cu-Ze catalyst, ranges from $10 and $30 per liter of SCR catalyst (Kubsh, 2007; Johnson, 2011). In this assessment, the substrate and washcoat cost was assumed as $20 per liter of catalyst substrate.
The canning cost was estimated as $15 per liter of catalyst, following suggestions by an expert reviewer (Johnson, 2011).
It was assumed in this cost assessment that the cost of the urea tank is a function of engine displacement. In order to estimate this relation, it was assumed that the urea refilling would occur every 7,500 miles. The urea tank volume was defined as the amount of urea required to operate the SCR system during 7,500 miles plus 20% of security factor. The amount of urea consumed was assumed as 1.5% of the fuel consumed along 7,500
15 Vanadium-based catalysts for SCR systems are less expensive than zeolite-based cataysts.
16 Expert reviewers estimated the Cu-Ze cost at $25 per pound, or 5.5 cents per gram.

62
miles (Johnson, 2007). As larger vehicles have, in general, greater fuel consumption than smaller vehicles, the urea tank depends on vehicle-engine size. Assuming that a 2.0L diesel vehicle gets 36 mpg and a 3.0L diesel vehicle gets 21 mpg, the fuel and urea consumed can be estimated. The volumes for the 2.0 and 3.0L vehicles were estimated at 17 and 25 liters, respectively. From this analysis, a rough correlation for engine volume and urea tank volume (UTV) was developed: UTV=8*Vd. Using this relationship and assuming that the tank is a cube, the area and therefore the amount of stainless steel required to build it was calculated. Material cost was estimated assuming a cost per unit area of $100/m2. The final cost of the tank was found by assuming that material’s costs represent 40% of the finished urea tank.
The cost of a urea-level sensor was assumed as the same as the cost of a fuel level sensor. The retail price of a fuel level sensor was around $60, a value obtained by averaging the prices for parts used in a model-year 2005 Honda Civic and Ford Focus, then dividing by 2.5.
The cost of mounting urea tank accessories, including brackets, bolts, spacers, and other hardware, was assumed as $15 to $20 depending on engine size.
The urea pump cost was found by assuming that it is similar to the cost of a conventional fuel pump. The price obtained from an auto-parts supplier was in the range of $120-$140 (Autoparts Warehouse, 2010); it was then divided by 2.5 for a estimated cost of $52.
The urea injector cost, $34, was assumed as equal to a high-performance gasoline fuel injector price of $86, divided by 2.5. (Bedick, 2009).
A section of stainless steel tube conveys the urea from the urea tank to the urea injector. The cost for this part was obtained from an auto-parts retailer (Autoparts Warehouse, 2010), corresponding to a brake line of 1.0 meters. The cost used in the assessment, $14, is the commercial price divided by 2.5.
The cost of the urea injection pipe section was calculated assuming a commercial pipe section D2.5”x1’ used in automotive applications (Autoparts Warehouse, 2010). The value used in the SCR cost assessment, $14, was obtained by dividing the commercial price by 2.5.
Urea injection mounting parts include brackets, bolts, gaskets, spacers and tubing connection accessories. An estimated value of $15 to $20 for these was used, depending on engine size.
The urea solution freezes below -11.5°C (11.3°F). For this reason, a heating system is required to ensure proper operation of the SCR system. The heating system of the SCR is typically an immersion-type heating device, a heater for the stainless steel tubing that conveys the solution from the
EmiSSion rEduction tEchnology coStS

coSt of EmiSSion rEduction tEchnologiES
63
urea tank to the urea injector. The total power required by the system in light-duty applications is 200 W, according to an estimate by Schaftingen (2006). The immersion-heating element cost was assumed as equal to the price of a 200 W, 24V DC water tank heater. The cost used in the assess-ment, $30, corresponds to the vendor price (Power Shop, 2011) divided by 2.5. The line heater cost was estimated based on the commercial price of a flexible heating tape (Omega, 2011), $25 per meter. Assuming the length as 1 m, the cost was $10 after applying the 2.5 reduction factor. The total heating system estimated cost, including connectors and fitting elements, was $40.
The urea-exhaust mixer creates turbulence between the urea injection plane and the catalyst, improving the distribution of urea spray before it meets the catalyst surface. A typical urea mixer, consisting of a wire mesh of stainless steel 2 inches thick, has a commercial price of around $500 for HD applica-tions (Bedick, 2009). Based on this and considering the change in size for LD applications, it was assumed that the mixer manufacturer cost was $50 after dividing the commercial price by the 2.5 reduction factor.
The SCR system described by Schaftingen (2006) includes two temperature sensors: one exhaust temperature sensor located upstream of the system and one urea solution temperature sensor located inside the urea tank. The first one is used for urea injection calculations, while the second is used for controlling the urea heating system. Temperature sensor costs, $21 each, are described in the DPF section.
Labor costs and overhead were assumed as four times the value reported for DOC, as the SCR is much more complex and requires more assembly steps. The estimate was $42.
Adding together the preceding cost items results in the estimated total direct cost to manufacturing.
As explained for DOC, warranty costs were estimated assuming a 3% rate claim and parts and labor cost per incident (EPA, 2004).
Baseline and long-term costs are treated the same way as for DPF.
Table 4–14 summarizes these estimates for four different engine displace-ments. The cost of SCR systems as a function of engine displacement was estimated as:
$SCR(Vd)=72*V
d+309

64
Table 4‑14 scr cost estimates by engine size
no cosT iTeM
1 average engine displacement, vd (L) 1.50 2.00 2.50 3.00
2 Catalyst volume, CV (SVR=1.0), liters 1.50 2.00 2.50 3.00
3 Pt, Pd, and Rh are not required for NOx control $0 $0 $0 $0
4 NH3 slip catalyst, CV (SVR=0.2), 1 g/L PGM @ $43/g $13 $17 $22 $26
5 Total PGM ([3]+[4]) $13 $17 $22 $26
6 Substrate and washcoat ($20/L*CV) $30 $40 $50 $60
7 Canning ($15*CV) $23 $30 $38 $45
8 Total scr catalysts: PGMs + substrate+ washcoat ([5]+[6]+[7]) $66 $87 $110 $131
9 Urea tank volume (8*Vd), liters 12 16 20 24
10 Urea tank cost $94 $114 $132 $149
11 Urea level sensor ($60 commercial price/2.5) $24 $24 $24 $24
12 Urea tank accessories (brackets, bolts, spacers) $15 $15 $20 $20
13 Urea pump ($130 commercial price/2.5) $52 $52 $52 $52
14 Urea injector ($86 commercial price/2.5) $34 $34 $34 $34
15 Tubing Stainless Steel ($35 commercial price/2.5) $14 $14 $14 $14
16Urea Injection pipe section D2.5”x38cm ($35 commercial price/2.5) $14 $14 $14 $14
17Urea Injection mounting parts (brackets, bolts, gaskets, spacers, tubing connectors) $15 $15 $20 $20
18 Urea heating system- 200 W, 12 V DC. $40 $40 $40 $40
19Temperature sensors (x2) ($2.5 thermocouple/2.5 +$50 transmitter, commercial price/2.5) $42 $42 $42 $42
20 Urea mixer ($125/2.5) $50 $50 $50 $50
21 Total urea system ([9]+[10]+…+[20]) $394 $414 $442 $459
22 Total Manufacturing: scr catalyst and urea system ([8]+[21]) $460 $501 $552 $590
22 Labor costs with overhead $48 $48 $48 $48
23 Total direct costs to Manufacturing ([22]+[23]) $508 $549 $600 $638
24 Warranty costs (3%claim rate) $15 $16 $18 $19
25 Baseline costs — near term $523 $565 $618 $657
28 Long term cost (0.8*baseline) $418 $453 $494 $526
EmiSSion rEduction tEchnology coStS

coSt of EmiSSion rEduction tEchnologiES
65
As a reference, cost estimates for urea injection systems and the whole SCR system have been independently assessed. According to Johnson (2011), the cost of urea injection systems for light duty applications ranges from $400 to $600; our estimates are located in the lower section of that range. SCR system values for HD applications range from $1,300 to $1,500 (Johnson, 2004), which is consistent with the estimated values.
The control of NOx emissions with SCR systems is expected to be required only in certain passenger cars or light commercial vehicles (N1) with engines larger than 2.5L. Figure 4-1 shows the LNT and SRC systems’ estimated costs as a function of vehicle engine displacement. Their cost estimates are roughly equal for engines with displacement around 2.4L. Due to the uncertainty of the cost estimation process, assumed as ±10%, the matching value can be extended to cover the range from 1.8 to 3.5 liters. The trend was confirmed by Johnson (2009), who estimated LNT costs below SCR costs for LDVs with engines smaller than 2.0-2.5L. Thus, for vehicles with engine displacements below 2.5L, which covers most of the current and future diesel LDV market, the use of LNT seems the most cost effective alternative for NOx control, provided that ultra-low-sulfur fuel is available.
$0
$200
$400
$600
$800
$1,000
$1,200
1.5 2.0 2.5 3.0 3.5 4.0 4.5
Co
st $
US
Engine Displacement Vd, L
SCR LNT
Figure 4‑1 cost comparisons between LnT and scr for passenger cars. dotted lines represent cost uncertainties of ±10%
Recent experience with diesel passenger cars shows that vehicle manufac-turers have preferred LNT for diesel LDVs with engine displacements below 2.5L. As an example, the 2009 Volkswagen Jetta TDI, powered by a 2.0L diesel engine, achieves Tier 2 Bin-5 certification level by using a LNT for NOx control and DOC plus DPF for PM control (VW, 2009). Larger vehicles such as the 3.0L Mercedes-Benz ML350 rely on SCR (Mercedes-Benz, 2010).

66
4.4.2 r&d, Tooling and certification
The cost of R&D for diesel passenger vehicles covers only in-cylinder emission control. As mentioned in the aftertreatment section, the R&D cost associated with the catalytic devices is included in the washcoat cost. The cost associated with developing the other system components and the required system integration with the engine was not available.
R&D cost estimates presented in this report are associated with improve-ments in combustion optimization, air-fuel management strategies, engine testing for new ECU maps, and certification. These costs for in-cylinder emission reduction measures were adapted from the US’s 2004 heavy-duty impact assessment report (EPA, 2000). Sources for LDVs were not available.
Combustion optimization includes improvements and redesign on air intake manifold, combustion chamber and nozzle design and compression ratio. It was assumed that these changes did not add any engine costs, but required significant investment in R&D and retooling. Fuel injection timing and rate shaping were also included in the original report (EPA, 2000).
Air management cost includes the cost of research and retooling associated with the use of VGTs to specific engine conditions.
Engine testing and new ECU maps consider the extensive emission testing of the whole system, engine-aftertreatment-ECU. Certification costs are incurred only during the vehicle certification process. Due to lack of more detailed information, tooling costs for diesel vehicles are assumed equal to the costs for gasoline vehicles, i.e, $12. Table 4–15 offers a summary of costs from the US’s 2000 heavy-duty impact assessment report (EPA, 2000).
The final cost per vehicle is calculated assuming the cost distributed over a vehicle line of 100,000 vehicles sold during a period of five years.
EmiSSion rEduction tEchnology coStS

coSt of EmiSSion rEduction tEchnologiES
67
Table 4‑15 estimated r&d, tooling and certification costs for diesel passenger cars based on costs per vehicle line
ProJecTToTaL cosT r&d ToTaL cosT r&d disTriBuTed over: ToTaL Per car
usd (2000) usd 100,000 cars*5 years usd
combustion optimization (a) $5,000,000 $7,200,000 500,000 $14.40
air management‑vGT (b) $3,600,000 $5,184,000 500,000 $10.37
engine testing‑new maps for ecu $5,000,000 $7,200,000 500,000 $14.40
certification costs $250,000 $360,000 500,000 $0.72
(a) Includes ECU algorithms modification, intake manifold geometry, fuel injection timing and rate shaping combustion chamber geometry (heads and piston crown), compression ratio
(b) Cost of tailoring the VGT to new air-management requirements
Information describing the cost incurred by European manufacturers on R&D for diesel emission control technologies was not available, so the R&D cost associated with US HD standards presented in Table 4–15 was adopted. The technology required for Euro 1 and 2 standards was based on engine improvements and EGR, so R&D costs includes only tooling and certification costs ($12) and the cost of combustion optimization ($14), for a total of $26. For Euro 3, 4, 5 and 6 diesel vehicles, the extra cost of air management and engine testing R&D was added for a total of $51. R&D costs for US Tier 2 vehicles were assumed equal to Euro 6 R&D costs ($51).
4.4.3 cost summary for diesel vehicles
Based on the information gathered describing the technology required for each of the regulatory levels according to European and US regulations, a summary table was created in which the cost of technology is presented for each regulatory level. Included in the table are variable costs (hardware) and indirect costs (R&D, tooling, certification). Due to the market differences between the passenger car market in the EU and light-duty market in the US regarding engine sizes and power, the cost summary table for diesel was divided into three sections.
The first two tables cover the cost of emission control technologies for diesel vehicles in the EU.
Table 4–16 and Table 4–17 show the summary for four-cylinder engines. Because the market share of light-duty diesel LDVs in the US is very small compared to in Europe, the LDV cost assessment for diesel vehicles in the US only included the latest vehicles on the market that are in compliance with US Tier 2-Bin 5 emission levels. There is only a very small set of LD diesel vehicles pre-2007 that can be used as reference for this study, so pre-2007 LD diesel vehicles were not included. Table 4–18 presents the cost of emission control technologies for diesel LDVs for US Tier 2-Bin 5 according to the number of cylinders.

68
Table 4‑16 estimated costs of emission control technologies for european diesel Ldv, vd<2.0 L
reGuLaTion euro 1 euro 2 euro 3 euro 4 euro 5 euro 6
inTroducTion year 1992 1996 2000 2005 2009 2014
reGuLaTed PoLLuTanTs (nox+hc/PM/co)
(nox+hc/PM/co) (nox/PM/co) (nox/PM/co) (nox/PM/co) (nox/PM/co)
eMission LeveLs, G/kM 1.13/0.18/3.16 0.7/0.08/1 0.5/0.05/0.64 0.25/0.025/0.5 0.18/0.005/0.5 0.08/0.0045/0.5
1. a/F control and engine‑out emissions assuming a 4‑cyl engine, vd= 1.5L
Fuel system – 50% of cost (a) - $50 $300 $330 $363 $399
Turbocharger – 50% of cost (b) - - - $70 $70 $128
Intercooler – 50% of costs (b) - - - $30 $30 $30
VGT (extra cost) – 50% of costs (b) - - - - - $50
EGR valves (c) $30 $30 $30 $38 $38 $38
EGR cooling system (c) - $34 $34 $40 $47 $54
Engine mapping and tuning (d) - R&D R&D R&D R&D R&D
Improvements on combustion chamber & nozzle geometry (e) - R&D R&D R&D R&D R&D
cost of a/F control and engine‑out emissions $30 $114 $364 $508 $548 $699
2. aftertreatment systems assuming a 4‑cyl engine, vd= 1.5 L
Diesel oxidation catalyst (DOC) (f) - - $62 $62 $62 $62
Diesel particulate filter (DPF) (f) - - - - $266 $266
Lean NOX trap (LNT) (f) - - - - - $320
Selective catalytic reduction (SCR) (f,g) - - - - - -
cost of aftertreatment systems (h) $0 $0 $62 $62 $328 $648
3. Total cost of hardware [1+2] $30 $114 $425 $570 $876 $1,347
4. Fixed costs (r&d, tooling, certification) $26 $26 $51 $51 $51 $51
5. Total cost of emission control technology [3+4] $56 $140 $476 $621 $927 $1,398
(a) Cost of rotary pump, HPFI pump, valves, common rail, and injectors. 50% of cost is charged to non-CO2 regulated emissions.
(b) Single stage turbocharging assumed. 50% of cost is charged to non-CO2 regulated emissions.
(c) Single-loop EGR. 50% of cost is charged to non-CO2 regulated emissions.
(d) Maximization of fuel economy and minimization of emissions by fuel injection strategies, air management, turbo, EGR.
(e) Research and development focused on improving combustion (fuel efficiency and emissions) through modeling (CFD) and experiments.
(f) See diesel aftertreatment detail.
(g) SCR cost includes the cost of dosage unit and tank. NH3 slip catalyst included. NOX sensor and H2S catalyst not included in cost.
(h) The cost of aftertreatment systems includes a minimum of devices for control of HC, CO, PM and NOX. The cost presented may vary depending on specific engine applications.
EmiSSion rEduction tEchnology coStS

coSt of EmiSSion rEduction tEchnologiES
69
Table 4‑17 estimated costs of emission control technologies for european diesel Ldv, vd>2.0 L
reGuLaTion euro 1 euro 2 euro 3 euro 4 euro 5 euro 6
inTroducTion year 1992 1996 2000 2005 2009 2014
reGuLaTed PoLLuTanTs (nox+hc/PM/co)
(nox+hc/PM/co) (nox/PM/co) (nox/PM/co) (nox/PM/co) (nox/PM/co)
eMission LeveLs, G/kM 1.13/0.18/3.16 0.7/0.08/1 0.5/0.05/0.64 0.25/0.025/0.5 0.18/0.005/0.5 0.08/.0045/0.5
1. a/F control & engine‑out emissions assuming a 4‑cyl engine, vd= 2.5 liters
Fuel system - 50% of cost (a) - $50 $345 $380 $417 $459
Turbocharger - 50% of cost (b) - - - $80 $80 $147
Intercooler - 50% of costs (b) - - - $34 $34 $34
VGT (extra cost) - 50% of costs (b) - - - - $60 $60
EGR valves (c) $30 $30 $30 $38 $38 $38
EGR cooling system (c) - $39 $39 $47 $54 $62
Engine mapping and tuning (d) - R&D R&D R&D R&D R&D
Improvements on combustion chamber & nozzle geometry (e) - R&D R&D R&D R&D R&D
cost of a/F control & engine‑out emissions $30 $119 $414 $578 $684 $800
2. aftertreatment systems assuming a 4‑cyl engine, vd= 2.5 liters
Diesel oxidation catalyst (DOC) (f) - - $99 $99 $99 $99
Diesel particulate filter (DPF) (f) - - - - $402 $402
Lean NOX trap (LNT) (f) - - - - - $509
Selective catalytic reduction (SCR) (f,g) - - - - - -
cost of aftertreatment systems (h) $0 $0 $99 $99 $501 $1,011
3. Total cost of hardware [1+2] $30 $119 $513 $677 $1,185 $1,811
4. Fixed costs (r&d, tooling, certification) $26 $26 $51 $51 $51 $51
5. Total cost of emissions control tech [3+4] $56 $145 $564 $728 $1,236 $1,862
(a) Cost of rotary pump, HPFI pump, valves, common rail, and injectors. 50% of cost is charged to non-CO2 regulated emissions
(b) Single stage turbocharging assumed. 50% of cost is charged to non-CO2 regulated emissions
(c) Single loop EGR. 50% of cost is charged to non-CO2 regulated emissions
(d) Maximization of fuel economy and minimization of emissions by fuel injection strategies, air management, turbo, EGR.
(e) Research and development focused on improving combustion (fuel efficiency and emissions) through modeling (CFD) and experiments.
(f) See diesel aftertreatment detail.
(g) SCR cost includes the cost of dosage unit and tank. NH3 slip catalyst included. NOX sensor and H2S catalyst not included in cost.
(h) The cost of aftertreatment systems includes a minimum of devices for control of HC, CO, PM and NOX. The cost presented may vary depending on specific engine applications.

70
Table 4‑18 estimated costs of emission control technologies for diesel passenger cars under us Tier 2‑Bin 5 emission levels
dieseL 4‑cyL or vd<2.5 LiTers 6‑cyL or vd>2.5 LiTers
reGuLaTion Tier 2 Bin 5 Tier 2 Bin 5
inTroducTion year 2009 2009
reGuLaTed PoLLuTanTs (nox/PM/co) (nox/PM/co)
eMission LeveLs, G/kM 0.04/0.006/2.5 0.04/0.006/2.5
1. a/F control & engine‑out emission assuming 4‑cyl, vd=2.0L assuming 6‑cyl, vd=3.0L
Fuel system - 50% of cost (a) $420 $459
Turbocharger - 50% of cost (b) $138 $155
Intercooler - 50% of costs (b) $32 $39
VGT (extra cost) - 50% of costs (b) $50 $60
EGR valves (c) $38 $38
EGR cooling system (c) $58 $66
Engine mapping and tuning (d) R&D R&D
Improvements on combustion chamber & nozzle geometry (e) R&D R&D
cost of a/F control & engine‑out emission $736 $817
2. aftertreatment systems vd=2.0 L vd=3.0 L
Diesel oxidation catalyst (DOC) (f) $78 $116
Diesel particulate filter (DPF) (f) $332 $468
Lean NOX trap (LNT) (f) $413 ($602)*
Selective catalytic reduction (SCR) (f, g) - $633**
cost of aftertreatment systems (h) $823 $1,217
3. Total cost of hardware [1+2] $1,559 $2,035
4. Fixed costs (r&d, tooling, certification) $51 $51
5. Total cost of emission control tech. [3+4] $1,610 $2,086
* Note: Cost numbers in parenthesis are informative, not added to final cost summation.
** SCR catalyst cost calculated with SVR corresponding to US requirements (SVR=2.0).
(a) Cost of rotary pump, HPFI pump, valves, common rail, and injectors. 50% of cost is charged to non-CO2 regulated emissions.
(b) Single stage turbocharging assumed. 50% of cost is charged to non-CO2 regulated emissions.
(c) Single loop EGR. 50% of cost is charged to non-CO2 regulated emissions.
EmiSSion rEduction tEchnology coStS

coSt of EmiSSion rEduction tEchnologiES
71
(d) Maximization of fuel economy and minimization of emissions by fuel injection strategies, air management, turbo, EGR.
(e) Research and development focused on improving combustion (fuel efficiency and emissions) through modeling (CFD) and experiments.
(f) See diesel aftertreatment detail.
(g) SCR cost includes the cost of dosage unit and tank. NH3 slip catalyst included. NOX sensor and H2S catalyst not included in cost.
(h) The cost of aftertreatment systems includes a minimum of devices for control of HC, CO, PM and NOX. The cost presented may vary depending on specific engine applications.


73
The fundamental problem addressed by this cost assessment is the cost of technology required in light-duty vehicles for compliance of emission regulations. After gathering the required set of technology in Chapter 2 and assessing the cost per technology for a limited number of engine sizes in Chapter 3, a cost summation was calculated for each engine technology (gasoline and diesel) under each regulatory body.
5.1 EuRopEan REguLaTionS
5.1.1 Gasoline vehicles
Table 5–1 shows the cost increase that gasoline LDV manufacturers will likely face when moving from one European regulatory level to the next one, starting from Euro 1 standards.
Euro 1 vehicles, depending on engine size, require the installation of throttle or port fuel-injected systems and TWC. This represents the largest cost for emission control in gasoline-powered vehicles. The analysis shows that the cost of technology for Euro 1 gasoline vehicles is $167 and $232 for vehicles with engine displacements of 1.5L and 2.5L, respectively. The Euro 2 standard requires the use of MPFI in small vehicles, which is reflected in an increase of $42. Once the MPFI and TWC systems are accounted for, the extra cost required for compliance of more stringent emission levels is very modest.
From Euro 2 to Euro 3, the cost increase is due to OBD requirements and the use of CC catalyst on larger engines required for cold start emissions controls. Cost increases from Euro 3 to 4 are due to CC catalyst requirements in all engine sizes and the implementation of EGR and manifold material improve-ments (low thermal capacity).
The cost increase from Euro 4 to Euro 5/6 is very small. This is due to the fact that the emission levels only mandated a 25% reduction in NOX for Euro 5 and no change in levels for Euro 6. Euro 6 technologies are focused on fuel economy and CO2 emissions, and therefore no extra costs are associated with conventional pollutant reduction.
Table 5‑1 incremental costs for gasoline Ldvs meeting european standards
GasoLine vehicLe cLass
euro 1 (BaseLine)
euro 1 To euro 2
euro 2 To euro 3
euro 3 To euro 4
euro 4 To euro 5
euro 5 To euro 6
cuMuLaTive To euro 6
4‑cyl, vd= 1.5 L $142 $63 $122 $25 $10 $- $362
4‑cyl, vd = 2.5 L $232 $3 $137 $15 $30 $- $417
5. SummaRy

74
Summary
5.1.2 diesel vehicles
The cost increase for diesel vehicles is presented in Table 5–2. Emission control technology costs for Euro 1 diesel-powered vehicles was estimated to be $56 for all engine sizes. Only EGR (without cooling) and a small amount of indirect R&D costs were needed to meet Euro 1.
Euro 2 emission levels required the improvement of the rotary fuel pump to reduce PM emissions and cooled EGR systems to reduce NOX. Euro 2 to Euro 3 levels require the use of common-rail injection, which is progressively more expensive in direct proportion to the fuel injection pressure. Significant increases in cost are required from Euro 3 to 4 due to the need for electronically controlled fuel injection systems and aftertreatment with DOC. DPF accounts for the largest fraction of the cost increase when moving from Euro 4 to 5 levels.
The extra cost incurred to reach Euro 6 levels is stronger in larger LDVs. According to experts from emission control associations and manufacturers, solicited in personal communications with T. Johnson (2010) and J. Kubsh (2010), it is possible that small diesel engines would be able to achieve the emission levels with advanced combustion techniques, including advanced EGR and air-fuel management strategies, and might not need NOX after-treatment control. Larger diesel engines most likely will require LNT or SCR for NOX control and DPF for PM control. LNT is expected to be used in diesel engines with displacement volumes below 2.5L, while SCR will likely be used in engines with larger displacements.
Table 5‑2 incremental costs for diesel Ldvs meeting european standards
dieseL vehicLe cLass
euro 1 (BaseLine)
euro 1 To euro 2
euro 2 To euro 3
euro 3 To euro 4
euro 4 To euro 5
euro 5 To euro 6
cuMuLaTive To euro 6
4‑cyl, vd = 1.5 L $56 $84 $337 $145 $306 $471 $1,399
4‑cyl, vd = 2.5 L $56 $89 $419 $164 $508 $626 $1,862
5.2 uS REguLaTionS
5.2.1 Gasoline vehicles
Emission control technology employed in Tier 1 vehicles includes all the basic technologies required for achieving the most stringent emission levels. The cost of emission control technology includes MPFI systems, O2 sensors and TWC systems, and even EGR. Because Tier 1 already contains most of the technology required in subsequent standards, the cost increase for those more stringent standards is relatively lower, as is presented in Table 5–3. The column labeled “Tier 1 to Tier 2” shows the incremental cost without considering the NLEV regulation, which is considered a transitional regulation and might not be implemented in international scenarios.

coSt of EmiSSion rEduction tEchnologiES
75
Table 5‑3 incremental costs for gasoline Ldvs meeting us standards
vehicLe cLassTier 1
(BaseLine)Tier 1 To
nLevnLev To
Tier 2Tier 1 To
Tier 2cuMuLaTive
To Tier 2
4‑cyl, vd = 2.3 L $260 $80 $65 $145 $405
6‑cyl, vd = 3.2 L $313 $115 $81 $197 $510
8‑cyl, vd = 4.5 L $381 $185 $124 $309 $690
The cost increase for NLEV level is generated mainly by the implementa-tion of close-coupled catalyst aiming to comply with more stringent HC emissions, which are caused primarily during cold-start operation. The cost effect of requiring a CC catalyst is intensified in eight-cylinder engines, which need a double set.
The additional cost for Tier 2 is based primarily on increased catalyst volume, improved manifold design, and R&D. For six-cylinder engines, the large increase in cost is due to the implementation of a double set of CC catalysts (one per bank of cylinders).
In cases where the transitional NLEV is not implemented, the incremental cost from Tier 1 to Tier 2 can be directly added.
It should be noted that the costs of implementing the baseline technology, i.e. Tier 1, are about double the costs of improving the emission standards to Tier 2 levels. This is because Tier 1 vehicle technology already includes MPFI and TWC. These two technologies aggregate the largest share of emission control technology costs in gasoline-powered LD vehicles.
5.2.2 diesel vehicles
For diesel- powered passenger vehicles, only the cost to achieve Tier 2-Bin 5 levels was analyzed. Only two vehicle categories are considered here, as presented in the cost section. Table 5–4 shows the summary cost for US Tier 2-Bin 5 diesel vehicles. These vehicles are typical of current (2011) vehicles offered in the US market.
Table 5‑4 incremental costs for diesel Ldvs meeting us standards
vehicLe cLass unconTroLLed To Tier 2
4‑cyl, vd= 2.0 L $1,609
6‑cyl, vd= 3.0 L $2,086

76
5.3 CompaRing EmiSSion CoSTS: uS VS. EuIn previous sections, the estimated cost and the incremental cost of emission control technologies were presented for engine sizes that are typical of each region. In this section, a cost comparison between regions and technologies is done assuming a common engine size. For sake of simplicity, a 2.0L engine was selected.17 Figure 5-1 presents the cost of emission control technologies, for gasoline and diesel vehicles under the EU and the US regulations. It is clear that the cost for gasoline LDVs is much more favorable than for diesel LDVs.
Gasoline vehicles require incremental air-fuel and aftertreatment system modifications to meet more stringent emission standards. The control of pollutants is based on improving air-fuel control using faster oxygen sensors and better control logic, combined with adjustments in PGM loading, washcoat formulation, and catalyst volume. Therefore, the incre-mental cost impact of emission control technologies in gasoline vehicles is less strong once the vehicles are fitted with MPFI and TWC.
Diesel vehicles, due to their inherently lean combustion process with direct fuel injection, require much deeper system modifications to achieve the emission targets. Diesel vehicles require the development and implementation of new fuel injection systems (common-rail), more responsive turbocharging systems (VGT), more complex EGR systems (double loop and larger heat exchange surfaces) and sophisticated aftertreatment devices (DOC, DPF, LNT, SCR), developed in parallel with in-cylinder control through engine calibration.
17 Cost details for the 2.0L gasoline and diesel engines are presented in Appendix C.
Summary

coSt of EmiSSion rEduction tEchnologiES
77
$-
$200
$400
$600
$800
$1,000
$1,200
$1,400
$1,600
$1,800
Euro 1 Euro 2 Euro 3 Euro 4 Euro 5 Euro 6
Em
issi
on
Co
ntro
l Co
st, $
USD
EU Regulations
Gasoline
Diesel
Diesel w/o deNOX
Tier 1 NLEV Tier 2 B5
US Regulations
Figure 5‑1. estimated cumulative emission control technology cost for gasoline and diesel light‑duty vehicles assuming a 2.0 L engine
Note that technology requirements for gasoline Euro 1 light-duty vehicles were more stringent than for diesel vehicles. Euro 1 gasoline vehicles require aftertreatment and port fuel injection, which is more expensive than the basic Euro 1 diesel emission control, based on EGR. Euro 2 levels can be considered as equivalent in terms of costs for both gasoline and diesel emission control technologies. For gasoline vehicles, once the TWC system is in place, including the port fuel injection system and basic oxygen sensor, the cost increase per regulatory level is lower than for diesel technology.


The cost figures presented in the previous section describe the emission control cost across different technologies and regulatory levels. The original values per component, obtained from scattered sources of information, were verified, consolidated and updated, aiming to provide a reasonable updated cost estimation. The next step is to offer a comparison between our estimated costs and recently available cost information on this topic. For this purpose, we will present a series of tables comparing the cost of various components used in gasoline and diesel emission control technologies and also a comparison of the overall cost assessment for gasoline vehicles in the US (no information was found available for diesel passenger vehicles in the EU).
The values on specific emission control system components for Tier 2 gasoline and diesel vehicles are compared here against recent reports on available technologies for improving fuel economy for light-duty vehicles. The reports were produced by the US National Academy of Sciences (NAS, 2011),18 and a second produced jointly by the US EPA and the National Highway Traffic Safety Administration (EPA, 2010). The values obtained from these reports, although specific for Tier 2 vehicles, provide a direct benchmark for values on this standard, and also provide a strong signal for other standards regarding the accuracy of our assumptions.
Cost values from the NAS and the joint EPA/NHTSA report are original equipment manufacturer (OEM) cost, without markup, similar to the treatment we have used throughout the present report. Another signifi-cant difference when comparing in-cylinder control costs between those reports and this report is that the NAS and the joint report show full cost in components used for engine operation, such as fuel injectors and turbochargers, while the ICCT report assumes a fraction of costs for emission control from such components (33%-50%). In those cases, the ICCT values are inflated to full costs for this comparative cost exercise and clearly stated to avoid any confusion with the numbers provided in previous tables.
6.1 CompaRiSon foR gaSoLinE TEChnoLogiES The information available in the NAS report allows comparing a handful of gasoline emission control technologies found in a four-cylinder, 2.0L gasoline vehicle compliant with Tier 2-Bin 5 standards, as shown in Table 6–1. The cost of oxygen sensors was estimated by NAS in $9 vs. $20 by ICCT.
18 The cost values provided by the NAS report (2011) consolidated values obtained from reports presented by Martec Group (2008), Duleep (2009) and US EPA (2008).
6. CompaRiSonS wiTh aVaiLabLE SouRCES

80
compariSonS
The estimated costs for wide-range oxygen sensors, or UEGO, were very similar in both studies (around $30). Estimated costs for EGR systems were also quite close, $25 and $39 from NAS and ICCT, respectively. Fuel injector estimated cost by NAS is $8, and $15 by ICCT. According to NAS, the cost numbers, which were taken from a report by Martec (2008), are low because fuel-injectors are high-volume commodity items in a highly competitive market, which drives their cost down. The next item on the table is the fuel injection system, including fuel injectors, rail and connec-tions. NAS estimated costs are $32 for a four-cylinder engine, equal to four times the cost of injectors; ICCT estimated cost of $195 includes the cost of fuel rail, connections, sensors (temperature and pressure), and ECU functions. A third comparison value was found in the NAS report, cited in turn from a recent EPA report, where the fuel injection system cost was estimated to be $165 for a similar vehicle (US EPA, 2008). ICCT cost estimates are close to EPA values.
In addition to component level cost, the NAS report presents total costs for port fuel injected emission control technologies in V6 and V8 vehicles. These cost values include the evaporative emission control system (EVAP) cost, which was not included in the ICCT total cost assessment. EVAP costs were estimated by Martec to be $37 and by EPA to be $75, including the fuel pump. ICCT values correspond to the aftertreatment system only, given that the NAS report does not include details on which items are included and reduces the fuel system cost to $32. No total emission system cost was presented for four-cylinder engines in the NAS report.
It is concluded that ICCT cost assessments for gasoline vehicles are somewhat higher than, but similar to, those made in other recent studies on this topic. The difference is small considering the uncertainties intrinsic to this kind of study, where cost values are calculated indirectly.

coSt of EmiSSion rEduction tEchnologiES
81
Table 6‑1 comparison for gasoline emission control technologies, iccT vs. nas study (nas, 2011)
TechnoLoGyTier 2‑ Bin 5, 4‑cyL, 2 L
coMMenTsnas iccT
oxygen sensor, ho2s $9 $20
oxygen sensor, ueGo $30 $33 Wide range oxygen sensor.
eGr valve $25 $39
Fuel injectors $8 $15According to Martec (2008), the injectors are considered high-volume commodity items.
Fuel system $165, EPA (2008) $195EPA values include only injectors and rail. ICCT and EPA values do not include fuel pump cost.
TechnoLoGy
Tier 2‑ Bin 5 Tech. cosTscoMMenTs
nas iccT
stoichiometric v6 emissions and evaP systems $245 $222* NAS data from Martec (2008)
* ICCT figure does not include cost of EVAP systems, which is approximately $60 averaged from EPA and Martec values.
stoichiometric v8 emissions and evaP systems $343 $342*
As a means of benchmarking, data from the US Bureau of Labor Statistics (BLS) was compared to ICCT-estimated values. BLS data is obtained each year from a sample of 15 US domestic passenger cars manufacturers on value of quality changes derived from emissions improvements in accor-dance with the 1990 Clean Air Act amendments (US DOL, 2010). The data obtained from BLS tracks the incremental cost from NLEV to Tier 2 regula-tions. Our estimates show that the shift from NLEV to Tier 2-B5 for vehicles with engine displacement of 2.3L (I4) and 3.2L (V6) cost around $65 and $81, respectively. BLS data shows that the average cost to manufacturers to reach Tier 2 compliance was about $54 above the cost associated with NLEV compliance. Thus, ICCT values are slightly above BLS data.
6.2 CompaRiSon foR DiESEL TEChnoLogiES The cost comparison for diesel emission control technologies is more detailed than the information presented for gasoline vehicles, including in-cylinder and aftertreatment control. In-cylinder control is presented for a four-cylinder, 2.0L engine, while the aftertreatment cost comparison was done for the previous engine and for a six-cylinder, 3.5L engine.

82
The costs of in-cylinder control technologies for diesel passenger vehicles are presented in Table 6–2, comparing cost values found in the NAS study versus ICCT values. It includes the common-rail injection system, VGT, inter-cooler and the EGR system, including the cooling system. The NAS study is very detailed on the common-rail system cost, while the ICCT shows only total costs. Total common-rail, VGT, intercooler, and EGR costs are similar.
Table 6‑2 comparison for diesel in‑cylinder emission control technologies, iccT vs. nas study (nas, 2011)
TechnoLoGyTier 2‑Bin 5, 4‑cyL, 2 L
coMMenTsnas iccT
common‑rail: Fuel injectors $300 -
common‑rail: high pressure fuel pump (1800 bar) $250 -
common‑rail: Fuel rail, regulator, fuel storage $125 -
Total common‑rail 1800 bar piezo‑actuated fuel system $675 $840 NAS included high-energy driver
upgrades to the engine control module.
variable‑geometry turbocharger [vGT] $250 $380
aluminum air‑air charge air cooler and plumbing $125 $64
hP/LP eGr system (cooling included) $215 $96
Total $1,265 $1,380
The costs of aftertreatment systems used in diesel passenger vehicles are presented in Table 6–3, comparing cost values found in the NAS and EPA study versus ICCT values for four-cylinder 2.0L and six-cylinder 3.0L and 3.5L diesel vehicles. The components compared include DOC, DPF, LNT and SCR.
Comparing the estimated DOC costs with NAS and EPA estimates shows a significant difference. Looking into the details presented in the NAS report, it is clear that the differences arise from PGM loading assumptions (NAS, 2011). Unfortunately, the PGM loading for DOC was not presented in these two reports. In the NAS report, some additional information shows that the DOC PGM cost is almost the same as the DPF. It can be argued that it is not realistic for DOC PGM costs to be the same as DPF PGM costs, and that ICCT estimates for the DOC reflect more closely the real cost for this component.
DPF costs estimates are reasonably close to those presented by NAS for the 2.0L engine and by EPA for the 3.0L engine. The DPF catalyst loading costs reported by NAS are very low ($26) for the V6 compared to the I-4 diesel
compariSonS

coSt of EmiSSion rEduction tEchnologiES
83
engine, suggesting that EPA values are more reasonable for comparison. More details about the assumptions made to derive those numbers were not available, limiting the ability to draw any comparison with ICCT numbers.
ICCT estimated cost values for the LNT were roughly 20% below values reported by NAS for the 4-cylinder vehicle, but very close for the EPA reported values. Regarding the SCR system, the estimated cost of the urea dosing system for the 3.5 L engine presented by the NAS report ($363) is reasonable similar to the ICCT estimate ($475). Monolith and canning costs estimated by the ICCT were 65% below the estimated NAS costs.
The total diesel aftertreatment system ICCT cost estimate is reasonably similar to the estimates found in the NAS and EPA cost reports. Compared to NAS costs, the ICCT estimated costs show differences of -28% and +2% for the 2.0L and the 3.5L engines, respectively. Compared to EPA cost figures, ICCT estimated values are 18% and 33% below for the 2.0L and the 3.0L engines.
Although this final number provides confidence in the overall cost exercise, some significant differences were found in specific technologies. Unfortunately, there was no available information for tracking the differ-ences in some cost estimates, such as PGM loading and CV assumptions used in the NAS report.
Table 6‑3 comparisons for diesel aftertreatment emission control technology costs (nas, 2011), (ePa, 2010)
TechnoLoGynas iccT nas iccT ePa iccT ePa iccT
coMMenTs4‑cyL, 2.0 L 6‑cyL, 3.5 L 4‑cyL, 2.0 L 6‑cyL, 3.0 L
doc $226 $80 $262 $135 $216 $80 $277 $116 EPA SVR= 0.5ICCT SVR= 0.75
dPF $284 $333 $299 $536 $401 $333 $534 $468 EPA SVR= 1.0ICCT SVR= 2.0
LnT $647 414$ - $392 414$ - -
scr - - $637 $559 - - $854 $524 EPA SVR= 1.0ICCT SVR= 1.0
Total $1157 $827 $1198 $1230 $1009 $827 $1665 $1108


85
Gasoline and diesel vehicle technology requirements for emission control in each regulatory level were identified, and their cost estimated, according to European and US standards. The main findings of this study are presented below:
gaSoLinE VEhiCLES • Gasoline vehicles require, as the basic setup, the installation of port
fuel injection technologies (sequential MPFI is preferred), three-way catalysts, and oxygen sensors. Once these basic components are installed, compliance with subsequent emission levels is accomplished through a series of incremental improvements in the system.
• For gasoline vehicles, the most significant improvement over the basic emission control setup is the use of close-coupled catalyst, OBD requirements, EGR, and engine control updates.
• CC catalysts are used for cold-start HC emission control in NLEV, Tier 2 and Euro 3 and later vehicles.
• OBD requirements impose the use of a secondary set of oxygen sensor to track catalyst performance over time. This technology is required from Tier 1 and Euro 3 vehicles.
• Engine control unit processing capacity and sensor response are expected to increase as new emission and performance require-ments are met.
• TWC technology and air-fuel control have evolved dramatically, allowing high conversion efficiencies while requiring very low PGM loading. PGM costs were estimated around $20-$35 per liter displacement, with larger cost for US-standard-compliant technol-ogy. Total TWC system cost per liter displacement was found between $55 and $60.
• The initial cost required for Euro 1 compliance in a gasoline vehicle is around $140 and $230 for a 1.5 liters and 2.5 liters engine, respectively. The cost roughly doubles, $360 and $420 respectively, in order to reach Euro 5/6 levels. This relatively low overall cost is the result of the technical simplicity and length of implementation time, which have allowed for cost reductions due to continuous improvement, and a large global market.
• The largest increase in cost after the Euro 1 level, about $120 for a 1.5L engine and $140 for a 2.5L engine appears when moving to Euro 3, which requires CC catalyst to achieve compliance under a test cycle that includes emissions measurement during cold start. Afterwards,
7. ConCLuSionS
86
concluSionS
the technology required in the same vehicle for reaching Euro 4 and 5/6 increases by around $30 to $45, depending on engine size.
• The complexity and cost of emission control technology depends on engine size. This is more evident for the US regulation, given that Tier 2 standards are independent of size. In the case of US Tier 1 compliant gasoline vehicles, the additional cost for reaching Tier 2-Bin 5 levels is $145 for a four-cylinder, 2.0L engine; $200 for a six-cylinder, 3.2L engine; and $310 for a eight-cylinder, 4.5L engine.
DiESEL VEhiCLES• Diesel vehicles, due to their direct-injection lean-combustion process
with late fuel injection, require much deeper system modifications than gasoline vehicles to achieve the emission targets.
• Euro 1 and Euro 2 diesel vehicles require only in-cylinder control, based on improvements in fuel injection pressure, provided by a rotary pump, and an EGR valve. Increasing fuel injection pressure was used for PM control, while the EGR valve was used to control NOX.
• More stringent standards starting from Euro 3 require the use of fuel injection systems capable of variable fuel injection timing and metering, at high injection pressures. Common-rail injection systems became the de facto solution for high fuel injection pressure and fuel injection timing and metering flexibility. This type of fuel injection systems allows for almost simultaneous in-cylinder PM and NOX control. Euro 3 and subsequent regulations demand cooled EGR systems for NOX control. Turbocharging was added to most Euro 4 vehicles to help with air-fuel management. Aftertreatment in the form of a DOC for HC and PM control is also required in most passenger vehicles starting with Euro 3.
• Euro 5 requires improvements on fuel injection strategies, air management through VGT and more sophisticated EGR systems for in-cylinder control of emissions. Engine-out emissions require after-treatment measures based on DPF for PM control.
• Euro 6 level requires continuous advances on in-cylinder control measures and additional aftertreatment for NOX control. SCR or LNT is the technology that will be most likely used.
• Along the process of tightening emission standards, in-cylinder control measures increase in complexity in order to reduce the need for aftertreatment.
• The common-rail system injection pressure increases roughly proportionally to the level of stringency, from 1,300 bar for Euro 3 up to 2,100 bar expected for Euro 6.
• EGR systems were improved, from mechanically operated valves to electronic control and cooling.

coSt of EmiSSion rEduction tEchnologiES
87
• Turbocharging is used actively for PM control in Euro 4 vehicles as part of the air-fuel management system. Euro 5 and 6 vehicles generally use variable geometry turbocharging technologies for fast air-handling response.
• In-cylinder control and aftertreatment control are developed in parallel, as an integrated system, requiring extensive design, testing and system calibration. R&D costs reflect the work devoted to this effort.
• Diesel emission control costs climb quickly once common-rail and aftertreatment are required. For a 1.5L engine, the emission control cost increases from below $140 for Euro 2, up to near $1,400 for Euro 6 levels (roughly 10 times). The technology required for Tier 2 Bin 5 diesel vehicles with the same engine size would cost approximately the same as for Euro 6.
• Diesel emission control technology cost is highly dependent on engine displacement. This is mostly due to the cost component derived from aftertreatment technology. In the US, the cost accrued on a Tier 2 Bin 5 vehicle is around $1,600 for a 4-cylinder, 2.0 L vehicle, and around $2,100 for a 6-cylinder, 3.0 L vehicle; most of this difference stems from aftertreatment costs.
• The cost assessment revealed that for aftertreatment NOX control, the LNT is economically viable for vehicles with less than about 2.5 liters, provided that low-sulfur diesel fuel (S<15 ppm) is available, while larger passenger vehicles, such as SUVs, would require SCR systems. This result was in agreement with experts’ opinions and technology trends in current vehicles.

88

89
Autoparts Warehouse (2010). Retrieved 2010 from http://www.autopartswarehouse.com.
Aoki, Y., Yoshida, T., Tanabe, T., Hatanaka, M., Nagai, Y., Sakagami, S., et al. (2009). Development of Double-Layered Three-Way Catalysts. SAE Technical Papers (2009-01-1081).
Araujo, J. B. (2008). Ambient Particulate Pollutants in the Ultrafine Range Promote Early Atherosclerosis and Systemic Oxidative Stress. Circulation Research.
Bedick, C. (2009). Optimization of a Retrofit Urea-SCR System. Ph.D. Dissertation. Morgantown, WV: West Virginia University, Morgantown, W.Va.
Bertola, A., (2001). Characterization of Diesel Particulate Emissions in Heavy-Duty DI-Engines with Common Rail Fuel Injection: Influence of Injection Parameters and Fuel Composition. SAE Technical Papers (2001-01-3573).
Blanchard, G., Colignon, C., Griard, C., Rigaudeau, C., Salvat, O., & Seguelong, T. (2002). Passenger Car Series Application of a New Diesel Particulate Filter System Using a New Ceria-Based Fuel-Borne Catalyst: From the Engine Test Bench to European Vehicle Certification. SAE Technical Papers (2002-01-2781).
BMW of South Atlanta (2010). Differential pressure sensor. Retrieved November 2010 from http://parts.bmwofsouthatlanta.com/products/Sensor—Differential-pressure/1276911/13627805758.html.
California Air Resources Board. (1996). Low-Emission Vehcile and Zero-Emission Vehicle Program Review. Staff Report.
Eastlake, A. R. (2000). Real World Tests of Heavy Duty Vehicles. SAE Topical Technical symposiums. Gothenburg: SAE.
eBay UK (2011). Ventra CDTi Turbo Intercooler FMIC Vauxhall. Retrieved December 20, 2011, http://www.ebay.co.uk/itm/VECTRA-CDTI-TURBO-INTERCOOLER-FMIC-Vauxhall-/260664168488?pt=UK_CarsParts_Vehicles_CarParts_ SM&hash=item3cb0cb9028.
US Environmental Protection Agency (1990). Light-Duty Tail Pipe Standards and Useful Life Requirements. Washington: US Environmental Protection Agency, Office of Air and Radiation, Office of Mobile Sources, Certification Division v2.1.
bibLiogRaphy

90
BiBliography
EPA (1999). Control of Air Pollution from New Motor Vehicles: Tier 2 Motor Vehicle Emissions Standards And Gasoline Sulfur Control Requirements (Regulatory Impact Analysis). Washington: US Environmental Protection Agency.
EPA (2000). Regulatory Impact Analysis: Control of Emissions of Air Pollution from Highway Heavy-Duty Engines. Washington: US Environmental Protection Agency, Office of Transportation and Air Quality.
EPA (2004). Final Regulatory Analysis: Control of Emissions from Non Road Diesel Engines. Washington: US Environmental Protection Agency.
EPA (2008). A Study of Potential Effectiveness of Carbon Dioxide Reducing Vehicle Technologies. Washington: US Environmental Protection Agency.
EPA (2010, September). Light-Duty Vehicle Greenhouse Gas Emission Standards and Corporate Average Fuel Economy Standards for Model Years 2017-2025. Interim Joint Technical Assessment by the US Environmental Protection Agency, US Department of Transportation and the California Air Resources Board.
European Automobile Manufacturers’ Association (ACEA) (2010). Trends in New Car Characteristics. Retrieved 2010 from http://www.acea.be/index.php/news/news_detail/trends_in_new_car_characteristics/.
US Department of Energy (2010). Transportation Energy Databook: Edition 29. Oak Ridge, Tenn.: Oak Ridge National Laboratory, Office of Energy Efficiency and Renewable Energy.
US Department of Labor (2010). Retrieved 2010 from Bureau of Labor Statistics (BLS): http://www.bls.gov/schedule/archives/all_nr.htm#CAR
Duleep, K. G. (2009). Diesel and hybrid cost analysis: EEA vs. Martec. Presentation made to NRC Committee, February 25, 2008, updated June 3, 2009.
DieselNet (2003). Commercial DOC Technologies. (Ecopoint Inc.) Retrieved March 17, 2010, from www.dieselnet.com/tech/cat_pm.html
German, J. M. (1995). Observations concerning current motor vehicle emissions. SAE Technical Papers (950812).
Girard, E. A. (2008). Technical Advantages of Vanadium SCR Systems for Diesel NOx Control in Emerging Markets. SAE Technical Papers (2008-01-1029).
Grumbrecht, F. E. (2007). Concept Development of an SCR Demonstrator Vehicle: Meeting Future European Emission Limits with Low Fuel Consumption. Berlin: IAV MinNOx Conference.

coSt of EmiSSion rEduction tEchnologiES
91
Iwakuni, H., Miyoshi, S., & Takami, A. (2009). Development of PGM Single Nano Catalyst Technology. SAE Technical Papers (2009-01-1081).
Hu, L., & Williams, S. (2007). Sulfur Poisoning and Regeneration of Pd Catalyst under Simulated Emission Conditions of Natural Gas Engine. SAE Technical Papers (2007-01-4037).
Heck, R. M., Farrauto, R. J., & Gulati, S. T. (2009). Catalytic Air Pollution Control Commercial Technology (3rd Edition ed.). Hoboken, N.J.: John Wiley & Sons, Inc.
Health Effects Institute. (2002). Understanding The Health Effects Of Components Of The Particulate Matter Mix: Progress And Next Steps, HEI Perspectives.
Hoard, J. W., & Hammerle, R. (2004). Economic Comparison of LNT Versus Urea SCR for Light Duty Diesel Vehicles in US Market. Coronado, Calif.: Diesel Engines and Emission Research Conference.
Minjares, R. and Posada, F. (2011). Estimated Costs of Gasoline Particulate Filters. Washington: International Council on Clean Transportation.
Johnson, T. (1999). Gasoline Vehicle Emissions – SAE 1999 In Review. SAE Technical Papers (2000-01-0855).
Johnson, T. (2000). Diesel Emission Control – Last 12 Months in Review. SAE Technical Papers (2000-01-2817).
Johnson, T. (2004). Diesel Emission Control in Review. SAE Technical Papers (2004-01-0070).
Johnson, T. (2006). Diesel Emission Control in Review. SAE Technical Papers (2006-01-0030).
Johnson, T. (2007). Diesel Emission Control in Review. SAE Technical Papers (2207-01-0233).
Johnson, T. (2009). Diesel Emission Control in Review. SAE Technical Papers (2009-01-0121).
Johnson Matthey. (2010). PGM Prices. Retrieved March 2010 from Platinum Today: http://www.platinum.matthey.com/pgm-prices/
Kubsh, J. (2007). Diesel Engine Emisson Control Technology. Retrieved 2009 from http://files.harc.edu/Sites/TERC/About/Events/ETAC200705/EmissionControlTechnology.pdf
Kai, R., Sekiya, T., Oagawa, M., Saiki, K., Matsubara, M., Kurachi, H., et al. (2009). Thermal-Mechanical Durability of DOC and DPF After-treatment

92
System for Light Heavy Pickup Truck Application. SAE Technical Papers (2009-01-2707).
Keenan, M. (2004). Review of NOx Reduction Technologies to Meting Light Duty Diesel 2010 and 2015 and Heavy Duty Diesel 2013 European Legislative Limits. Ricardo Consulting Engineers LTd.
Kishi, N., Kikuchi, S., Suzuki, N., & Hayashi, T. (1999). Technology for Reducing Exhaust Gas Emissions in Zero Level Vehicles (ZLEV). SAE Technical Papers (1999-01-0772).
Kolke, R. (2004). Vergleich der Umweltverträglichkeit Neur Technologien im Strassenverkehr. Ph.D. Thesis, Otto-von-Guericke-Universität Magdeburg,, Fakultät für Maschinenbau, , Germany.
Krishnan, R. T. (2005, January). Economics of Emission Reduction for Heavy Duty Trucks. Retrieved July 2010 from Dieselnet Technical Report: http://www.dieselnet.com/papers/0501krishnan/
Lambert, C. H. (2004). Technical Advantages of Urea SCR for Light-Duty and Heavy-Duty Diesel Vehicle Applications. SAE Technical Papers (2004-01-1292).
National Academy of Sciences (2011). Assessment of Technologies for Improving Light Duty Vehicle Fuel Economy. National Academy of Sciences, Committee on the Assessment of Technologies for Improving Light-Duty Vehicle Fuel Economy; National Research Council. National Academies Press.
Niemi, A. S., Paanu, T. P., & Laur, M. J. (2004). Effect of Injection Timing, EGR and EGR Cooling on the Exhaust Particle Number and Size Distribution of an Off-Road Diesel Engine. SAE Technical Papers (2004-01-1988).
Muitsuishi, S., Mori, K., Nishizawa, N., & Yamamoto, S. (1999). Emission Reduction Technologies for Turbocharged Engines. SAE Technical Papers (1999-01-3629).
Majewski, W. A. (2007). Lean NOX Traps. Retrieved 10 March 2010 from DieselNet: http://www.dieselnet.com/tech/cat_nox-trap.html
Majewski, W. A. (2002). Diesel Particulate Matter. Retrieved 10 March 2010 from DieselNet: http://www.dieselnet.com/tech/dpm.html
Majewski, W. A. (2004, January). Lean NOX Catalysts. Retrieved 10 March 2010 from Dieselnet: http://www.dieselnet.com/tech/cat_lean-nox.html
Majewski, W. A., & Jaaskelainen, H. (2009, September). Retrieved 21 April 2010 from Dieselnet: http://www.dieselnet.com/tech/engine_design.html
BiBliography

coSt of EmiSSion rEduction tEchnologiES
93
Martec Group (2008). Variable Costs of Fuel Economy Technologies. Prepared for Alliance of Automobile Manufacturers.
Mercedes-Benz. (2010). Explore BlueTEC. Retrieved 2010 from Mercedes-Benz USA, LLC: http://www.mbusa.com/mercedes/innovation/thinking_green/bluetec/vehicles/section-photos/group-0/tout-1
MetalsDepot. (2010). MetalsDepot. Retrieved 2010, from www.metalsdepot.com.
Mostafa, K. (2006). Automotive Natural Gas Engine Technology Evolution. Natural Gas Vehicle Conference. Cairo: NGV.
Omega. (2010). Omega sensors. Retrieved November 2010, from www.omega.com.
P. R. Phillips, G. R. (1999). Development of Advanced Diesel Oxidation Catalysts. SAE Technical Papers (1999-01-3075).
Pfahl, U., Rice, M., Kramer, J., & Bruestle, C. (2009). Advanced Catalyst Substrate Technology Development for Cost Efficient Exhaust Gas Aftertreatment Systems. SAE Technical Papers (2009-01-1073).
Su, T. E. (1995). Effects of injection pressure and nozzle geometry on spray SMD and D.I. emissions. SAE Technical Papers (952360).
Salvat, O. (2000). Passenger Car Serial Application of a Particulate Filter system on a Common Rail Direct Injection Diesel Engine. SAE Technical Papers (2000-01-0473).
Tate, J. (2010, October 13). Mazda Unveils Two New Fuel-Sipping Diesel and Gas Engines. Popular Mechanics. Retrieved 15 November 2010, from http://www.popularmechanics.com/cars/news/fuel-economy/mazda-sky-engines.
Tsumagari, I. (2006). Study of 2-LEG NOX Storage-Reduction Catalyst System for HD Diesel Engine. SAE Technical Papers (2006-01- 0211).
Volkswagen Service Training Team (2009). Volkswagen 2.0 Liter TDI Common Rail BIN5 ULEV Engine. VW Self-Study Program 826803.
Volkswagen Service Training Team (2005). The 2.0 L FSI Turbocharged Engine Design and Function. VW Self-Study Program 821503.
Wada, K. (2007). Study on Emission-Reducing Method With New Lean NOX Catalyst for Diesel Engines. SAE Technical Papers (2007- 01-1933).
Walsh, M. P. (2010). Automobile Emissions Motor Vehicle Pollution Control in the United States and Europe. In J. B. Wiener, M. D. Rogers, J. K. Hammitt, & P. H. Sand, The Reality of Precaution Comparing Risk Regulation in the United States and Europe.

94
Walsh, M. P. (1999). Mobile Vehicle Emission Controls: The Growing Global Market. Retrieved January 26, 2010, from http://www.walshcarlines.com/mpwdocs.html
White, L. J. (1982). The Regulation of Air Pollutant Emissions from Motor Vehicles (A. E. Policy, Ed.). Washington: American Enterprise Institute for Public Policy.
Xu, L., McCabe, R., Dearth, M., & Ruona, W. (2010). Laboratory and Vehicle Demonstration of “2nd-Generation” LNT + In-Situ SCR Diesel NOX Emission Control Systems. SAE Technical Papers (2010-01-0305).
BiBliography
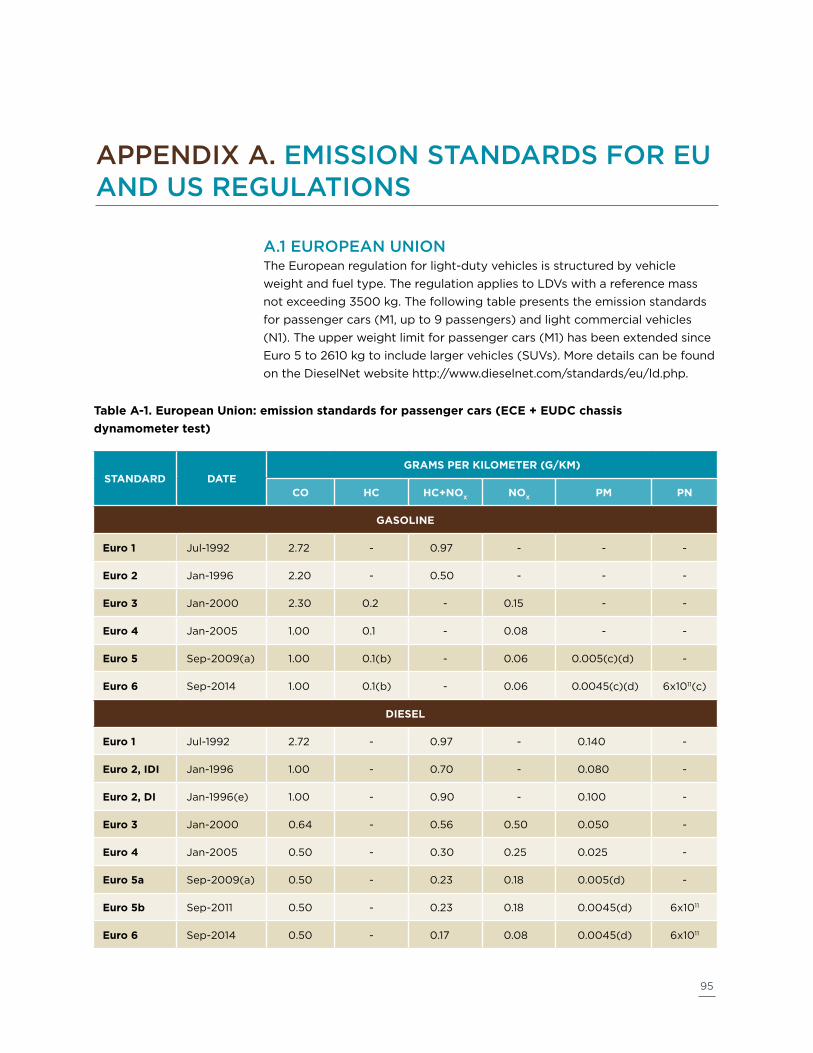
95
a.1 EuRopEan unionThe European regulation for light-duty vehicles is structured by vehicle weight and fuel type. The regulation applies to LDVs with a reference mass not exceeding 3500 kg. The following table presents the emission standards for passenger cars (M1, up to 9 passengers) and light commercial vehicles (N1). The upper weight limit for passenger cars (M1) has been extended since Euro 5 to 2610 kg to include larger vehicles (SUVs). More details can be found on the DieselNet website http://www.dieselnet.com/standards/eu/ld.php.
Table a‑1. european union: emission standards for passenger cars (ece + eudc chassis dynamometer test)
sTandard daTeGraMs Per kiLoMeTer (G/kM)
co hc hc+nox nox PM Pn
GasoLine
euro 1 Jul-1992 2.72 - 0.97 - - -
euro 2 Jan-1996 2.20 - 0.50 - - -
euro 3 Jan-2000 2.30 0.2 - 0.15 - -
euro 4 Jan-2005 1.00 0.1 - 0.08 - -
euro 5 Sep-2009(a) 1.00 0.1(b) - 0.06 0.005(c)(d) -
euro 6 Sep-2014 1.00 0.1(b) - 0.06 0.0045(c)(d) 6x10¹¹(c)
dieseL
euro 1 Jul-1992 2.72 - 0.97 - 0.140 -
euro 2, idi Jan-1996 1.00 - 0.70 - 0.080 -
euro 2, di Jan-1996(e) 1.00 - 0.90 - 0.100 -
euro 3 Jan-2000 0.64 - 0.56 0.50 0.050 -
euro 4 Jan-2005 0.50 - 0.30 0.25 0.025 -
euro 5a Sep-2009(a) 0.50 - 0.23 0.18 0.005(d) -
euro 5b Sep-2011 0.50 - 0.23 0.18 0.0045(d) 6x10¹¹
euro 6 Sep-2014 0.50 - 0.17 0.08 0.0045(d) 6x10¹¹
appEnDix a. EmiSSion STanDaRDS foR Eu anD uS REguLaTionS

96
appEndix a
* Category M1 vehicles. For Euro 1 through 4, vehicles greater than 2,500 kg were type approved as Category N1 vehicles
(a) Sep 2010 for all M and N vehicle weight categories
(b) NMHC limit = 0.068 g/km
(c) applicable only to vehicles with DI engines
(d) 0.0045 g/km using the PMP measurement procedure
(e) After Sept 30 1999, vehicles with DI engines had to meet the IDI limits
a.2 uniTED STaTES
Tier 1
Tier 1 emission standards are structured by fuel type and vehicle weight category. More details can be found in the US Code of Federal Regulations Title 40, Part 86, Subpart H.
Table a‑2. Tier 1 standards. Light‑duty vehicle emission standards (FTP‑75 chassis dynamometer test). emission limits at full useful life (100–120,000 miles)
Tier 1 GraMs Per MiLe (G/Mi)
vehicLe caTeGory nox nMhc co PM Thc
GasoLine
Ldv Passenger car 0.60 0.31 4.2 - -
LdT1 LVW <3,750 lbs 0.60 0.31 4.2 - 0.80
LdT2 LVW >3,750 lbs 0.97 0.40 5.5 - 0.80
LdT3 ALVW <5,750 lbs 0.98 0.46 6.4 - 0.80
LdT4 ALVW > 5,750 lbs 1.53 0.56 7.3 - 0.80
dieseL
Ldv diesel Passenger car 1.25 0.31 4.2 0.10 -
LdT1 diesel LVW <3,750 lbs 1.25 0.31 4.2 0.10 0.80
LdT2 diesel LVW >3,750 lbs 0.97 0.40 5.5 0.10 0.80
LdT3 diesel ALVW <5,750 lbs 0.98 0.46 6.4 0.10 0.80
LdT4 diesel ALVW > 5,750 lbs 1.53 0.56 7.3 0.12 0.80
LVW - Loaded vehicle weight (curb weight + 300 lbs) ALVW - Adjusted LVW (the numerical average of the curb weight and the GVWR) LLDT - Light light-duty truck (below 6,000 lbs GVWR) HLDT - Heavy light-duty truck (above 6,000 lbs GVWR)

coSt of EmiSSion rEduction tEchnologiES
97
national Low emission vehicle (nLev) standards
Note that emission standards are independent of fuel type.
Table a‑3. nLev standards. Light‑duty vehicle emission standards (FTP‑75 chassis dynamometer test). emission Limits at Full useful Life (100,000 miles)
nLev GraMs Per MiLe (G/Mi)
caTeGory nMoG co nox PM hcho
Passenger cars 0.09 4.2 0.3 0.08 0.018
LdT1, LvW <3,750 lbs 0.09 4.2 0.3 0.08 0.018
LdT2, LvW >3,750 lbs 0.13 5.5 0.5 0.1 0.023
Tier 2
The Tier 2 emissions control program was designed with various categories (bins) and temporal and permanent standards. The temporal standards follow a similar structure as Tier 1, with different bin levels for each vehicle category. From 2009 onward, vehicles have to comply with any of the permanent 8 bins, but each manufacturer fleet has to comply with an average NOX limit equivalent to Tier 2-Bin 5 levels of 0.07 g/mi. More details on this regulatory program can be found in the US Code of Federal Regulations CFR 40 Part 86, Subpart S.

98
appEndix a
Table a‑4. Tier 2 standards. Light‑duty vehicle emission standards (FTP‑75 chassis dynamometer test). emission limits at full useful life (100–120,000 miles)
Tier 2 sTandards GraMs Per MiLe (G/Mi)
sTandard ModeL year vehicLes nox nMoG co PM hcho
Bin 11 2004-2008 MDPV 0.9 0.28 7.3 0.12 0.032
Bin 10c 2004-2008 LDT4, MDPV 0.6 0.28 6.4 0.08 0.027
Bin 10b 2004-2008 HLDT, MDPV 0.6 0.23 6.4 0.08 0.027
Bin 10a 2004-2006 LDV, LLDT 0.6 0.156 4.2 0.08 0.018
Bin 9c 2004-2008 HLDT, MDPV 0.3 0.18 4.2 0.06 0.018
Bin 9b 2004-2006 LDT2 0.3 0.13 4.2 0.06 0.018
Bin 9a 2004-2006 LDV, LLDT 0.3 0.09 4.2 0.06 0.018
Bin 8b 2004-2008 HLDT, MDPV 0.2 0.156 4.2 0.02 0.018
Bin 8a 2004+ All vehicles 0.2 0.125 4.2 0.02 0.018
Bin 7 2004+ All vehicles 0.15 0.09 4.2 0.02 0.018
Bin 6 2004+ All vehicles 0.1 0.09 4.2 0.01 0.018
Bin 5 2004+ All vehicles 0.07 0.09 4.2 0.01 0.018
Bin 4 2004+ All vehicles 0.04 0.07 2.1 0.01 0.011
Bin 3 2004+ All vehicles 0.03 0.055 2.1 0.01 0.011
Bin 2 2004+ All vehicles 0.02 0.01 2.1 0.01 0.004
Bin 1 2004+ All vehicles 0 0 0 0 0

99
Three-way catalytic converters (TWCs) are used as the main aftertreat-ment emission reduction technologies for spark-ignited engines with stoichiometric combustion, including gasoline and natural gas engines. Other SI engines running on lean combustion such as gasoline direct injected (DI) or natural gas lean-burn engines cannot use three way catalyst systems.
A catalytic converter is a ceramic honeycomb structure in which the walls have been impregnated with a highly porous washcoat material (alumina oxide) containing a catalyst made of one of the noble metals, commercially known as platinum metals or precious metals group (PGM), required to activate the desired reactions. The TWC is a special kind of converter.
Platinum (Pt), palladium (Pd), and rhodium (Rt) are the main PGMs used in TWC applications. The use of PGM for catalytic converters in the automotive industry started in the mid 1970s with Pt and Pd as oxidizers of HC and CO. Later on, a reducing agent for NOx was required by regula-tions (from 1980) and Rh became the third basic PGM required to oxidize and reduce all three pollutants in one single converter. An efficient application of the TWC required a more precise air-fuel control than that provided by the carburetor because of the required stoichiometric atmo-sphere, low on excess oxygen, needed for NOx reduction. This prompted the development of precise A/F control technologies and sensor tech-nologies to detect the stoichiometric conditions of the exhaust gases.
Oxygen storage components (OSC) were introduced to the TWC formulation to buffer the typical rapid changes in A/F conditions on a vehicle. In the mid 1980s, the use of ceria, or cerium oxide, as an OSC was widespread and became a standard feature of the TWC. Although Pd was more available and cheaper than Pt, it was not originally used in the TWC due to its reactivity with sulfur and lead. The successive decreases in lead concentration for fuels during the 1980s opened the door for Pd to be used as a substitute of the more expensive and scarce Pt. Pd is also highly temperature-resistant, making it suitable for close-coupled catalysts.
Californian emission regulations from the 1990s (under the LEV program) required stricter controls on NOx and HC. The cold start period, which is strong contributor to HC emissions, was identified as the main challenge and as a result the light–off characteristics of the TWC were intensely
appEnDix b. hiSToRiC CoSTS of pgm LoaDingS

100
appEndix B
studied. In addition to stricter emission levels, higher durability require-ments were set, which prompted the need for solving the problem of thermal aging in combination with faster light-off TWCs. The industry solved these issues by intense research on formulations and the deposi-tion of PGMs in specific layers, to avoid metal to metal sintering derived from thermal aging and to optimize the oxidation/reduction function (Heck, Farrauto, & Gulati, 2009). Fast light-off was improved by increasing PGMs loading, mostly of Pd, which was the available and less expensive PGM. Durability and thermal aging were addressed by improving the OSC through the use of solution of ceria and zirconia starting around 1995. The improvements on OSC not only reduced the thermal impact on emission reduction deterioration, but also increase the A/F operational window, especially for Pd (Heck, Farrauto, & Gulati, 2009).
b.1 pgm ConSumpTion in noRTh amERiCa anD maRkET pRiCES
As explained in the previous sections, the TWC is the single largest contributor to the cost of emission reductions technologies for SI gasoline engines. The cost of legacy TWC systems can be broken down by component, in the cost of support 16%, impregnation 13%, PGM loading 67%, and others (Prigent, 1988). This general picture of the source of costs for legacy TWC systems provides a clear idea of the weight cost of PGMs for emission reduction technologies before improve-ments took place. Nowadays, the PGM cost fraction is below 50% of the catalyst cost and below 40% of the total TWC system (including CC and UF catalyst and accessories).
The automotive catalyst market is the main consumer of PGMs around the globe, taking almost 68%, 76% and 98% of the total produced Pt, Pd and Rt respectively (including recycled PGMs). Figure B-1 shows the PGM consumption in the North American market (CA, MX and US) for auto-catalysts. This heavy demand for PGMs has had a major impact on the prices of PGMs. The supply of Pd and Rh is almost completely inelastic, as they are almost entirely byproducts from nickel and Pt mining. There are no mines primarily for Rh; the only primary mine for Pd, in Stillwater, Montana, accounts for less than 7% of the world’s Pd supply. Because the sources of these scarce metals are mainly located in developing countries, their price also depends on the political and economical stability of the supplier. Figure B-2 shows the historic variation of PGM prices, which illustrates the level of variability of Rh and Pd prices.

coSt of EmiSSion rEduction tEchnologiES
101
0
20
40
60
80
100
120
199
0
199
2
199
4
199
6
199
8
200
0
200
2
200
4
200
6
200
8
2010
PG
M c
ons
ump
tio
n in
Cat
alys
t, T
ons
Pt Pd Rh
Fig. B‑1 PGMs consumption in north america (ca, Mx, us). data from Johnson Matthey website (1992‑2009) and us doi (2004)
0
50
100
150
200
250
199
1
199
2
199
3
199
4
199
5
199
6
199
7
199
8
199
9
200
0
200
1
200
2
200
3
200
4
200
5
200
6
200
7
200
8
200
9
2010
2011
PG
Ms
mar
ket
pri
ces,
$U
SD/g
r
Pt Pd Rh
Fig. B‑2, PGMs market price variations, in $usd (inflation corrected). data from Johnson Matthey website (1992‑2009) and us doi (2004)
The catalyst PGM loading and relative ratio for each precious metal are defined by two factors: regulatory emission policies and PGM market prices. Although the emissions standards are defined years before its implementa-tion, which would allow manufacturers to define catalyst formulations and technology in a phased manner, the relative inelasticity of PGM supply and increasingly stringent standards worldwide has forced them to continuously adapt new catalyst formulations and technology to dramatically reduce PGM loadings. In order to illustrate the historic change in catalyst PGM loading cost, the average PGM loading per liter is calculated for each year starting on 1992.

102
appEndix B
b.2 pgm CaTaLyST CoST moDELA model to calculate the average PGM loading per liter and its cost is presented in this section. The average PGM loading (PGMload) is estimated by calculating the PGM demand for the NA market (PGMNA_demand) during certain year divided by the summation of catalyst volume produced for LDVs in the NA market during that year,
PGM =demandY
load
PGMYNA
YcatV
PGM =demandY
load
PGMYNA
YdV totalvc/vdk
YdV total =
j=categories
Vdj • #Vehiclesj
Y
where Y refers to the year being calculated and Vcat represents the total volume of TWCs produced during year Y. Vcat is a function of the number of vehicles produced and their engine sizes. Data about the number of catalysts produced and their volume was not available, thus an additional assumption was made. Literature consulted on TWC technology shows that the ratio of engine volume to catalyst volume for SI gasoline vehicles is around 1:1. So this factor was applied and the denominator modified,
PGM =demandY
load
PGMYNA
YcatV
PGM =demandY
load
PGMYNA
YdV totalvc/vdk
YdV total =
j=categories
Vdj • #Vehiclesj
Ywhere kVC/Vd is the ratio of catalyst volume to engine displacement, and
PGM =demandY
load
PGMYNA
YcatV
PGM =demandY
load
PGMYNA
YdV totalvc/vdk
YdV total =
j=categories
Vdj • #Vehiclesj
Y
Where the left term in Equation B-3 represents the summation of all engine displacements of vehicles produced in year Y, which is equal to the total vehicles produced in each vehicle category (small car, medium car…small van, large van…medium SUV, large SUV) multiplied by corresponding average engine displacement. Data for each term is described below.
It was assumed that all the PGM demand for auto catalyst use (numerator of Equation B-2) is consumed by vehicle manufacturers in North America (Canada, Mexico and the United States), including implant companies. The PGM demand for North America was found in the website of one of the main catalyst manufacturers (Johnson-Matthey, 2009) and in the website

coSt of EmiSSion rEduction tEchnologiES
103
of the US Department of Interior geological survey (US DOI, 2004), and presented in Figure B-1.
The total engine displacement for year Y is calculated using the information from the Transportation Energy Data Book (DOE, 2009). The number of vehicles produced in North America for each vehicle category is multiplied by the corresponding engine size to obtain the total engine volume produced that year. Figure B-3 shows the number of engines for each range, and the total engine volume for each engine category. It should be recalled that the total engine volume is representative of total catalyst volume, with a ratio of catalyst volume to engine displacement of 1:1.
0
5000
10000
15000
20000
25000
30000
35000
40000
45000
199
0
199
2
199
4
199
6
199
8
200
0
200
2
200
4
200
6
200
8
Tota
l eng
ine
volu
me=
Eng
ine
size
*#ve
hicl
es,
tho
usan
d L
iter
s
0
2000
4000
6000
8000
10000
12000
14000
199
0
199
2
199
4
199
6
199
8
200
0
200
2
200
4
200
6
200
8
LDV
s p
rod
uced
in N
.A,
tho
usan
d u
nits
Small (Vd ≤ 2.5) 4-cyl
Medium (2.5 < Vd ≤ 3.75) 6-cyl
Large (Vd > 3.75) 8-10 cyl
Total
Fig. B‑3, engine category distribution and total engine size for the north american market. Based on data from the Transportation energy data Book (2009)
Figure B-4 shows the average PGM loading, in g/L. It can be observed that around 1995 the PGM formulation changed when Pt was replaced by Pd. Pd was three times cheaper before 1995, so the formulations where adjusted to take advantage of the price difference. The consequent increase in Pd

104
appEndix B
demand prompted a constant increase in its market price, a tendency that continued until 1999 when it surpassed the price of Pt.
0.00
0.50
1.00
1.50
2.00
2.50
1990 1992 1994 1996 1998 2000 2002 2004 2006 2008
Ave
rag
e P
GM
s lo
adin
g, g
/L
Pt Pd
Rh
Fig. B‑4, estimated TWcs precious metal loading for north america
In addition to the market forces, the Californian LEV program, and later the NLEV program, reduced the limits for HC and NOx. Because Pd was found to be an effective catalyst during the cold start period (Koltsakis, 1997), the demand for Pd had a technical reason to increase. The catalyst manufacturers responded to the increase in Pd market price by going back to using Pt or a combination of both Pt/Pd, which helped to reduce and stabilize the price of Pd.
The NLEV program in 2001-2003 and the beginning of the Tier 2 regula-tions, phased in for 2004, had a significant effect on the North American consumption of PGMs, especially for Rh, which is the key element for NOx reduction. Figure B-4 shows the peak on loading for Rh around 2001 and the constant increase in Rh loading since then. According to the 2003 Johnson Matthey publication on Platinum Group Metals consumption (JM, 2003), catalytic converters required 2 to 6 g of PGMs per automobile (~1-2 g/L) and 6 to 30 g of PGMs per sport utility vehicle or light truck. The amount of PGMs required per vehicle and the Pt-to-Pd ratio vary with the level of emission control, metal prices, and type of vehicle.
Based on the previous estimation of PGM loading per liter of TWC, the cost of PGM per liter was calculated assuming a SVR=1:1. Figure B-5 shows the estimated costs of PGM per liter of TWC. The cost per liter of TWC saw its lowest value around 1996, after years of stable Tier 1 regulations, when the technology was mature enough to reduce the cost without sacrificing the emissions output. The beginning of the NLEV program, which generated an increase in PGM demand, combined with the high prices of Pd, resulted in a steep increase in PGM cost for automotive catalyst. According to the estimations, the cost of PGM per liter of TWC increased four times from the

coSt of EmiSSion rEduction tEchnologiES
105
lowest value in 1996 to its local peak value in 2000. The second trend on cost increases of PGM per liter of TWC, starting in 2002, can be partially explained by the emission regulation demands of Tier 2 and its phase-in system, which allow manufacturers to reduce the average emission values of their fleet progressively, from 2004 to 2007 for LDVs. Unfortunately for estimating PGM loadings in LDVs, the use of precious metals for oxidation catalysts and catalyzed filters for emission control and retrofitting of heavy-duty diesel engines also began and steadily increased in the 2000s. Thus, part of the increase in Pt consumption after 1998 in Figure B-2 is due to heavy-duty use, which was also included in the consumption data for cost estimates in Figure B-5.
$-
$10.00
$20.00
$30.00
$40.00
$50.00
$60.00
$70.00
$80.00
$90.00
1990 1992 1994 1996 1998 2000 2002 2004 2006 2008
Pt Pd Rh Total cost PGM per liter TWC
Fig. B‑5, estimated cost of PGM loading per liter of TWc.
Another factor that helps shape the demand of PGMs, besides the emission regulations, is the consumer demand for specific kinds of vehicles. The US market preferences shifted over the period from 1990 to 2008, from mostly midsize vehicles to SUV and light-duty trucks. The ratio in 1990 was 70% midsize vehicles to 30% light trucks; in 2008, the ratio was 51% to 49% (US DOE, 2009). This change in consumer preferences also shaped the composition of total engine volume manufactured in the US, and hence, its PGM consumption.
Comparing the total engine volume manufactured in North America (Figure B-3), which has been decreasing since 2000, with the slight and steady increase in demand of PGMs until 2007 (Figure B-1), confirms that the demand of PGMs is also being generated outside the LDV market.

106
appEndix B
Figure B-5 suggests that the values predicted by the PGM adding model require a correction, especially since the year 2000. Aiming to correct the PGM consumption for LDV vehicles a literature review was performed and presented below.
b.3 pgm CaTaLyST LoaDing LiTERaTuRE REViEwThis discrepancy, which inflates the PGM consumption, was addressed by comparing the PGM loadings in Figure B-4 with typical PGM loadings reported in technical literature, specifically SAE Technical Papers. Tables B-1 and B-2 show some examples of PGM loading ratios Pt/Pd/Rh, PGM loading in g/L, and the correspondent cost when possible. The tables show data for US and EU regulations. It should be noted that no PGM loading data was found in the literature after 2002 for the US, although data was published in Europe through 2007.

coSt of EmiSSion rEduction tEchnologiES
107
Table B
‑1 Literature survey on P
GM
load
ing and
cost p
er liter for TW
cs used
in us vehicles
ye
ar
Pt/P
d/r
h c
oM
Po
siTion
PG
M Lo
ad
inG
, G/L
TWc
c
on
FiGu
ra
Tion
ToTa
L v
oLu
Me
, LiTe
rs
en
Gin
e
disP
Lac
eM
en
T, LiTe
rs
co
sT, usd
c
osT P
er
LiTe
r, u
sd
sae
PaP
er
n
uM
Be
r
199
05/0
/11.18/0
/0.235
UF
1.6$ 76
.64
$ 47.90
90
04
95
1997
0/6
0/1//5/0
/10
.87/1.83/0.21
Fro
nt//Rear
0.6//1.7
$ 58.00
$ 25.22970
266
1997
6/3/1//0/1/0
0.6
5/2.9.0.1
Fro
nt//Rear
0.8//1.6
6$ 6
4.9
9$ 27.0
89710
23
199
85/0
/11.18/0
/0.24
CC
1.4$ 32.4
0$ 23.14
9829
05
5/0/2
1.18/0/0
.25C
C//U
F1.2//1.7
$ 59.30$ 20
.45
0/14
/00
/3.95/0
.28C
C//U
F1.2//1.4
$ 89.25$ 34
.33
199
90
/9.7/00
/9.7/0F
ront/R
ear3.8
$ 40
1.20$ 10
5.5819
99
-01-0
776
0/6
6/10
/15.23/0.23
CC
//UF
1.39//1.393.8 L
$ 340
.85$ 89.70
0/9
0/1
0/9/0
.1C
C//U
F1.2//1.2
2.0 L
$ 169.41
$ 44
.58
199
95/0
/11.33/0
/0.27
UF
1.4$ 38.77
$ 27.6919
99
-01-0
307
1/17/30
.15/2.55/0.4
5U
F1.4
$ 62.77
$ 44
.84
199
90
/5/10
/1.18.0.24
--
199
9-0
1-030
8
0/9/1
1.91/0
/0.21
--
199
97/0
/11.1/0
/0.16
-1.4
$ 31.65
$ 22.6119
99
-01-36
27
5/0/1
1.5/0/0
.3-
1.41.25 L
$ 47.42
$ 33.87
200
10
/1/0//5/0
/11.4
2/1.63/0.16
Frnt.//R
ear CC
0.56//1.34
$ 80.54
$ 42.39
200
1-01-184
4
1.1/2.1/0.21
Frnt//R
ear CC
0.4
2//1.03
2.2 L$ 67.16
$ 44
.77
200
10
/1/0//2.3/0
/10
.151/0.4
/0.0
7F
ront//R
ear0
.66//1.0
$ 40
.99
$ 24.69
200
1-01-0
629
0/1/0
//0/2/0
0.17/0
.52/0.0
8F
ront//R
ear0
.7//1.0$ 34
.95
$ 20.56
200
20
/1/0//1/0
/10
.07/0
.56/0.0
7C
C//U
F2x 0
7//1.64
.6 L
$ 88.76$ 19.30
200
2-01-0
344
0/1/0
//2/0/1
0.15/0
.53/0.0
7C
C//U
F0
.7//0.8
$ 60
.70$ 4
0.47
1/6.3/1//1/6
.3/10
.14/0
.88/0.14
Fro
nt//Rear
0.7//1.0
2.4 L
$ 31.85$ 18.74
200
20
/11/10
/2.57/0.23
CC
2x0.9
42.2L
$ 76.20
$ 38.1020
02-0
1-034
8
0/11/1
0/1.28/0
.11C
C2x0
.94
$ 38.10$ 19.0
5

108
appEndix BTa
ble
B‑2
Lit
erat
ure
surv
ey o
n P
GM
load
ing
and
co
st p
er li
ter
for
TWc
s us
ed in
eur
op
ean
vehi
cles
yea
rPt
/Pd/
rh
co
MPo
siTi
on
PGM
Lo
ad
inG
, G
/LTW
c
co
nFi
Gu
ra
Tio
nTo
TaL
vo
LuM
e,
LiTe
rs
enG
ine
dis
PLa
ceM
enT,
Li
Ter
sc
osT
, usd
c
osT
Per
Li
Ter
, usd
sa
e Pa
Per
n
uM
Ber
1990
5/0
/11.4
8/0
/.29
--
--
-90
027
1
1991
5/0
/10
.88/
0/0
.17-
--
--
900
271
1994
5/0
/11.5
/0/0
.3-
2.1
-$
81.1
0$
38.
6294
093
4
1998
5/0
/11.1
8/0
/0.2
4C
C1.4
-
$ 3
2.4
0$
23.
1498
290
5
5/0
/21.1
8/0
/0.2
5C
C//
UF
1.2//
1.7
-$
59.
30$
20
.45
0/1
4/0
0/3
.95/
0.2
8C
C//
UF
1.2//
1.4-
$ 8
9.25
$ 3
4.3
3
1999
0/9
0/1
0/9
/0.1
CC
//U
F1.2
//1.2
2.0
L$
169.
41
$ 4
4.5
819
99-0
1-0
776
1999
7/0
/11.1
/0/0
.16-
1.4-
$ 3
1.65
$ 2
2.61
1999
-01-
3627
5/0
/11.5
/0/0
.3-
1.41.2
5 L
$ 4
7.4
2$
33.
87
200
10
/1/0
//5/
0/1
1.42/
1.63/
0.16
Fro
nt//
Rea
r C
C0
.56/
/1.3
4$
80
.54
$ 4
2.39
200
1-0
1-18
44
1.1/2
.1/0
.21
Fro
nt//
Rea
r C
C0
.42/
/1.0
32.
2 L
$ 6
7.16
$ 4
4.7
7
200
26/
0/1
1.05/
0/0
.18C
C1.4
1.3 L
$ 3
8.10
$ 2
7.21
200
2-0
1-35
51
6/0
/10
/1.0
5/0
.18C
C1.4
1.3 L
$ 2
6.90
$ 1
9.21
2/0
/30
.7/0
/0.11
CC
2.2
2.0
L$
9
.85
$
4.4
8
0/2
/30
/0.0
7/0
.11C
C1.6
1.6 L
$
8
.74
$
5.4
6
200
40
/1/0
0/1
.23/
0C
C1.2
1.2 L
$ 1
2.50
$ 1
0.4
220
04
-01-
2984
0/1
1/1
0/1
.18/0
.11C
C1.7
-$
23.
40
$ 1
3.76
200
50
/7/1
//0
/1/1
--
--
-20
05-
01-
2158
200
50
/5/1
0/1
.03/
0.2
CC
1.61.6
L$
25.
63$
16.
02
200
5-0
1-11
07
0/3
/10
/0.8
3/0
.28
CC
1.61.6
L$
26.
70$
16.
69
5/0
/10
.6/0
/0.11
CC
1.61.6
L$
43.
40
$ 2
7.13
200
70
/2/1
0/0
.35/
0.17
-1.6
1.6 L
$ 4
9.84
$ 3
1.15
200
7-0
1-0
16
0/6
.5/1
0/0
.46/
0.0
7-
1.6$
25.
50$
15.
94
0/1
0/1
0/0
.72/
0.0
7-
1.21.2
L$
23.
02
$ 1
9.18
200
70
/1/1
0/0
.036
/0.0
36-
1.61.6
L$
9
.40
$
5.8
820
07-
01-
017
0/2
/10
/0.0
67/0
.033
-1.6
1.6 L
$
9.4
0$
5
.88

coSt of EmiSSion rEduction tEchnologiES
109
Table B-3 summarizes the PGM loading values found in the literature survey. These PGM ranges are used in the main report text as the historic PGM loading values.
Table B‑3 summary of PGM loading according to technical literature (sae Technical Papers 1990‑2007)
reGuLaTion year Pt, G/L Pd, G/L rh, G/L
Tier 1 1994 1.4-1 .0 0.7-2.5 0.2
nLev 2001 0.9-0.15 1.8-14.0 0.1-0.2
Tier 2 2004 0.15 1.3-2.6 0.1-0.2
euro 1 1992 1.0 0 0.2
euro 2 1996 1.0 0 0.2
euro 3 2000 0.6-0.7 0 0.1-0.15
euro 4 2005 0 0.4 0.1-0.15
euro 5 2010 0 0.4 0.13-0.18
euro 6 2014 0 0.4 0.13-0.18
b.4 pgm CaTaLyST LoaDing Figure B-6 shows the summary of data presented in Table B-1 and B-2. It can be observed that the estimated PGM costs from Figure B-5 follow the trend of data reported for US catalyst through 2002. The estimated values fall in the lower section of the standard deviation of data, which suggests that the average PGM loading was slightly underestimated for 1990 to 1998. The trend follows the changes in PGM cost, and therefore cost per liter of catalyst, during the period 1998 to 2002. No data was found in the literature describing PGM loading of TWCs for the US since 2002.
As the emission standards in the US have not changed since the Tier 2 standards were adopted, it is reasonable to assume that the PGM loading for North American market vehicles may be extrapolated as a constant value using the Tier 2 values from Table B-2. Thus, the PGM cost per liter since 2002 would only change due to PGM market price variations. This extrapo-lated PGM cost is also included in Figure B-6, as “US corrected.”
The European case follows the same trends as the estimated cost of PGM loading through 2002, but a strong departure from the estimated value

110
appEndix B
is observed after 2002. In fact, the European costs are similar to the extrapolated US PGM costs. Both the European PGM costs and the US corrected PGM costs are far lower than the estimated costs after 2003 from Figure B-5.
The data and literature show that improvements in technology have reduced PGM loadings and allowed more efficient TWCs. In fact, the literature suggests that ultralow PGM loading is possible, with adequate durability and sulfur tolerance, by improving the OSC formulation, washcoat layering and PGM zoning. These improvements support that the increase in estimated PGM cost starting in 2003 (from Figure B-5) is related to an overestimation of the PGM demand for TWCs in the NA market. This overestimation is likely due to the increased use of precious metals for DOCs and catalyzed filters for retrofitting and emission control for heavy-duty diesel engines, which takes a percentage of the autocatalyst PGM demand.
$-
$10
$20
$30
$40
$50
$60
$70
$80
$90
$100
2010
PG
M lo
adin
g c
ost
per
lite
r, $
USD
/L
Estimated
US mean
EU mean
US Corrected
199
2
199
4
199
6
199
8
200
0
200
4
200
6
199
0
200
2
200
8
Fig. B‑6. estimated PGMs cost per liter and averaged values of information found in the literature survey for the us and eu. The dashed section of the us PGM estimated cost was calculated assuming a constant PGM loading after 2002

111
appEnDix C. ESTimaTED CoST of EmiSSion ConTRoL TEChnoLogy foR 2.0 L EnginE, gaSoLinE anD DiESEL
Table c‑1. estimated cost of emission control technologies for european gasoline Ldvs, vd=2.0 L
reGuLaTion euro 1 euro 2 euro 3 euro 4 euro 5 euro 6
inTroducTion year 1992 1996 2000 2005 2010 2014
reGuLaTed PoLLuTanTs co/hc+nox co/hc+nox co/nox/hc co/nox/hc co/nox/hc co/nox/hc
eMission LeveLs, G/kM 2.72/0.97 2.2/0.5 2.3/0.15/0.2 1.0/0.08/0.1 1.0/ 0.06/ 0.1 1.0/ 0.06/ 0.1
1. a/F control & engine‑out emissions assuming a four‑cylinder, vd=2.0 liters engine
Oxygen sensor set (typical minimum required) O2S O2S HO2S x2 HO2S x2 UEGO+O2S UEGO+HO2S
Oxygen sensor set $16 $16 $40 $40 $53 $53
Fuel system – 1/3 of cost (a) $52 $52 $65 $65 $65 $65
A/F management and combustion improvements R&D R&D R&D R&D R&D R&D
Faster microprocessor (b) - - $4 $4 $8 $8
Engine modifications $15 $15 $15 $15 $20 $20
EGR system (c) $25 $25 $39 $39 $39 $39
cost of hardware a/F control & engine‑out emissions $108 $108 $163 $163 $185 $185
2. aftertreatment systems assuming a four‑cylinder, vd=2.0 liters engine
TWC system (from Table 4-5) $73 $76 $92 $95 $101 $101
Exhaust pipe hardware (d) $12 $12 $24 $24 $24 $24
Low thermal capacity manifold - - $45 $45 $45 $45
cost of aftertreatment systems $85 $88 $161 $164 $170 $170
3. Total cost of hardware [1+2] $193 $196 $324 $327 $355 $355
4. Fixed costs (r&d, tooling, certification) (e) $24 $24 $31 $42 $42 $42
5. Total cost of emission control tech. [3+4] $217 $220 $355 $369 $397 $397
(a) Euro 1 levels in small vehicles were initially achieved with TBI. MPFI became the standard later on due to improved engine performance. Only one-third of the fuel system costs are charged to emission control; the remaining fraction is performance and fuel efficiency.
(b) Faster ECU operation describes improvements in microprocessor for number of signals and signal processing speed.
(c) EGR system includes a basic mechanically operated valve and the electronically improved system for Euro 3 to 6.
(d) Extra pipe work, change of material specifications and design.
(e) From Table 4-7. Tooling and certification are constant costs for all regulatory levels, while R&D varies depending on technology

112
appEndix c
Table c‑2. estimated cost of emission control technologies for european diesel Ldvs, vd=2.0 L
reGuLaTion euro 1 euro 2 euro 3 euro 4 euro 5 euro 6
inTroducTion year 1992 1996 2000 2005 2009 2014
reGuLaTed PoLLuTanTs (nox+hc/PM/co)
(nox+hc/PM/co) (nox/PM/co) (nox/PM/co) (nox/PM/co) (nox/PM/co)
eMission LeveLs, G/kM 1.13/0.18/3.16 0.7/0.08/1 0.5/0.05/0.64 0.25/0.025/0.5 0.18/0.005/0.5 0.08/0.0045/0.5
1. a/F control & engine‑out emissions assuming a 4‑cyl engine, vd= 2.0 liters
Fuel system - 50% of cost (a) - $50 $323 $355 $390 $429
Turbocharger - 50% of cost (b) - $75 $75 $138
Intercooler - 50% of costs (b) - $32 $32 $32
VGT (extra cost) - 50% of costs (b) - $55
EGR valves (c) $30 $30 $30 $38 $38 $38
EGR cooling system (c) $36 $36 $44 $51 $58
Engine mapping and tuning (d) - R&D R&D R&D R&D R&D
Improvements on combustion chamber & nozzle geometry (e) - R&D R&D R&D R&D R&D
cost of a/F control & engine‑out emissions $30 $116 $389 $543 $586 $750
2. aftertreatment systems assuming a 4‑cyl engine, vd= 2.0 liters
Diesel oxidation catalyst (DOC) (f) - - $78 $78 $78 $78
Diesel particulate filter (DPF) (f) - - - - $332 $332
Lean NOX trap (LNT) (f) - - - - - $413
Selective catalytic reduction (SCR) (g) - - - - - -
cost of aftertreatment systems (h) $0 $0 $78 $78 $410 $813
3. Total cost of hardware [1+2] $30 $116 $467 $621 $996 $1,572
4. Fixed costs (r&d, tooling, certification) $26 $26 $51 $51 $51 $51
5. Total cost of emissions control tech [3+4] $56 $142 $518 $672 $1,047 $1,623
(a) Cost of rotary pump, HPFI pump, valves, common rail, and injectors. 50% of cost is charged to non-CO2 regulated emissions
(b) Single stage turbocharging assumed. 50% of cost is charged to non-CO2 regulated emissions
(c) Single loop EGR. 50% of cost is charged to non-CO2 regulated emissions
(d) Maximization of fuel economy and minimization of emissions by fuel injection strategies, air management, turbo, EGR.
(e) Research and development focused on improving combustion (fuel efficiency and emissions) through modeling (CFD) and experiments.
(f) See diesel aftertreatment detail.
(g) SCR cost includes the cost of dosage unit and tank. NH3 slip catalyst included. NOX sensor and H2S catalyst not included in cost.
(h) The cost of aftertreatment systems includes a minimum of devices for control of HC, CO, PM and NOX. The cost presented may vary depending on specific engine applications.


BEIJING BERLIN BRUSSELS SAN FRANCISCO WASHINGTON
www.theicct.org
The International Council on Clean Transportation is an independent
nonprofit organization founded to provide first-rate objective research
and technical and scientific analysis to environmental regulators. Our
mission is to improve the environmental performance and energy
efficiency of road, marine, and air transportation, in order to benefit
public health and mitigate climate change.