estcp cost and performance report · pdf fileestcp cost and performance report environmental...
TRANSCRIPT
ESTCPCost and Performance Report
ENVIRONMENTAL SECURITYTECHNOLOGY CERTIFICATION PROGRAM
U.S. Department of Defense
(MM-0108)
Handheld Sensor for UXO Discrimination
June 2006
i
COST & PERFORMANCE REPORT ESTCP Project: MM-0108
TABLE OF CONTENTS
Page
1.0 EXECUTIVE SUMMARY ................................................................................................ 1 1.1 BACKGROUND .....................................................................................................1 1.2 OBJECTIVES OF THE DEMONSTRATION........................................................1 1.3 DEMONSTRATION RESULTS.............................................................................2
2.0 TECHNOLOGY DESCRIPTION ...................................................................................... 3 2.1 TECHNOLOGY DEVELOPMENT AND APPLICATION...................................3 2.2 PROCESS DESCRIPTION .....................................................................................5 2.3 PREVIOUS TESTING OF THE TECHNOLOGY .................................................5 2.4 ADVANTAGES AND LIMITATIONS OF THE TECHNOLOGY.......................5
3.0 DEMONSTRATION DESIGN .......................................................................................... 7 3.1 PERFORMANCE OBJECTIVES ...........................................................................7 3.2 SELECTION OF TEST SITE..................................................................................7 3.3 TEST SITE HISTORY AND CHARACTERISTICS .............................................7 3.4 PHYSICAL SETUP AND OPERATION ...............................................................8 3.5 ANALYTICAL PROCEDURES.............................................................................8
4.0 PERFORMANCE ASSESSMENT .................................................................................. 11 4.1 PERFORMANCE DATA......................................................................................11 4.2 PERFORMANCE CRITERIA ..............................................................................11 4.3 DATA ASSESSMENT..........................................................................................12 4.4 TECHNOLOGY COMPARISON.........................................................................14
5.0 COST ASSESSMENT...................................................................................................... 17 5.1 COST REPORTING..............................................................................................17 5.2 COST ANALYSIS.................................................................................................18 5.3 COST COMPARISON ..........................................................................................19
6.0 IMPLEMENTATION ISSUES ........................................................................................ 21 6.1 COST OBSERVATIONS......................................................................................21 6.2 PERFORMANCE OBSERVATIONS...................................................................21 6.3 SCALE-UP ............................................................................................................21 6.4 LESSONS LEARNED...........................................................................................22 6.5 END-USER ISSUES, APPROACH TO REGULATORY COMPLIANCE
AND ACCEPTANCE............................................................................................22
7.0 REFERENCES ................................................................................................................. 25 APPENDIX A POINTS OF CONTACT......................................................................... A-1
ii
LIST OF FIGURES
Page Figure 1. ROC for Ground Truth Targets Less Than 0.3 Depth. ........................................... 2 Figure 2. Electromagnetic Induction and the EM61-HH. ...................................................... 3 Figure 3. EM61-HH and Grid Template. ............................................................................... 4 Figure 4. Blind Test Grid Location (left) and Notional Schematic Layout. .......................... 8 Figure 5. User Interface for Inversion and Target Classification........................................... 9 Figure 6. EM61-HH ROC for Ground Truth Targets Less Than 0.3 m Depth. ................... 14
LIST OF TABLES
Page
Table 1. The Standard Inert Ordnance Targets. .................................................................... 4 Table 2. Threshold Depths for Standard UXO Targets. ....................................................... 6 Table 3. Performance Criteria for Demonstration. ............................................................. 12 Table 4. Expected Performance and Actual Performance. ................................................. 12 Table 5. Summary of Blind Grid Performance. .................................................................. 13 Table 6. ATC Blind Grid Discrimination Performance Summary. .................................... 15 Table 7. Equipment Cost for Demonstration. ..................................................................... 17 Table 8. Labor Costs for Demonstration............................................................................. 18 Table 9. Demonstration Cost Summary.............................................................................. 18 Table 10. Standardized On Site Demonstration Labor Cost Summary. ............................... 19

iii
ACRONYMS AND ABBREVIATIONS AEC Army Environmental Center AETC AETC Incorporated ATC Aberdeen Test Center CAIS Chemical Agent Identification Set EMI electromagnetic induction EPA Environmental Protection Agency ESTCP Environmental Security Technology Certification Program HEAT high energy anti-tank IDL Interactive Data Language (Research Systems, Inc.) MTADS multisensor towed array detection system NRL Naval Research Laboratory OEW ordnance and explosive waste Pd probability of detection Pfp probability of false positive RCWM recovered chemical warfare materiel RMS root mean square (standard deviation) ROC receiver operating characteristic SERDP Strategic Environmental Research and Development Program UXO Unexploded Ordnance
iv
ACKNOWLEDGEMENTS This work was sponsored by the Environmental Security Technology Certification Program (ESTCP) under contract DACA72-01-C-0023. The government liaison officer was George Robitaille of the Army Environmental Center (AEC). We appreciate the assistance from Rurik Loder of the Aberdeen Test Center (ATC) in making inert ordnance and clutter samples available to us for testing prior to the demonstration.
Technical material contained in this report has been approved for public release.
1
1.0 EXECUTIVE SUMMARY 1.1 BACKGROUND A significant fraction of the money spent by the United States to remediate buried unexploded ordnance (UXO) at closed and closing defense sites and neighboring areas goes to digging up things that could safely be left in the ground – range scrap and exploded ordnance fragments, as well as cultural, agricultural and industrial clutter. For several years, the Strategic Environmental Research and Development Program (SERDP) and the Environmental Security Technology Certification Program (ESTCP) have been investing in research and development of technologies capable of discriminating between buried UXO and clutter. This project demonstrated the use of commercially available technology (Geonics EM61-HH handheld metal detector) for UXO/clutter discrimination. It was a demonstration of cued identification – the target locations were known a priori, and the task was to determine whether each target was UXO or clutter. The Geonics EM61-HH handheld metal detector is a pulsed electromagnetic induction (EMI) sensor. The sensor head consists of offset transmit and receive coils mounted at the end of a shaft held by the operator. Electrical currents sent through the transmit coil create a time varying electromagnetic field that induces eddy currents in nearby metal objects. The electromagnetic field created by these eddy currents is measured by the receive coil. The response caused by a buried metal object (UXO or clutter) depends on the size and shape of the object as well as its location and orientation relative to the sensor head. Response data collected over an area above the object are inverted to determine size- and shape-related target features that are then used for UXO/clutter discrimination [1]. Accurate inversion relies on capturing subtle spatial patterns in the EMI response. Research has shown that good results require precise knowledge of the spatial locations of the sensor readings relative to one another [2]. In this demonstration, accurate positioning control was established by collecting data on a fixed 6x6 point, 75 cm square grid defined by a plywood template placed on the ground above the target. The demonstration was conducted on the Blind Grid at the Aberdeen Test Center (ATC) Standardized UXO Technology Demonstration Site. Experience with controlled test stand measurements over standard UXO items and clutter indicates that the threshold for target identification is about 40 mV in electromagnetically quiet areas such as the ATC test site. Classification performance peaks out for signal levels greater than 100 mV. For the high signal test stand data, the probability of detection or correctly identifying UXO as UXO is 95% (79 of 83 UXO target grids) at a false alarm rate (classifying clutter as UXO) of 26% (13 of 50 clutter grids). The false alarm rate increases to 40% if the classification rule is relaxed enough to ensure 100% probability of detection. 1.2 OBJECTIVES OF THE DEMONSTRATION The objective of the demonstration was to show that by following proper data collection protocols and using physics-based post-processing, the EM61-HH handheld metal detector can
2
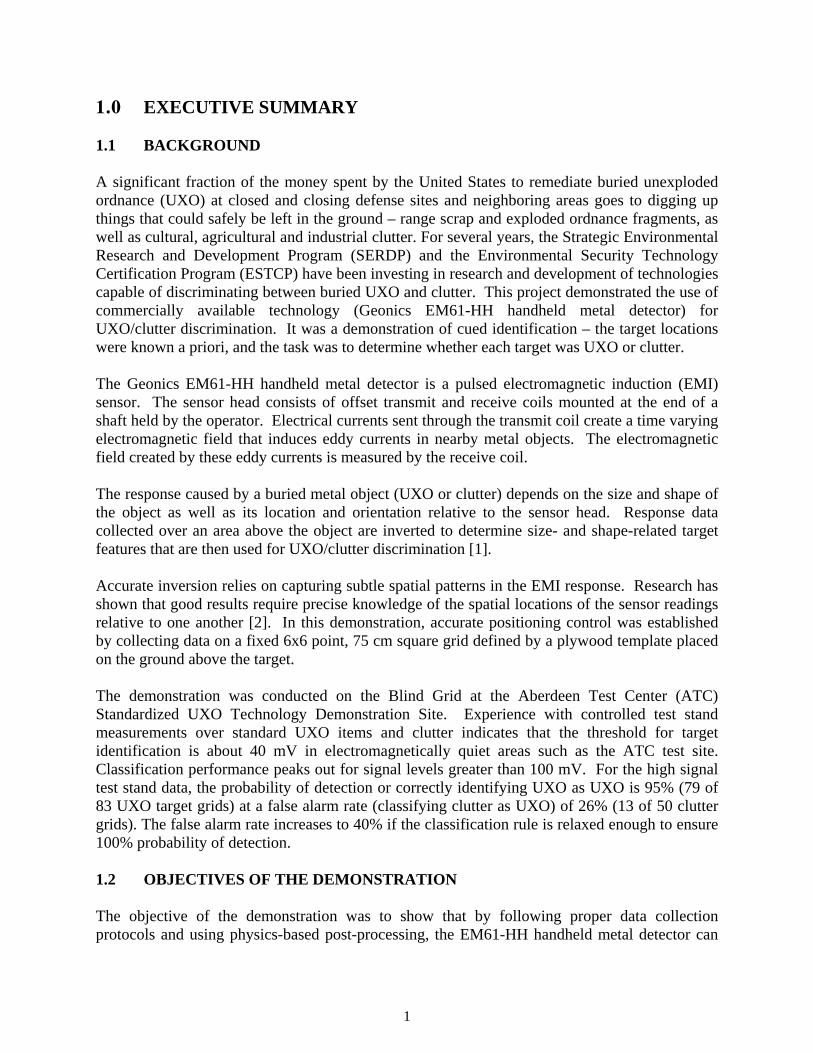
be used in a cued identification mode to reliably discriminate between buried UXO and clutter. Results of controlled test-stand measurements had indicated that 95% of detected UXO could be correctly identified as UXO, while 74% of the clutter items could be correctly classified as not UXO. In the field demonstration, the corresponding performance levels were reduced to 83% and 49%, respectively [3]. 1.3 DEMONSTRATION RESULTS Data were collected only at grid locations where the signal level was greater than 40 mV. Experience has shown that discrimination performance with the EM61-HH is poor at lower signal levels. There were 145 targets in the Blind Grid that met this criterion, and they were all interrogated during a 2-day period. This production rate is artificially high because of the layout of the Blind Grid. In the field, with targets scattered about randomly in varying terrain and vegetation, the production rate should average about 30 targets per day [4]. Two-thirds of the blind grid targets were detected at the 40 mV threshold. For shallow (<30 cm) targets, the detection rate was 100%. The detection rate dropped to 40% for targets in the depth range 30 cm to 1 m, and none of the targets deeper than 1 m were detected. The ROC curve for ground truth targets shallower than 30 cm is reproduced in Figure ES-1. The difference between the blue and red curves represents the discrimination performance. The blue line represents performance based solely on signal strength, with no attempt to differentiate between UXO and clutter. The red line shows performance after discrimination processing. At 100% probability of detection (correctly identifying all UXO as UXO), 55% of the clutter items are correctly identified as not UXO. This performance is similar to that achieved under controlled test conditions. For test stand data, we found a probability of detection of 95% (79 of 83 UXO target grids) at a false alarm rate (classifying clutter as UXO) of 26% (13 of 50 clutter grids). For the test stand data, the false alarm rate increased to 40% when the classification rule was relaxed enough to ensure 100% probability of detection.
Figure 1. ROC for Ground Truth Targets Less Than 0.3 Depth.
3
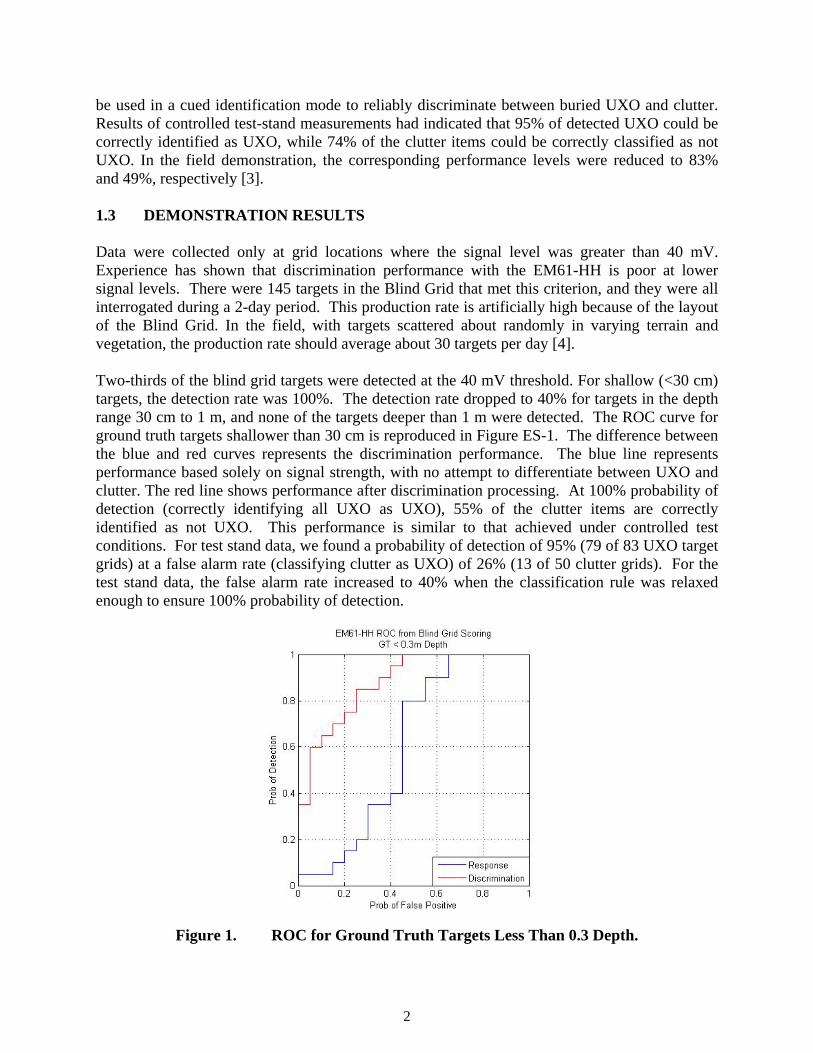
2.0 TECHNOLOGY DESCRIPTION 2.1 TECHNOLOGY DEVELOPMENT AND APPLICATION The Geonics EM61-HH handheld metal detector is a time domain or pulsed electromagnetic induction sensor (Figure 1). The transmitted primary field induces eddy currents in the target, which in turn radiate a secondary field measured by the receive coil. The EM61-HH measures the secondary field at time delays of 147 :sec, 263 :sec, 414 :sec and 613 :sec after the primary field shutoff. In this demonstration, we relied almost exclusively on the signal at the first time gate. Signals from later gates were used only occasionally to resolve discrimination ambiguities.
Figure 2. Electromagnetic Induction and the EM61-HH. The electromagnetic induction (EMI) response varies in a predictable way with target size, shape, and orientation. This can be exploited for target classification. Our discrimination approach [1] uses a model-based estimation procedure to determine whether or not an unknown target is likely to be a UXO item. It entails estimating the size and shape of the target from the spatial pattern of the induced field above the target. The EM61 signal is a linear function of the flux through the receive coil. In our model, the flux is assumed to originate from an induced dipole moment at the target location given by
0TUBU Hm =
where H0 is the peak primary field at the target, U is the transformation matrix between the coordinate directions and the principal axes of the target, and B is an empirically determined, effective magnetic polarizability matrix. For an arbitrary compact object, this matrix can be diagonalized about three primary body axes. The relative magnitudes of the eigenvalues ($s) are determined by the size, shape, and composition of the object. The transformation matrix contains the angular information about the orientation of the principal axes. For cylindrical objects like most UXO, there are only two unique coefficients, corresponding to the longitudinal ($L) and transverse ($T) directions. Clutter items generally have three distinct $ values. Discrimination is based on target $s estimated by inverting spatially mapped data using a least-squares error minimization procedure.
4
The standard emplaced UXO items in the demonstration are listed in Table 1. Some variants (different model numbers) for the projectiles, mortars, and rocket warheads were also included in the test site. Clutter items consisted mainly of range scrap recovered at the Aberdeen Test Center. The Blind Test Grid is an open, flat field with deep, poorly-drained, silty loam soil.
Table 1. The Standard Inert Ordnance Targets.
20mm projectile M55 60mm mortar M49A3 40mm grenade M385 2.75 inch rocket M230 40mm projectile MKII MK 118 Rockeye BDU-28 submunition 81mm mortar M374 BLU-26 submunition 105mm HEAT M456 M42 submunition 105mm projectile M60 57mm projectile APC M86 155mm projectile M483A1
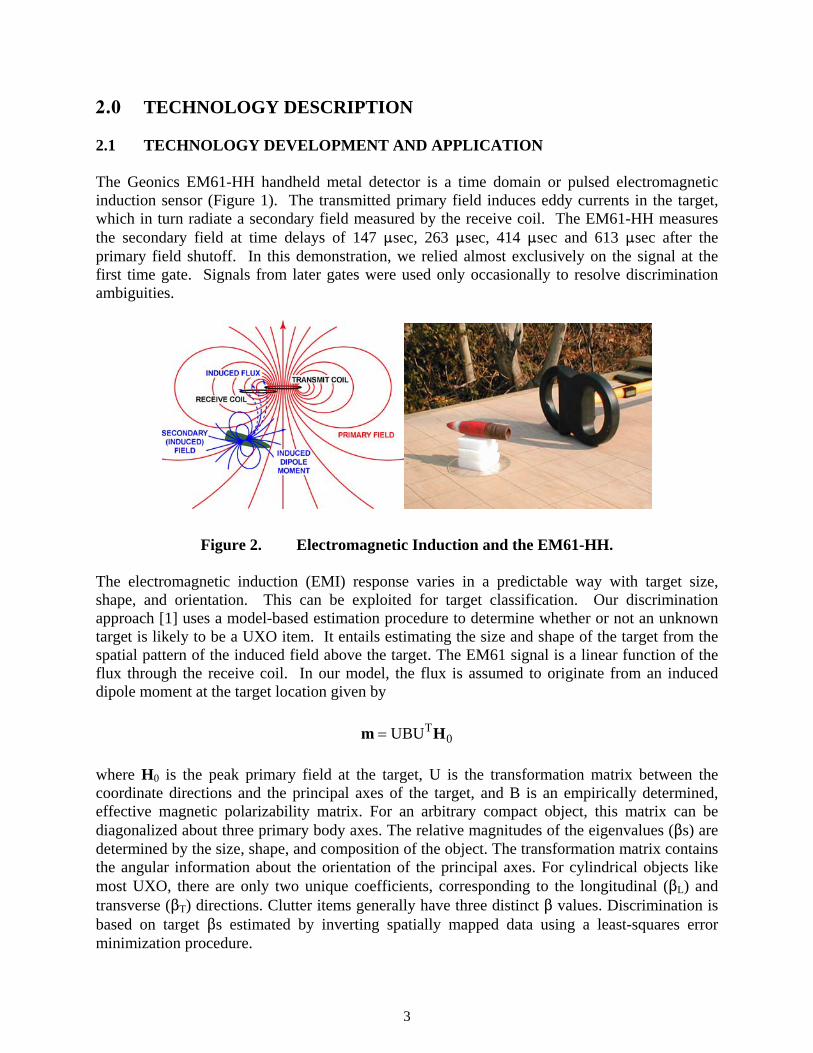
The standard EM61-HH consists of a sensor head mounted on a shaft, a backpack containing battery power and electronics, and a handheld field computer for data acquisition. We are using the sensor in a cued identification mode: target locations are known and have been flagged. Data are collected above each target on a 75 cm square, 6x6 point grid with the EM61-HH. A plywood grid template is first placed on the ground over the target (Figure 2). Grid points are marked on the template at the intersections of two perpendicular sets of lines. The line spacing is 15 cm and there are six lines in each set. A piece of Plexiglas marked with crosshairs is attached to the bottom of the sensor head. The EM61-HH sensor head is placed flat on the plywood template. It is precisely aligned and located at the grid points by lining up the crosshairs on the sensor head with the grid lines on the template. The positioning error is believed to be on the order of a few mm. The grid does not need to be precisely centered over the target. Actual target location relative to the center of the grid is determined as part of the data inversion. Sensor readings are averaged for a couple of seconds at each grid point and leveled using blank readings taken off to the side of the template.
Figure 3. EM61-HH and Grid Template.
5
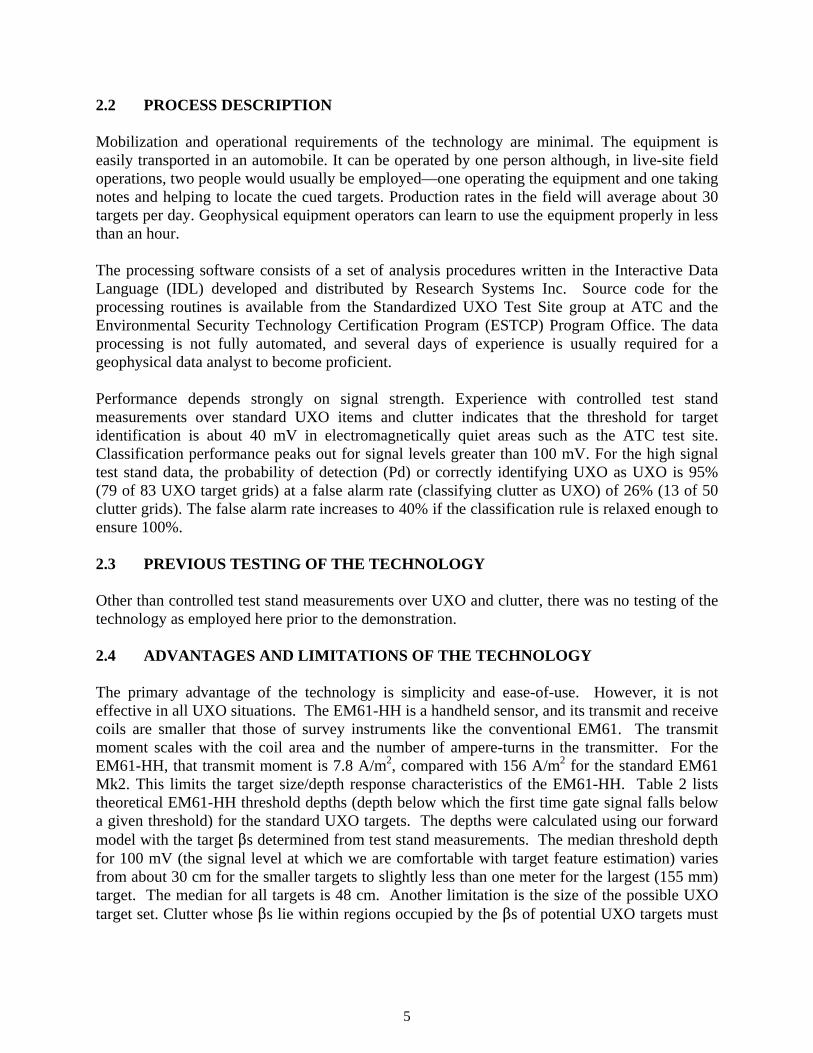
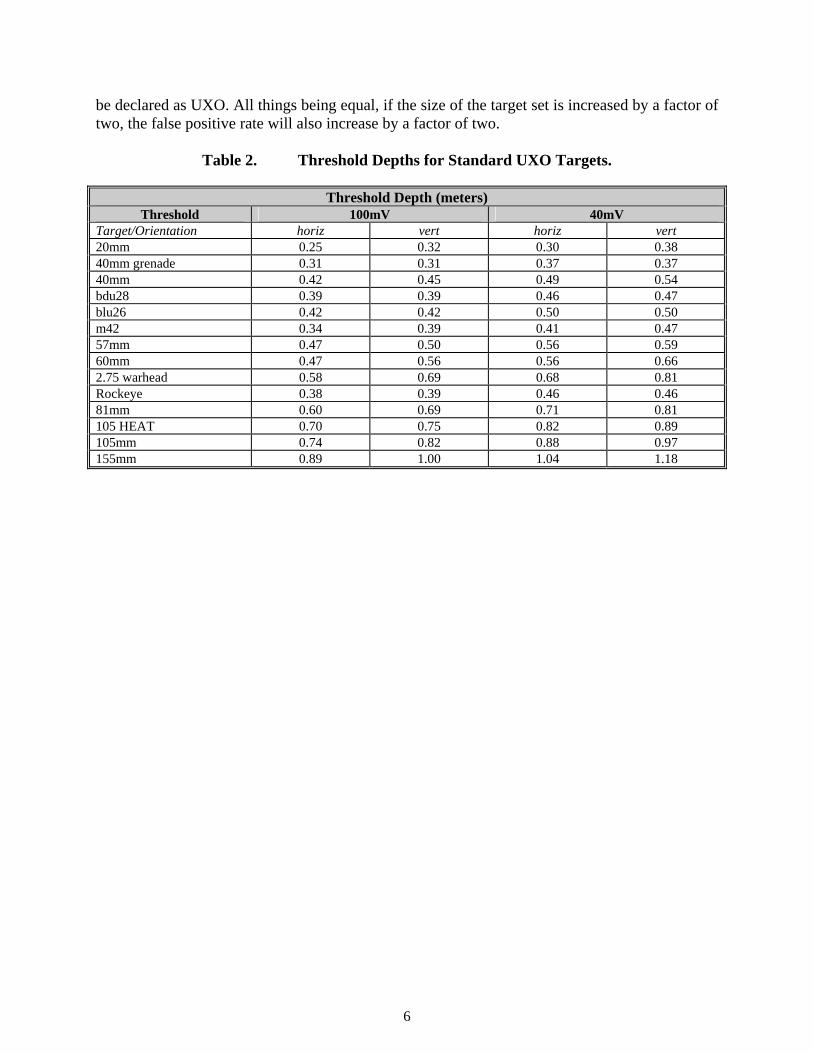
2.2 PROCESS DESCRIPTION Mobilization and operational requirements of the technology are minimal. The equipment is easily transported in an automobile. It can be operated by one person although, in live-site field operations, two people would usually be employed—one operating the equipment and one taking notes and helping to locate the cued targets. Production rates in the field will average about 30 targets per day. Geophysical equipment operators can learn to use the equipment properly in less than an hour. The processing software consists of a set of analysis procedures written in the Interactive Data Language (IDL) developed and distributed by Research Systems Inc. Source code for the processing routines is available from the Standardized UXO Test Site group at ATC and the Environmental Security Technology Certification Program (ESTCP) Program Office. The data processing is not fully automated, and several days of experience is usually required for a geophysical data analyst to become proficient. Performance depends strongly on signal strength. Experience with controlled test stand measurements over standard UXO items and clutter indicates that the threshold for target identification is about 40 mV in electromagnetically quiet areas such as the ATC test site. Classification performance peaks out for signal levels greater than 100 mV. For the high signal test stand data, the probability of detection (Pd) or correctly identifying UXO as UXO is 95% (79 of 83 UXO target grids) at a false alarm rate (classifying clutter as UXO) of 26% (13 of 50 clutter grids). The false alarm rate increases to 40% if the classification rule is relaxed enough to ensure 100%. 2.3 PREVIOUS TESTING OF THE TECHNOLOGY Other than controlled test stand measurements over UXO and clutter, there was no testing of the technology as employed here prior to the demonstration. 2.4 ADVANTAGES AND LIMITATIONS OF THE TECHNOLOGY The primary advantage of the technology is simplicity and ease-of-use. However, it is not effective in all UXO situations. The EM61-HH is a handheld sensor, and its transmit and receive coils are smaller that those of survey instruments like the conventional EM61. The transmit moment scales with the coil area and the number of ampere-turns in the transmitter. For the EM61-HH, that transmit moment is 7.8 A/m2, compared with 156 A/m2 for the standard EM61 Mk2. This limits the target size/depth response characteristics of the EM61-HH. Table 2 lists theoretical EM61-HH threshold depths (depth below which the first time gate signal falls below a given threshold) for the standard UXO targets. The depths were calculated using our forward model with the target $s determined from test stand measurements. The median threshold depth for 100 mV (the signal level at which we are comfortable with target feature estimation) varies from about 30 cm for the smaller targets to slightly less than one meter for the largest (155 mm) target. The median for all targets is 48 cm. Another limitation is the size of the possible UXO target set. Clutter whose $s lie within regions occupied by the $s of potential UXO targets must
6
be declared as UXO. All things being equal, if the size of the target set is increased by a factor of two, the false positive rate will also increase by a factor of two.
Table 2. Threshold Depths for Standard UXO Targets.
Threshold Depth (meters) Threshold 100mV 40mV
Target/Orientation horiz vert horiz vert 20mm 0.25 0.32 0.30 0.38 40mm grenade 0.31 0.31 0.37 0.37 40mm 0.42 0.45 0.49 0.54 bdu28 0.39 0.39 0.46 0.47 blu26 0.42 0.42 0.50 0.50 m42 0.34 0.39 0.41 0.47 57mm 0.47 0.50 0.56 0.59 60mm 0.47 0.56 0.56 0.66 2.75 warhead 0.58 0.69 0.68 0.81 Rockeye 0.38 0.39 0.46 0.46 81mm 0.60 0.69 0.71 0.81 105 HEAT 0.70 0.75 0.82 0.89 105mm 0.74 0.82 0.88 0.97 155mm 0.89 1.00 1.04 1.18

7
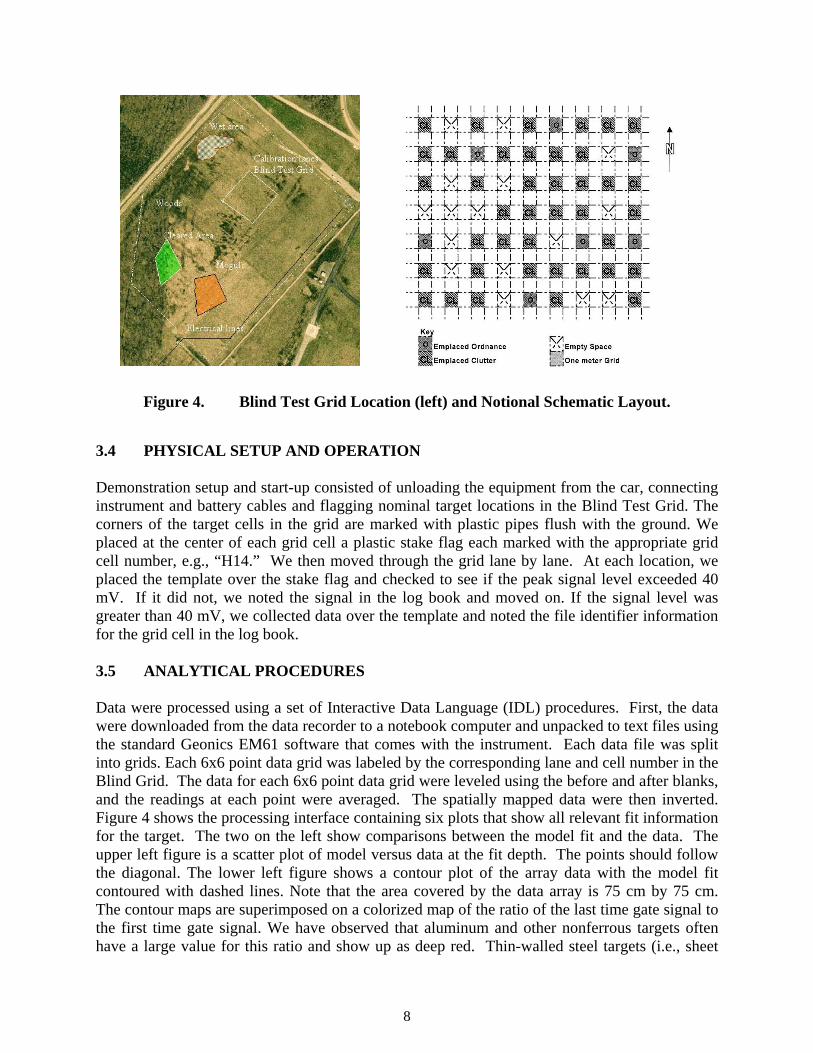
3.0 DEMONSTRATION DESIGN 3.1 PERFORMANCE OBJECTIVES The primary quantitative performance criteria are detection efficiency and false positive rejection rate. Detection efficiency measures the degree to which the detection performance of the system is preserved after application of discrimination techniques. It is a number between 0 and 1. An efficiency of 1 implies that all ordnance items initially detected by the sensor were retained after discrimination processing was employed. The false positive rejection rate measures the extent to which the non-UXO items are identified as clutter by the discrimination processing. The rejection rate is a number between 0 and 1. A rejection rate of 1 implies that all emplaced clutter items initially detected by the sensor were correctly rejected after discrimination processing was employed. Results of controlled test stand measurements conducted prior to the demonstration indicated that the EM61-HH used with a grid template in a cued identification mode should be capable of achieving a detection efficiency of 95% with a false alarm rejection rate of 74%. The performance achieved in the demonstration is reported in reference [3]. Of the 65% of UXO targets detected, 83% were correctly identified as UXO (detection efficiency), with a false positive rejection rate of 49%. 3.2 SELECTION OF TEST SITE The demonstration was carried out on the Blind Test Grid at the Standardized UXO Technology Demonstration Site at the Aberdeen Test Center. Testing at this site is independently administered and analyzed by the government for the purposes of characterizing technologies, tracking performance with system development, comparing performance of different systems, and comparing performance in different environments. 3.3 TEST SITE HISTORY AND CHARACTERISTICS The Aberdeen Standardized Test Site was constructed during 2001-2002, and the first demonstrations at the site (illustrated in Figure 3), were conducted during the summer of 2002. This demonstration took place during October 2002. The aerial photograph on the left side shows the location of the Blind Test Grid within the Standardized Test Site. A schematic of the layout of a portion of the grid is shown on the right. This is a notional schematic extracted from the test site protocols and does not show actual locations of UXO or clutter items. The Blind Test Grid is designed to test a demonstrator's ability to detect and discriminate clutter from ordnance under conditions favorable for detection and/or discrimination. The grid system is clearly marked so demonstrators will know their location on the field at all times. The Blind Test Grid measures 40 m by 40 m and contains four hundred 2 m square grid cells in a regular array. At the center of each cell within the grid there are nominally three target possibilities—nothing, clutter, or ordnance—although a few of the grid cells contain multiple targets.
8
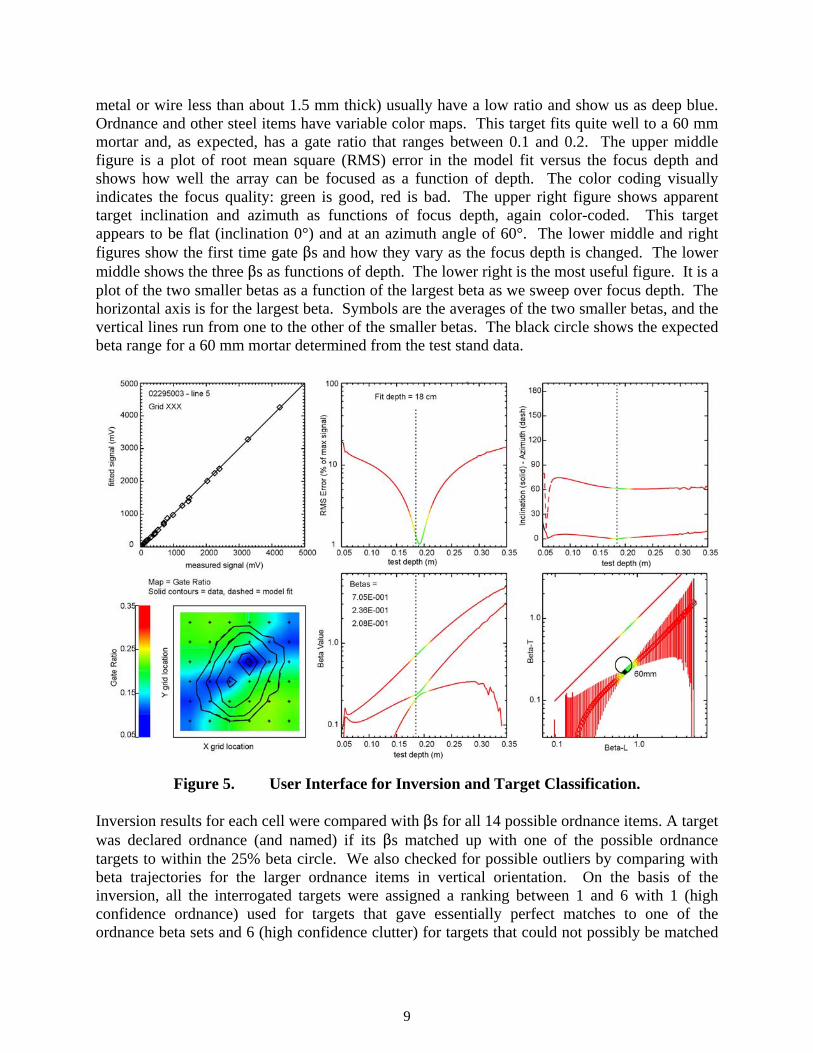
Figure 4. Blind Test Grid Location (left) and Notional Schematic Layout. 3.4 PHYSICAL SETUP AND OPERATION Demonstration setup and start-up consisted of unloading the equipment from the car, connecting instrument and battery cables and flagging nominal target locations in the Blind Test Grid. The corners of the target cells in the grid are marked with plastic pipes flush with the ground. We placed at the center of each grid cell a plastic stake flag each marked with the appropriate grid cell number, e.g., “H14.” We then moved through the grid lane by lane. At each location, we placed the template over the stake flag and checked to see if the peak signal level exceeded 40 mV. If it did not, we noted the signal in the log book and moved on. If the signal level was greater than 40 mV, we collected data over the template and noted the file identifier information for the grid cell in the log book. 3.5 ANALYTICAL PROCEDURES Data were processed using a set of Interactive Data Language (IDL) procedures. First, the data were downloaded from the data recorder to a notebook computer and unpacked to text files using the standard Geonics EM61 software that comes with the instrument. Each data file was split into grids. Each 6x6 point data grid was labeled by the corresponding lane and cell number in the Blind Grid. The data for each 6x6 point data grid were leveled using the before and after blanks, and the readings at each point were averaged. The spatially mapped data were then inverted. Figure 4 shows the processing interface containing six plots that show all relevant fit information for the target. The two on the left show comparisons between the model fit and the data. The upper left figure is a scatter plot of model versus data at the fit depth. The points should follow the diagonal. The lower left figure shows a contour plot of the array data with the model fit contoured with dashed lines. Note that the area covered by the data array is 75 cm by 75 cm. The contour maps are superimposed on a colorized map of the ratio of the last time gate signal to the first time gate signal. We have observed that aluminum and other nonferrous targets often have a large value for this ratio and show up as deep red. Thin-walled steel targets (i.e., sheet
9
metal or wire less than about 1.5 mm thick) usually have a low ratio and show us as deep blue. Ordnance and other steel items have variable color maps. This target fits quite well to a 60 mm mortar and, as expected, has a gate ratio that ranges between 0.1 and 0.2. The upper middle figure is a plot of root mean square (RMS) error in the model fit versus the focus depth and shows how well the array can be focused as a function of depth. The color coding visually indicates the focus quality: green is good, red is bad. The upper right figure shows apparent target inclination and azimuth as functions of focus depth, again color-coded. This target appears to be flat (inclination 0°) and at an azimuth angle of 60°. The lower middle and right figures show the first time gate $s and how they vary as the focus depth is changed. The lower middle shows the three $s as functions of depth. The lower right is the most useful figure. It is a plot of the two smaller betas as a function of the largest beta as we sweep over focus depth. The horizontal axis is for the largest beta. Symbols are the averages of the two smaller betas, and the vertical lines run from one to the other of the smaller betas. The black circle shows the expected beta range for a 60 mm mortar determined from the test stand data.
Figure 5. User Interface for Inversion and Target Classification.
Inversion results for each cell were compared with $s for all 14 possible ordnance items. A target was declared ordnance (and named) if its $s matched up with one of the possible ordnance targets to within the 25% beta circle. We also checked for possible outliers by comparing with beta trajectories for the larger ordnance items in vertical orientation. On the basis of the inversion, all the interrogated targets were assigned a ranking between 1 and 6 with 1 (high confidence ordnance) used for targets that gave essentially perfect matches to one of the ordnance beta sets and 6 (high confidence clutter) for targets that could not possibly be matched
10
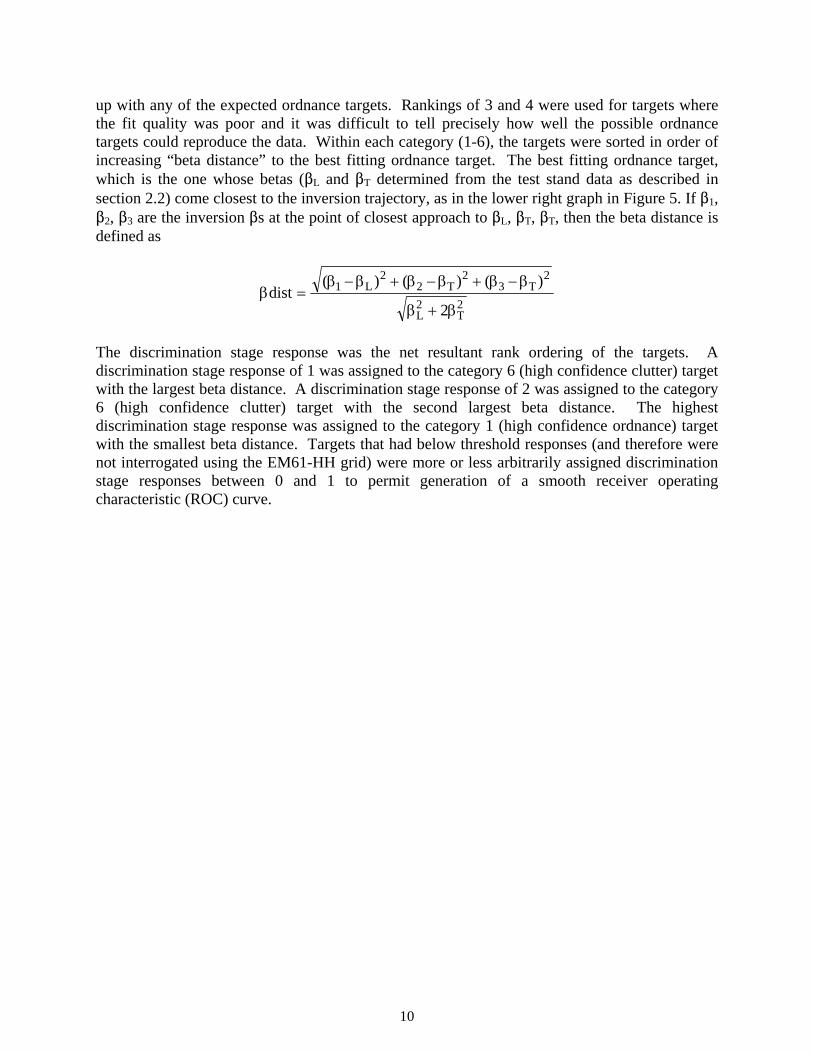
up with any of the expected ordnance targets. Rankings of 3 and 4 were used for targets where the fit quality was poor and it was difficult to tell precisely how well the possible ordnance targets could reproduce the data. Within each category (1-6), the targets were sorted in order of increasing “beta distance” to the best fitting ordnance target. The best fitting ordnance target, which is the one whose betas ($L and $T determined from the test stand data as described in section 2.2) come closest to the inversion trajectory, as in the lower right graph in Figure 5. If $1, $2, $3 are the inversion $s at the point of closest approach to $L, $T, $T, then the beta distance is defined as
2T
2L
2T3
2T2
2L1
2
)()()(dist
β+β
β−β+β−β+β−β=β
The discrimination stage response was the net resultant rank ordering of the targets. A discrimination stage response of 1 was assigned to the category 6 (high confidence clutter) target with the largest beta distance. A discrimination stage response of 2 was assigned to the category 6 (high confidence clutter) target with the second largest beta distance. The highest discrimination stage response was assigned to the category 1 (high confidence ordnance) target with the smallest beta distance. Targets that had below threshold responses (and therefore were not interrogated using the EM61-HH grid) were more or less arbitrarily assigned discrimination stage responses between 0 and 1 to permit generation of a smooth receiver operating characteristic (ROC) curve.
11
4.0 PERFORMANCE ASSESSMENT 4.1 PERFORMANCE DATA The performance scoring [3] is conducted in two stages, the response stage and the discrimination stage. For both stages, the Pd and the false alarms are reported as ROC curves. False alarms are divided into those anomalies that correspond to emplaced clutter items, measuring the probability of false positive (Pfp) and those that do not correspond to any known item, termed background alarms. The response stage scoring evaluates the ability of the system to detect emplaced targets without regard to ability to discriminate ordnance from other anomalies. For the response stage, we provided the scoring committee with a target response from each grid square, along with the noise level below which target responses are deemed insufficient to warrant further investigation (40 mV). The discrimination stage evaluates the ability to correctly identify ordnance as such and to reject clutter. For the discrimination stage, we provided the scoring committee with our rank ordering (as described in Section 3.5) for each grid square. The values in this list are prioritized based on our determination that a grid square is likely to contain ordnance. Higher values are indicative of higher confidence that an ordnance item is present at the specified location. We chose the threshold in the prioritized ranking for performance evaluation as the value corresponding to a signal level of 60 mV. The demonstration is also scored on efficiency and rejection ratios, which measure the effectiveness of the discrimination stage processing. The goal of discrimination is to retain the greatest number of ordnance detections from the anomaly list, while rejecting the maximum number of anomalies arising from nonordnance items. The efficiency ratio measures the fraction of detected ordnance retained after discrimination, while the rejection ratio measures the fraction of false alarms rejected. Both measures are defined relative to performance at the level below which all responses are considered noise (40 mV). 4.2 PERFORMANCE CRITERIA Table 3 lists the performance criteria for the demonstration and the corresponding expected performance. Detection efficiency measures the degree to which the detection performance of the sensor system is preserved after applying discrimination techniques. Efficiency is a number between 0 and 1, with 1 implying that all ordnance items initially detected in the response stage were retained at the discrimination stage. The false positive rejection rate measures the degree to which the sensor system’s false positive performance is improved over the response stage false positive performance. The rejection rate is a number between 0 and 1, with 1 implying that all emplaced clutter items initially detected in the response stage were correctly rejected at the discrimination stage. Our expected values for efficiency and rejection rate are based on the test stand results described in Section 2.2.
12
Table 3. Performance Criteria for Demonstration.
Type of Performance
Objective Primary Performance Criteria Expected Performance
(Metric) Qualitative 1. Ease of Use Operator acceptance
Quantitative 1. Detection Efficiency 0.95
2. False Positive Rejection Rate 0.74
The quantitative performance objectives were evaluated under auspices of the Standardized UXO Technology Demonstration Site Program [3]. The expected and actual performance (as confirmed by the government evaluation) is summarized in Table 4.
Table 4. Expected Performance and Actual Performance.
Performance Criteria Expected Confirmation Method Actual Response stage
1. Probability of detection 2. Probability of false alarm 3. Probability of background
alarm
* * *
Government Evaluation 0.65 0.65 0.10
Discrimination stage 1. Probability of detection 2. Probability of false alarm 3. Probability of background
alarm 4. Efficiency 5. Rejection rate
* * *
0.95 0.74
Government Evaluation 0.55 0.30 0.00 0.83 0.49
* Unknown—depends on target size/depth distribution and clutter 4.3 DATA ASSESSMENT It is not possible to assign values to the expected performance for response stage—probability of detection, probability of false alarm, or probability of background alarm. They depend on unknown, site-specific parameters relating to the emplaced target size, depth, and orientation distribution and the amount of residual clutter at the site that was not removed before the site became operational. The same holds true for these quantities at the discrimination stage since they are a dilution of the corresponding response stage quantities that accompanies the discrimination stage processing. The actual values for efficiency and rejection rate reported in Table 4 are based on a discrimination stage threshold level of 60 mv. The ease of use was a qualitative performance objective for the EM61-HH. We believe that it was met during the demonstration was confirmed by the operator and by the time required to collect the data on the Blind Grid. All 400 grid cells were interrogated during a 2-day period. As noted previously, the system has subsequently been used by a commercial team on a live site [4]. There, the targets were anomalies picked from a standard EM61 survey and had to be re-
13
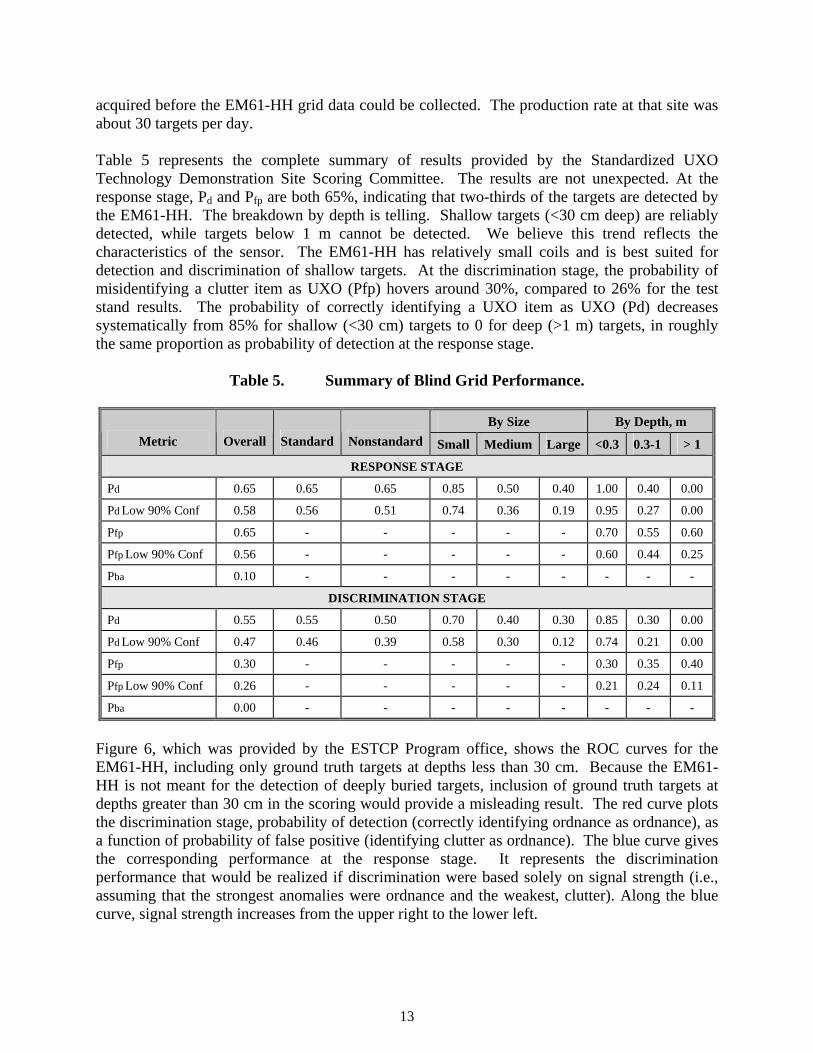
acquired before the EM61-HH grid data could be collected. The production rate at that site was about 30 targets per day. Table 5 represents the complete summary of results provided by the Standardized UXO Technology Demonstration Site Scoring Committee. The results are not unexpected. At the response stage, Pd and Pfp are both 65%, indicating that two-thirds of the targets are detected by the EM61-HH. The breakdown by depth is telling. Shallow targets (<30 cm deep) are reliably detected, while targets below 1 m cannot be detected. We believe this trend reflects the characteristics of the sensor. The EM61-HH has relatively small coils and is best suited for detection and discrimination of shallow targets. At the discrimination stage, the probability of misidentifying a clutter item as UXO (Pfp) hovers around 30%, compared to 26% for the test stand results. The probability of correctly identifying a UXO item as UXO (Pd) decreases systematically from 85% for shallow (<30 cm) targets to 0 for deep (>1 m) targets, in roughly the same proportion as probability of detection at the response stage.
Table 5. Summary of Blind Grid Performance.
By Size By Depth, m Metric Overall Standard Nonstandard Small Medium Large <0.3 0.3-1 > 1
RESPONSE STAGE
Pd 0.65 0.65 0.65 0.85 0.50 0.40 1.00 0.40 0.00
Pd Low 90% Conf 0.58 0.56 0.51 0.74 0.36 0.19 0.95 0.27 0.00
Pfp 0.65 - - - - - 0.70 0.55 0.60
Pfp Low 90% Conf 0.56 - - - - - 0.60 0.44 0.25
Pba 0.10 - - - - - - - -
DISCRIMINATION STAGE
Pd 0.55 0.55 0.50 0.70 0.40 0.30 0.85 0.30 0.00
Pd Low 90% Conf 0.47 0.46 0.39 0.58 0.30 0.12 0.74 0.21 0.00
Pfp 0.30 - - - - - 0.30 0.35 0.40
Pfp Low 90% Conf 0.26 - - - - - 0.21 0.24 0.11
Pba 0.00 - - - - - - - -
Figure 6, which was provided by the ESTCP Program office, shows the ROC curves for the EM61-HH, including only ground truth targets at depths less than 30 cm. Because the EM61-HH is not meant for the detection of deeply buried targets, inclusion of ground truth targets at depths greater than 30 cm in the scoring would provide a misleading result. The red curve plots the discrimination stage, probability of detection (correctly identifying ordnance as ordnance), as a function of probability of false positive (identifying clutter as ordnance). The blue curve gives the corresponding performance at the response stage. It represents the discrimination performance that would be realized if discrimination were based solely on signal strength (i.e., assuming that the strongest anomalies were ordnance and the weakest, clutter). Along the blue curve, signal strength increases from the upper right to the lower left.

14
Figure 6. EM61-HH ROC for Ground Truth Targets Less Than 0.3 m Depth. The separation between the blue and red curves reflects how well we are discriminating between ordnance and clutter. The red curve is consistently above and to the left of the blue curve. Here, we are correctly classifying targets significantly more often than not. At 100% Pd (correctly identifying all UXO as UXO), 55% of the clutter items are correctly identified as not UXO. This performance is similar to that achieved under controlled test conditions. For test stand data, we found a probability of detection of 95% (79 of 83 UXO target grids) at a false alarm rate (classifying clutter as UXO) of 26% (13 of 50 clutter grids). For the test stand data, the false alarm rate increased to 40% when the classification rule was relaxed enough to ensure 100% probability of detection. 4.4 TECHNOLOGY COMPARISON The EM61-HH is a standard commercial UXO sensor. It is quite portable and well suited to the task of cued identification. Because of the size of the coils and the transmitted power, it is more effective for the smaller, more shallow targets than the larger, deeper targets. Handheld total field magnetometer systems (e.g., Geometrics G858) may be more effective in detecting large, deep targets but have limited target classification ability. Other handheld EMI systems (e.g., White’s, Minelab, Geophex) have detection envelopes similar to the EM61-HH. Of these, only the Geophex GEM-3 broadband EMI sensor [5] has been demonstrated at the Aberdeen Standardized UXO Demonstration Site [6]. We can compare the performances of the EM61-HH and the GEM-3 (handheld mode) using the standard performance criteria of detection efficiency and false positive rejection rate. The efficiency of the EM61-HH was 0.83, while that of the GEM-3 was 0.76. The rejection rate for
15
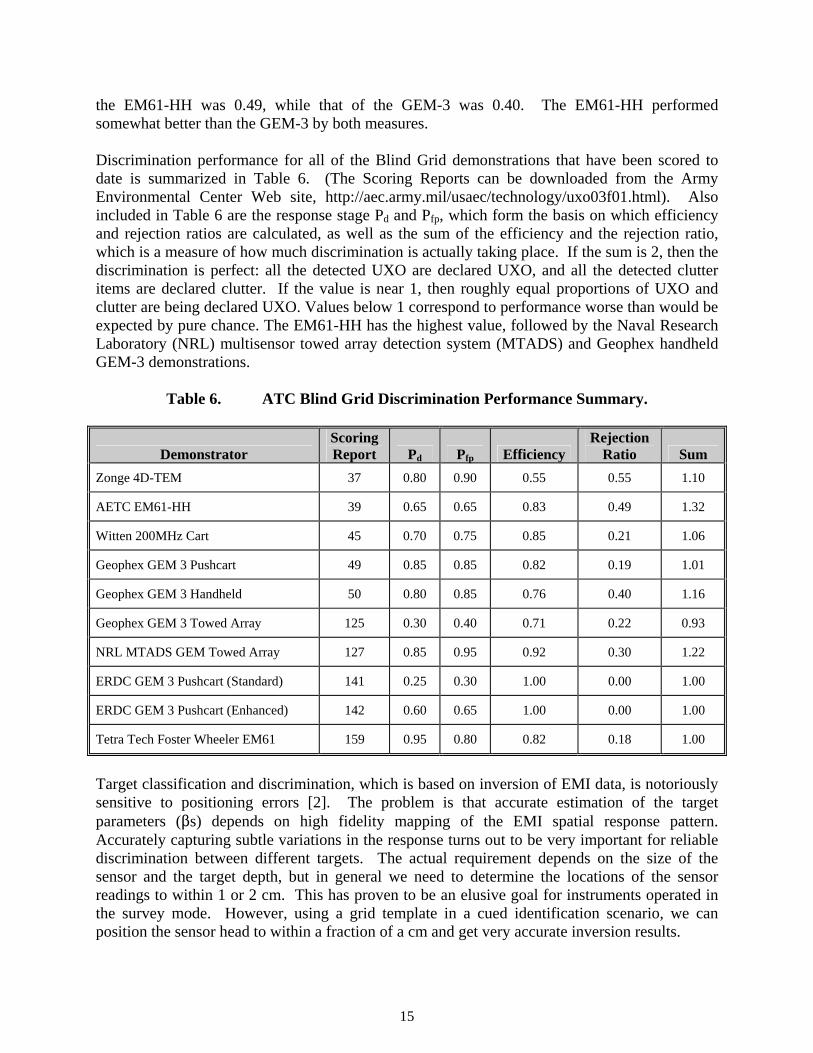
the EM61-HH was 0.49, while that of the GEM-3 was 0.40. The EM61-HH performed somewhat better than the GEM-3 by both measures. Discrimination performance for all of the Blind Grid demonstrations that have been scored to date is summarized in Table 6. (The Scoring Reports can be downloaded from the Army Environmental Center Web site, http://aec.army.mil/usaec/technology/uxo03f01.html). Also included in Table 6 are the response stage Pd and Pfp, which form the basis on which efficiency and rejection ratios are calculated, as well as the sum of the efficiency and the rejection ratio, which is a measure of how much discrimination is actually taking place. If the sum is 2, then the discrimination is perfect: all the detected UXO are declared UXO, and all the detected clutter items are declared clutter. If the value is near 1, then roughly equal proportions of UXO and clutter are being declared UXO. Values below 1 correspond to performance worse than would be expected by pure chance. The EM61-HH has the highest value, followed by the Naval Research Laboratory (NRL) multisensor towed array detection system (MTADS) and Geophex handheld GEM-3 demonstrations.
Table 6. ATC Blind Grid Discrimination Performance Summary.
Demonstrator Scoring Report Pd Pfp Efficiency
Rejection Ratio Sum
Zonge 4D-TEM 37 0.80 0.90 0.55 0.55 1.10
AETC EM61-HH 39 0.65 0.65 0.83 0.49 1.32
Witten 200MHz Cart 45 0.70 0.75 0.85 0.21 1.06
Geophex GEM 3 Pushcart 49 0.85 0.85 0.82 0.19 1.01
Geophex GEM 3 Handheld 50 0.80 0.85 0.76 0.40 1.16
Geophex GEM 3 Towed Array 125 0.30 0.40 0.71 0.22 0.93
NRL MTADS GEM Towed Array 127 0.85 0.95 0.92 0.30 1.22
ERDC GEM 3 Pushcart (Standard) 141 0.25 0.30 1.00 0.00 1.00
ERDC GEM 3 Pushcart (Enhanced) 142 0.60 0.65 1.00 0.00 1.00
Tetra Tech Foster Wheeler EM61 159 0.95 0.80 0.82 0.18 1.00
Target classification and discrimination, which is based on inversion of EMI data, is notoriously sensitive to positioning errors [2]. The problem is that accurate estimation of the target parameters ($s) depends on high fidelity mapping of the EMI spatial response pattern. Accurately capturing subtle variations in the response turns out to be very important for reliable discrimination between different targets. The actual requirement depends on the size of the sensor and the target depth, but in general we need to determine the locations of the sensor readings to within 1 or 2 cm. This has proven to be an elusive goal for instruments operated in the survey mode. However, using a grid template in a cued identification scenario, we can position the sensor head to within a fraction of a cm and get very accurate inversion results.

This page left blank intentionally.
17
5.0 COST ASSESSMENT
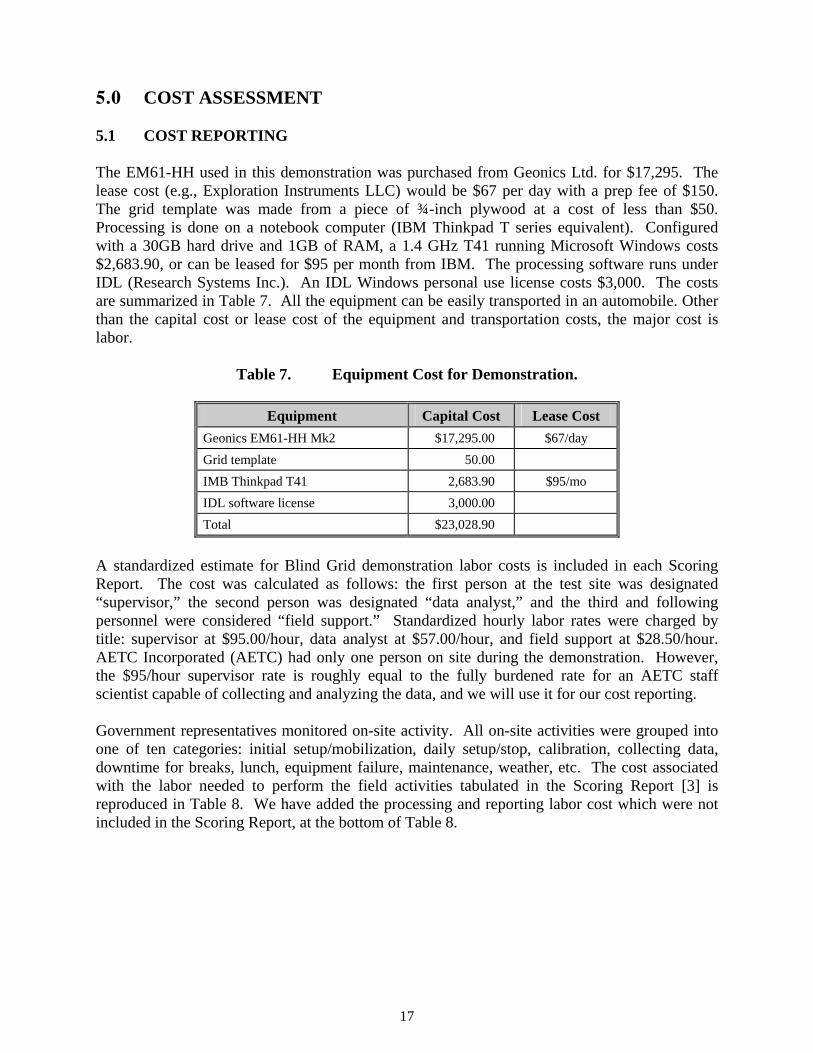
5.1 COST REPORTING The EM61-HH used in this demonstration was purchased from Geonics Ltd. for $17,295. The lease cost (e.g., Exploration Instruments LLC) would be $67 per day with a prep fee of $150. The grid template was made from a piece of ¾-inch plywood at a cost of less than $50. Processing is done on a notebook computer (IBM Thinkpad T series equivalent). Configured with a 30GB hard drive and 1GB of RAM, a 1.4 GHz T41 running Microsoft Windows costs $2,683.90, or can be leased for $95 per month from IBM. The processing software runs under IDL (Research Systems Inc.). An IDL Windows personal use license costs $3,000. The costs are summarized in Table 7. All the equipment can be easily transported in an automobile. Other than the capital cost or lease cost of the equipment and transportation costs, the major cost is labor.
Table 7. Equipment Cost for Demonstration.
Equipment Capital Cost Lease Cost Geonics EM61-HH Mk2 $17,295.00 $67/day Grid template 50.00 IMB Thinkpad T41 2,683.90 $95/mo IDL software license 3,000.00 Total $23,028.90
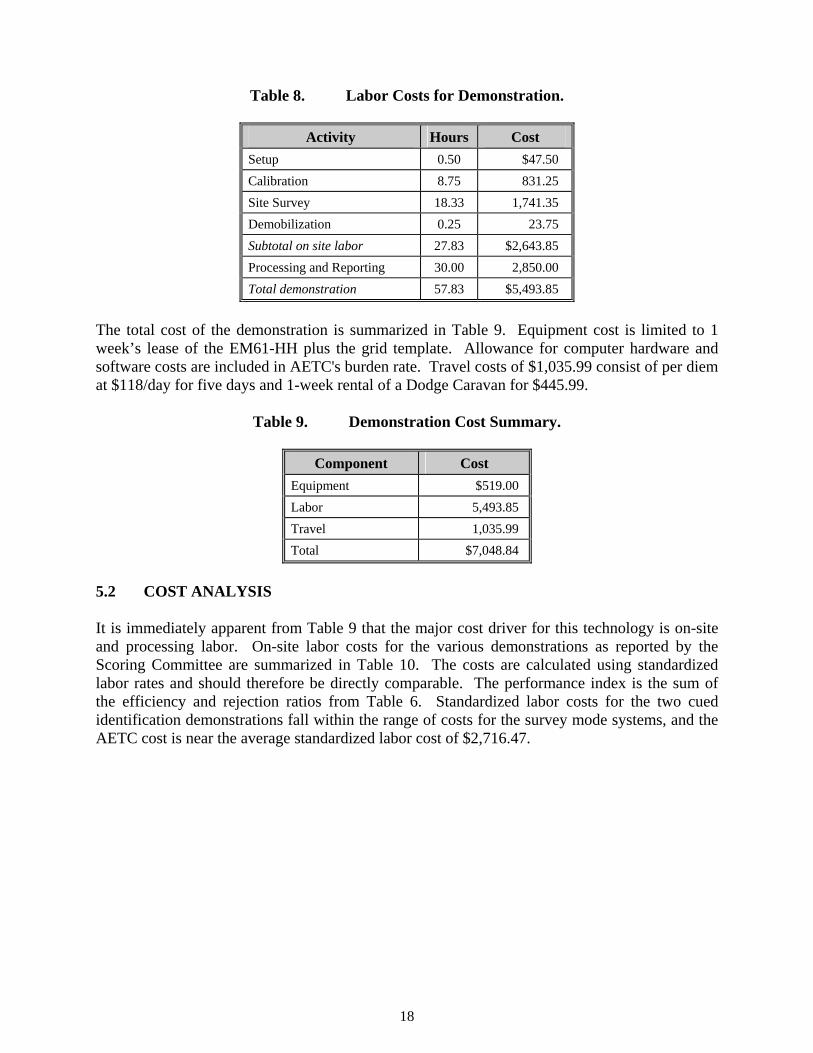
A standardized estimate for Blind Grid demonstration labor costs is included in each Scoring Report. The cost was calculated as follows: the first person at the test site was designated “supervisor,” the second person was designated “data analyst,” and the third and following personnel were considered “field support.” Standardized hourly labor rates were charged by title: supervisor at $95.00/hour, data analyst at $57.00/hour, and field support at $28.50/hour. AETC Incorporated (AETC) had only one person on site during the demonstration. However, the $95/hour supervisor rate is roughly equal to the fully burdened rate for an AETC staff scientist capable of collecting and analyzing the data, and we will use it for our cost reporting. Government representatives monitored on-site activity. All on-site activities were grouped into one of ten categories: initial setup/mobilization, daily setup/stop, calibration, collecting data, downtime for breaks, lunch, equipment failure, maintenance, weather, etc. The cost associated with the labor needed to perform the field activities tabulated in the Scoring Report [3] is reproduced in Table 8. We have added the processing and reporting labor cost which were not included in the Scoring Report, at the bottom of Table 8.
18
Table 8. Labor Costs for Demonstration.
Activity Hours Cost Setup 0.50 $47.50 Calibration 8.75 831.25 Site Survey 18.33 1,741.35 Demobilization 0.25 23.75 Subtotal on site labor 27.83 $2,643.85 Processing and Reporting 30.00 2,850.00 Total demonstration 57.83 $5,493.85
The total cost of the demonstration is summarized in Table 9. Equipment cost is limited to 1 week’s lease of the EM61-HH plus the grid template. Allowance for computer hardware and software costs are included in AETC's burden rate. Travel costs of $1,035.99 consist of per diem at $118/day for five days and 1-week rental of a Dodge Caravan for $445.99.
Table 9. Demonstration Cost Summary.
Component Cost Equipment $519.00 Labor 5,493.85 Travel 1,035.99 Total $7,048.84
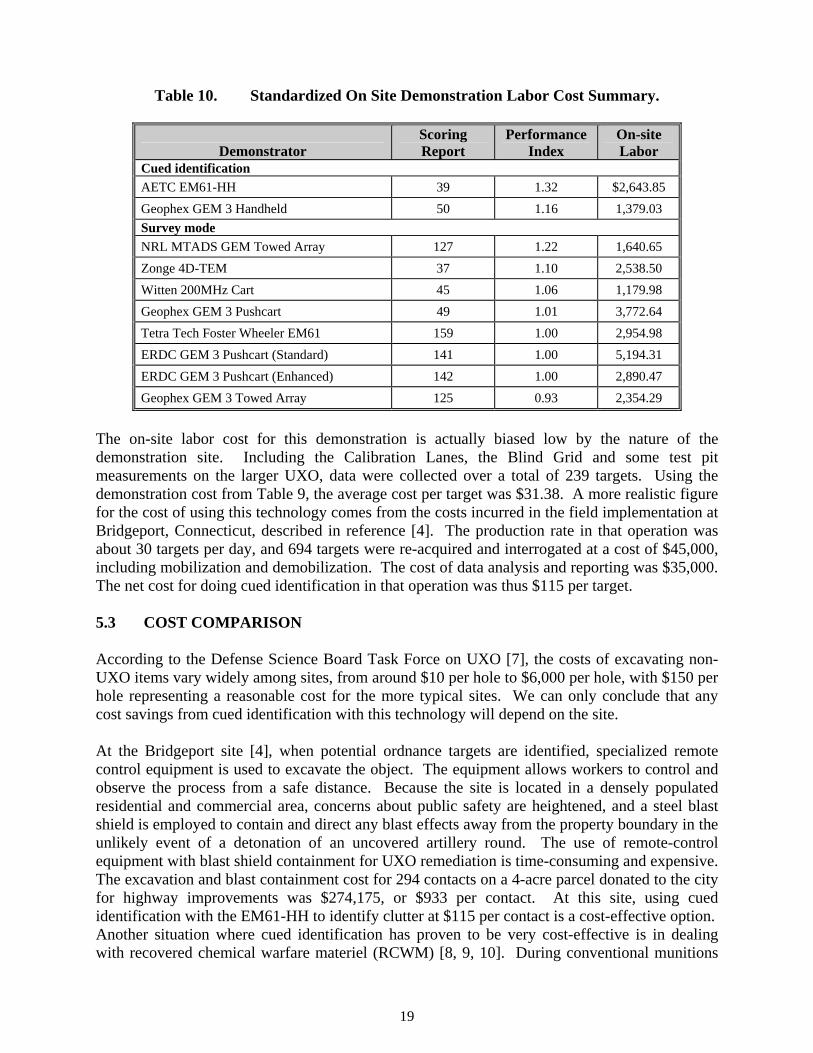
5.2 COST ANALYSIS It is immediately apparent from Table 9 that the major cost driver for this technology is on-site and processing labor. On-site labor costs for the various demonstrations as reported by the Scoring Committee are summarized in Table 10. The costs are calculated using standardized labor rates and should therefore be directly comparable. The performance index is the sum of the efficiency and rejection ratios from Table 6. Standardized labor costs for the two cued identification demonstrations fall within the range of costs for the survey mode systems, and the AETC cost is near the average standardized labor cost of $2,716.47.
19
Table 10. Standardized On Site Demonstration Labor Cost Summary.
Demonstrator Scoring Report
Performance Index
On-site Labor
Cued identification AETC EM61-HH 39 1.32 $2,643.85 Geophex GEM 3 Handheld 50 1.16 1,379.03 Survey mode NRL MTADS GEM Towed Array 127 1.22 1,640.65 Zonge 4D-TEM 37 1.10 2,538.50 Witten 200MHz Cart 45 1.06 1,179.98 Geophex GEM 3 Pushcart 49 1.01 3,772.64 Tetra Tech Foster Wheeler EM61 159 1.00 2,954.98 ERDC GEM 3 Pushcart (Standard) 141 1.00 5,194.31 ERDC GEM 3 Pushcart (Enhanced) 142 1.00 2,890.47 Geophex GEM 3 Towed Array 125 0.93 2,354.29
The on-site labor cost for this demonstration is actually biased low by the nature of the demonstration site. Including the Calibration Lanes, the Blind Grid and some test pit measurements on the larger UXO, data were collected over a total of 239 targets. Using the demonstration cost from Table 9, the average cost per target was $31.38. A more realistic figure for the cost of using this technology comes from the costs incurred in the field implementation at Bridgeport, Connecticut, described in reference [4]. The production rate in that operation was about 30 targets per day, and 694 targets were re-acquired and interrogated at a cost of $45,000, including mobilization and demobilization. The cost of data analysis and reporting was $35,000. The net cost for doing cued identification in that operation was thus $115 per target. 5.3 COST COMPARISON According to the Defense Science Board Task Force on UXO [7], the costs of excavating non-UXO items vary widely among sites, from around $10 per hole to $6,000 per hole, with $150 per hole representing a reasonable cost for the more typical sites. We can only conclude that any cost savings from cued identification with this technology will depend on the site. At the Bridgeport site [4], when potential ordnance targets are identified, specialized remote control equipment is used to excavate the object. The equipment allows workers to control and observe the process from a safe distance. Because the site is located in a densely populated residential and commercial area, concerns about public safety are heightened, and a steel blast shield is employed to contain and direct any blast effects away from the property boundary in the unlikely event of a detonation of an uncovered artillery round. The use of remote-control equipment with blast shield containment for UXO remediation is time-consuming and expensive. The excavation and blast containment cost for 294 contacts on a 4-acre parcel donated to the city for highway improvements was $274,175, or $933 per contact. At this site, using cued identification with the EM61-HH to identify clutter at $115 per contact is a cost-effective option. Another situation where cued identification has proven to be very cost-effective is in dealing with recovered chemical warfare materiel (RCWM) [8, 9, 10]. During conventional munitions
20
response activities at the Jeep/Demolition Range at the Former Lowry Bombing and Gunnery Range near Denver, Colorado, many inert RCWM training aids were recovered. Remnants from chemical agent identification sets (CAIS) were also found. The CAIS remnants elevated concerns of finding live agent, and the Jeep/Demolition Range transitioned to an RCWM site. Cued identification patterned after the approach described here but scaled-up to the standard EM61 Mk2 was introduced to effectively manage and reduce the hazards associated with the simultaneous presence of CAIS and conventional munitions. Results of the cued identification were used to focus costly and time-consuming RCWM operations on about 200 specific locations, as opposed to all the roughly 2,000 potential RCWM targets on the range, thereby saving millions of dollars.
21
6.0 IMPLEMENTATION ISSUES 6.1 COST OBSERVATIONS The standard supervisor labor rate of $95/hour was used in Table 9, but in fact, the demonstration was carried out by the principal investigator rather than a qualified staff scientist. Figuring in the higher labor rate ($192.45 versus $95.00), equipment, and travel, the actual cost for the demonstration is $12,684. This is less than 10% of the total cost ($203,596) of this project. A significant portion of the project cost went into exploring various procedures for precisely monitoring the spatial location of the EM61-HH before we finally settled on the grid template. The largest amount of money was spent collecting and analyzing test stand data and developing the analysis procedures and software used in the demonstration. 6.2 PERFORMANCE OBSERVATIONS The performance goal was a detection efficiency of 0.95 at a false positive rejection ratio of 0.74. In the demonstration, we achieved 0.83 and 0.49, respectively. Absent the ground truth for the demonstration site, a detailed evaluation of why the actual performance was not as good as expected cannot be made. Two factors that could have adversely affected our performance are the presence of nonstandard UXO targets (ordnance items having properties that differ from those in the set of standardized targets) and grid cells containing both UXO and clutter items. Both were present in the Blind Grid, although the affected fraction of UXO cells is not known to us. Table 5 indicates that our discrimination performance on the nonstandard targets was about 10% poorer than on the standard targets. 6.3 SCALE-UP In full-scale implementation, cued identification is one element in a process chain. At the Bridgeport site, the cleanup process included five steps: 1. Historical review of the site to determine potential UXO types. 2. Surface contact removal—thorough sweep of the area with a Schonstedt magnetometer to
detect and remove surface contacts to a depth of several inches using the least intrusive methods possible.
3. Standard EM-61 Mk II survey to identify contacts. Prioritize contacts based on survey
data analysis: (1) could potentially be UXO, (2) uncertain and/or more information needed to decide, or (3) high confidence not UXO.
4. Cued identification—re-acquire category 1 and 2 contacts, collect and process high
resolution EM-61 HH data for target classification. On the basis of EM61-HH processing, reassign re-acquired contacts to category 1, 2 or 3.
5. Remove final category 1 and 2 targets using remote excavation with blast shield.
22
The screening in step 3 was based primarily on the character of the anomaly in the EM61 survey map. An anomaly was classified as priority one if it showed good signal-to-noise, spatial extent, and profile shape. Priority two anomalies were characterized by broad profile shape, partial spatial extent (e.g., at data gaps), questionable character, or marginal signal-to-noise. Priority three anomalies were characterized by thin-walled material (i.e., sheet metal or wire, based on the ratio of first-to-last time gate signal levels), very small spatial extent, sudden sharp offset (indicative of sensor strike), low signal-to-noise, or correlation with a surface feature. The data processing and analysis software and procedures used in step 4 were identical with those used in this demonstration. This process was used in cleaning up an 18 acre site that was to be turned over to Bridgeport for municipal use. A total of 1,546 anomalies were identified in the EM61 survey, with 694 being identified as either priority one or two and re-acquired for cued identification using the EM61-HH. Of these, 584 were classified as high confidence clutter (3), 43 as uncertain (2) and 67 as possible UXO (1). A similar process was used at the Jeep/Demolition Range at Lowry. The site covered 175 acres, and 28,014 anomalies were identified in the original geophysical survey. After the initial screening, cued identification using total field magnetometer and EM61 grids was performed for more than 2,000 anomalies. Based on the results of the discrimination analysis on the cued grid data, approximately 200 targets were identified as possible CAIS, and RCWM excavations were performed. In analyzing the EM61 data, we used the same processing software and procedures that were developed for this demonstration. The only difference was that we used a forward model for the standard EM61, rather than the EM61-HH, in the least squares inversion. Processing and analysis cost was $44 per target for 2340 anomalies at Lowry, compared to $50 per target for the 694 priority 1 and 2 anomalies in the Bridgeport operation. 6.4 LESSONS LEARNED The EM61-HH is not meant to be used for detecting deeply buried targets. For shallow (<30 cm) targets, the detection rate in the demonstration was 100%. The detection rate dropped to 40% for targets in the depth range 30 cm to 1 m, and to zero for the targets deeper than 1 m. Good discrimination performance can be achieved with the EM61-HH in a cued identification mode, but only if controlled measurements for the likely target set are conducted beforehand. Discrimination is based on matching the calculated beta values for an unknown buried target to those appropriate to the expected target set. 6.5 END-USER ISSUES, APPROACH TO REGULATORY COMPLIANCE AND
ACCEPTANCE The actual demonstration was conducted at the Standardized UXO Technology Demonstration Site at Aberdeen Test Center. There were no end-user issues or issues relating to regulatory compliance and acceptance associated with the demonstration. The full-scale implementations cited previously are rather special cases, and it is likely that other full-scale implementations will correspond to similarly special situations.
23
The Bridgeport site is a private cleanup activity. Sporting Goods Properties Inc. (formerly Remington Arms Co.) is conducting an investigation for UXO on the 422-acre Lake Success Business Park property in Bridgeport. The property was operated by Remington from the late 1800s until 1989 for the production, testing, storage, and disposal of small- and large-caliber ammunition and powders. In 1990, the Environmental Protection Agency (EPA) and Remington entered into a consent order that required the company to investigate areas where discharges of hazardous waste may have occurred and to propose strategies for the remediation of contaminated areas. That remedial program changed complexion in September 1999, when two live artillery rounds were discovered in excavated contaminated soil that was undergoing on-site treatment by soil stabilization. Soil excavation and treatment was immediately halted, and a search for other UXO on the property was initiated. The site manager became aware of the potential for UXO/clutter discrimination through government contacts in 2002 and elected to include EM61-HH cued identification as part of the cleanup process after a successful prove-out in August of that year. The site is well suited for this technology because the potential UXO target set is small, being limited to items manufactured and tested at the site. Furthermore, it was expected that few, if any UXO items would be found on the site, and, because remote-control equipment with blast shield containment is used for suspected UXO targets, the excavation cost for suspected UXO is very high. No contacts are left in the ground, but most can be identified with high confidence as not UXO, and dug up using less costly procedures. At Lowry, cost was also a major factor, as was the time required for RCWM response for all contacts [8]. The site had been transferred to public ownership in 1969 and pressure from encroaching development was very high. Since there was only one type of target that required special excavation procedures—the CAIS K941 shipping container or pig—cued identification of possible CAIS items was a viable option. During previous response activities, all RCWM-related items had been found in trenches and pits, or were related to large geophysical anomalies. The project team (U. S. Army Corps of Engineers, Omaha District, Colorado Department of Public Health and Environment, and Shaw Environmental & Infrastructure, Inc.) was confident that RCWM efforts focused to trenches and pits and/or pig-sized or greater anomalies were appropriate. The cued identification procedures used were selected after an extensive prove-out operation that demonstrated reliable discrimination between pigs and conventional UXO and other ordnance and explosive waste (OEW) materials. By using an optimized approach that reduced the scope of RCWM operations and allowed concurrent conventional munitions response, the project team reduced the cost of the effort by millions of dollars, reduced the schedule by years, minimizing impacts of encroaching development, and used an approach agreed upon by the project stakeholders.

This page left blank intentionally.
25
7.0 REFERENCES 1. Bell, T. H., B. J. Barrow and J. T. Miller, “Subsurface Discrimination Using
Electromagnetic Induction Sensors,” IEEE Trans. Geoscience and Remote Sensing, vol. 39, no. 6, June 2001, pp. 1286-1293.
2. Barrow, B and H. H. Nelson, “Effects of Positioning Error on Inverting EMI Data for UXO Discrimination Using the MTADS Platform,” UXO/Countermine Forum, New Orleans, April 9-12, 2001.
3. Overbay, L., “Standardized UXO Technology Demonstration Site Blind Grid Scoring Report No. 39, Addendum 1,” U. S. Army Aberdeen Test Center Report ATC-8463, October 2003.
4. Ambrose, B., T. Bell and T. Furuya, “UXO Clearance at the Lake Success Redevelopment Project,” UXO/Countermine Forum, Saint Louis, March 9-12, 2004.
5. Won. I. J., D. Keiswetter, D. Hansen, E. Novikova and T. Hall, “GEM-3: A Monostatic Broadband Electromagnetic Induction Sensor,” J. Environ. Eng. Geophys., vol. 2, no. 1, 1997, pp. 53-64.
6. Overbay, L., “Standardized UXO Technology Demonstration Site Blind Grid Scoring Report No. 50,” U. S. Army Aberdeen Test Center Report ATC-8691, October 2003.
7. Office of the Under Secretary of Defense for Acquisition, Technology, and Logistics, “Report of the Defense Science Board Task Force on Unexploded Ordnance,” November 2003.
8. Hodgson, J. L., J. R. Swanson and T. M. White, “An Optimized Approach for a Concurrent Conventional Munitions and Recovered Chemical Warfare Materiel Response,” UXO/Countermine Forum, Saint Louis, March 9-12, 2004.
9. U. S. Army Environmental Center, “Optimized Approach for a Concurrent Conventional Munitions and RCWM Response Action,” Fielding Environmental Solutions, Message 67, June 2004.
10. Foley, J. E., M. Miele, R. Mehl, J. Dolynchuk, J. Hodgson and J. Swanson, “Procedures for Applying UXO Discrimination Technology at the Former Lowry Bombing and Gunnery Range,” UXO/Countermine Forum, Saint Louis, March 9-12, 2004.

This page left blank intentionally.

APPENDIX A
POINTS OF CONTACT

This page left blank intentionally.

A-1
POINTS OF CONTACT
ESTCP Jeffrey Marqusee ESTCP Program Director Tel: (703) 696-2120
Fax: (703) 696-2114 E-mail: [email protected]
Anne Andrews ESTCP Program Manager for UXO
Tel: (703) 696-3826 Fax: (703) 696-2114 E-mail [email protected]
Jeffrey Fairbanks ESTCP UXO Program Coordination
Tel: (703) 736-4541 Fax: (703) 478-0526 E-mail: [email protected]
AETC Thomas Bell Demonstration Manager Tel: (703) 413-0500
Fax: (703) 413-0512 E-mail: [email protected]
AEC George Robitaille AEC Demonstration Site
Program Manager Tel: (410) 436-6865 Fax: (410) 436-6836 E-mail: [email protected]
ATC Larry Overbay ATC Site Manager Tel: (410) 278-7620
Fax: (410) 278-1589 E-mail: [email protected]

ESTCP Program Office
901 North Stuart StreetSuite 303Arlington, Virginia 22203
(703) 696-2117 (Phone)(703) 696-2114 (Fax)
e-mail: [email protected]