estate agents affairs board - pmg...the eaab is required, to this end, to ensure that all qualifying...
TRANSCRIPT

1
ESTATE AGENTS AFFAIRS BOARD
SCHEDULE 3A PUBLIC ENTITY OF THE DEPARTMENT OF HUMAN SETTLEMENTS
ANNUAL PERFORMANCE PLAN
2019/20 FINANCIAL YEAR
FINAL DRAFT

2
Official Sign-Off
It is hereby certified that this Annual Performance Plan was developed by the Accounting
Authority with input received from the Executive Management of the Estate Agency
Affairs Board.
The Annual Performance Plan (APP) has been developed in line with the current
Strategic Plan of the Estate Agency Affairs Board (EAAB) and accurately reflects the
performance targets which the EAAB will endeavour to achieve, given the resources
made available in the budget for the 2019 – 2020 year.
Signature:
__________________________
Chief Financial Officer
Signature:
__________________________
Chief Risk Officer
Signature:
___________________________
Chief Executive Officer
Signature:
___________________________
Chairperson of the Board
APPROVED BY:
Signature:
___________________________
Minister of Department of Human Settlements
Honourable N C Mfeketo, MP

3
Foreword by the Accounting Authority
It is with great pleasure that the Estate Agency Affairs Board (“EAAB”), as the Accounting
Authority, presents its Annual Performance Plan for the period 2019/20 to the Executive
Authority, the Honorable Minister of Human Settlements, Nomaindiya Mfeketo The
drafting of the Annual Performance Plan has been guided by both the EAAB Strategic
Plan and the Department of Human Settlements Medium-Term Strategic Framework
(“MTSF”).
The Board of the EAAB, together with its Executive Committee and staff, reaffirms its
commitment to the progressive transformation of the estate agency sector to reflect the
demographics of a democratic South Africa and to the inculcation of the highest
standards of excellence in pursuit of its constitutional and statutory mandate to regulate
the estate agency sector in the public interest for the benefit of property consumers and
estate agents.
Two of the critical challenges posing a serious risk to the financial sustainability of the
EAAB that have been identified are:
the increasing number of suspicious, and potentially fraudulent, claims received by the
Estate Agents Fidelity Fund; and
Rampant money laundering using the real estate sector as a mechanism for this
purpose.
The EAAB is required, to this end, to ensure that all qualifying estate agents, on receipt
of compliant applications, are timeously issued with valid fidelity fund certificates to
enable them legally to render estate agency services and so mitigate these risks.
The EAAB continues, in cooperation with its manifold stakeholders, to strive to build a
professional estate agency sector. Doing so ensures the sustainable and progressive
development of both aspiring and existing estate agents and especially those from
historically disadvantaged groups. The EAAB wishes to assure the Executive Authority
that it is committed to full observance of the precepts of good corporate governance, not
only in strict compliance with the provisions of the Public Finance Management Act, 1 of
1999, but also any other applicable legislation and relevant codes such as the King IV
Code of Practice for Good Corporate Governance and the Codes of Good Practice.
The EAAB, moreover, has fully committed itself to mutual and harmonious cooperation
with other statutory regulators, the private property industry and civil society formations.
. Official sign-off It is hereby certified that this first draft Annual Performance Plan was developed by the Board of the EAAB and prepared in accordance with the current Strategic Plan of the EAAB. The first draft Annual Performance Plan accurately reflects the performance targets which the EAAB will strive to achieve, given the inherent constraint of available resources that have been provided for in the EAAB budget for the 2019/2020 financial year.

4
TABLE OF CONTENTS
PART A: STRATEGIC OVERVIEW 5
1. UPDATED SITUATIONAL ANALYSIS 5
1.1. PERFORMANCE DELIVERY ENVIRONMENT 5 1.2. ORGANISATIONAL ENVIRONMENT (SWOT) 7 1.3. REVISIONS TO LEGISLATIVE AND OTHER MANDATES 11 1.4. PENDING COURT CASES 11 1.5. STRATEGIC OUTCOME ORIENTATED GOALS OF EAAB 14 1.6. ORGANISATIONAL STRUCTURE 15 1.7. EAAB RESOURCE PLAN 15 1.7.1 REVENUE AND EXPENDITURE ESTIMATES 19 1.7.2 OPERATIONAL EXPENDITURE PER PROGRAMME 27 1.7.3 CASHFLOW STATEMENT 31 1.7.4 STATEMENT OF FINANCIAL POSITION 34 1.7.5 STATEMENT OF FINANCIAL PERFORMANCE ERROR! BOOKMARK NOT DEFINED.
PART B: PROGRAMMES PLANS 35
2. PROGRAMME 1: FINANCE AND ADMINISTRATION 45
3. PROGRAMME 2: COMPLIANCE 50
4. PROGRAMME 3: EDUCATION AND TRAINING 55
5. PROGRAMME 4: TRANSFORMATION 60
6. PROGRAMME 5: FIDELITY FUND 67
7. PROGRAMME 6: CONRIBUTION TO MEDIUM TERM STRATEGIC FRAMEWORK70
PART C: LINKS TO OTHER PLANS 73
1.1. DEPARTMENT OF HUMAN SETTLEMENT HOUSING INITIATIVES 73 1.2. TITLE RESTORATION PROJECT 73 1.3. TRANSACTIONAL SUPPORT INITIATIVE 73
ANNEXURE A - MATERIALITY FRAMEWORK 66
ANNEXURE B - STRATEGIC RISK REGISTER 68
ANNEXURE C - TECHNICAL STANDARDS 79

5
PART A: STRATEGIC OVERVIEW
1. UPDATED SITUATIONAL ANALYSIS
The Board has conducted a rigorous annual strategic review and a number of
factors (Internal and external) have demanded adjustments to the current plan.
These are reflected in this 2019/20 Strategic Plan.
The adjustments in this Plan, also seeks to accommodate recommendations from
the most recent audit findings and management letter.
1.1. Performance Delivery Environment
The EAAB has once again taken account of its operations and, more specifically,
how the same would impact and influence its business for the 2019/20 year.
The Board has used the PESTELD Analysis to evaluate the key environmental
factors and contributors that impact its external performance delivery.
The consolidated inputs are, therefore, reflected below.
Variable Considerations for EAAB
PO
LIT
ICA
L
Key interventions raised by Minister (2016), which relates to Estate Agency Affairs Board:
“To build 1, 5 million houses in partnership with the private sector, all stakeholders
and communities, over the next five years.
The National Home Builders Registration Council (NHBRC) will establish and officially
open a Training Academy in partnership with the Gordon Institute of Business
Science. This will focus on up-skilling 100 women and the youth. (In our discussions
with the EAAB,) they committed to train young, black candidate Estate Agents to
revitalise the industry. The Academy established by the NHBRC will incorporate a
training course on Estate Agents and other property practitioners.”

6
Variable Considerations for EAAB
ECO
NO
MIC
Slow rate of economic growth.
CPI inflation “shock” at this stage appears remote in 2017. It is expected to average 6% over 12 month period and decline to 4.7% by 2020.
Reduction in disposal income – will result in smaller-sized homes and smaller average stand sizes being more sought after.
Severe drought that has affected the country, political challenges and high
unemployment, international financial difficulties.
The projected growth to stimulate employment, house prices and property market has
not materialized.
The new Spatial Planning and Land Use Management Act. This will unlock significant
further private sector development potential across our cities, focused on strategic
corridors.
Lower and middle-income areas will outperform the high income/price end of the
market.
Expectation that the primary residential demand-dominated city markets to begin to
outperform the holiday town markets.
Less economically-diversified rural towns may also be at greater risk than the major metros, notably Mining and Manufacturing.
SOC
IAL
Racist remarks by various estate agents resulted in collaboration with Human Rights Commission - an enquiry into racism by estate agents in South Africa.
Estate agents engaging or participating in racist behavior may render themselves guilty of a contravention of regulations 2.1 and/or 2.6 of the Code of Conduct for Estate Agents (“the Code of Conduct”).
Increased levels of enforcement to eliminate racism and discrimination within the sector.
Introduction of appropriate education and sensitivity training for estate agency practitioners and consumers alike though the Continuing Professional Development (CPD) programme
TEC
HN
OLO
GIC
AL
The Estate Agency sector has embraced the use of technology in respect of transacting through use of cell phones and web page advertising.
Estate Agents are increasingly using technological devises to interact with the Estate Agency Affairs Board.
Application processes within the EAAB are now performed on-line.
Processing of transactions is performed through EAAB technological infrastructures.
The Estate Agent is able to track the progress of applications and complaints through web access.
Increased use of digital platforms and mobile applications by consumers, drives the need for EAAB to enhance its digital strategies.
Scourge in on-line related crime – fraud, identity theft, etc.

7
Variable Considerations for EAAB
LEG
AL
Since 27 February 2016, the Board’s inspection powers have been severely
circumscribed -
Impact of the impending Property Sector Bill on the levels of compliance
ET
HIC
AL
Increase in white collar crime – collusion
On-line fraud – identity theft
Risk of illegal operational practices
Failure by estate agents to pay interest earned on trust monies into the Fidelity Fund
DE
MO
-
GR
AP
HIC
S
Participation of historically disadvantaged groups in the real estate sector remains a
challenge.
1.2. Organisational environment (SWOT)
STRENGTHS WEAKNESSES
Fidelity Fund
Well-managed investments.
Turnaround time of approved claims.
Governance
Strong governance structure at Board level.
Management
Competent and committed management with
experience.
Competent disciplinary and claims committee
members.
Staffing
Young and energetic staff.
Staff is utilizing the in-house study support
benefits.
Internal processes
Effective internal processes
Basic systems in place
Professional Body status
Stakeholder Relations
Sound relationships with the SSETA, SAQA, the
Mandate and legislation
Insufficient capacity to comply with regulatory
mandate.
Outdated legislation, which does not sufficiently
empower EAAB enforcement mandate.
Fidelity Fund
Slow approval process impacts processing
speed resulting in increased interest claims.
Governance
Insufficient internal governance structures - vis-
à-vis policies, procedures and risk-orientation.
Management
High vacancy rate and secondments reduces
management capacity.
Staffing
High staff turnover erodes the experience curve
Lack of succession planning to ensure business
continuity.
Insufficient training in current legislative
frameworks and processes.

8
STRENGTHS WEAKNESSES
QCTO and sector representative organisations
through the Multi Stakeholder Group
Internal processes
Poor ratio of recoveries to claims approved and
paid.
Lack of customer centered focus
Slow responses to customer queries
Lack of systems integration negatively impact
service delivery
Reporting
Insufficient reporting, monitoring and control
structures/ systems
Unresponsive institutional culture.
IT system and outsourcing
Low functionality and outdated current IT
system (e.g. SAP) hinder EAAB’s ability to stay
relevant
Outsourcing of services and infrastructure
resulting in loss of control
High level of IT process downtime.
Infrastructure (hardware and software) is not
capable to support the effective implementation
of the EAAB mandate
Inadequate HR Management system (Software
System)
Performance Management
No Performance culture - performance
management system does not translate to
effective organisational performance.
Work repetition/ duplication and high workload
is common
Budget and Finances
Inadequate budget to deliver the mandate
Understated revenue due to inadequate
systems

9
A. External Environment
OPPORTUNITIES THREATS Legislative aspects and compliance
Build partnerships that improve the ability of EAAB
to ensure compliance to the Act.
Property Practitioners Bill will lead to a better and
modern regulatory environment
Fidelity Fund
Better investment opportunities to grow the
Fidelity Fund
Transformation
Devise strategies for economic inclusion of
previously disadvantaged persons in the property
sector.
Improving and strengthening collaboration with
sector and public entities.
Department of Human Settlement in resolution of
title deeds backlog and issuing of new title deeds,
leads to increased secondary market and more
estate agents emanating from previously
disadvantaged groups
Increasing sustaining mechanisms for black
agencies to continue operating can enhance
transformation
Education of potential Estate Agents of the sector
as a career of choice and as new business owners
Using the PPB to enforce transformation and
compliance
Collaboration with tertiary institutions to source
candidate estate agents
Technology
Increase EAAB outreach through media and other
advanced digital communication platforms.
Create service standards to improve industry
performance
Improving general image of the EAAB through
optimized partnerships with the industry/ sector
Monitoring and meeting increasing and evolving
Mandate
Expanding mandate outside of legislation and
without securing funding, leads to unauthorized
expenditure
Compliance and legislation
Non-compliance by estate agents jeopardizes
EAAB consumer protection mandate
An increase in the number of unregistered
estate agents could erode the integrity of the
property sales industry
Fidelity Fund
Increased risks of potential money laundering,
fraud and theft will lead to higher claims from
Fidelity Fund.
Failure by estate agents to bank trust monies
into the trust account can result in claims
lodged against the Fidelity Fund, affecting the
Fund’s performance.
Unlimited claims arising from consumers either
in size or number may deplete the Fidelity Fund
An increase in uninformed / unempowered
property consumers and consequent escalation
in the number of complaints and claims may
negatively impact the Board’s resources and
the Fund’s sustainability.
Illegal operators are a threat to the stability and
sustainability of the Fund.
Lack of understanding of law enforcement
agencies of the EEAB legislation.
Technology
Use of digital/ on-line tools and platforms by
estate agents to conduct their business, creates
opportunity for identity theft.
Sales transactions
A tightening credit market may lead to a
reduction in the number of sales transactions,

10
OPPORTUNITIES THREATS stakeholder needs.
Utilisation of new technological innovations and
developments.
Monitoring and adapting to changing socio,
political and legal landscapes;
Utilising QCTO framework for developing
occupational qualifications.
Managing stakeholder perceptions. Consumer Awareness and understanding
Building consumer understanding of the property
transactions to better protect the consumer.
affecting the sustainability and viability of estate
agency enterprises.
More sectional title properties on the market
could result in increased misappropriation of
those properties by sectional title managers
based on the trends.
Negative economic climate impacting on the
growth and profitability of estate agency
enterprises.
Rapidly increasing costs of services and
necessary IT interventions.
Failing to identify and accommodate changing
stakeholder educational needs; ever changing
skills development and qualification
dispensation and framework;
Lack of appropriate regulation of Property
Developers especially when they perform
Estate Agent functions.
Customer Service
Industry perception of slow turnaround times
and responses to customer queries.

11
1.3. Revisions to Legislative and Other Mandates
The following constitutional court decision had a direct impact on the validity of
Section 32A of the Estate Agency Affairs Act No.112 of 1976 (the Act), as the
court held that the inspection powers conferred on the Board by Section 32A was
unconstitutional. The constitutional invalidity was suspended until 26 February
2016 to enable an amendment to the Act to bring into line with the constitution.
Since 27 February 2016, the Board’s inspection powers have been severely
circumscribed and this has compromised the Board’s legal powers to enforce
regulatory mechanisms and to prevent money-laundering and corruption in the
property industry. It is envisaged that Property Practitioner’s Bill will close this
loophole.
In the meantime, the EAAB will implement a wide range of interim measures to
monitor compliance - such as introduction of online self-assessments and
evaluations, strengthening of the EAAB ‘enforcement capacity to enforce the
provision of the Act and strengthening audit compliance process. The EAAB has
further established strategic relationships with other law enforcement agencies
such as SAPS, FIC, IRBA, and NPA to assist with investigation criminal offence
as well as subsequent prosecution where applicable.
1.4. Pending court cases
Plaintiff/Applicant Case details Potential Liability Status HALIMA TAYLOR PROPERTIES CC
The EAAB has been joined as a third party in these proceedings, by the defendant who is being sued for commission relating to the sale of the EAAB offices in Sandton.
R500,000 loss Case is pending in court
DURRANVALE TRADE & ONV (PTY) LTD
Plaintiff is suing the EAAB for loss of income. EAAB
R750.000.00 Cases pending in court.

12
withheld his certificate to trade based on the fact that the plaintiff had a prior discipliniary record. He is therefore issuing EAAB to the sum of R44, 819, 536-90
JACOBUS STEPHANUS KOTZE
EAAB cited as an interested party. The plaintiff is suing the defendant for failing to pay commission.
R500 000.00 Cases pending in court.
PASCO RISK MANAGEMENT (PTY) LTD
The Plaintiff is claiming a payment of the sum of R490 109.38 plus cost. The Plaintiff claims that security services were performed on behalf of an Executive manager and this arrangement was agreed upon by EAAB. Matter is being defended
R600 000.00 Cases pending in court.
ATLANTIC BEACH HOMEOWNERS ASSOCIATION NPC
An application to prevent the EAAB from instituting internal disciplinary hearing. The applicant claimed that EAAB had no jurisdiction to institute internal discipliniary hearing as they were not Estate Agents in terms of the Act.(Although they sharing commission with Estate Agents) The EAAB successfully defended the matter and was awarded costs. The applicant has
R600,000.00 Cases pending in court

13
lodged an appeal against the EAAB.

14
1.5. Strategic Outcome Orientated Goals of EAAB
The Board confirmed the strategic goals, but the general view was that the goal
statements require revision to be more relevant to the current performance
delivery environment and understanding of the mandate in that context.
The following table reflects the updated goal statements.
No Strategic Outcome
Oriented Goal
Goal Statement
1 Compliant Estate Agency
Sector
To implement speedy cost-effective and transparent measures
to ensure compliance by the estate agencies and agents to
relevant legislation.
2 Consumers are aware and
understand all forms of
property transactions.
To ensure that consumers are made aware of property
transactions through the utilisation of appropriate multimedia,
advertising and marketing platforms.
3 Sustainable Fidelity Fund
To ensure that the Fidelity Fund is efficiently and effectively
managed and controlled.
4 Professional and capacitated
real estate sector
To ensure that all registered estate agents are fully qualified in
accordance with applicable legislative requirements.
5 Transformed real estate
sector
To develop and implement programmes to accelerate the
achievement of at least 30% participation by persons from the
historically disadvantaged backgrounds, in the profession of
estate agents.

15
1.6. Organisational Structure
The Board continued the process of stabilizing the organisation by engaging in
the alignment of the approved functional structure.
This exercise will culminate in a structure that will serve the strategic focus and
deliver the mandate of the EAAB. It will be sufficiently agile, to accommodate the
future demands of the Board.
1.7. EAAB Resource Plan
The organizational structure is prepared in respect of functions which would
enable Estate Agency Affairs Board to achieve their Strategic Goals. The key
functions of the Estate Agency Affairs Board should be the following:
Board (Accounting Authority)
Chief Executive office
Chief Financial office
Corporate services
Education and Training
Transformation
Compliance and Enforcement
Board (Accounting Authority)
The Board (Accounting Authority) serves are the oversight body of EAAB and
report directly to the Minister of Human settlement. (Executive Authority) The
Board is supported by the Complany Secretary in its performance of its duties.
Chief Executive Office
The Chief Executive office is responsible for the following functions:
Strategic planning and monitoring.
Stakeholder interaction and communications.
Overall management of the organisation.

16
The following functions Report to the Board through the Audit and Risk
Committee. These functions report administratively to the Chief Executive
Office
Risk Management
Internal audit
The Chief Finance office is responsible for the following functions:
Administration of the Fidelity Fund.
Financial Management.
Supply chain management
Management of Information Technology.
Corporate service is responsible for the following functions:
Human Resource Management
Marketing and publications
Facilities management
Internal Legal services
Marketing and Communications
Customer Relations Management
Education and Training is responsible for the following functions:
Estate Agents Education and Training.
Professional Body
Establishing a Research and knowledge centre, the research and knowledge unit
will also consist of transactional support.
Transformation is responsible for the following functions:
Drive Transformation both internally at EAAB and externally to ensure compliance
with applicable legislation such as Employment Equity Act and Broad-Based
Black Economic Empowerment and Property sector charter.
Ensure economic inclusion of the previously disadvantaged individuals (PDI) in
the property sector.

17
Engage with Public works department to ensure PDI participate in the property
business.
Establish a Real Estate Incubator for small struggling Estate Agencies,
rehabilitation of non-compliant Estate Agencies and empowerment of youth,
woman and persons with disabilities with focus on previously disadvantaged
individuals.
Promote Consumer Education and awareness and protection by engaging other
stakeholders in the property value chain like finance providers.
Cross functional interface with other section to ensure that transformational
agenda is persued, i.e. reviewing models and initiatives.
Compliance and enforcement is responsible for the following functions:
Attend to complaints received from property consumers..
disciplinary processes involving estate agents;
Adjudicate claims lodged against the Fidelity Fund;
Ensure compliance in relation to the submission of statutory auditor’s reports
by estate agency enterprises;

18

19
1.7.1 Revenue and Expenditure estimates
THE ESTATE AGENCY AFFAIRS BOARD PROJECTED INCOME AND EXPENDITURE BUDGET FOR THE YEAR ENDING 31 MARCH 2020
2017/2018 2017/2018 2018/2019 2018/2019 2019/2020 2020/2021 2021/2022 2022/2023 Budget Audited Outcome Approved
Budget Forecast Budget Forecast Forecast Forecast
Turnover 1 146 048 985 123 193 515 151 375 048 139 120 279 169 223 290 181 068 921 193 743 745 207 122 051 FFC Renewals 1.
1. 26 539 470 20 357 699 38 326 408 33 366 685 44 096 789 47 183 564 50 486 414 54 020 463
Principals 10 775 160 7 470 375 14 707 912 11 260 080 16 914 099 18 098 086 19 364 952 20 720 498 Full Status 6 878 421 6 710 407 10 658 430 9 973 050 12 257 195 13 115 198 14 033 262 15 015 590 Intern Estate Agents 7 580 982 5 302 243 11 972 526 11 257 363 13 768 405 14 732 193 15 763 447 16 866 888 Attorneys 104 907 97 430 107 100 113 322 144 585 154 706 165 535 177 123 Firms 1 200 000 766 444 880 440 756 870 1 012 506 1 083 381 1 159 218 1 240 363 Non-Executive
Director 10 800 6 000 29 224 31 269 33 458 35 800
New Registrations 1.2
3 677 150 3 425 140 3 794 027 3 895 718 5 344 316 5 718 418 6 118 707 6 363 260
Principals 24 297 357 530 196 311 267 000 214 935 229 980 246 079 263 305 Non-Principal 2 531 602 2 838 586 3 285 716 3 259 226 3 835 905 4 104 418 4 391 727 4 699 148 Status Change 427 051 221 905 312 000 250 492 513 000 548 910 587 334 628 447 Firms 694 200 - - 89 000 630 476 674 609 721 832 772 360 Non-Executive
Director - 7 120 - 30 000 150 000 160 500 171 735
Examinations 1.3
47 135 900 34 113 860 36 812 300 27 739 240 43 007 086 46 017 582 49 238 813 52 685 530
Examination Fees 1 460 000 1 543 760 1 605 000 1 563 585 2 106 320 2 253 763 2 411 526 2 580 333 Sales -Study Guides 1 212 800 600 300 1 342 000 1 075 415 1 493 750 1 598 313 1 710 194 1 829 908 Over 60's exemptions 388 000 126 180 213 400 334 400 373 450 399 592 427 563 457 492 CPD Fees 42 929 500 31 091 400 32 500 000 23 708 000 37 500 000 40 125 000 42 933 750 45 939 113

20
Equivalency exemptions
912 000 746 630 1 003 200 976 760 1 254 000 1 341 780 1 435 705 1 536 204
Appeals on Examination Results
44 000 90 48 500 25 230 97 816 104 663 111 990 119 829
Non- executive director exemption
150 000 5 500 82 500 41 250 137 500 147 125 157 424 168 443
Disability and Impairment exemption
39 600 - 17 700 14 600 44 250 47 348 50 662 54 208
Interest Income 1.4.
2 012 034 608 422 850 000 735 192 856 097 916 024 980 146 1 048 756
Interest on Investments
1 969 877 583 522 800 000 698 571 706 097 755 524 808 411 865 000
Interest Other 42 157 24 901 50 000 36 621 150 000 160 500 171 735 183 756
Other Income 1.5.
66 684 431 64 688 393 71 592 313 73 383 444 75 919 002 81 233 332 86 919 665 93 004 042
Administration Fees 53 190 948 52 463 904 56 042 021 62 033 348 58 488 834 62 583 053 66 963 866 71 651 337 Fines 3 750 000 1 914 600 6 500 000 4 343 101 7 150 000 7 650 500 8 186 035 8 759 057 Penalties 5 000 000 4 293 700 4 325 000 2 180 140 4 757 500 5 090 525 5 446 862 5 828 142 Delivery charges 40 000 23 395 40 000 29 670 44 000 47 080 50 376 53 902 Legal document
charges 12 000 8 885 12 000 14 330 13 200 14 124 15 113 16 171
Rental Income 2 241 483 2 333 016 2 423 292 2 427 652 2 670 468 2 857 401 3 057 419 3 271 438 Advertising Fees 50 000 38 740 50 000 49 000 55 000 58 850 62 970 67 377 Duplicate and Amendments
- FFC 1 200 000 1 285 115 1 200 000 1 547 455 1 440 000 1 540 800 1 648 656 1 764 062
Prior year write offs 290 837 - - - - - - Sundry income 1 200 000 2 036 201 1 000 000 758 748 1 300 000 1 391 000 1 488 370 1 592 556

21
2017/2018 2017/2018 2018/2019 2018/2019 2019/2020 2020/2021 2021/2022 2022/2023 Budget Audited Outcome Approved
Budget Forecast Budget Forecast Forecast Forecast
Operating costs 2 140 504 155 122 536 676 138 293 793 130 996 040 157 034 407 167 926 836 179 689 436 191 110 385 Admin expense 2.1 44 857 218 38 886 291 43 284 390 38 371 549 45 416 653 48 488 819 51 883 036 54 349 043
Venue Hire 4 000 000 2 924 343 2 057 000 2 036 694 2 188 000 2 341 160 2 505 041 2 680 394 COS - NQF 4 &
5 600 000 557 230 500 000 687 281 500 000 535 000 572 450 612 522
Invigilators' and Markers Fees
244 000 36 967 370 000 199 474 370 000 395 900 423 613 453 266
Venues, Conferences and Breakaways
356 800 106 583 100 000 124 982 120 000 128 400 137 388 147 005
Staff Training and development
922 419 435 892 650 000 431 399 700 000 749 000 801 430 857 530
Corporate Social Investments
120 000 - 100 000 50 000 - - - -
Bursaries 1 488 000 1 490 280 1 650 000 1 250 000 1 860 000 1 990 200 2 129 514 2 278 580 Software
License 1 390 000 1 259 743 1 390 000 1 062 881 1 390 000 1 487 300 1 591 411 1 702 810
Hardware Maintenance
550 000 - 450 000 225 000 450 000 481 500 515 205 551 269
Software Maintenance
700 000 283 843 500 000 317 964 500 000 535 000 572 450 612 522
Publication and Communication
640 000 342 998 670 000 336 180 500 000 535 000 572 450 612 522
Insurance 821 024 667 404 929 341 773 029 838 000 896 660 959 426 1 026 586 Assets
expensed - 4 721 20 000 20 000 21 400 22 898 -
Bad debts written off
131 512 - - - - - -
Provision for doubtful debts
- (676 961)
1 356 376 1 257 257 881 644 943 360 1 009 395 -
Assets Written Off
- 68 316 - 11 348 - - - -

22
Impairment Loss
- 96 547 50 000 25 000 50 000 53 500 57 245 -
Interest and penalties
- 139 873
Postages 552 859 326 186 650 000 483 366 650 000 695 500 744 185 796 278 Stationery and
Printing 1 400 000 1 706 673 1 700 000 1 207 333 1 500 000 1 605 000 1 717 350 1 837 565
Travelling expenses
2 648 008 2 741 466 2 571 437 1 612 147 2 971 747 3 179 770 3 402 353 3 640 518
Bank Charge 932 680 588 596 795 680 619 160 880 000 941 600 1 007 512 1 078 038 Auditors Remuneration -
Current Year 1 200 000 1 896 834 1 500 000 1 700 000 2 090 000 2 236 300 2 392 841 2 560 340
Internal Audit Fees
500 000 - 500 000 750 000 1 050 000 1 123 500 1 202 145 1 286 295
Telephone and Telex
2 807 508 4 720 323 2 912 160 4 332 412 2 764 355 2 957 860 3 164 910 3 386 454
Photo-copier charges
289 018 230 150 300 000 464 721 500 000 535 000 572 450 612 522
Entertainment 143 000 92 966 - - - - - - Staff welfare - 210 000 224 700 240 429 257 259 Catering and
Refreshments 642 090 558 014 450 000 398 354 505 778 541 182 579 065 619 600
Consumables - - - 3 928 42 000 44 940 48 086 51 452 Nestle
Equipment Rentals
7 274 - 7 856 - - - - -
Garden and Plant Maintenance
214 000 195 124 235 400 219 687 240 000 256 800 274 776 294 010
Subscriptions 292 740 229 522 410 883 332 758 437 943 468 599 501 401 536 499 Sundry
expenses - 60 930 - - - - - -
Office Cleaning 600 000 282 288 72 000 85 967 300 000 321 000 343 470 367 513 Rates and Taxes Office
Building 1 200 000 1 627 517 1 260 000 1 200 501 1 680 000 1 797 600 1 923 432 2 058 072
Repairs and Maintenance Building
1 000 000 889 780 2 500 000 2 051 102 2 500 000 2 675 000 2 862 250 3 062 608

23
Security Costs 548 493 609 116 802 500 709 672 802 500 858 675 918 782 983 097 Water and
Electricity 789 084 857 744 1 287 210 1 247 440 1 428 803 1 528 819 1 635 837 1 750 345
Licencing and Insurance
2 400 3 387 2 568 2 495 3 500 3 745 4 007 4 288
Repairs and Maintenance Vehicle
69 796 57 067 71 686 57 399 85 000 90 950 97 317 104 129
Repairs & Maintenance Furniture & Equipment
71 000 89 086 75 970 39 132 120 000 128 400 137 388 147 005
Promotion and Marketing
600 000 205 842 400 000 240 165 150 000 160 500 171 735 183 756
Advertising 200 000 - - - 250 000 267 500 286 225 306 261 Relocation
Costs - - 200 000 55 000 100 000
Consultants Fees
2 964 156 3 195 917 1 995 587 1 659 445 2 282 560 2 442 339 2 613 303 2 796 234
Corporate Gifts 450 000 215 200 000 178 739 250 000 267 500 286 225 306 261 Call Center 3 820 149 3 201 604 4 240 366 3 501 668 3 500 000 3 745 000 4 007 150 4 287 651 CPD Expenses 3 000 000 2 814 629 1 420 000 1 685 138 1 670 000 1 786 900 1 911 983 2 045 822 Depreciation - Office
furniture 287 120 201 340 237 120 252 890 334 230 357 627 382 660 409 447
Depreciation - Office Equipment
1 039 543 314 979 822 876 518 572 853 879 913 651 977 606 1 046 039
Depreciation - Computer equipment
1 074 871 750 648 1 441 538 1 164 175 1 702 729 1 821 920 1 949 454 2 085 916
Depreciation - Motor Vehicles
212 672 102 303 102 672 102 589 102 672 109 859 117 549 125 778
Depreciation - Buildings
1 611 784 1 571 553 1 631 034 1 468 563 1 616 104 1 729 231 1 850 277 1 979 797
Amortisation - Software
1 526 410 616 215 1 366 810 907 870 1 278 841 1 368 360 1 464 145 1 566 635
Amortisation - Intellectual Property
196 367 - 196 367 98 184 196 367 210 113 224 821 240 558
Depreciation - Leasehold Improvements
131 954 418 862 131 954 92 620 - - - -

24
Other operating
expense 1 783 426 1 287 018 3 114 980 2 092 390 3 540 458 3 795 310 4 068 703 4 362 007
Disciplinary costs
1 008 065 531 521 1 200 000 973 506 1 500 000 1 605 000 1 717 350 1 837 565
Legal Costs 300 000 297 906 1 350 000 566 853 1 550 000 1 658 500 1 774 595 1 898 817 Rental - Leased
Building 246 381 272 630 336 000 334 712 234 000 257 400 283 140 311 454
Recruitment and Selection
228 980 184 961 228 980 217 319 256 458 274 410 293 618 314 172
2017/2018 2017/2018 2018/2019 2018/2019 2019/2020 2020/2021 2021/2022 2022/2023 Budget Audited Outcome Approved
Budget Forecast Budget Forecast Forecast Forecast
Staff costs 2.
2. 90 983 945 79 447 388 88 862 241 87 441 983 104 789 952 112 125 249 119 974 016 128 372 197
Salaries and Wages 59 126 430 55 555 687 61 213 027 59 106 333 70 635 911 75 580 424 80 871 054 86 532 028 Overtime Expenses 195 000 262 533 278 400 283 301 287 388 307 505 329 031 352 063 13th Cheque 2 896 759 3 758 014 2 329 640 2 905 785 5 197 238 5 561 045 5 950 318 6 366 840 Performance
awards 4 672 934 7 786 558 3 655 954 4 672 934 4 342 148 4 646 099 4 971 325 5 319 318
Housing Allowances 1 227 571 - - - - - - - Travel Allowance 3 840 389 3 121 016 2 159 686 2 366 681 2 380 452 2 547 084 2 725 380 2 916 156 Cellphone Allowane 416 997 - 578 729 405 000 662 544 708 922 758 547 811 645 Pension Fund
Contributions 9 393 057 8 232 445 10 805 841 9 866 524 12 364 396 13 229 903 14 155 997 15 146 916
U.I.F Contributions 213 806 202 221 212 695 219 529 223 313 238 945 255 671 273 568 Medical Aid
Contributions 5 626 303 5 009 358 5 930 140 5 250 520 5 947 966 6 364 323 6 809 826 7 286 514
Skills Development Levies
590 499 658 875 605 778 597 643 789 550 844 818 903 955 967 232
Leave Pay - 473 373 - 764 184 450 000 481 500 515 205 551 269
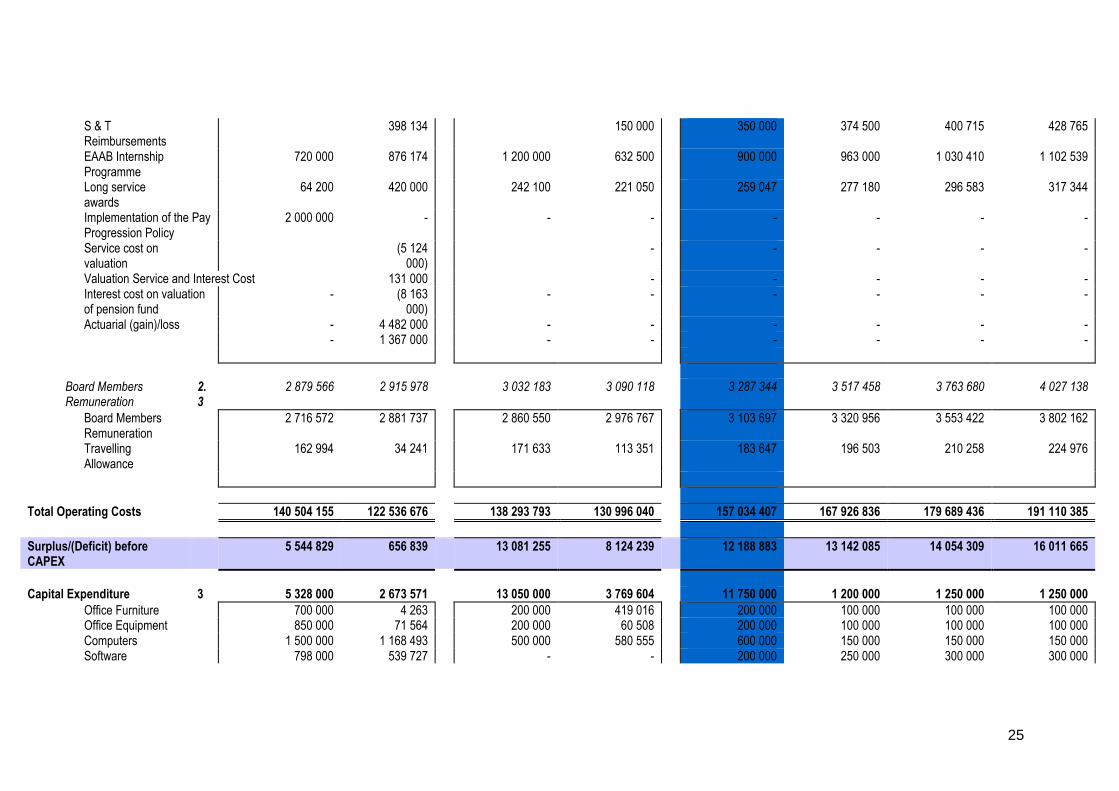
25
S & T Reimbursements
398 134 150 000 350 000 374 500 400 715 428 765
EAAB Internship Programme
720 000 876 174 1 200 000 632 500 900 000 963 000 1 030 410 1 102 539
Long service awards
64 200 420 000 242 100 221 050 259 047 277 180 296 583 317 344
Implementation of the Pay Progression Policy
2 000 000 - - - - - - -
Service cost on valuation
(5 124 000)
- - - - -
Valuation Service and Interest Cost 131 000 - - - - - Interest cost on valuation
of pension fund - (8 163
000) - - - - - -
Actuarial (gain)/loss - 4 482 000 - - - - - - - 1 367 000 - - - - - -
Board Members
Remuneration 2.3
2 879 566 2 915 978 3 032 183 3 090 118 3 287 344 3 517 458 3 763 680 4 027 138
Board Members Remuneration
2 716 572 2 881 737 2 860 550 2 976 767 3 103 697 3 320 956 3 553 422 3 802 162
Travelling Allowance
162 994 34 241 171 633 113 351 183 647 196 503 210 258 224 976
Total Operating Costs 140 504 155 122 536 676 138 293 793 130 996 040 157 034 407 167 926 836 179 689 436 191 110 385
Surplus/(Deficit) before CAPEX
5 544 829 656 839 13 081 255 8 124 239 12 188 883 13 142 085 14 054 309 16 011 665
Capital Expenditure 3 5 328 000 2 673 571 13 050 000 3 769 604 11 750 000 1 200 000 1 250 000 1 250 000
Office Furniture 700 000 4 263 200 000 419 016 200 000 100 000 100 000 100 000 Office Equipment 850 000 71 564 200 000 60 508 200 000 100 000 100 000 100 000 Computers 1 500 000 1 168 493 500 000 580 555 600 000 150 000 150 000 150 000 Software 798 000 539 727 - - 200 000 250 000 300 000 300 000

26
ERP - IT System overhaul
- - 10 000 000 1 500 000 8 500 000 - - -
Intellectual Property - Education Materials
200 000 - 100 000 - - 100 000 100 000 100 000
Land and Buildings 1 280 000 889 525 2 050 000 1 209 525 2 050 000 500 000 500 000 500 000
Surplus/(Deficit) after CAPEX 216 829 (2 016 733)
31 255 4 354 635 438 883 11 942 085 12 804 309 14 761 665

27
1.7.2 Operational expenditure per programme
2015/16 2016/17 2017/18 2018/19 2019/20 2020/21 2021/22
Expenses
Audited Outcome Audited Outcome Audited outcome Budget estimate
Approved budget
Changes from approved
budget
Budget estimate
Revised budget
estimate
Changes from budget
estimate
Budget estimate Revised budget estimate
Changes from budget estimate
Planning Budget Estimate
Rand thousand
Objective/Activity
Administration 61 454 119 208 70 409 82 969 88 501 5 532 89 422 97 752 8 330 95 692 104 494 8 802 111 817
Economic classification
Current payments 61 454 119 208 70 409 82 969 88 501 5 532 89 422 97 752 8 330 95 692 104 494 8 802 111 817
Compensation of employees 32 718 36 432 44 163 45 519 48 426 2 907 49 340 55 753 6 413 52 793 59 463 6 670 63 625
Salaries and wages 32 718 36 432 44 163 45 519 48 426 2 907 49 340 55 753 6 413 52 793 59 463 6 670 63 625
Social contributions - - - - - - - - - - - - -
Goods and services 25 154 78 651 22 270 30 944 34 145 3 201 33 653 35 915 2 262 36 020 38 520 2 500 41 225
Of which 1
Administrative fees - - - - - - - - - -
Advertising - - - - - 250 250 268 268 286
Agency and support/outsourced services 6 302 3 479 3 202 4 240 4 240 - 4 537 3 500 (1 037) 4 855 3 745 (1 110) 4 007
Assets less than R5 000 - - 5 20 20 20 20 21 21 23
Audit costs - - 1 897 2 000 2 000 3 140 3 140 3 360 3 360 3 595
Bank charges - - 589 796 796 880 880 942 942 1 008
Board costs - - 2 916 3 032 3 032 3 287 3 287 3 517 3 517 3 764
Bursaries (employees) - - 814 790 790 910 910 974 974 1 042
Catering: internal activities - - 485 360 360 406 406 434 434 465
Communication 2 994 3 111 3 477 2 317 3 102 785 2 479 2 246 (233) 2 653 2 403 (250) 2 571
Computer services 1 051 1 683 1 544 2 340 2 340 - 2 504 2 340 (164) 2 678 2 504 (174) 2 679
Consultants 2 057 2 862 3 084 1 340 1 640 300 1 434 1 780 346 1 534 1 905 371 2 038
Contractors - - - - - - - - - - - - -
Entertainment - - 93 - - - - - - -
Inventory - - - - - - - - - - - - -
Lease Payments 242 524 298 631 308 (323) 685 734 49 743 792 49 856
Legal fees - - 174 1 000 1 000 1 200 1 200 1 284 1 284 1 374
Non life insurance - - 667 929 929 842 842 900 900 963
Printing and publication - - 1 991 1 700 1 700 1 500 1 500 1 605 1 605 1 717
Property payments - - 3 571 3 921 3 921 4 151 4 151 4 442 4 442 4 753
Repairs and maintenance 1 257 1 470 1 036 2 648 2 648 - 2 833 2 705 (128) 3 031 2 894 (137) 3 097
Research and development - - - - - - - - - - - - -
Training and staff development 1 009 1 058 436 456 700 244 488 700 212 522 749 227 801
Travel and subsistence 3 470 3 671 2 027 1 495 1 645 150 1 600 1 728 128 1 712 1 849 137 1 978
Venues and facilities - - 107 100 100 120 120 128 128 138
Other unclassified expenditure 6 772 60 793 (6 142) 15 477 2 874 (12 603) 17 093 3 476 (13 617) 18 292 3 804 (14 488) 4 070
Valuation of post retirement benefits 6 772 - (7 325) 15 477 - (15 477) 17 093 - (17 093) 18 292 - (18 292) -
Postage & subscription - - 437 892 892 918 918 979 979 1 047
Bad debts written off and impairments - - (381) - - 932 932 997 997 1 067
Other expenditure - 60 793 251 1 982 1 982 727 727 865 865 1 030
EAAB Internship programme - - 876 - - 900 900 963 963 926
Depreciation 3 532 4 089 3 976 6 506 5 930 (576) 6 429 6 084 (345) 6 879 6 511 (368) 6 967
Losses from 50 36 - - - - - - - - - - -
Sale of fixed assets - 7 - - - - - - - - - - -
Impairments and Adjustments to Fair Value 50 29 - - - - - - - - - - -

28
Adjustments to Fair value of financial assets - - - - - - - - - - - - -
Impairments to non-financial assets 50 29 - - - - - - - - - - -
Other - - - - - - - - - - - - -
Total Expenditure 61 454 119 208 70 409 82 969 88 501 5 532 89 422 97 752 8 330 95 692 104 494 8 802 111 817

29
2015/16 2016/17 2017/18 2018/19 2019/20 2020/21 2021/22
Expenses
Audited Outcome Audited Outcome Audited outcome Budget estimate
Approved budget
Changes from approved budget
Budget estimate
Revised budget
estimate
Changes from budget estimate
Budget estimate
Revised budget estimate
Changes from budget estimate
Planning Budget
Estimate
Rand thousand
Objective/Activity
Compliance 29 844 30 796 33 568 39 973 37 711 (2 262) 42 770 40 643 (2 127) 45 765 43 489 (2 276) 46 533
Economic classification
Current payments 29 844 30 796 33 568 39 972 37 711 (2 261) 42 770 40 643 (2 127) 45 765 43 489 (2 276) 46 533
Compensation of employees 26 909 27 973 30 729 34 549 32 994 (1 555) 36 968 35 300 (1 668) 39 556 37 771 (1 785) 40 415
Salaries and wages 26 909 27 973 30 729 34 549 32 994 (1 555) 36 968 35 300 (1 668) 39 556 37 771 (1 785) 40 415
Social contributions - - - - - - - - - - - - -
Goods and services 2 935 2 823 2 839 5 423 4 717 (706) 5 802 5 343 (459) 6 209 5 718 (491) 6 118
Of which 1
Administrative fees - - - - - - - - - -
Advertising - - - - - - - - - -
Agency and support/outsourced services 809 598 532 2 307 - (2 307) 2 468 - (2 468) 2 641 - (2 641) -
Assets less than R5 000 - - - - - - - - - -
Audit costs - - - - - - - - - -
Bank charges - - - - - - - - - -
Board costs - - - - - - - - - -
Bursaries (employees) - - 572 760 760 790 790 845 845 904
Catering: internal activities - - 35 70 70 70 70 75 75 80
Communication 286 746 926 580 580 - 620 526 (94) 664 563 (101) 602
Computer services - - - - - - - - - - - - -
Consultants 172 - 28 156 156 - 166 303 137 178 324 146 346
Contractors - - - - - - - - - -
Entertainment - - - - - - - - - -
Inventory - - - - - - - - - -
Lease Payments - - - - - - - - - - - - -
Legal fees - - 98 1 550 1 550 1 850 1 850 1 980 1 980 2 118
Non life insurance - - - - - - - - - -
Printing and publication - - - - - - - - - -
Property payments - - - - - - - - - -
Repairs and maintenance - - - - - - - - - - - - -
Research and development - - - - - - - - - -
Training and staff development 460 380 - 1 443 - (1 443) 1 544 - (1 544) 1 652 - (1 652) -
Travel and subsistence 1 016 655 535 726 726 - 777 794 17 831 849 18 909
Venues and facilities - - - 757 757 888 888 950 950 1 017
Other unclassified expenditure 192 444 114 211 118 (93) 227 123 (104) 243 132 (111) 141
Subscriptions 192 444 114 211 118 (93) 227 123 (104) 243 132 (111) 141
Please Specify - - - - - - - - - -
Please Specify - - - - - - - - - -
Please Specify - - - - - - - - - -
Please Specify - - - - - - - - - -
Outside shareholders Interest - - - - - - - - - - - - -
Total Expenditure 29 844 30 796 33 568 39 972 37 711 (2 261) 42 770 40 643 (2 127) 45 765 43 489 (2 276) 46 533

30
2015/16 2016/17 2017/18 2018/19 2019/20 2020/21 2021/22
Expenses
Audited Outcome
Audited Outcome
Audited outcome Budget estimate
Approved budget Changes from approved budget
Budget estimate
Revised budget estimate
Changes from budget
estimate
Budget estimate Revised budget estimate
Changes from budget estimate
Planning Budget
Estimate
Rand thousand
Objective/Activity
Education and training 24 132 25 136 18 559 16 619 25 424 8 805 17 783 18 640 857 19 028 19 945 918 21 341
Economic classification
Current payments 24 132 25 136 18 559 16 619 25 424 8 805 17 783 18 640 857 19 028 19 945 917 21 341
Compensation of employees 7 243 9 503 11 003 10 589 20 759 10 170 11 331 13 017 1 686 12 124 13 928 1 804 14 903
Salaries and wages 7 243 9 503 11 003 10 589 20 759 10 170 11 331 13 017 1 686 12 124 13 928 1 804 14 903
Social contributions - - - - - - - - - - - - -
Goods and services 16 889 15 633 7 556 6 030 4 665 (1 365) 6 452 5 623 (830) 6 904 6 017 (887) 6 438
Of which 1
Administrative fees - - - - - - - - - -
Advertising - - - - - - - - - -
Agency and support/outsourced services 5 452 13 618 37 3 090 370 (2 720) 3 306 370 (2 936) 3 538 396 (3 142) 424
Assets less than R5 000 - - - - - - - - - -
Audit costs - - - - - - - - - -
Bank charges - - - - - - - - - -
Board costs - - - - - - - - - -
Bursaries (employees) - - 105 200 200 160 160 171 171 183
Catering: internal activities - - 38 20 20 30 30 32 32 34
Communication 492 610 316 685 375 (310) 733 493 (241) 784 527 (257) 564
Computer services - - - - - - - - - - - - -
Consultants - 65 84 200 200 - 214 200 (14) 229 214 (15) 229
Contractors - - - - - - - - - -
Entertainment - - - - - - - - - -
Inventory 548 370 557 500 500 - 535 (535) 572 (572)
Lease Payments - - - - - - - - - - - - -
Legal fees - - - - - - - - - -
Non- life insurance - - - - - - - - - -
Printing and publication - - 288 - - - - - - -
Property payments - - - - - - - - - -
Repairs and maintenance - - - - - - - - - - - - -
Research and development - - - - - - - - - -
Training and staff development 43 82 - 400 - (400) 428 - (428) 458 - (458) -
Travel and subsistence 206 301 180 350 200 (150) 375 450 75 401 482 81 515
Venues and facilities - - 2 924 1 300 1 300 1 300 1 300 1 391 1 391 1 488
Other unclassified expenditure 10 148 587 3 027 805 1 500 695 861 2 620 1 759 922 2 804 1 882 3 000
CPD expenses 10 148 587 2 815 805 1 420 615 861 1 670 809 922 1 787 865 1 912
Postage & subscriptions - - - 80 80 50 50 54 54 57
Promotion and marketing - - 206 - - 150 150 161 161 172
Other expenditure - - 7 - - 750 750 802 802 859
Please Specify - - - - - - - - - -
Outside shareholders Interest - - - - - - - - - - - - -
Total Expenditure 24 132 25 136 18 559 16 619 25 424 8 805 17 783 18 640 857 19 028 19 945 917 21 341

31
1.7.3 Cash flow statement
The budget information (Medium term estimate) is done on (cash/accrual) basis:
Notes 2015/16 2016/17 2017/18 2018/19 2019/20 2020/21 2021/22
Cash flow data Budget Audited
Outcome Budget Audited
Outcome Budget Audited
Outcome
Budget
estimate Approved
budget
Budget
estimate
Revised Budget
Estimate Budget
estimate
Revised Budget
Estimate
Planning Budget
Estimate
R Thousand
Cash flow from operating activities 10 039 (8 220) 7 826 (23 531) 11 626 10 915 1 119 20 392 553 18 305 581 19 687 21 057
Cash receipts from stakeholders 118 363 102 223 131 048 131 792 146 049 123 194 133 265 151 375 142 594 169 223 152 575 181 069 193 744
Tax receipts - - - - - - - - - - - - -
Sales of goods and services other than capital assets 116 382 95 939 120 257 123 037 135 287 116 378 125 590 139 700 134 381 156 460 143 788 167 413 179 131
Sales of goods and services produced by department (excl. capital assets) 116 382 95 939 120 257 123 037 135 287 116 378 125 590 139 700 134 381 156 460 143 788 167 413 179 131
Sales by market establishments 116 382 18 067 30 760 20 972 30 216 23 783 30 511 42 120 32 646 49 441 34 931 52 901 56 605
Administrative fees - 51 681 52 272 55 103 53 190 52 464 56 042 56 042 59 965 58 489 64 162 62 583 66 963
Other sales - 26 191 37 225 46 962 51 881 40 131 39 037 41 538 41 770 48 530 44 695 51 929 55 563
Transfers received - - - - - - - - - - - - -
Other goverment units - - - - - - - - - - - - -
Departmental transfers - - - - - - - - - - - - -
Executive Authority ( e.g. Health) - - - - - - - - - - - - -
Other national departments - - - - - - - - - - - - -
Departmental agencies and accounts - - - - - - - - - - - - -
Provincial governments - - - - - - - - - - - - -
Local governments - - - - - - - - - - - - -
Higher education institutions - - - - - - - - - - - - -
Foreign governments and international organisations - - - - - - - - - - - - -
Local non-government donors - - - - - - - - - - - - -
Fines, penalties and forfeits - 3 972 8 581 7 093 8 750 6 208 6 825 10 825 7 303 11 907 7 814 12 740 13 633
Interest and rent on land 1 981 2 312 2 210 1 662 2 012 608 850 850 910 856 973 916 980
Interest 1 981 2 312 2 210 1 662 2 012 608 850 850 910 856 973 916 980
Dividends - - - - - - - - - - - - -
Rent on land - - - - - - - - - - - - -
Unclassified revenue - - - - - - - - - - - - -
Tax benefit - - - - - - - - - - - - -
Outside shareholders interest - - - - - - - - - - - - -
Cash paid to stakeholders 108 324 110 443 123 222 155 323 134 423 112 279 132 146 130 983 142 041 150 918 151 994 161 382 172 687
Current payments 108 324 110 443 123 222 155 323 134 423 112 279 132 146 130 983 142 041 150 918 151 994 161 382 172 687
Compensation of employees 20
73 058 66 870 81 789 73 908 91 213 74 865 90 657 88 862 97 638 104 790 104 473 112 125 119 974
Salaries and wages 21 73 058 66 870 81 789 73 908 91 213 74 865 90 657 88 862 97 638 104 790 104 473 112 125 119 974
Social contributions 22 - - - - - - - - - - - - -
Goods and services 23
35 266 43 573 41 433 81 415 43 210 37 414 41 489 42 121 44 403 46 128 47 521 49 257 52 713
Administrative fees 24 - - - - - - - - - - - - -
Advertising 25 550 173 135 - 200 - - - - 250 - 268 286
Agency and support/outsourced services 26 3 646 2 870 3 789 3 531 4 064 3 773 4 610 4 610 4 932 3 870 5 279 4 141 4 431
Assets less than R5 000 27 - 24 - 15 - 5 20 20 21 20 23 21 23
Audit costs 28 1 742 2 054 1 757 1 747 1 700 1 897 2 000 2 000 2 140 3 140 2 289 3 360 3 595
Bank charges 29 624 877 724 563 933 589 796 796 851 880 911 942 1 008
Board costs 30 3 149 1 360 2 691 1 382 2 880 2 916 3 168 3 032 3 389 3 287 3 626 3 517 3 764

32
Bursaries (employees) 31 915 905 1 513 1 360 1 488 1 490 1 650 1 750 1 766 1 860 1 889 1 990 2 130
Catering: internal activities 32 615 407 392 475 642 558 450 450 482 506 515 541 579
Communication 33 3 434 3 599 3 195 4 469 3 448 4 950 3 582 4 057 3 833 3 264 4 101 3 493 3 737
Computer services 34 1 179 1 052 1 133 1 684 2 640 1 544 2 340 2 340 2 504 2 340 2 678 2 504 2 679
Consultants 35 1 630 2 229 1 750 2 927 2 964 3 196 1 696 1 996 1 814 2 283 1 941 2 442 2 613
Contractors 36 - - - - - - - - - - - - -
Entertainment 37 32 22 133 - 143 93 - - - - - - -
Inventory 38 400 548 400 370 600 557 500 500 535 - 572 - -
Lease Payments 39 - 5 257 281 253 298 331 308 364 734 400 792 856
Legal fees 40 1 711 821 1 308 599 1 308 273 2 550 2 550 2 729 3 050 2 920 3 264 3 492
Non life insurance 41 716 556 764 570 823 667 932 929 997 841 1 067 900 963
Printing and publication 42 2 230 1 714 2 050 1 794 2 000 2 050 2 100 1 700 2 247 1 500 2 404 1 605 1 717
Property payments 43 2 908 1 052 900 2 812 1 989 1 944 2 547 3 921 2 725 4 151 2 917 4 442 4 753
Repairs and maintenance 44 829 1 257 1 029 1 470 1 141 1 036 2 648 2 648 2 833 2 705 3 031 2 894 3 097
Research and development 45 40 - - - - - - - - - - - -
Training and staff development 46 993 607 1 532 460 922 436 650 700 696 700 744 749 801
Travel and subsistence 47 3 383 4 691 3 302 3 302 2 648 2 741 2 571 2 571 2 751 2 972 2 944 3 180 3 402
Venues and facilities 48 2 342 5 315 4 376 5 208 4 357 3 031 2 157 2 157 2 307 2 308 2 469 2 470 2 642
Other unclassified expenditure 49 2 198 11 435 8 303 46 396 6 067 3 371 4 191 3 086 4 487 5 466 4 801 5 742 6 144
Of Which:
Other operational expenses 250 408 392 - - - - - - - - - -
Corporate Social investments & Corporate gifts - - - 186 570 0 300 300 321 900 343 963 1 030
CPD Expenses - - 2 8 474 3 000 2 815 1 420 1 420 1 519 1 670 1 626 1 787 1 912
Postage & Subscriptions - - - 718 846 556 1 061 1 091 1 135 1 088 1 214 1 164 1 246
Other expenses (2016/17 incls R19.47m paid for pension fund conversion) 1 948 11 027 7 909 37 018 1 651 1 410 275 1 512 1 808 1 618 1 828 1 956
Interest and rent on land - - - - - - - - - - - - -
Interest 53 - - - - - - - - - - - - -
Dividends 54 - - - - - - - - - - - - -
Rent on land 55 - - - - - - - - - - - - -
Tax payment 61 - - - - - - - - - - - - -
Outside shareholders interest - - - - - - - - - - - - -
Transfers and subsidies 56 - - - - - - - - - - - - -
Private enterprises - - - - - - - - - - - - -
Higher education institutions - - - - - - - - - - - - -
Foreign governments and international organisations - - - - - - - - - - - - -
Non-profit institutions - - - - - - - - - - - - -
Households - - - - - - - - - - - - -
Social benefits 58 - - - - - - - - - - - - -
Other transfers to households 59 - - - - - - - - - - - - -
Cash flow from investing activities (4 835) (6 276) (2 650) 2 485 (5 328) 4 575 (3 450) (13 050) (1 450) (11 750) (1 300) (1 200) (1 250)
Acquisition of property, plant, equipment & intangible assets (4 835) (4 448) (2 650) (2 836) (5 328) (2 674) (3 450) (13 050) (1 450) (11 750) (1 300) (1 200) (1 250)
Buildings: residential 68 - - - - - - - - - - - - -
Buildings: non-residential 69 (500) (2 847) (1 000) (226) (1 280) (890) (2 050) (2 050) (500) (2 050) (500) (500) (500)
Other fixed structures 70 - - - - - - - - - - - - -
Investment property 71 - - - - - - - - - - - - -
Transport equipment 72 (460) - (50) - - - - - - - - - -
Furniture and office equipment 73 (300) (495) (200) (741) (1 750) (76) (400) (400) (300) (400) (200) (200) (200)
Other machinery and equipment 73 (100) - (200) - - - - - - - - - -

33
Heritage assets 74 - - - - - - - - - - - - -
Buildings and other fixed structures - - - - - - - - - - - - -
Other than buildings and fixed structures - - - - - - - - - - - - -
Biological assets 66 - - - - - - - - - - - - -
Software and other intangible assets 75 (2 700) (374) (1 000) (904) (798) (540) (500) (10 100) (500) (8 700) (450) (350) (400)
Land & subsoil assets 76 - - - - - - - - - - - - -
Computer equipment 73 (775) (731) (200) (965) (1 500) (1 168) (500) (500) (150) (600) (150) (150) (150)
Other flows from Investing Activities - (1 828) - 5 320 - 7 249 - - - - - - -
Domestic - (1 828) - 5 320 - 7 249 - - - - - - -
long term investments - - - - - - - - - - - - -
Proceeds from sale of property, plant, equipment & intangible assets - 3 - 3 - - - - - - - - -
Sale of other assets - - - - - - - - - - - - -
Other - (1 831) - 5 317 - 7 249 - - - - - - -
Foreign - - - - - - - - - - - - -
long term investments - - - - - - - - - - - - -
Proceeds from sale of assets - - - - - - - - - - - - -
Other - - - - - - - - - - - - -
Interest - - - - - - - - -
Dividends - - - - - - - - -
Outside shareholders interest - - - - - - - - -
Cash flow from financing activities - - - - - - - - - - - - -
Deferred Income - - - - - - - - - - - - -
Departmental transfer - - - - - - - - - - - - -
Other Revenue - - - - - - - - - - - - -
Borrowing Activities - - - - - - - - - - - - -
Domestic - - - - - - - - - - - - -
Loan from other government units - - - - - - - - - - - - -
Short-term (≤12 months) - - - - - - - - - - - - -
Long-term (>12 months) - - - - - - - - - - - - -
Market loans - - - - - - - - - - - - -
Other - - - - - - - - - - - - -
Repayment of long-term loans - - - - - - - - - - - - -
Foreign - - - - - - - - - - - - -
Market loans - - - - - - - - - - - - -
Other - - - - - - - - - - - - -
Repayment of long-term loans - - - - - - - - - - - - -
Repayment of finance leases - - - - - - - - - - - - -
Other (e.g. issuance of shares, revaluations) - - - - - - - - - - - - -
Interest - - - - - - - - -
Dividends - - - - - - - - -
Net increase / (decrease) in cash and cash equivalents 5 204 (14 496) 5 176 (21 047) 6 298 15 490 (2 331) 7 342 (897) 6 555 (719) 18 487 19 807

34
1.7.4 Statement of financial position
2015/16 2016/17 2017/18 2018/19 2019/20 2020/21 2021/22
Statement of Financial Position Notes
Budget Audited
Outcome
Budget Audited
Outcome Budget Audited
Outcome
Budget
estimate Approved
budget
Budget
estimate
Revised Budget
Estimate
Budget
estimate
Revised Budget
Estimate Planning
Budget Estimate
ASSETS
Current assets 40 000 53 696 47 397 27 635 33 673 34 053 30 582 33 504 27 800 32 589 29 746 34 306 36 115
Current investments 77 17 325 - - - - - - - - - - - -
Inventory 78 220 307 328 219 351 951 251 618 269 482 287 516 552
Short term loans 79 3 125 14 329 4 300 9 012 4 601 1 763 4 601 - - - - - -
Trade and other receivables from exchange transactions 81 1 800 829 5 420 3 744 4 003 2 166 4 450 2 318 4 762 2 479 5 095 2 653 2 839
Prepayments 83 - 4 704 500 2 179 2 332 1 202 2 332 1 286 2 495 1 376 2 670 1 472 1 576
Cash and cash equivalents 84 17 530 33 528 36 849 12 481 22 386 27 971 18 948 29 282 20 274 28 252 21 694 29 665 31 148
Non-current assets held for sale 85 - - - - - - - - - - - - -
Non-current assets 77 848 116 995 115 213 105 800 115 010 104 397 106 193 103 331 113 627 113 606 121 580 119 286 125 251
Property, plant and equipment 64 77 848 105 246 104 415 104 241 104 937 102 916 105 452 101 356 112 834 104 406 120 732 109 626 115 108
Intangible assets 65 - 1 843 892 1 559 167 1 481 741 1 975 793 9 200 848 9 660 10 143
Defined benefit plan assets 99 - 9 906 9 906 - 9 906 - - - - - - - -
Total assets 117 848 170 691 162 610 133 435 148 683 138 450 136 775 136 835 141 426 146 195 151 326 153 592 161 366
LIABILITIES
Current liabilities 11 320 29 302 20 800 32 331 18 820 44 313 18 895 35 771 20 218 28 085 21 633 27 177 25 214
Payments received in advance 102 - - - - - - - - - - - - -
Trade and other payables from exchange transactions 103 7 500 24 616 18 000 27 258 15 420 35 867 15 495 31 807 16 580 23 855 17 740 22 662 20 396
Current provisions 109 3 820 4 686 2 800 4 578 3 400 7 909 3 400 3 400 3 638 3 638 3 893 3 893 4 165
Leave 3 400 4 686 2 800 4 578 3 400 4 253 3 400 3 400 3 638 3 638 3 893 3 893 4 165
Bank overdraft 110 - - - - - - - - -
Other current financial liabilities 116 - - - 495 - 537 - 564 - 592 - 622 653
Non-current liabilities 9 720 8 556 8 556 24 634 8 556 17 010 27 098 27 098 28 995 28 995 31 025 31 025 33 196
Operating Lease Liability 125 - - - - - - - - - - - - -
Other non-current financial liabilities 126 - - - 15 771 - 7 302 17 349 17 349 18 563 18 563 19 863 19 863 21 253
Non-current provisions 127 9 720 - - - - - - - - - - - -
Defined benefit plan obligations 128 - 8 556 8 556 8 863 8 556 9 708 9 749 9 749 10 431 10 431 11 162 11 162 11 943
Derivatives financial instruments 132 - - - - - - - - - - - - -
Total liabilities 21 040 37 858 29 356 56 965 27 376 61 323 45 993 62 869 49 213 57 080 52 657 58 201 58 410
NET ASSETS 96 808 132 833 133 254 76 470 121 307 77 127 90 782 73 966 92 213 89 115 98 669 95 391 102 956
Accumulated surplus / (deficit) 133 96 808 102 526 133 254 76 470 121 307 77 127 90 782 73 966 92 213 89 115 98 669 95 391 102 956
Reserves 134 - 30 307 - - - - - - - - - - -
Total net assets and liabilities 117 848 170 691 162 610 133 435 148 683 138 450 136 775 136 835 141 426 146 195 151 326 153 592 161 366
Contingent liabilities
- - - - - - - - - - - - -

35
1.7.5 Income Statement per Quarter QUARTERLY TARGET 2019/2020 Quarter 1 Quarter 2 Quarter 3 Quarter 4 BUDGET
Turnover 169 252 514 28 471 246 35 015 748 47 875 518 57 890 002
FFC Renewals 44 126 013 1 314 620 11 984 123 24 843 893 5 983 377
Principals 16 914 099 644 560 5 726 267 8 310 490 2 232 781 Full Status 12 257 195 298 064 3 204 453 7 352 595 1 402 083 Intern Estate
Agents 13 768 405 324 688 2 766 011 8 532 301 2 145 405
Attorneys 144 585 15 381 15 381 33 839 79 983 Firms 1 012 506 24 622 264 704 607 361 115 819 Non-Executive
Director 29 224 7 306 7 306 7 306 7 306
New Registrations 5 344 316 1 336 079 1 336 079 1 336 079 1 336 079
Principals 214 935 53 734 53 734 53 734 53 734 Non-Principal 3 835 905 958 976 958 976 958 976 958 976 Status Change 513 000 128 250 128 250 128 250 128 250 Firms 630 476 157 619 157 619 157 619 157 619 Non-Executive
Director 150 000 37 500 37 500 37 500 37 500
Examinations
43 007 086
6 626 772
2 501 772
2 501 772
31 376 772
Examination Fees
2 106 320 526 580 526 580 526 580 526 580
Sales -Study Guides
1 493 750 373 438 373 438 373 438 373 438
Over 60's exemptions
373 450 93 363 93 363 93 363 93 363
Disability and Impairment exemption
44 250 11 063 11 063 11 063 11 063
Appeals 97 816 24 454 24 454 24 454 24 454 Non- executive
director exemption
137 500 34 375 34 375 34 375 34 375
Equivalency exemptions
1 254 000 313 500 313 500 313 500 313 500
CPD 37 500 000 5 250 000 1 125 000 1 125 000 30 000 000
Interest Income
856 097
214 024
214 024
214 024
214 024
Interest on Investments
706 097 176 524 176 524 176 524 176 524
Interest Other 150 000 37 500 37 500 37 500 37 500
Other Income
75 919 002
18 979 750
18 979 750
18 979 750
18 979 750
Administration Fees
58 488 834 14 622 209 14 622 209 14 622 209 14 622 209
Penalties 4 757 500 1 189 375 1 189 375 1 189 375 1 189 375 Fines 7 150 000 1 787 500 1 787 500 1 787 500 1 787 500 Delivery charges 44 000 11 000 11 000 11 000 11 000 Legal document
charges 13 200 3 300 3 300 3 300 3 300
Sundry income 1 300 000 325 000 325 000 325 000 325 000 Advertising Fees 55 000 13 750 13 750 13 750 13 750 Duplicate and
Amendments - FFC
1 440 000 360 000 360 000 360 000 360 000
Rental Income 2 670 468 667 617 667 617 667 617 667 617

36
Operating costs 157 034 407 38 807 345 41 862 053 37 124 005 39 241 005 Admin expense 45 416 653 11 988 443 10 701 003 10 305 103 12 422 103
Venue Hire 2 188 000 1 662 880 175 040 175 040 175 040 COS - NQF 4 &
5 500 000 125 000 125 000 125 000 125 000
Invigilators' and Markers Fees
370 000 92 500 92 500 92 500 92 500
Venues, Conferences and Breakaways
120 000 30 000 30 000 30 000 30 000
Staff Training and development
700 000 175 000 175 000 175 000 175 000
Bursaries 1 860 000 279 000 279 000 186 000 1 116 000 Software
License 1 390 000 347 500 347 500 347 500 347 500
Hardware Maintenance
450 000 112 500 112 500 112 500 112 500
Software Maintenance
500 000 125 000 125 000 125 000 125 000
Publication and Communication
500 000 125 000 125 000 125 000 125 000
Insurance 838 000 41 900 712 300 41 900 41 900 Assets
expensed 20 000 5 000 5 000 5 000 5 000
Provision for doubtful debts
881 644 220 411 220 411 220 411 220 411
Impairment Loss 50 000 - - - 50 000 Postages 650 000 162 500 162 500 162 500 162 500 Stationery and
Printing 1 500 000 375 000 375 000 375 000 375 000
Travelling expenses
2 971 747 742 937 742 937 742 937 742 937
Bank Charge 880 000 220 000 220 000 220 000 220 000 Auditors
Remuneration - Current Year
2 090 000 209 000 209 000 209 000 1 463 000
Internal Audit Fees
1 050 000 210 000 157 500 525 000 157 500
Telephone and Telex
2 764 355 691 089 691 089 691 089 691 089
Photo-copier charges
500 000 125 000 125 000 125 000 125 000
Staff welfare 210 000 52 500 52 500 52 500 52 500 Consumables 42 000 10 500 10 500 10 500 10 500 Subscriptions 437 943 109 486 109 486 109 486 109 486 Office Cleaning 300 000 75 000 75 000 75 000 75 000 Rates and
Taxes Office Building
1 680 000 420 000 420 000 420 000 420 000
Repairs and Maintenance Building
2 500 000 625 000 625 000 625 000 625 000
Security Costs 802 500 200 625 200 625 200 625 200 625 Water and
Electricity 1 428 803 357 201 357 201 357 201 357 201
Repairs and Maintenance Vehicle
85 000 21 250 21 250 21 250 21 250
Repairs & Maintenance Furniture & Equipment
120 000 30 000 30 000 30 000 30 000
Promotion and Marketing
150 000 37 500 37 500 37 500 37 500
Advertising 250 000 62 500 62 500 62 500 62 500

37
Relocation Costs
100 000 25 000 25 000 25 000 25 000
Consultants Fees
2 282 560 570 640 570 640 570 640 570 640
Corporate Gifts 250 000 62 500 62 500 62 500 62 500 Call Center 3 500 000 875 000 875 000 875 000 875 000 CPD Expenses 1 670 000 668 000 250 500 250 500 501 000 Depreciation -
Office furniture 334 230 83 558 83 558 83 558 83 558
Depreciation - Office Equipment
853 879 213 470 213 470 213 470 213 470
Depreciation - Computer equipment
1 702 729 425 682 425 682 425 682 425 682
Depreciation - Motor Vehicles
102 672 25 668 25 668 25 668 25 668
Depreciation - Buildings
1 616 104 404 026 404 026 404 026 404 026
Amortisation - Software
1 278 841 319 710 319 710 319 710 319 710
Amortisation - Intellectual Property
196 367 49 092 49 092 49 092 49 092
Other operating
expense 3 540 458 885 114 885 114 885 114 885 114
Disciplinary costs
1 500 000 375 000 375 000 375 000 375 000
Legal Costs 1 550 000 387 500 387 500 387 500 387 500 Rental - Leased
Building 234 000 58 500 58 500 58 500 58 500
Recruitment and Selection
256 458 64 114 64 114 64 114 64 114
Staff costs 104 789 952 25 111 951 29 454 099 25 111 951 25 111 951
Salaries and Wages
70 635 911 17 658 978 17 658 978 17 658 978 17 658 978
Overtime Expenses
287 388 71 847 71 847 71 847 71 847
13th Cheque 5 197 238 1 299 310 1 299 310 1 299 310 1 299 310 Performance
awards 4 342 148 - 4 342 148 - -
Travel Allowance
2 380 452 595 113 595 113 595 113 595 113
Cellphone Allowane
662 544 165 636 165 636 165 636 165 636
Pension Fund Contributions
12 364 396 3 091 099 3 091 099 3 091 099 3 091 099
U.I.F Contributions
223 313 55 828 55 828 55 828 55 828
Medical Aid Contributions
5 947 966 1 486 991 1 486 991 1 486 991 1 486 991
Skills Development Levies
789 550 197 387 197 387 197 387 197 387
Leave Pay 450 000 112 500 112 500 112 500 112 500 S & T
Reimbursements
350 000 87 500 87 500 87 500 87 500
EAAB Internship Programme
900 000 225 000 225 000 225 000 225 000
Long service awards
259 047 64 762 64 762 64 762 64 762

38
Board Members Remuneration
3 287 344 821 836 821 836 821 836 821 836
Board Members Remuneration
3 103 697 775 924 775 924 775 924 775 924
Travelling Allowance
183 647 45 912 45 912 45 912 45 912
Total Operating Costs 157 034 407 38 807 345 41 862 053 37 124 005 39 241 005
Surplus/(Deficit) 12 218 107 (10 336 099) (6 846 305) 10 751 513 18 648 997

39
1.7.6 EAFF Revenue and Expenditure Estimates
INCOME AND EXPENDITURE BUDGET - FOR THE YEAR ENDING 31 MARCH 2020
Budget
2017/18 Audited
Outcome 2017/18
Approved Budget 2018/19
Forecast 2018/19
Budget 2019/20
Forecast 2020/21
Forecast 2021/22
Forecast 2022/23
Revenue 92 024 863 79 424 969 162 003 118 98 682 649 157 977 251 130 515 658 139 651 754 149 427 377
Contributions
Board 1 749 581 1 840 472 1 749 581 1 494 367 1 911 017 2 044 789 2 187 924 2 341 079
Contributions 1 749 581 1 840 472 1 749 581 1 494 367 1 911 017 2 044 789 2 187 924 2 341 079
- Interest 43 497 325 52 540 976 49 404 785 48 487 865 51 873 069 55 504 184 59 389 476 63 546 740
Agent interest 37 815 380 44 137 339 40 462 457 36 569 322 43 294 829 46 325 467 49 568 250 53 038 027 Interest on
Investments 5 681 945 7 528 936 8 892 328 11 918 543 7 922 214 8 476 769 9 070 143 9 705 053
Interest Other - 874 701 50 000 - 656 026 701 948 751 084 803 660
Other Income 46 777 957 25 043 521 110 848 752 48 700 417 104 193 164 72 966 686 78 074 354 83 539 559
Claims Recoveries
3 000 000 - 24 000 000 7 384 150 24 000 000 25 680 000 27 477 600 29 401 032
Fair Value Adjustments
43 777 957 25 043 521 40 980 252 41 316 267 44 193 164 47 286 686 50 596 754 54 138 527
Learnership Programme (SSETA)
- - 45 868 500 - 36 000 000 - -
-

40
Operating costs 85 595 083 66 586 039 146 193 758 85 590 314 139 988 402 111 267 591 119 056 322 127 390 264 -
Bank Charges 20 000 3 706 21 400 62 876 22 898 24 501 26 216 28 051 Claims Paid 4 000 000 843 346 24 000 000 7 905 613 24 000 000 25 680 000 27 477 600 29 401 032 Management
Fees 53 130 083 52 463 904 56 042 021 52 796 993 58 488 834 62 583 053 66 963 866 71 651 337
Provision for bad debts
1 000 000 (628 276)
1 070 000 6 384 150 1 144 900 1 225 043 1 310 796 1 402 552
Bad debts written off
- 1 080 954 - - - - - -
Interest expense 600 000 - 642 000 300 000 686 940 735 026 786 478 841 531 Consumer
Education Awareness
9 445 000 3 995 108 5 903 032 5 903 032 6 056 323 6 480 266 6 933 885 7 419 257
Stakeholder Awareness
2 000 000 1 234 147 942 619 1 000 000 1 325 968 1 418 786 1 518 101 1 624 368
Transformation Initiatives
10 000 000 3 030 168 5 926 186 5 926 186 6 080 079 6 505 684 6 961 082 7 448 358
Insurance 300 000 227 515 321 000 150 000 343 470 367 513 393 239 420 766 Publications -
Agent Magazine 1 600 000 1 344 823 1 712 000 1 808 813 1 831 840 1 960 069 2 097 274 2 244 083
Consultants fees 500 000 726 815 535 000 426 815 572 450 612 522 655 398 701 276 Legal fees 3 000 000 2 008 808 3 210 000 2 925 837 3 434 700 3 675 129 3 932 388 4 207 655 Learnership Programme (SSETA) - 36 000 000 - - -
Surplus 6 429 780 12 838 930 15 809 360 13 092 334 17 988 848 19 248 068 20 595 432 22 037 113

41
1.7.7 EAFF Cash Flow Statement
Notes 2015/16 2016/17 2017/18 2018/19 2019/20 2020/21 2021/22
Cash flow data Budget Audited
Outcome Budget Audited
Outcome Budget Audited
Outcome
Budget
estimate Approved
budget
Budget
estimate
Revised Budget
Estimate Budget
estimate
Revised Budget
Estimate
Planning Budget
Estimate
R Thousand
Cash flow from operating activities (7 441) (8 600) (12 121) (8 489) (36 348) 5 026 (29 665) 5 874
(31 741)
(6 067) (33 966) (45 081) (48 235)
Cash receipts from stakeholders 63 934 52 771 65 166 96 509 48 247 84 218 81 968 120 642 87 707 116 070 93 845 85 608 91 600
Tax receipts - - - - - - - - - - - - - Sales of goods and services other than capital
assets 63 934 52 771 65 166 96 509 48 247 84 218 81 968 120 642 87 707 116 070 93 845 85 608 91 600 Sales of goods and services produced by
department (excl. capital assets) 63 934 52 771 65 166 96 509 48 247 84 218 81 968 120 642 87 707 116 070 93 845 85 608 91 600
Sales by market establishments 63 934 32 895 28 971 42 529 39 565 53 506 42 212 112 082 45 167 106 910 48 328 75 807 81 113
Administrative fees - - - - - - - - - - - - -
Other sales - 19 876 36 195 53 980 8 682 30 712 39 756 8 560 42 540 9 160 45 517 9 801 10 487
Cash paid to stakeholders 71 374 61 371 77 287 104 998 84 595 79 192 111 633 114 768 119 448 122 137 127 811 130 689 139 835
Current payments 71 374 61 371 77 287 104 998 84 595 79 192 111 633 114 768 119 448 122 137 127 811 130 689 139 835
Compensation of employees 20
- - - - - - - - - - - - -
Salaries and wages 21 - - - - - - - - - - - - -
Goods and services 23
70 653 60 916 76 515 104 946 83 995 79 192 110 991 114 126 118 761 121 450 127 076 129 954 139 049
Administrative fees 24 11 900 - - 13 498 19 445 8 259 25 861 12 772 27 672 13 429 29 609 14 369 15 377
Advertising 25 - - - - - - - - - - - - -
Agency and support/outsourced services 26 - - - 52 095 - 52 464 - 71 555 - 76 136 - 81 466 87 168
Bank charges 29 60 13 64 2 20 4 21 21 23 23 25 25 26
Board costs 30 51 493 52 137 52 272 - 53 130 - 53 191 - 56 914 - 60 898 - -
Communication 33 - 3 038 4 652 - - - - - - - - - -
Consultants 35 - 293 500 329 500 727 535 535 572 572 613 613 655
Legal fees 40 6 000 1 910 5 500 2 068 3 000 2 009 3 210 3 210 3 435 3 435 3 675 3 675 3 932
Non life insurance 41 100 18 107 7 300 228 321 321 343 343 368 368 393
Printing and publication 42 1 100 293 1 177 1 885 1 600 1 345 1 712 1 712 1 832 1 832 1 960 1 960 2 097
Venues and facilities 48 - - - - - - - - - - - - -
Other unclassified expenditure 49 - 3 214 12 243 35 062 6 000 14 156 26 140 24 000 27 970 25 680 29 928 27 478 29 401
Of Which:
Claims Paid - - - 11 634 4 000 843 24 000 24 000 25 680 25 680 27 478 27 478 29 401
Services SETA learnership - - - - 2 000 255 2 140 - 2 290 - 2 450 - -
Please specify - 3 214 12 243 23 428 - 13 058 - - - - - - -
Interest and rent on land 722 455 772 52 600 - 642 642 687 687 735 735 786
Interest 53 722 455 772 52 600 - 642 642 687 687 735 735 786
Outside shareholders interest - - - - - - - - - - - - -
Transfers and subsidies 56 - - - - - - - - - - - - -
Private enterprises - - - - - - - - - - - - -
Households - - - - - - - - - - - - -
Other transfers to households 59 - - - - - - - - - - - - -
Cash flow from investing activities - 381 017 3 434 (415 911) 21 281 (34 680) 15 308 15 308 32 973 32 973 32 973 32 973 35 281
Other flows from Investing Activities - 381 017 3 434 (415 911) 21 281 (34 680) 15 308 15 308 32 973 32 973 32 973 32 973 35 281
Domestic - 381 017 3 434 (415 911) 21 281 (34 680) 15 308 15 308 32 973 32 973 32 973 32 973 35 281

42
Sale of other assets - - - - - - - - - - - - -
Other - 381 017 3 434 (415 911) 21 281 (34 680) 15 308 15 308 32 973 32 973 32 973 32 973 35 281
Foreign - - - - - - - - - - - - -
Outside shareholders interest - - - - - - - - -
Cash flow from financing activities - - - - - - - - - - - - -
Deferred Income - - - - - - - - - - - - -
Other Revenue - - - - - - - - - - - - -
Borrowing Activities - - - - - - - - - - - - -
Loan from other government units - - - - - - - - - - - - -
Long-term (>12 months) - - - - - - - - - - - - -
Market loans - - - - - - - - - - - - -
Other - - - - - - - - - - - - -
Dividends - - - - - - - - -
Net increase / (decrease) in cash and cash equivalents (7 441) 372 417 (8 687) (424 400) (15 067) (29 654) (14 357) 21 182 1 232 26 906 (993) (12 108) (12 954)

43
1.7.8 EAFF Statement of Financial Position
2015/16 2016/17 2017/18 2018/19 2019/20 2020/21 2021/22
Statement of Financial Position Notes
Budget Audited
Outcome
Budget Audited
Outcome Budget Audited
Outcome
Budget
estimate Approved
budget
Budget
estimate
Revised Budget
Estimate
Budget
estimate
Revised Budget
Estimate Planning
Budget Estimate
ASSETS
Current assets 458 601 607 926 612 726 278 516 284 895 260 511 280 449 280 449 281 020 281 020 281 632 281 632 301 346
Current investments 77 436 802 138 260 130 716 238 371 273 900 251 216 272 289 272 289 272 289 272 289 272 289 272 289 291 349 Trade and other receivables from exchange transactions 81 15 554 11 842 13 523 6 722 3 571 5 526 3 821 3 821 4 088 4 088 4 375 4 375 4 681
Prepayments 83 - - - - - - - - - - - - -
Cash and cash equivalents 84 6 246 457 824 468 487 33 423 7 424 3 769 4 339 4 339 4 643 4 643 4 968 4 968 5 316
Derivatives financial instruments 90 - - - - - - - - - - - - -
Non-current assets 129 279 - - 332 000 348 000 350 679 364 919 364 919 390 463 390 463 417 796 417 796 447 042
Property, plant and equipment 64 - - - - - - - - - - - - -
Non-Current Investments 91 129 279 - - 332 000 348 000 350 679 364 919 364 919 390 463 390 463 417 796 417 796 447 042
Derivatives financial instruments 90 - - - - - - - - - - - - -
Total assets 587 880 607 926 612 726 610 516 632 895 611 190 645 368 645 368 671 483 671 483 699 428 699 428 748 388
LIABILITIES
Current liabilities 15 069 29 088 21 711 27 584 13 864 15 419 10 864 6 368 11 302 6 813 11 414 5 096 5 453
Payments received in advance 102 - - - - - - - - - - - - - Trade and other payables from exchange transactions 103 7 687 14 692 12 805 18 572 7 763 13 656 4 763 6 368 5 096 6 813 5 096 5 096 5 453
Taxes and transfers payable 108 - - - - - - - - - - - - -
Current provisions 109 4 257 67 4 546 - 1 500 - 1 500 - 1 605 - 1 717 - -
Provisions for operational liabilities - - - - - - - - - - - - -
Provisions for oustanding claims 4 257 67 4 546 - 1 500 - 1 500 - 1 605 - 1 717 - -
Bank overdraft 110 - - - - - - - - -
Current portion of operatinglease liability - - - - - - - - -
Managed funds 119 3 125 14 329 4 360 9 012 4 601 1 763 4 601 - 4 601 - 4 601 - -
Derivatives financial instruments 120 - - - - - - - - - - - - -
Non-current liabilities - - - - - - - - - - - - -
Unspent conditional grants and receipts 121 - - - - - - - - - - - - -
Derivatives financial instruments 132 - - - - - - - - - - - - -
Total liabilities 15 069 29 088 21 711 27 584 13 864 15 419 10 864 6 368 11 302 6 813 11 414 5 096 5 453
NET ASSETS 572 811 578 838 591 015 582 932 619 031 595 771 656 876 639 000 702 857 664 670 688 014 694 332 742 935
Accumulated surplus / (deficit) 133 572 811 578 838 591 015 582 932 619 031 595 771 656 876 639 000 702 857 664 670 688 014 694 332 742 935
Reserves 134 - - - - - - - - - - - - -
Cash reserves - - - - - - - - - - - - -
Non_cash reserves - - - - - - - - - - - - -
Capital fund/ Deferred government grant 135 - - - - - - - - - - - - - Capitalised value of pensions (for Comp Fund only) 136 - - - - - - - - - - - - -
Total net assets and liabilities 587 880 607 926 612 726 610 516 632 895 611 190 667 740 645 368 714 159 671 483 699 428 699 428 748 388

44
1.7.9 EAFF Income Statement per Quarter
ESTATE AGENTS FIDELITY FUND
BUDGET FOR THE YEAR ENDING 31 MARCH 2020
BUDGET 2019/20
QUARTERLY TARGETS
QUARTER 1 QUARTER 2 QUARTER 3 QUARTER 4
Revenue 157 977 251 62 924 265 31 180 496 32 700 651 31 171 838
Contributions Board 1 911 017 95 551 95 551 1 624 365 95 551
Contributions 1 911 017 95 551 95 551 1 624 365 95 551
Interest 51 873 069 36 780 423 5 036 654 5 027 996 5 027 996
Agent interest 43 294 829 34 635 863 2 892 094 2 883 436 2 883 436
Interest on Investments 7 922 214 1 980 554 1 980 554 1 980 554 1 980 554
Interest Other 656 026 164 006 164 006 164 006 164 006
Other Income 104 193 164 26 048 291 26 048 291 26 048 291 26 048 291
Claims Recoveries 24 000 000 6 000 000 6 000 000 6 000 000 6 000 000
Fair Value Adjustments 44 193 164 11 048 291 11 048 291 11 048 291 11 048 291
36 000 000 9 000 000 9 000 000 9 000 000 9 000 000
Operating costs 139 988 402 34 997 101 34 997 101 34 997 101 34 997 101
Bank Charges 22 898 5 725 5 725 5 725 5 725
Claims Paid 24 000 000 6 000 000 6 000 000 6 000 000 6 000 000
Management Fees 58 488 834 14 622 209 14 622 209 14 622 209 14 622 209
Provision for bad debts 1 144 900 286 225 286 225 286 225 286 225
Interest expense 686 940 171 735 171 735 171 735 171 735
Consumer Education Awareness 6 056 323 1 514 081 1 514 081 1 514 081 1 514 081
Stakeholder Awareness 1 325 968 331 492 331 492 331 492 331 492
Transformation initiatives 6 080 079 1 520 020 1 520 020 1 520 020 1 520 020
Insurance 343 470 85 868 85 868 85 868 85 868
Publications - Agent Magazine 1 831 840 457 960 457 960 457 960 457 960
Consultants fees 572 450 143 113 143 113 143 113 143 113
Legal fees 3 434 700 858 675 858 675 858 675 858 675
36 000 000 9 000 000 9 000 000 9 000 000 9 000 000
Surplus 17 988 848 27 927 165 (3 816 604) (2 296 449) (3 825 263)

45
PART B: PROGRAMMES PLANS
2. PROGRAMME 1: FINANCE AND ADMINISTRATION 1.1. Purpose
The programme seeks to maximise EAAB performance through effective and
efficient management of its resources and systems thereby creating a world-
class regulator.
1.2. Strategic Objectives
SO No
Strategic Objective (s) Objective Statement Sub-Programme(s)
1.1 Provide strategic
management and
support across the
organisation
To provide sound strategic
direction and leadership to EAAB
through facilitation of credible
strategic plans, annual
performance plans and reliable
management of EAAB’s
performance
Office of the CEO
1.2. Ensure good
governance and sound
control environment
To ensure good governance and
a sound control environment for
the department
Finance
Board Secretary
1.3 Ensure EAAB
operations are efficient
and effective
Maximise EAAB performance
through prudent management of
resources
Corporate Services
1.4 Maintain a Stakeholder-
centered organisation.
Improving accessibility, service
levels and general image of the
EAAB.
Customer
Relations
Management

46
1.3. Strategic Plan Objective Annual and Medium Term Targets
Programme Performance Indicator Audited/Actual Performance
Estimated Performance
Planned Performance
Medium-Term Targets (MTEF)
2015/16 2016/17 2017/18 2018/19 2019/20 2020/21 2021/22 2022/23 2023/24
Strategic Objective 1.1 Provide strategic management and support across the organization
1.1.1 Percentage achievement of EAAB pre-determined strategic objectives
New New New 68% 80% 100% 100% 100% 100%
1.1.2 Percentage alignment of operational plans to the APP
New New New New 100% 100% 100% 100% 100%
1.1.3 Percentage of strategic risk mitigation action plans implemented
New New New New 100% 100% 100% 100% 100%
Strategic Objective 1.2 Ensure good governance and sound control environment
1.2.1 Percentage Implementation of management action plans to address internal and external audit findings
New New New New 100% 100% 100% 100% 100%
1.2.2 Up to date policies and procedures across organization
New New New Consolidated policy register
developed
100%
100%
100% 100% 100%
1.2.3 Compliance to laws and regulations
New New New New 100% 100% 100% 100% 100%
1.2.4 Percentage of Board resolutions implemented
New New New Board Resolution Register in place
100% 100% 100% 100%
100%

47
Programme Performance Indicator Audited/Actual Performance
Estimated Performance
Planned Performance
Medium-Term Targets (MTEF)
2015/16 2016/17 2017/18 2018/19 2019/20 2020/21 2021/22 2022/23 2023/24
Strategic Objective 1.3 Ensure EAAB operations are efficient and effective.
1.3.1 Development and 100% implementation of the skills audit plan
New New New New
Development and implementation of the skills audit plan
70% alignment between requirements and candidate skills
80% alignment between requirements and candidate skills
90% alignment between requirements and candidate skills
100% alignment between requirements and candidate skills
1.3.2 Percentage of implementation of Integrated IT solution
New New New Approved ICT Architecture
Implemented integrated ICT solution
100% compatibility with organisational requirements
100% compatibility with organisational requirements
100% compatibility with organisational requirements
100% compatibility with organisational requirements
Strategic Objective 1.4 Maintain a Stakeholder-centered organisation.
1.4.1 Implementation of EAAB stakeholder management plan
New New New
Approved Stakeholder Management
Plan
100% implementation of the plan
100% implementation of the plan
100% implementation
of the plan
100% implementation
of the plan
100% implementation of the plan
1.4.2 Percentage rate of stakeholder query resolutions within 48 Hours
85% 83% 90% 85% 100 % 100 % 100 % 100 % 100 %
1.4.3 Number of partnerships SLAs with relevant partners
New New New New 8 10 12 14 16

48
1.4. Programme Performance Indicator Quarterly Targets for 2019/20
Programme Performance Indicator Reporting Period
ANNUAL TARGET
QUARTERLY TARGETS
2019/20 Q1 Q2 Q3 Q4
1.1.1 Percentage achievement of EAAB pre-determined strategic objectives
Quarterly 80% 80% 80% 80% 80%
1.1.2 Percentage alignment of operational plans to the APP
Annually 100% 100% N/A N/A N/A
1.1.3 Percentage of strategic risk mitigation action plans implemented
Quarterly 100% 100% 100% 100% 100%
Strategic Objective 1.2 Ensure good governance and sound control environment 1.2.1 Percentage Implementation of
management action plans to address internal and external audit findings
Quarterly 100% 100% 100% 100% 100%
1.2.2 Up to date policies and procedures across organization
Quarterly 100%
100% 100% 100% 100%
1.2.3 Compliance to laws and regulations Quarterly 100% 100% 100% 100% 100%
1.2.4 Percentage of Board resolutions implemented
Quarterly 100% 100% 100% 100% 100%
Strategic Objective 1.3 Ensure EAAB operations are efficient and effective.
1.3.1 Development and 100% implementation of the skills audit plan Bi -Annually
development and
implementation of the skills audit plan
N/A Development of the skills audit plan
N/A Implementation of the skills
audit plan

49
Programme Performance Indicator Reporting Period
ANNUAL TARGET
QUARTERLY TARGETS
2019/20 Q1 Q2 Q3 Q4
1.3.2 Percentage of implementation of Integrated IT solution
Quarterly Implemented integrated ICT
solution
100% achievement of milestones
100% achievement of milestones
100% achievement of milestones
Sign off and Handover
Strategic Objective 1.4 Maintain a Stakeholder-centered organisation.
1.4.1 Implementation of EAAB stakeholder management plan
Quarterly 100% implementation
of the plan
100% achievement of milestones
100% achievement of milestones
100% achievement of milestones
100% achievement of milestones
1.4.2 Percentage rate of stakeholder query resolutions within 48 Hours
Quarterly 100 % 100 % 100 % 100 % 100 %
1.4.3 Number of partnerships SLAs with relevant partners
Quarterly 8 2 2 2 2

50
3. PROGRAMME 2: COMPLIANCE 2.1 Purpose To ensure that all Estate Agents and Agencies operating in the country are compliant
to all relevant legislations.
2.2 Strategic Objectives
SO No
Strategic Objective (s)
Objective Statement Sub-Programme(s)
2.1 Improve compliance
with the EAA Act
Improve the level of
compliance by Estate Agents
and Agencies through
provision of effective and
efficient registrations,
inspections, audit compliance
and disciplinary processes
and Implement effective
enforcement initiatives aimed
at promoting compliance
Enforcement and
Compliance
2.2 Improve compliance
with the FIC Act
Improve the level of
compliance by Estate Agents
and Agencies through
provision of supervisory
functionalities in order to
comply with FIC Act.
Enforcement and
Compliance
2.3 Reduce number of
illegally trading
Estate Agents and
Agencies
Reduce the number of Estate
Agents and Agencies that
operate illegally through
issuing of FFCs timeously
and effective identification
and prosecution of estate
agents trading illegally.
Enforcement and
Compliance

51
2.3 Strategic Plan Objective Annual and Medium-Term Targets
Programme Performance Indicator
Audited/Actual Performance Estimated Performance
Planned Performance
Medium-Term Targets (MTEF)
2015/16 2016/17 2017/18 2018/19 2019/20 2020/21 2021/22 2022/23 2023/24
Strategic Objective 2.1 Improve compliance with the EAA Act
2.1.1 Number of self- assessment received, evaluated and analyzed (Report issued)
New New New New 1000 1500 1700 1900 2200
2.1.2 Percentage of compliant new registrations processed within 21 days
New New New New 100% 100% 100% 100% 100%
2.1.3 Percentage of compliant renewals processed within 5 days
New New New New 100% 100% 100% 100% 100%
2.1.4 Percentage Disciplinary Hearings held against completed investigations
New New New New 100% 100% 100% 100% 100%
2.1.5 Percentage compliance to turnaround time
New New New New 100% 100% 100% 100% 100%

52
Programme Performance Indicator
Audited/Actual Performance Estimated Performance
Planned Performance
Medium-Term Targets (MTEF)
2015/16 2016/17 2017/18 2018/19 2019/20 2020/21 2021/22 2022/23 2023/24 for Disciplinary Hearings
2.1.6 Percentage claims processed against claims received
New New New New 100% 100% 100% 100% 100%
Strategic Objective 2.2 Improve compliance with the FIC Act 2.2.1 Number of FIC
Inspections performed
N/A N/A 110 130 150 170 190 210 230
Strategic Objective 2.3 Reduce number of identified illegally trading Estate Agents and agencies
2.3.1 Percentage of cases investigated against the number reported
New New New New 100% 100% 100% 100% 100%
2.3.2 Percentage of disciplinary outcomes enforced
New New New New 100% 100% 100% 100% 100%
2.3.3 Development of the strategic plan to combat illegal trading
N/A N/A N/A
Conducted Research study to confirm the
statistics
Developed the strategic plan
to combat illegal trading
100% achievement of implementation
plan
100% achievement of implementation
plan
100% achievement of implementation
plan
100% achievement of implementation
plan

53
2.4 Programme Performance Indicator Quarterly Targets for 2019/20
Programme Performance Indicator Reporting
Annual Target
Quarterly Targets
2019/20 Q1 Q2 Q3 Q4
Strategic Objective 2.1 Improve compliance with the EAA Act
2.1.1 Number of self- assessment received, analyzed and evaluation (Report issued)
Quarterly 1000 250 250 250 250
2.1.2 Percentage of compliant new registrations processed within 21 days
Quarterly 100% 100% 100% 100% 100%
2.1.3 Percentage compliant renewals processed against those received
Quarterly 100% 100% 100% 100% 100%
2.1.4 Percentage Disciplinary Hearings held against completed investigations
Quarterly 100% 100% 100% 100% 100%
2.1.5 Percentage compliance to turnaround time for Disciplinary Hearings
Quarterly 100% 100% 100% 100% 100%
2.1.6 Percentage claims processed against claims received
Quarterly 100% 100% 100% 100% 100%
Strategic Objective 2.2 Improve compliance with the FIC Act 2.2.1 No of FIC Inspections
performed Annually 150 - - - 150
Strategic Objective 2.3 Reduce number of identified illegally trading Estate Agents

54
Programme Performance Indicator Reporting
Annual Target
Quarterly Targets
2019/20 Q1 Q2 Q3 Q4 2.3.1 Percentage of cases
investigated against the number reported
Quarterly 100% 100% 100% 100% 100%
2.3.2 Percentage of disciplinary outcomes enforced
Quarterly 100% 100% 100% 100% 100%
2.3.3 Development of the strategic plan to combat illegal trading
Annually
Developed the strategic plan
to combat illegal trading
N/A
N/A
N/A
Developed the strategic plan to combat illegal
trading

55
4. PROGRAMME 3: EDUCATION AND TRAINING 3.1 Purpose
To build capacity for the estate agency sector through training and continuous
professional development.
3.2 Strategic Objectives
SO No
Strategic Objective (s) Objective Statement Sub-Programme(s)
3.1 Facilitate increase in
the number of qualified
Estate Agents
Implement the estate
agents training programme
in line with the required
standards of education and
training for estate agency
practitioners
Education and Training
3.2 Ensure continuous
development of the
estate agents
Ensure that all registered
estate agents remain
relevant through
implementation of the
continuous professional
development programme
Education and Training
3.3 Develop and harvest
knowledge in the real
estate market
Position EAAB the
knowledge hub for all real
estate information
Education and Training Corporate Services

56
3.3 Strategic Plan Objective Annual and Medium Term Targets
Programme Performance Indicator
Audited/Actual Performance Estimated Performance
Planned Performance
Medium-Term Targets (MTEF)
2015/16 2016/17 2017/18 2018/19 2019/20 2020/21 2021/22 2022/23 2023/24
Strategic Objective 3.1 Facilitate increase in the number of qualified Estate Agents
3.1.1 Identified real estate sector skills and competency needs New New New
Completed stakeholder
liaison engagement
SAQA approved
Occupational Qualifications
Implementation of the approved
Occupational Qualifications
Implementation of the approved
Occupational Qualifications
Implementation of the approved
Occupational Qualifications
Implementation of the approved
Occupational Qualifications
3.1.2 Increase in percentage of registered Estate Agents with professional designation
New New New New 5% increase
as per audited results
10% increase as per audited results
15% increase as per audited results
20% increase as per audited results
25% increase as per audited results
3.1.3 Increase in percentage Retention rate of Candidate Estate Agents enrolled for PDE 4
New New New Establish a
baseline
5% increase as per audited
results
10% increase as per audited results
15% increase as per audited results
20% increase as per audited results
25 increase as per audited results
3.1.4 Increase in percentage retention rate of Non Principal Estate Agents enrolling for PDE 5
New New New Establish a
baseline
5% increase as per audited
results
10% increase as per audited results
15% increase as per audited results
20% increase as per audited results
25% increase as per audited results
3.1.5 Percentage of processed log books within the stipulated timeframes
New New New 100% 100% 100% 100% 100% 100%

57
Programme Performance Indicator
Audited/Actual Performance Estimated Performance
Planned Performance
Medium-Term Targets (MTEF)
2015/16 2016/17 2017/18 2018/19 2019/20 2020/21 2021/22 2022/23 2023/24
Strategic Objective 3.2 Ensure continuous professional development of the estate agents
3.2.1 Increase in the percentage of Estate Agents who are registered for CPD and have met CPD requirements in full
New New New 45% 55% increase as per audited
results
65% increase
as per audited results
75% increase
as per audited results
85% increase
as per audited results
95% increase
as per audited results
Strategic Objective 3.3 Develop and harvest knowledge in the real estate market
3.3.1 Publications produced per annum (Agent Magazine)
4 4 4 4 4 4 4 4 4
3.3.2 Percentage completion of the information hub project plan for Estate Agents and Agencies
New New New Signed off
library specification
Implemented Virtual library
Access by Estate
Agents and Agencies
Access by Estate
Agents and Agencies
Access by Estate
Agents and Agencies
Access by Estate
Agents and Agencies
3.3.3 Accessibility of the information to the consumers through implementation of communication strategy
New New New
Implemented multiple
communication methods
Implemented multiple
communication methods
Implemented multiple
communication methods
Implemented multiple
communication methods
Implemented multiple
communication methods
Implemented multiple
communication methods

58
3.4 Programme Performance Indicator Quarterly Targets for 2019/20
Programme Performance Indicator Reporting
Planned Performance
Quarterly Targets
2019/20 Q1 Q2 Q3 Q4
Strategic Objective 3.1 Facilitate increase in the number of qualified Estate Agents
3.1.1 Identified real estate sector skills and competency needs
Annually SAQA approved Occupational Qualifications
- - - SAQA approved
Occupational Qualifications
3.1.2 Increase in percentage of registered Estate Agents with professional designation
Annually 5% increase as per audited results
- - - 5% Increase
increase as per audited results
3.1.3 Increase in percentage Retention rate of Candidate Estate Agents enrolled for PDE 4
Annually 5% increase as per audited results
- - - 5% increase
increase as per audited results
3.1.4 Increase in percentage retention rate of Non Principal Estate Agents enrolling for PDE 5
Annually 5% increase as per audited results
- - - 5% increase
increase as per audited results
3.1.5 Percentage of processed log books within the stipulated timeframes
Bi annually 100 increase as per audited results
100%
100%
100%
100%
Strategic Objective 3.2 Ensure continuous professional development of the estate agents
3.2.1 Increase in the percentage of Estate Agents who are registered for CPD and have met CPD requirements in full
Annually 55% increase as
per audited results
- - - 55% increase as
per audited results

59
Programme Performance Indicator Reporting
Planned Performance
Quarterly Targets
2019/20 Q1 Q2 Q3 Q4
Strategic Objective 3.3 Develop and harvest knowledge in the real estate market
3.3.1 Publications produced per annum (Agent Magazine)
Quarterly 4 1 1 1 1
3.3.2 Percentage completion of the information hub project plan for Estate Agents and Agencies
Annually Implemented Virtual library
100% achievement of implementation milestones
100% achievement of implementation milestones
100% achievement of implementation milestones
100% completion of the implementation
3.3.3 Accessibility of the information to consumers through implementation of communication strategy
Quarterly Implemented multiple communication methods
100% implementation against plan
100% implementation against plan
Accessibility of information
Accessibility of information

60
5. PROGRAMME 4: TRANSFORMATION 4.1 Purpose
The purpose of the Transformation programme is to transform the real estate sector
with regards to economic participation of race and the culture of the industry.
4.2 Strategic Objectives
SO No
Strategic Objective (s) Objective Statement Sub-Programme(s)
4.1 To increase the number
of youth, PDI, black
women, and people
with disabilities in the
real estate sector
Through the Incubation
programme, increase
the rate of participation
and the success rate of
youth, black women,
people with disabilities
and PDI’s in the real
estate sector.
Transformation
Education and Training
4.2. To implement an
impactful Amnesty
Campaign for estate
agents and agencies.
To ensure the
strengthening of a
compliant real estate
sector by increasing the
number of estate
agencies and agents
who apply for amnesty.
Transformation
Communication
Compliance and
Enforcement
4.3 To ensure the
protection, education
and awareness of
Consumers with regard
to property transactions
Promote Consumer
Education and
awareness and
protection by engaging
other stakeholders in the
property value chain like
finance providers.
Transformation
Communication
Education and Training
4.4 To increase internal and
external transformation
in accordance with
BBBEE, PPPFA, EE,
Ensures that the EAAB
transforms its internal
environment and
practices to ensure
Corporate Services
Transformation

61
SO No
Strategic Objective (s) Objective Statement Sub-Programme(s)
Skills Development,
Property Sector
Charter.
compliance with the
applicable
transformation
legislation
4.5 To develop financial
mechanisms and
incentives for
sustainable
transformation
initiatives.
Develop schemes to
provide financial
incentives to facilitate
the sustainability of
transformation initiatives.
Transformation
Finance
4.3 Sub-Programme Overview
The purpose of the Transformation programme is to:
Drive Transformation both internally at EAAB and externally to ensure
compliance with applicable legislation such as Employment Equity Act
and Broad-Based Black Economic Empowerment and Property sector
charter.
Ensure economic inclusion of the previously disadvantaged individuals
(PDI) in the property sector.
Engage with Public works department to ensure PDI participate in the
property business.
Establish a Real Estate Incubator for small struggling Estate Agencies,
rehabilitation of non-compliant Estate Agencies and empowerment of
youth, woman and persons with disabilities with focus on previously
disadvantaged individuals.
Promote Consumer Education and awareness and protection by engaging
other stakeholders in the property value chain like finance providers.
Cross functional interface with other section to ensure that
transformational agenda is pursued, i.e. reviewing models and initiatives.

62
4.4 Strategic Plan Objective Annual and Medium-Term Targets
Programme Performance Indicator
Audited/Actual Performance Estimated Performance
Planned Performance
Medium-Term Targets (MTEF)
2015/16 2016/17 2017/18 2018/19 2019/20 2020/21 2021/22 2022/23 2023/24
Strategic Objective 4.1 To increase the number of Youth , PDI, black women, people with disabilities and in the real estate sector.
4.1.1 Number of youth intern placed with property industry host employers through the one learner one agency programme trainings.
2298 3100 4000 1000. 2000 4000 6000 8000 10000
4.1.2 Percentage increase in the retention/ success rate of youth intern placed with property industry host employers through the one learner one agency programme trainings.
New
New
New
New 50% retention
rate as per audited results
70% retention rate as per
audited results
90% retention
rate as per audited results
100% retention
rate as per audited results
100% retention
rate as per audited results
4.1.3 Percentage increase of black women (excl. youth category) that have been supported to increase economic participation through principalisation
New
New
New
New 10% 20% 30% 40% 50%

63
Programme Performance Indicator
Audited/Actual Performance Estimated Performance
Planned Performance
Medium-Term Targets (MTEF)
2015/16 2016/17 2017/18 2018/19 2019/20 2020/21 2021/22 2022/23 2023/24 4.1.4 Number of
principals established through the Implementation of the Principalisation Programme
new new new
Finalisation of the Principalisation Programme framework
250 300 350 400 450
Strategic Objective 4.2 To implement an impactful Amnesty Campaign for estate agents and agencies 4.2.1 Percentage of
illegally trading Estate Agents rehabilitated as a result of the Amnesty Campaign
N/A N/A N/a
Research study report with respect to illegal trading Estate Agents
100% of applied
granted will be rehabilitated
100%
100%
100% 100%
Strategic Objective 4.3 To ensure the protection, education and awareness of Consumers with regard to property transactions
4.3.1 Number of consumers reached through Radio media campaigns
10 256 000 consumers reached through National Radio media campaigns
12 445 000 consumers reached through National Radio media campaigns
15 045 000 consumers reached through National Radio media campaigns
16 500 000 consumers reached through National Radio media campaigns
18 600 000 consumers reached through National Radio media campaigns
20 700 000 consumers reached through National Radio media campaigns
22 800 000 consumers reached through National Radio media campaigns
24 900 000 consumers reached through National Radio media campaigns
27 000 000 consumers reached through National Radio media campaigns
4.3.2 Number of consumers reached through print media campaigns
100 000 consumers reached through Print media campaigns
300 000 consumers reached through Print media campaigns
750 000 consumers reached through Print media campaigns
800 000 consumers reached through Print media campaigns
700 000 consumers reached through Print media campaigns
1 000 000? consumers reached through Print media campaigns
1 100 000 consumers reached through Print media campaigns
1 200 000 consumers reached through Print media campaigns
1 300 000 consumers reached through Print media campaigns
4.3.3 Number of consumer
N/A N/A 15 6 15 billboards set up in all 9
15 17 19 20

64
Programme Performance Indicator
Audited/Actual Performance Estimated Performance
Planned Performance
Medium-Term Targets (MTEF)
2015/16 2016/17 2017/18 2018/19 2019/20 2020/21 2021/22 2022/23 2023/24 education campaigns using Billboards to raise awareness of property transactions and reach over 2million consumers
provinces and over 2millions
Strategic Objective 4.4 To improve internal transformation in accordance with BBBEE, PPPFA, EE, Skills Development, Property Sector Charter.
4.4.1 Implementation of the BBBEE score cards, employment equity, skills development plan and property sector charter
New New New new 100% achievement of the annual target reflected in the plans / scorecards of the different departments
100% achievement of the annual target reflected in the plans / scorecards of the different departments
100% achievement of the annual target reflected in the plans / scorecards of the different departments
100% achievement of the annual target reflected in the plans / scorecards of the different departments
100% achievement of the annual target reflected in the plans / scorecards of the different departments
Strategic Objective 4.5 To develop financial mechanisms and incentives for sustainable transformation initiatives.
4.5.1 Number of implementable developed financial incentive/s for transformation initiatives
New New New Approved framework Signed SLAs Approved plan
100% 100% 100% 100% 100%

65
4.5 Programme Performance Indicator Quarterly Targets for 2019/20
Performance Indicator Reporting
Period
Medium-Term Targets
Quarterly Targets
2019/20 Quarter 1 Quarter 2 Quarter 3 Quarter 4
Strategic Objective 4.1 To increase the number of Youth, HDI, black women, people with disabilities in the real estate sector. 4.1.1 Number of youth interns placed with property
industry host employers through the one learner, one agency programme training
Quarterly 2000 500 500 500 500
4.1.2 Percentage increase in the retention/ success rate of youth intern placed with property industry host employers through the one learner one agency programme trainings.
Annually 50% retention rate as per audited figures
- - -
50% retention rate as per audited figures
4.1.3
Percentage increase of black women (excl. youth category) that have been supported to increase economic participation through principalisation
Annually 5% - - - 5%
4.1.4 Number of principals established through the Implementation of the Principalisation Programme
Quarterly 250 55 65 65 65
Strategic Objective 4.2: To implement an impactful Amnesty Campaign for estate agents and agencies 4.2.1 Percentage of illegally trading Estate Agents
rehabilitated as a result of the Amnesty Campaign
Quarterly 100% of applied granted will be rehabilitated
100% 100%
100%
100%
Strategic Objective 4.3 To ensure the protection, education and awareness of Consumers with regard to property transactions
4.3.1 Number of consumers reached through Radio media campaigns
Quarterly
18 600 000 consumers reached through National Radio media campaigns
4 650 000
4 650 000
4 650 000
4 650 000

66
Performance Indicator Reporting
Period
Medium-Term Targets
Quarterly Targets
2019/20 Quarter 1 Quarter 2 Quarter 3 Quarter 4
4.3.2 Number of consumers reached through print media campaigns
Quarterly
700 000 consumers reached through Print media campaigns
175 000
175 000
175 000
175 000
4.3.3 Number of consumer education campaigns using Billboards to raise awareness of property transactions and reach over 2million consumers
Quarterly
15 billboards set up in all 9 provinces and over 2millions consumers reached – 3 GP, WC, KZN & 1 per province
1GP 1WC 1FS 1 NW
1GP 1WC 1KZN 1EC
1GP 1KZN 1MP
1WC 1KZN 1LMP
Strategic Objective 4.4 To improve internal transformation in accordance with BBBEE, PPPFMA, EE, Skills Development, Property Sector Charter.
4.4.1 Implementation of the BBBEE score cards, employment equity, skills development plan and property sector charter
Annually
100% achievement of internal targets of
each plan/ scorecard.
- - - 100%
Strategic Objective 4.5 To develop financial mechanisms and incentives for sustainable transformation initiatives.
4.5.1 Number of developed implementable financial mechanisms and incentive/s for transformation initiatives.
Quarterly
Establish and start the development of 1 financial incentive/
scheme.
Develop Approved Implement
25% Implement
50%

67
6. PROGRAMME 5: FIDELITY FUND 5.1 Purpose
The Fidelity Fund is the accumulation of financial resources used as a
protection mechanism for property consumers that are defrauded by estate
agents.
5.2 Strategic Objectives
SO No
Strategic Objective (s) Objective Statement Sub-Programme(s)
5.2.1 To ensure that the
Fidelity Fund is
financially sustainable
Ensure that the fidelity
fund has sufficient funds
to service/ supply the
demand in claims from
the property consumers.
Finance
5.2.2 To ensure that the
Fund is effectively and
efficiently managed
Ensure that the fund has
the necessary resources
and processes in place
to effectively and
efficiently execute its
mandate.
Finance
5.3 Sub-Programme Overview The fidelity fund is the accumulation of financial resources used as a protection
mechanism for property consumers that are defrauded by Estate Agents.

68
5.4 Strategic Plan Objective Annual and Medium-Term Targets
Programme Performance Indicator
Audited/Actual Performance Estimated Performance
Planned Performance
Medium-Term Targets (MTEF)
2015/16 2016/17 2017/18 2018/19 2019/20 2020/21 2021/22 2022/23 2023/24
Strategic Objective 5.1 To ensure that the Fidelity Fund is financially sustainable.
5.1.1 Percentage growth in Annual Net Asset Value
2.22% 0.095% 0.1% 1.25% 1.25% 1.25% 1.25% 1.25% 1.25%
5.1.2 Reviewed and approved investment strategy implemented
N/A N/A N/A N/A
Reviewed Investment
Strategy approved
Implement Implement Implement Implement
5.1.3 Re-insurance of Fidelity fund claims.
New New New Research possible options
Board Approval
Implement Implement Implement Implement
Strategic Objective 5.2 To ensure that the Fund is effectively and efficiently managed.
5.2.1 Percentage of interest receivable from estate agency trust accounts collected within 30 days of the due dates
30% 84% 95% 95% 95% 95% 95% 95% 95%
5.2.2 Percentage of fully compliant claims paid within six months
30% 69% 76% 80% 85% 90% 86% 88% 90%

69
5.5 Programme Performance Indicator Quarterly Targets for 2019/20
Performance Indicator Reporting
Period
Medium-Term Targets
Quarterly Targets
2019/20 Quarter
1 Quarter
2 Quarter
3 Quarter
4
Strategic Objective 5.1 To ensure that the Fidelity Fund is financially sustainable 5.1.1 Percentage growth in Annual Net Asset Value
Annually 1.25% - - - .1,25
5.1.2 Reviewed and approved investment strategy implemented Annually
Investment Strategy approved
Approved
Implemented
Implemented
Implemented
5.1.3 Re-insurance of Fidelity fund claims.
Bi Annually New Insurance
Investigated and approved
-
Investigate
possible option
- Investiga
te & Approve
Strategic Objective 5.2: To ensure that the Fund is effectively and efficiently managed 5.2.1 Percentage of interest receivable from estate agency
trust accounts collected within 30 days of the due dates Monthly 95% 95% 95% 95% 95%
5.2.2 Percentage of fully compliant claims paid within six months
Bi Annually 85% - 85% - 85%

70
7. PROGRAMME 6: CONRIBUTION TO MEDIUM TERM STRATEGIC FRAMEWORK
6.1 Purpose
Contribute to the MTEF objectives of the ministry by promoting and implementing
government-wide priorities.
6.2 Strategic Objectives
SO No
Strategic Objective (s) Objective Statement Sub-Programme(s)
6.1 Transactional Support -
estate agents and
agencies operating and
supporting the affordable
and subsidized housing
areas
To support the
development of a functional
and equitable residential
property market by
increasing the level of
support provided for
entering and transacting in
the affordable and
subsidized housing areas.
Education and
Training
Transformation
Compliance
6.2 Ensure Bi-annual
data/information on
industry trends and
analysis are available
Conduct research and
publish statistical
information on the
affordable and subsidized
housing market.
Education and
Training
Transformation

71
6.3 Strategic Plan Objective Annual and Medium Term Targets
Programme Performance Indicator
Audited/Actual Performance Estimated Performance
Planned Performance
Medium-Term Targets (MTEF)
2015/16 2016/17 2017/18 2018/19 2019/20 2020/21 2021/22 2022/23 2023/24
Strategic Objective 6.1 To provide transactional support through developing estate agents for the affordable and subsidized housing
areas
6.1.1
Percentage increase of estate agents and agencies operating in the subsidized and affordable housing areas.
N/A N/A 10% 10% 10% 5% 5% 5% 5%
Strategic Objective 6.2 Ensure Bi-annual data/information on industry trends and analysis are available
6.2.1 Number of reports on trends in the affordable property market.
New or N/A New or
N/A New or
N/A New or N/A
1 Annual Report
1 Annual Report
1 Annual Report
1 Annual Report
1 Annual Report
6.2.2 Distribution of sales in the affordable housing marketed and monitored
New or N/A New or
N/A New or
N/A New or N/A
Bi-annual report & monitoring
Bi-annual report & monitoring
Bi-annual report & monitoring
Bi-annual report & monitoring
Bi-annual report & monitoring
6.2.3 Annual trend analysis report indicating increase in transaction of properties valued less than
New or N/A New or
N/A New or
N/A New or N/A
1 Annual Report
1 Annual Report
1 Annual Report
1 Annual Report
1 Annual Report

72
Programme Performance Indicator
Audited/Actual Performance Estimated Performance
Planned Performance
Medium-Term Targets (MTEF)
2015/16 2016/17 2017/18 2018/19 2019/20 2020/21 2021/22 2022/23 2023/24 R500000
6.4 Programme Performance Indicator Quarterly Targets for 2019/20
Performance Indicator Reporting
Period
Medium-Term Targets
Quarterly Targets
2019/20 Quarter
1 Quarter
2 Quarter
3 Quarter
4
Strategic Objective 6.1 To provide transactional support through developing estate agents for the affordable and subsidized housing areas 6.1.1 Percentage increase in estate agents operating in the
subsidized and affordable housing areas.
Annually
10% increase in estate agents operating
2.5% 2.5% 2.5% 2.5%
Strategic Objective 6.2: Ensure Bi-annual data/information on industry trends and analysis are available 6.2.1 Number of reports on trends in the affordable property
market. Annually 1 Annual Report - - 1 report at year
end
6.2.2 Distribution of sales in the affordable housing marketed and monitored
Bi-annually 2 Bi-annual report & monitoring
1 report monitor 1 report
6.2.3 Annual trend analysis report indicating increase in transaction of properties valued less than R500000
Annually 1 Annual Report 1 report

73
PART C: LINKS TO OTHER PLANS
1.1. Department of Human settlement housing initiatives
The EAAB seeks to empower its own employees in terms of offering Department of
Human settlement products such as the Finance Linked Individual Subsidy
Programme (FLISP) and affordable housing. This initiative will operate through
interactions with NEHAWU. EAAB employees will be encouraged to own their own
homes and, consequently, to receive benefits from Department of Human
settlements such as, for instance, the grant of a subsidy to assist homeowners who
do not qualify to obtain a mortgage loan from a financial institution. Homeowners
earning between R3 500 and R15 000 per month may qualify to receive a subsidy
from the DHS, through the FLISP programme, and also secure assistance in the
obtaining of a mortgage loan.
1.2. Title Restoration Project
The Title Restoration Project continues to make inroads into eradicating the
registration backlog, and providing beneficiaries under the Human settlements
Programme with title deeds. To this end, the EAAB continues its support to the
project by availing project management and secretariat support to the project,
understanding that there are decided gains to be had for the Estate Agency Affairs
Board (EAAB). Through the success of the Title Restoration Project, this initiative will
serve as a catalyst in expanding and transforming the Real Estate Sector by:
Firstly, giving estate agents access to “Dead Capital” currently located in the
‘Township’ and ‘Secondary’ Markets; and
Secondly, affording registered estate agents, an opportunity to service those who
are new to the residential property market.
1.3. Transactional Support Initiative
Affordable housing markets are often perceived as weak and risky, but when
compared to the entire housing market, the affordable market has in the last seven
years been out-performing the top end of the market (CAHF 2014). The affordable

74
housing market presents major opportunities in terms of untapped equity, and for
including more people into the formal housing market. For the nine metropolitan
municipalities in South Africa, the percentage of affordable properties range from
44% to 73% of the total housing stock (CAHF 2014). The affordable housing market
segment is now an area of potential business growth, as this segment serves as a
vital feeder to the growing middle class in South Africa. Over the past decade, the
provision of housing loans to this market segment has proven to be both sustainable
and commercially viable.
For real estate agents to access this untapped opportunity within the affordable
housing market (‘Dead Capital’) and ensure that lower income households are able
to enter the housing market, the Estate Agency Affairs Board (EAAB) seeks to
establish an initiative to provide transactional support for, in particular, buyers and
sellers in the affordable housing market. To this end, the EAAB would want to ensure
that it takes strategic-level actions to ensure that transactional support becomes a
reality for the many people engaging in transactions at the lower end of the market.
The objectives of this initiative would be to support the development of a functional
and an equitable residential property market. It is also important to consider the
mandate of the EAAB and to ensure that a transactional support initiative aligns with
its expanded (developmental) mandate. Key to this initiative would be to specifically
support persons in the affordable housing market to enable them to enter and
transact within the market.
More broadly, creating better public access to market transaction information in the
residential sector is key to avoiding market information asymmetries, which tend to
be particularly marked when moving into an under-developed market segment.
Similarly there should be an overall focus on reducing transaction costs to improve
access and affordability.
It is useful to also recognise what transactional support would not include, especially
for the EAAB and considering their role and functions. The EAAB cannot be involved
in every transaction nor provide individual consumer support. The role of the EAAB
within the affordable housing market would be to contribute to creating an enabling
environment for transacting within this sub-market by providing strategic transactional
support.

75
The objectives of this initiative would be to support the development of a functional
and an equitable residential property market. It is also important to consider the
mandate of the EAAB and to ensure that a transactional support initiative aligns with
its expanded (developmental) mandate. Key to this initiative would be to specifically
support persons in the affordable housing market to enable them to enter and
transact within the market.
More broadly, creating better public access to market transaction information in the
residential sector is key to avoiding market information asymmetries, which tend to
be particularly marked when moving into an under-developed market segment.
Similarly there should be an overall focus on reducing transaction costs to improve
access and affordability.
It is useful to also recognise what transactional support would not include, especially
for the EAAB and considering their role and functions. The EAAB cannot be involved
in every transaction nor provide individual consumer support. The role of the EAAB
within the affordable housing market would be to contribute to creating an enabling
environment for transacting within this sub-market by providing strategic transactional
support.
As a supporting component, a knowledge repository is proposed. The aim of such a
repository would be to ensure that consumers and professionals are able to access
the knowledge products created through the initiative. A knowledge exchange
platform will serve to centralise useful data, information and advice in one place.
Many organisations can contribute their knowledge products and links to their data
platforms. The aim of the knowledge repository and portal would be to ensure that
this information is easily accessible to a broader audience over a longer time period.
Another objective would be to link enquirers to knowledge providers in a more
efficient

76
PART D: ANNEXURES
Annexure A
Materiality Framework
Broad Framework for the Estate Agency Affairs Board
The Estate Agency Affairs Board will be dealing with this framework under two main
categories, i.e. quantitative and qualitative aspects.
Quantitative Aspects
Materiality level
The materiality level is set at R366 266 which is ¼% of Turnover. .
Motivation
EAAB has high volume of transactions at low value. It is therefore for this purpose
that the materiality level is set based on an income statement measure. This
conservative materiality level will be used for all classes of transactions.
Factors Considered
The Estate Agency Affairs Board assesses the level of a material loss of R366 266as
¼% of gross revenue. The Estate Agency Affairs Board took into account factors that
include:
Nature of EAAB’s Business
To maintain and promote the standard of conduct of estate agents, having due
regard to public interests and regulate the activities of estate agents.
To proficiently discharge its statutory regulatory function through the
provision of a consistently effective service to estate agents and stakeholders
alike.
Although revenues and profits are not the main objective, the current economic
climate and the downturn in the property sector has meant that the EAAB had to
focus on its revenues and operating expenses. EAAB is a self-funded public entity
and therefore relies on the generation of revenue to sustain its activities and maintain
its going-concern.
77
Quality Aspects
Materiality is not confined to the size of the entity and the elements of its financial
statements.
The Estate Agency Affairs Board recognizes that misstatements that are larger either
individually or in the aggregate may affect a “reasonable” user’s judgment. Further,
misstatements may also be material on qualitative grounds. These qualitative
grounds include amongst others:
Unusual transactions entered into that are not of a repetitive nature and are
disclosed purely due to the nature thereof due to knowledge thereof affecting
the decision making of the user of the financial statements.
Transactions entered into that could result in reputational risk of Estate
Agency Affairs Board
Any fraudulent or dishonest behaviour of any officer or staff of Estate Agency
Affairs Board.
Procedures/processes required by legislation or regulation (e.g. PFMA and
the Treasury Regulations).
Unauthorized, irregular or fruitless and wasteful expenditure.
Items of a non-financial nature, which would impact on the continued
operation and deliverables of the Estate Agency Affairs Board.

78
ANNEXURE B
RISK MANAGEMENT PLAN
Risk Ref Numb
Programme Strategic objective
Risk Description
Inherent Risk
Rating
EAAB Action Plan Risk Owner
GR1
Compliance
Programme
To improve
compliance with
the Estate
Agency Affairs
Act and Financial
Intelligence Act.
Non-regulation of estate agents and non - enforcement of Estate Agency Act and Financial Intelligence Centre Act
25 1. Investigate segregation of duties for validation of documents and " accepting" of documents on SAP. 1.1. Recommend for Property Practitioner Bill that transferring attorneys do not pay commissions to illegal estate agents. 1.2. Research on illegal trading Estate Agents to be performed in the 2017/18 financial period. An enforcement strategy will be created from the Research outcomes. This includes the regularisation of non-compliant Estate Agents. 2. Develop a comprehensive compliance
EM: Compliance 31 March 2019

79
checklist against the Act. 3. Make recommend for Property Practitioner Bill that all categories of persons rendering estate agency services be included who are not yet included in the Act.
GR2 Education and Training programme
To ensure that EAAB operations are efficient and effective.
Deficient financial management systems.
25 1. Review & document business processes to inform development of a ICT Business case to enhance finance applications. 2.1. Amend debt collection policy in accordance with change to accrual policy and assign role of debt collection ( membership, licence & CPD fees) and develop collection procedures. 2.2. Establishment of Litigation & Recoveries unit (recoveries of claims) 3. Develop responsibility matrix for roles and responsibilities in finance. 4. Develop Standard
CEO and CFO
31 March 2019

80
operating Procedures for finance. 5. Submit a motivation to the Board for capacitation of finance. 6. Ensure budgets are developed linked to deliverables and KPI's. 6.1. Submission the Department Human Settlements to request a grant from Treasury as a S 3A Public Entity 7. Establish a register for fruitless expenditure.
GR3 Administration
Programme
To build capacity of key stakeholders and professionalise the Estate Agency Sector.
Inefficient implementation and monitoring of training regulations.
20 1. Review & document business processes to inform development of a ICT Business case to enhance finance applications. 2.1. Amend debt collection policy in accordance with change to accrual policy and assign role of debt collection ( membership, licence & CPD fees) and develop collection procedures. 2.2. Establishment of Litigation & Recoveries unit
CEO and CFO
01 December 2018

81
(recoveries of claims) 3. Develop responsibility matrix for roles and responsibilities in finance. 4. Develop Standard operating Procedures for finance. 5. Submit a motivation to the Board for capacitation of finance. 6. Ensure budgets are developed linked to deliverables and KPI's. 6.1. Submission the Department Human Settlements to request a grant from Treasury as a S 3A Public Entity 7. Establish a register for fruitless expenditure.

82
GR4 Fidelity Fund To ensure that the Fidelity fund is financially stable.
Inadequate management /depletion of the Fidelity Fund
25 1. Review and ensure adherence to National Treasury policy on investments. 2. Set prudential limits on investments. 3. Incorporate delegations for investment into the Delegation of Authority policy. 4. Review current expenses claimed from the Fund to ensure that they are not operational and in compliance with the Act. 5. Develop & implement a SoP whereby all claims paid are forwarded to the Legal Technical Analyst and reported to Exco.and Audit Committee 6. Make recommendation for Property Practitioner Bill that limits be set for claim against the Fund 6.1. Instituting interventions with Payprop to reduce risk of misappropriation of property consumer deposits. 7. Educate the public as per awareness programme
Chief Financial Officer
01
December 2018

83
on the purpose of the Fund. 8. Implementation of the accrual basis for accounting ensuring outstanding fees are invoiced and followed up on. 9. Initiate criminal charges post disciplinary process for those Estate Agencies who do not submit Audit Reports to declare interest earned on the trust accounts. 10. Make recommendation for Property Practitioner Bill that claims can only be processes for estate agents who are registered 11. Make recommendation for Property Practitioner Bill that annual fees are proportionate to revenue
GR5 Administration
Programme
To ensure that EAAB operations are efficient and effective.
Inadequate ICT management and governance
20 1 & 3.2 Update IT strategy as per outcome of business process review. 2. Update BCP and conduct tests 3.1. Finalisation of business process review. 3.3. Develop a business
Executive: Corporate services
01 December
2018

84
case per application. 3.4. Develop specifications per application. 4. Internal audit to verify control environment. 5. Investigate segregation of duties between security, applications, support personnel.
GR6 Transformation
To ensure that the Estate Agency sector and Property Industry is transformed.
Inadequate focus on government-wide priorities
20 1. Facilitating job fund application process for financial support. 2. Implement service centres in affordable housing areas enabling property consumers to engage with estate agents. 2.1. Engage with DPW and Gauteng Department of Infrastructure Development to secure mandate to dispose/ manage properties to emerging estate agencies who have neem through the Principalisation programme
Executive Manager : Special Projects 01 December 2018

85
GR7 All programmes
To ensure that EAAB operations are efficient and effective.
Inefficient performance information system.
25 1. Review of 2018/19 indicators by internal auditors to ensure the indicators are smart. 2 to 4. Review the data collection processes of performance information. Consider the following: - monthly submission ( instead of current quarterly submission ) of evidence to Risk & Strategy Department so that evidence can be verified timeously and differences resolved; - Executive Managers should sign off on performance achieved for the month and the accompanying evidence; - Develop process and tools for recording of evidence from Divisions and resolution of disputes; - Accountability of accuracy of performance information should reside with respective Divisions and the role of Risk & Strategy Departments will be to verify information submitted
Executive Committee 01 December 2018

86
to it and highlighting discreprencies. - Develop a process to record changes in performance information data due to corrections/ amendments to prior quarter results. 5.1. Implement disciplinary code for non-conformance to Performance Information Framework. 5.2. Pay performance bonuses after audit of performance information to link the payment to verified achievements.
GR8 All programmes
To ensure that EAAB operations are efficient and effective.
Fraud and corruption
20
1. Enhancement of access controls to ICT systems ( alignment of job description, processes and DoA). 2. Update and implement the of fraud prevention plan. 3. Identify gaps in segregation of duties through business process review. 4.Implementation of the Declaration of Interest

87
policy to identify any conflicts with the Boards operations and report findings to the Audit Committee. 5. Implement a gift register for staff to disclose all gratuities received.
GR9 Administration
Programme
To ensure that EAAB operations are efficient and effective.
Inadequate Human resource management
16 1. Identification of key positions and preparation and implementation of a succession plan. 2. Train management on the Labour Relations Act to implement consequence management. 3.1. Finalisation of Organisational Design and Migration exercise to ensure that the organogram is amended to be line with the capacity requirements of EAAB. 3.2. Implementation of the Organisational Design and Migration plan.
EM: Corporate Services 31 December 2018

88
GR10 Administration
Programme
To ensure that EAAB operations are efficient and effective.
Ineffective governance to ensure accountability, fairness & transparency
25 1. Filling of senior vacant positions after completion of organisation design and migration process. 2. Update of Risk management policy and development of appetite statements. 3. Implementation of the Declaration of Interest policy to identify any conflicts with the Boards operations and report findings to the Audit Committee. 4. Develop an ethics policy which states standards of conduct expected in areas where improper activities could damage the company's reputation. 5. Conduct a climate survey to determine root cause of staff dissonance
EM: Corporate Services 31 December 2018

89
Annexure C 1.1 Strategic Plan objective – Provide strategic management and support across the organization.
Indicator No & Title 1.1.1 Percentage achievement of EAAB pre-determined strategic objectives
Short definition Performance information
Purpose/importance Improve performance of pre-determined objectives set in the Annual performance plan
Source/collection of data
Quarterly “business matrix” reports approved by Board
Method of calculation
(Number of pre-determined objectives achieved/Number of pre-determined objectives) *100
Data limitations None
Type of indicator Strategic Output Goal indicator
Calculation type Percentage
Reporting cycle 1st of April to 31st March
New indicator Yes
Desired performance
100% achievement on pre-determined objectives
Indicator responsibility
Executive Committee
Indicator No & Title 1.1.2 Percentage alignment of operational plans to the APP
Short definition Departmental business plans
Purpose/importance Align organizational performance to departmental performance
Source/collection of data
Annual departmental business reports
Method of calculation
(Number of KPI’s as per business plan aligned to APP/total Number of KPI’s in the business plan) * 100
Data limitations None
Type of indicator Strategic Output Goal indicator
Calculation type Percentage
Reporting cycle 1st of April to 31st March
New indicator Yes
Desired performance
100% achievement on alignment of business plans to APP
Indicator responsibility
Executive Committee
Indicator No & Title 1.1.3 Percentage of strategic risk mitigation action plans implemented
Short definition Risk Management plan
Purpose/importance Mitigation of top ten strategic risks/increase the likelihood of achievement of organizational strategic objectives.
Source/collection of data
Quarterly risk reports
Method of calculation
Number of implemented mitigation action plans / Total number of mitigation action plans identified

90
Data limitations None
Type of indicator Strategic Output Goal indicator
Calculation type Percentage
Reporting cycle 1st of April to 31st March
New indicator Yes
Desired performance
100% of risks identified rated green
Indicator responsibility
Executive Committee
1.2 Strategic Plan Objective – Ensure good governance and sound control environment
Indicator No & Title 1.2.1. Percentage implementation of management action plans to address internal and external audit findings
Short definition Audit outcome
Purpose/importance To improve the integrity of financial reports, control environment and improved the integrity of performance information reports
Source/collection of data
Internal Audit Reports and AGSA Management Report
Method of calculation
(Total number of findings resolved within specified timeframes / Total number of audit findings)*100
Data limitations AGSA Management report is finalized after year-end
Type of indicator Strategic Outcome Goal indicator
Calculation type Statement on outcome
Reporting cycle 1st of April to 31st March
New indicator Yes
Desired performance
Unqualified audit opinion
Indicator responsibility
Executive Committee
Indicator No & Title 1.2.2. Up to date policies and procedures across organization
Short definition Consolidated policies register
Purpose/importance To improve compliance to legislation and best practice
Source/collection of data
Policy register
Method of calculation
( Number of policies reviewed and approved / number of policies due for review as per the policy register)*100
Data limitations None
Type of indicator Strategic Output Goal indicator
Calculation type Percentage
Reporting cycle 1st of April to 31st March
New indicator Yes
Desired performance
100% of policies as per the policy register are up to date and approved
Indicator responsibility
Executive Committee

91
Indicator No & Title 1.2.3 Compliance to laws and regulations
Short definition Compliance to statutory requirements
Purpose/importance To improve compliance to laws and regulations
Source/collection of data
Compliance universe register
Method of calculation
(Number of laws and regulations complied with as per compliance universe / Total number of laws and regulation as per compliance universe) *100
Data limitations None
Type of indicator Strategic Output Goal indicator
Calculation type Percentage
Reporting cycle 1st of April to 31st March
New indicator Yes
Desired performance
Approved compliance framework document
Indicator responsibility
Chief Financial Officer
Indicator No & Title 1.2.4 Percentage of Board resolutions implemented
Short definition Board resolutions
Purpose/importance To improve the achievement of strategic objectives
Source/collection of data
Board resolution register/ Board and Committee meetings
Method of calculation
(Number of Board resolutions implemented)/Total number of Board resolutions approved)*100
Data limitations None
Type of indicator Strategic Output Goal indicator
Calculation type Percentage
Reporting cycle 1st of April to 31st March
New indicator Yes
Desired performance
100% of Board resolutions are implemented
Indicator responsibility
Chief Executive Officer
1.3 Strategic objective – Ensure EAAB operations effective and efficient
Indicator No & Title 1.3.1 Development and 100% implementation of the skills audit plan
Short definition Efficient and effective staff
Purpose/importance To improve organizational performance
Source/collection of data
Skills audit report
Method of calculation
development and implementation of the skill audit plan
Data limitations None
Type of indicator Strategic Output Goal indicator
Calculation type Plan developed
Reporting cycle 1st of April to 31st March
New indicator Yes

92
Desired performance
100% of positions required for skills audit are completed
Indicator responsibility
EM: Corporate services
Indicator No & Title 1.3.2 Percentage of implementation of Integrated IT solution
Short definition ICT system overhaul
Purpose/importance To improve the processing of applications and transactions within the system.
Source/collection of data
ICT system project implementation
Method of calculation
(Number of project tasks completed)/ (Total number of project tasks)*100
Data limitations None
Type of indicator Strategic Output Goal indicator
Calculation type Percentage of project completion
Reporting cycle 1st of April to 31st March
New indicator Yes
Desired performance
100% of project implementation
Indicator responsibility
EM: Corporate services
1.4 Maintain a Stakeholder – centered organization
Indicator No & Title 1.4.1 Implementation of EAAB stakeholder management plan
Short definition Stakeholder management plan
Purpose/importance To improve stakeholder relations and support to EAAB activities and projects
Source/collection of data
Stakeholder management plan and implementation source documents
Method of calculation
(Number of stakeholder tasks implemented)/Total number of tasks per stakeholder plan)
Data limitations None
Type of indicator Strategic output Goal indicator
Calculation type Percentage
Reporting cycle 1st of April to 31st March
New indicator Yes
Desired performance
100% of stakeholder implementation

93
Indicator No & Title 1.4.2 Percentage rate of stakeholder query resolutions within 48 Hours
Short definition Query resolution within 72 hours
Purpose/importance To improve customer service to the Estate Agency
Source/collection of data
QMNS report
Method of calculation
(Number of queries resolved)/ (Total number of queries received from public)*100
Data limitations None
Type of indicator Strategic outcome goal indicator
Calculation type Percentage
Reporting cycle 1st of April to 31st March
New indicator No
Desired performance
100% queries resolved
Indicator responsibility
EM; Corporate services
Indicator No & Title 1.4.3 Number of partnerships SLAs with relevant partners
Short definition Stakeholder satisfaction
Purpose/importance To improve collaboration, stakeholder relations and support to EAAB activities and projects
Source/collection of data
Number Signed service level agreements in place
Method of calculation
number of singed SLA with relevant partners
Data limitations None
Type of indicator Strategic outcome goal indicator
Calculation type Percentage
Reporting cycle 1st of April to 31st March
New indicator Yes
Desired performance
8 signed SLAs with relevant partners
Indicator responsibility
EM; Corporate services

94
2.1 - Improve compliance to the EAA Act
Indicator No & Title 2.1.1 Number of self- assessment received, evaluated and analyzed (Report issued)
Short definition N/A
Purpose/importance Improve Compliance to Estate Agency Affairs Act
Source/collection of data
Self-assessment reports
Method of calculation
Number of self-assessment reports issued
Data limitations Self-assessment sample is not necessary representative of population
Type of indicator Strategic Outcome Goal indicator
Calculation type Percentage
Reporting cycle 1st of April to 31st March
New indicator Yes
Desired performance
10% reduction on Annual basis
Indicator responsibility
Executive Manager-Enforcement & Inspections
Indicator No & Title 2.1.2 Percentage of compliant new registrations processed within 21 days
Short definition New registrations
Purpose/importance Compliance to Estate Agency Affairs Act.
Source/collection of data
Download reports from the SAP system . New registrations and New applications reports from SAP.
Method of calculation
(Number of compliant new registrations process within 21 days)/(Total number of compliant new registrations received) * 100
Data limitations The system needs to include data of compliancy and not rely on date received
Type of indicator Strategic output objective indicator
Calculation type Percentage
Reporting cycle Quarterly
New indicator Yes
Desired performance
100% of compliant new registrations processed against those received
Indicator responsibility
Compliance Executive

95
Indicator No & Title 2.1.3 Percentage of compliant renewals processed received within 5 days.
Short definition Renewals
Purpose/importance Compliance to Estate Agency Affairs Act.
Source/collection of data
Download report from the SAP system. Renewals and New applications reports from SAP.
Method of calculation
(Number of compliant renewals processed within 5 days)/(Total number of compliant renewals received)* 100
Data limitations The system needs to include data of compliancy and not rely on date received
Type of indicator Strategic objective indicator
Calculation type Percentage
Reporting cycle Quarterly
New indicator Yes
Desired performance
100% of compliant renewals processed against those received
Indicator responsibility
Compliance Executive
Indicator No & Title 2.1.4 Percentage Disciplinary Hearings held against completed investigations
Short definition Public complaint reported cases
Purpose/importance To improve compliance to EAAct
Source/collection of data
SAP Download
Method of calculation
(Number of Disciplinary Hearings held)/ Total number of completed investigations)*100
Data limitations None
Type of indicator Strategic output objective
Calculation type Percentage
Reporting cycle 1st April to 31st March
New indicator Yes
Desired performance
100% of the reported cases investigated
Indicator responsibility
Compliance and Enforcement Executive
Indicator No & Title 2.1.5. Percentage compliance to turnaround time for Disciplinary Hearings
Short definition Disciplinary Hearings
Purpose/importance To improve compliance to EAAct
Source/collection of data
SAP Download
Method of calculation
(Number of Disciplinary Hearings completed within the expected turnaround times/ Total number of Disciplinary hearings completed)*100
Data limitations None
Type of indicator Strategic output objective
Calculation type Percentage
Reporting cycle 1st April to 31st March

96
New indicator Yes
Desired performance
100% of Disciplinary hearings completed within the expected turnaround times.
Indicator responsibility
Compliance and Enforcement Executive
Indicator No & Title 2.1.6 Percentage claims processed against claims received
Short definition Claims processed
Purpose/importance To improve property consumers protection for Estate Agents
Source/collection of data
SAP Download
Method of calculation
(Number of claims received and processed)/(Number of claims received)*100
Data limitations None
Type of indicator Strategic output objective
Calculation type Percentage
Reporting cycle 1st April to 31st Marc
New indicator Yes
Desired performance
100% of cases received were processed
Indicator responsibility
Compliance and Enforcement Executive
2.2 Strategic objective – Improve compliance with FIC Act
Indicator No & Title 2.2.1 Number of FIC inspections performed.
Short definition Financial Intelligent Centre Act inspections
Purpose/importance To monitor compliance of Financial Intelligent Centre Act
Source/collection of data
Reports received from inspectors
Method of calculation
List of the number of inspections reports received from inspectors
Data limitations None
Type of indicator Strategic objective indicator
Calculation type Number
Reporting cycle Quarterly
New indicator No
Desired performance
150 inspections performed
Indicator responsibility
Compliance and Enforcement Executive

97
2.3 Reduce the number of illegally trading Estate Agents or Agency
Indicator No & Title 2.3.1 Percentage of cases investigated against the number reported
Short definition Legal compliant cases
Purpose/importance Improve compliance to EAAct
Source/collection of data
SAP report download
Method of calculation
(Number of public complaint cases investigated and reported)/(Total number of cases reported) *100
Data limitations None
Type of indicator Strategic output objective indicator
Calculation type Percentage
Reporting cycle 1st April to 31st March
New indicator Yes
Desired performance
100% of cases reported are investigated
Indicator responsibility
Compliance and Enforcement Executive
Indicator No & Title 2.3.2 Percentage of Disciplinary outcomes enforced
Short definition Disciplinary hearings
Purpose/importance To improve compliance to EAAct
Source/collection of data
SAP repot down load
Method of calculation
(Number of cases with disciplinary outcomes enforced)/(Total number of disciplinary outcome cases)*100
Data limitations None
Type of indicator Strategic objective indicator
Calculation type Percentage
Reporting cycle Quarterly
New indicator Yes
Desired performance
100% of Disciplinary outcome cases enforced
Indicator responsibility
Compliance and Enforcement Executive
Indicator No & Title 2.3.3 Development of the strategic plan to combat illegal trading
Short definition Illegally trading Estate Agents/Agencies
Purpose/importance To improve compliance to EAAct
Source/collection of data
Strategic plan to combat illegal trading
Method of calculation
Developed and approved strategic plan to combat illegal trading
Data limitations None
Type of indicator Strategic objective output indicator
Calculation type Number
Reporting cycle Annually
New indicator Yes

98
Desired performance
1 Research paper completed and acknowledged by the Board
Indicator responsibility
Compliance and Enforcement Executive
3.1 Strategic objective - Facilitate increase in the number qualified Estate Agents
Indicator No & Title 3.1.1 Identified real estate sector skills and competency needs
Short definition Sector skills and competency
Purpose/importance To build capacity of practicing Estate Agents and comply with SAQA standards.
Source/collection of data
SAQA approved document
Method of calculation
SAQA approved Occupational Qualifications
Data limitations None
Type of indicator Strategic Outcome Goal indicator
Calculation type Number
Reporting cycle 1st April-31st March
New indicator No
Desired performance
1 SAQA approval document completed
Indicator responsibility
Education and Training Executive Manager
Indicator No & Title 3.1.2 Increase in percentage of registered Estate Agents with professional designation
Short definition PDE
Purpose/importance To build capacity of practicing Estate Agents and comply with SAQA standards.
Source/collection of data
SAP Download
Method of calculation
(Number Registered Estate Agents with professional designation)/ Total number of Registered Estate Agents) *100
Data limitations None
Type of indicator Strategic Output Goal indicator
Calculation type Percentage
Reporting cycle 1st April-31st March
New indicator Yes
Desired performance
100% Registered Estate Agents with professional designation
Indicator responsibility
Education and Training Executive Manager

99
Indicator No & Title 3.1.3 Increase in percentage Retention rate of Candidate Estate Agents enrolled for PDE 4
Short definition PDE 4
Purpose/importance To build capacity of practicing Estate Agents and comply with SAQA standards.
Source/collection of data
SAP Download
Method of calculation
(Number of Candidate Estate Agents enrolled for PDE 4 and retained)/ Total number of Candidate Estate Agents) *100
Data limitations None
Type of indicator Strategic Output Goal indicator
Calculation type Percentage
Reporting cycle 1st April-31st March
New indicator Yes
Desired performance
100% of Candidate Estate Agents enrolled for PDE 4 and retained.
Indicator responsibility
Education and Training Executive Manager
Indicator No & Title 3.1.4 Increase in percentage retention rate of Non Principal Estate Agents enrolling for PDE 5
Short definition PDE 5
Purpose/importance To build capacity of practicing Estate Agents and comply with SAQA standards.
Source/collection of data
SAP Download
Method of calculation
(Number of Candidate Estate Agents enrolled for PDE 5 and retained)/ Total number of Candidate Estate Agents) *100
Data limitations None
Type of indicator Strategic Output Goal indicator
Calculation type Percentage
Reporting cycle 1st April-31st March
New indicator Yes
Desired performance
100% of Candidate Estate Agents enrolled for PDE 5 and retained.
Indicator responsibility
Education and Training Executive Manager
Indicator No & Title 3.1.5 Percentage of processed log books within the stipulated timeframes
Short definition Logbooks
Purpose/importance To build capacity of practicing Estate Agents and comply with SAQA standards.
Source/collection of data
SAP Download
Method of calculation
(Number of Logbooks completed within a prescribed time frame)/ Total number of Logbooks completed) *100
Data limitations None
Type of indicator Strategic Output Goal indicator
Calculation type Percentage

100
Reporting cycle 1st April-31st March
New indicator Yes
Desired performance
100% of Logbooks completed within the prescribed time period..
Indicator responsibility
Education and Training Executive Manager
3.2 Strategic objective – Ensure continuous Professional development of Estate Agents
Indicator No & Title 3.2.1 Increase in the percentage of Estate Agents who are registered for CPD and have met CPD requirements in full
Short definition CPD
Purpose/importance To build capacity of practicing Estate Agents and comply with SAQA standards.
Source/collection of data
SAP Download
Method of calculation
(Number of Estate Agents registered for CPD and have met CPD requirements)/ ( Total number of Estate Agents who have registered for CPD) *100
Data limitations None
Type of indicator Strategic Output Goal indicator
Calculation type Percentage
Reporting cycle 1st April-31st March
New indicator Yes
Desired performance
100% of Estate Agents are registered for CPD have met CPD requirements.
Indicator responsibility
Education and Training Executive Manager
3.3 Develop and Harvest knowledge in the Real Estate
Indicator No & Title 3.3.1 Publications produced per annum (Agent Magazine)
Short definition Agent magazine
Purpose/importance To communicate industry knowledge to Estate Agents
Source/collection of data
Agent magazine published
Method of calculation
Number of Agent magazine published
Data limitations None
Type of indicator Strategic output objective
Calculation type Number
Reporting cycle 1st April to 30th March
New indicator Yes
Desired performance 4 magazines per annum
Indicator responsibility
Corporate services Executive
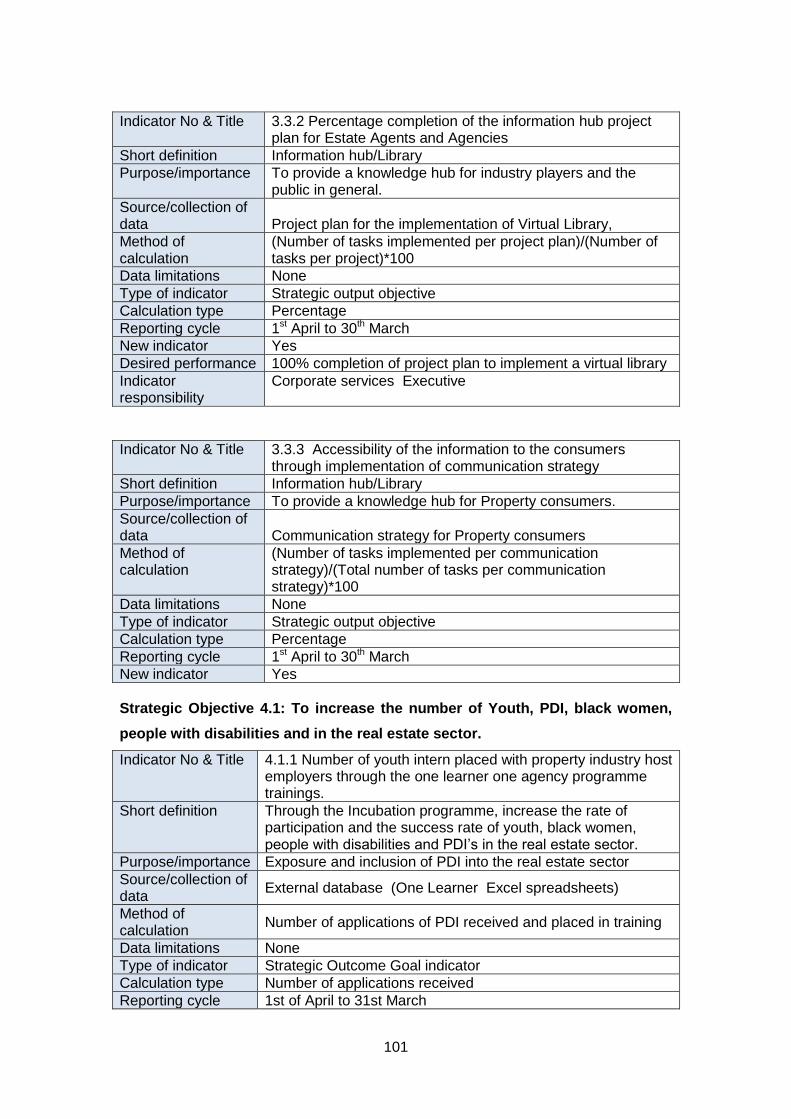
101
Indicator No & Title 3.3.2 Percentage completion of the information hub project plan for Estate Agents and Agencies
Short definition Information hub/Library
Purpose/importance To provide a knowledge hub for industry players and the public in general.
Source/collection of data
Project plan for the implementation of Virtual Library,
Method of calculation
(Number of tasks implemented per project plan)/(Number of tasks per project)*100
Data limitations None
Type of indicator Strategic output objective
Calculation type Percentage
Reporting cycle 1st April to 30th March
New indicator Yes
Desired performance 100% completion of project plan to implement a virtual library
Indicator responsibility
Corporate services Executive
Indicator No & Title 3.3.3 Accessibility of the information to the consumers through implementation of communication strategy
Short definition Information hub/Library
Purpose/importance To provide a knowledge hub for Property consumers.
Source/collection of data
Communication strategy for Property consumers
Method of calculation
(Number of tasks implemented per communication strategy)/(Total number of tasks per communication strategy)*100
Data limitations None
Type of indicator Strategic output objective
Calculation type Percentage
Reporting cycle 1st April to 30th March
New indicator Yes
Strategic Objective 4.1: To increase the number of Youth, PDI, black women,
people with disabilities and in the real estate sector.
Indicator No & Title 4.1.1 Number of youth intern placed with property industry host employers through the one learner one agency programme trainings.
Short definition Through the Incubation programme, increase the rate of participation and the success rate of youth, black women, people with disabilities and PDI’s in the real estate sector.
Purpose/importance Exposure and inclusion of PDI into the real estate sector
Source/collection of data
External database (One Learner Excel spreadsheets)
Method of calculation
Number of applications of PDI received and placed in training
Data limitations None
Type of indicator Strategic Outcome Goal indicator
Calculation type Number of applications received
Reporting cycle 1st of April to 31st March

102
New indicator Yes
Desired performance
Achievement of targeted numbers for the designated period
Indicator responsibility
Transformation & Education and Training
Indicator No & Title 4.1.2 Percentage increase in the retention/ success rate of youth intern placed with property industry host employers through the one learner one agency programme trainings..
Short definition Improvement in participation and retention of PDI
Purpose/importance Exposure and inclusion of PDI into the real estate sector
Source/collection of data
External database (One Learner Excel spreadsheets)
Method of calculation
(Number of youth who completed the training and were retained/Total number of youth who completed the training) *100
Data limitations None
Type of indicator Strategic Output Goal indicator
Calculation type Percentage of retention rate
Reporting cycle 1st of April to 31st March
New indicator Yes
Desired performance
50% retention rate
Indicator responsibility
Transformation & Education and Training
Indicator No & Title 4.1.3 Percentage increase of black women (excl. youth category) that have been supported to increase economic participation through principalization
Short definition Focus on participation of black women in the programme
Purpose/importance Exposure and inclusion of PDI into the real estate sector
Source/collection of data
External database (One Learner Excel spreadsheets)
Method of calculation
(Number of black women in participation during current period - Number of black women in participation during previous period / Total number of women in participation during previous period) *100
Data limitations None
Type of indicator Strategic Output Goal indicator
Calculation type Percentage increase of black women
Reporting cycle 1st of April to 31st March
New indicator Yes
Desired performance
5% increase in participation of black women
Indicator responsibility
Transformation
Indicator No & Title 4.1.4 Number of principals established through the Implementation of the Principalisation Programme
Short definition Focus placed on Estate agent status upgrade to Principal status
Purpose/importance Exposure and inclusion of PDI into the real estate sector

103
Source/collection of data
SAP Download
Method of calculation
No of principals established through the principalisation programme
Data limitations None
Type of indicator Strategic Outcome Goal indicator
Calculation type number
Reporting cycle 1st of April to 31st March
New indicator Yes
Desired performance
250 principals established through the principalisation programme
Indicator responsibility
Transformation
Strategic Objective 4.2: To implement an impactful Amnesty Campaign for estate agents and agencies
Indicator No & Title 4.2.1 Percentage of illegally trading Estate Agents rehabilitated as a result of the Amnesty Campaign
Short definition To ensure the strengthening of a compliant real estate sector by increasing the number of estate agencies and agents who apply for amnesty.
Purpose/importance Improvement in compliance within the real estate sector
Source/collection of data
SAP Download
Method of calculation
(Number of estate agents rehabilitated/Total number of estate agents who applied to be rehabilitated)*100
Data limitations None
Type of indicator Strategic Outcome Goal indicator
Calculation type Percentage of amnesty applications finalised
Reporting cycle 1st of April to 31st March
New indicator Yes
Desired performance
100% of applications granted will be rehabilitated
Indicator responsibility
Transformation
Strategic Objective 4.3: To ensure the protection, education and awareness of Consumers with regard to property transactions
Indicator No & Title 4.3.1 Number of consumers reached through Radio media campaigns
Short definition Creating awareness of services offered by the EAAB to the general public via Radio
Purpose/importance Enhancement in awareness of campaigns related to the EAAB as a regulatory board of the real estate sector
Source/collection of data
Radio station listenership report
Method of calculation
Study report with respect to the number of listenership on different national radio stations
Data limitations None
Type of indicator Strategic Outcome Goal indicator
Calculation type Number of consumers reached through Radio

104
Reporting cycle 1st of April to 31st March
New indicator Yes
Desired performance
Achievement of targeted number for the designated period
Indicator responsibility
Communication
Indicator No & Title 4.3.2 Number of consumers reached through print media campaigns
Short definition Creating awareness of services offered by the EAAB to the general public through print media campaigns
Purpose/importance Enhancement in awareness of campaigns related to the EAAB as a regulatory board of the real estate sector
Source/collection of data
Number of publications distributed
Method of calculation
Study report with respect to the number of different publications distributed
Data limitations None
Type of indicator Strategic Output Goal indicator
Calculation type Total number of different publications distributed
Reporting cycle 1st of April to 31st March
New indicator Yes
Desired performance
Achievement of targeted numbers for the designated period
Indicator responsibility
Communication
Indicator No & Title 4.3.3 Number of consumer education campaigns using Billboards to raise awareness of property transactions and reach over 2million consumers
Short definition Number of Billboards
Purpose/importance Enhancement in awareness of campaigns related to the EAAB as a regulatory board of the real estate sector
Source/collection of data
Number of Billboards
Method of calculation
Number of billboard placed
Data limitations None
Type of indicator Strategic Output Goal indicator
Calculation type Total number of billboard done
Reporting cycle 1st of April to 31st March
New indicator Yes
Desired performance
Achievement of targeted numbers for the designated period
Indicator responsibility
Communication

105
Strategic Objective 4.4: To improve internal transformation in accordance with BBBEE, PPPFA, EE, Skills Development, and Property Sector Charter.
Indicator No & Title 4.4.1 Implementation of the BBBEE score cards, employment equity, skills development plan and property sector charter
Short definition Improving compliance of the entity to various statutory and regulatory pronouncements
Purpose/importance Maintaining adherence to various statutory and regulatory pronouncements
Source/collection of data
Internal reports concerning compliance
Method of calculation
Study reports with respect to achievement of scorecards of different departments in terms of BBBEE, PPPFA, EE, Skills Development, Property Sector Charter.
Data limitations None
Type of indicator Strategic Outcome Goal indicator
Calculation type Percentage
Reporting cycle 1st of April to 31st March
New indicator Yes
Desired performance
100% achievement of the annual target reflected in the plans and scorecards of the different departments
Indicator responsibility
Transformation & Corporate Services
Strategic Objective 4.5: To develop financial mechanisms and incentives for sustainable transformation initiatives.
Indicator No & Title 4.5.1 Number of implementable developed financial incentive/s for transformation initiatives
Short definition Development of financial mechanisms and incentives required to achieve sustainable transformation initiatives.
Purpose/importance Achievement of sustainable transformation initiatives with no hindrances to the financial well-being of the entity in the long-term
Source/collection of data
Financial mechanisms and incentives for transformation initiatives document
Method of calculation
Developed, approved and implemented financial mechanisms and incentives for transformation initiatives
Data limitations None
Type of indicator Strategic Outcome Goal indicator
Calculation type Framework and Plan document
Reporting cycle 1st of April to 31st March
New indicator Yes
Desired performance
Approved framework and plan
Indicator responsibility
Transformation & Corporate Services

106
Strategic Objective 5.1: To ensure that the Fidelity Fund is financially
sustainable.
Indicator No & Title 5.1.1 Percentage growth in Annual Net Asset Value
Short definition Improvement in the Annual Net Asset Value of the Fidelity Fund
Purpose/importance To ensure financial sustainability of the Fidelity Fund.
Source/collection of data
Financial management Reports
Method of calculation
(Current Net Asset Value – Previous Net Asset value)/ Previous Net Asset Value)*100
Data limitations None
Type of indicator Strategic Outcome Goal indicator
Calculation type Percentage
Reporting cycle 1st of April to 31st March
New indicator Yes
Desired performance
Achievement of 1.25% in growth to the Annual Net Asset Value
Indicator responsibility
Chief Financial Officer
Indicator No & Title 5.1.2 Reviewed and approved investment strategy implemented
Short definition Investment Strategy
Purpose/importance To ensure financial sustainability of the Fidelity Fund
Source/collection of data
Investment strategy has quarterly deliverables
Method of calculation
1 Completed and approved Investment strategy
Data limitations None
Type of indicator Strategic Outcome Goal indicator
Calculation type Number
Reporting cycle 1st of April to 31st March
New indicator Yes
Desired performance
Approved Investment Strategy
Indicator responsibility
Chief Financial Officer
Indicator No & Title 5.1.3 Re-insurance of Fidelity fund claims
Short definition Limiting total losses that may result from claims on the Fund
Purpose/importance To ensure financial sustainability of the Fidelity Fund
Source/collection of data
Research commissioned by EAAB
Method of calculation
Re-insurance option investigated and approved by the board, minutes of meetings.
Data limitations None
Type of indicator Strategic Outcome Goal indicator
Calculation type None
Reporting cycle 1st of April to 31st March
New indicator Yes
Desired Board Approval on chosen option
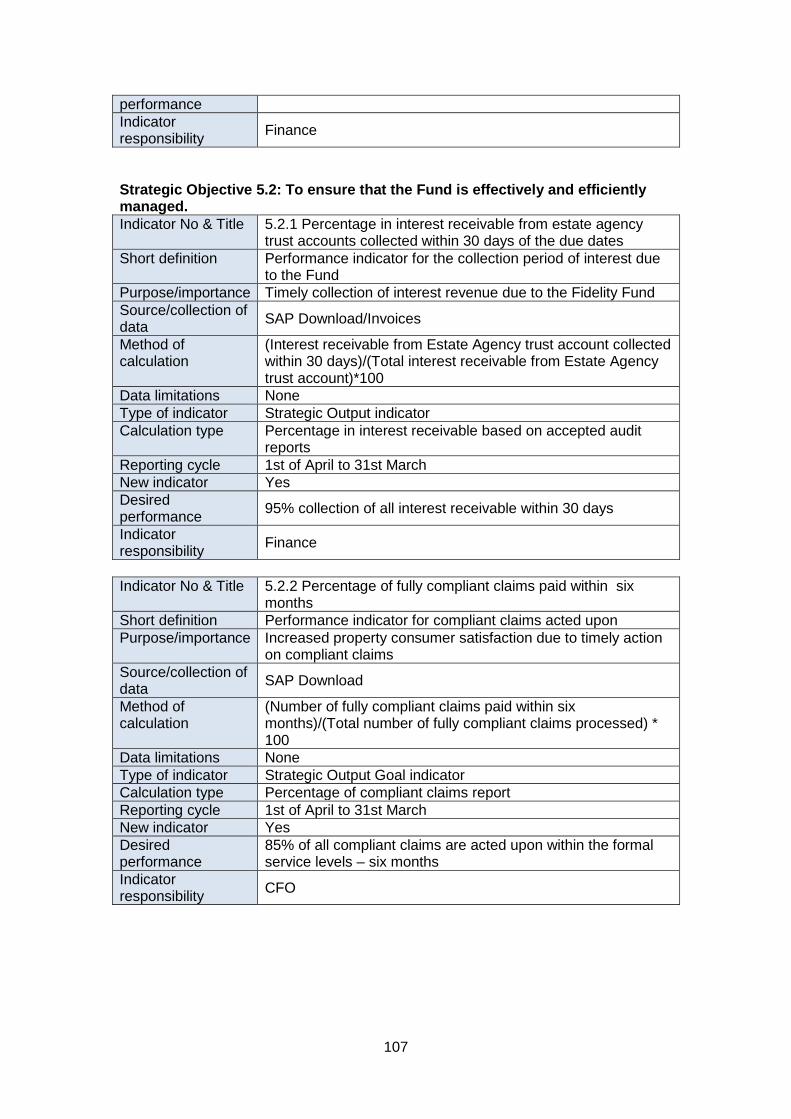
107
performance
Indicator responsibility
Finance
Strategic Objective 5.2: To ensure that the Fund is effectively and efficiently managed.
Indicator No & Title 5.2.1 Percentage in interest receivable from estate agency trust accounts collected within 30 days of the due dates
Short definition Performance indicator for the collection period of interest due to the Fund
Purpose/importance Timely collection of interest revenue due to the Fidelity Fund
Source/collection of data
SAP Download/Invoices
Method of calculation
(Interest receivable from Estate Agency trust account collected within 30 days)/(Total interest receivable from Estate Agency trust account)*100
Data limitations None
Type of indicator Strategic Output indicator
Calculation type Percentage in interest receivable based on accepted audit reports
Reporting cycle 1st of April to 31st March
New indicator Yes
Desired performance
95% collection of all interest receivable within 30 days
Indicator responsibility
Finance
Indicator No & Title 5.2.2 Percentage of fully compliant claims paid within six months
Short definition Performance indicator for compliant claims acted upon
Purpose/importance Increased property consumer satisfaction due to timely action on compliant claims
Source/collection of data
SAP Download
Method of calculation
(Number of fully compliant claims paid within six months)/(Total number of fully compliant claims processed) * 100
Data limitations None
Type of indicator Strategic Output Goal indicator
Calculation type Percentage of compliant claims report
Reporting cycle 1st of April to 31st March
New indicator Yes
Desired performance
85% of all compliant claims are acted upon within the formal service levels – six months
Indicator responsibility
CFO

108
Strategic Objective 6.1: To provide transactional support through developing estate agents for the affordable and subsidized housing areas
Indicator No & Title 6.1.1 Percentage increase of estate agents and agencies operating in the subsidized and affordable housing areas.
Short definition Improving the existence and availability of estate agents and agencies operating in the subsidized and affordable housing
Purpose/importance GAP market
Source/collection of data
Data received from Lightstone in respect of affordable housing. Estate agents addresses to match to suburbs linked to Lighstone Report downloaded from SAP.
Method of calculation
(Current number of estate agents and agencies operating in subsidized and affordable housing areas less previous period number of estate agents and agencies operating in subsidized and affordable housing areas)/ previous period number of estate agents and agencies operating in subsidized and affordable housing areas)/
Data limitations None
Type of indicator Strategic Output Goal indicator
Calculation type Percentage
Reporting cycle 1st of April to 31st March
New indicator Yes
Desired performance
10% increase of estate agents and agencies operating in the subsidized and affordable housing areas.
Indicator responsibility
Transformation Compliance
Strategic Objective 6.2: Ensure Bi-annual data/information on industry trends and analyses are available
Indicator No & Title 6.2.1 Number of reports on trends in the affordable property market.
Short definition Establishment of reports on trends in the affordable property market.
Purpose/importance Improved reporting on activity in the affordable property market
Source/collection of data
External surveys
Method of calculation
1 data set received from CAHF
Data limitations None
Type of indicator Strategic Output Goal indicator
Calculation type Number
Reporting cycle 1st of April to 31st March
New indicator Yes
Desired performance
2 Half-yearly Report
Indicator responsibility
Transformation Executive

109
Indicator No & Title 6.2.2 Distribution of sales in the affordable housing marketed and monitored
Short definition Establishment of reports focused on the distribution of sales in the affordable housing marketed and monitored
Purpose/importance Improved reporting on distribution of sales in the affordable housing marketed and monitored
Source/collection of data
External surveys
Method of calculation
1 data set received from CAHF
Data limitations None
Type of indicator Strategic Output Goal indicator
Calculation type Number
Reporting cycle 1st of April to 31st March
New indicator Yes
Desired performance
Bi-annual report & monitoring
Indicator responsibility
Transformation Executive
Indicator No & Title 6.2.3 Annual trend analysis report indicating increase in transaction of properties valued less than R500000
Short definition Establishment of reports focused on annual trend analysis in transaction of properties valued less than R500000
Purpose/importance Improved reporting on annual trend analysis in transaction of properties valued less than R500000
Source/collection of data
External surveys
Method of calculation
1 data set received from CAHF
Data limitations None
Type of indicator Strategic Output Goal indicator
Calculation type Inclusion of survey data in Annual Report
Reporting cycle 1st of April to 31st March
New indicator Yes
Desired performance
2 Half-yearly Report
Indicator responsibility
Transformation Executive