establishment and characterization of a rat model of ... · establishment and characterization of a...
TRANSCRIPT

©FUNPEC-RP www.funpecrp.com.brGenetics and Molecular Research 14 (3): 11089-11098 (2015)
Establishment and characterization of a rat model of hyperphosphatemia
C. Zhang1,2*, Y. Shao1*, Q.-G. Zhu1*, Y. Li3, C.-L. Jin1, H.-P. Wang1, L. Zhou1, C. Yu1, Y.K. Zhao1, G.J. Yuan1, X.-P. Hu2, L. Zhang2 and H. Wang2
1Urology Department, The Second Affiliated Hospital of Harbin Medical University, Harbin, China2Urology Department, The Fifth Hospital of Cheng Du, Cheng Du, China3Quality Control Office, The Fifth Hospital of Cheng Du, Cheng Du, China
*These authors contributed equally to this study.Corresponding author: C.-L. JinE-mail: [email protected]
Genet. Mol. Res. 14 (3): 11089-11098 (2015)Received February 17, 2015Accepted June 29, 2015Published September 22, 2015DOI http://dx.doi.org/10.4238/2015.September.22.2
ABSTRACT. We established a rat model of hyperphosphatemia and investigated the systemic effects of high phosphorus (P). Sprague Dawley rats were randomly divided into high (HP), low (LP), and normal (NP) P groups (N = 12 each), which received injections of fructose diphosphate sodium, or were fed self-manufactured low phosphorus or normal diets, respectively. In each group, 4 rats were sacrificed at the first, third, and sixth week to detect the serum (Scr) and urinary creatinine and P, and calcium (Ca) levels. The HP group’s serum P and intact parathyroid hormone (iPTH) were significantly higher than those in the other groups at the first, third, and sixth weeks, (P < 0.05); the LP group’s serum P was lower than the NP group’s at the third week (P < 0.05), while at the sixth week, the serum P and iPTH were lower (P < 0.05). No significant differences were detected for blood Ca+ (P > 0.05). The HP group’s Scr increased (P < 0.01), whereas the fractional excretion decreased (P < 0.05) significantly. Thighbone and lumbar spine bone densities differed significantly between groups

11090C. Zhang et al.
©FUNPEC-RP www.funpecrp.com.brGenetics and Molecular Research 14 (3): 11089-11098 (2015)
in the third week (P < 0.05); LP group densities were lower than NP group measures (P < 0.05). Crystallized stones were not observed microscopically following hematoxylin and eosin staining of the kidney. We successfully established a hyperphosphatemia rat model, and high blood P was found to significantly influence renal function and bone density. These results might provide a foundation to study the effects of hyperphosphatemia in rats.
Key words: Hyperphosphatemia; Model; Rat
INTRODUCTION
A large number of studies have shown that long-term hyperphosphatemia not only causes secondary hyperparathyroidism, renal osteodystrophy, and vitamin D metabolism dis-orders, but also causes cardiovascular disease and severe cerebrovascular events. Hyperphos-phatemia constitutes an important factor contributing to the increased morbidity and mortality of cardio cerebral vascular diseases in patients with end-stage renal disease (Goodman, 2004; Yuan and Du, 2010). The question of how to effectively control the blood phosphorus levels, prevent various complications, and improve the quality of life of patients with chronic renal failure has increasingly drawn the attention of clinicians. Recent studies have demonstrated that staghorn calculi are composed of magnesium ammonium phosphate or calcium carbon-ate, magnesium ammonium phosphate, and calcium phosphate. After the surgical treatment of staghorn calculi, drug treatment is very effective in preventing the recurrence of calculi (Pu et al., 2010). Therefore, to facilitate the treatment of hyperphosphatemia, we have established an animal model of high serum phosphorus in this study, which might provide an experimental reference for the further study of hyperphosphatemia in rats including the systemic effects of high phosphorous levels and the prevention of calculus formation.
MATERIAL AND METHODS
Material
This study utilized 36 Sprague Dawley rats ranging from 6 to 8 weeks and weighing 190 to 200 g. Animals were provided by the Experimental Animal Center of the Second Af-filiated Hospital of Harbin Medical University. Rats were randomly divided into a high phos-phorus diet group (HP), low phosphorus diet group (LP), and a normal diet group (NP), with 12 rats in each group. Rats were individually reared in the same environment. Rats in the HP group were injected with fructose sodium phosphate by intraperitoneal injection with a con-centration of 100 mg/100 g and fed with a normal diet. Animals in the LP group were injected with the same volume saline. Their diet contained 0.2% phosphorus and 0.5% calcium in accordance with the AIN-93G standard. Animals in the NP group were also injected with the same volume of saline, and their normal diet contained 0.6 to 1.2% phosphorus according to the standard of AIN-93G (Reeces et al., 1993; Mao et al., 2006). Four rats in each group were sacrificed at the first, third, and sixth weeks; blood samples were collected from the abdominal aortas and tibial and femoral specimens were also prepared.

11091Effects of high phosphorus on rats
©FUNPEC-RP www.funpecrp.com.brGenetics and Molecular Research 14 (3): 11089-11098 (2015)
Methods
Detection of serum phosphorus, urine phosphorus, serum calcium (Ca), creatinine (Cr), and intact parathyroid hormone (iPTH)
Preoperative pretreatment rats were placed in a metabolism cage, urine was collected over 24, 48, and 72 h, and the amount of urine was recorded at each time point. After intraperito-neal anesthesia by chloral hydrate, blood samples were collected from the abdominal aorta. The blood phosphorus, blood Ca2+, serum creatinine (Scr), urine phosphorus, Cr, and iPTH levels were measured in a Hitachi 7600 automatic biochemical analyzer (DSL-8000 kit, America Beckman Coulter), the fractional excretion was also detected (the concentration of urine phosphorus / the concentration of blood phosphorus) / (the concentration of urinary Cr / the concentration of Scr).
Detection of histological changes of renal tissue
Kidney tissue was fixed in 10% poly formalin, dehydrated, embedded in resin, and sliced into 10-μm sections. Sections were processed for hematoxylin and eosin staining and the changes of glomeruli, renal tubules, and renal interstices were determined at high magni-fication using a light microscope (400X), along with the observation of whether crystallized stones were present.
Detection of femoral and lumbar bone densities
The density of the proximal femurs (lesser trochanteric base to femoral head) and lumbar bones were detected using Hologic QDR4000 dual energy X-ray absorptiometry (Lu-nar Company, USA).
Statistical analysis
All data were analyzed with the SPSS13.0 statistical software (SPSS, Chicago, IL, USA). P < 0.05 was taken to indicate significant difference. The experimental data are reported as means ± standard deviation. Comparisons between groups were performed using analysis of variance in the three groups.
RESULTS
Composition of the different diets
The detection results showed that the low phosphorus diet contained 0.19% phospho-rus, while the normal diet contained 0.73% phosphorus, consistent with expected standard. One rat of the HP group died in the sixth week; the remaining rats were sacrificed per experi-mental protocol.
Changes in serum indices in the different groups
The dynamic observation of the serum levels of phosphorus, Ca+, and iPTH are shown
11092C. Zhang et al.
©FUNPEC-RP www.funpecrp.com.brGenetics and Molecular Research 14 (3): 11089-11098 (2015)
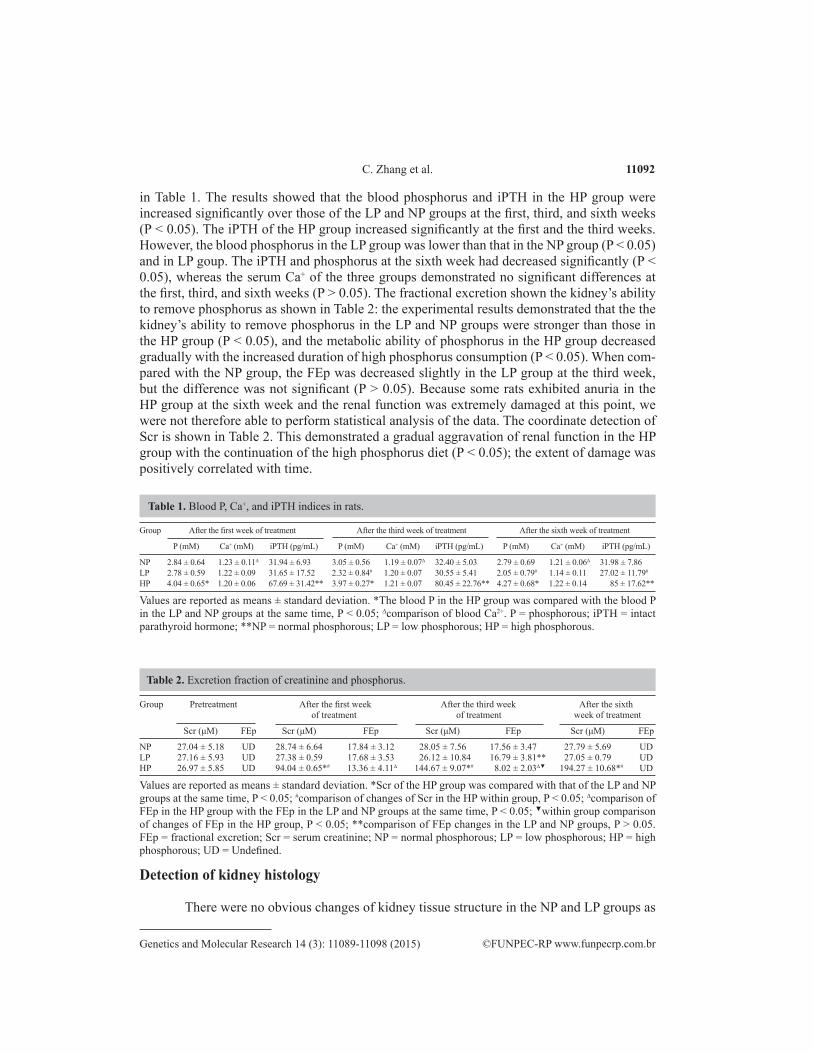
in Table 1. The results showed that the blood phosphorus and iPTH in the HP group were increased significantly over those of the LP and NP groups at the first, third, and sixth weeks (P < 0.05). The iPTH of the HP group increased significantly at the first and the third weeks. However, the blood phosphorus in the LP group was lower than that in the NP group (P < 0.05) and in LP goup. The iPTH and phosphorus at the sixth week had decreased significantly (P < 0.05), whereas the serum Ca+ of the three groups demonstrated no significant differences at the first, third, and sixth weeks (P > 0.05). The fractional excretion shown the kidney’s ability to remove phosphorus as shown in Table 2: the experimental results demonstrated that the the kidney’s ability to remove phosphorus in the LP and NP groups were stronger than those in the HP group (P < 0.05), and the metabolic ability of phosphorus in the HP group decreased gradually with the increased duration of high phosphorus consumption (P < 0.05). When com-pared with the NP group, the FEp was decreased slightly in the LP group at the third week, but the difference was not significant (P > 0.05). Because some rats exhibited anuria in the HP group at the sixth week and the renal function was extremely damaged at this point, we were not therefore able to perform statistical analysis of the data. The coordinate detection of Scr is shown in Table 2. This demonstrated a gradual aggravation of renal function in the HP group with the continuation of the high phosphorus diet (P < 0.05); the extent of damage was positively correlated with time.
Group After the first week of treatment After the third week of treatment After the sixth week of treatment
P (mM) Ca+ (mM) iPTH (pg/mL) P (mM) Ca+ (mM) iPTH (pg/mL) P (mM) Ca+ (mM) iPTH (pg/mL)
NP 2.84 ± 0.64 1.23 ± 0.11∆ 31.94 ± 6.93 3.05 ± 0.56 1.19 ± 0.07∆ 32.40 ± 5.03 2.79 ± 0.69 1.21 ± 0.06∆ 31.98 ± 7.86LP 2.78 ± 0.59 1.22 ± 0.09 31.65 ± 17.52 2.32 ± 0.84# 1.20 ± 0.07 30.55 ± 5.41 2.05 ± 0.79# 1.14 ± 0.11 27.02 ± 11.79#
HP 4.04 ± 0.65* 1.20 ± 0.06 67.69 ± 31.42** 3.97 ± 0.27* 1.21 ± 0.07 80.45 ± 22.76** 4.27 ± 0.68* 1.22 ± 0.14 85 ± 17.62**
Values are reported as means ± standard deviation. *The blood P in the HP group was compared with the blood P in the LP and NP groups at the same time, P < 0.05; ∆comparison of blood Ca2+. P = phosphorous; iPTH = intact parathyroid hormone; **NP = normal phosphorous; LP = low phosphorous; HP = high phosphorous.
Table 1. Blood P, Ca+, and iPTH indices in rats.
Group Pretreatment After the first week After the third week After the sixth of treatment of treatment week of treatment
Scr (μM) FEp Scr (μM) FEp Scr (μM) FEp Scr (μM) FEp
NP 27.04 ± 5.18 UD 28.74 ± 6.64 17.84 ± 3.12 28.05 ± 7.56 17.56 ± 3.47 27.79 ± 5.69 UDLP 27.16 ± 5.93 UD 27.38 ± 0.59 17.68 ± 3.53 26.12 ± 10.84 16.79 ± 3.81** 27.05 ± 0.79 UDHP 26.97 ± 5.85 UD 94.04 ± 0.65*# 13.36 ± 4.11∆ 144.67 ± 9.07*# 8.02 ± 2.03∆▼ 194.27 ± 10.68*# UD
Values are reported as means ± standard deviation. *Scr of the HP group was compared with that of the LP and NP groups at the same time, P < 0.05; #comparison of changes of Scr in the HP within group, P < 0.05; ∆comparison of FEp in the HP group with the FEp in the LP and NP groups at the same time, P < 0.05; ▼within group comparison of changes of FEp in the HP group, P < 0.05; **comparison of FEp changes in the LP and NP groups, P > 0.05. FEp = fractional excretion; Scr = serum creatinine; NP = normal phosphorous; LP = low phosphorous; HP = high phosphorous; UD = Undefined.
Table 2. Excretion fraction of creatinine and phosphorus.
Detection of kidney histology
There were no obvious changes of kidney tissue structure in the NP and LP groups as

11093Effects of high phosphorus on rats
©FUNPEC-RP www.funpecrp.com.brGenetics and Molecular Research 14 (3): 11089-11098 (2015)
observed under an optical microscope. However, changes in the kidney tissue in the HP group could be identified at the first week, including an essentially normal glomerulus, renal tubular epithelial cells with mild edema, slightly narrowed renal tubular lumen, and inflammatory cell infiltration of the renal interstitium. Concomitant with the increase of hyperphosphatemia, further changes appeared by the third week, including the development of slight glomerular shrinkage, severe edema of the renal tubular epithelial cells, a narrowing renal tubular lumen, t. At the sixth week, glomerular shrinkage and deformation could be observed, along with vacuolar degeneration of renal tubular epithelial cells, necrosis, a significantly narrowed renal tubular lumen encompassing a large number of debris, and the observation of hyperemia and infiltration of inflammatory cells into the renal interstitial space. The experimental results were consistent with the determination of Cr levels, and as the time increased, the degree of kidney damage also increased. However, no urinary stone crystallization was observed in the HP, NP, or LP groups at the first, third, or sixth weeks (Figures 1-4).
Figure 1. Glomerular histology (hematoxylin and eosin, 400X) of the high-phosphorous group during the first week. The glomerulus appears essentially normal with slight wrinkling from mild edema; the lumen is slightly narrow, interstitial less inflammatory cell epithelium is complete.
Figure 2. Glomerular histology (hematoxylin and eosin, 400X) of the high-phosphorous group at the sixth week. Glomerular shrinkage deformation can be observed, along with vacuolar degeneration of renal tubular epithelial cells, necrosis, and a significantly narrowed renal tubular lumen containing a large number of debris. Hyperemia and infiltrating inflammatory cells can be observed in the renal interstitial spaces.

11094C. Zhang et al.
©FUNPEC-RP www.funpecrp.com.brGenetics and Molecular Research 14 (3): 11089-11098 (2015)
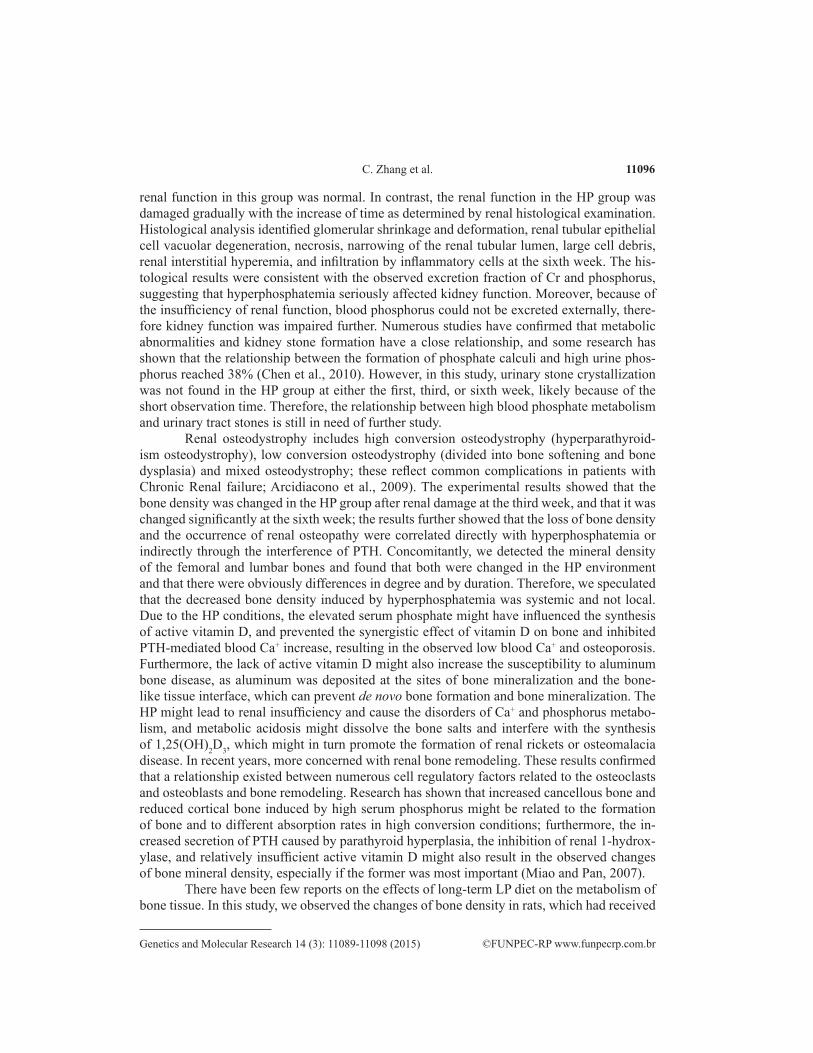
Determination of the mineral density of the femoral and lumbar bones
As shown in Table 3, the bone densities of the femur and lumbar vertebrae in the HP group were decreased at the third week when compared with the LP and NP groups (P < 0.05). With the increase of time, the bone densities of the HP group declined further at the sixth week compared with the third week (P < 0.05); when compared with the NP group, the mineral densities of the femur and lumbar bones in the LP group were decreased at the sixth week (P < 0.05). The bone osteoporosis symptoms of the HP group were worse than those of the LP group at the sixth week (P < 0.05).
Figure 3. Glomerular histology (hematoxylin and eosin, 400X) of the high-phosphorous group at the third week. Mild shrinkage of the glomerulus can be observed along with severe edema of the renal tubular epithelial cells; the renal tubular lumen is narrowed, and the renal interstitial space has been infiltrated by inflammatory cells.
Figure 4. Glomerular histology (hematoxylin and eosin, 400X) of the normal-phosphorous group the structure of the renal tissue appears clear and the renal tubular epithelial cells are complete and arranged neatly.

11095Effects of high phosphorus on rats
©FUNPEC-RP www.funpecrp.com.brGenetics and Molecular Research 14 (3): 11089-11098 (2015)
DISCUSSION
A diet containing higher phosphorus as required in this experiment would be expected to affect the absorption of calcium (Zeng et al., 2005). Therefore, we made the appropriate adjustments for the HP group such that rats in this group were fed a normal diet but received in-traperitoneal injection of fructose sodium phosphate. The experiments showed that it appeared higher HP and PTH in the feeding at first weeks (P < 0.05), suggesting that the high serum phos-phorus model was established successfully. iPTH was also increased significantly at the third week in the HP group, along with the emergence of secondary hyperparathyroidism (SHPT) at that stage, which was consistent with the results of Lötscher et al. (1996). However, although some differences of iPTH in the HP group existed at different times as determined from the results of biochemical index measurements, there were no obvious differences in blood Ca+ levels among the three groups at the first, the third, and sixth weeks (P > 0.05), which confirmed previous reports that the observed hyperphosphatemia-mediated PTH increase was not depen-dent on blood Ca+ levels (Zeng et al., 2004). The dynamic balance of phosphorus metabolism in vivo was primarily maintained by the adjustment of PTH, 1,25(OH)2D3, and calcitonin (Miao and Pan, 2007). Hyperphosphatemia might result in an increase of blood PTH levels thus pro-ducing SHPT, which made compensatory hyperphosphatemia which in turn leads to compen-satory hyperphosphatemia. At the same time, research has shown that high blood phosphorus affects the expression of renal sodium phosphate co-transporter (NaPi)-II mRNA, thus playing an important role in regulating the concentration of intracellular phosphorus. It can decrease the reabsorption of urine phosphorus and relieve hyperphosphatemia appropriately, which might limit further enhancement of SHPT (Zhao, 2005).
In this study, we detected the phosphorus excretion fraction of the three groups. The results showed that the metabolic capacities of phosphorus in the LP and NP groups were significantly stronger than that in the HP group at the first week. With the increased duration of high phosphorus consumption, the metabolic ability of phosphorus in the HP group gradu-ally decreased (P < 0.05). Simultaneously, the Scr results showed that the renal function of rats in the HP group was damaged gradually with the continuation of the high phosphorus diet (P < 0.05), and that the extent of damage was positively related to the duration of consump-tion, suggesting that the high serum phosphorus environment might lead to a decrease in the metabolic ability of the kidney, and to serious damage to kidney function. In addition, the FEp in the LP group was decreased slightly at the third week when compared with that of the NP group, but this difference was not significant (P > 0.05); it might be that the reduction of body phosphorus along with urinary phosphorus excretion led to slightly decreased FEp, but the
Group After the first week of treatment After the third week of treatment After the sixth week of treatment
Femur density Lumbar density Femur density Lumbar density Femur density Lumbar density
NP 0.30 ± 0.02 0.28 ± 0.01 0.31 ± 0.01 0.29 ± 0.01 0.31 ± 0.02 0.28 ± 0.01LP 0.30 ± 0.03 0.28 ± 0.01 0.29 ± 0.02 0.28 ± 0.02 0.27 ± 0.02∆ 0.25 ± 0.01∆
HP 0.27 ± 0.03* 0.25 ± 0.02* 0.23 ± 0.02*# 0.21 ± 0.04*# 0.19 ± 0.03*# 0.17 ± 0.02*#
Values are reported as means ± standard deviation. *Comparison of the mineral densities of the femur and lumbar bones in the HP group with those in the LP and NP groups at the same time, P < 0.05; #comparison of mineral density within the HP group P < 0.05; ∆comparison of bone density between the LP, HP, and NP groups, P < 0.05. NP = normal phosphorous; LP = low phosphorous; HP = high phosphorous.
Table 3. Changes of femur and tibia bone densities.
11096C. Zhang et al.
©FUNPEC-RP www.funpecrp.com.brGenetics and Molecular Research 14 (3): 11089-11098 (2015)
renal function in this group was normal. In contrast, the renal function in the HP group was damaged gradually with the increase of time as determined by renal histological examination. Histological analysis identified glomerular shrinkage and deformation, renal tubular epithelial cell vacuolar degeneration, necrosis, narrowing of the renal tubular lumen, large cell debris, renal interstitial hyperemia, and infiltration by inflammatory cells at the sixth week. The his-tological results were consistent with the observed excretion fraction of Cr and phosphorus, suggesting that hyperphosphatemia seriously affected kidney function. Moreover, because of the insufficiency of renal function, blood phosphorus could not be excreted externally, there-fore kidney function was impaired further. Numerous studies have confirmed that metabolic abnormalities and kidney stone formation have a close relationship, and some research has shown that the relationship between the formation of phosphate calculi and high urine phos-phorus reached 38% (Chen et al., 2010). However, in this study, urinary stone crystallization was not found in the HP group at either the first, third, or sixth week, likely because of the short observation time. Therefore, the relationship between high blood phosphate metabolism and urinary tract stones is still in need of further study.
Renal osteodystrophy includes high conversion osteodystrophy (hyperparathyroid-ism osteodystrophy), low conversion osteodystrophy (divided into bone softening and bone dysplasia) and mixed osteodystrophy; these reflect common complications in patients with Chronic Renal failure; Arcidiacono et al., 2009). The experimental results showed that the bone density was changed in the HP group after renal damage at the third week, and that it was changed significantly at the sixth week; the results further showed that the loss of bone density and the occurrence of renal osteopathy were correlated directly with hyperphosphatemia or indirectly through the interference of PTH. Concomitantly, we detected the mineral density of the femoral and lumbar bones and found that both were changed in the HP environment and that there were obviously differences in degree and by duration. Therefore, we speculated that the decreased bone density induced by hyperphosphatemia was systemic and not local. Due to the HP conditions, the elevated serum phosphate might have influenced the synthesis of active vitamin D, and prevented the synergistic effect of vitamin D on bone and inhibited PTH-mediated blood Ca+ increase, resulting in the observed low blood Ca+ and osteoporosis. Furthermore, the lack of active vitamin D might also increase the susceptibility to aluminum bone disease, as aluminum was deposited at the sites of bone mineralization and the bone-like tissue interface, which can prevent de novo bone formation and bone mineralization. The HP might lead to renal insufficiency and cause the disorders of Ca+ and phosphorus metabo-lism, and metabolic acidosis might dissolve the bone salts and interfere with the synthesis of 1,25(OH)2D3, which might in turn promote the formation of renal rickets or osteomalacia disease. In recent years, more concerned with renal bone remodeling. These results confirmed that a relationship existed between numerous cell regulatory factors related to the osteoclasts and osteoblasts and bone remodeling. Research has shown that increased cancellous bone and reduced cortical bone induced by high serum phosphorus might be related to the formation of bone and to different absorption rates in high conversion conditions; furthermore, the in-creased secretion of PTH caused by parathyroid hyperplasia, the inhibition of renal 1-hydrox-ylase, and relatively insufficient active vitamin D might also result in the observed changes of bone mineral density, especially if the former was most important (Miao and Pan, 2007).
There have been few reports on the effects of long-term LP diet on the metabolism of bone tissue. In this study, we observed the changes of bone density in rats, which had received

11097Effects of high phosphorus on rats
©FUNPEC-RP www.funpecrp.com.brGenetics and Molecular Research 14 (3): 11089-11098 (2015)
different levels of dietary phosphorus over the long term. As mentioned above, the decreased bone density of rats with chronic renal failure, which had received a long-term HP diet might be due to increased bone turnover rates and cancellous bone. The cortical osteopenia was also decreased. It was found that the bone density in the LP group was decreased significantly when compared with that of the HP group at the sixth week (P < 0.05), suggesting that bone density might also be impacted in a LP environment. At the same time, the blood phosphorus and iPTH of the LP group were lower than those of the NP group at the sixth week (P < 0.05), suggesting that the decreased bone density caused by low phosphorus diet, and which might be due either to the inorganic phosphorus deficiency, and influenced the formation of bone and the bone mineralization process. Therefore, the cancellous bone was increased and the cortical bone was reduced significantly. Studies have shown that the LP diet can reduce the stimula-tion of HP and low calcium on parathyroid cells in the renal failure state, thereby reducing the secretion of PTH and easing the increased bone turnover rates in the condition of chronic renal failure. It can also lead to cortical bone mass decrease, although the potential mechanism still requires further study (Zhu et al., 2011).
Hyperphosphatemia as an independent risk factor has attracted increasing amounts of attention. The prevention and treatment of hyperphosphatemia can effectively reduce the complications, morbidity, and mortality of patients, which might improve their life quality. We have successfully established a hyperphosphatemic rat model in this study. The experi-ment results showed that high blood phosphate has obvious effects on renal function and bone mineral density. We also explored the relationship between hyperphosphatemia, high urine phosphorus, and urinary tract stones, which might lay the foundation for further study of the effects of hyperphosphatemia on the body.
Conflicts of interest
The authors declare no conflict of interest.
ACKNOWLEDGMENTS
Research supported by the Science and Technology Program of Heilong Jiang Province (#LC08C16) and the financial aid from the Overseas Program of the Ministry of Education, Heilong Jiang Province (#1152hq26).
REFERENCES
Arcidiacono T, Paloschi V, Rainone F, Terranegra A, et al. (2009). Renal osteodystrophy and vascular calcification. J. Endocrinol. Invest. 32: 21-26.
Chen ZY, Ji SQ, Zhu GD, Han YF, et al. (2010). Analysis of chemical composition of urinary stones and evaluation of metabolic disturbance in 480 Uighur patients in south Xinjiang. Mod. Prev. Med. 37: 570-579.
Goodman WG (2004). Importance of hyperphosphataemia in the cardio-renal axis. Nephrol. Dial. Transplant. 19: i4-8.Lötscher M, Wilson P, Nguyen S, Kaissling B, et al. (1996). New aspects of adaptation of rat renal Na-Pi contransporter
to alterations in dietary phosphate. Kidney Int. 49: 1012-1018.Mao YH, Wang HT, Wang SL, Fang F, et al. (2006). Acute hyperphosphatemia and renal failure due to fructose
diphosphate injection. Adv. Drug Reactions J. 8: 109-112.Miao H and Pan MM (2007). Recent progresses in clinical study and treatment of hyperphosphatemia in chronic renal
failure. Chin. J. Blood Purif. 6: 500-502.

11098C. Zhang et al.
©FUNPEC-RP www.funpecrp.com.brGenetics and Molecular Research 14 (3): 11089-11098 (2015)
Pu RJ, Li HX and Ren S (2010). The prevention and treatment of residual stones in complicated renal calculi after percutaneous nephrolithotomy. J. Clin. Exp. Med. 9: 537-539.
Reeces PG, Nielsen FH and Fahey GC Jr (1993). AIN-93 purified diets for laboratory rodents: final report of the American Institute of Nutrition ad hoc writing committee on the reformulation of the AIN-76 rodent diet. J. Nutr. 123: 1939-1951.
Yuan FH and Du X (2010). The harm and prevention of hyperphosphataemia. Chin. J. Integr. Trad. West. Nephrol. 11: 847-849.
Zeng M, Wang XY, Wang XB and Zhao XF (2005). The effects of hyperphosphatemia on the expression of renal IIa type sodium phosphate cotransporter gene in rats with 5/6 nephrectomy and intervention of S Velam. Chin. J. Nephrol. 21: 408-412.
Zhao XZ (2005). Roles of serum phosphorus and sodium phosphate co transporter in the development of secondary parathyroid hyperfunction in patients with chronic kidney disease. Chin. J. Nephrol. 21: 172-173.
Zhu ZR, Lin S, Jia JY, Yan TK, et al. (2011). Effects of long-term various levels of dietary phosphorus feeding on bone morphology in the rats with chronic renal failure. Beijing Med. J. 33: 167-169.