establishing the linkages of human resource development
TRANSCRIPT

185
Establishing the Linkagesof Human Resource Development with Inclusive Growth
Tereso S. Tullao, Jr., PhDChristopher James Cabuay, MS
and Daniel Hofileña, MAE
Angelo King Institute for Economic and Business StudiesDe La Salle University-Manila
May 2014
Abstract
This study is one of the component papers in the priority area on inclusive growth of APEC 2015. This paper aims to establish the linkages of enhancing human capital and human resource development in an economy in attaining inclusive growth. Various studies have suggested that education, training, and human resource development in general raise the productivity of workers through the transmission of knowledge, skills, and competencies, which then increase the earnings capacity of an individual. Inclusive growth refers to economic growth performance that encompasses equity, equality in both income and opportunities, and protection in market and employment transitions. Because of the link between education and earnings capacity, improving education will lead to inclusive growth as educated individuals enhance their employment opportunities, improve their income and pursue entrepreneurial options. The state of education in the Philippines as well as in APEC economies was analyzed in terms of quality, relevance, access and equity, and efficiency and effectiveness. Likewise, options for the development of human resources in the Philippines and lessons learnt from best practices in APEC economies were categorized according to these four dimensions. Lastly, this study enumerates several actionable recommendations to help the region develop its human resources and ultimately attain inclusive growth through cooperation among the economies in bridging the development and human resource gaps in the Asia-Pacific region.
Keywords: Human Resource Development, Human Capital, Inclusive Growth, APEC 2015, Philippine Education, Asia-Pacific Region

186
Executive Summary
Project APEC 2015: Inclusive Growth
The Philippines is set to host the APEC meetings in 2015, and in formulating the analytical framework for the meeting’s agenda, the government has identified inclusive growth as one of the priority areas. Inclusive growth refers to economic growth performance that encompasses equity, equality in both income and opportunities, and protection in market and employment transitions (Anand, Mishra and Peiris, 2013).
Although the relationship between the quality of human resources and economic progress has been established in many theoretical and empirical studies, the question still remains regarding the contribution of human capital investment and knowledge capital to attaining inclusive growth. Thus, the primary objective of the paper is to establish the linkages of enhancing human capital and human resource development in an economy in attaining inclusive growth.
Linking Education, Training, and Human Resource Development to Economic Growth
Education, training, and human resource development in general raise the productivity of workers through the transmission of knowledge, skills, and competencies, which then increase the earnings capacity of an individual (Xiao, 2001; Mincer, 1974; Becker 1964; as cited in Tullao and Cabuay, 2013). Earlier growth accounting studies (Abramovitz, 1956; Fabricant, 1954; Tinbergen, 1942) have pointed to total factor productivity (TFP) as the determinant of technical change, which in turn is shaped by human resource development and management, institutional restructuring, and sociodemographic factors ( Jajri, 2007).
Cooray (2009) highlights the findings of many studies (Mankiw, Romer and Weil, 1992; Barro, 1991; Hanushek, 1995) with his international empirical evidence, that education quantity (enrolment rates) and quality (availability and quality of physical capital, teacher training) are positively associated with higher growth rates. Ozturk (2001) mentions that in the course of a economy’s growth, the different levels of education provide the various skills and competencies that directly determine the economy’s capacity to effectively utilize borrowed technology.
The development of an economy is complemented by the growth of various sectors as well as the improvement in technologies as it transits through various phases of development (Tullao and Cabuay, 2013). Economies usually start as a “traditional economy” with a growth bias in agriculture and employing unskilled workers and undemanding technology. As they develop, the intensity in agriculture declines and the industrial and manufacturing sector expand while being accompanied by changes in technology and the types of workers. As they progress further, economies utilize a mix of borrowed technology and locally developed technology, requiring professionals with higher education such as engineers, technicians, and technologists. Beyond the age of heavy manufacturing, economies are able to innovate, which requires scientists,

187
engineers, and researchers that can conduct research and development to produce the knowledge capital required as a base for innovations.
As an economy evolves to the stage of innovative technology, it will require strong linkage between higher education and R&D because innovation requires the accumulation of knowledge capital, which in turn is generated through R&D, which is most effectively produced by professionals and researchers that have high levels of human capital, which is gathered through higher education, training, and experience. The capacity of an economy to innovate will determine its global competitiveness. Hence, education, training, and human resource development play an important role in economic growth.
The Pursuit of Inclusive Growth
Inclusive growth refers to economic growth performance that encompasses equity, equality in both income and opportunities, and protection in market and employment transitions (Anand, Mishra, and Peiris, 2013). This is an ideal form of growth because it entails all social strata of an economy are growing at the same rate as the growth in income, investment and employment opportunities (Ianchovichina and Gable, 2012).
Inclusive growth requires macroeconomic stability: trade openness, moderate price and output volatility, substantial domestic and foreign capital formation, and financial openness. It also requires good investment in education and good levels of human capital accumulation, the ability to produce knowledge capital, and the generation of employment opportunities in all sectors. The government will play a crucial role in improving the speed and inclusiveness of the delivery of social services, infrastructure and social institutions such as microfinance, healthcare, and infrastructure (Deloitte and AIMA, 2011). Also, the growth of the private sector is what generates wealth and stimulates growth in the economy. It also generates jobs, mobilizes resources, facilitates knowledge transfers, develops skills, and provides training, which is also important in alleviating poverty (Allison, 2012).
Education can lead to inclusive growth by increasing productivity: learning the proper skills, competencies, and abilities makes people more productive, thereby increasing an economy’s output per worker. It leads to greater employment opportunities and reinforces the tenure of people with jobs especially during periods of economic downturns (Gurria, 2012). It also enhances entrepreneurship, facilitating investments in all types of business enterprises.
An economy must maintain the congruence between the supply and demand for educated labor because to ensure the attainment of inclusive growth, the average income must be raised for all people, and to ensure this, people must have employment. However, this is not an easy task especially in developing economies, where there are labor market mismatches, unemployment, and brain drain.

188
Human Capital Formation in the APEC Region
In assessing the level of human capital in the APEC region, we look at three indicators: the output of educational institutions and the impact of learning to pupils, financial and human resource investments in education, and the access to education, participation, and progression.
In terms of gross graduation ratios (GGR), the APEC region has improved levels over the previous decade up until 2010. Australia registered the highest with rates ranging from 51 percent to 60 percent, while Brunei showed the lowest graduation ratio at 6.22 percent in the year 2000; yet, this rate doubled to 13 percent in 2005 before slowly stabilizing between 10.7 percent and 10.8 percent.
In terms of research capability, the United States registered the highest contribution of around 7 million documents (SJR rank no. 1). China (SJR rank no. 2) has a share less than half of the United States with a total of 2.7 million indexed documents. Japan (SJR rank no. 5) has around 1.7 million indexed documents. The US, China, and Japan account for 73.4 percent of indexed documents of all APEC member-economies. The other quarter of the publications of has been contributed by the other 18 APEC economies with varying contributions.
In terms of resources invested in education particularly the public expenditures on education as a percentage of GDP, the APEC economies have been slowly increasing their expenditure in education, with the exception of a few economies such as Canada, Peru, and the Philippines.
In terms of the access to education, participation and progression, all the economies exhibited an increasing degree of participation throughout the periods being observed, with the yearly average growing from 71.26 percent in 1990 to 87.17 percent in 2010. But because of demographic developments, enrolment in primary education and tertiary education has been declining in many APEC economies. However, the school life expectancy has been increasing from 1990 to 2010, indicating that either there is a higher level of participation or an increase in the retention rate of educational systems.
The Educational System in the Philippines
Though the education sector of the Philippines has expanded in terms of enrolment rates and the number of educational institutions, the progress of the economy in achieving universal primary education under the Millennium Development Goal (MDG) has been lagging. Hence, the targets in the Philippine Development Plan (PDP) 2011-2016 have been set to achieve universal access (100 percent participation or net enrolment) in basic education, at least 93 percent participation or net enrolment rate in secondary education, and an increased enrolment and graduation rate in higher education and Technical and Vocational Education and Training (TVET), all by 2016 (National Economic Development Authority [NEDA], 2011).
In reviewing the landscape for the education sector of the Philippines, we look at four indicators: quality and excellence (provision of education that meets international

189
standards), relevance and responsiveness (generation and diffusion of knowledge in disciplines that are relevant to both the domestic and international environment), access and equity (broadening the participation in education particularly for deserving and qualified but underprivileged individuals), and efficiency and effectiveness (optimization of social, institutional, and individual returns to education).
Various indicators were used to evaluate these four dimensions. For quality and excellence, we used national achievement test scores, passing rates in professional licensure examination, levels of accreditation, and quality of teachers. National Achievement Test Scores have remained low for Grade 6 and 4th year High School students. National passing rates in professional licensure examination for various disciplines have remained low. To date, there are only 21.54 percent of the more than 2,247 HEIs have some form of accreditation granted by the major accrediting agencies.
For relevance and responsiveness, we utilized program offerings, enrollment, survival and completion rates, and enrollment rates. The largest number of enrollees in higher education is concentrated in business administration and related courses.
For access and equity, we looked financial assistance programs. The total number of CHED financial assistance programs beneficiaries increased from 48,705 in SY 2006-2007 to 72,775 in SY 2008-2009, but this number dwindled to 57,551 in SY 2010-2011 although the funding has increased significantly.
For efficiency and effectiveness, we used budgetary allocations and internal and external efficiency indices. The total budget for education and training has grown from PHP 162 billion in 2008 to nearly PHP 196 billion in 2010. The largest budget goes to the DepEd, followed by TESDA and CHED, respectively. In terms of efficiency, the primary and secondary education sectors account for has the largest budget but still have poor participation, cohort survival, and low achievement test scores. HEIs, particularly SUCs, have good output rates and licensure passing rates, but their internal efficiency suffers due to their mandates and programs offered outside of their mandates. The TVET sector has good internal efficiency given their wide range of scholarships but has a hard time providing good employment to their graduates.
Learning from APEC Economies
The role of organizations, institutions, and networks such as ASEAN University Network (AUN) Southeast Asia Engineering Education Development Network (SEED-Net), South East Asian Ministers of Education Organization (SEAMEO), Asia Professional Education Network (APEN), and ASEAN Framework Agreement on Services (AFAS), is paramount to develop education multilaterally as it facilitates the transfer of technology as well as fostering cooperation in developing the region’s human resources.
In improving quality and excellence, many APEC economies opted for institutional and structural reforms. Examining the economic and industrial needs of the economy and matching the products of higher education is necessary to maintain the relevance

190
of education, as well as to make it more responsive to changes in the labor market. A number of economies have programs in reducing the gap in education and income. In improving efficiency and effectiveness, many APEC economies once again opted for institutional and structural reforms including provision for decentralization, self-managing schools, reduction in central government role in basic education, and close partnership with the private sector.
Policy Recommendations: Cooperative Measures for APEC Economies in Human Resource Development
There are theoretical basis for investing in education because it can shape the stock and structure of human capital of an economy. Greater and intensive investment in education particularly higher education and research can build the higher level of human resource, which is knowledge capital. Both human capital and knowledge capital are essential in shaping the trajectory of economic prosperity.
Given this backdrop, the following specific proposals are being recommended to answer the needs of the Philippine Development Plan as well as to respond to the eminent role of education in the promotion of economic technical assistance, achieving the Bogor Goals, and in implementing cross-border education, which are all major thrusts of APEC:
1. Because of limited appreciation of professors and students in APEC economies on the educational systems, particularly higher educational institutions, of other economies, there are inadequate cooperative programs among educational institutions in the region. But interuniversity cooperation can only proceed after we have developed a sense of community among professors and students in APEC economies. To this end, there is a need to establish and maintain academic exchanges.
2. Given that Economic and Technical Assistance is a major pillar of APEC, specific measures of cooperation in the area of education and human resource development should be identified, and explicit measures should be made to implement this thrust of APEC. The economic and technological gaps among APEC member-economies provide avenues for cooperation and technical assistance. Cooperation can take the form of sharing of modern equipment and technologies, teacher training in technical and vocational skills, and accreditation and qualification measures in technical competency.
3. Given the existing cooperative programs and networks in the region, there is a need to further enhance these programs and initiatives under the ASEAN University Network (AUN), Southeast Asian Ministers of Education Organization (SEAMEO), Association of Southeast Asian Institutions of Higher Learning (ASAIHL), and other regional groupings in education, human resource development, and science and technology.
4. Given the common problems experienced by APEC economies related to labor and talent mismatch, there is a need to exchange
191
best practices in addressing the problem of educated unemployment and talent mismatch as well as the migration of human resources.
5. Given the wide gaps in educational indicators and human resource development in APEC member-economies, there is a need to narrow these gaps through various means of cooperation and technical assistance. Aside from exchange of professors, the twinning of academic programs among universities in the region should be expanded. Universities among developed economies in the region may partner with key universities in the developing economies in terms of faculty development, program cooperation, and joint research undertakings. Such cooperative measures, in turn, can strengthen R&D capacity of research and academic institutions and improve graduate education in APEC economies.
I. Introduction
Over the years, the thrust of the Asia-Pacific Economic Cooperation (APEC) has evolved from trade and investment liberalization to a much broader economic agenda covering international prosperity and development. As host of APEC 2015, the Philippines is tasked to set the agenda and the theme for all APEC meetings during the year. The agenda will be built around the priorities of the host economy and important issues surrounding developing economies and, at the same time, take into account APEC’s core principles of trade and investment liberalization, business facilitation, and economic and technical cooperation.
In this light, Project APEC 2015 was initiated to assist the Philippine government in crafting the analytical framework for the priorities for the year-long meetings in 2015. Project APEC 2015 is a collaboration of the government, private sector, and academe that will generate actionable policy recommendations and strategies that can be used in the discussions of various working groups in the APEC meetings in the Philippines in 2015.
This specific paper on Establishing the Linkages of Human Resource Development with Inclusive Growth is one of the component papers in the priority area on inclusive growth. Aside from highlighting the importance of human capital development, the paper will examine how this aspect of development is linked with the goal on attaining inclusive growth.
The relationship between the quality of human resources of an economy and the level of its material progress has been established in many theoretical and empirical studies. Investment in human capital and training has a significant effect on the growth of both developing and developed economies. In addition, the sustained development in developed economies has been attributed to the level of their knowledge capital. But what is not evident, however, is whether investment in human capital and knowledge capital lead to inclusive growth.
Although the pursuit of inclusive growth is a major concern by individual developing economies, it is likewise important to a regional aggrupation like APEC to hasten its

192
regional cooperation and integration initiatives. The 21 member-economies of the APEC have varied levels of economic development and also have differentiated stages of human resource development. Many developed economies have attained inclusive growth with their sustained development, while developing economies are still coping with this seemingly elusive goal. Given this asymmetry, one can explore the benefits of complementation and learn from the experiences of economies that have achieved inclusive growth. Indeed, there are internal initiatives that should be done to attain inclusive growth through human resource development. However, APEC as a regional group has something to contribute in addressing the improvement of the quality of human resources of member-economies. Bridging the human resource gap within the region may bring about inclusive growth in specific economies. Thus, cooperative efforts on the part of member-economies in improving basic education, vocational and technical education, higher education, and research and development will be explored. Given the asymmetry in human resource development among APEC economies, partnership and other cooperative initiatives that may be productive to all economies are likewise investigated. These initiatives do not only provide avenues for addressing the development gaps within the Asia-Pacific region but may also eventually contribute in achieving inclusive growth.
1.1 Objectives of the Paper
The primary objective of the paper is to establish the linkages of enhancing human capital and human resource development in an economy in attaining inclusive growth. In the course of trying to achieve the primary objective, we will also carry out the following sub objectives:
• Trace the linkages of education, human capital formation, and human resource development on the one hand, and economic development on the other
• Establish the connections between human capital and human resource development with inclusive growth
• Investigate the state of basic education, higher education, and skills training in the APEC economies
• Analyze some of the key issues confronting basic education, higher education, and technical education in the Philippines
• Examine how these human resource development issues are impeding the attainment of inclusive growth and the goals of the Philippine Development Plan
• Draw lessons from the experiences and best practices of APEC economies that may be relevant in resolving issues of human resource development in the Philippines
• Formulate possible cooperative mechanisms within APEC in narrowing the human resource development gaps within APEC economies.

193
1.2 Significance of the Paper
The paper emphasizes the role of education in enhancing human capital and human resource development in order to attain inclusive growth. An economy’s essential educational features determine the quality of labor force and the stock of human capital, which are important in the initial stage of economic development. As the level and quality of education of an economy’s human resources further improve, these can shape the economy’s capacity to conduct research, generate knowledge capital, and innovate, which in turn determines how an economy will gear its development path to greater heights.
Investment in human capital has the potentials of contributing toward the attainment of inclusive growth since the more educated and trained individuals are likely to participate in economic activities. In addition, workers with higher stocks of human capital are likely to have improved earning potentials and productivity from employment in quality jobs. Thus, improving the stock of human capital in an economy through education can contribute to inclusive growth as it serves as an enabler for individuals to have greater participation in economic activities on the one hand, while it directly expands the productive capacity of an economy on the other hand.
From the Philippines’ perspective, the paper provides policymakers with an appreciation of the state of human resource development in the economy and how the issues confronting education and training are contributing or impeding the attainment of the goals of the Philippine Development Plan. In particular, such analysis can serve as pressure for our policymakers to consider investment in human resource development as a priority not only in closing our gap with the more advanced APEC economies but more so in our quest for inclusive growth.
From a regional cooperative perspective, this paper is significant since it will allow APEC economies to learn from the best practices in the region on how human resource development has contributed toward the attainment of inclusive growth. More importantly, the paper identifies and recommends practicable cooperative initiatives that can be undertaken at regional level to narrow the gaps in human resource development among APEC economies.
1.3 Methodology
In answering these objectives, we will review the literature, gather pertinent data, examine the issues in human resource development, learn from best practices, and explore complementation of cooperation.
Reviewing the Literature
In answering sub objectives 1 and 2, the project will perform an extensive review of theoretical, conceptual, and empirical literature that will link education to human capital and human resource development and then to inclusive growth. This will also look at the research studies of APEC that analyze the trends and demands of the labor markets of the APEC economies.

194
Gathering Data
In answering sub objective 3, the project will collect data on the state of basic and higher education. Data to be collected include enrollment and graduation rates in APEC economies, universities, the courses that they offer, and the training they provide, as well as human resource development programs offered in each APEC economy as well as APEC itself. Data sources would include the World Bank, government agencies in charge of higher education in APEC economies, and human resource development institutions within APEC.
Examining the Issues
For sub objectives 4 and 5, we will analyze the issues confronting basic education, higher education and technical education in the Philippines in terms of quality, relevance, access, finance, and effectiveness. Quality refers to the characteristics of educational inputs particularly qualifications of teachers and curricular programs. Relevance, on the other hand, is the matching of outputs with the functions of the various types of education. Access, meanwhile, refers to the ease of admission and the difficulties of retention of students in schools. Finance points to the alternatives of funding the provision of various types of education. Meanwhile, effectiveness relates to the resource requirements in producing the outputs. Indeed, investment in human resource development has implications on the Philippine Development Plan since formation of human capital has to be efficient and equitable to promote rapid and inclusive growth.
Learning from Best Practices
In answering sub objective 6, we will review the literature, relevant APEC documents, and research studies on how human resource development has facilitated inclusive growth. Best practices may include how economies have enhanced the access to education, promotion of quality in basic and higher education, as well as improved skills training in the workplace. This will also entail the enumeration of skills and competencies required to make individuals of all social strata more competitive in an international workplace.
Exploring Complementation
In answering sub objective 7, we will document successful regional cooperative programs undertaken by the ASEAN University Network (AUN), the South East Asian Ministers of Education (SEAMEO) with its regional centers spread all over the region, and other regional organizations in improving basic education, higher education, and research and development in the region. We will craft recommendations on how APEC can cooperate, support, expand, and improve these regional initiatives aimed at enhancing human resources and in narrowing the human resource development gaps among developed and developing economies in the region.

195
II. Role of Education, Training and Human Resource Development in the Process of Economic Growth
It has been suggested by Becker (1964) and Mincer (1974) that investment in human capital is a strong driver of economic growth as it increases the earnings capacity of individuals. The human capital theory suggests that education, training, and human resource development, in general, raise worker productivity through the transmission of knowledge, skills, and competencies, and thereby raising future earnings of trained individuals (Xiao, 2001; Mincer, 1974; Becker 1964; as cited in Tullao and Cabuay, 2013).
2.1. Education and Economic Growth
One of the earlier economic growth models proposed by Solow (1957) suggested that growth is determined by factor inputs, labor, and capital and also by technical change (Tullao and Cabuay, 2013). Growth accounting studies (Abramovitz, 1956; Fabricant, 1954; Tinbergen, 1942) have pointed to total factor productivity (TFP) as the determinant of technical change, which in turn is shaped by human resource development and management, institutional restructuring, and sociodemographic factors ( Jajri, 2007).
Education entails the transmission of knowledge, skills, and competencies to individuals, which in turn enhance the individual’s productivity. However, the link between education and productivity is unclear. The most that education can do is to signal. The educational attainment of an individual serves as an indicator for employers to gauge the potential productivity of a worker (Spence, 1973), although at times, it is the job that determines productivity rather than the worker (Thurow, 1975).
Cooray (2009) provides a comprehensive review of literature on the effects of education on economic growth. He re-emphasizes the findings of many studies (Mankiw, Romer and Weil, 1992; Barro, 1991; Hanushek, 1995) with his international empirical evidence that education quantity (enrolment rates) and quality (availability and quality of physical capital, teacher training) are positively associated with higher growth rates. The study concludes that much of government expenditure needs to be allocated toward the improvement of education quality.
Ozturk (2001) mentions that in the course of an economy’s growth, education directly determines the economy’s capacity to effectively utilize borrowed technology. Primary and secondary education teaches the basic skills needed in the workplace such as numeracy, literacy, communication skills, and social skills including working with teams. Technical skills and other work-related competencies can be learned in secondary and vocational education. Tertiary education prepares students for employment in industries using more sophisticated technology, which are imported, adapted, and improved. Meanwhile, higher education provides support for the development of sciences that generates of knowledge capital and the development of technology and innovation.

196
2.2. Educational and Skills Requirement at Various Stages of Economic Development
From Unskilled Workers to Skilled Workers
The development of an economy is complemented by the growth of various sectors as well as the improvement in technologies as it transits through various phases of development (Tullao and Cabuay, 2013). Economies usually start with growth bias on agriculture, which uses traditional and undemanding technologies in agricultural and cottage industries. These production processes are uncomplicated and uses unskilled up to semiskilled workers to perform manual labor (Tullao and Cabuay, 2013). In this stage, little education is needed, and perhaps basic education is sufficient.
As the economy develops, the share of agriculture in national income declines, while the share of the industrial sector in generating income and employment begins to increase due to an expanding population and structural changes in economy (Tullao and Cabuay, 2013). This change is accompanied by changes in technology as well as the types of workers needed in the economy. Unskilled workers that operate in traditional agriculture may no longer be applicable in mechanized and large-scale manufacturing production. At this stage of development, the economy may have to borrow technology from more developed ones as it exploits opportunities in the manufacturing sector based on its resource endowment. From the human resource perspective, borrowed technology may require middle-skilled and technical workers. This implies that graduates of secondary education and technical/vocational training should have the appropriate competencies and dexterity to operate improved production techniques.
From Skilled Workers to Highly Skilled Technicians and Professionals
As the economy further develops, it may utilize a mix of borrowed technology and locally developed technology (Tullao and Cabuay, 2013). At this point, countries start to develop their industries that produce intermediate inputs to support their manufacturing sector’s quest to be globally competitive. This requires the employment of higher-educated professionals such as engineers, technicians, and technologists to exhaust the economy’s comparative advantage given its resource endowments. This marks the journey of an economy toward middle-income status (Tullao, 2012).
Moving beyond the stage of heavy manufacturing, the economy evolves further by developing differentiated manufactures. This may involve introducing innovation to the existing technologies both borrowed and locally developed. This stage produces innovative products that utilize high value-adding services. This stage requires the production of scientists, highly educated engineers, and highly skilled professionals (Tullao and Cabuay, 2013). To sum up, this stage requires very strong linkage between higher education and research and development (R&D).

197
2.3. Education and Research &Development
From Human Capital to Knowledge Capital
As an economy evolves to the stage of innovative technology, it will require strong linkage between higher education and R&D. This has been the highlight of Romer’s (1986) endogenous growth theory. The theory relieves the traditional growth theories of the assumption of decreasing returns to capital as it broadens the definition of capital to include human capital and knowledge capital (Tullao and Cabuay, 2013). He introduces the concept of increasing returns to capital with decreasing returns to knowledge, because he posits that in the long run, growth is driven by the accumulation of knowledge. In his model, human capital is composed of health, education, and training, whereas knowledge capital is investment in a economy’s capacity for R&D. As an economy moves to the stage of innovative technology, it will require a supply of knowledge capital to generate innovations. The generation of knowledge capital is hinged on the economy’s R&D capacity, which in turn is anchored on the level of human capital accumulation, which is dependent on human resource development in general. Hence, as mentioned previously, highly educated and highly skilled professionals, scientists, and engineers (researchers in general) are needed to generate the R&D (and knowledge capital) to enable the economy to innovate.
Ultimately, the capacity of an economy to innovate will eventually determine their competitiveness in terms of “the development and diffusion of new products and services, and organizational and institutional innovations such as new marketing strategies, management, policies, new services, and improved approaches to internal and external communications positioning” (Tullao, 2012).
III. Human Resource Development and Inclusive Growth
The story of growth in most developing countries has been one of rapid and sustained GDP growth driven by a leading sector, but not all sectors and social strata are growing at the same rate. There may be fast growth in the economy’s output, but this is accompanied by slower growth performance in sectors like agriculture, low quality of human resources, poor access and availability of quality education and healthcare, and generally increasing income inequality between rural and urban areas as well as among social strata. Inclusive growth refers to economic growth performance that encompasses equity, equality in both income and opportunities, and protection in market and employment transitions (Anand, Mishra and Peiris, 2013). This is an ideal form of growth because it entails that all social strata of an economy are growing at the same rate as the growth in income, investment, and employment opportunities (Ianchovichina and Gable, 2012).
3.1. Requirements for Inclusive Growth
Growth is unambiguously inclusive if the growth of the average income of individuals is coupled with an increase in equity (see Anand, Mishra, and Peiris, 2013, for a well-rounded discussion on the requirements of inclusive growth). These two goals may not always go together, and there have been various cases in economies wherein there

198
is pure income growth without any improvement in equity, and sometimes, there is no income growth, but a better income distribution. Many studies (Anand, Mishra, and Peiris, 2013; Deloitte and All India Management Association [AIMA], 2011; Geron, Chua, and Songco, 2011; Vaithiyanathan, 2012) have already listed down avenues in order to attain inclusive growth.
Macroeconomic stability is one of the avenues in attaining inclusive growth (Anand, Mishra, and Peiris, 2013). An economy more open with trade, with moderate price and output volatility, substantial capital accumulation from both domestic and foreign sources, and financial openness, has been seen empirically and conceptually to lead to inclusive growth (Anand, Mishra, and Peiris, 2013; Geron, Chua, and Songco, 2011).
Another important avenue in achieving inclusive growth is education. The capacity of an economy to invest in more and better quality human capital (Anand, Mishra, and Peiris, 2013), its ability to generate knowledge capital (Vaithiyanathan, 2012), and generate employment opportunities to all sectors can lead to inclusive growth. As a consequence, structural changes are required in attaining inclusive growth (Anand, Mishra, and Peiris, 2013).
Deloitte and AIMA (2011) emphasize on the central role of government in achieving inclusive growth. The government itself is not expected to provide all the benefits in attaining inclusive growth, but it is crucial in improving the speed and inclusiveness of the delivery of social services, infrastructure, and social institutions (Deloitte and AIMA, 2011). Improvement of the access to social services like microfinancing is important to people of lower income strata to be able to engage in entrepreneurial activity. Healthcare also important as it complements education in the accumulation of human capital. Infrastructure is a key component to making countries more competitive: roads, good public transportation systems, seaports, and airports all facilitate the conduction of business and the flow of investment. Up to some extent the private sector may also have a hand in achieving inclusive growth (Allison, 2012).
The role of the private sector in development is primarily generating wealth and stimulating economic growth. It is also responsible of generating jobs, mobilizing resources, facilitating the knowledge transfer by introducing creative and innovative solutions, and fostering skills development and training (Allison, 2012). The evolution of core business and inclusive business models also plays a role in how the private sector may contribute to attaining inclusive growth (Allsion, 2012; Deloitte and AIMA, 2011). These “inclusive business models” help reduce poverty through job creation and transmission of skills and training, while also maintaining the profitability and competitiveness of companies (Allison, 2012). This also entails that the products that companies manufacture may also cater to lower income strata consumers, giving them access to portable, affordable, but good-quality products (Deloitte and AIMA, 2011).
3.2. Education and Inclusive Growth
Inclusive growth may be attained by increasing average income and making the income distribution of an economy more equitable (Anand, Mishra, and Peiris, 2013). Empirically, education appears to be a highly significant correlate for inclusive growth

199
(Anna, Mishra, and Peiris, 2013; Barro and Lee, 2000), particularly the years of schooling in primary, secondary, and tertiary levels of education. A strong economy for knowledge has emerged globally, thus creating incentives for people to invest in their skills particularly through education (Gurria, 2012).
Education provides three linkages in attaining inclusive growth. This is made possible through increases in productivity, greater employment opportunities, and enhanced entrepreneurship. Learning the proper skills, competencies, and abilities makes people more productive, thereby increasing an economy’s output per worker. At the same time, education reinforces the tenure of people with jobs especially during periods of economic downturns (Gurria, 2012). Education also encourages entrepreneurial development, facilitating investments in all types of business enterprises. Education, which secures employment, improves productivity, and enhances entrepreneurial capacity, is essential to improving average income of the people as well as the income distribution of the economy because it acts as an enabler for individuals more especially those at the lower income strata.
3.3. Mismatch, Unemployment, and Brain Drain
As discussed in the previous section, education, training, and human resource development, in general, lead to accumulation of human capital, which leads to the generation of knowledge capital and, ultimately, innovation. In developing human capital to attain inclusive growth, an economy must maintain the congruence between the supply and demand for educated labor (Tullao and Cabuay, 2013). This is desirable because in order to ensure the inclusiveness of growth, people must have employment. As can be seen in Anand, Mishra, and Peiris’ (2013) framework, one way to ensuring inclusiveness is to raise the average income for all people. This requires that all people must have a job. But this is not always the case for developing economies where there is tendency to overproduce certain professions/degrees or underproduce one that is badly needed in the industry.
In addition, the economy may experience the phenomenon of brain drain if it has a weak domestic absorption for particular occupations (for example, jobs are not readily available in underdeveloped industries). In such a backdrop, individuals with higher levels of education tend to migrate toward economies with higher wages or perhaps those with more favorable living conditions.
Education by itself may not be sufficient to attain inclusive growth. It all boils down to what kind of skills and degrees educational sector is producing, what industries are being developed and their manpower requirements, and all incentives an economy has in place to encourage individuals to take higher education and to prevent them from migrating.
IV. State of Human Capital Formation in the APEC
This section describes the state of human capital formation in APEC member-economies. The development of human capital has been associated to the knowledge, education, skills, and abilities of an individual (Garavan et al., 2001). Therefore, we

200
refer to the state of education and training as indicators of the present and future trends of human capital formation in different economies (Miyamoto, 2003).
In order to serve as a guide, we divide our data into three parts in accordance with the division set forth by the OECD-INES (2013), although we only look at some indicators. First, we use the output of educational institutions and the impact of learning to the pupils. Second, we use the financial and human resources invested in education. Usually, this includes the expenditures of the government that directly affect the student, as it directly affects the learning environment and conditions within the classroom. Third, the focus of this section is the access to education, participation and progression. It is important to note, however, that we did not include indicators for the fourth category, the learning environment and organization of schools.
4.1 The Output of Educational Institutions and the Impact of Learning to the Pupils
Gross Graduation Ratio. Tertiary (ISCED 5A) First Degree
Gross Graduation Ratio (GGR) is defined as all the graduates in ISCED 5A programs expressed as the percentage of the population who belong to the age bracket wherein they theoretically finish the most common first degree program (Table 1). Among all the economies that were included, Australia ranks the highest in terms of the GGR, with rates ranging from 51 to 60 percent. New Zealand also experienced a GRR at an average of 48 percent, ranking second among those included.
Table 1. Gross Graduation Ratio of APEC economies. Tertiary (ISCED 5A) First Degree. Total.

201
In general, looking at Figure 1, we can see that all of the economies experienced an improving graduation ratio for all the years starting from 2000-2010. The highest rate of increase is experienced by Korea, from a GRR of 28% in 2000 to 50% in 2009, with a staggering rate of growth of 79%
Research Capabilities
Table 2 shows the rankings and the number of documents listed in the SCImago Journal and Country Rank of each APEC economy, as well as their respective shares to the total number of indexed documents contributed by APEC member-economies for the years 1996-2012. The United States (SJR rank no. 1) has the highest contribution of around 7 million documents (45.04 percent). China (SJR rank no. 2) has a share less than half of the United States at 17.09 percent, with a total of 2,680,395 indexed documents. Japan (SJR rank no. 5) ranks third with a total share of 11.33 percent, or around 1.7 million indexed documents.
Looking at Table 2, it is evident that there is a large disparity between the number of documents published by the three most indexed. In total, the US, China, and Japan account for 73.4 percent of indexed documents of all APEC member-economies. At the other end of the spectrum are Thailand, Singapore, Philippines, Peru, Papua New Guinea, New Zealand, Mexico, Malaysia, Chile, Brunei, and Vietnam, with each contributing 1 percent of indexed documents.
On the other hand, Brunei showed the lowest graduation ratio at 6.22 percent in 2000, yet this rate doubled to 13 percent in 2005 before slowly stabilizing between 10.7 and 10.8 percent. Indonesia’s average is also low as compared to other economies in the APEC, with an average rate of graduation of 10.39 percent from 2000 to 2010.Vietnam, with only two data points available, averaged at a rate of 9.25 percent.
Figure 1. Gross Graduation Ratios of APEC economies

202
4.2 Resources invested in education
Public expenditure on education as % of GDP
Total public expenditure on education as a percentage of GDP is defined as the “current and capital expenditure on education by local, regional, and national governments on education, expressed as a percentage of GDP (for a given year) (UNESCO, 2011). High values of this indicator mean that the government puts priority in the development of educational institutions and infrastructure.
In the past two decades, it can be seen from Table 2 and Figure 2 that the economies have been slowly increasing their expenditure in education, with the exception of a
Table 2. Global SJR Ranks and Documents listed in SCImago Journal and Economy Rank of APEC economies for the Period 1996-2012. Share of Each
APEC economy to the Total APEC Number of Documents.
SJR Rank Economy Documents % Share
11 Australia 683,585 4.36
134 Brunei Darussalam 1,345 0.01
7 Canada 993,461 6.33
44 Chile 68,974 0.44
2 China 2,680,395 17.09
30 China, Hong Kong SAR 162,812 1.04
61 Indonesia 20,166 0.13
5 Japan 1,776,473 11.33
40 Malaysia 99,187 0.63
28 Mexico 166,604 1.06
34 New Zealand 129,822 0.83
122 Papua New Guinea 1,719 0.01
77 Peru 8,963 0.06
70 Philippines 13,163 0.08
13 South Korea 578,625 3.69
12 Russian Federation 586,646 3.74
32 Singapore 149,509 0.95
16 Taiwan 398,720 2.54
43 Thailand 82,209 0.52
1 United States 7,063,329 45.04
67 Viet Nam 16,474 0.11

203
few economies such as Canada, Peru, and the Philippines. The share of education in GDP in the Philippines decreased by 13 percent, from 3.04 to 2.65 percent. As for Peru, it shrank by 11 percent, from 3.09 to 2.75 percent, and Canada by 9 percent, from 6.09 to 5.50 percent.
On a lighter note, Indonesia’s expenditure increased by 300 percent, from 1 percent of GDP to 3 percent by the end of 2010. This is followed by Mexico and Chile, with a growth in government spending by 128 and 78 percent, respectively. We also see that Australia increased their expenditure by 19 percent, from 4.67 to 5.58 percent.
Table 3. Public Expenditure on Education as % of GDP
Finally, by looking at the periods between 2000 and 2005, it is seen the most economies actually experienced a slight decline (or no change) in the share of education in GDP. However, examining the periods between 2005 and 2009, it is evident that majority of member-economies started to increase their education expenditure, that is, during this time economies started to prioritize the development of human capital.
4.3 Access to Education, Participation, and Progression
Gross Enrollment Ratio, All Levels Combined
The Gross Enrollment ratio (GER), as defined by the UNESCO Institute for Statistics (2012), refers to the number of student enrolled in all levels of education (except preprimary), expressed as a percentage of the official school age population. According to the report, it is also used to “indicate the capacity of the education system to enroll students of a particular age group.” However, a limitation of this statistic is that it

204
Figure 2. Public Expenditure on Education as % of GDP.
Source: The World Bank.(n.d.).World Bank Open Data.In The World Bank.Working for a world free of poverty. Retrieved November 1, 2013, from http://data.worldbank.org.
also includes overaged or underaged students, repeaters, and early and late entrants in the calculation, a reason why sometimes the GER goes over 100 percent. A GER of 100 percent is an indicator that there is a high degree of participation in education, regardless of age.
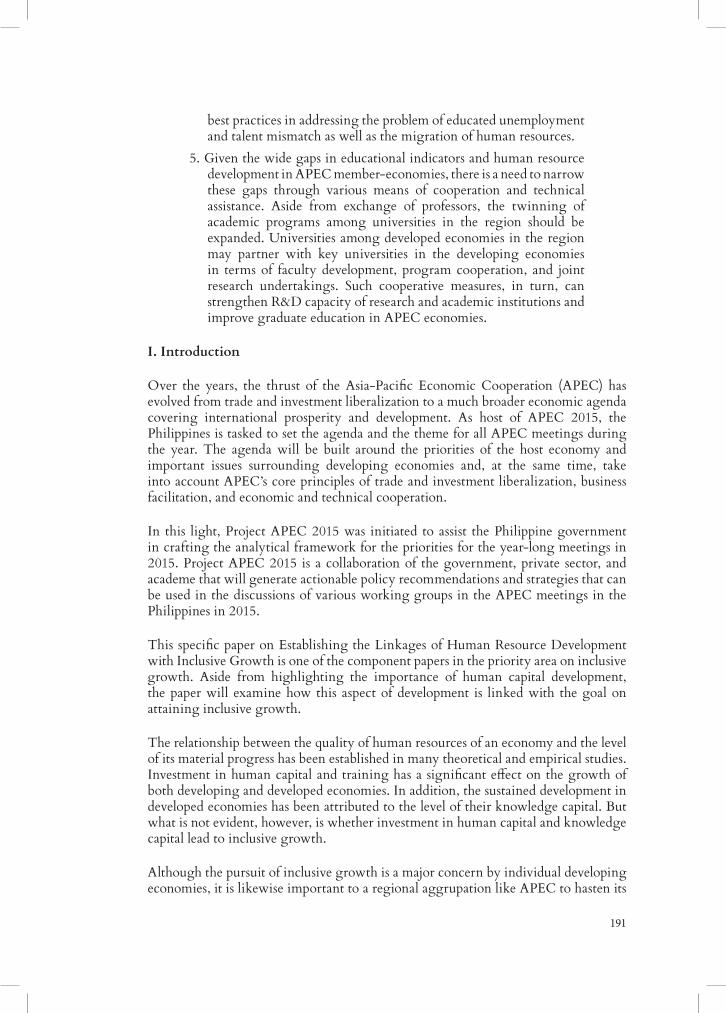
Generally, all the economies exhibited an increasing degree of participation throughout the periods being observed, with the yearly GER average growing from 71.26 percent in 1990 to 87.17 percent in 2010 (see Table 4). A word of warning: since a lot of data points are missing in 2000 and 2010, it is possible that these average could mean higher or lower than what is shown.
Canada, on the other hand, experienced a decrease of the GER from 97.99 percent in 1990 to 93.47 percent in 2000. However, we are unable to retrieve data on the GER on Canada after the year 2000. On average, the economies that have the highest GER are Australia, New Zealand, South Korea, and the United States, with participation rates ranging from 98 percent (USA) up to 109 percent (Australia). The economies that have a low rate of participation are Vietnam, Thailand, China, Indonesia, and Malaysia, with participation rates ranging from 64 to 67 percent. Papua New Guinea recorded a 32.53 percent participation rate in the year 1995; however, since there are a lot of data points that are missing, it might be erroneous to come to sudden conclusions.
Looking at the deviation of the GER of each economy as compared to the mean GER for that year (Table 5), we can see that slowly, the level of dispersion converges. This
205
is with the exception of Vietnam and New Zealand, which over the years actually deviated from the mean GER: Vietnam with a lower GER and New Zealand with a GER exceeding the average by at least 21 percent.
Primary Education, as defined by the ISCED (2011), provides the students with essential skills in writing, reading, and mathematics. It equips the pupils with the necessary understanding of the core areas of knowledge and personal development in preparation for lower secondary education. The data give us the total enrollment in primary education in public institutions for selected years.
It is clearly seen in Table 6 that majority of the economies examined exhibit a downward trend in the total number of students who enrolled in primary education. Among the economies that exhibited a sharp decline in primary enrollment are Papua New Guinea, Vietnam, Russia, Peru, Hong Kong, and Chile. However, economies such as New Zealand, Indonesia, the Philippines, and the United States generally experienced a surge in primary enrollment during the 10 year period.
Table 4. Gross Enrollment Ratio. All Levels Combined (Except Preprimary). Total.
WDI Economy VW 1990 1995 2000 2005 2009 2010 Average
Australia ... 105.42 114.40 111.55 107.20 109.78 109.67
Brunei Darussalam ... ... 77.04 83.89 83.85 83.06 81.96
Canada 97.99 99.14 93.47 ... ... ... 96.30
Chile ... ... 77.68 82.90 84.67 86.22 82.87
China 49.85 56.27 ... ... 68.88 69.58 64.91
Hong Kong SAR ... ... ... 74.14 83.58 82.50 80.07
Indonesia 61.32 60.29 61.00 65.49 74.05 75.56 67.28
Japan 77.79 80.06 83.72 86.45 88.53 89.16 85.58
Korea, Rep. 79.50 84.84 93.36 97.72 101.32 101.50 95.75
Malaysia 57.60 59.95 68.67 71.33 ... ... 66.65
Mexico 66.88 66.31 72.05 77.00 80.34 80.91 75.32
New Zealand 79.27 93.64 97.21 106.15 110.74 107.91 103.13
Papua New Guinea ... 32.53 ... ... ... ... 32.53
Peru 78.32 78.56 ... 81.77 ... 82.92 81.08
Philippines 74.92 ... ... 78.47 76.39 ... 77.43
Russian Federation 85.96 79.23 ... 81.84 85.34 ... 82.14
Thailand 48.82 55.29 ... 72.10 71.92 ... 66.44
United States 89.73 93.66 91.64 94.43 97.29 98.31 95.07
Vietnam 49.70 ... 64.11 64.84 64.28 65.77 64.75
Yearly Average 71.26 74.66 82.86 83.13 85.23 87.17
Source: The World Bank. (n.d.). World Bank Open Data. In The World Bank. Working for a world free of poverty. Retrieved November 1, 2013, from http://data.worldbank.org.

206
Looking at Table 7, it is also evident that the sharpest drops in the total number of enrollees happened between 2005 and 2009, with an average change (for all economies) of -6.73. Furthermore, it also important to note that Vietnam and Papua New Guinea experienced sharp drops during the periods 2000-2005, with values of -25.88 and -34.09, respectively.
Tertiary Education (ISCED levels 5 to 8), as defined by the ISCED (2011), is the education that provides learning in specialized fields of education; it is learning at a high level of specialization and complexity. This also includes vocational and professional education. The data above reflect the total number of those who enrolled for the school year, may it be part time or full time students, in both public and private institutions.
Looking at the Tables 8 and 9, it can be seen that all economies, with the exception of Canada, experience an increase in the total number of enrollees in tertiary education in the past two decades. The number of enrollees in Canada decreased by 41 percent
Table 5. Gross Enrollment Ratio. Deviation from Yearly Average.
WDI Economy VW 1990 1995 2000 2005 2009 2010
Australia ... 30.75904 31.53432 28.42083 21.97607 23.54014
Brunei Darussalam .. ... -5.82665 0.760151 -1.37942 -3.18473
Canada 26.72817 24.48208 10.60709 ... ... ...
Chile ... ... -5.17856 -0.22636 -0.55778 ...
China -21.4069 -18.3813 ... ... -16.3445 -16.6612
Hong Kong SAR ... ... ... -8.99137 -1.64479 -3.73716
Indonesia -9.94142 -14.3636 -21.8633 -17.6422 -11.1787 -10.6787
Japan 6.531319 5.400426 0.862277 3.315901 3.306592 2.91695
Korea, Rep. 8.238809 10.17921 10.50126 14.58771 16.09631 15.26153
Malaysia -13.661 -14.7038 -14.1944 -11.7994 ... ...
Mexico -4.3834 -8.34946 -10.8172 -6.12901 -4.88297 -5.33229
New Zealand 8.014349 18.97998 14.35098 23.02018 25.51367 21.67218
Papua New Guinea ... -42.1238 ... ... ... ...
Peru 7.055749 3.907386 ... -1.35556 ... -3.32648
Philippines 3.659789 ... ... -4.65633 -8.83305 ...
Russian Federation 14.69971 4.573116 ... -1.28627 0.110962 ...
Singapore ... ... ... ... ... ...
Thailand -22.4411 -19.3613 ... -11.0275 -13.3048 ...
United States 18.46889 19.00195 8.778177 11.29593 12.06363 ...
Vietnam -21.5631 ... -18.7539 -18.2866 -20.9413 -20.4702
Source: The World Bank. (n.d.). World Bank Open Data. In The World Bank. Working for a world free of poverty. Retrieved November 1, 2013, from http://data.worldbank.org.

207
Tabl
e 6.
Tot
al E
nrol
lmen
t in
Prim
ary,
Pub
lic, A
ll Pr
ogra
mm
es1
WD
I Eco
nom
y V
W20
0020
0520
0920
10T
rend
in
Enro
llmen
t
Aus
tral
ia13
8750
013
7250
013
8500
013
9250
0U
pwar
d
Bru
nei D
arus
sala
m29
483
2957
728
280
2811
6D
ownw
ard
Can
ada
2297
314
2184
000
2060
859
Dow
nwar
d
Chi
le84
2048
6775
2564
9091
Dow
nwar
d
Chi
na98
8130
4895
9898
57D
ownw
ard
Hon
g K
ong
SAR
4007
6231
4344
2936
17D
ownw
ard
Indo
nesia
2375
7584
2429
7134
2500
3576
2523
9328
Upw
ard
Japa
n74
6087
071
6243
970
7899
170
2054
5D
ownw
ard
Kor
ea, R
ep.
3971
679
3979
257
3433
362
3258
733
Dow
nwar
d
Mal
aysia
3175
406
2972
445
2918
944
Dow
nwar
d
Mex
ico
1367
4934
1351
7130
1363
0684
1367
8961
Upw
ard
New
Zea
land
3103
2730
4671
3412
28U
pwar
d
Papu
a N
ew G
uine
a
Peru
3773
774
3408
690
2988
563
2932
444
Dow
nwar
d
Phili
ppin
es11
7866
2212
0873
7012
5745
06U
pwar
d
Rus
sian
Fede
ratio
n61
2010
052
8224
049
8333
9D
ownw
ard
Sing
apor
e27
2254
Dow
nwar
d
Tha
iland
5304
006
5030
262
4384
613
Dow
nwar
d
Uni
ted
Stat
es22
0823
6721
9456
5422
1867
0322
2233
58U
pwar
d
Vie
tnam
1003
2430
7744
745
6704
614
6882
246
Dow
nwar
d
Tabl
e 7.
Gro
wth
of t
he E
nrol
lmen
t in
Prim
ary.
Pub
lic. A
ll Pr
ogra
mm
es. (
%)2
Econ
omy
2000
-220
520
05-2
009
2009
-201
0To
tal C
hang
e
Aus
tral
ia-1
.11
0.82
0.70
0.41
Bru
nei D
arus
sala
m0.
32-4
.48
-0.5
8-4
.75
Can
ada
-5.0
6-5
.80
...-1
0.86
Chi
le...
-21.
74-4
.29
-26.
03
Chi
na...
...-2
.90
-2.9
0
Hon
g K
ong
SAR
, Chi
na...
-24.
29-6
.82
-31.
11
Indo
nesia
2.25
2.87
0.94
6.05
Japa
n-4
.08
-1.1
7-0
.83
-6.0
8
Kor
ea, R
ep.
0.19
-14.
76-5
.22
-19.
79
Mal
aysia
...-6
.61
-1.8
2-8
.42
Mex
ico
-1.1
60.
840.
350.
03
New
Zea
land
...-1
.84
11.3
39.
49
Papu
a N
ew G
uine
a-3
4.09
0.15
0.15
-33.
79
Peru
-10.
17-1
3.15
-1.9
0-2
5.22
Phili
ppin
es2.
523.
95...
6.47
Rus
sian
Fede
ratio
n-1
4.72
-5.8
3...
-20.
55
Sing
apor
e-2
.05
-2.5
5-3
.11
-7.7
1
Taiw
an (E
lem
enta
ry S
tude
nts)
-5.0
1-1
3.95
-4.7
3-2
3.69
Tha
iland
-5.3
0-1
3.74
...-1
9.04
Uni
ted
Stat
es-0
.62
1.09
0.17
0.64
Vie
tnam
-25.
88-1
4.42
2.61
-37.
69
Aver
age
Cha
nge
-6.5
0-6
.73
-0.9
4-1
2.12

208
Tabl
e 8.
Enr
ollm
ent i
n To
tal T
ertia
ry, P
ublic
and
Priv
ate,
Ful
l and
Par
t T
ime3
WD
I Eco
nom
y V
W20
0020
0520
0920
10T
rend
in
Enro
llmen
t
Aus
tral
ia
Bru
nei D
arus
sala
m39
8450
2361
0757
76U
pwar
d
Can
ada
1212
161
Dow
nwar
d
Chi
le45
2177
6636
9487
6243
9876
43D
ownw
ard
Chi
na73
6411
120
6012
1929
2958
4131
0467
35D
ownw
ard
Hon
g K
ong
SAR
, Chi
na15
2294
2542
7326
4761
Upw
ard
Indo
nesia
3126
307
3662
234
4859
409
5001
048
Dow
nwar
d
Japa
n39
8206
940
3830
238
7422
438
3631
4D
ownw
ard
Kor
ea, R
ep.
3003
498
3210
184
3219
216
3269
509
Dow
nwar
d
Mal
aysia
5492
0569
6760
1000
694
1061
421
Dow
nwar
d
Mex
ico
1962
763
2388
4858
2705
190
2847
376
Dow
nwar
d
New
Zea
land
1719
6223
9983
2630
2826
6232
Dow
nwar
d
Papu
a N
ew G
uine
a
Peru
9093
1512
0697
0D
ownw
ard
Phili
ppin
es24
0264
926
2538
5U
pwar
d
Rus
sian
Fede
ratio
n63
3132
490
0320
893
3011
5D
ownw
ard
Sing
apor
e19
8634
2134
46U
pwar
d
Tha
iland
1900
272
2359
127
2417
262
2426
577
Dow
nwar
d
Uni
ted
Stat
es13
2028
8017
2720
4419
1028
1420
4277
09D
ownw
ard
Vie
tnam
7321
8713
5454
317
7432
120
2041
3D
ownw
ard
Tabl
e 9.
Enr
ollm
ent i
n Te
rtia
ry. P
ublic
and
Pri
vate
. Ful
l Tim
e an
d Pa
rt T
ime.
Gro
wth
Rat
e (%
)4
Econ
omy
1995
-200
020
00-2
005
2005
-200
920
09-2
010
Aus
tral
ia68
.78
-13.
2619
.26
15.7
9
Bru
nei D
arus
sala
m...
......
19.5
4
Can
ada
-3.1
5-3
8.63
......
Chi
le...
27.7
038
.37
27.7
8
Chi
na29
.65
33.2
910
2.87
35.2
1
Hon
g K
ong
SAR
, Chi
na...
......
51.2
6
Indo
nesia
38.6
033
.79
15.8
228
.28
Japa
n37
.86
1.63
1.40
-4.1
5
Kor
ea, R
ep.
23.6
637
.44
6.66
0.28
Mal
aysia
55.1
495
.79
23.8
036
.20
Mex
ico
7.79
32.3
419
.48
12.6
0
New
Zea
land
38.5
34.
7933
.33
9.17
Rus
sian
Fede
ratio
n-1
4.11
33.8
035
.21
3.57
Taiw
an (E
nrol
lmen
t in
Col
lege
s, U
nive
rsiti
es a
nd Ju
nior
Col
lege
s)26
.47
37.4
017
.16
3.04
Tha
iland
21.8
347
.28
21.6
32.
43
Uni
ted
Stat
es5.
33-7
.83
26.8
710
.07
Vie
tnam
9.01
128.
1461
.52
27.0
0
Dat
e20
03-2
005
2005
-200
720
07-2
009
2009
-201
0
Phili
ppin
es-1
.20
8.08
0.80
5.40
Dar
e20
06-2
007
2007
-200
820
08-2
009
2009
-201
0
Sing
apor
e5.
035.
364.
432.
54

209
from 1995 to 2005, with the sharpest drop occurring between 2000 and 2005 (-38.63 percent). However, with the limited data that have been collected about Canada, it cannot be proven that this trend continued for the periods 2005-2010.
On the other hand, the number of enrollees increased in Vietnam, Malaysia, and China, a change of over 200 percent in the past 20 years. It is also important to note
Table 10. Growth Rate in the Number of Students in Tertiary Education(Per 100,000 Inhabitants).
1990-1995 1995-2000 2000-2005 2005-2009 2009-2010
Brunei Darussalam ... ... 12.79 11.65 (7.43)
Canada (8.79) (43.54) ... ... ...
Chile ... 20.46 32.79 23.76 11.02
China 22.95 29.02 99.51 33.19 5.33
Indonesia 30.61 26.74 9.56 23.65 1.79
Japan 36.02 0.64 0.78 (4.28) (0.97)
Korea, Rep. 20.31 33.83 4.10 (1.37) 1.13
Malaysia 42.16 83.26 12.84 ... ...
Mexico (1.44) 23.86 13.34 7.23 3.82
New Zealand 30.55 (0.28) 26.46 4.83 0.16
Peru (10.68) ... ... ... ...
Russian Federation (15.19) 35.40 37.30 4.20 ...
Thailand 17.25 41.28 16.16 (0.70) (0.26)
United States 0.30 (13.92) 22.07 6.42 5.81
Vietnam (1.10) 120.81 56.61 22.43 11.83
Source: The World Bank. (n.d.).World Bank Open Data. In The World Bank. Working for a world free of poverty. Retrieved November 1, 2013, from http://data.worldbank.org.
that Indonesia, Thailand, and Australia had an increase of 116.50, 93.18, and 90.56 percent, respectively. However, other economies are not lagging behind, for in two decades, the average change for all economies is around 88 percent.
Number of Students in Tertiary Education
The data in Table 10 are concerned with the number of students enrolled in the tertiary level per 100,000 inhabitants in a given academic year. This is computed in order to show the level of participation in tertiary education by showing the density of students in an economy’s population. One limitation of this indicator, however, is that it uses the economy’s total population rather than the school-age population. This may mask the true degree of participation of the youth in tertiary education (ISCED, 2011).

210
Taking a look at the growth rate, we can see that three economies—China, Malaysia, and Vietnam—experienced a surge in the number of enrollees in tertiary education. For China, the rate was at its peak between 2000 and 2005 at 99.51. For Malaysia, the surge happened between 1990 and 2000, with growth rates of 42.16 and 83.26, then falling to 12.84 percent between 2000 and 2005. For Vietnam, the growth rate jumped from a disappointing -1.10 percent from 1990 to 1995 to a staggering 120 percent from the period 1995-2000. As for Canada, it generally experienced declining numbers in the participation in tertiary education, bottoming at -43 percent from 1995 to 2000. As for other economies such as Thailand, Russia, Mexico, and Chile, they had a surge in the number of tertiary students between 1995 and 2005 before experiencing a slowdown in growth in 2005-2010. Finally, Indonesia, Korea, and New Zealand experienced the highest growth from the period 1990-2000.
Figure 3a. Growth Rates of School Age Population (Official Entrance Age).
Source: The World Bank. (n.d.). World Bank Open Data. In The World Bank. Working for a world free of poverty. Retrieved November 1, 2013, from http://data.worldbank.org.
School Age Population
School age population is the defined by the UNESCO Institute for Statistics (2012) as the population of the age group that corresponds to a level of education, as per the theoretical entrance age and duration. This indicator is usually analyzed with the Total Number of Enrollees within a given particular level. In Figure 3a, 3b, and 3c, we see that that the school age population for most of the economies exhibited a downward trend from 1991 to 2000. However, during this period, Brunei, Hongkong, Papua New Guinea, and Korea experienced growth in the school age population at a rate between 2 and 4 percent. Moreover, Japan managed to experience a slower rate of decline in the school age population, from at least -3 thorough between 1993 and 1994 to around -1 percent in the year 2000.
Looking at the years 2000-2010, most of the economies that experienced a decline during the 1990s managed a rebound. New Zealand, from a growth rate of almost zero in 2000, reached a peak of at least 3 thorough in 2012. Russia, experienced a

211
sharp decline during the year 2000 with a staggering -11 percent; yet the economy managed to recover at the end of 2012, experiencing a 3.7 percent rate of growth. Vietnam, reached a bottom of -8.23 percent in the year 2003 but managed to get a positive growth rate of 1.43 percent by the end of 2011.
Furthermore, China had a negative rate for 12 years, from 1997 to 2009, bottoming at -8.42 percent in the year 2000. By the end of 2010, however, China finally experienced 0.49 percent growth in the school age population. Hong Kong basically experienced a shrinkage in the school age population from 1991 to 2012, only exhibiting growth between 1997 and 2000, with a peak of 2.75 percent in 1998 and a trough of -7.4 percent in 2006.
Figure 3b. Growth Rates of School Age Population (Official Entrance Age).
Source: The World Bank. (n.d.).World Bank Open Data. In The World Bank. Working for a world free of poverty. Retrieved November 1, 2013, from http://data.worldbank.org.
Figure 3c. Growth Rates of School Age Population (Official Entrance Age).
Source: The World Bank. (n.d.).World Bank Open Data. In The World Bank. Working for a world free of poverty. Retrieved November 1, 2013, from http://data.worldbank.org.

212
However, amid this erratic population changes in most of the economies, Mexico and Thailand exhibited a rather stable rate of change throughout the period, fluctuating around the average of 0.31 and -1.35 percent.
Outbound Mobility Ratio (%)
The outbound mobility ratio (OMR) is defined as the number of students studying abroad, given as a percentage of the total tertiary enrollment in a particular economy
Table 11. Outbound Mobility Ratios.
Source: The World Bank. (n.d.). World Bank Open Data. In The World Bank. Working for a world free of poverty. Retrieved November 1, 2013, from http://data.worldbank.org.*neg - Magnitude is negligible. - No data available.
(ISCED, 2011). A high outbound mobility ratio indicates that a lot students go abroad to take up tertiary education, rather than enroll in local institutions.
It may be seen in Table 11 that from the period 1999-2010, two economies, Brunei and Hong Kong, exhibited a high outbound mobility ratio. Brunei has an OMR of 56 percent as of 1999. While this continued to decrease over the years, reaching a bottom at 39 percent in 2003, it started to increase once again after 2006, almost reaching its 1999 level at 55 percent in 2010. Hong Kong also experience a relatively high number of outgoing students, although it started to slow down in the past decade. In 7 years, the OMR of Hong Kong decreased by almost 50 percent, with ratio of 23 percent in 2003 to 12 percent in 2010.
Most of the economies such as Australia, Canada, Chile, China, Indonesia, Japan, Mexico, Peru, and Thailand did not experience any drastic changes in OMR, maintaining well below the 2 percent level. When closely observed, some economies

213
exhibited a slight decline in their OMR. Indonesia decreased from 0.8 to 0.6 percent, Chile from 1.01 to 0.91 percent, Japan from 1.48 to 1.05 percent, Thailand from 1.10 to 1.08 percent, and China from 1.92 to 1.82 percent.
Looking at Malaysia, the OMR was slashed by around 50 percent in the past decade, from an OMR of 10.44 percent in 1999 to 5.14 percent in 2010. New Zealand also experienced a drop in OMR from a peak of 3.4 to 1.7 percent by the end of 2010. On the other hand, Vietnam (1 to 2.35 percent ) and Korea (2.4 to 3.8 percent) observed an increase in OMR.
School Life Expectancy
Table 12. School Life Expectancy (Years). Primary to Tertiary. Total.
WDI Economy VW 1990 1995 2000 2005 2009 2010
Australia ... 18.82 20.29 20.01 19.11 19.49
Brunei Darussalam 12.46 (1992)
12.79 (1994) 13.77 14.84 15.10 15.03
Canada 16.67 16.75 (1993)
16.85 (1995)
16.87 (1996)
15.88(1999)
15.89 (2000)
Chile 13.05 (1991)
11.84 (1993) 12.94 14.06 14.72 14.95
China 8.94 9.20 9.35 (2001)
10.96 (2006) 11.57 11.70
Hong Kong SAR, China ... ... ... 13.66 15.53 15.50
Indonesia 9.90 9.93 10.30 11.21 12.63 12.86
Japan 13.34 14.23 14.64 14.99 15.21 15.30
Korea, Rep. 13.72 14.73 15.98 16.48 16.99 17.16
Malaysia 9.75 10.23 11.95 12.60 ... ...
Mexico 10.93 11.06 12.00 12.88 13.61 13.74
New Zealand 14.48 16.85 17.43 19.17 20.18 19.67
Papua New Guinea ... 5.18 5.89 (1998) ... ... ...
Peru 12.09 12.39 13.91 (1991) 12.93 12.95
(2006) 13.21
Philippines 10.75 11.13 (1996)
11.39 (2001) 11.60 11.30 11.28
(2009)
Russian Federation 12.69 11.70 12.10 (1990) 13.69 14.26 13.98
(2009)
Singapore ... ... ... ... ... ...
Thailand 8.40 9.55 11.54 (2001) 12.30 12.30 13.08387
(2009)
United States 15.31 15.89 15.43 16.07 16.58 16.76
Vietnam 7.90 10.12 (1998) 10.40 11.06 11.58 11.92
Source: The World Bank. (n.d.). World Bank Open Data. In The World Bank. Working for a world free of poverty. Retrieved November 1, 2013, from http://data.worldbank.org.

214
School life expectancy (primary to tertiary) is defined as the number of years that a student can expect to spend from enrolling in primary education to graduating from tertiary education (UNESCO, 2011). A high SLE means that there is a greater chance that children will spend more years in educational institutions and that there is a high rate of retention in the education system. A word of caution, however, is that SLE does not give the level of completion because it does not take into account repetition. Furthermore, the number of years in school maybe negatively affected by the magnitude of children who do not go to school, since it is based on the level of participation. Another limitation of this indicator is that it is not strictly comparable because the length of schooling and the quality of education differ between nations.
Looking at Table 12, it is observed that SLE increased from 1990 to 2010, indicating that either there is a higher level of participation or an increase in the retention rate of educational systems. Vietnam’s SLE jumped by 4 years in two decades from 7.90 to 11.92 years. Thailand also experienced an increase in SLE by 4.7 years, from 8.40 to 13.08. New Zealand, has experienced the largest increase of 5.27 years, from 14.48 to 19.67. Among all those observed, Canada is the only economy that experienced a decrease in SLE, from 16.67 in 1990 to 15.89 in 2000.
Australia maintained the highest level of SLE in the past 20 years, increasing from 18.8 years in 1995 to 20 years in 2005, before dropping down to 19.5 years in 2010. The United States, with little change in SLE, maintained an average of 16 years, while New Zealand has an average of 18 years. Although we only have two data points for Papua New Guinea, it had the lowest SLE in 2000, clocking only at 5.89 years, while other nations have an SLE of at least 10 years.
V. Issues in Education and Training and Development Strategies in the Philippines
The educational sector of the Philippines has been expanding in terms of the enrolment rates and the number of educational institutions at all levels of education. However, the progress of the economy in achieving universal primary education under the Millennium Development Goal (MDG) has been lagging behind despite this expansion, and the probability of attaining the target by 2015 has remained low. Hence, the targets in the Philippine Development Plan (PDP) 2011-2016 have been set to achieve universal access (100 percent participation or net enrolment) in basic education, at least 93 percent participation or net enrolment rate in secondary education, and an increased enrolment and graduation rate in higher education and Technical and Vocational Education and Training (TVET), all by 2016 (National Economic Development Authority [NEDA], 2011).
This section will look at the issues that have confronted the Philippine education sector for years. These issues are also the thrusts of the education sector and serve as the motivations for its reform. We will highlight the development strategies that the Philippine government has crafted in order to attain the various dimensions of the goal of improved education by 2016.

215
Amidst a very dynamic environment, aside from addressing domestic issues the Philippine education sector is forced to deal with the pressures of globalization and the internationalization of education. Educational institutions at all levels of education are pressured to alter ways they respond to their mission of developing the human resource pool of the nation. Tullao (2004) and Johanson (2001) identify four themes that have significantly altered the delivery of educational institutions, particularly higher education institutions (HEIs): quality and excellence (provision of education that meets international standards), relevance and responsiveness (generation and diffusion of knowledge in disciplines that are relevant to both the domestic and international environment), access and equity (broadening the participation in education particularly for deserving and qualified but underprivileged individuals), and efficiency and effectiveness (optimization of social, institutional, and individual returns to education).
5.1 Quality and Excellence
The increasing number of HEIs in the economy and the increasing spectrum of program offerings must be accompanied by the pursuit of quality and excellence if the economy will reap the benefits of an ASEAN Economic Community (AEC) starting 2015. Quality and excellence are both a thrust and an end in itself because given an internationalized labor force and a greater opportunity for overseas employment, the Filipino workforce needs to meet international standards in order to be competitive globally. In addition, the competitiveness of domestic industries will rely on the quality of graduates of secondary and tertiary education.
Table 13. Teacher-Pupil Ratio for Basic and Secondary Education.
Education LevelSY 2009-2010 SY 2010-2011
Enrollment Teacher TPR Enrollment Teacher TPR
Basic 12,789,110 358,164 1:36 13,003,238 361,567 1:36
Secondary 5,416,718 142,994 1:38 5,530,420 146,255 1:38
Source: DepEd, PSY, (2011), NSCB
Table 14. Number of Elementary and Secondary Textbooks.
Year No. of textbooks Year No. of textbooks
2001 9,628,500 2006-2007 33,648,847
2002 38,521,930 2008 17,182,594
2003 36,015,207 2009 16,313,231
2004 13,339,079 2010 5,732,505
2005 2,527,681
Source: Instructional Materials council Secretariat, DepEd, PSY, (2011), NSCB.

216
In order to gauge the progress of the pursuit for quality and excellence, we will look at the number of teachers and educational inputs, cohort survival rates, and national achievement tests scores for basic and secondary education. For HEIs, Tullao (2004) lists measures that allow us to gauge the development of the Philippine human resource pool: passing rates in licensure examinations and the availability of accredited programs offered by HEIs.
Number of Teachers and Textbooks and the Cohort Survival Rate
Looking at the resources of basic and secondary education, the number of schools has increased over the last decade’s school years. Looking at the spread of teachers (Table 13) and the number of textbooks procured (Table 14), it may be inferred that the resources allocated for basic and secondary education are spread thinly. The 1:36 teacher-pupil ratio (TPR) in basic education and the 1:38 TPR in secondary imply that teachers are
Table 15. Cohort Survival Rate in Public and Private Elementary and Secondary Schools.
Region Elementary Secondary
2007-08 2008-09 2007-08 2008-09
Philippines 75.26 75.39 79.91 79.73
National Capital Region 87.84 87.51 83.76 84.76
Cordillera Administrative Region 73.62 77.37 78.98 86.17
I Ilocos Region 83.91 86.70 86.53 85.05
II Cagayan Valley 78.68 81.58 81.41 83.05
III Central Luzon 82.81 83.02 81.26 81.24
IV-A CALABARZON 81.38 83.77 85.05 85.41
IV-B MIMAROPA 70.10 73.92 76.90 77.55
V Bicol Region 76.44 76.33 77.77 76.32
VI Western Visayas 74.77 75.47 81.06 80.18
VII Central Visayas 81.02 81.39 76.78 77.55
VIII Eastern Visayas 71.06 73.16 73.68 73.98
IX Western Mindanao 61.98 61.12 73.18 71.73
X Northern Mindanao 70.75 70.80 76.25 73.75
XI Southern Mindanao 67.33 64.55 76.09 76.94
XII Central Mindanao 67.30 67.84 76.01 72.90
XIII Caraga 73.93 73.53 76.06 76.06
Autonomous Region in Muslim Mindanao
45.47 40.75 73.53 69.80
Source: Department of Education (DepEd), Philippine Statistical Yearbook [PSY], (2011), published by the National Statistical Coordination Board (NSCB).

217
an improvement from SY 1999-2000 survival rate, which was 69.29 percent for elementary and 71.02 percent for secondary (PSY, 2011). However, the development of the cohort survival rate has largely fluctuated over the past decade. The highest survival rate for elementary was recorded for SY 2008-2009 and the average for the SYs 1999-2009 was estimated at 71.33 percent. The highest survival rate for secondary was also for SY 2008-2009, and the average for SYs 1999-2000 was 75.43 percent.
National Achievement Test Scores
Looking at the scores of students in the National Achievement Test (NAT) (Table 16) conducted by the National Educational Testing and Research Center of the Department of Education (DepEd), it may be seen that mean percentage scores have been alarmingly low for SY 2009-2010 and SY 2010-2011. Grade 6 scores are generally higher than 4th year high school scores, and it appears that English has the highest MPS for both education levels, while Science is the lowest. Nonetheless, for Grade 6, the MPS in the three subject areas did not even reach 70 percent for the time period, and for 4th year high school, the MPS in the three subject areas did not even exceed 50 percent, which may point toward inefficiencies or shortcomings in the quality of and the way basic and secondary education levels are delivered in the economy.
handling very large classes, especially in the denser regions of the economy. There may be a misallocation of teachers across regions since there are some with 1:<30 TPR, whereas there are 1:>30 TPR. Looking at the number of elementary and secondary textbooks procured (Table 14), it may be seen that the procurement fluctuated over the previous decade. In general, the number of textbooks may be sufficient for most of the period, but years like 2005 and 2010, which have very low numbers of procurement, may not have been enough to the number of enrollees during those years (there were only 2,527,681 procured in 2005 and 5,732,505 in 2010).
Table 15 shows the cohort survival rate for both elementary and secondary grade levels for the school years (SY) 2007-2008 and 2008-2009. As may be seen, the SY 2008-2009 national survival rate for elementary was 75.39 percent and for secondary was 79.73 percent, which imply relatively low completion rates. This is certainly
Table 16. National Achievement Test Mean Percentage Scores for Grade 6 and 4th Year High School Students for SY 2009-2010 and SY 2010-2011.
Source: National Educational Testing and Research Center, DepEd, PSY (2011), NSCB.

218
Table 17. Number of Examinees and Overall Passing Rate per Discipline for All Schools.
Source: PRC – Educational Statistics Task Force, Commission on Higher Education (CHED).

219
Table 18. Number of Examinees and Overall Passing Rate per Discipline for SUCs.
Source: PRC – Educational Statistics Task Force, Commission on Higher Education (CHED).

220
Passing in Licensure Examinations
In terms of the professional licensure examination passing rates (see Table 17 for all schools and Table 18 for SUCs only), the national passing rate for various disciplines have remained low. For all schools, the passing rate has been 36.3 percent for 408,456 takers in 2009 and 33.8 percent for 418,924 takers in 2010. For SUCs, the passing rate has been 35.2 percent for 100,264 takers in 2009 and 32.4 percent for 105,472 takers in 2010. This is the national rate for all disciplines. The occupation with the largest number of takers is the nursing profession particularly for all schools, with 175,288 takers but with a low passing rate of 38.4 percent. Elementary and Secondary Teachers are also very popular professions among all schools, with 71,342 and 64,509 takers, respectively, but alarmingly low passing rates of 17.7 and 24.8 percent in 2010.
Table 19. Number of Persons Assessed and Certification Rate of TVET Graduatesin Priority Industries.
Sector2009 2010
Assessed Certification Rate Assessed Certification
Rate
Philippines 836,131 83 716.220 83
Agriculture and Fishery
11,420 93 13,688 70
Automotive 63,344 78 65,575 76
Construction 45,290 83 36,469 83
Electronics 34,907 70 23,455 67
Footwear and Leather Goods
25 100 - -
Furniture - - 14 100
Garments 7,792 80 6,921 80
Health 160,586 93 164,240 91
HVAC-R 9,162 83 7,228 87
ICT 188,736 72 60,884 53
Maritime 60,024 96 77,124 97
Metals and Engineering
58,275 81 41,321 81
Processed Foods
11,180 92 9,100 93
Tourism 185,390 84 210,201 85
Source: Technical Education and Skills Development Authority (TESDA), PSY, (2011), NSCB.

221
These elementary and secondary teachers account for the largest proportion of takers from SUCs with 31,300 and 37,072 takers, with passing rates slightly higher than the national averages 22.32 and 24.59 percent, respectively. These low passing rates may indicate good standards on the part of the test administrators but also point toward the lack of quality in teacher education institutions.
Looking at the Technical and Vocational Education and Training (TVET) graduates that were certified (see Table 19), the national certification rate is a lot higher than the national professional licensure examination passing rate with 83 percent out of 836,131 and 716,220 takers for 2009 and 2010, respectively. The highest number of takers for the two years come from Tourism, with 185,390 assessed (84 percent certification rate) in 2009 and 210,201 (85 percent certification rate) in 2010, followed by Health with 160,586 assessed (93 percent certification rate) in 2009 and 164,240 (91 percent certification rate) in 2010, ICT with 188,736 assessed (72 percent certification rate) 2009 and 60,884 (53 percent certification rate) in 2010. Other sectors with a large amount of takers are maritime, automotive, metals and engineering, construction, and electronics. In 2011, the number of assessed persons increased to 835,572 with an average certification rate of 84.21 percent (TESDA-Labor Market Information Division [TESDA-LMID], 2014). This increased to 1,033,681 assessed persons in 2012 and 1,055,576, with accompanying rates of certification 86.15 and 88.67 percent. In these years, TVET has experienced an increase in quality and excellence through the increase in certification rates.
Accreditation of Programs
Another dimension in measuring the quality of education is the features of educational inputs particularly qualification of teachers, availability of laboratories and equipment, research infrastructure, and quality of program offerings. The quality of these inputs is summarized by the level of accreditation granted by external agencies on programs offered by HEIs. To date, there are only 21.54 percent of the more than 2,247 HEIs that have some form of accreditation granted by the major accrediting agencies. Some 1,393 programs in public HEIs have some form of accreditation, while there are 1,392 programs in private HEIs. In addition, given the 130,118 faculty members in these HEIs, only 12.66 percent possess doctoral degrees, while those with master’s degrees account for 41.44 percent of the total faculty members and almost half are bachelor degree holders. Because of this feature, research and graduate education is underdeveloped in many of the economy’s HEIs with very few professors get published in local and international journals (Tullao, 2010).
The SUCs, on the other hand, are likewise plagued with many issues pertaining to the quality of delivery, the relevance of their program graduates, and both internal and external efficiency. Manasan (2013) identifies two issues: the program offerings of SUCs vis-à-vis their mandates and the very likely occurrence of program duplication because of the said mandates. Each SUC is assigned a “core mandate” indicating the specialization that an SUC should have in accordance with its charter. These core mandates are specified in various republic acts, which state the integration of an SUC or an SUC’s absorption of a college and the courses/subjects to be offered by each school in the group. The specialization stated in the mandate of each SUC varies

222
with the needs of their region, as well as the nature of the educational institution (university, polytechnic, or technical and vocational). These core mandates, along with the development of the laws governing these mandates, tend to be very broad; at the same time, they allow SUCs to offer programs outside of their mandate, so there have been many SUCs with an increasing number of program offerings that are outside their mandate. This would not pose a problem, but because in some SUCs, enrollment in these programs is increasing, and tends to be higher than the enrollment in core programs, the quality and the relevance of their graduates may suffer. Especially since core programs are set based on the needs of their region, producing too much graduates in noncore programs may impair the potential regional impact of their graduates and the intended relevance of these SUCs as well.
There is also a tendency for program duplication because the core mandates of SUCs are very broad. Program duplication occurs when an SUC offers programs offered by neighboring SUCs and PHEIs. Manasan (2013) finds that the average program duplication rate for SUCs in Region IV-A, VI, VII, and XI varies between 79-82 percent in terms of the number of program offerings, and 93-95 percent based on total enrolment. This incidence of program duplication would pose as a problem because it tends to increase the per-student cost of SUCs, and because the tuition fees charged by SUCs are lower than PHEIs, they tend to crowd out PHEIs (Manasan, 2013).
5.2 Relevance and Responsiveness
Aside from the increasing pressures of internationalization, higher education needs to stay relevant and responsive to the human resource requirements of domestic industries (Tullao, 2004). Colleges and universities serve as the training centers for an economy’s workforce and should offer instructional programs that are flexible and responsive to the changes in the economy. In this section, we will look at the higher education enrollees and graduates by discipline, as well as TVET scholars in disciplines and the employability of graduates from both HEIs and TVET.
Enrollees and Graduates in Priority and Nonpriority Programs
Looking at Table 20, it may be seen that total enrolment has been increasing. The largest number of enrollees is in business administration and related courses, with about 727,018 enrollees for the SY 2009-2010. Other disciplines with a large number of enrollees are Medical and Allied Courses, which decreased from 547,595 in SY 2007-2008 to 440,266 in SY 2009-2010; Education and Teacher Training, which decreased from 370,441 in SY 2007-2008 to 249,634 in SY 2009-2010; Engineering and Technology with about 344,662 enrollees in SY 2009-2010; Information Technology Related Disciplines with about 348,462 enrollees in SY 2009-2010; and Religion and Theology with about 117,299 enrollees in SY 2009-2010.
Looking at Table 21, it may be inferred that the number of graduates is significantly lower than the year-on-year number of enrollees. Total enrollees in SY 2009-2010 amounted to 2,770,965, whereas graduates only amounted to 469,654. The largest number of graduates comes from Medical and Allied Courses, 128,050 graduates

223
Table 20. Number of Higher Education Enrollees by Discipline.
Note: This includes post graduate enrollees.Source: CHED, PSY, (2011), NSCB.
Table 21. Number of Higher Education Graduates by Discipline.
Note: This includes post graduate enrollees.Source: CHED, PSY, (2011), NSCB.

224
in SY 2009-2010, followed by Business Administration and Related Courses with 107,272; Education and Teacher Training with 56,295; Engineering and Technology with 48,448; and Information Technology Related Disciplines with 45,830.
In Orbeta and Abrigo’s (2013) assessment of TESDA scholarship programs, they find that the largest percentage of TVET scholars is enrolled in Information and Communication Technology Courses, followed by Health and Social Courses, Metals and Engineering, and Tourism with Health and Restaurant Management.
We observe the concentration of enrollment and graduates in higher education in the fields of business, medical, education, ICT, and engineering courses. In terms of technical education, there is large concentration in tourism, ICT, and medical programs.
National Development Priorities
Examining NEDA’s (2011) PDP 2011-2016, the primary goal for the economy’s industrial and services sectors is enhancing global competitiveness and innovation. These sectors are aiming for quality employment and higher gross value added. In order to achieve this goal, they need to improve the business environment, increase productivity, and protect consumer welfare. In particular, they seek to promote investment in job-generating areas such as Tourism, IT-BPO, Electronics, Mining, Housing, Agribusiness/Forest-Based Industries, Logistics, Shipbuilding, and Infrastructure. The plan also identifies nurturing industries with high potential for domestic and export market demand, job generation, utilization of local talents and creative, and the maximization of the value chain. Such industries include homestyle products, wearables, motor vehicle parts and components, garments, and construction.
Employability of Graduates
Among the indicators of relevance and responsiveness is the employability of graduates, which is the hardest to monitor and quantify. This requires the conduct of graduate tracer studies especially on the part of HEIs. Due to time and resource constraints, this study must be updated when information on the employability of HEIs graduates are made available. On the other hand, the employment rates of TVET graduates have been registered in the 2008 Impact Evaluation Survey and have been documented by Orbeta and Abrigo (2013) in their assessment of the Technical Education and Skills Development Authority (TESDA) scholarship programs, Private Education Student Financial Assistance (PESFA), and Training for Work Scholarship Program (TWSP), which will also be discussed briefly in the access and equity part of this section.
Orbeta and Abrigo (2013) find that the employment rate for all TVET graduates, defined as whether or not the graduate has landed a first job after training, was 34.2 percent (Table 8, p. 23 of Orbeta and Abrigo, 2013), which is relatively low. Even the employment rate for their succeeding jobs is low, which is 44.9 percent for all TVET graduates. In addition, the time it takes for a third of TVET graduates to find a job may be less than one month, but the average number of months it takes for most graduates to find a job is 5.3 months (Table 9, p. 24 of Orbeta and Abrigo, 2013). They
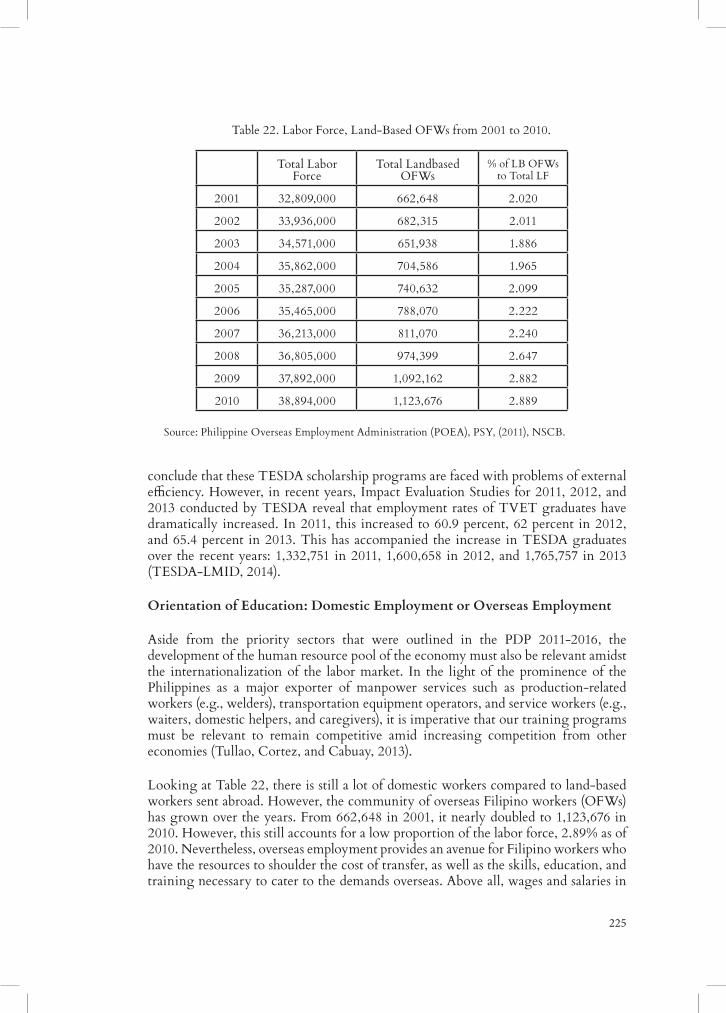
225
conclude that these TESDA scholarship programs are faced with problems of external efficiency. However, in recent years, Impact Evaluation Studies for 2011, 2012, and 2013 conducted by TESDA reveal that employment rates of TVET graduates have dramatically increased. In 2011, this increased to 60.9 percent, 62 percent in 2012, and 65.4 percent in 2013. This has accompanied the increase in TESDA graduates over the recent years: 1,332,751 in 2011, 1,600,658 in 2012, and 1,765,757 in 2013 (TESDA-LMID, 2014).
Orientation of Education: Domestic Employment or Overseas Employment
Aside from the priority sectors that were outlined in the PDP 2011-2016, the development of the human resource pool of the economy must also be relevant amidst the internationalization of the labor market. In the light of the prominence of the Philippines as a major exporter of manpower services such as production-related workers (e.g., welders), transportation equipment operators, and service workers (e.g., waiters, domestic helpers, and caregivers), it is imperative that our training programs must be relevant to remain competitive amid increasing competition from other economies (Tullao, Cortez, and Cabuay, 2013).
Looking at Table 22, there is still a lot of domestic workers compared to land-based workers sent abroad. However, the community of overseas Filipino workers (OFWs) has grown over the years. From 662,648 in 2001, it nearly doubled to 1,123,676 in 2010. However, this still accounts for a low proportion of the labor force, 2.89% as of 2010. Nevertheless, overseas employment provides an avenue for Filipino workers who have the resources to shoulder the cost of transfer, as well as the skills, education, and training necessary to cater to the demands overseas. Above all, wages and salaries in
Table 22. Labor Force, Land-Based OFWs from 2001 to 2010.
Total Labor Force
Total Landbased OFWs
% of LB OFWs to Total LF
2001 32,809,000 662,648 2.020
2002 33,936,000 682,315 2.011
2003 34,571,000 651,938 1.886
2004 35,862,000 704,586 1.965
2005 35,287,000 740,632 2.099
2006 35,465,000 788,070 2.222
2007 36,213,000 811,070 2.240
2008 36,805,000 974,399 2.647
2009 37,892,000 1,092,162 2.882
2010 38,894,000 1,123,676 2.889
Source: Philippine Overseas Employment Administration (POEA), PSY, (2011), NSCB.

226
other economies are significantly higher than those in the Philippines, so the economy fully benefits from the remittance-sending behavior of OFWs (e.g., smoothened consumption, improved investment and entrepreneurial behavior, investment in education of migrant beneficiaries). In order to remain competitive globally, the education given to the Filipino worker must remain relevant and highly responsive in order to cater to the demands of an internationalizing workplace, as well as a more globally integrated workforce.
5.3 Access and Equity
Aside from the thrusts of quality and excellence, and relevance and responsiveness, educational institutions have the responsibility to contribute toward a more equitable society particularly by making sure that every individual has access to education (Tullao, 2004), which is the key to closing the income gap. In this sense, educational institutions must open opportunities to those that are competent, however underprivileged, by giving them scholarships. At the same time, alternatives must be available for individuals that may lack the competency for formal tertiary education. In order to gauge the progress of the pursuit for access and equity, we will look at the gross enrolment and net participation rates for basic and secondary levels of education, and we will look at scholarship programs for higher education as well as TVET as an alternative mode of delivery, particularly the penetration of the two TESDA scholarship programs reviewed by Orbeta and Abrigo (2013), TSWP and PESFA.
Enrollment and Net Participation Rate in Public and Private Schools inPreschool, Elementary, and Secondary Schools
Looking at Table 23, it may be seen that the levels of total enrollment for preschool, elementary, and secondary schools are increasing, especially those in public schools. On one hand, this reflects that there is indeed an improvement when it comes to increasing the access of households to education. But looking at the net participation rate for elementary and secondary for the entire economy (Table 24), it may be seen that despite increasing numbers of enrollees, this still does not cover nearly the entire schooling age population, as what is intended in the MDG on universal primary education. Net participation rate for elementary was 85.12 percent and secondary was 60.74 percent for SY 2008-2009. In addition, many regions have net participation
Table 23. Enrollment in Government and Private Schools in Preschool, Elementary, and Secondary Schools.
Source: DepEd, PSY (2011), NSCB.

227
rates that are significantly lower than the national average. This goes with the issue on quality and excellence wherein there is a very low cohort survival rate for both primary and secondary levels of education (as reported in Table 15).
As may be seen previously in Table 20, the total enrolment for tertiary level education has increased as well, which is indicative of improved access for individuals. But going back once more to the level of tertiary graduates (Table 21), though the number of graduates is increasing, the gap between enrollees and graduates is still very large.
Financial Assistance Programs
We now look at the available financing programs that aim to improve individuals’ access to tertiary education. Table 25 summarizes the number of beneficiaries and the
Table 24. Net Participation Rate in Public and Private Elementary and Secondary Schools.
Region Elementary Secondary
2007-2008 2008-2009 2007-2008 2008-2009
Philippines 84.84 85.12 60.26 60.74
National Capital Region 94.42 93.69 80.16 80.79
Cordillera Administrative Region 81.50 81.93 57.04 57.14
I Ilocos Region 83.14 82.85 67.42 68.22
II Cagayan Valley 77.53 76.23 59.47 58.34
III Central Luzon 91.37 90.93 70.78 71.24
IV-A CALABARZON 94.02 94.10 73.86 74.89
IV-B MIMAROPA 84.07 85.42 59.28 59.67
V Bicol Region 85.41 85.07 55.97 55.24
VI Western Visayas 75.44 74.93 53.83 53.98
VII Central Visayas 80.28 81.38 54.57 55.49
VIII Eastern Visayas 79.19 80.33 51.49 53.28
IX Western Mindanao 78.99 79.25 50.18 49.28
X Northern Mindanao 80.60 81.23 51.70 50.67
XI Southern Mindanao 77.38 78.00 49.12 48.61
XII Central Mindanao 78.65 80.12 50.62 51.80
XIII Caraga 78.69 7639 49.85 51.09
Autonomous Region in Muslim Mindanao
94.01 99.85 34.58 37.98
Source: DepEd, PSY (2011), NSCB.
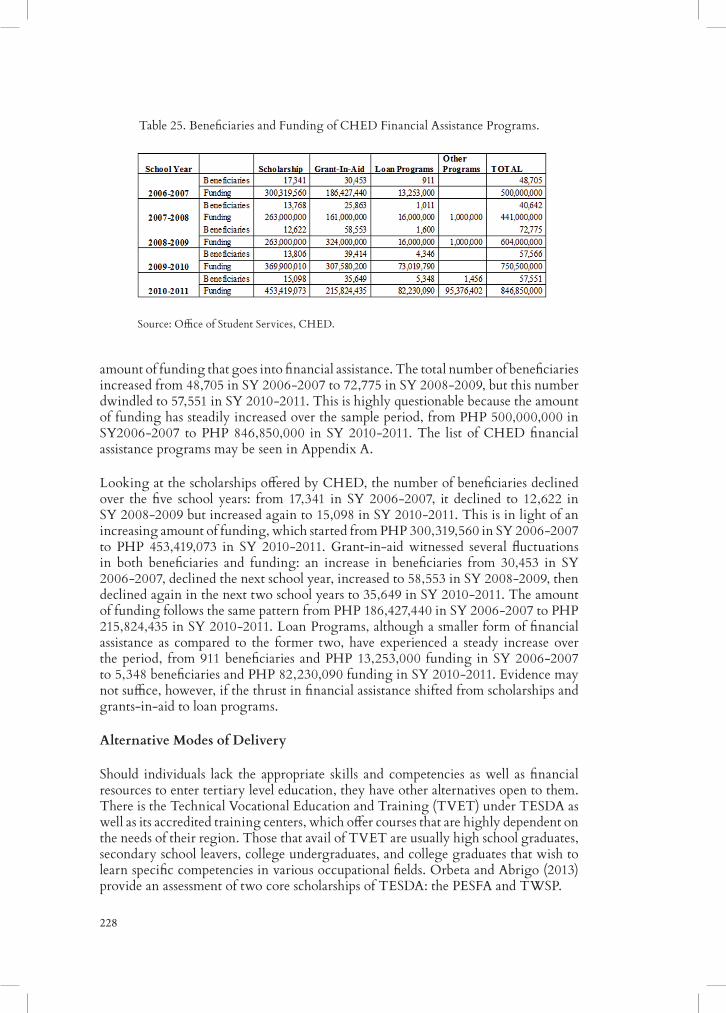
228
Table 25. Beneficiaries and Funding of CHED Financial Assistance Programs.
Source: Office of Student Services, CHED.
amount of funding that goes into financial assistance. The total number of beneficiaries increased from 48,705 in SY 2006-2007 to 72,775 in SY 2008-2009, but this number dwindled to 57,551 in SY 2010-2011. This is highly questionable because the amount of funding has steadily increased over the sample period, from PHP 500,000,000 in SY2006-2007 to PHP 846,850,000 in SY 2010-2011. The list of CHED financial assistance programs may be seen in Appendix A.
Looking at the scholarships offered by CHED, the number of beneficiaries declined over the five school years: from 17,341 in SY 2006-2007, it declined to 12,622 in SY 2008-2009 but increased again to 15,098 in SY 2010-2011. This is in light of an increasing amount of funding, which started from PHP 300,319,560 in SY 2006-2007 to PHP 453,419,073 in SY 2010-2011. Grant-in-aid witnessed several fluctuations in both beneficiaries and funding: an increase in beneficiaries from 30,453 in SY 2006-2007, declined the next school year, increased to 58,553 in SY 2008-2009, then declined again in the next two school years to 35,649 in SY 2010-2011. The amount of funding follows the same pattern from PHP 186,427,440 in SY 2006-2007 to PHP 215,824,435 in SY 2010-2011. Loan Programs, although a smaller form of financial assistance as compared to the former two, have experienced a steady increase over the period, from 911 beneficiaries and PHP 13,253,000 funding in SY 2006-2007 to 5,348 beneficiaries and PHP 82,230,090 funding in SY 2010-2011. Evidence may not suffice, however, if the thrust in financial assistance shifted from scholarships and grants-in-aid to loan programs.
Alternative Modes of Delivery
Should individuals lack the appropriate skills and competencies as well as financial resources to enter tertiary level education, they have other alternatives open to them. There is the Technical Vocational Education and Training (TVET) under TESDA as well as its accredited training centers, which offer courses that are highly dependent on the needs of their region. Those that avail of TVET are usually high school graduates, secondary school leavers, college undergraduates, and college graduates that wish to learn specific competencies in various occupational fields. Orbeta and Abrigo (2013) provide an assessment of two core scholarships of TESDA: the PESFA and TWSP.

229
PESFA provides assistance for individuals aged 18 years old upon completion of training, with annual family income not more than PHP 120,000 and a high school graduate. It also gives allowances for daily needs and procurement of books. PESFA aims to improve equity and access to TVET and ensure immediate employment for individuals and seeks to encourage TVET investments and encourage technical vocational institutions to offer programs that are responsive to labor market demands (Orbeta and Abrigo, 2013). TWSP is more comprehensive in the sense that the only qualification for an individual to avail of the assistance is to be of working age (15 years old). Individuals that are displaced workers are given an income support fund equal to half of the daily minimum wage per training day, as well as a tool kit for their selected programs, and a free competency assessment. TWSP can be availed of more than once. TWSP aims to address structural unemployment and pump-prime the economy by focusing on training skills and competencies needed by existing occupations.
Looking at the 2005 and 2008 IES, Orbeta and Abrigo (2013; Table 2, p. 14) report that scholarship coverage has remained low, although it has increased from 4 percent of graduates in 2004 to 17 percent of graduates in 2008. Enrollees in TWSP have
Table 26. Budgetary Appropriation for the Philippine Education System by Level of Education and Agency (In Thousands).
Source: Department of Budget and Management (DBM), PSY, (2011), NSCB.
Level of Education – Government Agency
FY 2008 FY 2009 FY 2010
Total 162,179,821 181,474,735 195,851,074
Basic Education – DepEd
155,706,009 171,695,738 191,105,839
Higher Education – CHED
2,241,948 1,899,776 1,661,974
Technical/Vocational Education – TESDA
4,231,864 7,879,221 3,083,261
increased have increased significantly from 222,698 in 2006-2007 to 743,465 in 2009, whereas its graduates have also increased from 215,418 in 2006-2007 to 732,656 in 2009 (Orbeta and Abrigo, 2013; Table 4, p. 15). PESFA, on the other hand, faced decreasing enrollees, with 30,725 in 2006-2007 to 17,205 in 2009. The same occurred for their graduates, which decreased from 28,913 in 2006-2007 to 17,046 in 2009 (Orbeta and Abrigo, 2013; Table 4, p. 16). Despite the vast discrepancy between the two scholarship programs in terms of enrollment and graduation, there is a whole different story with regard to their efficiency. Overall enrollment in TVET reached 1,572,131 in 2011, 1,804,742 in 2012, and 1,943,589 in 2013 (TESDA-LMID, 2014).
230
5.4 Efficiency and Effectiveness
In light of educational institutions responding to the first three concerns, they are still subject to resource constraints. The issues of efficiency and effectiveness and the mode of financing education are closely tied to the other three issues because the outcomes in the three are what determine if the management of the three educational agencies has been truly efficient, most especially since education is accompanied by very large costs. We need to look at internal efficiency, that is, how the budget for education is appropriated among the agencies, projections for the budget of financial assistance programs, and the management of resources. We will also assess the external efficiency of the educational sector by looking at whether or not it has hit the targets that were laid out by the national government.
Budgetary Appropriation
Table 26 summarizes the budgetary appropriation for the Philippine education system. The total budget has grown from PHP 162 billion in 2008 to nearly PHP 196 billion in 2010. The largest budget goes to the DepEd, which governs basic education. This is followed by TESDA and CHED, respectively. As may be seen from the table, the budget of DepEd has grown from 2008 to 2010, whereas the budgets for both higher education and technical/vocation education have dwindled significantly to a portion of their appropriations in 2008.
On the Efficiency of Basic and Secondary Education
To be brief, in terms of internal efficiency, enrolment in basic and secondary education reached 13,934,172 and 6,806,079, respectively, which is significantly the highest it has been over the past decade (Table 23). But it is still way off in terms of achieving full participation especially in the Mindanao regions (Table 24). As of SY 2008-2009, only 85.12 percent of the elementary age is in school, and alarmingly, only 60 percent of the secondary education age is in school. These are national averages. Taking into consideration the regional participation rates, it may be inferred that there are large disparities in participation as there are several regions that have basic and secondary participation significantly lower than the national average. This may imply that though access has increased, the extent of penetration, the individuals that are able to enroll, is still very shallow.
At this point, it is worth noting that basic education has undoubtedly the largest share in the budgetary appropriation for education (Table 26). In terms of external efficiency, the cohort survival in both basic and secondary education has remained low at the national average (Table 15). As of SY 2008-2009, the cohort survival rate is 75.39 percent for basic education and 79.73 percent for secondary education. Secondary education has better survival rates than basic education in general. And it may be noted that survival rates for many regions in Luzon and Visayas are well above the national average; at the same time, Mindanao regions post the lowest survival rates, especially the ARMM wherein less than half the starting population of cohorts survive the entire grade level for basic education. Going back to the NAT scores posted in Table 16, it may be seen that the performance of both grade 6 and 4th year high school

231
students are noticeably low for SY 2010-2011. In the subject areas of mathematics, science, and English, the average score of grade 6 students is a little below 70 percent, whereas the average score of 4th year high school students does not even reach 50 percent for all three subject areas.
On the Efficiency of HEIs Particularly SUCs
In terms of the internal efficiency of HEIs, in general, looking back at the number of enrollees in priority sectors of the economy (Table 20), it may be seen that the number of enrollees have increased significantly, which indicates that access has been efficiently promoted. On the other hand, CHED financial assistance programs (Table 25) have decreased in terms of the number of beneficiaries, which may imply that the increase in enrollees may have been hampered. Looking at SUCs, Manasan (2013) finds quite a number of SUCs that offer programs outside of their core mandate, coupled with an increase in the enrollment of these programs. This may imply that the regional impact of these SUCs’ graduates may be shorthanded because their core mandates have been tailor-made for the needs of their region. Manasan (2013) also finds a large rate of program duplication between SUCs and their subsidiaries. This may serve as a problem because it raises the per-student cost of SUCs and becomes a misallocation of resources due to the lack of specialization among the SUC group. Having a large extent of the duplication of courses may spread human and professional resources too thinly and may possibly compromise the quality of their graduates.
Assessing the external efficiency of HEIs, we first look at the graduates in various disciplines (Table 21). It may be seen that the total number of graduates increased and that the graduates are specifically numerous in the disciplines that are highly relevant to the priority sectors identified in the PDP 2011-2016. Looking back at the number of professional licensure examination passers (Tables 17 and 18), it may be seen that the national passing rate was alarmingly low: the national average for all HEIs was 33.8 percent of takers in 2010, whereas the national average for SUCs is 32.4 percent. But looking at the occupations that are essential to the priority sectors identified in the PDP (e.g., aeronautical, agricultural, chemical, civil, electronics and communication, mechanical and mining engineering, marine logistics, accountancy), passing rates for licensure examinations are higher. In these essential occupations, it may be seen that the passing rates for SUCs are significantly higher as compared to PHEIs. Cuenca (2011) performed data envelopment analysis on 78 SUCs to determine their efficiency and found that around 65-85 percent of the SUCs are inefficient. Furthermore, Cuenca (2011) found that the number of inefficient SUCs grew in number in 2009. By calculating the Malmquist index, Cuenca (2011) finds further that these SUCs have very minimal productivity gains, although much of the improvement in their total factor productivity is attributed to technological change as opposed to change due to efficiency.
On the Efficiency of TVET Institutions
Looking at the internal efficiency of TVET institutions, it may be inferred that enrollment in TVET has increased especially in ICT and Tourism (Orbeta and Abrigo, 2013), which are both priority sectors identified in the PDP 2011-2016.

232
Furthermore, Orbeta and Abrigo (2013) find that with the help of PESFA and TWSP, enrollment in TVET has answered the call of access and equity, especially with increasing enrollment in TWSP albeit decreasing enrollment in PESFA. At the same time, TVET graduates have increased.
Looking at external efficiency, Table 19 shows that the certification rate for TVET graduates for all disciplines has been relatively high. On the other hand, Orbeta and Abrigo (2013) find that TVET institutions have failed to achieve good employment rates, especially TWSP, which primarily aims to link graduates with employment. At the same time, they were able to find that the utilization rate of their training—how much of what was taught to enrollees that were actually of any use in the workplace—appeared to be very low. Orbeta and Abrigo conclude that though TVET institutions have good internal efficiency, they have a hard time achieving their objectives in terms of external efficiency. However, TESDA-LMID reveals that in recent years, certification rates have dramatically improved, and the IES 2011, 2012, and 2013 reveal that the employment rate of TVET graduates has increased in recent years, implying that TVET is now beginning to exploit niches and improve efficiency.
5.5 Development Strategies
The MDG for education aims to attain universal primary education and eventually secondary education as well. This entails full participation rates for all regions. However, the progress toward this MDG is lagging, and the economy is way off before it can attain this goal.
The PDP 2011-2016 outlines priority sectors that are key to the development and progress of the economy. These key sectors include Tourism, IT-BPO, Electronics, Mining, Housing, Agribusiness/Forest-Based Industries, Logistics, Shipbuilding, and Infrastructure.
In order to attain these goals, a set of guidelines and strategies must be followed.
To ensure quality and excellence, there must be a bridge between secondary and tertiary levels of education. Curricular programs need to be updated and upgraded to fit the growing needs and standards of the international community. At the same time, there is a need to maintain the strength and reliability of quality assurance and systems accreditation, monitoring, and evaluation. At the same time, the quality and productivity of resources, teachers, classrooms, and textbooks, must be upgraded.
To ensure relevance and responsiveness, similarly to ensuring quality and excellence, curricular programs must be updated and upgraded to fit not only the standards of the international community but also that of the local industries. This entails gearing skills and training in scholarship programs to focus on technical education and skills development that support industries identified in the PDP 2011-2016. For higher education, there is a need to further strengthen the research capability of HEIs and promote dialogue and linkages between the academe and the industries. The use of ICT should be further reinforced in the curriculum to ensure the adaptability of graduates to the changing landscapes of the labor market.

233
To ensure access and equity, student assistance programs need to be expanded further to include more beneficiaries and, as mentioned previously, should be geared toward the promotion of the economy’s priority sectors. But at the same time, existing financial assistance programs need to be re-examined for their objectives, their market, as well as the quality of the resources used in producing their graduates. At the same time, because of differences in competencies and purchasing power among individuals, there need to be alternatives to formal higher education through the promotion and expansion of TVET programs. Although it is the national government that should shoulder most of these subsidies, support from LGUs are much needed, especially since SUC scholars in the right disciplines are essential to developing regional industries and specializations.
To ensure efficiency and effectiveness, stronger quality assurance is needed especially in the resources used in producing basic and secondary education graduates. At the tertiary level, there is a need to rationalize the program offerings of all HEIs, especially in SUCs and their subsidiaries, to avoid program duplication. SUCs must be encouraged to be innovative in generating revenues and should avoid offering programs that are outside their mandate; rather, they should coordinate closely with their respective LGUs to ensure that resources are not misallocated and that graduate degrees produced are relevant to their region. Lastly, there is a need to rationalize tuition fees especially in SUCs to avoid over spending on individuals that take courses that have little social impact or those that will eventually emigrate; conversely, tuition fees should be subsidized further if the degree has high social impact or is relevant to one of the economy’s priority sectors.
VI. Human Resource Development and Inclusive Growth: Lessons from APEC Economies
6.1. Lessons on Improving Quality of Education and the Role of the Government
Lessons from Various Organizations, Pacts, and Networks
Under this section, we tackle the various organizations and commitments that have been organized to improve the quality of education through the encouragement of cooperation in the development of the educational services sector, free flow of information, technology, and human capital, and liberalization. We discuss the goals of each and at the same time highlight some of their achievements with the aim to present a much clearer picture of the forces at work in the improvement of the global quality of education.
AUN-SEED-Net. Since engineers are those who create value by transforming ideas into innovations and inventions, they are able to give value to consumers and are also central to the growth and sustainability of profits for an enterprise (Wnek and Williamson, 2010). This in turn can support economic growth and sustainability through the advancement of technology. We therefore look at some initiatives set forth by member economy of the APEC community in order to develop engineering education.

234
The ASEAN University Network (AUN)-Southeast Asia Engineering Education Development Network (SEED-Net) plays a major role in the development of engineering education in the ASEAN. Established in April 2001, the AUN SEED-net promotes the development of human resource in the region. These activities include:
1) providing linkage and strengthening linkages among member institutions, industries, and communities;
2) enabling systems to conduct research activities addressing regional issues;
3) enhancing the capacity of member institutions’ academic staff to perform research and education; and
4) strengthening the academic network among member institutions and Japanese supporting universities (AUN SEED-Net 2012).
The Network collaborates with the ASEAN’s 19 leading education institutions and garners support from the 11 leading Japanese universities through the Japan International Cooperation Agency ( JICA). Within a span of a decade, the Network has accomplished numerous achievements, which include increasing the number of academic staff with higher educational degrees, improving the graduate programs, and internationalization of member institutions.
It also promotes collaborative research with industries and member institutions by encouraging a wide number of publications through the launch of the ASEAN Engineering Journal. As of March 2012, 116 papers have been received, 20 percent of which are in environmental engineering, followed by mechanical and applied engineering.
As of 2011, the most popular fields for master’s applications are environmental engineering, civil engineering, and geological engineering, garnering at least 160 applications with 45 scholarships, while the most applied for fields in doctoral programs are environmental engineering, civil engineering, electrical and electronics engineering, information and communication technology, and chemical engineering, with a total of 33 applications (AUN SEED-Net, 2012).
Overall, AUN SEED-Net has provided 795 scholarships (496 master’s, 143 PhD Sandwich, 128 PhD in Japan, 28 PhD in Singapore); 514 graduates (379 master’s, 135 PhD); 426 collaborative research projects amounting to USD 4,424,172.00; 63 research grants for alumni; 1,500 research publications; four issues of the ASEAN Engineering Journal with 33 published papers; and 94 special equipment (Tullao and Cabuay, 2013).
Finally, the Network encourages collaborative research with the private sector and member institutions by their participation in the Collaborative Research Program and Regional Conference Program. The conference serves as a venue for local companies to voice out their concerns and technological needs, while at the same time strengthening the linkages between universities and industries (Tullao and Cabuay, 2013). To further the agenda of collaborative research, the Network also provides short-term research visits to ASEAN nations and Japan.
235
SEAMEO. The SEAMEO was established in 1965 by governments of the Southeast Asian economies as a means to promote regional cooperation in education, science, and culture (SEAMEO, n.d.).
Its primary objectives are:
“…to enhance regional understanding, cooperation and unity of purpose among for a better quality of life through the establishment of networks and partnerships, the provision of fora among policy makers and experts, and the promotion of sustainable human resource development.”
Among SEAMEO’s strategic goals, being the ASEAN’s partner, are those that highlight the development of human capital. These include the promotion of R&D in education, science, and culture and facilitating the speed of dissemination of R&D, as well as being the harbinger of the harmonization of education standards in order to be the leader in the advancement of education, culture, and science.
SEAMEO also conducts training programs through its 15 specialist institutions in 8 member economies. These provide trainings in the following areas:
1) Agriculture and Rural Development;2) Culture and History, which includes Culture Development,
Archaeology and Fine Arts, and History and Tradition;3) Education, which includes Higher Education, Language Education,
School Management, Innovative Education and Information and Communications Technology (ICT) for Education, Open and Distance Education, Science and Mathematics Education, Vocational and Technical Education;
4) Tropical Biology and Natural Resources; and 5) Tropical Medicine, Public Health and Nutrition.
Other training centers include:
a. The SEAMEO Regional Centre for Higher Education and Development (SEAMEO RIHED), located in Thailand, offers courses in Higher Education/ University Governance and Management, Harmonization on Higher Education in Southeast Asia, and Quality Assurance in Higher Education.
b. The SEAMEO Regional Centre for Vocational and Technical Education and Training (SEAMEO VOCTECH), which is located in Brunei Darussalam, offers courses in Curriculum Design and Development for Vocational and Technical Education and Training (TVET), Management for VTET, Refresher Programmes for VTET Teachers and Instructors, Incorporating ICT in education and learning, and Research and Development for VTET.
236
Among other projects completed by the SEAMEO include:
a. SEAMEO Sister School Network Project / SEAMEO Regional Schools Internet Project. This project acknowledges the importance of the linkages between schools, especially through the Internet. This is a small-scale pilot project that aims to be the venue of discussion about the issue of transportation within the region. Between December 1997 and March 1998, training has been provided to students and teachers, in six member economies including Singapore, Indonesia, Thailand, Philippines, Malaysia, and Brunei.
b. Connecting Southeast Asia & Europe e-Learning Models. This project aims to establish cooperation of Southeast Asian and European economies for the development of an adaptable and flexible Virtual Learning Model. The project involved five Southeast Asian nations and four European economies.
APEN. The Asia Professional Education Network (APEN), on the other hand, was established to be the core of collaboration among organizations through project based learning (PBL). APEN was founded by Shanghai Jiao Tong University (China), Advanced Institute of Industrial Technology ( Japan), Pohang University of Science and Technology (Korea), and the University of Engineering and Technology, Vietnam National University, Hanoi (Vietnam) in June 2011. After which, the Institute of Technology of Cambodia (Cambodia), the Institut Teknologi Bandung (Indonesia), Thammasat University (Thailand), and Universiti Teknology (Malaysia) joined in. Soon after, the National University of Laos (Laos) joined the APEN (APEN, n.d.).
It also aims to produce global professionals who can contribute to the enhancement of the Asian society by the means of industrialization (APEN, n.d.). The PBL programs have particular training projects defined by well-designed education processes, clearly set targets, and proper systems of assessments.
Among the current APEN programs include the facilitation of dialogues between policy-makers and training entities and education institutions, such as the 2013 Saudi Arabian Mission of directors of the vocational training entities and the dialogue with Institute for Small-Scale Industries.
AFAS. The ASEAN Framework Agreement on Services (AFAS) was signed in 1995 with the intent to facilitate the free flow of services in the region within a decade. By the means of liberalization, the AFAS intends to abolish discriminatory measures and market access limitations (ASEAN, 2012). The agreement compels all signatories to improve/establish infrastructure, joint production systems, synchronize R&D, and encourage the free flow of information. At the same time, member states need to mutually recognize the education, experience, requirements, licenses and certifications granted by other member-states (ASEAN, 2012).
Cross-border education is one of the targets that AFAS tries to promote. Cross-border education can be undertaken through the four modes of supplying services. In mode 1 or cross-border transactions, this can be done through e-learning and distance education. Under mode 2 or consumption abroad, cross-border education

237
can be promoted through exchange of students to acquire educational services in territories outside their economies. Under mode 3 or commercial presence, this can be done through the establishment of branches of leading universities in the region or in twinning or cooperative programs among universities in the region. Under, mode 4 or movement of natural persons, this can be facilitated through the exchange of professors and researchers.
In line with this, the AFAS targets the education sector for liberalization. Ishido (2011) calculated the Hoekman index for education services of member-economies given the commitments made by them in light of the AFAS. But before we look at that, we first tackle the importance of liberalization of this sector. As Dee (2013) noted, the education services sector builds social infrastructure and its development is vital to the progress of a nation. Once this sector has been liberalized, it will help ensure the quality, availability, and affordability of education for all segments of the society.
Ishido (2011) finds that adult education is the subsector that has the highest degree of liberalization, followed by higher education and other education. It is imperative to note, however, that the ASEAN average for higher education (0.39) still indicates that the commitment is not as sound. Looking closely at the higher education subsector, it can be seen that Cambodia has the deepest commitment in liberalizing the sector (0.75), followed by Indonesia, Myanmar, and Thailand, each having an index of 0.63. However, it also noted that the Philippines, Singapore, and Brunei have not made any commitment in liberalizing higher education.
On the other hand, the level of liberalization for primary and secondary education is not high. To be exact, only a few committed at all, with an average of 0.22 and 0.33, respectively. Thailand leads in the commitment in these two sectors with an index value of 0.63 for primary education and 0.81 for secondary education.
Looking at the overall commitment of each member-economy, it can be seen that economies that are most committed are Thailand (0.54) , Lao PDR (0.56), and Indonesia (0.478). However, it is obvious that economies are still not liberalizing their education sector, reflecting a need to hasten up the process if we are to achieve our 2015 goal. As Ishido (2011) have noted, this sector still needs to be developed and liberalized in the way such as the business, communication, construction and engineering, distribution, and tourism sectors.
Lessons from Selected APEC Economies: Improving Quality and Excellence
Under this section, we present the current situation of selected APEC member-economies and highlight the policies that each have undertaken with the hope to improve the quality of education.
In China, under the reforms undertaken by Deng Xiaoping, there was an emphasis in the improvement in the quality of education through the development of nearly 100 universities and vital disciplines. In 1999, an action plan was formulated for “Furthering the Education Reform and Promoting Quality-Oriented Education.” These reforms tackled critical areas in educational reform such as changing the teaching style to

238
encourage independent thinking and stimulate creativity, the implementation of quality oriented education in all school levels, expanding university enrollment, developing private educational institutions, and most notably the extension of the national compulsory education program with increased government assistance to low-income areas.
In the United States, one of the most historic policies in basic education is the “No Child Left Behind Act of 2001,” an act signed in 2002 by President Bush because “too many of our neediest children are being left behind.” This reformed the culture of US schools and improved the performance of students. Along with the passage of this act, the United States Congress reauthorized the Elementary and Secondary Education Act (ESEA). The amendment exchanged federal aid for better systems of accountability to ensure the quality of education for every child of the state (US Department of Education, 2003).
In Japan, the reform on improving quality was centered on decentralization. In 1991, the Standards for the Establishment of Universities were revised. The revision contained changes about the curriculum and at the same time made it more flexible, thereby giving universities more power to construct their curriculum independently, with a provision that they are obligated to report educational and research activities in a detailed self-evaluation system. With these changes in place, universities began to lessen the teaching of foreign language and most general education requirements.
In Australia, the provision of “high quality public school education” has focused mainly on the improvement of the quality of its teachers. Among the OECD economies, Australia registers one of the highest in terms of instruction times and teachers’ teaching time. A typical Australian teacher has a heavy teaching workload at 873 hours per academic year in primary school. Teachers also reported a 97 percent participation in professional development activities as shown in the TALIS survey. Australia is the only economy where the number of days that teacher spent in development programs is significantly correlated with the improvements in the discipline within the classroom (OECD, 2013).
Among the initiatives taken by Australia to improve the quality of its teachers is the establishment of the Australian Institute for Teaching and School Leadership in 2010. It also formulated seven standards in four career stages—graduate, proficient, highly accomplished and lead teacher—and three domains—professional knowledge, practice, and engagement. The Australian Professional Standards for Principals likewise erected three leadership requirements that principals must draw upon five areas of their practice, namely, “leading teaching and learning; developing self and others; leading improvement, innovation, and change; leading the management of the school; and engaging and working with the community” (OECD, 2013).
Finally, in 2009, Australia saw the rise of the National Partnership on Improving Teacher Quality , which provided a funding of AUD 550 million to states and territories so that they can attract the best graduates, both local and foreign, through the development of the university, better teacher training, national consistency in the registration of teachers, better teacher mobility, and retention of the best teachers and staff.

239
Lessons from Selected APEC Economies: Enhancing Relevance and Responsiveness
In Japan, the Central Council for Education (CCE) submitted a report titled “The Model for Japanese Education in the Perspective of the 21st Century” in 1996. The report outlines the future of Japan and the problems that the society may encounter, but most importantly they highlighted the skills that a child must be equipped with in order to handle these problems more effectively.
The CCE stressed the importance of the phrase “Ikiruchikara”—competences for positive living or zest for living. They encouraged the collaboration of the household, school, and the community in developing a positive environment for the students. To develop these competencies the different sectors were to have “Yutori” (latitude or relaxed feeling) so that students will be able to love and embrace both the family and community (NIER, n.d.).
Among the recommendations of the CCE were to reduce learning through rote and memorization, to modify the teaching strategies so that students are able to grasp the fundamentals, to reduce the number of teaching hours so that the students are able to be more relaxed and are given ample time to discover their own distinct personalities, to cultivate the spirit of humanity by engaging students in community and volunteer work, and to promote cross-curricular comprehensive studies.
Lessons from Selected APEC Economies: Improving Access and Equity
In Australia, one of the thrusts of the Department of Education is equity in education. In line with this, in 1989, the “National Aboriginal and Torres Strait Islander Education Policy (AEP)” was introduced, with the main focus of its 21 goals is to reduce the gap in education quality, access, and participation of the indigenous and other Australians. And in 1999, the Australian Council established the Taskforce on Indigenous Education—a body composed of members of the government, private sector, and representatives from the Aboriginal and Torres Strait Islander Commission. The objective of the task force is to monitor the current progress of indigenous education and to recommend actions to the government to improve literacy and mathematical ability (MCEETYA, 2000).
Lessons from Selected APEC Economies: Enhancing Efficiency and Effectiveness
In the US, the Chicago School Reform Amendatory Act of 1995 amended the 1988 Chicago School Reform Act. This decentralized the main function of government, constituted better checks and balances, and established stronger central support functions (King and Guerra, n.d.; Haney, 2011). During this time, the governance of Chicago public schools were transformed in a corporate-management-like structure.
In Japan, the role of the government was defined by the “Law Concerning Reorganization of the National Universities as Corporations” (2003), which gave universities the legal status of a type of corporation. In terms of finances, “Law

240
Concerning the National Treasury’s Share of Compulsory Education Expenditures” (2008) reduced the central government’s share of compulsory education expenditure to 33 percent (from 50 percent) (NIER, n.d.). It is also important to note that there is a close connection between the keiretsu (large firms) and the central government. These keiretsu helped the government implement technological goals (Okimoto, 1989) and helped contribute to Japan’s technological prowess by emphasizing reverse engineering and innovation, resulting to improved product quality, better R&D, and a large number of patents (Marinova, 1999).
In New Zealand, the Education Act of 1989 overhauled the schooling systems of New Zealand; among these are the establishment of the policy-focused Ministry of Education, self-managing schools, the Education Review Office, and early childhood education centers. It also made schooling compulsory for both residents and citizens between 6 and 16 years old (in some cases, 19 years old).
The Tomorrow’s Schools program of 1988 abolished regional education boards, and individual schools were placed under the control of their Board of Trustees. The Board is composed of parents, the school principal, a student representative, a staff representative, and trustees appointed by school proprietors. In 1990, the change in the government promoted competition between schools, abolishing school enrolment zones so that parents have more freedom to choose where there kids go to school. With autonomy given to schools, the system allows for greater flexibility in terms of constructing the curriculum, it also enhances the innovation of local practices in improving the quality of education. Finally, this system gives teachers a high degree of professional autonomy, it is expected that teachers are to analyze each individual’s ability and adapt the appropriate teaching strategy.
As for accountability, New Zealand Qualifications Authority (NZQA), defined by the Crown Entities Act of 2004, is an independent board appointed by the Ministry of Education in order to ensure quality in secondary and tertiary schools. As for the financing, it is managed by the Education Review Office (ERO). The way it computes funding for schools is quite peculiar for it uses per-student formulas. These make every student “translatable” to dollar values of school based on factors such as year level, socioeconomic state of the community, and school location.
6.2. Lessons on the Impact of education on Equity and Inclusive Growth
The Role of Education in Inclusive Growth
Inclusive growth is economic growth with equal opportunity for each member of the society; it is also one of the main objectives of the Asian Development Bank (2013). In recent decades, it has been found that education also plays a role in increasing the development of the quality of life—access to education, equal distribution of income, provision of health and education services, and threat of crime, among many others (World Bank, n.d.). The OECD (2013) Well-Being Framework proposes 11 monetary and nonmonetary dimensions that are critical to people’s lives. This includes skills and education, which develop the capacity of individuals to contribute to economic growth through working and innovation.

241
Tullao (2012) stated that the next stage of industrial development may be the development of heavy manufacturing that can supply inputs to labor-intensive product processes. In order to be competitive, economies should develop these input industries by developing technology or adapting the technology of foreign economies. He also states that the growth of ASEAN nations to reach middle-income status owes in part to the development of middle-skilled and technical workers. This includes the training of engineers, technicians technologists, and other professionals who can efficiently utilize the comparative advantage of an economy along with its resource endowments. Table 27 shows the share of exports to GDP and explains that the economies in the ASEAN+4 are becoming more involved in international trade.
Since economic growth is a vital part of inclusive growth, this section presents evidence on the impact of education on equity and inclusive growth among different member-economies of the APEC; in some instances, we also highlight vital empirical findings from other economies.
Problems Encountered on the Equality of Education
Education is a vital factor to inclusive growth; however, the underdevelopment of institutions, high poverty, and high income inequality can also hinder access to
Table 27. Goods and Service Exports of ASEAN+4 Economies as Percentage of GDP.
ASEAN Economy 1960 1970 1980 1990 2000 2010
Brunei Darussalam - - 93.36 61.81 67.35 81.44
Cambodia 13.90 5.76 - - 49.85 54.08
Indonesia 15.04 13.45 34.18 25.33 40.98 24.62
Lao PDR - - - 11.33 30.10 35.54
Malaysia 50.60 41.41 56.69 74.54 119.81 93.75
Myanmar 19.69 5.21 9.10 1.94 0.49 -
Philippines 11.95 21.58 23.57 27.52 51.37 34.80
Singapore - 126.10 202.61 177.45 192.34 207.17
Thailand 15.68 14.99 24.11 34.13 66.78 71.29
Vietnam - - - 36.04 55.03 77.53
China - 2.61 10.65 16.07 23.33 30.61
India 4.39 3.72 6.03 6.93 12.82 21.94
Japan 10.72 10.59 13.42 10.29 10.88 15.19
Korea 3.16 13.63 32.06 27.95 38.56 52.28
Source: World Bank.

242
public services. This presents a feedback relationship between inclusive growth and education.
First, let us examine two economies that experienced problems in the equality of education among the members of society. As King and Guerra (n.d.) have pointed out that overall, China’s enrolment rates in basic education increased, yet the provinces vary greatly in terms of literacy (for ages 10 and above) and enrolment in secondary education. In China, the average literacy rate is 70 percent. However, even with the implementation of compulsory education, there are provinces such as Qinghai, Gansu, Yunnan, and Guizhou that experience 20 percent lower rates than the leading provinces of Liaoning, Jilin, and Tianjin. Enrolment rates in secondary education are also unequal between provinces. wherein Shanghai and Beijing have an enrolment rate of 90 percent, while Tibet, Guizhou, Guangxi, and Hainan have enrolment rates that are one-third lower. The problem is more severe in the education of minority ethnic groups in the interior rural regions. As Hannum (2002), have pointed out, enrolment rates are 10-15 percent lower for minority girls and boys than the Han Chinese.
The disparity of the level and access of education between provinces is not limited to China. As King and Guerra (n.d.) also stated, the Philippines is also a victim of such a tragedy. From 1989 to 1994, literacy rates increased by a substantial amount, yet in 1994, the literacy rate in the Autonomous Region of Muslim Mindanao, an autonomous region that governs its own education system, is 61 percent as compared to the 92 percent in the National Capital Region. Even with the gains from the decentralization of education, enrolment rates in secondary education declined in Northern Mindanao. In 2002, enrolment rates vary from 94 percent in the region of Ilocos to 32 percent in ARMM. In 2001, legislation was passed that outlined guidelines on how the region’s schools are to adapt basic courses, including standards for the minimum curriculum, and textbooks that are used by the national government. However, even with this reform, the ARMM was still not able to catch up with other regions. King and Guerra (n.d.) outline two factors that may have caused this—high poverty and persistent armed conflict.
Role of Education in Income Inequality
In theoretical studies, the relationship of education and income distribution is not clear. Models such as those of Schultz, Becker, and Mincer suggest that the average years of schooling may either have a positive or negative effect on income inequality. However, this finding may be questioned, as it was suggested by the research of Hanushek and Wößmann (2007) who pointed out that the average years of schooling are a weak instrument for education, for the level of education received by one student in one year may differ between economies. In development economics, the relationship of income inequality and education is still yet to be determined. Studies such as those of Knight and Sabot (1983) attributed this to the “composition” and “wage compression” present in a dual economy. First, the “composition” effect increases the size of the educated workforce, which in turn increases income inequality. On the other side of the spectrum, the “wage compression” effect is used to describe the lowering of the premium for skilled labor as the supply of educated labor goes up.

243
Empirical studies such as those of Psacharopoulos and Woodhall (1985) and Ram (1989) relate a negative relationship between the level of education and income inequality. This is supported by the findings of Becker and Chiswick (1996) who show that among the states in the US, income inequality is positively correlated with inequality in schooling and is negatively correlated with the level of schooling.
A study conducted by Lee (2013) regressed the income inequalities between the provinces of China to schooling years, age, health, nature of work, organization size, and sector of employment. Their results indicated that education is currently the most important factor in explaining (25 percent) of the variation in income—reflecting the growing skills premium. Chinese fiscal spending on public schooling and health increased from 18 to 21 percent in recognition of the increasing skill premium and returns on human capital. However, the high degree of fiscal decentralization in China presents complications between provincial governments. For example, more than half of all government expenditure in China occurs at a subprovincial level. Therefore, poor provinces who lack own-revenue sources cannot afford to provide public education and good services. The China Health and Nutrition Survey showed that there are large differences in per capita allocation across provinces in terms of public spending on education.
A cross-economy study was done by De Gregorio and Lee (2002), which included Africa, Asia, Latin America, and OECD. In their findings, they found that inequality between different regions differ significantly. They found out that high education attainment and an equal distribution of education play a role in changing the income distribution. However, these quantitative effects, quite small for educational expansion, do not necessarily mean equality in the educational attainment of the population. It is now imperative that policies in educational expansion should focus on reducing education inequality if the primary target is to reduce income inequality.
In Australia, in an economy note by the OECD (2011), the inequality in the working-age population has been rising since 2000. In 2008 the average income of the top 10 percent is 10 times higher than that of the bottom 10 percent, as compared to a ratio of 8:1 in the 1990s. This has been attributed to the widening disparities of market incomes such as gross earnings, savings, and capital and a weakening distribution. In a study by Whiteford (2013), he identified that education inequality is one of the driving forces of the growth in income inequality. Those who have attained a Year 12 education are more likely to work in white-collar jobs. And in 2009, 70 percent of the people who have a personal gross income in the highest quintile have attained a Year 12 education. In another study conducted by Leigh (2008), it has been estimated that there is roughly an 8-11 percent increase in hourly wages when educational attainment is increased by one year, with the largest gains being experienced by the graduates of bachelor’s degree programs and grade 12.
In Japan, there is an almost equal distribution of income during the 1960s and 1970s. However, since the 1980s and 1990s, which coincided with the nation’s bubble economy, income inequality became a common issue in public policy (Tachibanaki, 1998). As stated in the review of literature prepared by Takanami (2010), there are several causes of the rising inequality. First, with the rapid technological change in

244
Japan, globalization, and skill-based technical change, demand for labor shifted from unskilled to skilled workers. Therefore, there came a large shift in wage differences between skilled workers and unskilled workers (Sasaki and Sakura, 2004). Second, is the ageing of a large part of the population. Third, is the prevalence of nonregular employees. Young part-timers are commonly called freeters, aged 15-34 who are seeking part-time work after graduating or dropping out of schools (Kosugi, 2004). These people have difficulty in finding stable employment for they are less educated, while demand in Japan is primarily concerned with graduates in higher education. The growing number of freeters in Japan lead to a wider gap in income between workers (Kosugi, 2005). Fourth is the weakness in social security systems. From these, we can infer that the rising income inequality in Japan is due to the differences in the educational attainment of the population; since the economy is moving to be technologically advanced society, labor demand is now focused on the highly skilled and technical.
Table 28. Total Unemployment in the APEC as Percentage of Labor Force.
Unemployment, total (% of total labor force)
2000 2004 2008 2009 2012
Australia 6.30 5.40 4.20 5.60 5.20
Brunei Darussalam ... ... ... ... ...
Cambodia 2.50 1.70 0.10 0.20
Canada 6.80 7.20 6.10 8.30 7.20
China 3.10 4.20 ... ... ...
Hong Kong SAR, China 4.90 6.70 3.60 5.20 3.30
Indonesia 6.10 9.90 8.40 7.90
Japan 4.80 4.70 4.00 5.00 4.30
Korea, Rep. 4.40 3.70 3.20 3.60 3.20
Lao PDR ... ... ... ... ...
Malaysia 3.00 3.50 3.30 3.70 3.00
Myanmar ... ... ... ... ...
New Zealand 6.20 4.00 4.20 6.10 6.90
Papua New Guinea 2.86 ... ... ... ...
Philippines 11.20 11.90 7.30 7.50 7.00
Singapore 3.70 4.40 3.20 4.30 2.80
United States 4.00 5.50 5.80 9.30 8.10
Vietnam 2.30 2.10 2.40 ... 1.80
Source: World Bank.

245
6.3. Lessons on Addressing Labor and Education Mismatch, Unemployment, and Brain Drain
In the 2012 Talent Shortage Survey of the Manpower Group (2012), it was revealed that around 45 percent of employers, an increase from 28 percent in 2006, in Asia
Table 29. Unemployment by Educational Attainment, Selected APEC Nations.
Primary Unemployment
Secondary Unemployment
Tertiary Unemployment
Economy 2000 2004 2008 2000 2004 2008 2000 2004 2008
Australia 44.4 48.3 47.4 40.8 32.7 33.6 14.9 19 19
Canada 33 28.3 26.3 42.3 41.9 41 24.6 29.9 32.7
Hong Kong, SAR
47.9 48.3 38 41.9 39.7 43.8 8.4 10..3 17.1
Indonesia 44.5 48.4 43.4 43.8 36 40.6 7.9 5.7 10.2
Japan 23.8 70.4 66.8 52 ... ... 24.2 29.3 33.2
Korea, Rep. 24.9 17.3 15.3 62.5 65.7 63.7 12.6 17.1 21.1
Malaysia 15.3 13.3 10.4 66 62.8 60.9 15.2 20.9 24.9
New Zealand 0.9 31.4 30.6 49.3 37.8 39.2 11.9 26.3 25.7
Philippines 21.8 20.7 14 42..3 43 45.5 32.9 34 40
Singapore 33.6 27 47.8 48.1 18.6 24.6
United States 21.8 19.3 17.9 36.3 34.3 35.5 41.9 46.5 46.5
Source: World Bank.
and the Pacific have talent shortages in 2011. Notable economies such as Japan (81 percent), Australia (50 percent), New Zealand (48 percent), and India (48 percent) experienced severe problems in talent shortages. These shortages according to the employers were caused by the lack of available applicants (35 percent), lack of technical competencies (29 percent) lack of employability skills (soft skills) (28 percent), lack of experience (17 percent), individuals looking for more pay than what is offered (13 percent), undesirable geographic locations (6 percent), and poor image of the business sector (5 percent) (Manpower Group 2012).
Looking at the total unemployment in APEC economies (Table 28), we can see a decreasing trend of unemployment from 2001 to 2010, with most nations reaching peak unemployment in 2005. This is an indication of a strong demand for labor; however, it is not indicative of the unemployment rate of educated workers. Looking at the following table, we present unemployment according to educational attainment.

246
We can see that the largest proportion of the unemployed in 2004 are those with secondary education (Table 29). This indicates that a significant portion of the unemployed are underqualified. Such is most evident in Canada, Hong Kong, Korea, Malaysia, New Zealand, Philippines, and Singapore. However, it is notable that in the United States, those who experience the highest unemployment are tertiary graduates, this may be indicative of the very high supply of technical and skilled workers in the United States.
A noteworthy case on labor-market distortions caused by the international migration of Filipino nurses was presented by Tullao et al. (2010). In the past decade, there has been a high demand for nursing graduates from developed economies, increasing the rate of return to nursing. However, with the low rate of passing of nursing graduates in both national and international licensure examinations, only a few are able to migrate and reap the high rates of return on their investment. The rest are forced to seek jobs in the Philippines, most of whom remain unemployed because of weak domestic absorption. If employed, most nurses use this as a training grounds in order to gain sufficient qualification to migrate. Lastly, those who do not pass the examination retake recursively or resort to being employed in other non-nursing jobs. This may account for the high level of tertiary unemployment in the Philippines.
In Australia, the share of 15-29 year olds that are not in education or not employed is 11.5 percent, well below the OECD average, but then the government is increasing their capacity to respond by developing vocational training programs (OECD, 2013). The Vocational Education and Training (VET) in the economy is being provided at both tertiary and secondary education levels, with employers playing a large role in the system. For example, the Australian Apprenticeship Centre provides the information and support for employers and apprentices, while the Australian Apprenticeships Access Program provides prevocational training that is linked to securing an apprenticeship. This mostly target vulnerable job-seekers. The VET facilitates easy entry into the labor market by the provision of work-study programs. Current reforms in the VET system aim to shape it to a more demand-driven program. This is to be done by making the system more flexible in terms of the length of apprenticeship and providing more support and a more common means of assessment.
The Council of Australian Governments set VET 2020 targets such as doubling the number of Diploma and Advanced Diploma completions and increasing the proportion of the working population with Certificate Level III qualification. In addition, the government aims to improve apprenticeships by providing more incentives for employers and students (OECD, 2013).
In order to further address the problem of a growing secondary unemployment in Australia, they have also introduced programs such as the “The National Partnership on Youth Attainment and Transitions (2009),” which aims to retain the youth in education and to assist them in transitioning to higher education programs, training, and employment. Another policy such as the “Advancing Quality in Higher Education plan (2012-2014)” aims to improve teaching and learning in higher education by providing additional funding to universities to attract, support, and retain students with disadvantaged backgrounds.

247
Brain drain usually occurs when demand for educated manpower in a given economy is not enough to cater to the large supply of skilled labor. For example, jobs are not able to accommodate or attract graduates to the high wage-differential when compared to other nations; skilled labor may seek alternative employment in foreign soil. Because of the mismatch in skill and qualification, overqualified workers tend to be underpaid, and as a result, they have very high mobility (Quintini, 2011). The following table presents the percentage of tertiary graduates of migrate to other nations for employment opportunities.
As can be seen from Table 30, the proportion of tertiary-level migrants from APEC member-economies have fluctuated from 1990 to 2000, with some countries such as Brunei, Cambodia, Indonesia, Korea, and Malaysia experiencing a downward trend, which is indicative of the better capacity of the economy to absorb graduates. However, it can be seen that economies such as Russia, Philippines, Australia, and New Zealand have an increasing rate of migration. This may be the result of a higher population availing of higher education, as such was seen in previous sections, or as a result of high enrollment rates of foreigners in the economy.
Table 30. Emigration Rate of Tertiary Educated.
Economy 1990 2000
Australia 2.09 2.72
Brunei Darussalam 22.12 15.05
Cambodia 22.51 21.47
Canada 4.87 4.69
Chile 6.86 6.02
China 3.01 3.79
Indonesia 5.56 2.92
Japan 1.32 1.24
Korea, Rep. 9.82 7.51
Malaysia 26.27 10.54
New Zealand 16.91 21.76
Papua New Guinea 37.25 27.78
Peru 5.96 5.83
Philippines 12.57 13.55
Russian Federation 0.48 1.38
Thailand 2.39 2.21
United States 0.49 0.45
Source: World Bank.

248
VII. Policy Recommendations: Cooperative Measures for APEC Economies in Human Resource Development
There are theoretical basis for investing in education because it can shape the stock and structure of human capital of an economy. Greater and intensive investment in education particularly higher education and research can build the higher level of human resource, which is knowledge capital. Both human capital and knowledge capital are essential in shaping the trajectory of economic prosperity.
From the Philippine perspective, there is an imperative to invest in education. The Philippine Medium-Term Development Plan is enhancing knowledge and skills and is a major strategy in improving human capabilities, which in turn will contribute in the general thrust of the plan of reducing poverty and the creation of massive quality employment. But such investment in human capital is faced with challenges of improving quality, making education relevant and accessible, and ensuring that resources are efficiently utilized.
From the APEC perspective, education and human resource development are important in pursuing the goals of the organization and in the narrowing income gaps among the economies in the APEC. Improving the economic opportunities for women and vulnerable groups requires access to education and skills training. In addition, the expansion of connectivity among member-economies of APEC can be facilitated and translated into connectivity in trade in services, including cross-border education. Thus, education is important for narrowing gaps internally and externally as well as in expanding trade in services.
It is in this light that human capital development is being proposed as major thrust and theme in the 2015 APEC meetings in Manila. With this theme, there is a need to have high-level discussions on developing the 21st century workforce because it is key to the development of competitive industries and the promotion of inclusive growth. There is a need to discuss cooperative measures in the development of science and technology in the region as a way of developing and narrowing existing gaps in knowledge capital. There is also a need to recommend specific measures of increasing productivity of small and medium enterprises through skills training. Lastly, to foster connectivity, there is a need to enhance cross-border education, movement of workers, and development of an APEC-wide qualification referencing framework.
Given these as backdrop, the following specific proposals are being recommended to answers the needs of the Philippine Development Plan as well as responding to the eminent role of education in the promotion of economic technical assistance, achieving the Bogor Goals, and in implementing cross-border education, which are all major thrusts of APEC:
7.1. Because of limited appreciation of professors and students in APEC economies on the educational systems, particularly higher educational institutions, of other economies, there are inadequate cooperative programs among educational institutions in the region. But inter university cooperation can only proceed after we have developed a sense of community among professors and

249
students in APEC economies. To this end, there is a need to establish and maintain academic exchanges.
The relevant academic exchanges are those that respond to the needs of the Philippines particularly the improvement of the quality of our higher education institutions. The Philippines is lagging in terms of research productivity and graduate education. Visiting professorship programs should be geared toward the nurturing of long-term professional and academic relationships between the researchers in the economy and researchers from other APEC economies. Visiting professors from APEC economies can also team up and teach with local professors, especially in graduate programs. Another possible academic exchange program is in the area of doctoral enrichment programs and research internship with distinguished professors in research universities in APEC economies.
In addition, academic exchanges can also be enhanced through the liberalization in trade in higher education. In the movement of natural persons, for example, the Philippines can relax the economic needs test as well as the restriction on practice of foreign professors especially if the terms of engagement is not more than a year. This is being recommended not for the sake of liberalization but to reap the benefits by exposing our students and our local professor with foreign professors.
As a target, each economy should have at least two of its leading universities establish cooperative programs with other leading universities in other APEC member-economies. The cooperative programs should include exchange of professors and students.
As an additional target, each member-economy should send at least 5 percent of the students enrolled in their leading universities to higher educational institutions (HEIs) in other APEC economies for various forms of exposures in cross-border education by 2020. In addition, these key universities should host students from other APEC economies up to 5 percent of its student population by 2020.
Aside from these targets, the synchronization the academic calendar, standardization of course offerings, and measures of accreditation and recognition should be pursued to facilitate academic exchange.
Another target to consider is the establishment of academic exchange visa for students and professors similar to the APEC business visa.
7.2. Given that Economic and Technical Assistance is a major pillar of APEC, specific measures of cooperation in the area of education and human resource development should be identified and explicit measures of implementing this thrust of APEC should be made. The economic and technological gaps among APEC member-economies provide avenues for cooperation and technical assistance. The experience of Chinese Taipei and South Korea in training technical workers to support their labor intensive industries in the past can assist developing economies in APEC in improving their technical and vocation education. Cooperation can

250
take the form of sharing of modern equipment and technologies, teacher training in technical and vocational skills, and accreditation and qualification measures in technical competency.
To make this proposal more meaningful, there should be an evaluation on the recipients of technical assistance in teacher training abroad. Because of the dearth of teachers with advanced training in the economy, many of these recipients are promoted to administrative positions, and as a consequence the trainings received are not translated into the intended beneficiaries. One way of addressing this issue is to form regional training centers with attached teacher training programs where recipients of advanced training abroad can train other teachers and write instructional materials on the subject of their expertise.
As a target, developed economies of APEC should have at least one technical assistance program with at least two developing economies in APEC in the area of training for instructors in technical and vocational education. The technical assistance should also prepare recipient economies for accreditation and qualification assessment of skills competency.
7.3. Given the existing cooperative programs and networks in the region, there is a need to further enhance these programs and initiatives under the ASEAN University Network (AUN), Southeast Asian Ministers of Education Organization (SEAMEO), Association of Southeast Asian Institutions of Higher Learning (ASAIHL), and other regional groupings in education, human resource development, and science and technology.
As a target, existing cooperative programs can be expanded by increasing its membership and expanding its coverage of cooperation by least 20 percent of existing programs and activities by 2020.
Another target is to establish an APEC Network of Universities (ANU) patterned after the structure and modes of cooperation of the ASEAN University Network and the APEC Study Centers Network.
Although there are differences in the structure of higher education among APEC economies, this does not prevent universities in establishing cooperative arrangements within the region. Currently, there is a consortium of APEC Study Centers composed of national APEC Study Centers, which are mainly university-based. This mode of cooperation among research institutions can be expanded to generate more research and publications and improve graduate education that can enhance research and development in the APEC region.
7.4. Given the common problems experienced by APEC economies related to labor and talent mismatch, there is a need to exchange best practices in addressing the problem of educated unemployment and talent mismatch as well as the migration of human resources.

251
As a target, there should be regular discussions of officials and researchers on how to address this problem of mismatch. Although talent mismtach is an efficiency issue, the issue of equity in employment is likewise a legitimate issue that should also be considered in these discussions.
Another target is the establishment of a mechanism where these exchanges of best practices can be facilitated either through a website, joint research projects, or regular conferences on the issue.
7.5. Given the wide gaps in educational indicators and human resource development in APEC member-economies, there is a need to narrow these gaps through various means of cooperation and technical assistance. Aside from exchange of professors, the twinning of academic programs among universities in the region should be expanded. Universities among developed economies in the region may partner with key universities in the developing economies in terms of faculty development, program cooperation, and joint research undertakings. Such cooperative measures, in turn, can strengthen R&D capacity of research and academic institutions and improve graduate education in APEC economies.
As target, the number of existing academic linkages of key universities in developed APEC economies with HEIs in developing APEC economies should be increased by at least 15 percent by 2020.
As target, the number of graduate students coming from developing APEC economies enrolled in key universities in developed APEC economies should be expanded by at least 15 percent by 2020.
As target, the number of cooperative research projects and joint publications among professors in APEC economies should be increased by at least 20 percent by 2020.
To see the figures and tables in color, please see the online version at http://dfa.gov.ph/index.php/apec-2015-policy-studies

252
REFERENCES
Abramovitz, M., (1956). Resource and Output Trends in the United States Since 1870. American Economic Review Papers and Proceedings 46: 5-23. Taken from Crafts (2008).
Acemoglu D. and J. A. Robinson, (2012). Why Nations Fail? The Origins of Power, Prosperity and Poverty
Albrecht, T. and Adelman, M. (1987). “Communicating social support: A Theoretical perspective.” Thousand Oaks, CA, US: Sage Publications, Inc. (1987). 317 pp.
Allison, D., (2012). Driving inclusive economic growth: The role of the private sector in international development.Report of the Standing Committee on Foreign Affairs and International Development, 41st Parliament, 1st Session, House of Commons, Canada. Available at http://www.parl.qc.ca.
Anand, R., Mishra, S., and Peris, S., (2013). Inclusive growth: Measurement and determinants. IMF Working Paper WP/13/135.Available at www.imf.org/external/pubs/ft/wp/2013/wp13135.pdf.
Deloitte, and All India Management Association, (2011). Inclusive growth: A challenging opportunity. Available at http://www.deloitte.com/assets/dcom-india/local%20assets/documents/inclusive_growth.pdf
Asian Development Bank. Key indicators for Asia and the Pacific 2013: Framework of inclusive growth indicators, special supplement. Mandaluyong City, Philippines: Asian Development Bank, 2013.
AUN SEED-Net (2012), Annual Report 2011/12.
Barro, R., (1991). Economic growth in a cross-section of countries. Quarterly Journal of Economics, 106, 407-443. Cited in Cooray (2009).
Becker, G. and Chiswick, B. (1986). Education and the Distribution of Earnings. American Economic Review, Papers and Proceedings, 86, 218-23.
Becker, G., (1964). Human Capital. New York: Columbia University Press.
Boeing, P., and Sandner, P. (2011). ‘The Innovative Performance of China’s National Innovation System’, Frankfurt School–Working Paper Series, No. 158. Frankfurt School of Finance and Management.
Cooray, A. V., (2009). The role of education in economic growth. Proceedings of the 2009 Australian Conference of Economists (pp. 1-27). Adelaide, Australia: South Australian Branch of the Economic Society of Australia. Taken from http://ro.uow edu.au/cgi/viewcontent.cgi?article=1732&context=commpapers

253
Crafts, N., (2008). Solow and growth accounting: A perspective from quantitative economic history. Paper prepared for HOPE Conference, Robert Solow and the Development of Growth Economics, Duke University, April 2008.
Cuenca, J., (2011). Efficiency of state universities and colleges in the Philippines: A data envelopment analysis. Philippine Institute for Development Studies Discussion Paper Series, No. 2011-14. Available at dirp4.pids.gov.ph/ris/dps/pidsdps1114.pdf
Dee, P. (2013), “Does AFAS Have Bite? Comparing Commitments with Actual Practice,” Taken from Services Liberalization: Impact and Way Forward, a paper prepared for the ASEAN Economic Community Midterm Review, Economic Research Institute for ASEAN and East Asia (ERIA), Jakarta. Available at https://crawford.anu.edu.au.
Deloitte, and All India Management Association. (2011). Inclusive growth: A challenging opportunity. Available at http://www.deloitte.com/assets/dcom-india/local%20assets/documents/inclusive_growth.pdf
Fabricant, S. (1954). Economic Progress and Economic Change. In NBER 34th Annual Report. New York. Taken from Crafts (2008). NBER Economic Fluctuations and Growth.
Flanagan, C., Levine, P., Sttersten, R. (n.d.). Civic Engagement and the Changing Transition to Adulthood. Available at http://www.sohe.wisc.edu/is/documents/CIRCLEChangingTTA.pdf
Freeman, C. (1987). Technology and Economic Performance: Lessons from Japan. London: Pinter.
Garavan, T. N. et al. (2001). Human Capital Accumulation: The Role of Human Resource Development. Journal of European Industrial Training, 25(2), 48-68.
Geron, M., Chua, R., and Songco, D. (2011). Attaining inclusive growth: Investing in economic development of the poor. A Seminal Paper in partnership with PinoyME Foundation, Ninoy and Cory Aquino Foundation, and Hanns Seidel Foundation/Germany. Available at http://www.hss.de/fileadmin/suedostasien/philippines/downloads/110212-Attaining-Inclusive-Growth-Seminal-Paper.pdf
Greenville, J., Pobke, C., and Rogers, N. (2013). Trends in the Distribution of Income in Australia. Available at http://www.pc.gov.au/__data/assets/pdf_file/0006/122496/income-distribution-trends.pdf
Gurria, A. (2012). Editorial: Investing in people, skills and education for inclusive growth and jobs. Education at a Glance 2012 OECD Indicators. Available at http://www.oecd.org/edu/English%20Editorial.pdf

254
Hall, R. and Jones, C. (1998). Why do some countries produce so much more output per worker than others?
Haney, L. (2011). “The 1995 Chicago School Reform Amendatory Act and the Cps Ceo: A Historical Examination of the Adminstration of Ceos Paul Vallas and Arne Duncan.” Available at http://ecommons.luc.edu/cgi/viewcontent.cgi?article=1061&context=luc_diss
Hannum, E. (2002). “Educational Stratification by Ethnicity in China.” Demography 39(1): 91–117
Hanson, C. (2013). Food Security, Inclusive Growth, Sustainability, and the Post-2015 Development Agenda. Available at http://www.post2015hlp.org/wp-content/uploads/2013/05/Hanson_Food-Security-Inclusive-Growth-Sustainability-and-the-Post-2015-Development-Agenda.pdf
Hanushek, E. and Wößmann, L. (2007). “The Role of Education Quality in Economic growth.” World Bank Policy Research Working Paper 4122, February 2007.
Hanushek, E. (1995). Interpreting recent research on schooling in developing countries. World Bank Research Observer, 10, 227-246. Cited in Cooray (2009).
Ianchovichina, E. and Gable, S. (2012). What is inclusive growth? In Commodity Prices and Inclusive Growth in Low-Income Countries. Eds. Arezki, R., Pattillo, C., Quintyn, M., and Zhu, M., International Monetary Fund.
Ishido, H. (2011). “Liberalization of Trade in Services under ASEAN+n: A Mapping Exercise. ERIA Discussion Paper Series 2011-02. Available at www.eria.org/ERIA-DP-2011-02.pdf.
Jajri. (2007). Determinants of total factor productivity growth in Malaysia. Journal of Economic Cooperation, 28, 3 (2007), 41-58.
Johanson, R. (2001). Strengthening the higher education development fund (HEDF). TA-3500 PHI: Education Sector Development Program. Asian Development Bank.
Kennedy, E. (2013). “China’s National Innovation System: Learning from a Holistic, National Approach.” The Breakthrough Institute. Taken from www.thebreakthrough.org.
King, E. and Guerra, S. (n.d.). Education Reforms in East Asia: Policy, Process, and Impact.
Knight,J. &Sabot,R. “ Educational Expansion and the Kuznets Effect.” American Economic Review, 73,1132-6, December, 1983.

255
Kosugi, R. (2005). “The Problems of Freeters and NEETs under the Recovering Economy.” Social Science Japan, No. 32. Tokyo: University of Tokyo.
Kosugi, R. (2004). “Young People in Transitional Crisis: Interview Survey for the Young Jobless and Freeters.” JILPT Research Report No. 6. Tokyo: Japan Institute for Labour Policy and Training.
Lee, I., Syed, M., and Wang, X. (2013). Two Sides of the Same Coin?Rebalancing and Inclusive Growth in China. Available at http://www.imf.org/external/pubs/ft/wp/2013/wp13185.pdf.
Leigh, A. (2008). “Returns to Education in Australia,.” Economic Papers, The Economic Society of Australia, 27(3), 233-249, 09.
Liu, X. and White, S. (2001). “Comparing Innovations Systems: A Framework and Application to China’s Transitional Context,” Research Policy 20.7, pp. 1091-1114.
Manasan, R. (2013). Review and assessment of programs offered by state universities and colleges. Philippine Institute for Development Studies (PIDS) Discussion Paper Series, No. 2013-29. Available at http://dirp4.pids.gov.ph/ris/dps/pidsdps1329.pdf
Mankiw, N. G., Romer, D., and Weil, D. (1992). A contribution to the empirics of economic growth. Quarterly Journal of Economics, 107, 407-437. Cited in Cooray (2009).
Marinova, D. (1999). Japan: A Case Study in National Systems of Innovation. Institute for Sustainability and Technology Policy, Murdoch University. Taken from www.istp.murdoch.edu.au.
MCEETYA Taskforce on Indigenous Education. (2000). “Achieving Educational Equality for Australia’s Aboriginal and Torres Strait Islander Peoples.” Available at http://www.mceecdya.edu.au/verve/_resources/reporta_file.pdf.
Mincer, J. (1974). Schooling, Experience and Earnings. New York: Columbia University Press.
Ministry of Education. (2011). “OECD Review on Evaluation and Assessment Frameworks for Improving School Outcomes.” Available at http://www.educationcounts.govt.nz/publications/schooling/oecd-review-on-evaluation-and-assessment-frameworks-for-improving-school-outcomes/chapter-1-the-school-system.
Ministry of Education, Culture, Sports, Science and Technology (MEXT). (2004). The Development of Education in Japan. Available at http://www.ibe.unesco.org/International/ICE47/English/Natreps/reports/japan.pdf.

256
Miyamoto, K. (2003, July). Human Capital Formation and Foreign Direct Investment in Developing Countries. Retrieved January 9, 2014, from http://www.oecd.org/dev/5888700.pdf.
National Economic and Development Authority (NEDA). (2011). Chapter 8: Social Development. Philippine Development Plan 2011-2016. Available at http://www.neda.gov.ph/?p=1128.
National Institute for Educational Policy Research. (n.d.). Education in Japan: Past and Present. Available at: http://www.nier.go.jp/English/EducationInJapan/Education_in_Japan/Education_in_Japan_files/201103EJPP.pdf.
OECD. (2013). Education at a Glance 2013: OECD Indicators, OECD Publishing. http://dx.doi.org/10.1787/eag-2013-en.
OECD. (2013). “Education Policy Outlook: Australia.”
OECD. (2013). “OECD Workshop on Inclusive Growth Session Notes.”
OECD. (2011). How is Life? Measuring Well-Being, OECD Publishing.
OECD. (2011). Divided We Stand: Why inequality keeps on rising - Country Note: Australia. Available at http://www.oecd.org/australia/49177643.pdf.
Okimoto, D. (ed.). (1989). Between MITI and the Market Place. Stanford University Press.
Orbeta A., and Abrigo, M. (2013). An assessment of TESDA scholarship programs.PIDS Research Paper Series, No. 2013-01. Available at http://dirp4.pids.gov.ph/webportal/CDN/PUBLICATIONS/pidsrp1301.pdf.
Ozturk, I. (2001). The role of education in economic development: A theoretical perspective. Journal of Rural Development and Administration, Volume XXXIII, No. 1, Winter 2001, pp.39-47. Taken from http://mpra.ub.uni-muenchen.de/9023/1/MPRA_paper_9023.pdf.
The People’s Republic of China State Council (PRC State Council). (n.d.). The National Medium- and Long-Term Program for Science and Technology Development (2006-2020).
Psacharopoulos, G. and Woodhall, M. (1985). Education for Development: An analysis of Investment Choice. Oxford University Press, New York.
Ram, R. (1984). Economic Growth, Educational Inequality, and Income Distribution: Some Recent Evidence. Journal of Development Economics, 14, 419-28.

257
Romer, P. (1986). Increasing returns and long-run growth. The Journal of Political Economy, Vol. 94, No.5, (Oct, 1986), pp. 1002-1037. University of Chicago Press.
Ross, Steven M., William L. Sanders, S. Paul Wright, Sam Stringfield, Weiping Wang, and MartyAlberg. (2001). “Two and Three Year Achievement Results From the Memphis Restructuring Initiative.” Available at http://www.memphis.edu/crep/pdfs/2_and_3_Year_of_Memphis_Restructuring_Intiative.pdf.
Ross, Steven M., William L. Sanders, S. Paul Wright, and Sam Stringfield. (1998). “The Memphis Restructuring Initiative:Achievement Results for Years 1 and 2 on the Tennessee ValueAdded Assessment System (TVAAS).” Memphis, TN: University of Memphis, Center for Research in Educational Policy.
Sasaki, H. and K. Sakura. (2004). “Changes in the Demand for Skilled Labor within Japan’s Manufacturing Sector: Effects of Skill-Biased Technological Change and Globalization,” Bank of Japan Working Paper Series.
Solow, R. (1957). Technical change and the aggregate production function. The Review of Economics and Statistics, Vol. 39, No. 3 (Aug. 1957), pp. 312-320. The MIT Press, taken from http://www.jstor.org/stable/1926047.
Spence, M. (1973). Job market signaling. Quarterly Journal of Economics 87 (3), 355-375.
Tachibanaki, T. (1998). Economic Inequality in Japan. Tokyo: Iwanami-shoten.
Takanami, K. (2010). Rising Income Inequality and Poverty in Japan. Available at http://sdsu-dspace.calstate.edu/bitstream/handle/10211.10/613/Takanami_Keiko.pdf?sequence=2.
Technical Education and Skills Development Authority (TESDA). (2014). Impact Evaluation Study 2011.
Technical Education and Skills Development Authority (TESDA). (2014). Impact Evaluation Study 2012.
Technical Education and Skills Development Authority (TESDA). (2014). Impact Evaluation Study 2013.
Thurow, L. (1975). Generating inequality. New York: Basic Books, Inc.
Tinbergen, J. (1942). ZurTheorie der LangfirstigenWirtschaftsentwicklung.WeltwirtschaftlichesArchiv 55: 511-49. Taken from Crafts (2008).
Tsang, M. (2000). “Education and National Development in China since 1949: Oscillating Policies and Enduring Dilemmas.” Available at www.tc.columbia.edu/faculty/tsang/Files/7.pdf.

258
Tullao, T., Cortez, M., and Cabuay, C. (2013). Issues and prospects on the movement of natural persons and temporary migration in Philippine-Chinese Taipei economic partnership. Philippine Institute for Development Studies in cooperation with the Angelo King Institute for Economic and Business Studies.
Tullao, T., and Cabuay, C. (2013). Education and human capital development to Strengthen R&D capacity in ASEAN. Draft paper for Explicating Jakarta Framework of Moving ASEAN Economic Community (AEC) Beyond 2015. Angelo King Institute for Economic and Business Studies, De La Salle University Manila.
Tullao, T. (2012). Investing in human capital: The key to transforming the Asia-Pacific region. Asia Pacific World, 4(1), Spring 2013: 15-31. Paper presented at the International Conference of the International Association for Asia Pacific Studies at the Chines University of Hong Kong, November 23-24, 2012.
Tullao, T. S. (2004). Summative evaluation of the medium term higher education development and investment plan. Commission on Higher Education.
UNESCO Institute for Statistics. (2012). International Standard Classification of Education. Montreal, Quebec: UNESCO Institute for Statistics, 2012. N. pag.Web. 6 Jan. 2014. Taken from http://www.uis.unesco.org/Education/Documents/isced-2011-en.pdf.
United States Department of Education. (2003). “Education in the United States, A brief overview.” Available at http://aboutusa.japan.usembassy.gov/pdfs/wwwf-education-overview.pdf.
U. S. Department of Education. (2003). NCES, 2002 Digest of Education Statistics, Table 166. (Washington, D.C.: NCES, 2003).
Vaithiyanathan, S. (2012). Achiving inclusive growth and sustainable development: Role of innovative and benchmarked KOSM practices – A case study. Conference proceedings of the 33rd International Association of Scientific and Technological University Libraries (IATUL) Conference held 4-7 June 2012 at the Nanyang Technological University, Singapore.
Wells,R. Education’s Effect on Income Inequality: A Further Look. Available at http://www.ccpr.ucla.edu/publications/conference-proceedings/CP-05-054.pdf.
Whiteford, P. (2013). Australia: Inequality and Prosperity and their Impacts in a Radical Welfare State. Available at https://crawford.anu.edu.au/public_policy_community/content/doc/Australia_Inequality-and-Prosperity_final-15-March-13.pdf.

259
Wnek, G. and Williamson, S. (2010). “Engineering Value Propositions: Professional and Personal Needs.” In Grasso and Burkins (eds.). Holistic Engineering Education: Beyond Technology, Springer, pp. 137-144.
World Bank. (n.d.). “Beyond Economic growth.” Retrieved January 29, 2014, from http://www.worldbank.org/depweb/beyond/beyondbw/begbw_01.pdf.
Wylie, C. (1999). “Ten Years On: How Schools View Educational Reform.”
Xiao, J. (2001). Determinants of salary growth in Shenzhen, China: An analysis of formal education, on-the-job training, and adult education with a three-level model.
Dataset References
Philippine Statistical Yearbook 2011. Published by the National Statistical Coordination Board (NSCB).
World Bank Database, available at data.worldbank.org.
SCImago Journal and Country Rank, www.scimagojr.com.
Technical Education and Skills Development Authority – Labor Market Information Division, 2014.
Website References
APEN (n.d.), www.apen.asia .
ASEAN (2012). ASEAN Framework Agreement on Services. Available at http://www.asean.org/communities/asean-economic-community/item/aseanframework-agreement-on-services.
AUN/SEED-NET, available at www.seed-net.org.
SEAMEO (n.d.), available at www.seameo.org.
Ministry of Education (NZ): http://www.minedu.govt.nz/N Z E d u c a t i o n / E d u c a t i o n Po l i c i e s / I n t e r n a t i o n a l E d u c a t i o n /ForInternationalStudentsAndParents/NZEdOverview/Education_System.aspx.
American Psychological Association, http://www.apa.org/education/undergrad/civic-engagement.aspx.
China Health and Nutrition Survey, http://www.cpc.unc.edu/projects/china.

260
Ministry of Health, Labor and Welfare, http://www.mhlw.go.jp/english/database.
UNESCO FAO, http://www.unesco.org/archives/sio/Eng/presentation php?idOrg=1011.
World Bank (2008).

261
Notes
1 The World Bank. (n.d.). World Bank Open Data. In The World Bank. Working for a world free of poverty. Retrieved November 1, 2013, from http://data.worldbank.org.
2 The World Bank. (n.d.). World Bank Open Data. In The World Bank. Working for a world free of poverty. Retrieved November 1, 2013, from http://data.worldbank.org.
Taiwan Data Source: Council for economic planning and development. Retrieved January 3 2014, from http://www.cepd.gov.tw.
Singapore Data Source: Department of Singapore Statistics. Retrieved January 3, 2014, from http://www.singstat.gov.sg.
Papua New Guinea Data Source: Pagelio, J. (2008). The State of Education.
3 The World Bank. (n.d.). World Bank Open Data. In The World Bank.Working for a world free of poverty. Retrieved November 1, 2013, from http://data.worldbank.org.
4 Source: The World Bank. (n.d.). World Bank Open Data. In The World Bank. Working for a world free of poverty. Retrieved November 1, 2013, from http://data.worldbank.org.
Taiwan Data Source: Council for economic planning and development. Retrieved January 3, 2014, from http://www.cepd.gov.tw.
Singapore Data Source: Department of Singapore Statistics. Retrieved January 3, 2014, from http://www.singstat.gov.sg.
Papua New Guinea Data Source: Pagelio, J. (2008). The State of Education.
Philippines Data Source. National Statistical Coordination Board. (2011). Philippine Statistical Yearbook.