essentialdownload.e-bookshelf.de/download/0000/5951/32/l-g...th e image shows colourised scanning...
TRANSCRIPT


Essential Haematology

Companion website
This book has a companion website:
www.wiley.com/go/essentialhaematology
with:
• Figures and tables from the book for downloading• Interactive multiple choice questions prepared by the authors

Essential Haematology
A. V. HoffbrandMA DM FRCP FRCPath FRCP(Edin) DSc FMedSci
Emeritus Professor of Haematology University College London
Honorary Consultant Haematologist Royal Free Hospital
London, UK
P. A. H. MossPhD MRCP FRCPath
Professor of Haematology University of Birmingham
Birmingham, UK
Sixth Edition
A John Wiley & Sons, Ltd., Publication

Th is edition fi rst published 2011, © 1980, 1984, 1993, 2001, 2006, 2011 by AV Hoff brand and PAH Moss
Blackwell Publishing was acquired by John Wiley & Sons in February 2007. Blackwell’s publishing program has been merged with Wiley’s global Scientifi c, Technical and Medical business to form Wiley-Blackwell.
Registered offi ce: John Wiley & Sons Ltd, Th e Atrium, Southern Gate, Chichester, West Sussex, PO19 8SQ, UK
Editorial offi ces: 9600 Garsington Road, Oxford, OX4 2DQ, UK Th e Atrium, Southern Gate, Chichester, West Sussex, PO19 8SQ, UK 111 River Street, Hoboken, NJ 07030-5774, USA
For details of our global editorial offi ces, for customer services and for information about how to apply for permission to reuse the copyright material in this book please see our website at www.wiley.com/wiley-blackwell
Th e right of the author to be identifi ed as the author of this work has been asserted in accordance with the UK Copyright, Designs and Patents Act 1988.
First published 1980Reprinted 1981, 1982, 1983 (twice)Second edition 1984Reprinted 1985Reprinted with corrections 1985, 1988 (twice), 1989German edition 1986 (reprinted 1996)Japanese edition 1986Spanish edition 1987 (reprinted twice)Indonesian edition 1987Th ird edition 1993German 1996Hungarian edition 1997Chinese edition 1998Reprinted with corrections 1993, 1994, 1995, 1996, 1997, 1998, 1999, 2000Fourth edition 2001German 2002Indonesian 2005Korean 2005Portuguese 2005Fifth edition 2006Reprinted with Gaucher’s disease 2008
All rights reserved. No part of this publication may be reproduced, stored in a retrieval system, or transmitted, in any form or by any means, electronic, mechanical, photocopying, recording or otherwise, except as permitted by the UK Copyright, Designs and Patents Act 1988, without the prior permission of the publisher.
Designations used by companies to distinguish their products are often claimed as trademarks. All brand names and product names used in this book are trade names, service marks, trademarks or registered trademarks of their respective owners. Th e publisher is not associated with any product or vendor mentioned in this book. Th is publication is designed to provide accurate and authoritative information in regard to the subject matter covered. It is sold on the understanding that the publisher is not engaged in rendering professional services. If professional advice or other expert assistance is required, the services of a competent professional should be sought.
Th e contents of this work are intended to further general scientifi c research, understanding, and discussion only and are not intended and should not be relied upon as recommending or promoting a specifi c method, diagnosis, or treatment by physicians for any particular patient. Th e publisher and the author make no representations or warranties with respect to the accuracy or completeness of the contents of this work and specifi cally disclaim all warranties, including without limitation any implied warranties of fi tness for a particular purpose. In view of ongoing research, equipment modifi cations, changes in governmental regulations, and the constant fl ow of information relating to the use of medicines, equipment, and devices, the reader is urged to review and evaluate the information provided in the package insert or instructions for each medicine, equipment, or device for, among other things, any changes in the instructions or indication of usage and for added warnings and precautions. Readers should consult with a specialist where appropriate. Th e fact that an organization or Website is referred to in this work as a citation and/or a potential source of further information does not mean that the author or the publisher endorses the information the organization or Website may provide or recommendations it may make. Further, readers should be aware that Internet Websites listed in this work may have changed or disappeared between when this work was written and when it is read. No warranty may be created or extended by any promotional statements for this work. Neither the publisher nor the author shall be liable for any damages arising herefrom.
Library of Congress Cataloging-in-Publication Data
Hoff brand, A. V.Essential haematology / A.V. Hoff brand, P.A.H. Moss, – 6th ed.p. ; cm.Includes bibliographical references and index.ISBN 978-1-4051-9890-51. Blood–Diseases. 2. Hematology. I. Moss, P. A. H. II. Title.[DNLM: 1. Hematologic Diseases. WH 120 H698e 2011]RC633.H627 2011616.1′5–dc222010024521
A catalogue record for this book is available from the British Library.
Set in 10/12pt Adobe Garamond Pro by Toppan Best-set Premedia Limited
1 2011

Preface to the Sixth Edition viiPreface to the First Edition ixHow to get the best out of your textbook x
1 Haemopoiesis 1
2 Erythropoiesis and general aspects of anaemia 15
3 Hypochromic anaemias 33
4 Iron overload 50
5 Megaloblastic anaemias and other macrocytic anaemias 58
6 Haemolytic anaemias 73
7 Genetic disorders of haemoglobin 88
8 The white cells 1: granulocytes, monocytes and their benign disorders 108
9 The white cells 2: lymphocytes and their benign disorders 126
10 The spleen 142
11 The aetiology and genetics of haematological malignancies 150
12 Management of haematological malignancy 166
13 Acute myeloid leukaemia 178
14 Chronic myeloid leukaemia 191
15 The non-leukaemic myeloproliferative neoplasms 200
16 Myelodysplasia 214
17 Acute lymphoblastic leukaemia 223
Contents

vi / Contents
18 The chronic lymphoid leukaemias 234
19 Hodgkin lymphoma 245
20 Non-Hodgkin lymphoma 253
21 Multiple myeloma and related disorders 272
22 Aplastic anaemia and bone marrow failure 288
23 Stem cell transplantation 297
24 Platelets, blood coagulation and haemostasis 314
25 Bleeding disorders caused by vascular and platelet abnormalities 330
26 Coagulation disorders 345
27 Thrombosis and antithrombotic therapy 362
28 Haematological changes in systemic disease 381
29 Blood transfusion 397
30 Pregnancy and neonatal haematology 413
Appendices
1 Normal values 424
2 World Health Organization classifi cation of tumours of the haematopoietic and lymphoid tissues 426
Index 431
Companion website
This book has a companion website:
www.wiley.com/go/essentialhaematology
with:
• Figures and tables from the book for downloading• Interactive multiple choice questions prepared by the authors

Preface to the Sixth Edition Haematology has advanced more rapidly in the last ten years more than any branch of medicine. Current haematological literature is so prolifi c that it is increasing diffi cult for any one but a specialist to keep up to date.
Th e Anaemias by Janet Vaughan, 1st edition, Oxford Medical Publications, 1933
Almost 70 years later, haematology still continues to be at the forefront of medical advances. Th e increased understanding of blood diseases particularly their genetic basis and changes in their treatment is such that in writing this new edition, substantial changes have been necessary throughout. Th e classifi cation of the neoplasms of the haemopoietic and lymphoid diseases has been revised by WHO (2008) and the names and defi nitions of many of these diseases have changed. Clinical features, genetics and immunophenotype are increasingly used to defi ne biological entities. We have made changes in all the relevant chapters but, in a book intended primarily for undergraduates, we have simplifi ed some of the classifi cation tables and omitted detailed descriptions of rare diseases. On the other hand, some tests e.g. red cell survival and vitamin B 12 absorption studies have become obsolete and are now omitted. As previously, we have used a colour line in the margin to indicate text that we consider more advanced than is needed for under graduate medical students and more appropriate for postgraduates.
John Pettit, co - author on all fi ve previous editions, has retired from authorship for this edition. Much of the success of the book when it fi rst appeared 30 years ago and in all fi ve previous editions has been due to John ’ s ability to write clear, concise descriptions of the various diseases, and to produce fi rst - class photomicrographs and line diagrams to illustrate the text. Many of these images appear in this latest edition.
Th e diff erent aspects of iron overload are now merged into a new chapter and we have separated chapters on acute myeloid and acute lymphoblastic leukaemia. We have also introduced summary boxes at the end of each chapter to summarise the contents and added multiple choice questions to the website both at undergraduate and at a more advanced level to help in self - learning. Th e book ’ s website will be updated annually.
We would like to thank Elsevier for the use of the following fi gures: 4.2 , 11.14 , 13.5 b, 18.5 , 18.6 , 18.7 , 20.13 – 16 , 20.18 , 21.2 b, 22.3 , 23.13 , 26.7 , 30.5 from Hoff brand A.V., Pettit J.E. and Vyas P. (2010) Color Atlas of Clinical Hematology , 4th edition. Mosby Elsevier, Philadelphia. We would also like to thank Professor John W. Weisel for the use of the chapter title fi gure from Brown A.E.X., Nagaswami C., Litvionov R.I. and Weisel J.W. (2009) Focusing on fi brin. Science 327 : 741. Th e image shows colourised scanning electron micrograph of a thrombus taken from a patient with acute myocardial infarction. Th e thrombus is made up of a fi brin meshwork (brown) together with platelets (light purple). Erythrocytes (red) and leucocytes (green) are trapped in the network.
We wish to thank our many colleagues at the Royal Free Hospital and in Birmingham who have com-mented on the various chapters and made helpful suggestions for improvements. We are also indebted to our publishers, Wiley - Blackwell, and particularly to Rebecca Huxley who has provided tremendous skills throughout the assembly of this new edition, and Jane Fellows who has expertly drawn all the line diagrams.
A.V. Hoff brand and P.A.H. Moss November 2010


Preface to the First Edition Th e major changes that have occurred in all fi elds of medicine over the last decade have been accompanied by an increased understanding of the biochemical, physiological and immunological processes involved in normal blood cell formation and function and the disturbances that may occur in diff erent diseases. At the same time, the range of treatment available for patients with diseases of the blood and blood - forming organs has widened and improved substantially as understanding of the disease processes has increased and new drugs and means of support care have been introduced.
We hope the present book will enable the medical student of the 1980s to grasp the essential features of modern clinical and laboratory haematology and to achieve an understanding of how many of the manifestations of blood diseases can be explained with this new knowledge of the disease processes.
We would like to thank many colleagues and assistants who have helped with the preparation of the book. In particular, Dr H.G. Prentice cared for the patients whose haematological responses are illustrated in Figs 5.3 and 7.8 and Dr J. McLaughlin supplied Fig. 8.6 . Dr S. Knowles reviewed critically the fi nal manuscript and made many helpful suggestions. Any remaining errors are, however, our own. We also thank Mr J.B. Irwin and R.W. McPhee who drew many excellent diagrams, Mr Cedric Gilson for expert photomicrography, Mrs T. Charalambos, Mrs B. Elliot, Mrs M. Evans and Miss J. Allaway for typing the manuscript, and Mr Tony Russell of Blackwell Scientifi c Publications for his invaluable help and patience.
AVH, JEP 1980

How to get the best out of your textbook
Welcome to the new edition of Essential Haematology . Over the next two pages you will be shown how to make the most of the learning features included in the textbook
An interactive textbook
For the fi rst time, your textbook gives you free access to a Wiley Desktop Edition – a digital, interactive version of this textbook. You can view your book on a PC, Mac, laptop and Apple mobile device, and it allows you to:
Search: Save time by fi nding terms and topics instantly in your book, your notes, even your whole library (once you ’ ve downloaded more textbooks) Note and Highlight: Colour code highlights and make digital notes right in the text so you can fi nd them quickly and easily Organize: Keep books, notes and class materials organized in folders inside the application Share: Exchange notes and highlights with friends, classmates and study groups Upgrade: Your textbook can be transferred when you need to change or upgrade your computer or device Link: Link directly from the page of your interactive textbook to all of the material contained on the companion website
▲
Simply fi nd your unique Wiley Desktop Edition product code on the inside front cover of this textbook and carefully scratch away the top coating on the label, then visit http://www.vitalsource.com/software/bookshelf/downloads/ to get started
Full support is available at http://support.vitalsource.com/
A companion website
Your textbook is also accompanied by a FREE companion website that contains:
• Self - assessment material consisting of multiple choice questions and answers
• All of the illustrations and photographs contained in the book for use in assignments and presentations
• References and further reading suggestions Log on to www.wiley.com/go/essentialhaematology to fi nd out more
ained in the book for use
RE
VI S
ED
274 / Chapter 21 Multiple myeloma and related disorders
Figure 21.1 Serum protein electrophoresis in multiple myeloma showing an abnormal paraprotein in the γ-globulin region with reduced levels of background β- and γ-globulins.
Alb β γα2α1 Origin
Ab
sorb
ance
Distance from origin
Normalpattern
Patient with multiple myelomaIgGκ monoclonal protein 38 g/L
Figure 21.2 (a) The bone marrow in multiple myeloma showing large numbers of plasma cells, with many abnormal forms. (b) Low power view showing sheets of plasma cells replacing normal haemopoietic tissue. (c) Immunohistochemical staining of the bone marrow in myeloma with antibody to CD138 revealing extensive numbers of plasma cells.(c)
(b)(a)
disease). Also, amyloid, hyperviscosity and recur-rent infection may also be present.
Asymptomatic (smouldering) myeloma is diag-nosed if there is an M protein in serum at myeloma levels (>30 g/L) and/or 10% or more of clonal plasma cells in the marrow but no related organ or tissue impairment (e.g. CRAB or myeloma-related symptoms).
Clinical features
1 Bone pain (especially backache) resulting from vertebral collapse and pathological fractures (Fig. 21.3a,b).
2 Features of anaemia, e.g. lethargy, weakness, dys-pnoea, pallor, tachycardia.
3 Recurrent infections: related to deficient anti-body production, abnormal cell-mediated immu-nity and neutropenia.
RE
VI S
ED
286 / Chapter 21 Multiple myeloma and related disorders
Figure 21.13 Hyperviscosity syndrome in Waldenström’s macroglobulinaemia. (a) The retina before plasmapheresis shows distension of retinal vessels, particularly the veins which show bulging and constriction (the ‘linked sausage’ effect) and areas of haemorrhage; (b) following plasmapheresis the vessels have returned to normal and the areas of haemorrhage have cleared.
(a) (b)
plasmapheresis in myeloma, Waldenström’s disease or hyperfibrinogenaemia; and leucopheresis or chemotherapy in leukaemias associated with high
white cell counts. The long-term treatment depends on control of the primary disease with specific therapy.
SU
MM
AR
Y ■ The term paraproteinaemia refers to the presence of a monoclonal immunoglobulin band in serum and reflects the synthesis of immunoglobulin from a single clone of plasma cells.
■ Multiple myeloma (myelomatosis) is a tumour of plasma cells that accumulate in the bone marrow, release a paraprotein and cause tissue damage. The disease has a peak incidence in the seventh decade.
■ Almost all cases of myeloma develop from a pre-existing monoclonal gammopathy of undetermined significance (MGUS) in which there is low level paraprotein and no evidence of tissue damage. Approximately 1% of cases progress to myeloma each year.
■ A useful reminder for the spectrum of tissue damage in myeloma is CRAB – hypercalaemia, renal impairment, anaemia, bone disease.
x / How to get the best out of your textbook

Features contained within your textbook
Every chapter has its own chapter - opening page that offers a list of key topics contained within the chapter Throughout your textbook you will fi nd a series of icons outlining the learning features in the book:
RE
VI S
ED
Essential Haematology, 6th Edition. © A. V. Hoffbrand and P. A. H. Moss. Published 2011 by Blackwell Publishing Ltd.
Key topics■ Site of haemopoiesis 2
■ Haemopoietic stem and progenitor cells 2
■ Bone marrow stroma 3
■ Tissue-specific stem cells 5
■ The regulation of haemopoiesis 6
■ Haemopoietic growth factors 6
■ Growth factor receptors and signal transduction 8
■ The cell cycle 10
■ Apoptosis 11
■ Transcription factors 13
■ Adhesion molecules 13
CHAPTER 1
Haemopoiesis
RE
VI S
ED
Essential Haematology, 6th Edition. © A. V. Hoffbrand and P. A. H. Moss. Published 2011 by Blackwell Publishing Ltd.
Key topics■ Megaloblastic anaemias 59
■ Vitamin B12 59
■ Folate 62
■ Vitamin B12 deficiency 63
■ Folate deficiency 64
■ Clinical features of megaloblastic anaemia 65
■ Diagnosis of vitamin B12 or folate deficiency 67
■ Other megaloblastic anaemias 71
■ Systemic diseases associated with folate or vitamin B12 deficiency 71
■ Other macrocytic anaemias 71
CHAPTER 5
Megaloblastic anaemias and other macrocytic anaemias
▲
▼
The coloured line in the margin indicates text that we consider more advanced than is needed for undergraduate medical students and more appropriate for postgraduates
Self - assessment multiple choice questions and answers are available on the companion website: www.wiley.com/go/essentialhaematology . You can also access these questions by clicking on this icon in your Desktop Edition
Your textbook is full of useful photographs, illustrations and tables. The Desktop Edition version of your textbook will allow you to copy and paste any photograph or illustration into assignments, presentations and your own notes. The photographs and illustrations are also available to download from the companion website
SU
MM
AR
Y Haemolytic anaemia is caused by shortening of the red cell life. The red cells may break down in the reticuloendothelial system (extravascular) or in the circulation (intravascular).
Haemolytic anaemia may be caused by inherited red cell defects, which are usually intrinsic to the red cell, or to acquired causes, which are usually caused by an abnormality of the red cell environment.
Features of extravascular haemolysis include jaundice, gallstones and splenomegaly with raised reticulocytes, unconjugated bilirubin and absent haptoglobins. In intravascular haemolysis (e.g. caused by ABO mismatched blood
transfusion), there is haemoglobinaemia, methaemalbuminaemia, haemoglobinuria and haemosiderinuria.
Genetic defects include those of the red cell membrane (e.g. hereditary spherocytosis), enzyme deficiencies (e.g. glucose-6-phosphate dehydrogenase or pyruvate kinase deficiency) or haemoglobin defects (e.g. sickle cell anaemia).
Acquired causes of haemolytic anaemia include warm or cold, auto- or allo-antibodies to red cells, red cell fragmentation syndromes, infections, toxins and paroxysmal nocturnal haemoglobinuria.
▲
▼
We hope you enjoy using your new textbook. Good luck with your studies!
Every chapter ends with a chapter summary which can be used for both study and revision purposes
▲
RE
VI S
ED
230 / Chapter 17 Acute lymphoblastic leukaemia
Figure 17.7 Detection of minimal residual disease (MRD) by four-colour flow cytometry in: normal bone marrow mononuclear cells (BM), BM from a patient with B lineage ALL at diagnosis and in remission 6 weeks after diagnosis. The cells were detected with four different antibodies (anti-CD10, anti-CD19, anti-CD34, anti-CD38) attached to fluorescent labels abbreviated as PE, APC, PerCP and FITC, respectively. The tridimensional plot shows the immunophenotype of CD19+ lymphoid cells in the three samples. MRD of 0.03% of cells expressing the leukaemia-associated phenotype (CD10+, CD34+, CD38−) were detected at 6 weeks, confirmed by polymer-ase chain reaction (PCR) analysis. (From Campana D. and Coustan-Smith E. (1999) Commun Clin Cytometry 38, 139–52, with permission.)
Normal BM ALL diagnosis
CD19 APC
CD
10 P
E
CD38 FITC CD34
Per
CP
CD
10 P
E
CD38 FITC CD34
Per
CP
CD
10 P
E
CD38 FITC CD34
Per
CP
ALL remission
Figure 17.6 Acute lymphoblastic leukaemia (ALL). (a) Flow chart illustrating typical treatment regimen. (b) Kaplan–Meier analyses of overall survival in 2628 children with newly diagnosed ALL. (Updated from Pui C.H. and Evans W.E. (2006) N Engl J Med 354, 169.)
00 10 20
Years after diagnosis30
60
80
20
40
Pro
bab
ility
of
ove
rall
surv
ival
(%
)
100
40
Studies 1 to 4, 1962–1966 Studies 5 to 9, 1967–1979 Study 10, 1979–1983 Studies 11 and 12, 1984–1991 Studies 13A, 13B and 14, 1991–1999 Study 15, 2000–2010
Inductione.g. vincristine, asparginase, dexamethasone (or prednisolone) ± daunorubicin
Consolidatione.g. daunorubicin, cytosine arabinoside, vincristine, etoposide, thioguanine or mercaptopurine, cyclophosphamide in one to four courses
Cranial prophylaxise.g. high dose systemic methotrexate or multiple intrathecal methotrexate or cranial irradiation (1800–2400 rad) + intrathecal methotrexate
Maintenance therapye.g. mercaptopurine, methotrexate, vincristine, dexamethasone (or prednisolone)
Late intensification (as consolidation)
Possible stem celltransplantation
(a)
(b)
Maintenance therapy as above (2–3 years)
84±2
74±2
48±2
21±4
81±2
96±3
RE
VI S
ED
Chapter 17 Acute lymphoblastic leukaemia / 231
involve the use of vincristine, cyclophosphamide, cytosine arabinoside, daunorubicin, etoposide or mercaptopurine given as blocks in different combi-nations. Three blocks of intensification are generally given for children, with more sometimes used in adults.
Central nervous system directed therapyFew of the drugs given systemically are able to reach the CSF and specific treatment is required to prevent or treat central nervous system (CNS) disease. Options are high-dose methotrexate given intravenously, intrathecal methotrexate or cytosine arabinoside, or cranial irradiation. Cranial irradia-tion is now avoided as far as possible in children because of substantial side-effects. CNS relapses still occur and present with headache, vomiting, papil-loedema and blast cells in the CSF. Treatment is with intrathecal methotrexate, cytosine arabinoside and hydrocortisone, with or without cranial irradia-tion and systemic reinduction because bone marrow disease is usually also present.
MaintenanceThis is given for 2 years in girls and adults and for 3 years in boys, with daily oral mercaptopurine and once-weekly oral methotrexate. Intravenous vincris-tine with a short course (5 days) of oral dexametha-
from the complications of bone marrow failure and leukaemic infiltration (Fig. 17.1). The aim of remission induction is to rapidly kill most of the tumour cells and get the patient into remission. This is defined as less than 5% blasts in the bone marrow, normal peripheral blood count and no other symp-toms or signs of the disease. Dexamethasone, vinc-ristine and asparaginase are the drugs usually used and they are very effective – achieving remission in over 90% of children and in 80–90% of adults (in whom daunorubicin is also usually added). However, it should be remembered that remission is not the same as cure. In remission a patient may still be harbouring large numbers of tumour cells and without further chemotherapy virtually all patients will relapse (see Fig. 13.8). Nevertheless, achievement of remission is a valuable first step in the treatment course. Patients who fail to achieve remission need to change to a more intensive protocol.
Intensification (consolidation)These courses use high doses of multidrug chemo-therapy in order to eliminate the disease or reduce the tumour burden to very low levels. The doses of chemotherapy are near the limit of patient tolerabil-ity and during intensification blocks patients may need a great deal of support. Typical protocols
Figure 17.8 Cumulative incidence of relapse according to minimal residual disease (MRD) levels at the end of remission induction in children with acute lymphoblastic leukaemia (ALL) treated at St Jude Children’s Research Hospital. (Courtesy of Dr D. Campana.)
00 2 4
Years6 81 3 5 7
60
80
20
40
Cu
mu
lati
ve in
cid
ence
of
rela
pse
100
72% MRD+ (≥1%) n = 9
43% MRD+ (≥0.1% – <1%) n = 14
23% MRD+ (<0.1%) n = 19
10% MRD– n = 123
ranial irradia-le in children
NS relapses stillmiting, papil-Treatment is
ne arabinoside cranial irradia-e bone marrow
adults and forptopurine and venous vincris-al dexametha-
RE
VI S
ED
186 / Chapter 13 Acute myeloid leukaemia
Prognosis and treatment stratification
The outcome for an individual patient with AML will depend on a number of factors including age and white cell count at presentation. However, the genetic abnormalities in the tumour are the most important determinant.
Promyelocytic leukaemia with the t(15; 17) translocation responds to treatment with high doses of ATRA which causes differentiation of the abnor-mal promyelocytes and results in improved progno-sis. Interestingly, in rare variants of RARα is fused to other genes and in these cases ATRA treatment is not successful.
Figure 13.6 FACS analysis of AML – tumour cells are initially gated on forward scatter (FSC) versus side scatter (SSC). Further analysis reveals (i) lack of expression of lymphocyte markers (CD3 and CD19), (ii) expression of CD33 and (iii) CD117 as well as HLA-DR on a subset of cells.
100 101 102 103 104
FL2-H: CD117 PE
100
101
102
103
104
FL4
-H: C
D33
AP
C
100 101 102 103 104
FL1-H: Anti-HLA-DR FITC
100
101
102
103
104
FL2
-H: C
D11
7 P
E
100 101 102 103 104
FL3-H: CD34 PerCP
100
101
102
103
104
FL4
-H: C
D33
AP
C
100 101 102 103 104
FL3-H: CD3 PerCP
100
101
102
103
104
FL4
-H: C
D19
AP
C
0 200 400 600 800 1000
FSC-H: Forward Scatter
0
200
400
600
800
1000
SS
C-H
: Sid
e S
catte
r
92.4
Figure 13.7 Generation of the t(15; 17) translocation. The PML gene at 15q22 may break at one of three different breakpoint cluster regions (BCR-1, -2 and -3) and joins with exons 3–9 of the RARα gene at 17q12. Three different fusion mRNAs are generated (termed long (L), variable (V) or short (S)) and these give rise to fusion proteins of different size. In this diagram only the long version resulting from a break at BCR-1 is shown.
BCR-1/LPML RAR α
PML
15q22
BCR-1
1 2 3 4 5 6
RAR α
17q123 4 5 6 7 8 9
RE
VI S
ED
Chapter 13 Acute myeloid leukaemia / 187
An important concept developing in AML therapy is that of basing the treatment schedule of individual patients on their risk group. Favourable cytogenetics and remission after one course of chemotherapy both predict for a better prognosis. In contrast, monosomy 5 or 7 abnormalities, blast cells with the FLT3 internal tandem duplication mutation or poorly responsive disease places patients into poor risk groups which need more intensive treatments (Table 13.3).
Monitoring of minimal residual disease during and after chemotherapy is being investigated as a means to guide appropriate treatment. It may be performed by polymerase chain reaction (PCR) or flow cytometric analysis of the abnormal ‘leukaemia-associated immunophenotype’ that is seen in over 90% of cases.
Figure 13.8 Acute leukaemia: principles of therapy. ALL, acute lymphoblastic leukaemia; SCT, stem cell transplantation; TBI, total body irradiation.
100 0.0001Time
Conventional detection level
Resistant disease(biochemical,anatomical,biologicalresistance)
100
10
1
0.1
0.01
0.001
106
108
102
104
Nu
mb
er o
f le
uka
emic
cel
ls
% le
uka
emic
cel
ls in
bo
ne
mar
row
1010 5
1012
Maintenancechemotherapy(ALL)
Completeremission
Remissioninduction
Consolidation
Bonemarrowfailure Mild
Severe
Relapse
SCT(chemo±TBI)
Detection level by molecular orimmunological techniques
Figure 13.9 Acute myeloid leukaemia: flow chart illustrating typical treatment regimen.
Inductione.g. daunorubicin, cytosine arabinoside, thioguanine or etoposide
Consolidatione.g. daunorubicin, cytosine arabinoside, thioguanine or etoposide
Consolidatione.g. m-AMSA, etoposide, cytosine arabinoside
Possible stem celltransplantation,allogeneic or autologous
Further consolidatione.g. mitoxantrone, idarubicin, high dose cytosine arabinoside, anti-CD33 antibody
How to get the best out of your textbook / xi

Essential Haematology, 6th Edition. © A. V. Hoffbrand and P. A. H. Moss. Published 2011 by Blackwell Publishing Ltd.
Key t opics ■ Site of haemopoiesis 2
■ Haemopoietic stem and progenitor cells 2
■ Bone marrow stroma 3
■ Tissue - specifi c stem cells 5
■ The regulation of haemopoiesis 6
■ Haemopoietic growth factors 6
■ Growth factor receptors and signal transduction 8
■ The cell cycle 10
■ Apoptosis 11
■ Transcription factors 13
■ Adhesion molecules 13
CHAPTER 1
Haemopoiesis

2 / Chapter 1 Haemopoiesis
marrow consists of fat (Fig. 1.1 ). Th e remaining fatty marrow is capable of reversion to haemopoiesis and in many diseases there is also expansion of haemopoiesis down the long bones. Moreover, the liver and spleen can resume their fetal haemopoietic role ( ‘ extramedullary haemopoiesis ’ ).
Haemopoietic s tem and p rogenitor c ells
Haemopoiesis starts with a pluripotential stem cell that can self - renew but also give rise to the separate cell lineages. Th ese cells are able to repopulate a bone marrow from which all stem cells have been eliminated by lethal irradiation or chemotherapy. Th is haemopoietic stem cell is rare, perhaps 1 in every 20 million nucleated cells in bone marrow. Although its exact phenotype is unknown, on immunological testing it is CD34 + CD38 − and negative for lineage markers (Lin − ) and has the appearance of a small or medium - sized lymphocyte (see Fig. 23.3 ). Th e cells reside in specialized ‘ niches ’ . Cell diff erentiation occurs from the stem cell via committed haemopoietic progenitors which are restricted in their developmental potential (Fig. 1.2 ). Th e existence of the separate progenitor cells can be demonstrated by in vitro culture techniques. Very early progenitors are assayed by culture on bone marrow stroma as long - term culture initiating cells whereas late progenitors are generally assayed
Th is fi rst chapter is concerned with the general aspects of blood cell formation (haemopoiesis). Th e processes that regulate haemopoiesis and the early stages of formation of red cells (erythropoiesis), granulocytes and monocytes (myelopoiesis) and platelets (thrombopoiesis) are also discussed.
Site of h aemopoiesis
In the fi rst few weeks of gestation the yolk sac is the main site of haemopoiesis. However, defi nitive hae-mopoiesis derives from a population of stem cells fi rst observed on the dorsal aorta termed the AGM (aorta - gonads - mesonephros) region. Th ese common precursors of endothelial and haemopoietic cells (haemangioblasts) are believed to seed the liver, spleen and bone marrow and from 6 weeks until 6 – 7 months of fetal life the liver and spleen are the major haemopoietic organs and continue to produce blood cells until about 2 weeks after birth (Table 1.1 ; see Fig. 7.1 b ). Th e bone marrow is the most important site from 6 to 7 months of fetal life. During normal childhood and adult life the marrow is the only source of new blood cells. Th e develop-ing cells are situated outside the bone marrow sinuses; mature cells are released into the sinus spaces, the marrow microcirculation and so into the general circulation.
In infancy all the bone marrow is haemopoietic but during childhood there is progressive fatty replacement of marrow throughout the long bones so that in adult life haemopoietic marrow is con-fi ned to the central skeleton and proximal ends of the femurs and humeri (Table 1.1 ). Even in these haemopoietic areas, approximately 50% of the
Table 1.1 Sites of haemopoiesis.
Fetus 0 – 2 months (yolk sac) 2 – 7 months (liver, spleen) 5 – 9 months (bone marrow)
Infants Bone marrow (practically all bones)
Adults Vertebrae, ribs, sternum, skull, sacrum and pelvis, proximal ends of femur
Figure 1.1 A normal bone marrow trephine biopsy (posterior iliac crest). Haematoxylin and eosin stain; approximately 50% of the intertrabecular tissue is haemopoietic tissue and 50% is fat.

Chapter 1 Haemopoiesis / 3
cells are, however, capable of responding to haemo-poietic growth factors with increased production of one or other cell line when the need arises. Th e development of the mature cells (red cells, granulocytes, monocytes, megakaryocytes and lym-phocytes) is considered further in other sections of this book.
Bone m arrow s troma
Th e bone marrow forms a suitable environment for stem cell survival, self - renewal and formation of diff erentiated progenitor cells. It is composed of stromal cells and a microvascular network (Fig. 1.4 ).
in semi - solid media. An example is the earliest detectable mixed myeloid precursor which gives rise to granulocytes, erythrocytes, monocytes and meg-akaryocytes and is termed CFU (colony - forming unit) - GEMM (Fig. 1.2 ). Th e bone marrow is also the primary site of origin of lymphocytes (see Chapter 9 ) which diff erentiate from a common lymphoid precursor.
Th e stem cell has the capability for self - renewal (Fig. 1.3 ) so that marrow cellularity remains con-stant in a normal healthy steady state. Th ere is con-siderable amplifi cation in the system: one stem cell is capable of producing about 10 6 mature blood cells after 20 cell divisions (Fig. 1.3 ). Th e precursor
Figure 1.2 Diagrammatic representation of the bone marrow pluripotent stem cell and the cell lines that arise from it. Various progenitor cells can be identifi ed by culture in semi - solid medium by the type of colony they form. It is possible that an erythroid/megakaryocytic progenitor may be formed before the common lymphoid progenitor diverges from the mixed granulocytic/monocyte/eosinophil myeloid progenitor. Baso, basophil; BFU, burst - forming unit; CFU, colony - forming unit; E, erythroid; Eo, eosinophil; GEMM, granulocyte, erythroid, monocyte and megakaryocyte; GM, granulocyte, monocyte; Meg, megakaryocyte; NK, natural killer.
Pluripotentstem cell
Erythroidprogenitors
CFUGEMMCommon myeloidprogenitor cell
BFUE
CFUE
CFUMegMegakary-ocyteprogenitor
CFUGMGranulocytemonocyteprogenitor
CFUEoEosinophilprogenitor
CFUGMEo
CFUbaso
Thymus
CFU-M CFU-G
Common lymphoidprogenitor cell
Redcells
Platelets Mono-cytes
Neutro-phils
Eosino-phils
Baso-phils
Lymphocytes NK cell
B T NK

4 / Chapter 1 Haemopoiesis
In addition, stromal cells secrete several growth factors necessary for stem cell survival.
Mesenchymal stem cells , also called multipo-tent mesenchymal stromal cells or adherent stromal cells, are critical in stromal cell formation. Together with osteoblasts they form niches and provide the
Th e stromal cells include adipocytes, fi broblasts, osteoblasts, endothelial cells and macrophages and they secrete extracellular molecules such as collagen, glycoproteins (fi bronectin and thrombospondin) and glycosaminoglycans (hyaluronic acid and chon-droitin derivatives) to form an extracellular matrix.
Figure 1.3 (a) Bone marrow cells are increasingly differentiated and lose the capacity for self - renewal as they mature. (b) A single stem cell gives rise, after multiple cell divisions (shown by vertical lines), to > 10 6 mature cells.
(b)
Maturecells
Recognizablecommitted
marrowprecursors
Multipotentprogenitor cells
Stemcells
Selfrenewal
Multiplication
Differentiation
(a)
Figure 1.4 Haemopoiesis occurs in a suitable microenvironment ( ‘ niche ’ ) provided by a stromal matrix on which stem cells grow and divide. There are specifi c recognition and adhesion sites (see p. 13 ); extracellular glycopro-teins and other compounds are involved in the binding.
Stem cell
Extracellularmatrix
Fat cell
Fibroblast
Adhesion molecule
Growth factor
Ligand
Growth factor receptor
Endothelial cell
Macrophage

Chapter 1 Haemopoiesis / 5
tions maintain stem cell viability and production in the stroma including stem cell factor (SCF) and jagged proteins expressed on stroma and their respective receptors KIT and NOTCH expressed on stem cell.
Tissue - s pecifi c s tem c ells
Stem cells are present in many diff erent organs. Th ese are pluripotent and can generate various types of tissue, e.g. epithelial cells, nerve cells (Fig. 1.5 ). Studies in patients and animals who have received haemopoietic stem cell transplants (see Chapter 23 ) have suggested that donor haemopoi-etic cells may contribute to tissues such as neurons,
growth factors, adhesion molecules and cytokines which support stem cells, e.g. the protein jagged, on stromal cells binds to a receptor NOTCH1 on stem cells which then becomes a transcription factor involved in the cell cycle.
Stem cells are able to traffi c around the body and are found in peripheral blood in low numbers. In order to exit the bone marrow, cells must cross the blood vessel endothelium and this process of mobilization is enhanced by administration of growth factors such as granulocyte colony - stimulating factor (G - CSF) (see p. 6 ). Th e reverse process of stem cell homing appears to depend on a chemokine gradient in which the stromal - derived factor 1 (SDF - 1) is critical. Several critical interac-
Figure 1.5 (a) Cells from the inner cell mass of the blastocyst in the early embryo are able to generate all the tissues of the body and are known as totipotent. (b) Specialized adult stem cells of the bone marrow, nervous tissue, epithelial and other tissues give rise to differentiated cells of the same tissue.
Neuraltissues
Muscle,tendon,cartilage,fat, etc.
Epithelialstem cell
Neuralstem cellMesenchymal
stem cell
Myeloid andlymphoid cells
Embryonic stem cells
Pluripotent somatic stem cells
Haemopoieticstem cell
Liver, etc.
Totipotent cell
(b)
(a)

6 / Chapter 1 Haemopoiesis
liver and muscle. Th e contribution of adult donor haemopoietic cells to non - haemopoietic tissues is at most very small. Th e persistence of pluripotential stem cells in postnatal life, the presence of mesen-chymal stem cells in bone marrow and fusion of transplanted cells with host cells have all been pro-posed to explain many of the fi ndings suggesting stem cell ‘ plasticity ’ .
The r egulation of h aemopoiesis
Haemopoiesis starts with stem cell division in which one cell replaces the stem cell ( self - renewal ) and the other is committed to diff erentiation. Th ese early committed progenitors express low levels of tran-scription factors that may commit them to discrete cell lineages. Which cell lineage is selected for dif-ferentiation may depend both on chance and on the external signals received by progenitor cells. Several transcription factors (see p. 13 ) regulate survival of stem cells (e.g. SCL, GATA - 2, NOTCH - 1) whereas others are involved in diff erentiation along the major cell lineages. For instance, PU.1 and the CEBP family commit cells to the myeloid lineage whereas GATA - 1 and FOG - 1 have an essential roles in erythropoietic and megakaryocytic diff erentiation.
Haemopoietic g rowth f actors
Th e haemopoietic growth factors are glycoprotein hormones that regulate the proliferation and dif-ferentiation of haemopoietic progenitor cells and the function of mature blood cells. Th ey may act locally at the site where they are produced by cell – cell contact or circulate in plasma. Th ey also bind to the extracellular matrix to form niches to which stem and progenitor cells adhere. Th e growth factors may cause cell proliferation but can also stimulate diff erentiation, maturation, prevent apoptosis and aff ect the function of mature cells (Fig. 1.6 ).
Th ey share a number of common properties (Table 1.2 ) and act at diff erent stages of haemopoi-esis (Table 1.3 ; Fig. 1.7 ). Stromal cells are the major
Table 1.2 General characteristics of myeloid and lymphoid growth factors.
Glycoproteins that act at very low concentrations
Act hierarchically
Usually produced by many cell types
Usually affect more than one lineage
Usually active on stem/progenitor cells and on functional end cells
Usually show synergistic or additive interactions with other growth factors
Often act on the neoplastic equivalent of a normal cell
Multiple actions: proliferation, differentiation, maturation, functional activation, prevention of apoptosis of progenitor cells
Table 1.3 Haemopoietic growth factors.
Act on stromal cells IL - 1 TNF
Act on pluripotential stem cells SCF FLT3 - L VEGF
Act on multipotential progenitor cells IL - 3 GM - CSF IL - 6 G - CSF Thrombopoietin
Act on committed progenitor cells G - CSF * M - CSF IL - 5 (eosinophil - CSF) Erythropoietin Thrombopoietin *
CSF, colony - stimulating factor; FLT3 - L, FLT3 ligand; G - CSF, granulocyte colony - stimulating factor; GM - CSF, granulocyte – macrophage colony - stimulating factor; IL, interleukin; M - CSF, macrophage colony - stimulating factor; SCF, stem cell factor; TNF, tumour necrosis factor; VEGF, vascular endothelial growth factor. * These also act synergistically with early acting factors on pluripotential progenitors.

Chapter 1 Haemopoiesis / 7
myeloid and lymphoid progenitors (Fig. 1.7 ). Interleukin - 3 (IL - 3) and granuloctye – macrophage colony - stimulating factor (GM - CSF) are multipo-tential growth factors with overlapping activities. G - CSF and thrombopoietin enhance the eff ects of SCF, FLT - L, IL - 3 and GM - CSF on survival and diff erentiation of the early haemopoietic cells.
Th ese factors maintain a pool of haemopoietic stem and progenitor cells on which later acting factors erythropoietin, G - CSF, macrophage colony -
source of growth factors except for erythropoietin, 90% of which is synthesized in the kidney, and thrombopoietin, made largely in the liver. An important feature of growth factor action is that two or more factors may synergize in stimulating a par-ticular cell to proliferate or diff erentiate. Moreover, the action of one growth factor on a cell may stimu-late production of another growth factor or growth factor receptor. SCF and FLT ligand (FLT - L) act locally on the pluripotential stem cells and on early
Figure 1.6 Growth factors may stimulate proliferation of early bone marrow cells, direct differentiation to one or other cell type, stimulate cell maturation, suppress apoptosis or affect the function of mature non - dividing cells, as illustrated here for granulocyte colony - stimulating factor (G - CSF) for an early myeloid progenitor and a neutrophil.
Activation ofphagocytosis,killing, secretion
Proliferation
Differentiation
Maturation
Early cell
Late cell
G-CSF
G-CSF
G-CSF
Suppressionof apoptosis
Functionalactivation
G-CSF
Monocyte
Neutrophil
G-CSF

8 / Chapter 1 Haemopoiesis
Figure 1.7 A diagram of the role of growth factors in normal haemopoiesis. Multiple growth factors act on the earlier marrow stem and progenitor cells. EPO, erythropoietin; PSC, pluripotential stem cell; SCF, stem cell factor; TPO, thrombopoietin. For other abbreviations see Fig. 1.2 .
IL-3 IL-3
TPO
Platelets Monocytes Neutrophils EosinophilsRed cells
SCF
EPO
GM-CSF GM-CSF
BFUEMeg
CFUMeg
CFUE
BFUE
PSC
CFUM CFUG
CFUGMM-CSF G-CSF
IL-5
CFUEo
CFU-GEMM
CFU-GMEo
stimulating factor (M - CSF), IL - 5 and thrombopoi-etin act to increase production of one or other cell lineage in response to the body ’ s need. Granulocyte and monocyte formation, for example, can be stim-ulated by infection or infl ammation through release of IL - 1 and tumour necrosis factor (TNF) which then stimulate stromal cells to produce growth factors in an interacting network (see Fig. 8.4 ). In contrast, cytokines such as transforming growth factor - β (TGF - β ) and γ - interferon (IFN - γ ) can exert a negative eff ect on haemopoiesis and may have a role in the development of aplastic anaemia (see p. 290 ).
Growth f actor r eceptors and s ignal t ransduction
Th e biological eff ects of growth factors are mediated through specifi c receptors on target cells. Many
receptors (e.g. erythropoietin (epo) receptor (R), GMCSF - R) are from the haematopoietin receptor superfamily which dimerize after binding their ligand.
Dimerization of the receptor leads to activation of a complex series of intracellular signal transduc-tion pathways of which the three major ones are the JAK/STAT, the mitogen - activated protein (MAP) kinase and the phosphatidylinositol 3 (PI3) kinase pathways (Fig. 1.8 ; see Fig. 15.2 ). Th e Janus - associated kinase (JAK) proteins are a family of four tyrosine - specifi c protein kinases that associate with the intracellular domains of the growth factor recep-tors (Fig. 1.8 ). A growth factor molecule binds simultaneously to the extracellular domains of two or three receptor molecules, resulting in their aggre-gation. Receptor aggregation induces activation of the JAKs which now phosphorylate members of the signal transducer and activator of transcription (STAT) family of transcription factors. Th is results

Chapter 1 Haemopoiesis / 9
Figure 1.8 Control of haemopoiesis by growth factors. The factors act on cells expressing the corresponding receptors. Binding of a growth factor to its receptor activates the JAK/STAT, MAPK and phosphatidyl - inositol 3 - kinase (PI3K) pathways (see Fig. 15.2 ) which leads to transcriptional activation of specifi c genes. E2F is a transcription factor needed for cell transition from G1 to S phase. E2F is inhibited by the tumour suppressor gene Rb (retinoblastoma) which can be indirectly activated by p53. The synthesis and degradation of different cyclins (Fig. 1.10 ) stimulates the cell to pass through the different phases of the cell cycle. The growth factors may also suppress apoptosis by activating AKT (protein kinase B).
Gene expression
MYC, FOS
MAP kinase
Blockedapoptosis
RAF
RAS
Active STAT dimers
Activation ofgene expression
STATs
JAK
JAKAKT
PI3KinasePlasma membrane
Nucleus
Growthfactor
M
G2 G1
S
Rb
p53
DNA damage
E2F

10 / Chapter 1 Haemopoiesis
Figure 1.9 Model for control of gene expression by a transcription factor. The DNA - binding domain of a transcription factor binds a specifi c enhancer sequence adjacent to a structural gene. The transactivation domain then binds a molecule of RNA polymerase, thus augmenting its binding to the TATA box. The RNA polymerase now initiates transcription of the structural gene to form mRNA. Translation of the mRNA by the ribosomes generates the protein encoded by the gene.
RNA polymerase+
accessory factorsTranscription
DNA-bindingdomain
Transactivationdomain
EnhancerDNA sequence
TATA boxsequence
(promotor)
Structuralgene
in their dimerization and translocation from the cell cytoplasm across the nuclear membrane to the cell nucleus. Within the nucleus STAT dimers activate transcription of specifi c genes. A model for control of gene expression by a transcription factor is shown in Fig. 1.9 . Th e clinical importance of this pathway is revealed by the fi nding of an activating mutation of the JAK2 gene as the cause of polycythaemia rubra vera (see p. 201 ).
JAK can also activate the MAPK pathway which is regulated by Ras and controls proliferation. PI3 kinases phophorylate inositol lipids which have a wide range of downstream eff ects including activa-tion of AKT leading to block of apoptosis and other actions (Fig. 1.8 ; see Fig. 15.2 ). Diff erent domains of the intracellular receptor protein may signal for the diff erent processes (e.g. proliferation or suppression of apoptosis) mediated by growth factors.
A second smaller group of growth factors, including SCF, FLT - 3L and M - CSF (Table 1.3 ), bind to receptors that have an extracellular immunoglobulin - like domain linked via a trans-membrane bridge to a cytoplasmic tyrosine kinase domain. Growth factor binding results in dimeriza-tion of these receptors and consequent activation of the tyrosine kinase domain. Phosphorylation of tyrosine residues in the receptor itself generates binding sites for signalling proteins which initiate
complex cascades of biochemical events resulting in changes in gene expression, cell proliferation and prevention of apoptosis.
The c ell c ycle
Th e cell division cycle, generally known simply as the cell cycle , is a complex process that lies at the heart of haemopoiesis. Dysregulation of cell prolif-eration is also the key to the development of malig-nant disease. Th e duration of the cell cycle is variable between diff erent tissues but the basic principles remain constant. Th e cycle is divided into the mitotic phase ( M phase ), during which the cell physically divides, and interphase during which the chromosomes are duplicated and cell growth occurs prior to division (Fig. 1.10 ). Th e M phase is further partitioned into classical mitosis in which nuclear division is accomplished, and cytokinesis in which cell fi ssion occurs.
Interphase is divided into three main stages: a G 1 phase in which the cell begins to commit to replication, an S phase during which DNA content doubles (Fig. 1.10 b) and the chromosomes replicate and the G 2 phase in which the cell organelles are copied and cytoplasmic volume is increased. If cells rest prior to division they enter a G 0 state where they can remain for long periods of time. Th e number of cells at each stage of the cell cycle can
Chapter 1 Haemopoiesis / 11
M
M phase
G2 G1
G0
S
Interphase(a)
(b)
Cdk2
Cdk2Cdk2
CyclinA
CyclinB
CyclinE
Phase of cell cycle
G1 S G2 M
DN
A c
on
ten
t
4c
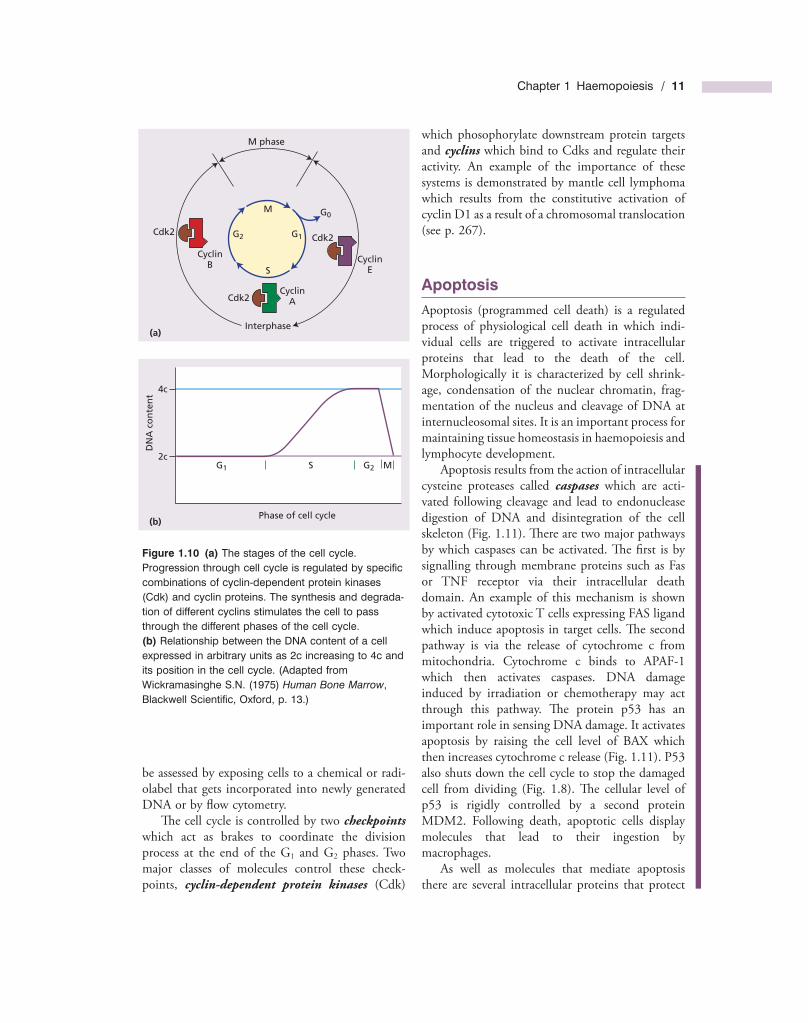
2c
Figure 1.10 (a) The stages of the cell cycle. Progression through cell cycle is regulated by specifi c combinations of cyclin - dependent protein kinases (Cdk) and cyclin proteins. The synthesis and degrada-tion of different cyclins stimulates the cell to pass through the different phases of the cell cycle. (b) Relationship between the DNA content of a cell expressed in arbitrary units as 2c increasing to 4c and its position in the cell cycle. (Adapted from Wickramasinghe S.N. (1975) Human Bone Marrow , Blackwell Scientifi c, Oxford, p. 13.)
be assessed by exposing cells to a chemical or radi-olabel that gets incorporated into newly generated DNA or by fl ow cytometry.
Th e cell cycle is controlled by two checkpoints which act as brakes to coordinate the division process at the end of the G 1 and G 2 phases. Two major classes of molecules control these check-points, cyclin - dependent protein kinases (Cdk)
which phosophorylate downstream protein targets and cyclins which bind to Cdks and regulate their activity. An example of the importance of these systems is demonstrated by mantle cell lymphoma which results from the constitutive activation of cyclin D1 as a result of a chromosomal translocation (see p. 267 ).
Apoptosis
Apoptosis (programmed cell death) is a regulated process of physiological cell death in which indi-vidual cells are triggered to activate intracellular proteins that lead to the death of the cell. Morphologically it is characterized by cell shrink-age, condensation of the nuclear chromatin, frag-mentation of the nucleus and cleavage of DNA at internucleosomal sites. It is an important process for maintaining tissue homeostasis in haemopoiesis and lymphocyte development.
Apoptosis results from the action of intracellular cysteine proteases called caspases which are acti-vated following cleavage and lead to endonuclease digestion of DNA and disintegration of the cell skeleton (Fig. 1.11 ). Th ere are two major pathways by which caspases can be activated. Th e fi rst is by signalling through membrane proteins such as Fas or TNF receptor via their intracellular death domain. An example of this mechanism is shown by activated cytotoxic T cells expressing FAS ligand which induce apoptosis in target cells. Th e second pathway is via the release of cytochrome c from mitochondria. Cytochrome c binds to APAF - 1 which then activates caspases. DNA damage induced by irradiation or chemotherapy may act through this pathway. Th e protein p53 has an important role in sensing DNA damage. It activates apoptosis by raising the cell level of BAX which then increases cytochrome c release (Fig. 1.11 ). P53 also shuts down the cell cycle to stop the damaged cell from dividing (Fig. 1.8 ). Th e cellular level of p53 is rigidly controlled by a second protein MDM2. Following death, apoptotic cells display molecules that lead to their ingestion by macrophages.
As well as molecules that mediate apoptosis there are several intracellular proteins that protect

12 / Chapter 1 Haemopoiesis
Overexpression of the BCL - 2 protein makes the malignant B cells less susceptible to apoptosis. Apoptosis is the normal fate for most B cells undergoing selection in the lymphoid germinal centres.
Several translocations leading to the generation of fusion proteins such as t(9; 22), t(1; 14) and t(15; 17) also result in inhibition of apoptosis (see Chapter 11 ). In addition, genes encoding proteins that are involved in mediating apoptosis following DNA damage, such as p53 and ATM, are also fre-quently mutated and therefore inactivated in hae-mopoietic malignancies.
Necrosis is death of cells and adjacent cells due to ischemia, chemical trauma or hyperthermia. Th e
cells from apoptosis. Th e best characterized example is BCL - 2. BCL - 2 is the prototype of a family of related proteins, some of which are anti - apoptotic and some, like BAX, pro - apoptotic. Th e intracel-lular ratio of BAX and BCL - 2 determines the relative susceptibility of cells to apoptosis (e.g. determines the lifespan of platelets) and may act through regulation of cytochrome c release from mitochondria.
Many of the genetic changes associated with malignant disease lead to a reduced rate of apoptosis and hence prolonged cell survival. Th e clearest example is the translocation of the BCL - 2 gene to the immunoglobulin heavy chain locus in the t(14; 18) translocation in follicular lymphoma.
Figure 1.11 Representation of apoptosis. Apoptosis is initiated via two main stimuli: (i) signalling through cell membrane receptors such as FAS or tumour necrosis factor (TNF) receptor; or (ii) release of cytochrome c from mitochondria. Membrane receptors signal apoptosis through an intracellular death domain leading to activation of caspases which digest DNA. Cytochrome c binds to the cytoplasmic protein Apaf - 1 leading to activation of caspases. The intracellular ratio of pro - apoptotic (e.g. BAX) or anti - apoptotic (e.g. BCL - 2) members of the BCL - 2 family may infl uence mitochondrial cytochrome c release. Growth factors raise the level of BCL - 2 inhibiting cytochrome c release whereas DNA damage, by activating p53, raises the level of BAX which enhances cytochrome c release.
BCL-2
IncreasedBCL-2
Survival factor e.g. growth factor
Death factor e.g. Fas ligand
Release ofcytochrome c
Inhibits
Deathdomain
Procaspases
Caspases
APOPTOSIS
DNAdamage
Cytotoxic drugsRadiation
BAX geneexpression
IncreasedBAX protein
p53

Chapter 1 Haemopoiesis / 13
1 Immunoglobulin superfamily Th is includes receptors that react with antigens (the T - cell receptors and the immunoglobulins) and antigen - independent surface adhesion molecules.
2 Selectins Th ese are mainly involved in leucocyte and platelet adhesion to endothelium during infl ammation and coagulation.
3 Integrins Th ese are involved in cell adhesion to extracellular matrix (e.g. to collagen in wound healing and in leucocyte and platelet adhesion).
Th e adhesion molecules are thus important in the development and maintenance of infl ammatory and immune responses, and in platelet – vessel wall and leucocyte – vessel wall interactions. Expression of adhesion molecules can be modifed by extracel-lular and intracellular factors and this alteration of expression may be quantitative or functional. IL - 1, TNF, IFN - γ , T - cell activation, adhesion to extracel-lular proteins and viral infection may all up - regulate expression of these molecules.
Th e pattern of expression of adhesion molecules on tumour cells may determine their mode of spread and tissue localization (e.g. the pattern of metastasis of carcinoma cells or non - Hodgkin lym-phoma cells into a follicular or diff use pattern). Th e adhesion molecules may also determine whether or not cells circulate in the bloodstream or remain fi xed in tissues. Th ey may also partly determine whether or not tumour cells are susceptible to the body ’ s immune defences.
cells swell, the plasma membrane loses integrity. Th ere is usually an infl ammatory infi ltrate in response to spillage of cell contents. Autophagy is the digestion of cell organelles by lysosomes. It may be involved in cell death but in some situations also in maintaining cell survival by recycling nutrients.
Transcription f actors
Transcription factors regulate gene expression by controlling the transcription of specifi c genes or gene families. Typically, they contain at least two domains: a DNA - binding domain such as a leucine zipper or helix - loop - helix motif which binds to a specifi c DNA sequence, and an activation domain which contributes to assembly of the transcription complex at a gene promoter (Fig. 1.9 ). Mutation, deletion or translocation of transcription factors underlie many cases of haematological neoplasms.
Adhesion m olecules
A large family of glycoprotein molecules termed adhesion molecules mediate the attachment of marrow precursors, leucocytes and platelets to various components of the extracellular matrix, to endothelium, to other surfaces and to each other. Th e adhesion molecules on the surface of leucocytes are termed receptors and these interact with mole-cules (termed ligands) on the surface of potential target cells. Th ree main families exist:
SU
MM
AR
Y
■ Haemopoiesis (blood cell formation) arises from pluripotent stem cells in the bone marrow. Stem cells give rise to progenitor cells which, after cell divisions and differentiation, form red cells, granulocytes (neutrophils, eosinophils and basophils), monocytes, platelets and B and T lymphocytes.
■ Haemopoetic tissue occupies about 50% of the marrow space in normal adult marrow. Haemopoiesis in adults is confi ned to the central skeleton but in
infants and young children haemopoietic tissue extends down the long bones of the arms and legs.
■ Stem cells reside in the bone marrow in niches formed by stromal cells and circulate in the blood.
■ Growth factors attach to specifi c cell receptors and produce a cascade of phosphorylation events to the cell nucleus. Transcription factors carry the message to those genes that are to be ‘ switched on ’ , to stimulate cell division,
(Continued)

14 / Chapter 1 Haemopoiesis
Now visit www.wiley.com/go/essentialhaematology to test yourself on this chapter.
differentiation, functional activity or suppress apoptosis.
■ Transcription factors are molecules that bind to DNA and control the transcription of specifi c genes or gene families.
■ Apoptosis is a physiological process of cell death resulting from activation of caspases. The intracellular ratio of pro - apoptotic
proteins (e.g. BAX) to anti - apoptotic proteins (e.g. BCL - 2) determines the cell susceptibility to apoptosis.
■ Adhesion molecules are a large family of glycoproteins that mediate attachment of marrow precursors and mature leucocytes and platelets to extracellular matrix, endothelium and to each other.

Essential Haematology, 6th Edition. © A. V. Hoffbrand and P. A. H. Moss. Published 2011 by Blackwell Publishing Ltd.
Key t opics ■ Erythropoietin 17
■ Haemoglobin 19
■ Red cell metabolism 22
■ Red cell membrane 22
■ Clinical features of anaemia 25
■ Classifi cation and laboratory fi ndings in anaemia 26
■ Assessment of erythropoiesis 29
CHAPTER 2
Erythropoiesis and g eneral a spects of a naemia
16 / Chapter 2 Erythropoiesis and anaemia
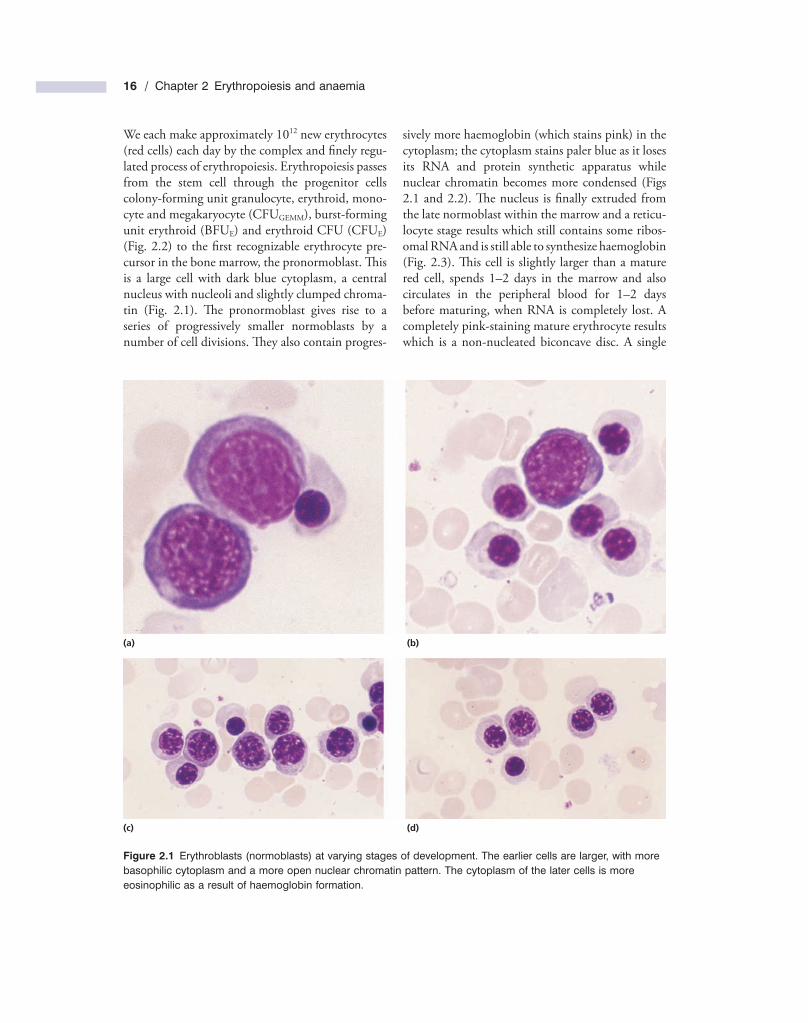
sively more haemoglobin (which stains pink) in the cytoplasm; the cytoplasm stains paler blue as it loses its RNA and protein synthetic apparatus while nuclear chromatin becomes more condensed (Figs 2.1 and 2.2 ). Th e nucleus is fi nally extruded from the late normoblast within the marrow and a reticu-locyte stage results which still contains some ribos-omal RNA and is still able to synthesize haemoglobin (Fig. 2.3 ). Th is cell is slightly larger than a mature red cell, spends 1 – 2 days in the marrow and also circulates in the peripheral blood for 1 – 2 days before maturing, when RNA is completely lost. A completely pink - staining mature erythrocyte results which is a non - nucleated biconcave disc. A single
We each make approximately 10 12 new erythrocytes (red cells) each day by the complex and fi nely regu-lated process of erythropoiesis. Erythropoiesis passes from the stem cell through the progenitor cells colony - forming unit granulocyte, erythroid, mono-cyte and megakaryocyte (CFU GEMM ), burst - forming unit erythroid (BFU E ) and erythroid CFU (CFU E ) (Fig. 2.2 ) to the fi rst recognizable erythrocyte pre-cursor in the bone marrow, the pronormoblast. Th is is a large cell with dark blue cytoplasm, a central nucleus with nucleoli and slightly clumped chroma-tin (Fig. 2.1 ). Th e pronormoblast gives rise to a series of progressively smaller normoblasts by a number of cell divisions. Th ey also contain progres-
Figure 2.1 Erythroblasts (normoblasts) at varying stages of development. The earlier cells are larger, with more basophilic cytoplasm and a more open nuclear chromatin pattern. The cytoplasm of the later cells is more eosinophilic as a result of haemoglobin formation.
(a) (b)
(c) (d)