essential or expendable?
TRANSCRIPT

Essential or Expendable?H o w H u m a n S e r v i c e s S u p p o r t e d
C o m m u n i t i e s T h ro u g h C O V I D - 1 9 a n d
R e c o m m e n d a t i o n s t o S u p p o r t a n
E q u i t a b l e R e c o v e r y
F ro m t h e H u m a n S e r v i c e s
R e c o v e r y Ta s k f o rc e

1
Abou t the Human Se rv ices Counc i l
HSC fosters a diverse network of human services organizations. Together,
we discuss ideas and take collective action on issues that impact the entire
sector and those they serve. Through advocacy and collaboration, we
support member organizations and their leaders in addressing their
concerns of public policy, economic trends, and the regulatory
environment. The human services workforce encapsulates 200,000+
employees in subsectors including: housing access, childcare, elder care,
shelters, food pantries, mental health counseling, and disaster response. As
the voice of the human services community, we highlight the struggles of
those we serve and amplify the need for a strong, well-invested sector.

2
Tab le o f Con ten t s
Executive Summary...................................................................3
Introduction................................................................................6
Recommendation #1..............................................................12
Recommendation #2..............................................................17
Recommendation #3..............................................................22
Recommendation #4..............................................................29
Conclusion.................................................................................35
Acknowledgements.................................................................36
Endnotes....................................................................................38
Appendices...............................................................................43

Exe c u t i ve Summary . . .Through the darkest days of the pandemic, when hospitals and morgues both filled to capacity, nonprofit human services organizations and their workers kept communities afloat. They delivered food to the homebound, opened food pantries for those battling food
insecurity, and ensured shelters stayed open for New Yorkers experiencing homelessness
and survivors of domestic violence.
Nonprofits did all of this with little to no support or guidance from the government, despite providing services on behalf of the City and State and having to rely on government
funding for the vast majority of their budgets. Nonprofits were largely left to fend for themselves and had to locate and pay for their own protective gear and other critical
supplies.
Meanwhile, the need for their services reached new heights as people who had never
relied on programs before showed up at their doors looking for housing, food, employment
assistance, and help navigating overwhelmed government systems. Nonprofits stepped up to meet demand and offered new services based on community needs, even when they
did not have the financial resources to do so.
Nonprofit human services providers began the pandemic already in crisis. The sector was in dire financial shape due to years of chronic underfunding. Over the past several decades, government has transferred most legally mandated social services to the nonprofit sector to save on costs. Although government is a meaningful funder for many nonprofits, the investment simply isn’t enough. Nonprofits report that an average of 77 percent of revenues came from government contracts in 2020 and what they do pay often came late.
The nonprofit sector is treated the way it is because of who they serve and who they employ. Government savings are borne on the backs of low-income neighborhoods and
Black, Indigenous, and people of color (BIPOC) communities who get reduced services and
a workforce that is predominantly made up of women and people of color who are paid
poverty-level wages.
These workers were sent to the frontlines of the pandemic with inadequate supplies and
were asked to meet growing community needs with fewer resources. They were sent
to help Black and brown New Yorkers who were dying at disproportionate rates due to
economic insecurity, a lack of health-care access and affordable housing, and their
overrepresentation in low-wage essential jobs that prevented them from staying at home.
We hear over and over that the City and State are serious about equity, but it does not
show up in how they fund services in underinvested communities or pay women of color on
the frontlines.
Nonprofits rose to the occasion of the pandemic but will not survive unless something changes. It is not sustainable, and it has left them on the brink. Human services were a
lifeline to communities during the peak of COVID-19 and they will be essential for New York
to achieve an equitable post-pandemic recovery. Communities will need job training for
displaced workers, eviction prevention for those unable to make rent, and after-school and
tutoring to get children back on track along with childcare to get parents back to work.
This report outlines the role of nonprofit human services organizations during the pandemic, analyzes the state of the sector today, and provides recommendations for strengthening
New York’s post-pandemic recovery by ensuring a strong and sustainable human services
delivery system.
3 E x e c u t i v e S u m m a r y

Key F ind ings . . .1. Despite fiscal and logistical challenges, 82% of organizations reported launching new services during the pandemic and 72% reported expanding existing services to respond to the needs of communities.
• 45% of organizations overall launched telehealth services. • 47% of organizations that added new services launched food programs.• 32% launched new direct financial assistance programs.
2. A majority of organizations (51%) reported a decline in expected revenue for calendar year 2020, with an average decline of nearly $9.1 million. New York could
see as many as 1,829 nonprofits close their doors because of funding cuts and COVID-19 losses.
• Delays in payments from the City and State wreak havoc on nonprofits, with 70% of organizations reporting a delayed payment from the City and 60% from the State in the last year.
• Last year, the average value of delayed payments from the City was
$8,025,000 and $998,000 from the State.
• Nearly 46% of respondents were forced to take out loans or draw on a line of credit due to withheld or delayed payments—sometimes at significant cost. The average annual cost of interest for those loans is reported as $223,000.
3. Of the total amount that organizations spent on COVID-related expenses, like
physical protections needed to ensure staff safety, only 38% was reimbursed by government on average.
• Respondents spent on average $539,000 on COVID-related physical materials
in calendar year 2020 (e.g., PPE, plexiglass barriers, phones, computers,
hotspots).
4. Black and LatinX employees carried the greatest risk of COVID-19 exposure.
• On average, 85% of employees in frontline roles that involved in-person interactions are people of color, including 48% identifying as African American or Black and 30% identifying as Hispanic or LatinX.
5. 62% of organizations had to either permanently or temporarily lay off or furlough staff.
6. Chronic underfunding from the government results in lower wages for the
workforce. Nonprofit human services workers generally make about 71% of what government employees make, and 82% of what private sector workers receive for the same role.
• For workers with a high school education and higher, core human services
workers generally make about $20,000 a year less than a public sector worker
with a comparable education.
• The relatively low pay in the core human services sector means that 15% of
4E x e c u t i v e S u m m a r y

More Key F ind ings . . .all workers (both full- and part-time) qualified for food stamps in the 2016-18 period analyzed, higher than the 12% share for all private sector workers, and much higher than for government employees (9 percent). However, if childcare
workers and home health aides are included, nearly a quarter of all human
services workers received food stamps.
7. Human services are critical for New York’s recovery.
• A record number of single adults are experiencing homelessness.
• Food insecurity rose 54% citywide and 64% among children during the pandemic.
• The number of people receiving public benefits increased by 20%.• Just before the pandemic, the City’s unemployment rate was 4.2 percent; a
year later, it is 11.2 percent.
Recommendat ions . . .Recommendation 1: Human services nonprofits must be a part of crisis response and community recovery.
Recommendation 2: Government must commit to paying equitable wages to
contracted human services workers.
Recommendation 3: Government must pay in full and on time for essential services for
New Yorkers. Human services contracts must cover indirect expenses, reflect market rates for goods and services, and end delayed reimbursements that amount to millions
of dollars.
Recommendation 4: Transform the human services procurement system to prioritize
meaningful outcomes for New Yorkers, rather than race-to-the-bottom cost-cutting,
starting with a Procurement Reform Commission.
5 E x e c u t i v e S u m m a r y
I n t ro d uc t ion . . .Through the darkest days of the pandemic, when hospitals and morgues both filled to capacity, the human services sector remained a vital backbone for New York. Nonprofits rose to the occasion, ensuring shelters stayed open and getting New Yorkers off the
streets, helping children and families make the transition to online school, delivering
food to people who could not leave their homes and were newly experiencing food
insecurity, and ensuring kids in the foster care system were in safe and nourishing
environments.
Nonprofits did this lifesaving work amidst a backdrop of a City and State government that, while understandably absorbed in responding to the pandemic, seemed
incapable of integrating human services organizations into that response. Human
services providers were largely left to fend for themselves with little to no support from
government partners to ensure their safety or help meet the additional needs of their
clients and communities.
The need for services reached new heights as people who had never relied on social
services programs before sought emergency housing, food, employment assistance,
and help navigating overwhelmed government systems. Organizations stepped up to
meet demand and offered new services based on community needs, even when they
did not have the financial resources to do so. Meanwhile, they had to locate and pay for their own protective gear and other critical supplies.
Nonprofit human services providers have long been a backbone of both the economic and social fabric of New York, combining government resources with private giving and
philanthropy to deliver services to over 2.5 million New Yorkers each year.1 The sector is
both an essential partner to government—contracted to provide mandated services like
shelter in addition to key programs like childcare, afterschool programs, food pantries,
and mental health services—and also independent organizations that can and do react
quickly to changing needs in their communities and engage in rapid response to ensure
children and families have their needs met.
There is no greater example of this than the response of the sector to the pandemic.
Nonprofits scrambled to figure out how to keep vital services up and running while ensuring the safety of clients and staff – a challenge given that services are most often
delivered in person. They spent an average of $539,000 last year on costs related to
COVID-19, from PPE to new technology enabling remote services.2 Government ended
up paying only a fraction of these costs—on average, only 38 percent—leaving the rest
unreimbursed,3 despite government asking more of nonprofits to meet emerging needs
of residents. While COVID-19 expenses ate up significant financial resources, the City and State took drastic measures to shore up their own budgets by cutting those of nonprofits, at the expense of providers and the communities they serve.
E ro s io n o f a T rans fo rmat i v e S e c t o r . . .Nonprofits came to the pandemic already confronting their own crisis: as of 2018, almost 20 percent of New York City human services nonprofits were fiscally insolvent because the true cost of delivering services was rarely covered by government contracts.
4 The
pandemic laid bare the gross fissures in the State and local infrastructure for supporting human services providers, who grappled with the new complexities of the pandemic as
well as the decades-in-the-making consequences of bad government policymaking.
6I n t ro d u c t i o n

Over the past several decades, government has transferred most legally mandated
human services for New Yorkers to the nonprofit sector in order to save on costs. New York’s estimated seven thousand human services providers
5 – nonprofits providing services related to homelessness, mental health, disability, child welfare, and workforce
preparedness on behalf of government – are contracted by City and State agencies
to deliver programs helping New Yorkers thrive and weather life’s storms. Nonprofits are not just more cost-effective, but also deliver higher quality services than government
can alone, by combining government and private resources and being more agile and
able to adapt to community needs. By being ingrained in communities, they are trusted
messengers, can address emerging needs more quickly than government, and enhance
basic services for better outcomes. But as the sector has stretched to meet community
needs, nonprofits are met with chronic delays in payment, underfunding, and a lack of sincere collaboration to create meaningful and lasting interventions, which strips away at
limited resources. The State, in particular, has substantially decreased investment in human
services, cutting local aid for human services funding by 26 percent (FY2011 to FY2018).6
City and State agencies have forced nonprofit human services providers into financial and programmatic precarity that threatens the availability of high-quality services for New
Yorkers, especially when they need them most. Although government is a meaningful
funder for many nonprofits, the investment simply is not enough. Nationally, nonprofits report that government pays about 70 cents on the dollar for direct program expenses,
7
leaving providers to fundraise to fill the gap which diverts time and attention away from services. The alternative is to cut back on programs or pay less to already underpaid staff.
I nv e s t i n Equ i ty . . .Systematic underinvestment in nonprofits is not an accident. Veterans of the sector strongly believe human services organizations are devalued because of who they serve and who
they employ. The City and State budgets are balanced on the backs of low-income
neighborhoods and BIPOC communities who get reduced services, and a workforce that
is predominantly made up of women and people of color who are paid poverty-level
wages due to insufficient contract funding.
While government agencies ask providers to hire highly trained staff to deliver services,
they effectively mandate wages far below the demands of their roles and the value of
their skills. Sixty-three percent of human services workers have a four-year college degree
or better, while only making a median annual salary of $47,000, compared to over $66,000
for a comparable job in government.8 This median salary means that 15 percent of all
human services workers (both full and part-time) qualified for food stamps in the 2016-18 period, higher than the 12 percent share for all private sector workers, and much higher
than for government employees (9 percent).9 These workers came to the frontlines of the
pandemic with inadequate supplies and were asked to meet growing community needs
with fewer resources. Many come from the communities in which they work, meaning that
government is contributing to the multi-generational economic structural inequity that
providers are asked to solve.
No Re c overy W i thou t No n pro f i t s . . .As with 9/11, the 2008 financial crisis, and Superstorm Sandy, nonprofits once again rose to the occasion at New Yorkers’ time of need. But many will not survive the recovery from
COVID-19 unless something changes. Need is rising – there is a record number of single
adults experiencing homelessness,10
food insecurity rose 54 percent citywide and 64
percent among children,11 and the number of people receiving public benefits increased
by 20 percent.12
7 I n t ro d u c t i o n

The COVID-19 economic impact could not be more lopsided. Just before the
pandemic, the City’s unemployment rate was 4.2 percent; a year later, 11.2 percent of
residents are unemployed.13
Communities of color have borne 75 percent of the New
York City job losses and two-thirds of job losses have hit low-paid workers,14
including
workers with disabilities, many of whom are experiencing heightened hardships and
face enormous challenges in regaining stable employment. Communities will need job
training for displaced workers, eviction prevention for those unable to make rent, and
afterschool and tutoring programs to get children back on track – along with childcare
to get parents back to work.
Recovery hinges on human services, while at the same time, New York could see as
many as 1,829 nonprofits close their doors because of funding cuts and COVID-19 losses.
15 Nonprofits were a lifeline to communities during the peak of COVID-19, but they might not be around to play their much-needed role in achieving an equitable post-
pandemic recovery for New Yorkers.
The COVID-19 pandemic laid bare the persistent inequities that exist in our communities
and the inability of government – at all levels – to appropriately respond not just to this
crisis, but to the everyday crises facing individuals and families. Over and over, City and
State elected officials state that they are serious about equity, but it does not show up in how they fund services in underinvested communities or pay women of color on the
frontlines. Now is the time to address these issues to ensure a fairer and more equitable
New York.
Re b u i ld Be t te r . . .In November 2020, the Human Services Council convened a Human Services Recovery
Taskforce charged with analyzing the impact of COVID-19 on the human services
sector and providing recommendations for more effective City and State policies to
ensure high quality services for New Yorkers, prepare for recovery as well as the next
disaster, and ameliorate long-standing problems in the sector. The Taskforce – made up
of leaders of New York’s human services providers, as well as advisors from philanthropy
and the private sector – generated the recommendations that follow.
As part of this effort, the Human Services Council also enlisted the civic sector consulting
firm Bennett Midland to conduct a survey with human services organizations to collect data about their organizations and the effects of the COVID-19 pandemic. The findings from 65 organizations – representing a range of missions and budget sizes – are included
in this report. The Center for New York City Affairs conducted independent research
as well as surveyed nonprofits on human services workforce and wage information contained in this report.
We believe there must be a major shift in how government interacts with the sector and
together, a partnership must be built for a better way forward. The sector can no longer
accept substandard contracts for programs that do not go far enough to solve our
community’s most pressing issues and underpay essential workers, reinforcing the racial
disparities we are charged with solving. The recommendations propose initial concrete
steps and guidance for government to ensure a strong and sustainable human services
delivery system. We demand their implementation now, in real time, while the lessons
learned from the pandemic are fresh in all of our minds.
I n t ro d u c t i o n 8

With these findings as a backdrop, the Taskforce has put forth the following four recommendations along with an in-depth justification for why each recommendation is
needed now so that New Yorkers can recover and thrive.
Recommendation 1: Human services nonprofits must be a part of crisis response and community recovery.
• We know from documented experience that human services providers are
essential in disaster response and recovery, sharing critical information with
communities as trusted sources, offering community space for relief efforts, and
providing real time emergency response services. Government must ensure that
providers are included in response planning efforts for a more equitable and
inclusive recovery.
Recommendation 2: Government must commit to paying equitable wages to
contracted human services workers.
• Government is the main driver of human services salaries, and often sets salary
rates on contracts. Setting low rates results in tax dollars being used to fund
poverty level wages, where 15 percent of human services workers qualify for food
stamps.16
Government must enact a comprehensive plan to raise the wages of
the sector to be commensurate with wages of government employees.
Recommendation 3: Government must pay in full and on time for essential services for
New Yorkers. Human services contracts must cover indirect expenses, reflect market rates for goods and services, and end delayed reimbursements that amount to millions
of dollars.
• The sector continuously experiences underfunding and financial stress through the lack of a permanent commitment to sufficient indirect funding, inadequate payment for services, and chronically delayed procurement processes, which
prevents providers from cultivating a strong infrastructure. Government must
support the sustainability of organizations and their programs by fully funding the
sector.
Recommendation 4: Transform the human services procurement system to prioritize
meaningful outcomes for New Yorkers, rather than race-to-the-bottom cost-cutting,
starting with a Procurement Reform Commission.
• Government relies on human services providers to deliver many legally mandated
services at a much lower cost than what government would pay to provide it
directly. But it does so through an inefficient procurement process that prioritizes superficial outputs rather than lasting results. Therefore, the sector is always working in a scarcity environment, contracted for government programs that may not
move the needle in truly transformative ways. Government must recognize that a
reimagining of the procurement system is necessary to strengthen the way human
services programs are delivered and to ensure that community needs are met.
I n t ro d u c t i o n9
With these findings as a backdrop, the Taskforce has put forth the following four recommendations along with an in-depth justification for why each recommendation is needed now so that New Yorkers can recover and thrive.

During the pandemic, human services
organizations stepped up to meet a need
that had become more urgent among their
clients, but that most did not consider a core
service before the pandemic: food. Fifty-five percent of organizations that launched new
services during the pandemic did so in the
area of food and nutrition; establishing food
pantries, creating new food delivery services,
and providing food vouchers to reduce
food insecurity among New Yorkers. Thirty-
six percent of organizations that expanded
existing services did so to increase capacity,
staffing, and reach for their existing food and nutrition programs.
Sheltering Arms set up pop-up food
pantries in Jamaica and Far Rockaway in
collaboration with food banks and local
elected officials. LiveOn NY delivered over 300,000 meals to seniors in senior housing
facilities. The Chinese-American Planning
Council distributed hundreds of meals to
community members each week in Queens
and Brooklyn. VISIONS expanded a breakfast
voucher program for blind seniors at a local
diner and solicited free meals for blind
tenants in the apartment building where they
operated a senior center.
Human services organizations also looked
for opportunities to innovate and address
challenges seen in food pantries across
the country. NMIC, which serves New
Yorkers in upper Manhattan and the Bronx,
transitioned away from their traditional
pantry set up to reduce contact among
clients and staff, distributing pre-packed
boxes of produce and pantry items for
residents to pick up. Each box contained
enough supplies for 12 meals. Guided by
the goal of treating everyone with care
and dignity, they established an equitable
appointment process and lottery to avoid
the formation of winding lines, reducing the
wait time for community members to less
than five minutes. In the new system, any community member can apply online,
by phone, or in person for a time to pick
up food and, if randomly selected, are
provided with a specific time slot to arrive to receive the box. This system ensures
social distancing practices are in place
and provides clarity on when and how
food will be available for each household.
Alongside these changes, like many
organizations in the city, NMIC rapidly
scaled up their offerings. While they
previously served 150 families a month,
they now average distribution to 170-225
families every two weeks – a number that
is still less than half of the demand and
could be more than doubled if they had
access to additional funds.
Human services organizations did much
of this critical work on their own with
limited government support, drawing on
individual donations and philanthropy,
because the need was so pronounced
among their clients. However, some
benefitted from partnerships with government. For example, Greenwich
House contracted with the City to provide
Emergency Food Deliveries to 600 New
Yorkers twice a week, every week. As of
February 2021, they have helped prepare
and deliver meals to over 175,000 New
Yorkers in every borough except Staten
Island. Urban Pathways helped provide
food and pantry items to residents at
supportive housing sites through the City’s
Emergency Food Assistance Program.
It is critical for government to recognize
and support the role of human services
organizations in meeting clients’ needs
in response to disasters, given their strong
networks in communities.
10
CASE STUDY Food Security
I n t ro d u c t i o n

Detailed Recommendations
11

12
#1H u m a n s e r v i c e s
n o n p ro f i t s m u s t b e a p a r t
o f c r i s i s re s p o n s e a n d
c o m m u n i t y re c o v e r y .
Recommendat ion

New York was the first state in the country to experience – daily – thousands of COVID-19 cases and fatalities. As New York began to shut down, it was clearer than ever that the
nonprofit human services sector is the cornerstone of the social and economic security of New York. The pandemic presented
massive challenges in increased and
changing services with less revenue,
and amplified systemic challenges to communities, clients, and employees.
Nonprofits are trusted messengers in times of crisis, getting vital information
out to individuals and providing
basic shelter, heating and cooling
spaces, or medical assistance. The
pandemic was no different. Providers
were tasked with helping community
members understand what was
happening, while making their own
decisions about closing, moving to
remote services, or staying open,
which all had consequences for their
community.
Providers spent valuable time waiting
for government to determine if
contracts would be honored for programs that could not continue in person, worried
about re-allocating funding to other operational services, or being able to pay
employees working in closed programs. Government needs to match the sector’s
flexibility in a disaster to not just keep services running, but to shift services and leverage
“Government needs
to match the sector’s
flexibility in a disaster to not just keep services running,
but to shift services and
access communities
through the extensive
network of nonprofits.
By the Numbers . . .• Instead of shrinking their operations in response to the constraints of COVID-19,
nonprofits responded to community needs by launching new services and expanding existing ones. 82% of nonprofits reported launching new services; 72% reported expanding existing services.
17
• 45% of nonprofits overall launched telehealth services,18 and among those that
launched new services, 47% started new food programs, and 32% launched new direct financial assistance programs.19
Despite the challenges and risks of offering
services in person, around half of respondents reported they did not stop a single
service due to the pandemic.20
• Government often failed to reimburse for PPE, IT, and other physical
protections needed to ensure staff safety and operations continuity. Nonprofits overwhelmingly had to turn to philanthropy (79%) and/or draw down their general operating funds (69%) to pay for items essential to maintaining operations and keeping their workforce safe during COVID-19.
21 On average, respondents spent
$539,000 on COVID-related physical materials in calendar year 2020 (e.g., PPE,
plexiglass barriers, phones, computers, hotspots, broadband expansion/installation,
transportation, etc.).22 On average, only 38% of these expenses were reimbursed
by government.23
Background . . .
13 R e c o m e n d a t i o n # 1

the extensive network of nonprofits to reach communities during a crisis. Sixty-three percent of providers agreed that they were disappointed by the City’s response to the
needs of the human services sector during the pandemic.24
Sixty-eight percent agreed
that they were disappointed by the State’s response.25
As the pandemic progressed and the need for human services increased, many
improvements to physical spaces and workplace safety were needed to keep
employees and clients safe. While providers were asked or required to stay open, there
was limited financial and technical support to ensure providers could operate safely. The nonprofit sector was largely responsible for acquiring their own PPE, cleaning equipment, thermometers, plexiglass shields, HVAC systems, and other critical supplies, which were
often beyond the financial means of nonprofits. On average, respondents spent $539,000 on COVID-related physical materials in calendar year 2020.
26 Nonprofits must be able to rely on government funding to shift services, particularly to respond to requests to be part
of disaster response and recovery.
Another challenge, not to just nonprofits but also to millions of New Yorkers, was the lack of access to broadband. Close to 500,000 NYC households did not have any type of
internet connection,27 which made it difficult for individuals to access important COVID-
related updates and needed services, and for providers to reach people. The pandemic
made plain that broadband is a necessity for individuals and families to engage in
learning, access critical services like telehealth, and sign up for essential programs like
meal delivery and vaccinations. Eighty-two percent of nonprofits launched new services28
such as telehealth services; on average, organizations spent $204,000 on IT-related COVID
expenses in 2020.29
The digital divide was particularly stark for low-income communities of
color, who were most impacted by the pandemic, as well as for low-income people with
disabilities, who often did not receive necessary devices and training. Students without
reliable internet access at home struggled to keep up with their classmates in learning.
The lack of universal broadband created a fundamental disadvantage for communities.
New services most frequently launched by organizations.
R e c o m m e n d a t i o n # 1 14

CASE STUDYYMCA of Flushing, Queens
Frankie Carlucci grew up going to the YMCA.
He started his work at the YMCA 12 years
ago, as a college student with a community
service requirement. Soon, he was hooked,
coming on part-time to help with afterschool
programs. After earning his degree in youth
development and a brief stint as a New
York City EMT, he took on leadership roles,
becoming the senior director of youth and
family for the Flushing YMCA, overseeing
programs for children of all ages, including
universal pre-K, afterschool, summer camps,
and beacon programs.
Like other nonprofits, the YMCA faced dramatic changes when the pandemic
hit. The organization put gym memberships
on hold and shut down pools, at a cost of
millions of dollars in lost revenue. When the
City announced a plan to launch Learning
Labs, providing a safe space for kids to
take online classes during the day while
schools were closed and parents worked or
looked for work, the YMCA jumped at the
opportunity. Upon winning the contract,
YMCA branches received a list of parents,
local schools, and nearby shelters intended
for the program. But Frankie immediately saw
a problem for the Flushing YMCA Learning
Lab. How would families in shelters complete
the City’s online enrollment process when the
shelters lacked internet access?
Frankie called and visited the shelters himself,
letting parents use his laptop to enroll and
turning his phone into a hotspot. When
shelters asked Frankie not to come due to
COVID-19 precautions, he had to come
up with a Plan B, opening up the Flushing
YMCA and allowing parents to sign up
there. While Frankie was glad the City
came forward with the idea for Learning
Labs, he was disappointed there wasn’t
more thought given to how families with
the least resources would access services.
Over the last year, the Flushing YMCA
Learning Lab helped over 100 families.
During the day, kids took classes and
did homework under the supervision of
college students and graduates, who
could help them with problems students
across the country faced, like logging into
Zoom and completing assignments far
away from their teachers. With reliable
childcare, one parent whose child was
enrolled in the program was thrilled to find a position at a local hospital despite the
grueling job market. Many families without
computers struggled to get them from
the City. To provide kids using Learning
Labs with a similar experience to their
classmates, the YMCA turned to donors,
securing a gift from BlueCross BlueShield
of hundreds of Chromebooks for students
across the five boroughs. As school opening policies changed and students
shifted between in-person and remote
learning environments, the Flushing YMCA
Learning Lab remained open for kids to
come during school hours.
15 R e c o m m e n d a t i o n # 1

Recommendat i o n s fo r Ch a n g e . . .More must be done to include human services in disaster planning and set aside
resources in emergency reserves so that the sector can respond to community needs in
real time. New York City and State must create formal mechanisms in the contracting
process to guarantee that if there is a declared state of emergency or disaster, human
services nonprofits will have contracted expenses honored in the event that:
1. Providers are unable to fulfill contract deliverables but still have expenses including personnel costs that must be met regardless of service delivery.
2. Providers will have approved costs covered if service delivery must be altered in
the event of an emergency or providers are asked to alter their services to assist in
response and recovery efforts.
COVID-19 has made it clear that how government structures response and recovery
efforts and how individuals and families access those services is dependent on online
services. Human services nonprofits similarly need to be able to access their community remotely:
1. Broadband must be made universal with government committing to ensure access
to all individuals and families, regardless of income.
2. Human services contracts should be changed to budget the cost of broadband
as a utility and direct program cost, not an indirect expense, due to its essential
nature in program delivery.
New York State and City should establish disaster and response recovery funds available
to human services agencies to cover necessary expenses, including:
1. Costs associated with deploying and protecting the human services workforce
such as PPE, overtime, and transportation.
2. Costs associated with service delivery in a disaster such as dispersing supplies to
the community, technology, client transportation, sanitation, and infrastructure.
16R e c o m m e n d a t i o n # 1

17
#2G o v e r n m e n t m u s t c o m m i t
t o p a y i n g e q u i t a b l e
w a g e s t o c o n t r a c t e d
h u m a n s e r v i c e s w o r k e r s .
Recommendat ion

By the Numbers . . .• Human services workers are overwhelmingly female (66%), over two-thirds are
full-time workers of color (68%), and nearly half (46%) are women of color. These shares are considerably higher than for New York City’s overall private sector
workforce, where only a quarter (26%) of private sector workers overall are women of color.
30 As such, pay disparities in this sector have important consequences for
race and gender equity.
• At the same time as they are underpaid compared to the private sector, human
services workers are often more highly educated, making the disparity even
more troubling. Sixty-three percent of full-time workers have a 4-year college
degree or better, 10 percentage points greater than for the private sector overall.
Conversely, only three percent of full-time human services workers do not have a
high school diploma compared to nine percent for the private sector.31
• The relatively low pay in the core human services sector means that 15% of all workers (both full- and part-time) qualified for food stamps in the 2016-18 period analyzed, higher than the 12% share for all private sector workers, and much higher than for government employees (9%).32
If childcare workers and home
health aides are included, nearly a quarter of all human services workers received
food stamps for this period.
• Sixty-two percent of nonprofits had to either permanently or temporarily lay off or furlough staff during the height of the pandemic.
33 While racial demographics of
layoffs are not available, we know that the workforce overall is disproportionately
female and people of color. Overall, there are nearly 10% fewer Black women employed than a year ago in the U.S.
34
• Black and LatinX employees made up a much larger share of nonprofits’ frontline roles that carried greater risk of COVID-19 exposure than White employees. On
average, 85% of an organization’s frontline workers identified as people of color, including 48% identifying as African American or Black and 30% identifying as Hispanic or LatinX.
35 While White employees make up a much smaller share of the
human services workforce than their overall population (21%), they make up an even smaller share of frontline roles (14%).36
• Many human services nonprofits are struggling with high vacancy rates, with an estimated average vacancy rate around 11% as of March 2021, 54% of whom had a vacancy rate higher than 10%, and over 30% had a vacancy rate higher than 15%.37
Government is not just the predominant funder of human services, but is also the main
driver of human services salaries, and either directly sets salary rates on contracts or
does so indirectly by establishing costs for a unit of service along with required staffing on a contract. Government contracting practices have created an intolerable situation
of extreme pay disparities where human services workers make on average 71% of what government employees make, and 82% of what private sector workers receive.38
For workers with a high school education and higher, core human services workers
generally make about $20,000 a year less than a public sector worker with a comparable
education.39
This pronounced pay disparity disadvantages a highly educated workforce
where more than half of the frontline social workers, counselors, and case workers are
Background . . .
18R e c o m m e n d a t i o n # 2

women of color. This also means that taxpayer dollars that should be used to build the
economy and better communities are being used to fund poverty level wages across
New York.
Salaries start low and often remain stagnant because human services contracts last
five to seven years (or more) with no opportunity for cost-escalators to allow for rising salaries. Similarly, cost-of-living adjustments (COLAs) to keep up with inflation are not standardized. The State has mostly deferred the statutory COLA for human services
workers, costing workers almost $700 million in increased salaries over the last 12 years.40
This results in increased staff turnover as underpaid staff leave nonprofits for better-paying jobs in government or the private sector, depriving New Yorkers of services from
the most experienced,
well-trained staff and
jeopardizing high-quality
services. Over 30 percent of
surveyed nonprofits have a vacancy rate higher than 15
percent41
and 80 percent of
respondents reported that
inadequate pay significantly impacted their organization’s
ability to make hires – far and
away above other factors.42
Having consistent and
well-trained staff is integral
to quality services, and
community members suffer
when staff they rely on turn
over at a high rate or important
positions remain vacant.
As a result of the pandemic, permanent and temporary layoffs gripped the human
services sector. Fifty-one percent of nonprofits had to temporarily lay off or furlough staff and 42 percent reported having to make permanent layoffs.
43 As New York looks to
human services programs to recover, nonprofits that have laid off employees will not be able to respond as quickly or robustly as they could if fully staffed.
The lack of COLAs and livable wages for workers not only disadvantages communities
who rely on these workers for lifesaving services but represents a critical and overlooked
economic equity issue. Government pays inequitable wages to a workforce upwards
of 800,000 in New York State.44
These workers continued to serve their communities by
innovating and adapting their person-to-person operations to the current reality shaped
by the pandemic while being paid poverty-level wages through government contracts.
For nonprofits with 100 or more employees, the average percentage of Black employees that had frontline roles during the pandemic was over four times higher than White
employees.45
However, these workers have been continuously underpaid, placing them
in the same situation as many of the clients that they serve. Government must enact
a comprehensive plan to raise the wages of the sector and provide enhanced career
advancement opportunities.
Percentage of organizations reporting a factor significantly impacted their ability to make new hires.
19 R e c o m m e n d a t i o n # 2

CASE STUDYVISIONS is a nonprofit organization that provides free services for people who
are blind or visually impaired to lead
independent and active lives. Its programs
include work readiness training and job
placement services for about 7,000 New
Yorkers each year. While New Yorkers
who are blind already faced barriers in
finding work or acclimating to new jobs, the pandemic presented a host of new
challenges. How do you socially distance
if you can’t see the people near you? How
can you follow the rules of the workplace if
it’s presented on signage? What if your usual
mode of transportation is no longer running
because of budget cuts?
When COVID-19 hit, VISIONS was able
to assist several clients in securing jobs
at Amazon in warehouse roles as online
shopping grew dramatically and led to new
staffing needs. Many participants chose nighttime jobs so they could help their
children with homework during the day or
balance other responsibilities with family
members. Among the services VISIONS
offers, certified orientation and mobility specialists provide specialized instruction
and assistance to people who are blind
and need to safely navigate to, from, and
within the workplace. Over the last year, this
meant accompanying some participants
from their homes to the Amazon facility to
work the late shift, then back home at the
end of the shift in the early morning. In the
first days of employment, some specialists made themselves available the entire shift
to orient the employee to their worksite. The
work itself was challenging and risky: each
specialist had to assume all the same risks
of COVID-19 exposure as their clients and
be close enough to help if something went
wrong, while trying to maintain distance as
much as possible.
What resources did government agencies
give VISIONS to compensate staff for the
added risk and sacrifices needed to retain highly in-demand specialists? Not much.
In the case of VISIONS’s outcome-based
state contracts, the organization receives
payment only when a program participant
achieves a training goal and can complete
a task independently. While VISIONS
believes in the benefits of outcome-based contracting to give program participants
more power in defining their own goals, the contracting approach passes on great risk
to the service provider when unexpected
events make service delivery harder or more
expensive. In April to June 2020, VISIONS lost
about a third of its revenue. There was no
extra state funding for staff costs now that
orientation and mobility specialists were
asked to complete lessons at midnight or
4:00 a.m. in person during a pandemic.
There was no money given to buy Personal
Protective Equipment (PPE), sanitize offices, change HVAC filters, or pay for Ubers for employees to pick up donations that were
desperately needed, but often far away
from the office. The organization leaned on its PPP loan to give small bonuses to
employees whose responsibilities had grown
immensely, and relied on The New York
Community Trust, Robin Hood Foundation,
and a small family foundation to pay costs
related to COVID-19 precautions like PPE. In
addition, other nonprofits shared their PPE donations with VISIONS.
In spite of these constraints, VISIONS not
only continued to provide its core services,
but also responded to clients’ changing
needs by establishing new offerings. While
the pandemic has been hard on all New
Yorkers, there are some blind older adults
who have not left their apartments since
March 2020 out of fear of contracting
COVID-19. VISIONS staff recognized that
many of their clients were lonely during
holidays and became despondent, so
staff came up with a novel new offering:
a hotline for New Yorkers who are blind
to call on holidays if they’re feeling alone
where a staff member will answer. It’s a
service VISIONS plans to continue even
after the pandemic ends, reflecting their commitment to innovation despite the
significant strains that the pandemic and the lack of government support have
placed on its budget.
20R e c o m m e n d a t i o n # 2
VISIONS

Recommendat io n s fo r Ch a n g e . . .• Establish a living wage floor for all City and State government contracted human
services workers at a rate no less than $21 an hour, providing comparability with
government employees holding similar nonprofessional job titles in the human
services agencies. In New York City, this would translate to a $640 million wage
investment for some of the City’s lowest paid workers.
• Bring together the Comptroller, government agencies, human services providers,
and labor at both the City and State to establish a wage and benefit schedule for all government-contracted human services workers to put them on an equal
footing with comparable City and State employees. Once established, these
compensation benchmarks must be incorporated into all contracts, along with
funding to support career advancement and promotion opportunities. The City
and State should phase in funding increases to achieve full compensation parity,
and immediately establish a reserve for recruitment and retention to stabilize the
contracted human services workforce.
• An automatic annual COLA should be incorporated into all human services
contracts, not as a substitute for comparable pay but to ensure that pay parity is
maintained on a continuing basis. A three percent COLA for workers on New York
City contracts would cost $48 million.46
For workers on State contracts, the cost
would be $120 million statewide.47
21 R e c o m m e n d a t i o n # 2

22
#3G o v e r n m e n t m u s t p a y i n f u l l a n d
o n t i m e f o r e s s e n t i a l s e r v i c e s
f o r N e w Yo r k e r s . H u m a n s e r v i c e s
c o n t r a c t s m u s t c o v e r i n d i re c t
e x p e n s e s , re f l e c t m a r k e t r a t e s
f o r g o o d s a n d s e r v i c e s , a n d e n d
d e l a y e d re i m b u r s e m e n t s t h a t
a m o u n t t o m i l l i o n s o f d o l l a r s .
Recommendat ion

By the Numbers . . .• A majority of nonprofits (51%) reported a decline in expected revenue for
calendar year 2020, with an average decline of nearly $9.1 million.48
• Long a problem in the sector, persistent delays in payments from the City and
State are wreaking havoc on nonprofits, with 70% of nonprofits reporting a delayed payment from the City and 60% from the State in just the last year.49
The
average value of payments delayed in the last year from the City was $8,025,000
and $998,000 by the State.50
Without question, the impact was substantial.
• Nearly 46% of respondents were forced to take out loans or draw on a line of credit due to withheld or delayed payments – sometimes at significant cost. The average annual cost of interest on interest-bearing loans is reported as $223,000.
51
• Government often failed to reimburse for PPE, IT, and other physical
protections needed to ensure staff safety and operations continuity. Nonprofits overwhelmingly had to turn to philanthropy (79% of respondents) and/or draw down their general operating budget (69% of respondents).52
• 68% of respondents agreed with the statement: “The lower indirect rate provided to my organization contributed to difficulties in preparing for and/or responding to the pandemic.”
53 About a year after cutting the indirect rate for providers, the City
recently announced that it will honor the indirect rate initiative and funding this
year and next. Providers already made painful cuts and are still waiting on budget
modifications nine months into the year so the benefits of the program will not be fully realized until next year.
Average delayed payments from the City and State as a percentage of organizations’ annual operating budgets, broken out by budget range
R e c o m m e n d a t i o n # 323

Government contracts rarely cover the true costs of programs and with the increased
expenses in providing additional services during the pandemic and constant delays
for government reimbursement, human services nonprofits face cash flow problems in addition to chronic underfunding. This has been a nagging and significant issue as most human services contract reimbursement rates have not been adjusted to reflect rising costs in New York, leaving budget holes that private philanthropy cannot fill. Seventy-nine percent of respondents noted using funds from philanthropy to cover the gap in
paying for items essential to maintain operations during COVID-19,54
and some of that is
one-time or emergency funding that will not cover all of organizations’ ongoing needs.
One particular area of concern
for providers is the arbitrary cap on
indirect spending, which prevents
providers from spending crucial dollars
on supporting the full organization such
as upgrading IT for both remote service
delivery and cybersecurity, time spent
complying with government requests,
and cleaning and maintenance –
particularly crucial during COVID-19.
Other industries do not face the
same caps on indirect costs, and
by neglecting to pay for necessary
expenses, government has stripped
providers of fundamental resources
needed to successfully operate.
New York City, to their credit, took
on the indirect issue in recent years
and developed the Indirect Cost
Rate Initiative (ICR) to allow providers
to develop individualized rates and
have them funded on contracts, but then backed away from funding the program
until recently. On average, nonprofits reported a loss of $396,000 in FY2055 between the
revenue that they had projected based on the indirect rate initially approved by the
City and the revenue that they actually generated under the new Indirect Cost Rate
Initiative. This means that prior to this initiative – and the needed funding – providers
were subsidizing New York City, on average, about $400,000 a year to provide services,
just on the indirect costs.
The State has made no effort in the area of indirect costs, despite federal guidance
on indirect56
and the City developing a mechanism the State could easily follow. ICR is
currently restored in the Mayor’s Fiscal Year 2022 budget with a substantial investment
of $120 million for the next two years.57
This is an important effort made by the City, with
both the standard manual and the needed funding, and the sector needs to see a
similar commitment from the State and assurances that the ICR will continue with the
new City Administration as without a permanent commitment to indirect funding, the
future is uncertain.
“Other industries do not
face the same caps on
indirect costs, and by
neglecting to pay for
necessary expenses,
government has stripped
providers of fundamental
resources needed to
successfully operate.
Background . . .
24R e c o m m e n d a t i o n # 3

Before developing a budget, providers compete for RFPs, where scopes of work
proposed by government agencies are typically developed without a market survey of
costs or input from service providers. This results in RFPs that do not cover the real cost of
services and inadequate compensation for a highly educated workforce, which are all
essential to implement a high-quality program. A market research survey done by the
agency developing the RFP would be an important tool to assess costs and accurately
price out the rates in an RFP. Additionally, if the RFP did not reflect the market research, the agency would have to defend why crucial services and equitable wages were not
fully funded in the RFP. Forcing transparency in average costs versus proposed funding
would help move procurements away from a place of scarcity where government
budgets are balanced on the backs of nonprofits and frontline workers.
Once awarded a contract, persistent delays in payments force providers to take on
loans or lines of credit to make payroll, rent, and service delivery, which often amass
interest not reimbursed by government contracts even though it is not the fault of the
provider. Nearly 46 percent of respondents were forced to take out loans or draw on
a line of credit due to withheld or delayed payments and the average annual cost
on these interest-bearing loans is reported as $223,000.58
This puts providers at risk of
insolvency as providers are faced with chronically delayed payments, which could
compromise the quality of programs. As nonprofits struggle to borrow to make rent andsalaries, this impacts the resources they can put into additional programming, strategic
planning, and compensating the workforce.
The collective services provided by human services nonprofits make the difference between success and failure for countless individuals and families. Government should
ensure that contract payments cover indirect expenses, reflect market rates, and pay on time.
R e c o m m e n d a t i o n # 325

CASE STUDYIndirect Cost Rate
When New York City passed a new initiative
expanding the indirect cost rate for human
services providers in the summer of 2019,
nonprofits rejoiced. Among them were Brooklyn Community Services, which works
with youth, families, adults, and people
living with disabilities in the borough, and
Barrier Free Living, which operates an
emergency shelter in the Bronx and other
programs for survivors of domestic violence
with disabilities. For years, nonprofits had been told to “run like a business,” asked to recruit highly trained staff, and invest in
resources like data management to carefully
track client outcomes. But government
contracts didn’t even fully cover the costs
of running the programs they contracted
nonprofits to provide, let alone investing in new capacities. For example, simply running
government programs usually left Brooklyn
Community Services with an annual deficit of about $1.7 million from unreimbursed costs
like technology, staff training, finance and grants management, and human resources,
which the organization had to fundraise
from philanthropy and individual donors, a
distraction from their core work of serving
children and families.
Under the new initiative, the City allowed
human services providers to apply for indirect
rates higher than the previous cap of 10
percent to cover demonstrated expenses
related to running the organization—like core
infrastructure and salaries for many staff—
that are not covered by program budgets
but required for the success of programs.
When COVID-19 hit in March 2020,
human services providers worked
diligently to adapt to drastically changed
circumstances for clients and staff, with
necessary but unplanned expenditures
on technology, personal protective
equipment, and physical changes to
their offices. In April, the City announced the unthinkable. Instead of providing the
additional funding they had promised,
which was needed now more than ever
to continue providing services to New
Yorkers safely, the Mayor’s April 2020
Executive Plan cut indirect funding nearly
40%. In August, six weeks after the 2020 fiscal year had closed, providers were informed that the City would apply the
cuts not only for future payments, but
retroactively to cut payments for the
months before the policy was announced,
after providers had already incurred
the expenses. Chief Program Officer for Barrier Free Living Cynthia Amodeo put
it this way: “The City is asking us to run our organization like a business, but how
can you do that if you don’t know your
income?” And what was a nonprofit to do if they had already spent the promised
funds?
For Brooklyn Community Services,
the change amounted to a $750,000
26R e c o m m e n d a t i o n # 3

CASE STUDYIndirect Cost Rate (con’t)
budget cut that the organization had
already spent on essentials—for example,
expanded cleaning during the pandemic.
The organization had the good fortune of
a strong relationship with a bank and was
able to secure funding through its revolving
loan fund but drew on it much more than
planned. As of May 2021, the organization
had yet to receive a single payment of
indirect funding for FY20. “It seems to say they don’t care,” Brooklyn Community
Services President and Executive Director
Janelle Farris says, reflecting on the City’s failure to pay in a timely manner on top of
cuts to social service budgets. “At the same time, they say every life matters.”
Barrier Free Living lost $154,000 in critical
funds because of the change in the
indirect rate, which would have sustained
the administrative staff that serves as the
operational spine for the organization. Two
staff members of the modest four-person
finance team had to step down at the start of the pandemic, burdening an already-
stretched staff. Because of the indirect
cost rate change, the organization had to
lower salaries for the open positions, making
hiring an arduous, lingering process. One
position that previously paid $70,000 went
down to $45,000. Another role was cut by
a third to $40,000 and is still unfilled. When a mission-driven, small organization like
Barrier Free Living cannot offer competitive
compensation for staff, it is nearly impossible
to fill vacancies and prevent turnover. Human services jobs, which should be a
channel for upward economic mobility for
New Yorkers, are increasingly becoming
low-wage jobs incommensurate with the
training and time required to do the work.
While existing staff members scramble to
complete their responsibilities and those
of unfilled positions, they struggle to meet reporting requirements from funders and
strategize for the future.
In April 2021, there was an abrupt change
in policy. The City suddenly announced
it would honor the indirect rate for FY21
after all and increase the baselined
funding for the initiative to help prevent
future cuts. For human services providers,
the reaction was relief, but also frustration
and whiplash. Many already endured
painful cuts and lost the opportunity to
invest in staff and programs during the
moment of greatest need. “The challenge ahead is to ensure that the future is one
that respects nonprofits as the small businesses we are,” Farris said. “We are employers, frontline workers, and essential
to New York City.”
R e c o m m e n d a t i o n # 327

Recommendat io n s fo r Ch a n g e . . .RFPs should demonstrate that government agencies have done the appropriate market
research to justify the cost allocations put forward in the creation of rates or overall
budgets offered on human services programs.
1. RFPs should include a sample budget detailing how the government agency
arrived at rates and overall funding.
2. Government should demonstrate before an RFP is released that it has surveyed
contractors of current or similar services to determine appropriate costs.
New York State and City must recognize the true costs of operating human services
programs and commit to paying indirect costs on all human services contracts.
1. New York City went through a long and involved process to establish an Indirect
Cost Rate manual and to create a system for providers to claim their individualized
rate. After a disappointing year-long delay, New York City has just committed to
fully funding this Initiative on current contracts, and now should work to ensure that
RFPs and renewal contracts support approved rates going forward.
2. New York State must adopt a system, either through federal OMB Guidance or
the City’s Cost Manual, to allow for individualized indirect rates on contracts and
commit to funding those rates.
Government at all levels must commit to paying providers in a timely way. To accomplish
this, the City and State should:
1. Set clear timelines for payment at the City level that are always honored.
2. Strengthen existing prompt payment legislation at the State by not allowing State
agencies to offer “waivers” to providers for required interest payments. 3. Legislate interest penalties for delayed payments that cannot be paid out of the
value of the contract at both the City and State.
28R e c o m m e n d a t i o n # 3

29
#4Transform the human services
procurement system to prioritize
meaningful outcomes for New Yorkers,
rather than race-to-the-bottom cost-
cutting, starting with a Procurement
Reform Commission.
Recommendat ion

By the Numbers . . .• City government increasingly relies on the nonprofit human services sector to
deliver the broad range of services New Yorkers need and some that are required
by law, demonstrated by the growing number of program areas and the fact that
employment across the human services sector grew nearly four times as much as
total NYC employment from 1990 to 2019 (110% vs. 30%).59
• Human services employment has grown even faster in the rest of New York State,
increasing by over 150% from 1990 to 2019, more than 14 times the growth rate in total employment.
60
• Eighty-nine percent of responding nonprofits agreed with the statement: “My organization would produce better outcomes for its clients if it was reimbursed for
the full cost of providing services.”61
• Communities of color have borne 75% of job losses and two-thirds of job losses have hit low-paid workers,
62 who are facing new hardships and enormous
challenges in regaining stable employment. Even with the continued return of
20,000-25,000 jobs per month for the remainder of 2021, there will still be roughly a
300,000 jobs deficit at the end of the year.63 This will require new and increased
programs to get people back to work.
Over the decades, the sector itself has transformed into a dependable and much-
needed lifeline for children and families that works in every corner of New York, with
millions of people from all walks of life depending on programs to help them find jobs, care for family members, engage in community activities, deal with mental and
physical health problems, and recover from disasters. Government increasingly relies
on the nonprofit human services sector for a broad range of vital public services as indicated by the growing number
of program areas and the fact that
employment in the human services
sector has grown more than three
times as much as total New York
City employment (110% vs. 30%, 1990-2019).
64
While the sector has grown,
needed funding and partnership
with government has not kept
pace. Government calls on
nonprofits to be like businesses and partners in helping to solve
our most pressing social issues – all
while not treating nonprofits like a business or a partner. A business
would not accept a contract for 80
cents on the dollar;65
a company
Background . . .
“That is what government
asks of nonprofits: take on contracts that do not cover
the full cost, do not pay an
equitable wage to workers,
requires a program design
they had little to no input on,
and does not have space
to be creative or cater to
specific needs. Simply put, the model is broken.
30R e c o m m e n d a t i o n # 4

contracted to build a bridge would not fundraise for the last bit of costs, accept losses
if the price of steel increases, or be paid years late with no interest. A partner would
not accept a relationship where they had no meaningful seat at the table and little to
no input on program design, cost structure, or how to measure success. That is what
government asks of nonprofits: take on contracts that do not cover the full cost, do not pay an equitable wage to workers, requires a program design they had little to no input
on, and does not have space to be creative or cater to specific needs. Simply put, the model is broken.
State and local government agencies continue to propagate programs without the
input, collaboration, and shared goals of providers. The sector can and does transform
communities and generate long-term multigenerational impact, but often in spite
of government, not because of it. Programs frequently consist of short-term metrics,
outputs, and levels of service rather than being designed around lasting outcomes
and funding the service to achieve lasting change. Nonprofits are the vehicle to get people to success, but procurements do not match that potential. Instead, government
perpetuates scarcity, forcing providers to compete with one another on the lowest
dollar and not on the quality of programs, constraining the resiliency of the sector and
the communities that they serve.
The lack of appropriate funding and partnership absolutely hindered the ability of the
sector to respond to COVID-19, and as recovery proves the essential work providers do,
it is more important than ever that this broken system is re-imagined. Government must
transform into a reliable business partner that treats nonprofits as the service experts they are and important community stakeholders, including in the way government interacts
with contractors, how government purchases and pays for human services, and how
government can be held accountable to ensure an equitable system. Providers want to
solve problems in communities, and the procurement system, as currently designed, is
not the mechanism for the deep change that tackles the circumstances that led to the
need for services.
Provider expense categories reported as reimbursed by government
31 R e c o m m e n d a t i o n # 4

CASE STUDYVolunteers of America
Run by Volunteers of America-Greater
New York, the Schwartz Assessment
Shelter (SAS) on Wards Island can
house up to 335 men experiencing
homelessness, helping them find more permanent living situations based on their
needs.
When COVID-19 hit, the staff knew that
operations would need to change
drastically to keep staff and clients
safe. After emergency measures to
create physical distancing like moving
beds, changing cafeteria seating, and
rearranging recreational areas, the
team learned that the City had made
arrangements with a number of hotels to
house people experiencing homelessness
in non-congregate settings that would
reduce the spread of COVID-19. But the
announcement belied the complexity for
human services providers.
With only four days’ notice and no
additional funding, the team had to
move hundreds of clients and prepare
the hotel for use. For example, the team
had to figure out how to store and deliver meals to clients on site and change the
locks so staff could enter the room if a
client needed emergency assistance.
Worried that neighbors might complain
about their new neighbors—a well-
founded fear given what happened
at the Lucerne not long after—staff
patrolled the streets outside the hotel
to avoid any possible issues that could
jeopardize the safe placement of their
clients.
Meanwhile, the organization’s staff
was already stretched thin. At one
point, 60% of the shelter’s staff were out sick; when schools closed, many
struggled to secure childcare. Despite
the challenges, the team managed to
keep case rates low compared to the
city overall, and there was not a single
death due to COVID-19 among clients
or staff.
32R e c o m m e n d a t i o n # 4

Recommendat io n s fo r Ch a n g e . . .The City and State must commit to transformative human services programs, which
mean those services that are designed in partnership with providers and communities to
get at the root cause of the issues and state provable and achievable outcomes that
demonstrate individual and community value.
To do so, the next Mayor of New York must undertake – with human services nonprofits – a rethinking of the entire procurement system. A start of such an effort would be creating
a Procurement Commission that redesigns the procurement system within the first 60 days of office with six months to deliver a plan and 18 months for implementation. The Governor must also commit to a similar pledge of creating a Procurement Commission at
the State level.
The Procurement Commission should prioritize these five tenets in its proposals:
1. Focus on clients and outcomes as the well-being of communities that nonprofits serve in how programs are designed and implemented.
2. Encourage continuity and competition so that nonprofits of all sizes have access to government contracts.
3. Guarantee timely payments that cover the full cost of services so that the sector
can focus on delivering high quality programs without the threat to sustainability.
4. Create consistency and transparency in processes across all contracting agencies
which are currently not aligned in their expectations, communication, and
procurement protocols with providers.
5. Support racial and social equity and leverage funding as a direct response to
community needs and conditions that produce injustice.
The Procurement Commissions can accomplish procurement reform through the
following tools:
1. At the City:
• Review PASSPort data to establish clear timeframes for contracting deadlines
that are codified through legislation for the contracting process.
• Utilize the Mayor’s Management Report to include procurement measures
and targets.
2. At the State:
• Establish procurement and contracting deadlines, along with publicly facing
tracking systems to track compliance.
33 R e c o m m e n d a t i o n # 4

34R e c o m m e n d a t i o n # 4
It is crucial that the Procurement Commissions establish mutual accountability for both
contracting agencies and providers through these methods:
1. Establish clear government leadership for the human services sector with access to
the Administration at the City and State and ensure that the entity has:
• Authority over all human services programs and procurement;
• Expertise and experience in human services;
• Established timely decision-making across all contracting agencies;
• Established formal and informal interaction and feedback with human
services providers; and
• Connections to the budget process.
2. Contracting agencies should work together to build systems in coordination and
synchronize their data instead of requiring providers to use multiple systems.
3. Legislate penalties for failure to pay on time at the City level and strengthen the
State’s rule on prompt payment.
4. Establish meaningful and impactful reporting and mandate reporting requirements
for all contracting agencies, including developing key performance indicators and
scorecards.
5. Include cost escalators within fixed costs of contracts.
6. Hold providers accountable for outcomes, while allowing for flexible budgeting as providers are the experts in knowing how to implement programs.
7. Utilize the Nonprofit Resiliency Committee’s Guide to Collaborative Communication with Human Services Providers
66 before releasing procurements.

Co nc l us ion . . .The sector is at a breaking point. Every day, providers are asked to make an impossible
choice between providing needed services with inadequate funding that puts their
organizations in jeopardy and perpetuates wage gaps or turning down that work
at the expense of communities – often communities of color. If government cannot
address and remove the impediments that keep them from being reliable partners to
communities, providers will have to make the difficult decisions about how and if they will be able to work with government to serve communities, or if the system is too flawed to continue.
There has been significant federal investment with the American Rescue Plan that targets dollars to States and localities to not just plug budget holes but to “aid the communities and populations hardest hit by the crisis, support an equitable recovery
by addressing not only the immediate harms of the pandemic, but its exacerbation of
longstanding public health, economic and educational disparities.”67
That is the role of
the human services sector, and nonprofits have successfully played that role for decades and continue to ensure individuals, children, and families have the resources they need
to learn, live, and grow. Investment is clearly needed at the workforce level right away
– $168 million for both City and State COLAs68
and $640 million to raise a living wage
for City contracted workers – and federal stimulus dollars would be well used in this
area. Additional investment will be needed at the program level as the City and State
issues RFPs at the full cost of providing services. Redesigning how services are procured
and moving towards a true partnership will likely enact cost savings as we streamline
processes and collaborate on programs that have better, long-lasting outcomes.
As New York, along with the rest of the country, looks to recover and rebuild, we need
our leaders to move beyond platitudes and roll up their sleeves alongside human
services nonprofits to make deep and lasting changes to how government works with the sector, striving for an actual partnership. Human services nonprofits are a lifeline and a ladder for millions of New Yorkers. Without robust and agile human services providers,
our communities cannot recover from COVID-19, and rebuilding a better New York will
remain out of reach.
35 C o n c l u s i o n

Ac kno wledgement s . . .The COVID-19 pandemic has underlined the importance of the human services sector
in disaster response and recovery efforts. We know that New York recovers with human
services nonprofits in the lead. The services our members provide – childcare, job training, eviction prevention, and other lifesaving programs – are the essential elements
to getting the economy back up and running. But, more importantly, it is necessary to
the survival and resiliency of community members struggling within an inequitable and
unjust system. Over the past year, nonprofit human services providers faced a series of increasingly difficult obstacles in dealing with COVID-19 and were still able to meet the most urgent needs of their communities. These organizations are at the front lines of this
crisis. We thank them for their dedication to New York’s communities, their passion for
change, and for the incredible work they have continued to do throughout COVID-19.
We would like to give a special thank you to Frederick Shack and James Rubin, co-
Chairs of the Human Services Recovery Taskforce, who volunteered a significant amount of their time and expertise and whose involvement was invaluable in bringing people to
the table and reaching consensus on the recommendations put forward in this report.
This report would not have been possible without the thoughtful, candid contributions of
the Human Services Recovery Taskforce members. These leaders with expertise in human
services, health care, government, philanthropy, and business devoted a substantial
amount of time over the course of several months to exploring difficult questions in a meaningful way. They provided thought-provoking insights that led to rich discussions
and helped advance our work. Once the recommendations were completed, all
members of the Taskforce contributed to the editing of the report. We thank them for
their collaborative approach, unwavering commitment, and for giving so much of
their time and energy to this process. A list of the Taskforce members appears in the
appendices to this report.
This report was written through the combined efforts of Michelle Jackson, Executive
Director, and Gloria Kim, Senior Policy Analyst, of the Human Services Council. Dalia
Mechanic, Sam Knowles, and Tabraiz Lodhi of Bennett Midland contributed to the
report, created the case studies, and conducted the research and data analysis on this
report. Jennifer Burner Barden of Risa Heller Communications was the public relations
consultant for this project and wrote the Executive Summary, offering invaluable insights
on communicating our message effectively.
James Parrott of The New School Center for New York City Affairs led the research into
New York City’s human services workforce.
The HSC staff were instrumental in producing this report. It was a herculean effort, and
we would like to thank Na’ilah Amaru, Policy Director, Gabriela Andrade, Policy and
Organizing Strategist, Jennifer Diamond, Communications and Membership Coordinator,
MJ Okma, Policy and Campaign Strategist, Luis Saavedra, Executive Assistant, Phoebe
Wapnitsky, Fordham School of Social Work Student Intern, and Jason Wu, Director of
Operations, for helping make this report possible.
36A c k n o w l e d g e m e n t s
HSC thanks the following funders for their generous support of this report: Altman
Foundation, Robin Hood, and The New York Community Trust. We also thank The Clark
Foundation for making significant investments in the work of the Human Services Council. We deeply appreciate the support these funders provide to HSC’s 170 members,
whose collective investment makes the very existence of HSC possible. Participation
in the Taskforce and/or support by these funders does not constitute implicit or express
endorsement of the contents of this report.
Finally, we thank the HSC Board of Directors whose sound stewardship of the
organization has enabled HSC to be a strong representative of the human services
sector in New York. A list of our Board Members can be found in the appendices to this
report.
This report, although a significant undertaking, is just the beginning of our journey towards helping the human services sector and New York recover from the COVID-19
pandemic. We are deeply grateful to all who made it possible, and we are excited to
continue our collaboration for the long-term recovery efforts.
37 A c k n o w l e d g e m e n t s

Endnotes
38

Endnotes...1 Human Services Council, H. S. C. (2016). (rep.). New York Nonprofits in the Aftermath
of FEGS: A CALL TO ACTION. Human Services Council. Retrieved from https://
humanservicescouncil.org/wp-content/uploads/Initiatives/HSCCommission/
HSCCommissionReport.pdf
2 See Appendix A, Survey Findings: Understanding the State of the New York Human Services
Sector, 7.
3 Ibid.
4 Roberts, D., Wyman, O., Morris, G., Wyman, O., MacIntosh, J., & Millenson, D. (n.d.). Risk Management for Nonprofits. 1. Retrieved May 28, 2021 from https://www.oliverwyman.
com/content/dam/oliver-wyman/global/en/2016/mar/SeaChange-Oliver-Wyman-
Risk-Report.pdf
5 Human service organizations in New York | Cause IQ. (n.d.). Retrieved May 5, 2021, from
https://www.causeiq.com/directory/human-service-organizations-list/new-york-
state/#search_section
6 New York State’s Historic Disinvestment in Human Services since the Great Recession (n.d.).
Center for New York City Affairs. Retrieved May 13, 2021, from http://www.centernyc.
org/ny-state-historic-disinvestment
7 A National Imperative. (n.d.). 35. Retrieved June 1, 2021, from https://www.oliverwyman.
com/content/dam/oliver-wyman/v2/campaign-assets/January2018/A%20National%20Imperative_Finalscreen.pdf
8 See Appendix B, Preliminary Findings on New York City’s Human Services Workforce, 3.
9 Ibid., p. 2.
10 NYC homeless shelter occupancy for adults reached all-time high during COVID: study—New York Daily News. (n.d.). Retrieved May 12, 2021, from https://www.
nydailynews.com/coronavirus/ny-covid-adults-nyc-homeless-shelters-20210427-
f6gcyj436rhnxcvvrq2nicpq3q-story.html
11 Food Insecurity. (n.d.). City Harvest. Retrieved May 12, 2021, from https://www.
cityharvest.org/food-insecurity/
12 Parrott, J. A. (2021, February). New York City’s Covid-19 Economy Will Not Snap Back (Pg.
3). The New School Center for New York City Affairs. https://static1.squarespace.com
static/53ee4f0be4b015b9c3690d84/t/6026c0746c5e057118e2c15a/1613152379026/
CNYCAEconReport021221.pdf
13 State Labor Department Releases Preliminary March 2021 Area Unemployment Rates. (n.d.). Department of Labor. Retrieved May 5, 2021, from https://dol.ny.gov/news/
state-labor-department-releases-preliminary-march-2021-area-unemployment-rates
39 E n d n o t e s

14 See Appendix B, Preliminary Findings on New York City’s Human Services Workforce, 6.
15 Candid & Center for Disaster Philanthropy. (2021, February). 23. Philanthropy and COVID-19 Measuring one year of giving. https://www.issuelab.org/
resources/38039/38039.pdf
16 See Appendix B, Preliminary Findings on New York City’s Human Services Workforce, 2.
17 See Appendix A, Survey Findings: Understanding the State of the New York Human Ser-
vices Sector, 16.
18 Ibid.
19 Ibid., p. 17.
20 Ibid., p. 16.
21 Ibid., p. 8.
22 Ibid., p. 7.
23 Ibid.
24 Ibid., p. 9.
25 Ibid.
26 Ibid., p. 7.
27 Measuring the Digital Divide in NYC: An Open Data Guide. (2021, February 26). Citizens’
Committee for Children of New York. https://cccnewyork.org/events/measuring-the-
digital-divide-in-nyc-an-open-data-guide/
28 See Appendix A, Survey Findings: Understanding the State of the New York Human
Services Sector, 16.
29 Ibid., p. 7.
30 See Appendix B, Preliminary Findings on New York City’s Human Services Workforce, 2.
31 Ibid.
32 Ibid.
33 See Appendix A, Survey Findings: Understanding the State of the New York Human
Services Sector, 12.
34 A Year Later, Who Is Back to Work and Who Is Not? - The New York Times. (n.d.). Retrieved
May 5, 2021, from https://www.nytimes.com/interactive/2021/03/09/business/
economy/covid-employment-demographics.html
40E n d n o t e s

35 See Appendix A, Survey Findings: Understanding the State of the New York Human
Services Sector, 12.
36 Ibid.
37 Ibid., p. 14.
38 See Appendix B, Preliminary Findings on New York City’s Human Services Workforce, 4.
39 Ibid.
40 Human Services Council of New York & Strong Nonprofits for a Better New York. (2018, October). Fund Human Services to Build Strong Communities. Strong Nonprofits. https://humanservicescouncil.org/wp-content/uploads/2021/05/Keep-the-COLA-one-
pager-GENERAL-10.16.18.pdf
41 See Appendix A, Survey Findings: Understanding the State of the New York Human
Services Sector, 14.
42 Ibid., p. 14.
43 Ibid., p. 12.
44 The Fiscal Policy Institute. (2020, February). Building a More Equitable New York Human Service Nonprofits. http://fiscalpolicy.org/wp-content/uploads/2020/02/FY2021-Human-Service-Nonprofits.pdf
45 See Appendix A, Survey Findings: Understanding the State of the New York Human
Services Sector, 13.
46 Johnson, H. C., Dromm, H. D., Rosenthal, H. H., & McKinney, L. R. (2022). The New York City Council’s Response to the Fiscal 2022 Preliminary Budget and Fiscal 2021 Preliminary Mayor’s Management Report. 5. Retrieve June 1, 2021, from https://council.nyc.
gov/budget/wp-content/uploads/sites/54/2021/04/Fiscal-2022-Preliminary-Budget-
Response-1.pdf
47 FY 2022 Enacted Budget | NYS DOB. (n.d.). Retrieved June 1, 2021, from https://www.
budget.ny.gov/pubs/archive/fy22/en/index.html
48 See Appendix A, Survey Findings: Understanding the State of the New York Human
Services Sector, 4.
49 Ibid., p. 6.
50 Ibid.
51 Ibid., p. 7.
52 Ibid., p. 8.
41 E n d n o t e s

53 Ibid., p. 6.
54 Ibid., p. 8.
55 Ibid., p. 6.
56 Guidance for Grants and Agreements, 78 FR 78608, (Dec. 26, 2013), as amended at 79 FR
75886, (Dec. 19, 2014); 85 FR 49563, (Aug. 13, 2020).
57 The Recovery Budget: Mayor de Blasio Releases the Executive Budget for Fiscal Year 2022. (2021, April 26). The Official Website of the City of New York. http://www1.nyc.
gov/office-of-the-mayor/news/307-21/the-recovery-budget-mayor-de-blasio-releases-executive-budget-fiscal-year-2022
58 See Appendix A, Survey Findings: Understanding the State of the New York Human
Services Sector, 7.
59 See Appendix B, Preliminary Findings on New York City’s Human Services Workforce, 1.
60 Ibid.
61 See Appendix A, Survey Findings: Understanding the State of the New York Human
Services Sector, 6.
62 See Appendix B, Preliminary Findings on New York City’s Human Services Workforce, 6.
63 Ibid.
64 Ibid., p. 1.
65 Human Services Council, H. S. C. (2016). (rep.). New York Nonprofits in the Aftermath of FEGS: A CALL TO ACTION. Human Services Council. 3. Retrieved from https://
humanservicescouncil.org/wp-content/uploads/Initiatives/HSCCommission/
HSCCommissionReport.pdf
66 Mayor’s Office of Contracts Services, & Nonprofit Resiliency Committee, Guide to Col-laborative Communication with Human Services Providers (2018). New York City, New
York; Nonprofit Resiliency Committee. Retrieved May 28, 2021, from https://www1.nyc.
gov/assets/opportunity/pdf/Guide-to-Collaborative-Communication.pdf
67 Treasury Launches Coronavirus State and Local Fiscal Recovery Funds to Deliver $350 Billion | U.S. Department of the Treasury. (n.d.). Retrieved May 20, 2021, from https://
home.treasury.gov/news/press-releases/jy0169
68 See The New York City Council’s Response to the Fiscal 2022 Preliminary Budget and
Fiscal 2021 Preliminary Mayor’s Management Report for the potential 3% COLA, https://council.nyc.gov/budget/wp-content/uploads/sites/54/2021/04/Fiscal-2022-
Preliminary-Budget-Response-1.pdf. See the State FY 2022 Enacted Budget for 1% COLA, https://www.budget.ny.gov/pubs/archive/fy22/en/index.html.
42E n d n o t e s

Appendices
43

AS u r v e y F i n d i n g s :
U n d e r s t a n d i n g t h e S t a t e o f t h e N e w Yo r k H u m a n S e r v i c e s S e c t o r i n t h e
Wa k e o f C O V I D - 1 9
Append ix
P re p a re d b y B e n n e t t M i d l a n d L L C

HUMAN SERVICES COUNCIL
Survey Findings: Understanding the State of the New York Human Services Sector
in the Wake of COVID-19
June 2021
Prepared by: BENNETT MIDLAND LLC 245 West 29th Street, Floor 12A
New York, New York 10001
www.bennettmidland.com

Contents OVERVIEW ............................................................................................................................. 1 I. FINANCIAL FINDINGS ................................................................................................ 4 II. WORKFORCE FINDINGS ........................................................................................... 12 III. PROGRAMMING FINDINGS ..................................................................................... 16 APPENDIX ............................................................................................................................ 19
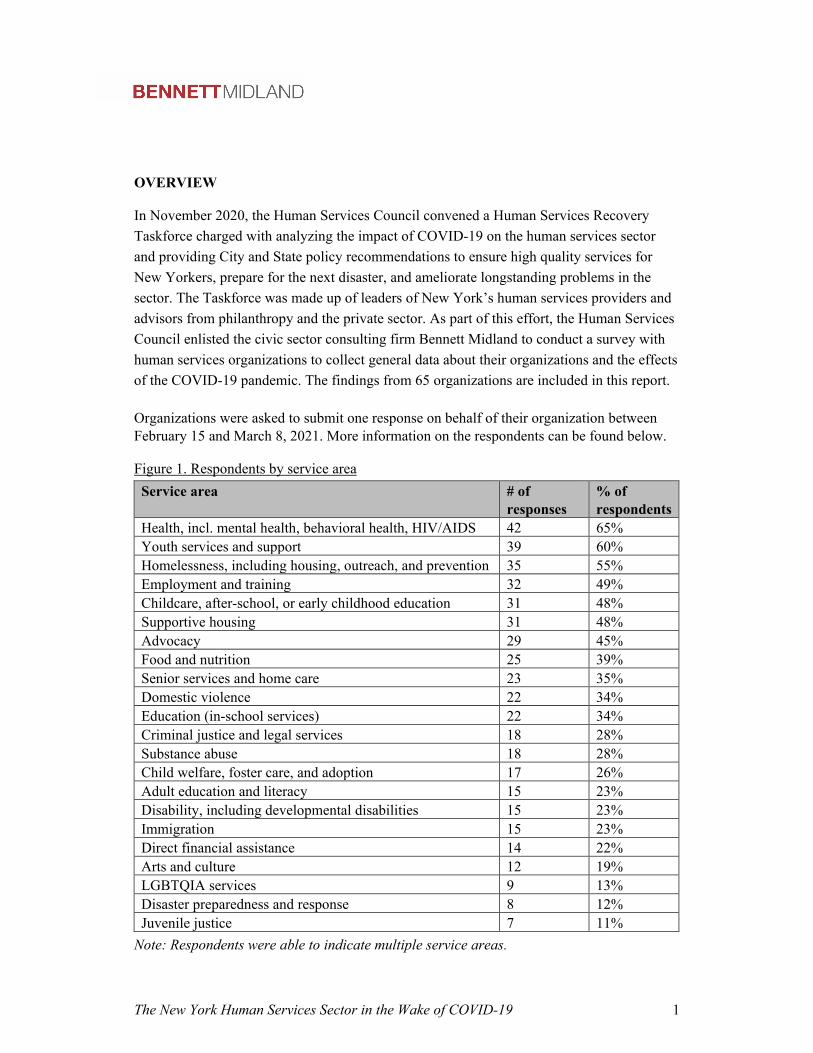
The New York Human Services Sector in the Wake of COVID-19 1
OVERVIEW
In November 2020, the Human Services Council convened a Human Services Recovery Taskforce charged with analyzing the impact of COVID-19 on the human services sector and providing City and State policy recommendations to ensure high quality services for New Yorkers, prepare for the next disaster, and ameliorate longstanding problems in the sector. The Taskforce was made up of leaders of New York’s human services providers and advisors from philanthropy and the private sector. As part of this effort, the Human Services Council enlisted the civic sector consulting firm Bennett Midland to conduct a survey with human services organizations to collect general data about their organizations and the effects of the COVID-19 pandemic. The findings from 65 organizations are included in this report.
Organizations were asked to submit one response on behalf of their organization between February 15 and March 8, 2021. More information on the respondents can be found below.
Figure 1. Respondents by service area Service area # of
responses % of respondents
Health, incl. mental health, behavioral health, HIV/AIDS 42 65% Youth services and support 39 60% Homelessness, including housing, outreach, and prevention 35 55% Employment and training 32 49% Childcare, after-school, or early childhood education 31 48% Supportive housing 31 48% Advocacy 29 45% Food and nutrition 25 39% Senior services and home care 23 35% Domestic violence 22 34% Education (in-school services) 22 34% Criminal justice and legal services 18 28% Substance abuse 18 28% Child welfare, foster care, and adoption 17 26% Adult education and literacy 15 23% Disability, including developmental disabilities 15 23% Immigration 15 23% Direct financial assistance 14 22% Arts and culture 12 19% LGBTQIA services 9 13% Disaster preparedness and response 8 12% Juvenile justice 7 11%
Note: Respondents were able to indicate multiple service areas.

The New York Human Services Sector in the Wake of COVID-19 2
Figure 2. Respondents by City, State, and Federal agency contractors City agency # of
responses % of respondents
Department of Health and Mental Hygiene 43 66% Human Resources Administration 38 58% Department of Youth and Community Development 36 55% Department for the Aging 25 39% Department of Homeless Services 24 37% Department of Housing Preservation and Development 22 34% Administration for Children’s Services 19 29% Department of Education 19 29% Mayor’s Office of Criminal Justice 15 23% New York City Housing Authority 12 19% Department of Probation 8 12% Department of Cultural Affairs 7 11% Health and Hospitals Corporation 6 9% Department of Small Business Services 5 8% Department of Correction 3 5% Emergency Management 2 3% Mayor’s Office to End Domestic & Gender-Based Violence 2 3% New York County District Attorney’s Office 2 3% State agency # of
responses % of respondents
Office of Children and Family Services 37 56% Department of Health 27 42% Office of Mental Health 24 37% Education Department 21 33% Office of Temporary and Disability Assistance 19 30% Dormitory Authority of the State of New York 17 28% Office of Addiction Services and Supports 14 22% Office of Victim Services 10 14% Division of Housing and Community Renewal 9 14% Office for People with Developmental Disabilities 9 13% Office for the Aging 7 8% Division of Criminal Justice Services 4 6% Division of Veterans’ Services 2 3% Federal agency # of
responses % of respondents
Department of Housing and Urban Development 16 25% Department of Health and Human Services 7 11% Office on Violence Against Women 5 8% Administration for Children and Families 4 6% Office of Head Start 3 5%
Note: Respondents were able to indicate multiple City, State, and Federal agencies.

The New York Human Services Sector in the Wake of COVID-19 3
Figure 3. Respondents by size of annual operating budget Annual operating budget # of respondents % of respondents Cumulative % <$500,000 1 2% 2% $500,000-$1,000,000 1 2% 4% $1,000,001-$3,000,000 4 6% 10% $3,000,001-$5,000,000 8 12% 22% $5,000,001-$10,000,000 8 12% 34% $10,000,001-$15,000,000 4 6% 40% $15,000,001-$25,000,000 4 6% 46% $25,000,001-$50,000,000 9 14% 60% $50,000,001-$75,000,000 4 6% 66% $75,000,001-$100,000,000 5 8% 74% >$100,000,000 17 26% 100%
Figure 4. Respondents by number of clients served annually Number of clients # of respondents % of respondents Cumulative % <1,000 7 11% 11% 1,000-5,000 17 26% 37% 5,001-10,000 8 12% 49% 10,001-25,000 13 20% 69% 25,001-50,000 11 17% 86% >50,000 9 14% 100%
Figure 5. Respondents by boroughs served NYC borough # of responses % of respondents Manhattan 53 82% The Bronx 47 72% Brooklyn 47 72% Queens 45 69% Staten Island 30 46%
Figure 6. Respondents by other regions served outside NYC NYC borough # of responses % of respondents Long Island 16 25% Hudson Valley 14 22% Western New York 5 8% Southern Tier 5 8% Central New York 4 6% Capital Region 4 6% Finger Lakes 3 5% Mohawk Valley 3 5% North Country 3 5%
Note: Respondents were able to indicate multiple boroughs and regions.

The New York Human Services Sector in the Wake of COVID-19 4
I. FINANCIAL FINDINGS
Finding #1: Across the sector, COVID-19 had a significant negative impact on
organizations’ budgets. When asked about the greatest challenges organizations faced
during the pandemic, nearly all respondents mentioned financial issues—noting that dealing
with immediate financial management issues and constraints prevents organizations from
thinking strategically and proactively planning for growth. This negative impact is projected
to last well into the next calendar year.
- Over half of respondents indicated a decline in expected revenue in calendar year2020. Of these organizations, the average difference between their actual revenueand budgeted revenue for calendar year 2020 was a staggering $9.1M (almost 10%of their budgeted revenue, on average).
- Organizations with operating budgets under $25M were more significantlyimpacted, experiencing on average a 13% reduction between expected and actualrevenue in calendar year 2020.
Figure 7. Changes in organizations’ actual revenue compared to their pre-pandemic budgeted revenue for calendar year 2020
51%
31%
17%
0%
10%
20%
30%
40%
50%
60%
Experienced a decrease inrevenue
Experienced nosignificant change in
revenue
Experienced an increasein revenue
Perc
enta
ge o
f org
aniz
atio
ns

The New York Human Services Sector in the Wake of COVID-19 5
Figure 8. Loss of revenue in calendar year 2020 for small, medium, and large organizations that experienced a decline in revenue
- The reduction in New York City’s indirect rate and the loss of annual fundraisingevents were the biggest drivers in loss of expected revenue.
o Of organizations that experienced a change in revenue, 32% cited thereduction in NYC’s indirect rate and 58% cited loss of in-person fundraisingevents as reducing their revenue.
o Aside from the indirect rate, respondents reported mixed impacts from theoverall change in government funding on their revenue compared to pre-pandemic projections, with 28% indicating that their revenue was positivelyimpacted, 30% noting a negative impact, and 21% noting no significantchange or impact.
- At least one organization with performance-based contracts experienced a dramaticdecrease in revenue because project outcomes were not possible to achieve asinitially described, leaving the organization to bear the costs without earningrevenue.
- Even as the City reduced its payments during the pandemic, it did not slow down thepace of required audits, which have been extraordinarily time-consuming during aperiod when organizations are in crisis mode, requiring staff to clear their days tofulfill urgent requests for paperwork. The City asked one organization to participatein 37 audits between September 2020 through May 2021.
- Looking ahead, a third of organizations expect a decrease in revenue in calendaryear 2021 compared to the actual revenue they received in calendar year 2020.
13%
6%
8%
0%
2%
4%
6%
8%
10%
12%
14%
$25M–$100M
Reve
nue
lost
as a
per
cent
age
of b
udge
ted
reve
nue
Budgeted revenue for calendar year 2020

The New York Human Services Sector in the Wake of COVID-19 6
Finding #2: For organizations that had a City-approved increase to their indirect cost rate,
the rollback of the promise posed a significant financial burden and was especially felt
during a time when organizations were asked to outlay additional costs to keep their
operations going and their staff safe during a pandemic.
- 64% of respondents that contract with the City had an indirect rate increase approved through the Indirect Cost Rate Initiative, which the City chose not to honor after the pandemic hit (in April 2021, the City said it would restore the indirect funding).
o On average, these organizations lost $396,000 in FY20 due to the City providing a lower indirect rate than initially promised through the Indirect Cost Rate Initiative.
- For the 64% that had the rate increase approved, the average indirect rate held with City agencies in FY19 was 10%, and the average indirect rate initially approved for FY20 was 17%.
o Seven respondents with an annual operating budget between $25-$50M had the highest initially approved indirect rate for FY20 at 18% on average.
- Most organizations found that the change in the indirect cost rate by the City created hardships for already stretched organizations and clients during the pandemic.
o 68% of respondents agreed with the statement: “The lower indirect rate provided to my organization contributed to difficulties in preparing for and/or responding to the pandemic.”
o 89% of respondents agreed with the statement: “My organization would produce better outcomes for its clients if it was reimbursed for the full cost of providing services.”
- Among respondents, the average indirect cost rate with the State in FY20 is 11%.
Finding #3: A longstanding problem in the sector, delays in payments from the City and
State wreak havoc on organizations, with 70% of organizations reporting a delayed payment
from the City and 60% from the State in the last year. As organizations were asked to do
more with less during the pandemic, many were forced to take out loans—and pay interest,
which is not reimbursed by contracts.
- An average of 77% of organizations’ revenue came from government contracts incalendar year 2020, among those that provided a breakdown.
- The average value of payments delayed in the last year from the City toorganizations was $8,025,000 (an average of 13% of annual operating budgets)compared to $998,000 by the State (an average of 4% of budgets).

The New York Human Services Sector in the Wake of COVID-19 7
Figure 9. Average delayed payments from the City and State as a percentage of organizations’ annual operating budgets, broken out by budget range
- Nearly 46% of respondents had to take out loans or draw on a line of credit to make
up for withheld or delayed payments—at significant cost. The average annual cost of interest on interest-bearing loans is reported as $223,000.
- 80% of relevant organizations were provided with a reason for withholding by the State. The most common reason cited was the State budget crisis and its associated funding cuts.
- Half of organizations whose payments were withheld by the State indicated that the State had confirmed they would receive some of the withheld payment.
Finding #4: Government often did not cover the cost of PPE, IT, and other physical
protections needed to ensure staff safety and operations continuity. Organizations
overwhelmingly had to turn to philanthropy or draw on their general operating funds to pay
for items essential to maintaining operations and staff safety during COVID-19.
- On average, respondents spent $539,000 on COVID-related physical materials in calendar year 2020 (e.g., PPE, plexiglass barriers, phones, computers, hotspots, broadband expansion/installation, transportation).
o Of that amount, an average of $204,000 was spent on IT-related COVID expenses.
o On average, around 38% of total COVID-related expenses on physical materials was reimbursed by government, leaving organizations to cover the rest.
12%
14%
12%
7%
3%
1%
0%
2%
4%
6%
8%
10%
12%
14%
16%
$25M–$100M > $100MAve
rage
am
ount
del
ayed
as a
per
cent
age
of a
nnua
l op
erat
ing
budg
et
Annual operating budget
City State

The New York Human Services Sector in the Wake of COVID-19 8
Figure 10. Percentage of organizations reporting COVID-related expense categories as unreimbursed
- Organizations turned to a variety of places to help cover the gap—79% noted usingfunds from philanthropy and 69% using their general operating funds.
- The Department of Homeless Services was the City agency most likely to reimbursethe organizations that contract with it, with 67% of the relevant respondentsreceiving reimbursements for physical protections and IT. The Department ofHousing Preservation and Development was least likely, with only 5% reporting thesame.
- The Office of Addiction Services and Supports was the State agency most likely toreimburse the organizations that contract with it, with 43% of the relevantrespondents reporting receiving reimbursements.
- The Dormitory Authority of the State of New York was the least likely to providereimbursements–none of the seven organizations that received reimbursements fromother State agencies received one from this agency.
Finding #5: Respondents noted that government reimbursed hazard pay and additional
overtime expenses related to COVID-19 at a higher rate than physical protections and IT
needed to ensure continuity of operations.
- 45% of organizations experienced an increase in overtime costs due to the pandemic,spending an average of $542,000 on additional overtime.
- Organizations had an average of 48% of their hazard pay expenses and 44% ofadditional overtime expenses reimbursed. By comparison, government reimbursedon average about 38% of the COVID-related physical expenses organizationsreported.
28%
17%
15%
14%18%
18%
14%
20%
Transporation
Plexiglass barriers
Phones
PPE
Computers
Hotspots
Broadband
Other

The New York Human Services Sector in the Wake of COVID-19 9
Figure 11. Expense categories reported as reimbursed by government
- The agencies most likely to reimburse for overtime expenses include:
o Department of Homeless Services (67% of organizations that contract with this agency and experienced an increase in overtime cost received reimbursements)
o Human Resources Administration (32% of organizations that contract with this agency received reimbursements)
o Department of Health and Mental Hygiene (30% of organizations that contract with this agency received reimbursements)
Finding #6: Organizations that were eligible overwhelmingly turned to the Payroll
Protection Program (PPP) to help offset some of the financial burdens of COVID-19.
- Of the 66% of respondents that were eligible for PPP, nearly 91% either applied or intended to apply for a PPP loan.
- When reflecting on the financial gap that the PPP loan filled, one organization noted “without PPP, we would have closed.”
Finding #7: Most organizations were disappointed by the City and State’s response to the
human services sector during the pandemic, highlighting a need for government to better
plan and collaborate in future crises.
- 63% of respondents agreed with the statement: “I was disappointed by the City’s response to the needs of the human services sector during the pandemic.”
- 68% of respondents agreed with the statement: “I was disappointed by the State’s response to the needs of the human services sector during the pandemic.”
38%
48%44%
62%
52%56%
0%
10%
20%
30%
40%
50%
60%
70%
COVID-related physicalmaterials
Hazard pay Overtime
Ave
rage
am
ount
of e
xpen
ses r
eim
burs
edReimbursed Unreimbursed
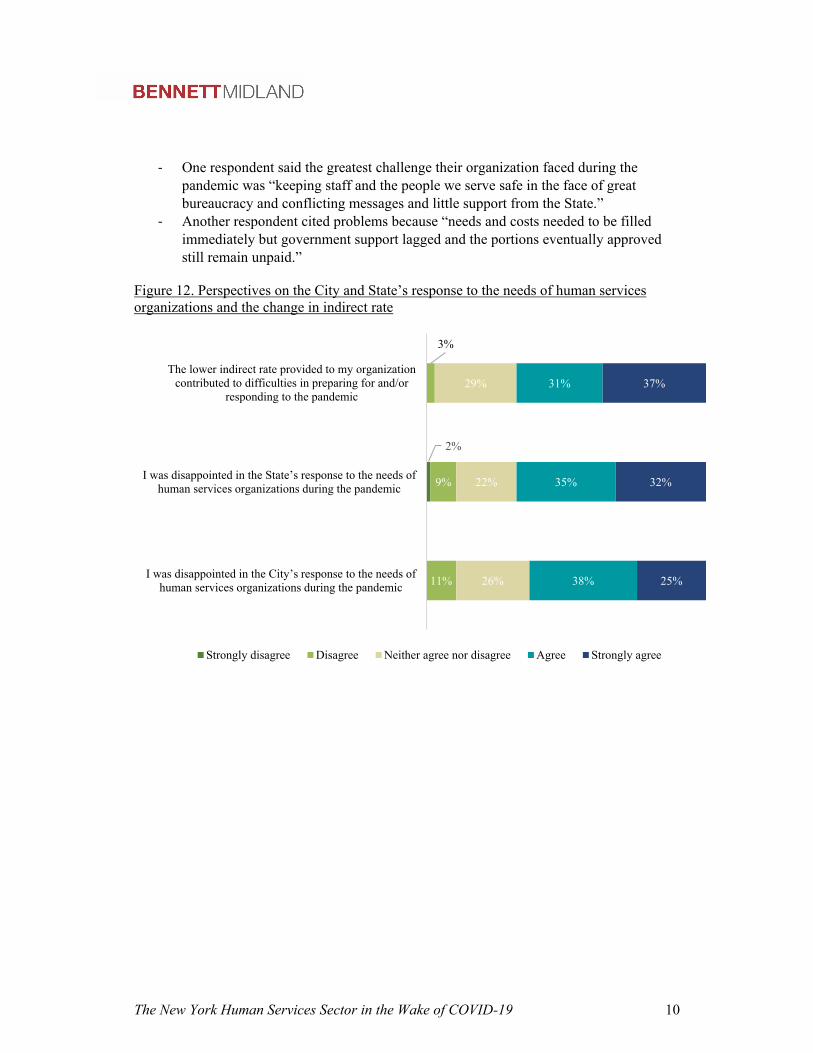
The New York Human Services Sector in the Wake of COVID-19 10
- One respondent said the greatest challenge their organization faced during the pandemic was “keeping staff and the people we serve safe in the face of great bureaucracy and conflicting messages and little support from the State.”
- Another respondent cited problems because “needs and costs needed to be filled immediately but government support lagged and the portions eventually approved still remain unpaid.”
Figure 12. Perspectives on the City and State’s response to the needs of human services organizations and the change in indirect rate
2%
11%
9%
3%
26%
22%
29%
38%
35%
31%
25%
32%
37%
I was disappointed in the City’s response to the needs of human services organizations during the pandemic
I was disappointed in the State’s response to the needs of human services organizations during the pandemic
The lower indirect rate provided to my organizationcontributed to difficulties in preparing for and/or
responding to the pandemic
Strongly disagree Disagree Neither agree nor disagree Agree Strongly agree

The New York Human Services Sector in the Wake of COVID-19 11
Finding #8: Most organizations found that philanthropy provided much-needed support where the City and State fell short.
- To compensate for decreases in revenue, organizations turned to philanthropicfunding to offset losses from other sources (44% of respondents that experienced achange in revenue said a change in philanthropic funding, compared to pre-pandemic projections, had a positive impact on their revenue).
- 69% of respondents agreed with the statement: “My organization was able to securephilanthropic donations during the pandemic to launch new programs.”
- One respondent said: “Philanthropy stepped up to meet some of the tremendoushealth and financial needs that arose because of the pandemic.” Another noted thatthe greatest success for their organization was “securing philanthropic funding to fillcritical gaps in supplies and services.”
- Philanthropy was a critical resource for unreimbursed COVID-19 expenses thatgovernment partners chose not to cover but were essential to staff and client safety,and the transition to remote operations.

The New York Human Services Sector in the Wake of COVID-19 12
II. WORKFORCE FINDINGS
Finding #9: As a result of the pandemic, permanent and temporary layoffs gripped the
human services sector.
- 62% of organizations had to either permanently or temporarily lay off or furlough staff.
- While more than half of respondents (51%) had to temporarily lay off or furlough staff, 42% of respondents reported having to make permanent layoffs, including 7 out of the 8 organizations (88%) that provide disaster preparedness and response services; 7 out of the 9 organizations (79%) that provide LGBTQIA+ services; and 12 out of the 18 organizations (67%) that provide substance abuse services.
- The vast majority (78%) of organizations that permanently laid off staff had delayed payments from the City, and 70% had delayed payments from the State.
Finding #10a: Black and Latinx employees made up a much larger share of organizations’
frontline roles that carried greater risk of COVID-19 exposure than White employees.
- People of color are disproportionately represented in frontline roles. On average, 85% of organization’s frontline workers identified as people of color, including 48% identifying as African American or Black and 30% identifying as Hispanic or Latinx.
o While organizations reported that 21% of all staff identify as White, only 14% of frontline workers identify as White.
Figure 13. Racial demographics of frontline workers
48%
30%
14%
4% 4%
Black or AfricanAmerican
Hispanic or Latinx
White
Asian
Other
Chart reflects average percentage of staff identifying as each identity for organizations that
provided demographic data.

The New York Human Services Sector in the Wake of COVID-19 13
Figure 14. Workforce racial demographics
Finding #10b: The racial disparity among frontline workers is even greater at large
organizations with over 100 full- and part -time staff, where over 50% of frontline roles are
held by Black employees.
- In large organizations, the average percentage of Black employees serving in frontline roles (52%) is over four times higher than White employees (12%).
Figure 15. Racial demographics of frontline workers by staff size
41%
29%
21%
5% 4%
48%
30%
14%
4% 4%
0%
10%
20%
30%
40%
50%
Black or AfricanAmerican
Hispanic orLatinx
White Asian Other
% o
f Wor
kfor
ceAll staff Frontline staff
Chart reflects average percentage of staff identifying as each identity for organizations that provided
52%
28%
12%
3% 4%
39% 39%
14%
4% 2%
0%
10%
20%
30%
40%
50%
60%
Black or AfricanAmerican
Hispanic orLatinx
White Asian Other
% o
f Wor
kfor
ce
Large organizations (over 100 staff)
Small organizations (under 100 staff)
Chart reflects average percentage of staff identifying as each identity for organizations that provided
demographic data.

The New York Human Services Sector in the Wake of COVID-19 14
Finding #11: Many human services organizations are struggling with high vacancy rates,
with an estimated average vacancy rate around 11% as of March 2021.
- Of the organizations that reported their vacancy rates, 54% have a vacancy rate higher than 10%, and over 30% have a vacancy rate higher than 15%. One organization reported a vacancy rate of 28%.
o Large organizations reported higher vacancy rates. Organizations with operating budgets above $25 million had an average vacancy rate over 13%.
Figure 16. Average vacancy rate of organizations by size of operating budget
- 75% of the organizations that reported having a vacancy rate of 10% or higher had
delayed payments from the City, compared to 65% of organizations with a vacancy rate lower than 10% that reported delayed City payments.
Finding #12: 80% of respondents reported that inadequate pay significantly impacts their
organization’s ability to make hires—far and away above other factors.
- Inadequate opportunities for career advancement, inadequate benefits, and high caseloads were each cited by around 17% of respondents as significant factors impacting their organization’s ability to make hires.
9%
10%
7%
7%
14%
12%
11%
14%
0% 2% 4% 6% 8% 10% 12% 14% 16%
$1M–$3M
$3M–$10M
$10M–$15M
$15M–$25M
$25M–$50M
$50M–$75M
$75M–$100M
>$100M
Average vacancy rate
Ann
ual o
pera
ting
budg
et

The New York Human Services Sector in the Wake of COVID-19 15
Figure 17. Percentage of organizations reporting a factor significantly impacted their ability to make new hires
- One organization explained that “cuts to the ICR [Indirect Cost Rate] have impacted
our a i it to provide annua sa ar increases to our sta a of o ave gone to incredible lengths to continue to serve families this year.”
- One organization reported using their PPP funding to recognize work performed by staff beyond their ordinary responsibilities, which was not possible to finance through outcome-based government contracting.
Finding #13: Most organizations said it was common for departing staff to take government
jobs, which generally offer better salaries and benefits for similar work—representing a
significant source of talent loss for NYC direct service providers.
- 70% of organizations said it was somewhat or very common for staff to leave for government jobs.
- Many organizations note a perverse trend, saying that low government rates for services are the source of inadequate pay and drive substantial turnover, while higher pay for government workers draws them away from human services organizations.
80%
18%
17%
17%
13%
Inadequate pay
Inadequate benefits
Inadequate opportunitiesfor career advancement
High case loads
Long hours

The New York Human Services Sector in the Wake of COVID-19 16
III. PROGRAMMING FINDINGS
Finding #14: Instead of shrinking their operations in response to the practical and financial
constraints of COVID-19, organizations launched new services and expanded existing ones.
- 82% of organizations reported launching new services and 72% of organizations reported expanding existing ones.
- Despite the challenges of offering services virtually or with other programmatic constraints during the pandemic, only around half of respondents (51%) reported stopping any services due to the pandemic.
- One organization said “none of our services were ever interrupted and we started ve ne progra s ore t an an sing e ear in our istor
Finding #15: Telehealth and remote case management represented the most common new
services launched.
- 45% of organizations reported launching new telehealth services, particularly for substance abuse services and mental health support. Of these, 62% plan on continuing to offer telehealth services in the long-term, and 78% of respondents overall agree that they plan on continuing to offer remote service delivery. These policies would likely require contracting changes and cooperation from government agencies.
- Organizations cited telehealth and remote work as a great success and a challenge. o 85% of respondents agreed with the statement: “My organization was able
to swiftly adjust to remote operations at the start of the pandemic.” o By far, respondents noted the technology innovations they implemented to
continue delivering services, serve clients, and support staff as their greatest success and innovation in response to the pandemic.
o Despite these successes, a number of organizations said at least some staff and clients struggled to transition to digital services due to lack of familiarity, training, and technology.
- Only 28% of organizations agreed that they realized net cost savings in remote service delivery compared to in-person service delivery, indicating that remote services were not necessarily cheaper to deliver for most organizations.
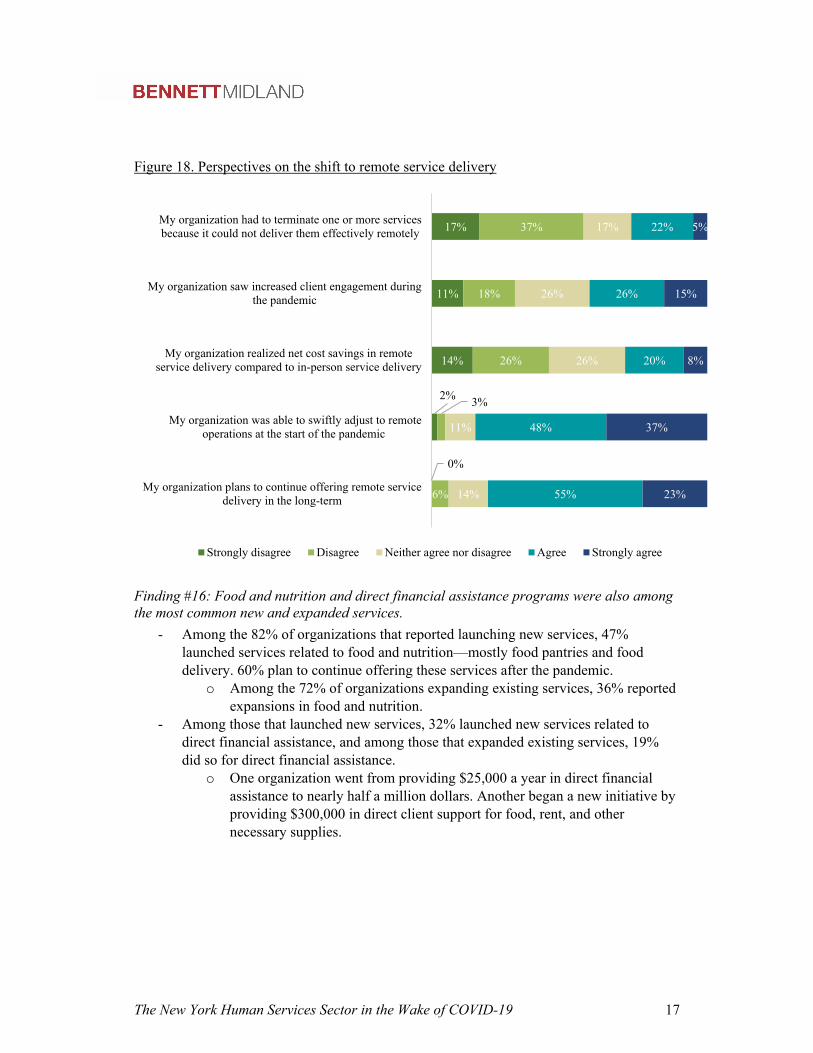
The New York Human Services Sector in the Wake of COVID-19 17
Figure 18. Perspectives on the shift to remote service delivery
Finding #16: Food and nutrition and direct financial assistance programs were also among
the most common new and expanded services.
- Among the 82% of organizations that reported launching new services, 47% launched services related to food and nutrition—mostly food pantries and food delivery. 60% plan to continue offering these services after the pandemic.
o Among the 72% of organizations expanding existing services, 36% reported expansions in food and nutrition.
- Among those that launched new services, 32% launched new services related to direct financial assistance, and among those that expanded existing services, 19% did so for direct financial assistance.
o One organization went from providing $25,000 a year in direct financial assistance to nearly half a million dollars. Another began a new initiative by providing $300,000 in direct client support for food, rent, and other necessary supplies.
0%
2%
14%
11%
17%
6%
3%
26%
18%
37%
14%
11%
26%
26%
17%
55%
48%
20%
26%
22%
23%
37%
8%
15%
5%
My organization plans to continue offering remote servicedelivery in the long-term
My organization was able to swiftly adjust to remoteoperations at the start of the pandemic
My organization realized net cost savings in remoteservice delivery compared to in-person service delivery
My organization saw increased client engagement duringthe pandemic
My organization had to terminate one or more servicesbecause it could not deliver them effectively remotely
Strongly disagree Disagree Neither agree nor disagree Agree Strongly agree

The New York Human Services Sector in the Wake of COVID-19 18
Figure 19. New services most frequently launched by organizations
Figure 20. Services most frequently expanded by organizations
Finding #17: Childcare/after-school services and senior services/home care were the
services that the greatest number of organizations reported terminating during the
pandemic.
- Of the organizations that terminated existing services due to the pandemic, one in three reported terminations in childcare. One in three also reported terminations in senior services.
- However, organizations like the YMCA stepped up to meet the void, hosting Learning Labs where kids could come during the school day or after school while parents were at or looking for jobs, including families in homeless shelters.
55%
47%
32%28%
23%
0%
10%
20%
30%
40%
50%
60%
Telehealth Food andnutrition
Direct financialassistance
Health Senior servicesPerc
enta
ge o
f org
aniz
atio
ns th
at la
unch
ed
new
serv
ices
36%
21% 21%19%
17%
0%
5%
10%
15%
20%
25%
30%
35%
40%
Food andnutrition
Health Homelessness Direct financialassistance
Employmentand training
Perc
enta
ge o
f org
aniz
atio
ns th
at e
xpan
ded
exist
ing
serv
ices

The New York Human Services Sector in the Wake of COVID-19 19
APPENDIX
Research methodology
This survey was administered online and distributed to HSC and non-HSC members through multiple rounds of outreach between February 15 and March 8, 2021. Respondents could save their progress in the survey and return to it later to complete it. Discrepancies that were identified in an organization’s data submission were either corrected in consultation with the respondent or excluded from the analysis. An additional round of outreach was conducted between April 5 and April 12, 2021 to gather follow-up information from the initial set of respondents. Duplicative or incomplete responses were excluded from the final analysis.
About the Human Services Council
HSC strengthens New York’s nonprofit human services sector, ensuring New Yorkers from all walks of life, across diverse neighborhoods, cultures, and generations reach their full potential. HSC fosters a diverse network of human service organizations. Together, we discuss ideas and take collective action on issues that impact the entire sector and those they serve. Through advocacy and collaboration, we support member organizations and their leaders in addressing their concerns of public policy, economic trends, and the regulatory environment. The human services workforce encapsulates 200,000+ employees in subsectors including: housing access, childcare, elder care, shelters, food pantries, mental health counseling, and disaster response. As the voice of the human services community, we highlight the struggles of those we serve, and amplify the need for a strong, well-invested sector.
About Bennett Midland
Bennett Midland is a management consulting firm in New York City that works exclusively in the civic sector. We work with government agencies, non-profit organizations, and foundations to develop and implement new programs and initiatives, solve operational problems, and execute effective management strategies. We work with the imperative to make the world better and believe the status quo is rarely ever good enough.

BP re l i m i n a r y F i n d i n g s o n N e w Yo r k C i t y ’ s H u m a n
S e r v i c e s Wo r k f o rc e
Append ix
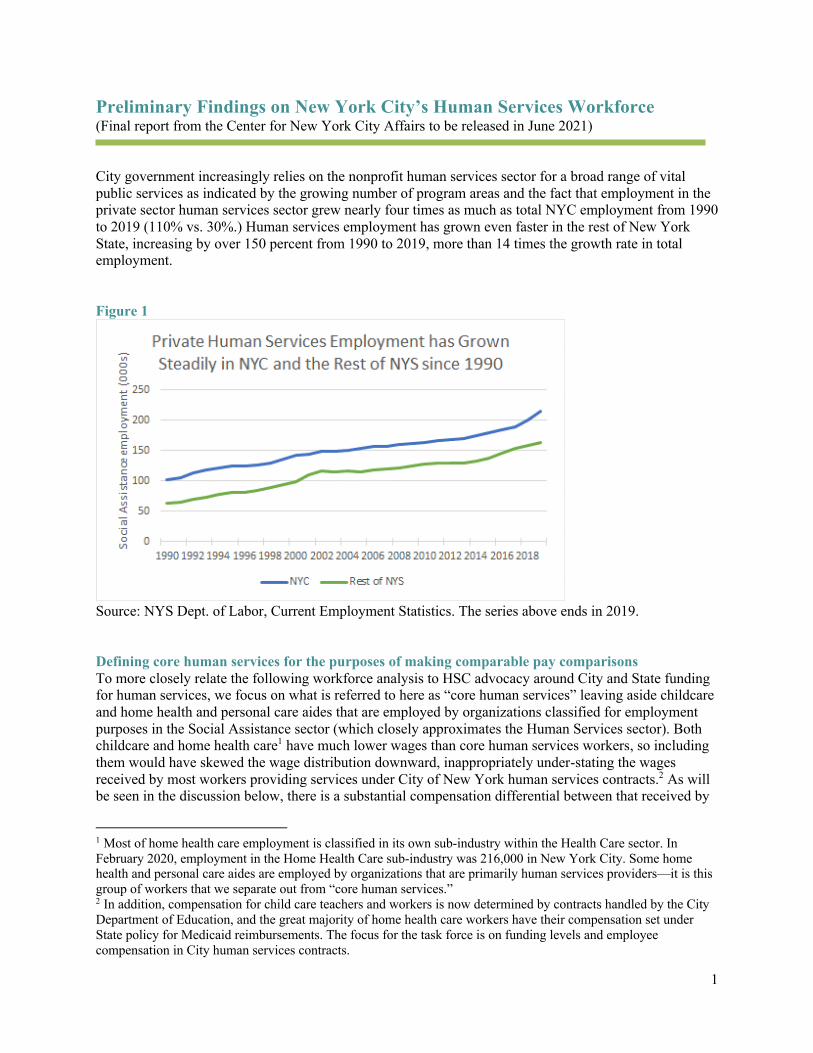
1
Preliminary Findings on New York City’s Human Services Workforce (Final report from the Center for New York City Affairs to be released in June 2021) City government increasingly relies on the nonprofit human services sector for a broad range of vital public services as indicated by the growing number of program areas and the fact that employment in the private sector human services sector grew nearly four times as much as total NYC employment from 1990 to 2019 (110% vs. 30%.) Human services employment has grown even faster in the rest of New York State, increasing by over 150 percent from 1990 to 2019, more than 14 times the growth rate in total employment. Figure 1
Source: NYS Dept. of Labor, Current Employment Statistics. The series above ends in 2019. Defining core human services for the purposes of making comparable pay comparisons To more closely relate the following workforce analysis to HSC advocacy around City and State funding for human services, we focus on what is referred to here as “core human services” leaving aside childcare and home health and personal care aides that are employed by organizations classified for employment purposes in the Social Assistance sector (which closely approximates the Human Services sector). Both childcare and home health care1 have much lower wages than core human services workers, so including them would have skewed the wage distribution downward, inappropriately under-stating the wages received by most workers providing services under City of New York human services contracts.2 As will be seen in the discussion below, there is a substantial compensation differential between that received by
1 Most of home health care employment is classified in its own sub-industry within the Health Care sector. In February 2020, employment in the Home Health Care sub-industry was 216,000 in New York City. Some home health and personal care aides are employed by organizations that are primarily human services providers—it is this group of workers that we separate out from “core human services.” 2 In addition, compensation for child care teachers and workers is now determined by contracts handled by the City Department of Education, and the great majority of home health care workers have their compensation set under State policy for Medicaid reimbursements. The focus for the task force is on funding levels and employee compensation in City human services contracts.

2
nonprofit employees and City government or private hospital employees. It is important for policy purposes to focus as closely as possible on apples-to-apples comparisons to effectively present our case. Demographic comparisons The demographic data presented below are for employees in core human services areas, excluding childcare and home health care.3 The data are from the U. S. Census Bureau’s American Community Survey. Highlights of the data presented below include:
• Human services workers are overwhelming female (66 percent), over two-thirds are full-time workers of color (68 percent), and nearly half (46 percent) are women of color. These shares are considerably higher than for New York City’s overall private sector workforce. Only a quarter (26 percent) of private sector workers overall are women of color.
• Human services workers are highly educated with 63 percent of full-time workers having a 4-year college degree or better, 10 percentage points greater than for the private sector overall. Conversely, only 3 percent of full-time human services workers do not have a high school diploma compared to 9 percent for the private sector.
• The relatively low pay in the core human services sector means that 15 percent of all workers (both full- and part-time) qualified for food stamps in the 2016-18 period analyzed, higher than the 12 percent share for all private sector workers, and much higher than for government employees (9 percent.) However, if childcare workers and home health aides are included, nearly a quarter of all human services workers received food stamps.
Figure 2
Source: CNYCA analysis of American Community Survey data, 2016-18, from IPUMS.
3 Because we are excluding extremely low-paid childcare and home health care workers, the data presented below for public assistance recipiency are lower than that which has been cited in previous reports.

3
Figure 3 – Percent of full-time and part-time workers receiving food stamps
Source: CNYCA analysis of American Community Survey data, 2016-18, from IPUMS. Borough of residence Thirty-four percent of all core human services employees reside in Brooklyn, 24 percent in the Bronx, 21 percent in Queens, 17 percent in Manhattan, and 4 percent in Staten Island. Salary comparisons with the private sector overall and the government sector An effective way to make an apples-to-apples pay comparison is to focus on full-time workers and to compare salaries by education level. Figure 4 shows median annual salary comparisons for full-time workers. The median represents the worker in the exact middle of the pay distribution within any category and is more reflective of what a typical worker might receive than the average, or mean. Given the very high pay levels for top earners in sectors like finance, corporate headquarters and professional services in New York City, mean salary data can be skewed sharply upward. For example, those with a master’s degree or better in the city’s private sector have an average salary of nearly $160,000, more than twice that in the core human services sector. Our focus here is on median pay comparisons. Figure 4 – Median annual salary for full-time workers, by education attainment
Source: CNYCA analysis of American Community Survey data, 2016-18, from IPUMS.

4
The data in Figure 4 show that nonprofit human services workers generally make about 71 percent of what government employees make, and 82 percent of what private sector workers receive. As the two columns on the right show, there is only one instance (those with less than a high school education vs. the private sector) where human services workers have a higher median salary than their counterpart in either the private sector or the public sector. However, this case is more of an anomaly since only 3 percent of human services workers have that limited level of education attainment. For workers with a high school education and higher, core human services workers generally make about $20,000 a year less than a public sector worker with a comparable education. (Over two-thirds of government employees in New York City are employed by the City of New York or one of its subsidiary entities, including Health + Hospitals and NYCHA.) If human services pay is 71 percent of City pay for a comparably educated worker, then a 41 percent increase is needed to raise nonprofit pay to the City level. Fringe benefits—including health insurance, health and welfare fund contributions, pension contributions and paid time off—are also significantly higher in the public sector than in the nonprofit human services sector. (On a preliminary basis, average fringe rates relative to gross pay are about 33 percent in the nonprofit sector compared to 49 percent for City employees. That is roughly a 50 percent differential. In the recommendation below, comparable pay is based on base pay comparability leaving aside fringe benefit comparability for the time being.) Pay comparisons for specific occupations with private hospitals and the public sector Figure 5 provides comparisons for three professional occupations, including an entry-level (“social service assistants”), and three nonprofessional occupations. The bottom half of the chart shows human services pay relative to government and to private hospitals and the last column in the bottom half averages the two ratios for each of the six occupations. The average ratios range from 60 percent for social service assistants to 79 percent for cooks and food preparation workers and for social workers. Figure 5 – Median annual salary for full-time workers, by selected occupations
Source: CNYCA analysis of American Community Survey data, 2016-18, from IPUMS.

5
Figure 6 – graphically depicts the data presented in Figure 5
Zeroing in on two key occupations and holding education level constant Another way to compare salaries between the human services sector and the public sector is to focus on two key occupations—social workers and counselors—and separate out the pay comparison for those with a bachelor’s degree from those with a master’s degree. Figure 7 presents this comparison. Figure 7
Again, the ratio of human services pay to public sector pay spans a range from 61 percent to 82 percent. Taking all three comparisons into account, the rough average ratio is about 70 percent, a differential that would require roughly a 41 percent increase to achieve a semblance of base pay parity (again, leaving aside the fringe benefit disparity for the time being.) Given the rough similarity in the Figure 4 comparisons looking across professional and nonprofessional occupations, we would suggest the 41 percent increase generally should apply across the board.

6
COVID-19 economic impact The COVID-19 economic impact could not be more lop-sided—communities of color have borne about 75 percent4 of the NYC job losses and two-thirds of job losses have hit low-paid workers, many of whom are experiencing heightened hardships and face enormous challenges in re-gaining stable employment. Even with the continued return of 20,000-25,000 jobs per month for the remainder of 2021, there will still be roughly a 300,000 jobs deficit at the end of the year. The latest City Office of Management and Budget forecast does not expect total employment to return to the pre-pandemic job level until 2023 at the earliest. The Center for New York City Affairs and the Independent Budget Office do not see a return to the pre-pandemic job level until late 2024.5 Over 500,000 city workers have been unemployed for more than eight months, and tens of thousands of New Yorkers have dropped out of the labor force, including many women who have shouldered the burden of caring for family members through the pandemic. As of April, childcare center capacity in New York City was still 25 percent below pre-pandemic levels, and there was a crisis in childcare affordability and accessibility before the pandemic. High unemployment and hardships are likely to continue for at least another two-to-three years, increasing the demands placed upon the city’s human services sector. The figure below shows the increase in public assistance since the onset of the pandemic.
4 Note this is a revised figure, up from 68 percent. The previous estimate was derived from baseline pre-pandemic employment shares by industry. That method implicitly assumed an even incidence of dislocation from employment reductions. However, demographic data on state unemployment insurance recipients show a disproportionate impact on workers of color. The UI data were used to adjust the racial and ethnic incidence of job dislocation and the revised 90 percent estimate resulted. 5 The City of New York Executive Budget, FY 2022, Message of the Mayor, April 26, 2021, p. 24; New York City Independent Budget Office, “Double Shot: An Infusion of federal Funds Boosts City’s Bottom Line, As Vaccines Bring Optimism for Economic Recovery,” May 17, 2021, p. 3; Center for New York City Affairs, New York City employment projections, May 2021, unpublished.

CM e m b e r s o f t h e
H u m a n S e r v i c e s R e c o v e r y Ta s k f o rc e
Append ix

Members o f t heHuman Se rv ices Recovery Task fo r c e
Lilliam Barrios-Paoli, Hunter CollegeDouglas Bauer, The Clark FoundationGordon Campbell, NYU WagnerJessica Cavagnero, SeaChange Capital PartnersLouisa Chafee, UJA-Federation of New YorkStuart Cohen, BDO FMAJason Cone, Robin HoodLisa David, Public Health SolutionsJanelle Farris, Brooklyn Community ServicesNathaniel Fields, Urban Resource InstituteHenry Garrido, DC37Elizabeth Gaynes, The Osborne AssociationSharon Greenberger, YMCA of Greater New YorkCorinne Hammons, Little Flower Children and Family Services of New YorkKathryn Haslanger, JASAWayne Ho, Chinese-American Planning CouncilMichelle Jackson, Human Services Council of New YorkDamyn Kelly, Lutheran Social Services of New YorkJeremy Kohomban, The Children’s VillageMyung Lee, Volunteers of America – Greater New YorkMaria Lizardo, NMICNancy D. Miller, VISIONS/Services for the Blind and Visually ImpairedHaydee Morales, Casita Maria Center for Arts & EducationGregory Morris, Stanley M. Isaacs Neighborhood CenterJames Parrott, Center for New York City Affairs at The New SchoolRachael Pine, The Altman FoundationChristine Quinn, WinRonald Richter, JCCABrenda Rosen, Breaking GroundPatricia A. Swann, The New York Community TrustJennifer Talansky, Nonprofit Finance FundMarlon Williams, Philanthropy New YorkKathryn Wylde, Partnership for New York City
Membersh ip . . .
Co -Cha i r s . . .James Rubin, Meridiam NAFrederick Shack, Urban Pathways

DH u m a n S e r v i c e s C o u n c i l ’ s
B o a rd o f D i re c t o r s
Append ix

Members o f Human Se rv ices Counc i l ’ s Boa rd o f D i rec to r s
Lilliam Barrios-PaoliGordon J. CampbellLouisa ChafeeMargaret CrottyJanelle FarrisNathaniel FieldsDavid GarzaKaren Spar KasnerDamyn KellyThomas KreverKeith LittleRonald RichterEileen TorresRobert Trobe
Membersh ip . . .
Boa rd Cha i r : Jeremy Christopher KohombanVice Ch a i r : Frederick ShackT re asu re r : Mitchell NetburnSec re t a ry : Maria Lizardo

Human Services Council of New York
130 E. 59th Street
New York, NY 10022
www.humanservicescouncil.org