esse environmental scenario search engine for the data services grid mikhail zhizhin, geophysical...
TRANSCRIPT

ESSEEnvironmental Scenario Search
Engine for the Data Services Grid
Mikhail Zhizhin, Geophysical Center Russian Academy of Sciences
Eric Kihn, National Geophysical Data Center [email protected]

www.wdcb.ru
• Geophysical Center Russian Academy of Sciences
• World Data Centers for Solid Earth and Solar-Terrestrial Physics
• Environmental data archives – paper, tapes, files, databases, e-journals…
• International network for geophysical data exchange with the US, Japan, China, …
• Computer center, Linux cluster, fiber optics• Part of the European GRID infrastructure EGEE,
Russian GRID Virtual Organization e-Earth

50 years ago – International Geophysical Year – IGY1957
Sun and space
Sun and space
Solid Earth
Meteo
Solid Earth
Satellites
Meteo
Meteo
Solid Earth
World Data Center A
World Data Center B
World Data Center C
Total data volume ~ 1 Gb
Exchange ~ 1 Mb/year
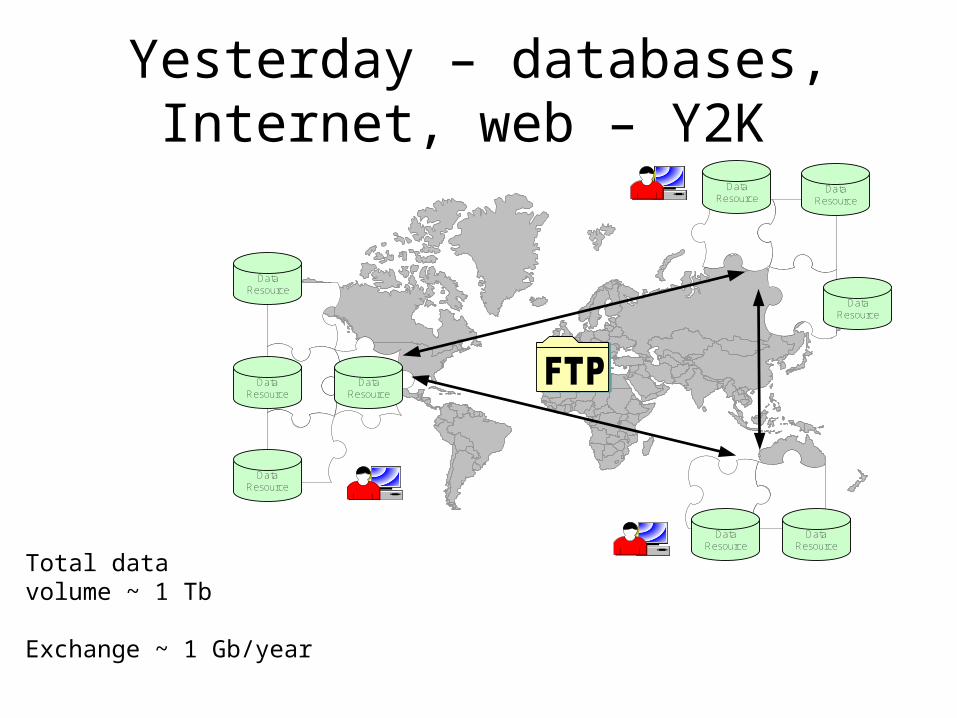
Yesterday – databases, Internet, web – Y2K
Data Resource
Data Resource
Data Resource
Data Resource
Data Resource
Data Resource
Data Resource
Data Resource
Data Resource
Total data volume ~ 1 Tb
Exchange ~ 1 Gb/year

Tomorrow – Electronic Geophysical Year – EGY2007
Data Resource
Data Resource
Data Resource
Data Resource
Data Resource
Data Resource
Data Resource
Data Resource
GRID`
Total data volume ~ 1 Pb
Exchange ~ 1 Tb/year

BoulderMoscow
Kamchatka
Nagoya
SydneyGrahamstown
SPIDR – Space Physics Interactive Data Resource
SPIDR 3
SPIDR 2
http://spidr.ngdc.noaa.gov
Beijing

Cross-disciplinary data exchange
?
Space
Atmosphere
Ocean
Geology
data
data
data
data
Userresults
queries
• Users need data from different disciplines
• Rapid growth of the data volume and data demand requires new tools for the data management and the data mining

“Metcalfe’s law” for databases
• The utility of N independent data sets seems to increase super-linearly
1 2 3 4 5 6
Nubmer of data sources
Uti
lity
• One can find N(N-1) ≈ N2 relations between data sources, that is their utility grows ≈ N2
• It is more efficient ot use several data sources than one archive

Sources of data inflation?1. New versions2. Derived data products 3. Reanalysis
0
2
4
6
8
10
12
14
16
18
1 2 3 4 5 6 7 8 9 10 11 12 13
Years
Dat
a, T
b Level 0
Level 1
Level 0 + Level 1
Products of Level 1 (NASA terminology) take 10% of the Level 0 volume, but the number of the Level 1 products is increasing. If the volume of the Level 0 data grows as N, then the volume of Level 1 data is growing as N2.
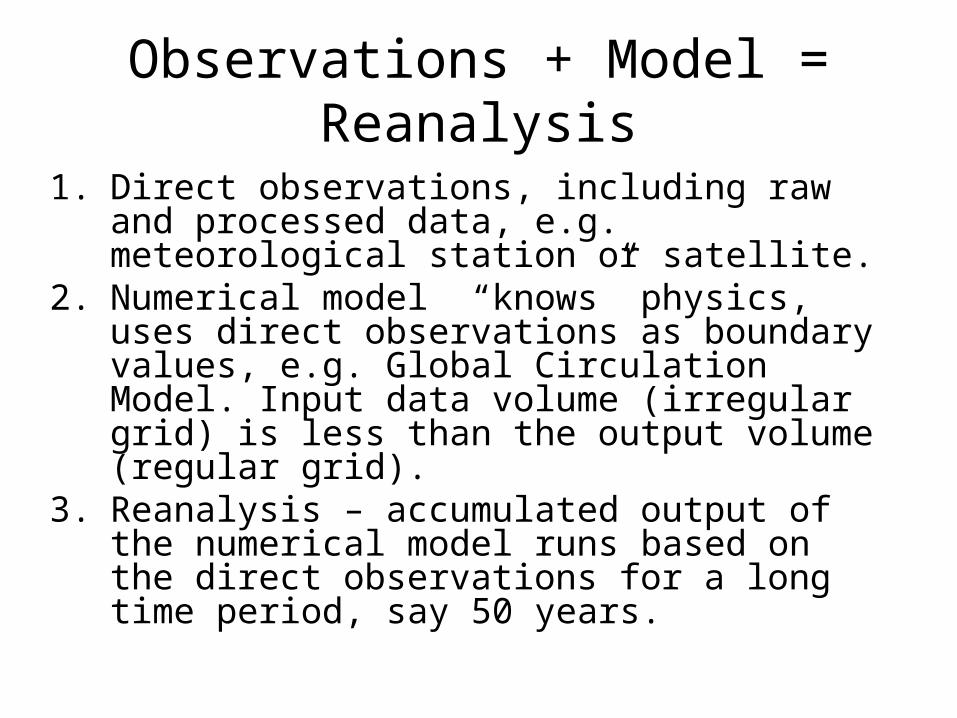
Observations + Model = Reanalysis
1. Direct observations, including raw and processed data, e.g. meteorological station or satellite.
2. Numerical model “knows” physics, uses direct observations as boundary values, e.g. Global Circulation Model. Input data volume (irregular grid) is less than the output volume (regular grid).
3. Reanalysis – accumulated output of the numerical model runs based on the direct observations for a long time period, say 50 years.
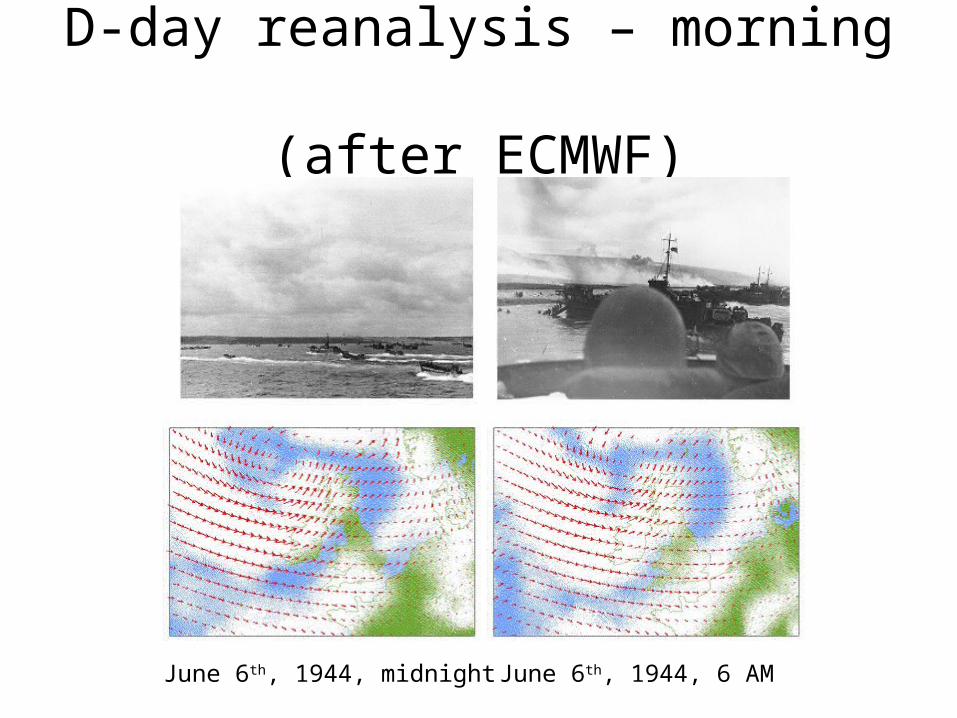
D-day reanalysis – morning (after ECMWF)
June 6th, 1944, midnight June 6th, 1944, 6 AM

D-day reanalysis – evening(after ECMWF)
June 6th, 1944, 6 PMJune 6th, 1944, 12 AM

Data inflation after reanalysis
• Modern global atmospheric circulation model (GCM) at 2.5o (latitude) x 2.5o (longitude) x 20 (levels) = 106 gridpoints.
• GCM outputs "high-frequency" data every six hours of simulation time, so ~ 1 Gb of data per simulation day .
• By contrast, the world-wide daily meteorological observational data collected over the Global Telecommunications System, is ~ 200 Mb.
• As an extreme, to run the GCM for 50 years of simulation time will provide 40 Tb of data.

IMFKpDst
10.7 cm FluxHPI
MagnetometerGOES
AMIE
TIEGCM
MSMHigh Lat Elec
Geostationary Magnetic Field, Kp
Init Conditions
SWRDATA
TEC, FoF2,Neutral Winds
Magnetic, Electric Potential, Etc.
Particle Data
Input: ground and satellite data from SPIDR
Space weather numerical models
Output: high-resolution representation of the near-Earth space
Space Weather Reanalysis

ESSE solutions
• Do not use data files, use distributed databases• Optimize data model for the typical data request• Virtualize data sources using grid (web) services• Metadata schema describes parameters, grids,
formulas for virtual parameters (e.g., wind speed from U- and V-wind)
• Search for events in the environment by the “scenario” in natural language terms
• Translate the scenario into the parallel request to the databases using fuzzy logic

ESSE architecture
Client Fuzzy SearchWeb Service
Space WeatherWeb Service
List of events
Data
Data
Data
TerrestrialWeather
Web Service
Digital TerrainWeb Service
• Fuzzy logic engine performs searching and statistical analysis of the distribution of the identified events
• Parallel mining of several distributed data sources, possibly from different subject areas
• Both the fuzzy logic engine and data sources implemented as Grid (web) services
• Interfaces and data structures can be obtained from the definitions of the web-services (WSDL)
• Web services and prototype user interface are installed on two mirror servers:− Boulder, US− Moscow, Russia

Parallel database cluster (NCEP reanalysis)
Years:1N+12N+1...
Years:2N+22N+2...
Years:3N+32N+3...
Years:N2N3N...
...
Select Temperature in April for years 2N+3 to3N+1
(e.g., 1993-2001)

ESSE “time series” data model
Indexed lat-lon grids of time series in BLOBs

What is fuzzy logic?
• Fuzzy logic uses set membership values between and including 0 and 1, allowing for partial membership in a set.
• Fuzzy logic is convenient for representing human linguistic terms and imprecise concepts (“slightly”, “quite”, “very”).
Fuzzy membership functions

What good is fuzzy logic for ESSE?
• Fuzzy engine allows to build queries in human linguistic terms:
(VERY LARGE “wind speed") AND
(AVERAGE "surface temperature") AND
(“relative humidity“ ABOUT 60%)
• You can use the same terms for different value ranges:
AVERAGE TEMPERATURE for Africa is not the same as for Syberia.
• Results are given as a list of “most likely” events. Each event is assigned a value, representing its “likeliness”.

January Wind Speed Record
0
5
10
15
20
1/1/97 1/6/97 1/11/97 1/16/97 1/21/97 1/26/97 1/31/97
Date
Win
d S
pee
d (
kts)
January Temperature Record
0
5
10
15
20
25
30
1/1/97 1/6/97 1/11/97 1/16/97 1/21/97 1/26/97 1/31/97
Date
Tem
per
atu
re (
deg
C)
January Relative Humidity Record
0
20
40
60
80
100
1/1/97 1/6/97 1/11/97 1/16/97 1/21/97 1/26/97 1/31/97
Date
Rel
. Hu
mid
ity
(%)
“High” Wind
“Average”Temperature
“About” 60%Humidity

Prototype workflow and UI
• Prototype UI implemented as a web-application• Discover data sources by keyword-based metadata
search• Use predefined weather events (e.g. “ice storm”, “flood”)• Define the event as a combination of fuzzy conditions on
a set of environmental parameters (e.g. “high temperature and low relative humidity”)
• Review statistics for the detected events• Visualize the selected event as time series plots or
contour maps• Download the event data in self-describing format
(NetCDF or HDF) to the user’s workstation
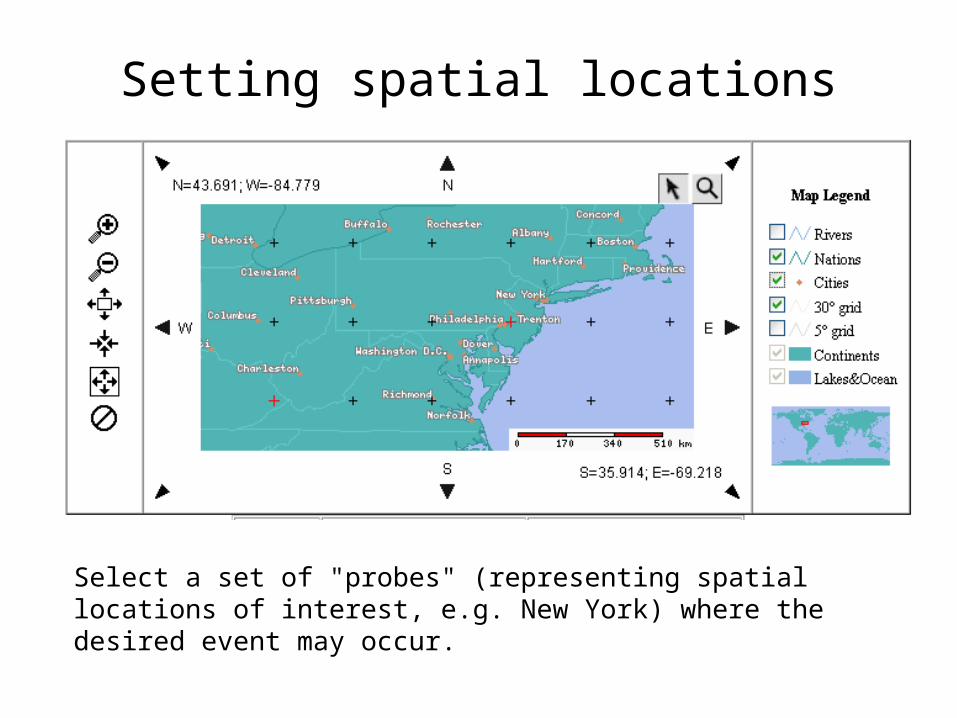
Setting spatial locations
Select a set of "probes" (representing spatial locations of interest, e.g. New York) where the desired event may occur.

Defining fuzzy search criteria
• Select several parameters for the event from a list.Set the fuzzy constraints on the parameters for the event (e.g. “very high temperature”, “very high humidity”).

Working with scenarios
The user may search for a desired scenario by describing several subsequent events

Search Results
• “Score” represents the “likeliness” of each event in a numerical form.
• The results page provides links to visualization and data export pages.

Visualizing event as time series

Visualizing event in 5D

Visualizing event from satellites

What do we get at the end?
• Using the “time machine”, we can see the weather on the D-day, or the Rita hurricane, or the typical September day in San Diego.
• Statistics to estimate risk from natural disasters, global climate change, realistic weather in movies, computer games, simulators
• When Tim Berners-Lee uses semantic web to find a photo of the Eiffel Tower on a sunny summer day, ESSE can provide a list of sunny days to be merged with the list of images named with “eiffel”