essbase vs. relational data: the pros and cons of …...this requires the extra step of conditional...
TRANSCRIPT

Essbase vs. Relational Data: the Pros and Cons of each
for BI Reporting in OAC Presented by: Greg Vlahos – Sierra-Cedar

Today’s Objective: Relational DB vs. Multidimensional DB
2
GoEssbase
GoRelational
What works best in OAC BI
?

Agenda● Brief Introductions
● Why consider Essbase as a source for OAC BI Dashboards
● Comparison of Relational and Essbase Reporting Capabilities
● Essbase Design Tips with OAC BI and DV in Mind
● Questions & Answers
3
Live demonstrations throughout the presentation

OAC EssbaseOracle Analytics Cloud
Essbase Cloud
OAC DVOracle Analytics Cloud
Data Visualizations from the Cloud to the Desktop to the Enterprise
PBCS and EPBCSPlanning & Budgeting Cloud Services
Presenter: Greg Vlahos – General Manager BI-EPM Practice• Designing and Building Essbase solutions since version 1.02 (1994)• Implementing Oracle BI solutions since 2007• Specialty of Integrating and Federating Essbase data in Oracle BI• Passions outside of work include Tennis and playing a Trumpet
OAC BIOracle Analytics Cloud
Business Intelligence CloudDay by Day Mobile Analytics
Sierra-Cedar – BI, EPM and ERP for the CloudExploring and
Delivering Oracle Cloud
ServicesProduct ExpertiseOracle Business Intelligence
(Hyperion, OBIEE, OBIA)Oracle Fusion CloudPeopleSoft Enterprise
Oracle E-Business Suite
FCCSFinancial Close & Consolidation
Cloud Services
EPRCSEnterprise Reporting Cloud Services
PCMCSProfitability & Cost Management
Cloud Services
4

Why Consider OAC BI as a Frontend for Essbase

Why Consider OAC BI as a Frontend for Essbase● Strategically, it provides one reporting and dashboard solution for end users.● It adds graphical charts and mobile access to your Essbase/EPM solutions.● It can integrate EPM and Relational data in a seamless fashion for transaction
drilldown.– Same ad hoc capabilities exist regardless of source: drilldown, formatting, sorting, filtering, traffic
lights, setting alerts, etc.– Power users can create drill thru reports; not limited to predefined “SQL” reports.
● It handles aspects of Essbase reporting that other BI tools typically can not:– New Essbase members will immediately work in existing reports and prompts.– Essbase “ragged” hierarchies and alternate hierarchies capabilities.– Essbase members from different levels of a dimension hierarchy can be stacked in the same
column, with Smart View like drilldown (e.g., P&L Statement).– Reporting and drilldown are allowed over both Essbase Members and Aliases.– Asymmetrical reporting is supported (i.e., unbalanced stacked column headers).
6
When should you use Essbase as a Source vs Relational Data?
How do these compare?

OAC BI Relational vs. Essbase Comparison Chart
8
Comparison Features Relational Essbase Detail DescriptionTime Series Metrics Handles YTD and year-over-year reporting
Variance Metrics Implements variance calculations, such as YoY%
Asymmetrical Columns Implements unbalanced stacked column headers, like EssbaseUsers in Smart View
Alternate Hierarchies Implements alternate rollups, including partial subset rollups
Large Number of Attributes Reports with a large variety of attributes, such as demographic data
Column Names Able to provide meaningful names to all columns
Metric Formatting Easy setup of metric report formatting
Transaction Drill-Through Implements drill-through reporting from a summary level subject area to transaction level
Writeback Capabilities Captures writeback data, such as budget or target numbers
Data Visualization Source Easy source in Data Visualization

Relational Essbase
Handling Time Series and Variance

Handling Time Series and Variance – Relational
● All calculated metrics are typically modeled in the RPD “Fact Table.”● This example shows that it requires 7 RPD Calculated Metrics to support year-
over-year YTD variance for the single loaded Metric of Sales.● So if a model holds 6 metrics (e.g., Sales, COGS, Discount, Royalty, Gross
Margin, Units), we need to create 42 calculated metrics to support YoY Variance % (for Month and YTD).
10
METRIC FORMULASalesPY Sales AGO("Beverage Sales"."Sales Facts".Sales, "Beverage Sales"."Date Dim"."Year", 1)PY Sales Var "Beverage Sales"."Sales Facts".Sales - "Beverage Sales"."Sales Facts"."PY Sales"PY Sales Var % ("Beverage Sales"."Sales Facts".Sales - "Beverage Sales"."Sales Facts"."PY Sales") / "Beverage Sales"."Sales Facts"."PY Sales" * 100.00
YTD Sales TODATE("Beverage Sales"."Sales Facts".Sales, "Beverage Sales"."Date Dim"."Year")PY YTD Sales AGO("Beverage Sales"."Sales Facts"."YTD Sales", "Beverage Sales"."Date Dim"."Year", 1)PY YTD Sales Var "Beverage Sales"."Sales Facts"."YTD Sales" - "Beverage Sales"."Sales Facts"."PY YTD Sales"PY YTD Sales Var % ("Beverage Sales"."Sales Facts"."YTD Sales" - "Beverage Sales"."Sales Facts"."PY YTD Sales") / "Beverage Sales"."Sales Facts"."PY YTD Sales" * 100.00

Handling Time Series and Variance – Relational● For reports, simply select the desired Fact Table metrics● Fact Table holds a list of the 49 metrics in this example to handle YTD
11

Handling Time Series and Variance – Essbase● Essbase allows calculated metrics in every dimension.● Below example shows how 3 calculations match the 42 Relational calcs.
12
FormulaYear
20172016PY Var ([Year].CurrentMember, [Actual]) - ([Year].CurrentMember.NextMember, [Actual])PY Var% ((([Year].CurrentMember, [Actual]) - ([Year].CurrentMember.NextMember, [Actual])) / ([Year].CurrentMember.NextMember, [Actual])) * 100
FormulaPOV
Periodic (+)QTD (~) SUM(PeriodsToDate([Time].Generations(3), [Time].CurrentMember), [Time Pov].[Periodic]) YTD (~) SUM(PeriodsToDate([Time].Generations(2), [Time].CurrentMember), [Time Pov].[Periodic])
FormulaMeasures
Gross Margin (+)Sales (+)COGS (-)Discount (-)Royalty (-)
Units (~)
Member
Member
Member
Adding QTD Calc makes these 4 calculations
match 84 RelationalRPD Calculations; plus these work forall stored Measures

Handling Time Series and Variance – Essbase● Essbase reports require column stacking across multiple dimensions.
13

Relational Essbase
Handling Asymmetrical Column Headings

Essbase Users are used to Asymmetrical Columns● In Smart View, Users can stack column Headers to retrieve combinations● Note how 2016 Actuals are listed in the middle of 2017 columns
15
September Periodic Thousands 01000_Company A1
2017 2016 2017 2017 2017Actual Actual Year Var % Budget Budget Var %
Net Sales. 50,644.07 43,037.02 17.7% 55,264.73 -8.4%Materials. 16,485.15 12,169.20 -35.5% 17,710.34 6.9%Direct labor. 2,608.50 2,869.35 9.1% 2,782.51 6.3%Overhead. 2,639.99 2,176.68 -21.3% 3,923.06 32.7%Trucking Expenses. 872.03 704.17 -23.8% 1,005.20 13.2%Total Cost of Goods Sold. 22,605.68 17,919.39 -26.2% 25,421.10 11.1%Gross Margin. 28,038.39 25,117.63 11.6% 29,843.63 -6.0%Selling. 2,931.81 2,440.46 -20.1% 3,096.76 5.3%General and Administrative. 728.76 596.22 -22.2% (339.29) 314.8%Total Selling, General and Admin.. 2,203.05 1,844.24 -19.5% 3,436.05 35.9%Operating Income. 25,835.34 23,273.39 11.0% 26,407.57 -2.2%

The Essbase Stacked Column Header Challenge● This is a non-issue with a Relational data source, as all calculated metrics are
in the “Fact table,” so the User can simply pick desired metrics.● However, Essbase sourced OAC BI includes all Value combinations.
16

The Answer Requires Filtered Report Calculations● This report has hidden all of the Essbase sourced metrics and created calculated
metrics in the report that combine Year and Scenario:– Actual 2017 = FILTER("Measures"."Actual" USING "Year"."Year Values" = '2017')
17

Relational Essbase
Alternate Hierarchies

Handling Alternate Hierarchies – Relational Data● Relational data supports full alternate hierarchies, where every row in
the dimension rolls into every hierarchy.
● All hierarchies are modeled in the same RPD dimension.
● Multiple columns can be associated with a level to support both codes and descriptions for drilldown.
● This example shows State rolling up by Population and Region.
● Alternate hierarchies share the bottom level (State).
19

Handling Alternate Hierarchies – Essbase● Essbase also handles full alternate hierarchies:
– The RPD developer must choose if the alternate hierarchies should be modeled as separate dimensions or combined.
– When combined, the levels can not be individually named.– When separated, columns from different alternate hierarchies can
not be used in the same report.● Only Essbase handles partial alternate hierarchies:
– Finance users of Essbase often like to use partial alternate hierarchies as a way to create special account groupings.
– This is not an option for Relational data modeling.– However, if reports require a combination of members from
multiple hierarchies (e.g., both accounts and calculated metrics from an alt hierarchy), then generic column names are required.
20

Large Number of AttributesRelational Essbase

Working with Large Numbers of Attributes● An attribute is a dimensional column that
supports report aggregation and filtering.● In Essbase, beyond hierarchies and alternate
hierarchies, the only way to include additional attributes is to add attribute dimensions for each one.
● This shows up as many different dimensions in BI and can impact speed.
● With a Relational source, these will simply be additional columns in a dimension.
● This is handled much better with Relational.
22

Column NamesRelational Essbase

Essbase Column Names Require Cleanup● Relational columns can simply be renamed with user friendly names.● Essbase columns require an additional level of cleanup.
– Many Essbase developers do not know they can name generations in Essbase.– An Essbase generation is imported with multiple columns and generic names.– The RPD developer must eliminate and cleanup column names.– When there are ragged hierarchies or alternate hierarchies, it can be clunky.– All these “Year” columns get cleaned up into a single column in the RPD.
24

Relational Essbase
Metric Formatting

● Relational is simple: all metrics are in the Fact table and can be formatted.● Essbase can have calculations in any “dimension,” but only one dimension can
be identified as the “Fact table” in the RPD..● This requires the extra step of conditional formatting; examples shown here
where percent calculations exist in two dimensions.
– Profit % has simplecolumn data formatting
– PY Var% requires special Conditional formatting
Metric Formatting
26

Transaction Drill-ThroughRelational Essbase

Transaction Drill-Through● For Relational reporting, drilling from summary reports to transaction
level detail is considering routine data warehouse star schema design and is simple to implement in OAC BI with federation or linked navigation.
● Essbase is a great summary database, typically at the month level.
● Using OAC BI to implement Essbase drill-through is a great use case,but it requires planning and typically a transaction data mart to work.
– The transaction Relational data must be modeled in the RPD.– The dimensions and column values must exactly match Essbase.– Using linked navigation to drilldown is a little easier to work with.– Full federation requires detail transaction modeling to align with Essbase,
but can be successfully implemented.
28

Linked Navigation from Essbase to OBIA GL Trans● Linked navigation is implemented
at the report level, and passes parameters from one report to another, with each over a different source.
– Synchronization is only required for parameter columns.
– The example allows the user to drill from Essbase SG&A Expense to the supporting Relational GL detail.
– This example goes from Planning to OBIA GL Detail report.
29

Writeback CapabilitiesRelational Essbase

Oracle Analytics Cloud Writeback Capabilities● While Oracle BI has always had a very basic writeback capability that
required technical SQL skills, it is a reporting and analytical tool.● If a solution requires writeback, such as a basic Budget or Target/Goal
entry system, then OAC Essbase with Excel Smart View is an ideal solution.– Assuming User has security, they
can simply type in the desired SG&A budget numbers in this example by month and selected Company.
– Then click Submit Data.– Data is now stored and
aggregated across the model.
31

Data Visualization SourceRelational Essbase

Data Visualization over OAC BI vs. OAC Essbase● Data Visualization is a powerful tool directly over Relational data; even
better over an OAC BI model’s optimal joins, good naming standards, and prebuilt calculated metrics such as Time Series.
● Data Visualization over OAC Essbase certainly works, but with limits:– It does not work with Essbase Aliases.– It can not show a level 0 “column” in a ragged hierarchy
(e.g., JE level Account column in most GL solutions).– It does not support hierarchy columns:
meaning a User can not expand/close levels of a hierarchy within a column.
– This OAC BI report example shows a P&L report using a hierarchy column, which can’t be done directly in DV.
● However, putting OAC BI over Essbase, or designing Essbase with DV in mind, can minimize these DV issues for Essbase.
33

Data Visualization Over OAC Essbase● These screenshots are from DV over OAC Essbase.● In the P&L report on the left, the User can drill down on any Actual value (either
Periodic or YTD) to view the GL JE level Account detail.● The next section describes Essbase design tips to enable this in DV.
34

Essbase Design Tips with OAC BI and Data Visualization in Mind

OAC Essbase Design Tips for Direct DV Access● There are some challenges with Data Visualization reporting directly over
an Essbase database.● These can be avoided if your organization also owns OAC BI OCPUs
that enable you to use the RPD model to eliminate these issues.● But if you only own OAC Essbase and Data Visualization, this section will identify
the issues along with some work-around recommendations that can be modeled into the Essbase database with DV in mind.
– Issue: DV currently can’t use Essbase aliases.– Issue: DV can’t present a level 0 “column” in a ragged hierarchy (e.g., Account).– Issue: DV does not support a hierarchy column to combine members from different
generations of an Essbase hierarchy (e.g., needed for P&L report).– Issue: DV does not provide the ability to rename Essbase generations.– Issue: DV automatically uses the Essbase “Account” dimension as a flat measure list.
36

OAC Essbase Design Tip – DV Alias Issue● Issue: Data Visualization can not use Essbase Aliases.● Resolution: Defy the Essbase best practice of using the “code” for member
names and the “Description” for Alias, and combine the two for the member name.
– This example shows the member name with account number and Alias combines.
– Challenge is that Account descriptionchanges can break areport with specificaccount selections.
37

OAC Essbase Design Tip – Level 0 Issue ● Issue: Data Visualization can not show Essbase level 0 column for a ragged
hierarchy, such as most Account dimensions.● Resolution: create an alternate Account hierarchy
called Account List, and have the children be a flat list of shared member accounts.
– This example shows a Generation 2 parent called“List of Accounts”, and it’s children are a flat list of all level 0 Accounts in this Essbase database.
– We have also had clients who use Sub-Accounts: for these clients, we use the sub-account as the lowest level and Account as the middle level; this provides both an Account and Sub-Account DV column.
38
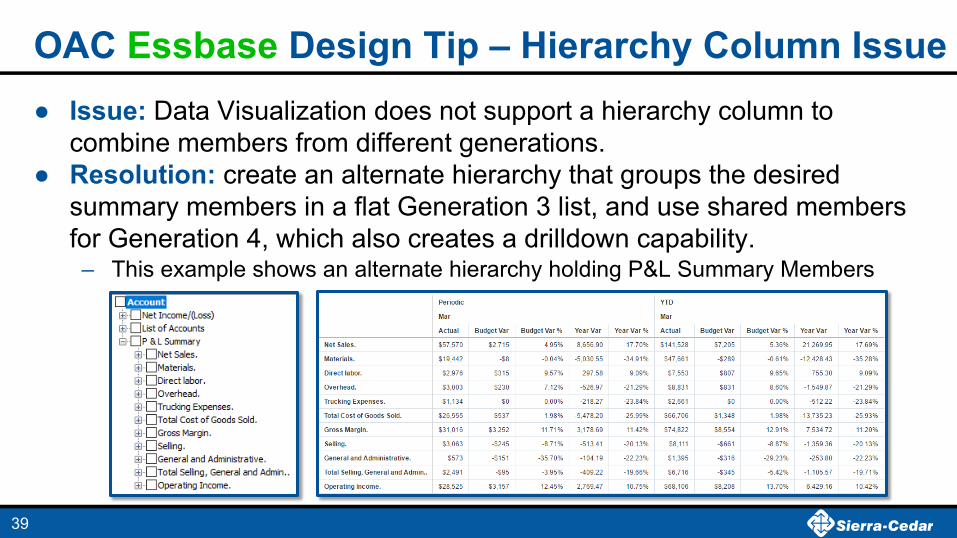
OAC Essbase Design Tip – Hierarchy Column Issue ● Issue: Data Visualization does not support a hierarchy column to
combine members from different generations.● Resolution: create an alternate hierarchy that groups the desired
summary members in a flat Generation 3 list, and use shared members for Generation 4, which also creates a drilldown capability.– This example shows an alternate hierarchy holding P&L Summary Members
39

OAC Essbase Design Tip – Generation Names● Issue: Data Visualization does not provide the ability to rename
default Essbase generation “column” names.● Resolution: Essbase generations need to be named directly on
the Essbase model.– It is an easy process to provide a user-friendly name to Essbase
dimension generations, but many Essbase developers do not know this.
– If the Essbase developer does not give these meaningful names, then the default generation names of Gen1, Account; Gen 2, Account; etc. will be used.
40

OAC Essbase Design Tip – Account Dimension● Issue: Data Visualization automatically converts the Essbase
“Account” tagged dimension into a flat “fact table”; this means that if a database has the GL Account dimension tagged as accounts, then DV will create a massive flat list of accounts with no hierarchy.
● Resolution: Create an Essbase database version where a dimension such as Scenarios is tagged as “Accounts”.
– This can mean creating a second version of an Essbase database just to support Data Visualization use. (We anticipate future options to better handle this like we can in OAC BI). Note: ASO is more flexible here.
– The example on the right is over an Essbase database where Scenario has been tagged as Accounts, and the Account dimension has its hierarchy.
41

