essays on leisure of the thai people - microsoft …libdcms.nida.ac.th/thesis6/2010/b169348.pdf ·...
TRANSCRIPT

ESSAYS ON LEISURE OF THE THAI PEOPLE
Siriwan Saksiriruthai
A Dissertation Submitted in Partial
Fulfillment of the Requirements for the Degree of
Doctor of Philosophy (Economics)
School of Development Economics
National Institute of Development Administration
2010


ABSTRACT
Title of Dissertation Essays on Leisure of the Thai People
Author Miss Siriwan Saksiriruthai
Degree Doctor of Philosophy (Economics)
Year 2010
This is a collection of essays on the leisure of the Thai people. The first essay,
The Impact of Extra Income on Leisure: A Theoretical Foundation, develops the
conceptual framework for exploring the individual’s leisure time allocation when his or
her wages change. In the study, an individual’s income, as a part of budget constraints, is
separated into two types, permanent and extra income. Permanent income is given for a
fixed work time (for instance, a fixed monthly salary), while the extra income (for
instance, overtime and bonus) depends on the length of work time. A model of time
allocation is then analyzed for optimal leisure and consumption. Additionally, the paper
proceeds to analyze the factors influencing the substitution effect, the income effect, and
the total effect of leisure time allocation given a change in extra wages, as well as
explores how people, with a variety of leisure/consumption preference respond
dissimilarly to leisure time allocation. The results suggest that the magnitudes of those
effects rely on the importance of leisure in an individual’s utility. In total, leisure time
can either rise or fall in response to extra wage increase, depending on the individual’s
utility function. A leisure lover is likely to allocate more time for leisure when an extra
wage is reduced than will a consumption lover. The higher the degree of substitutability
between leisure and consumption, the greater the magnitude of changes in an extra wage
will be on leisure time use.
Essay two, Is Leisure A Normal Good for the Thai People?, aims to explore,
empirically, Thai people’s behavior regarding time use by employing Time Use Survey
and Labor Force Survey to find the determinants of leisure time allocation, as well as the
relationship between leisure time use and the individual’s income. Leisure is divided into

iv
four different measures, from the narrowest to the broadest. Narrowly defined as time
spent for direct enjoyment, leisure is distinctively consumed by university graduates more
than by lower-educated people by more than 10%, whereas single spend more leisure
time than those of other statuses. However, how educational level and marital status
affect leisure time use becomes unclear when leisure is more broadly defined as the
residual of work. Thai people in the agricultural sector engage in more leisure time than
others. During a week, Thai people enjoy leisure time the most on Sunday, while
allocating the least leisure time to Monday. In addition, this study reveals the existence of
a gender gap, where males have priority in terms of work choice. This means that males
can choose to work in the market only while females are more likely to be responsible for
non-market work, for example, housework and home production than males. Female
wage workers take substantially less time for leisure, but a longer time for housework.
The estimation of leisure time allocation in response to wage change among the Thais
significantly indicates that people allocate more time for leisure in response to an
increase in their hourly wage. This finding signifies that leisure is a normal good for the
Thai people.
In order to examine whether leisure, which is usually considered unproductive in
relation to economic growth, positively impacts an individual’s wage in the labor market,
Essay 3, Does Leisure Contribute to Wage Improvement of the Thai People?, aims to
explore whether leisure activities can be correlated with wage improvement. The study
categorizes leisure into seven types which theoretically provide a positive impact on
wage change: computer use, media use, recreation, sport and exercise, sleeping and
personal care, social participation and volunteer activities, and finally, learning during
leisure time. The findings indicate that media use and recreation evidently contribute to
the wage increase, while leisure time use for social participation and volunteer activities
is negatively related to wage change. However, the study does not offer conclusions
regarding how leisure activities such as computer use, sleep and personal care, as well as
sport and exercise, influence wage change. The study extends the ideas in essay two by
further examining how leisure time is affected by an individual’s wage and income. The
results indicate a positive relationship between leisure time and wage, confirming that
leisure is a normal good for the Thai people.

ACKNOWLEDGEMENTS
This dissertation would not have been possible without the guidance and help of
several people who in one way or another contributed and extended their valuable
assistance in the completion of this study.
Foremost, I would like to express my warm and sincere gratitude to my adviser,
Associate Professor Dr. Piriya Pholpirul for his detailed and constructive comments, and
for his patience and important support throughout this work. I am deeply grateful to my
committees, Associate Professor Dr. Pungpond Rukumnuaykit, who not only gave me
insightful comments and suggestions, but also inspired me to do this research, and
Assistant Professor Dr. Amornrat Apinunmahakul, and also my committee chairperson,
Dr. Watcharas Leelawath, for their valuable comments and suggestions.
It is a pleasure to extend my thanks also to the National Institute of Development
Administration (NIDA) for their financial support, the National Statistical Office (NSO)
for the supporting data, Dr. Bruce Leeds for revising the English of my manuscript and
Ms. Pawana Kemaratana, the librarian at the Library and Information Center, NIDA, for
the formal editing.
This dissertation is dedicated to the memory of my father, who always inspired
and encouraged me to learn. I am indebted to my family, especially my mother and my
brother, for always giving loving and supporting me spiritually throughout my life. My
special gratitude is due to my friend, Piyachon Sangklinhom, for his friendly help with
mathematics and computer software use issues. Finally, I also wish to thank Piggy, Nu
Dam, Jacky, Heart, Pooklook, Tampoo, I-tim and Gluayhom for making me smile even in
difficult moments.
Siriwan Saksiriruthai
March 2011

TABLE OF CONTENTS
Page
ABSTRACT iii
ACKNOWLEDGEMENTS v
TABLE OF CONTENTS vi
LIST OF TABLES viii
LIST OF FIGURES ix
EXECUTIVE SUMMARY 1
Essay 1 Impact of Extra Income on Leisure: A Theoretical Foundation 1
Essay 2 Is Leisure a Normal Goods for the Thai People? 2
Essay 3 Does Leisure Contribute to an Increase in the Wages of 3
the Thai People?
Policy Implication 4
Further Studies and Future Research 5
Bibliography 6
ESSAY 1 IMPACT OF EXTRA INCOME ON LEISURE: 7
A THEORETICAL FOUNDATION
1.1 Abstract 7
1.2 Introduction 8
1.3 Theoretical Framework 11
1.4 Optimal Leisure and Consumption 12
1.5 Impact of an Extra Wage Change on Leisure Time 16
1.6 Conclusion 26
1.7 Bibliography 27
ESSAY 2 IS LEISURE A NORMAL GOODS FOR THE 30
THAI PEOPLE?
2.1 Abstract 30
2.2 Introduction 31

vii
2.3 Leisure: Definition and Measures 34
2.4 Model Specification 38
2.5 Model Estimation 54
2.6 Empirical Analysis 56
2.7 Conclusion 68
2.8 Bibliography 69
ESSAY 3 DOES LEISURE CONTRIBUTE TO AN INCREASE 72
IN THE WAGES OF THE THAI PEOPLE?
3.1 Abstract 72
3.2 Introduction 73
3.3 Impact of Leisure on Wage 74
3.4 Leisure Activities and Model Specification 80
3.5 Does Leisure Contribute to an Increase in the Wages 100
of the Thai People?
3.6 Is Leisure a Normal Good for the Thai People? 123
—A Reinvestigation
3.7 Conclusion and Policy Implications 133
3.8 Bibliography 134
BIOGRAPHY 139
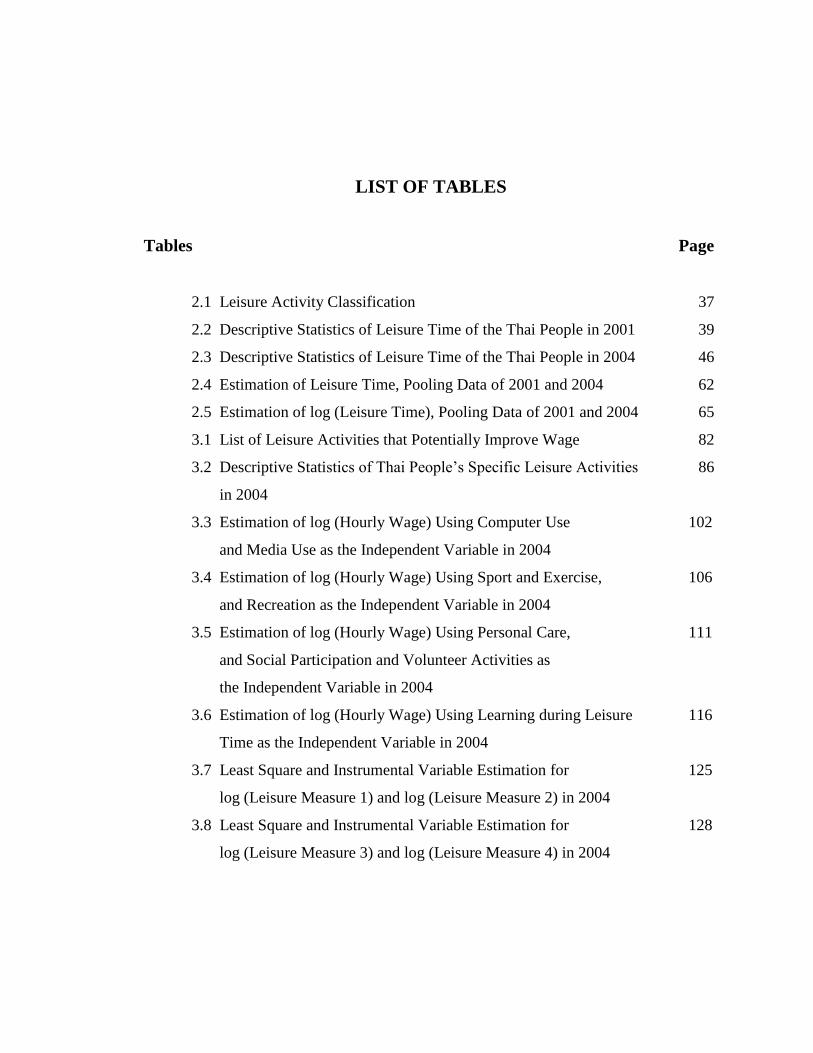
LIST OF TABLES
Tables Page
2.1 Leisure Activity Classification 37
2.2 Descriptive Statistics of Leisure Time of the Thai People in 2001 39
2.3 Descriptive Statistics of Leisure Time of the Thai People in 2004 46
2.4 Estimation of Leisure Time, Pooling Data of 2001 and 2004 62
2.5 Estimation of log (Leisure Time), Pooling Data of 2001 and 2004 65
3.1 List of Leisure Activities that Potentially Improve Wage 82
3.2 Descriptive Statistics of Thai People’s Specific Leisure Activities 86
in 2004
3.3 Estimation of log (Hourly Wage) Using Computer Use 102
and Media Use as the Independent Variable in 2004
3.4 Estimation of log (Hourly Wage) Using Sport and Exercise, 106
and Recreation as the Independent Variable in 2004
3.5 Estimation of log (Hourly Wage) Using Personal Care, 111
and Social Participation and Volunteer Activities as
the Independent Variable in 2004
3.6 Estimation of log (Hourly Wage) Using Learning during Leisure 116
Time as the Independent Variable in 2004
3.7 Least Square and Instrumental Variable Estimation for 125
log (Leisure Measure 1) and log (Leisure Measure 2) in 2004
3.8 Least Square and Instrumental Variable Estimation for 128
log (Leisure Measure 3) and log (Leisure Measure 4) in 2004

LIST OF FIGURES
Figures Page
1.1 Conceptual Framework for Essay 1 11
1.2 Substitution, Income, and Total Effect for an Increase 20
in an Extra Wage
1.3 Total Effect of Change in Leisure Given an Extra Wage 21
Change in Various Leisure/Consumption Preferences
3.1 Conceptual Framework for Essay 3 75
3.2 Percentage of Time for Leisure Activities of the Thai People 84

EXECUTIVE SUMMARY
Among the activities in an individual’s time use, leisure is an indispensable
element in time allocation. Nevertheless, from the past, leisure was simply categorized as
a kind of non-work activity, even if it is true that leisure is significantly different from
other activities, for instance, housework and home production. For years, people have
tended to focus more on work hours than on leisure, even though leisure psychologically
plays a critical role in human life. Numerous concepts of leisure have been developed1.
This collection of essays emphasizes an individual’s leisure time allocation. The
empirical research further explores this issue regarding the Thai people as to whether
leisure is a normal good as well as whether leisure contributes to wage improvement.
Essay 1 Impact of Extra Income on Leisure: A Theoretical Foundation
An individual’s time use is usually focused on market activities, as it creates
monetary valuation, which directly boosts economic growth. However, besides market
activities, each person gains utility from non-market activities and time use. While the
consumption of goods and service increase has to be obtained by exchanging goods and
services with money or other market benefits, which can usually be obtained from
working in the market, leisure is an activity only driven by time for enjoyment and
increases utility. Considered unnecessary for generating economic growth, leisure is an
activity that raises an individual’s utility and welfare, which mainly require time for
achieving utility maximization. This paper emphasizes the individual’s time use for
leisure under the condition that time allocation is divided into leisure for utility
maximization and work for receiving income for consumption. Wages can be divided
1 For example, Jeffery Gobbi defined leisure as a life which is released from the outer pressure of
civilization and substance environment, which can be, for example, routine work, and is relatively free,
whereas De Grazia pointed out that leisure is a quality of feeling. Explanations of leisure in Chinese and
English languages concluded that leisure means living a life of ease.

2
into two types, permanent and extra wages. A permanent wage is a certain amount of
earning in a range of time, for instance, a monthly salary. An extra wage is the earning
directly related to the length of work time, for example, overtime. Based on the
microeconomic theory of time allocation, a model for the optimization of leisure and
consumption under the assumption of these two types of an individual’s wage, permanent
and extra wage, is developed for this study As a permanent job limits work time to only a
fixed number of hours, a rise in wage does not alter time for work and hence leaves
leisure time unchanged. The objectives of this study include finding how each person
adjusts his or her leisure time in response to a change in extra wage. Also, the research
divides people into consumption lovers and leisure lovers. Whether extra income
enhances or deteriorates leisure time depends on the individual’s preference. A leisure
lover is relatively more responsive regarding leisure time consumption when there is a
change in extra wages than a consumption lover. The degree of substitutability between
leisure and consumption plays a key role in strengthening the negative response of leisure
time as an extra wage changes.
Essay 2 Is Leisure a Normal Good for the Thai People?
Traditional economic theory generally promotes increasing income for the
maximization of an individual’s utility, as well as macroeconomic growth and welfare,
while leisure is not a topic of interest to economists, as it does not enhance income or
increase economic growth. The paper focuses on the definition of leisure time according
to various measures2, from the narrowest, time consuming activities in the pursuit of
direct enjoyment, to the broadest, the residual of work and how leisure plays a critical
role in raising an individual’s utility, leading to a rise in happiness and welfare. Using
Time Use Survey and Labor Force Survey data, this study emphasizes how Thai people
allocate their leisure time in response to their wage, the opportunity cost of leisure, rise
and fall. This study, using a variety of definitions of leisure, yields the finding that people
2 Based on Aguiar, Mark and Hurst, Erik. 2007. Measuring Trends in Leisure: The Allocation of Time
over Five Decades. Quarterly Journal of Economics. 122 (2): 969-1006.

3
increase their leisure time in response to hourly wage increases, indicating that leisure is
a normal good for Thai people. Moreover, the result also reveals the significance of a
gender gap between males and females, implying that there exists a social structure
whereby men have the opportunity to choose to work in the market while females, even
while working in the market, are responsible, to devote time for housework and home
production. Therefore, females obviously consume a substantially less leisure time3.
Essay 3 Does Leisure Contribute to an Increase in the Wages of the Thai
People?
Each person spends hours per day for leisure as the residual of work4 in a variety
of activities. This study aims to explore whether these leisure activities contribute to an
increase in wage. These activities include computer use, media use, personal care,
recreation, sport and exercise, social participation and volunteering activities, and
learning. Computer use leisure includes computer use activities for non-work purposes as
well as Internet use, whereas media use activities include reading, watching TV, VDO,
DVD and VCDs, listening to the radio and music, and library visiting. Those activities
improve wages by boosting computer skills, and knowledge and psychological benefits.
Sleeping, eating, and self-caring are on the list of personal care activities that fulfill
physical needs as well as improve physical and mental health. Recreation includes
activities such as playing games, sightseeing, and cultural site visits which not only
improve knowledge but also yield happiness from the recreational time spent. All kinds
of sport activities and exercise, both indoor and outdoor, listed in the group of sport and
exercise clearly benefit physical one’s condition and health, including mental condition.
Social participation and volunteering increase interpersonal relationships and social
connections. Learning in one’s free time for skill and career development raises the
usefulness of time use, which could improve knowledge and skills. Using the Time Use
3 This corresponds to Beblo, Miriam and Robledo, Julio R. 2008. The Wage Gap and the Leisure Gap for
Double Earner Couples. Journal of Population Economics. 21: 281-304.
4 Market work, housework and home production

4
Survey and Labor Force Survey, a number of activities were found to significantly
influence an individual’s wage change. Leisure time for media use and recreation were
positively correlated with wage rise or fall, while time for social participation and
volunteering were negatively correlated with wage change. Whether leisure activities
such as learning, computer use, and personal care contribute to Thai people’s wage rise or
fall could not be concluded according to this study. Since wage is found to be
endogenous to leisure, this essay further re-investigates how wage influences leisure time
use. The results confirm that leisure is a normal good for the Thai people.
Policy Implications
Studies of leisure disclose information on the individual’s time allocation
behavior as well as the factors influencing the individual’s leisure time. Moreover, the
finding whether some specific leisure activities improve one’s wages provides a valuable
link of leisure time use to the labor market, which reveals that the benefit of leisure is not
only utility increase. Leisure time spending can increase an individual’s wage and
welfare growth simultaneously.
As each person responds dissimilarly to a change in extra wages, findings on how
these wages influence leisure time would be helpful to the leisure industry. These
findings imply that for wage workers, the greater extra wage that each worker receives
could increase leisure time use. Additionally, the higher preferences for leisure, the
greater the leisure time he or she is likely to engage in. A person with high unearned
income, for example rents and financial interests, tends to consume greater leisure given
the equal change in extra wages. This illustrates the relationship of time allocation to
leisure, as it implies that stimulation of an individual’s preferences regarding leisure
activities by applying market and business strategies enhances the individual’s demand
for leisure. Promoting the leisure of people with higher unearned income, for instance,
the retired and landlords, tends to create more leisure time than with individuals at other
statuses.

5
The results from exploring the factors influencing leisure time indicate how
people of different socio-demographic characteristics re-allocate leisure time in response
to wage changes. Information on when during each week a person devotes time to leisure
reveals that Sunday, the day when people spend relatively longer on leisure time, is a
good choice for businesses to offer leisure activities and related products. The finding
that singles take the longest leisure time compared with those of other status implies that
leisure products segmented for singles are likely to generate more growth because of the
higher tendency of leisure consumption of these individuals.
The government could promote some specific leisure activities in order to
improve an individual’s productivity and wage, which would also yield a welfare
increase. In terms of mental improvement, promoting time allocation for recreational
activities, for example developing more recreational parks and promoting recreational
activities in communities, would not only bring about an individual’s happiness from
leisure, but also would increase labor productivity, which would increase one’s wages as
a consequence. The government’s support of media use, especially for people in rural
areas that are provided a substantially lower chance of media access, increases the chance
of enjoying this activity group. This support is highly advantageous because media use
contributes to the development of knowledge and productivity. This finding could also be
used to obtain information for promoting related leisure products.
Further Studies and Future Research
This dissertation on the leisure of the Thai people provides a conceptual
framework for the analysis of time use for utility maximization under the situation of
both time and income constraints. The distinction of the study is that it divides wages into
permanent and extra wages. Then, empirical investigation explores whether leisure is a
normal good and further determines whether leisure activities, of various types, improve
wages. The research reveals information on Thai people’s behavior of leisure and time
use, and the factors influencing leisure time, especially among the Thai people.

6
Focusing on Thai people’s leisure time by employing the Time Use Survey and
Labor Force Survey, this study still has the problem of limitations in data. It is not
certainly indicated whether the wages presented in the Labor Force Survey, especially for
wage workers, are permanent or extra wages, leaving the types of wages individuals earn
inconclusive. Therefore, types of income should be more clearly defined in the data in
order to make the empirical study of the impact of permanent and extra income on leisure
time possible. As labor productivity plays a key role in an individual’s wage, there should
be additional variables for studying how leisure affects labor productivity, which
influences wages and welfare as a consequence.
Bibliography
Aguiar, Mark and Hurst, Erik. 2007. Measuring Trends in Leisure: The Allocation of
Time over Five Decades. Quarterly Journal of Economics. 122 (2): 969-
1006.
Beblo, Miriam and Robledo, Julio R. 2008. The Wage Gap and the Leisure Gap for
Double Earner Couples. Journal of Population Economics. 21: 281-304.
Becker, Gary S. 1965. A Theory of the Allocation of Time. The Economic Journal.
75: 493-517.
Min, Jie and Jin, Houzhong. 2010. Analysis on Essence, Types and Characteristics of
Leisure Sports. Modern Applied Science. 4 (7): 99-103.

ESSAY 1
IMPACT OF EXTRA INCOME ON LEISURE:
A THEORETICAL FOUNDATION
1.1 Abstract
Leisure is an indispensable element in an individual’s time allocation, influencing
utility maximization under budget constraints. This paper develops a conceptual
framework to study leisure behavior change given an extra income change. An
individual’s wage, as a part of budget constraint, is separated into two types, permanent
wage (for example, fixed monthly salary) and extra wage (for example, overtime and
bonus). Then the model of time allocation is analyzed in order to find the optimal leisure
and consumption as well as the factors impacting leisure. Moreover, the paper proceeds
to analyze the substitution effect, income effect, and total effect. The finding suggests
that leisure time can either rise or fall given an extra wage increase, for example,
overtime wage rate change, impacting a positive change on leisure price possibly causing
either a positive or negative change in leisure time. The leisure lover is more willing to
allocate more time for leisure when extra wages are reduced compared with the
consumption lover. The degree of substitutability between leisure and consumption
strengthens the negative response of leisure time as an extra wage changes.
Keywords: Leisure, Extra income, Extra wage
8
1.2 Introduction
Leisure is a type of activities that increases and is relevant to an individual’s time
allocation, as presented in economic theory, which states that an individual’s utility is
optimized by maximizing leisure and consumption under wage and time constraints. Not
only has the correlation between consumption and wage been affirmed since wages are a
source of income for consumption, but economists have also found that leisure and wage
rates evolve along one’s life span (Becker, 1990 quoted in Albelo and Serrano, 1998: 9).
Empirical research provides information on the individual’s utility maximization
condition under different constraints, based on the issues studied (for example, Barnett
(1979: 544-536), Alderman and Sahn (1993: 875-883), and Kumar (2005: 4-22)). So far,
the income constraints studied in earlier works mostly related to current income, even in
reality, individuals could earn different types of income. Some people’s earning varies
according to the length of work time, called extra income, while some persons’ income is
fixed, called permanent income. Persons that earn different types of income possibly
choose leisure time differently in response to wage or income change. This paper fills the
research gap by exploring leisure time alteration when permanent and extra income
change.
As mentioned, there is still no research on the impact of wage change on leisure
time allocation in the situation where individuals earn both permanent and extra income.
Whether people who earn a higher proportion of permanent income spend significantly
more time on leisure or vice versa, compared with those earning extra income, has not
been explored. In this paper, an economic model is constructed by separating an
individual’s earned income into extra and permanent income. Since permanent income is
generally a fixed amount of money given in a certain range of time, while extra income
of each earner varies depending on the conditions, such as work time and job
characteristics, the work and leisure behaviors of those different types of earners are
possibly dependent of the type income. Hence, this paper explores the possible
relationship between leisure and permanent income as well as leisure and extra income.
The study further finds the determinants of leisure time in a theoretical framework as it
represents the factors influencing an individual’s decisions regarding leisure time
consumption.

9
There are two types of activities for which each person devotes time, economic
and non-economic. Leisure, included in the latter type, consists of the activities that are
carried out in different environments when time is elastic and there is no pressure of
competition or of earning profit condition. Because of the exclusion of leisure from
economic progress measures, it is not integrated as a part of GDP and GNP measures. As
leisure is an indispensable element in time allocation and according to the layman, it is
almost impossible for an individual to enjoy leisure through a surrogate (Gronau, 1976a:
6); the inclusion of leisure activities as one part of the economy does contribute to
obtaining a total measure of the ―welfare‖ of people in the economy. Greenberg (1997:
413) has proved the existence of bias in cost-benefit analysis, a crucial part of net social
benefits, when leisure cost was not included in the cost-benefit estimates. This implies
that leisure is an inevitable part of economic analysis.
One of the earliest empirical works on leisure and time allocation study was
Becker’s (1965: 493-517) theory of the allocation of time. The model assumes that utility
could be gained directly by combining time and market goods to produce consumption
goods under two constraints, time and income. Gronau (1986: 282-288) elaborated on
non-economic activities by separating leisure from work at home. For this, leisure plays a
critical role in determining labor supply and it is detailed that leisure activities could take
place elsewhere. Therefore, it is possible to enjoy leisure even during one’s work time, so
called ―on-the-job leisure.‖ Studies supporting the importance of leisure include Yamada,
Yamada, and Kang (1999: 41-42), who pointed out that for each person, economic
rationality is a critical factor in determining leisure time and time allocation for other
activities. The studies of leisure and time allocation indicate the existence of the
relationship of these factors. This reflects the use of time as a scarce resource for leisure
and other activities determining the relative prices of goods and services.
For years, empirical research has revealed the importance of leisure in economic
analysis and how leisure relates to wages and income. Focusing on the demand for
leisure, Owen (1971: 69) found that leisure time was associated with real hourly wages,
supporting the backward-bending supply curve of labor theory, and elaborated on leisure
by separating leisure from market recreation, i.e. travelling, indicating that leisure
includes activities that a person need not pay a direct cost for, i.e. napping and playing at
home, not necessarily outdoor activities. The way to define leisure is more realistic than
10
some other empirical studies, which merely describe leisure as the residual of total hours
of work (for instance, Fischer (2001: 249-269), Kumar (2005: 4-15) and Chen and
Chevalier (2007: 353-356)). Alderman and Sahn (1993: 875-883) further found that a
large share of transferred income would be allocated to leisure rather than other goods by
analyzing large own-price elasticity of leisure in a developing country. This implies that
if the price of leisure rises, leisure time falls at a higher proportion. This finding
contradicts that of Owen (1971: 65-66), which declared that the price of leisure, as
measured by wage, and income, provided slightly inverse changes to leisure. However,
how leisure time changes in response to the price of goods changes also depends on
which category of goods is used for estimation, as Barnett (1979: 544-536) argued that
the interactions between goods and leisure by separating goods into different categories,
i.e. durable and non-durable, suggested unequal complementarities between leisure and
those goods. Hence, optimization of leisure for utility maximization has to be explored
simultaneously with other activities by using the model of time allocation to find the
optimal leisure time and other activities under the constraints that each person confronts.
The studies above provide a variety of aspects of leisure and how leisure relates to
different goods and income. However, the income employed in those studies includes
only current income, while there exists a research gap in the investigation of the
relationship between leisure and permanent and extra income separately. Even though
wage or earning has been found to relate to many factors, including time devoted to other
activities in, for instance, leisure and work, so far in the literature, the relationship
between permanent and extra income and behavior regarding time allocation in leisure
activities has not been explored as well. This paper develops a theoretical framework for
an individual’s leisure, time allocation, and consumption profile and their possible
relationship with permanent and extra income.
The paper is organized as follows: consumption and time allocation, which is
illustrated in the theoretical framework. Then a mathematical model is presented to
investigate optimal leisure and consumption and the roles of permanent and extra income
in an individual’s decisions for maximizing utility. Moreover, substitution, income, and
total effect of leisure changes in response to permanent and extra wage changes are
analyzed before the conclusion.

11
1.3 Theoretical Framework
Leisure is an activity that plays a key role in determining time allocation subject
to an individual’s preferences and labor supply. The distinction of the model is that it
separates two types of earning, permanent and extra income, in order to explore the
impact of each type of revenue on an individual’s leisure, work, and time allocation.
Since the level of extra income relies on an individual’s work time, while a permanent
income increase does not require any changes in work hours, an individual’s optimal
leisure and work time possibly differ depending on which income type has changed. The
study provides policy implications in terms of the setting of work hours, taxation, and
encouraging leisure to increase people’s welfare.
Budget
Unearned Income
Earned Income
Financial Income
Others
Permanent
Extra
Time
Work Time
Leisure Time
Produce
Good & Services
Time Allocation
Optimal Leisure
Optimal Work
Consumption
Purchase
Utility Maximization
Leisure (L)
Consumption (X)
Constraints
Figure 1.1 Conceptual Framework for Essay 1
The conceptual framework of this paper is illustrated in Figure 1.1. There are two
constraints faced by individuals, income and time, of which sources include work and
non-work. Permanent and extra income are the two elements of earned income, whereas
earnings from financial assets, rents, and others are categorized under unearned income.

12
Each person spends time mainly for leisure and work, then combines his or her budget
and time resources for optimal leisure time and consumption. The level of each activity’s
optimization relies on the individual’s preference expressed in the utility function. This
conceptual framework affirms the possible relationship of extra and permanent income
and leisure.
Besides the analysis of the allocation of time and goods under the condition of the
two types of earned income, based on the model, the paper also explores the impact of
extra wage change on leisure time use by considering how leisure alters, both in direction
and magnitude, when wage changes.
1.4 Optimal Leisure and Consumption
In the model, each person’s consumption for utility maximization is based on two
commodities, leisure (L) and goods (X). There are two types of restrictions confronted by
individuals, income and time. For the consumption function, the Constant Elasticity of
Substitution (CES) is assumed as the utility function. The CES utility function is more
general and proved quite useful for illustrating the degree of substitutability present in
leisure and other activity relationships (Albelo and Serrano, 1998: 10). The consumption
function, C, can be defined as
C = f (X, L)
where X denotes the quantity of the consumption of goods and services, while L is time
devoted to leisure. The CES utility function for individuals becomes
LX)1( if ≠ 0
(1) U = 0 ≤ α ≤ 1, < 1
[lnX +(1-)lnL], if =0
where is correlated to substitution parameter, by
1
1. When = 0, =
1, which corresponds to the Cobb-Douglas case, whereas when = -, = 0, it refers to
the case of fixed proportion. Assuming that there are two types of activities that influence
an individual’s utility. The denotes consumption preference in the utility function,

13
while (1-) provides the importance of leisure in the individual’s utility. A leisure lover
has relatively larger size of (1-), while consumption lovers tend to enjoy high
proportion of . Each person receives mainly two types of revenue, earned income (VM)
gained from working in the market and unearned income (VN); then the total earnings for
an individual (V) become
(2) V = VM + VN
The model provides only two ways to earn market income, working for extra and
permanent income. Therefore, total work time, a, consists of the time an individual
devotes to work for his or her extra income, aT, and time to work for the permanent
income, aP, which is divided into two parts, the required work time for permanent
income, aPMin
, and additional work time for permanent income, aPA, as follows:
(3) a = aT + aP
where aT ≥ 0
aP = aPMin
+ aPA
, aPMin
> 0
aPA ≥ 0
where aP denotes the positive work time for permanent income. A permanent job earner
is required to allocate at least a number of positive fixed work hours, aPMin
, while he or
she is free to allocate additional work time for a permanent job, aPA. Revenue earned
from the market can be divided into permanent income (wPaP) and extra income (wTaT). It
is calculated from wages and time of work. Each person can choose his or her working
hours to earn extra income and work a number of fixed hours. Total market income, VM,
obtained from those two types of income is
(4) VM = wTaT + wP aPMin
+ (0) aPA
At the same time, an individual might earn from other sources. VN represents non-market
earnings, which are composed of several types of revenue, for example, financial income,
rents, dividends, and others.
Each person devotes time for market work and leisure. Assuming no savings, the
budget constraints for each person indicate that wage earnings plus unearned income,
which consists of financial income and others, should be equal to consumption of goods
and services in each period, expressed as follows:
(5) wTaT + wP aP + VN = X
14
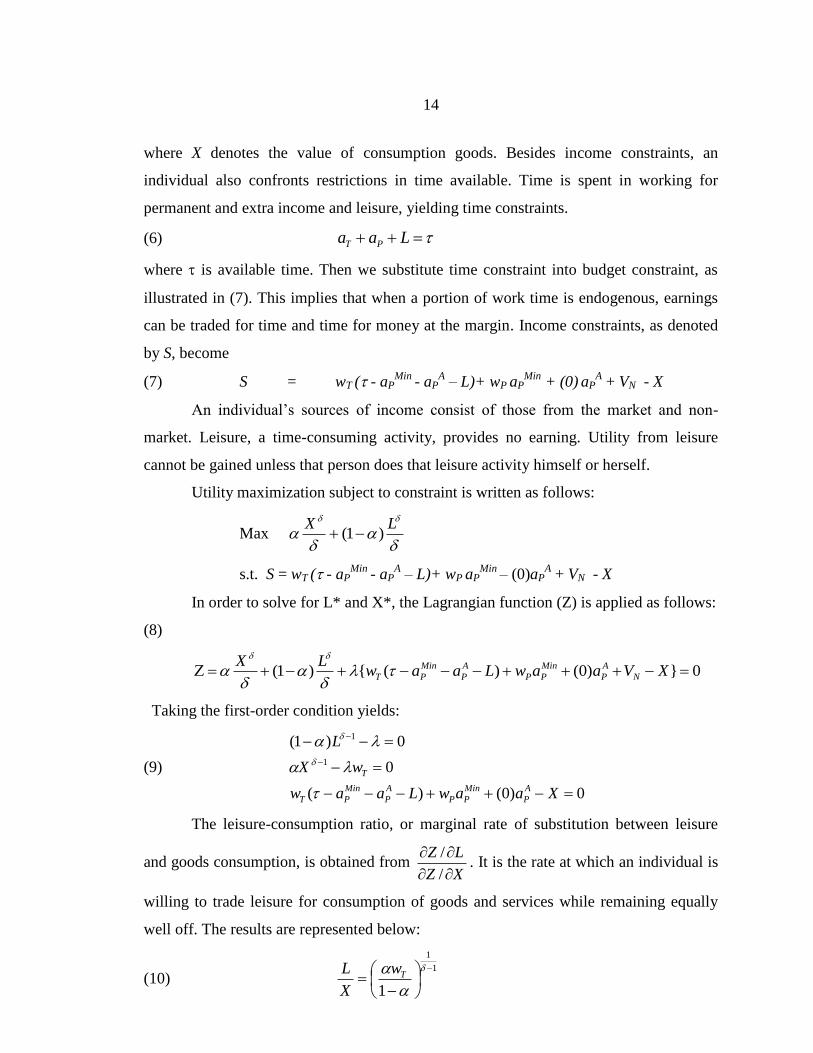
where X denotes the value of consumption goods. Besides income constraints, an
individual also confronts restrictions in time available. Time is spent in working for
permanent and extra income and leisure, yielding time constraints.
(6) Laa PT
where is available time. Then we substitute time constraint into budget constraint, as
illustrated in (7). This implies that when a portion of work time is endogenous, earnings
can be traded for time and time for money at the margin. Income constraints, as denoted
by S, become
(7) S = wT ( - aPMin
- aPA – L)+ wP aP
Min + (0) aP
A + VN - X
An individual’s sources of income consist of those from the market and non-
market. Leisure, a time-consuming activity, provides no earning. Utility from leisure
cannot be gained unless that person does that leisure activity himself or herself.
Utility maximization subject to constraint is written as follows:
Max
LX
)1(
s.t. S = wT ( - aPMin
- aPA – L)+ wP aP
Min – (0)aP
A + VN - X
In order to solve for L* and X*, the Lagrangian function (Z) is applied as follows:
(8)
0})0()({)1( XVaawLaawLX
N
A
P
Min
PP
A
P
Min
PT
Taking the first-order condition yields:
(9)
0)0()(
0
0)1(
1
1
XaawLaaw
wX
L
A
P
Min
PP
A
P
Min
PT
T
The leisure-consumption ratio, or marginal rate of substitution between leisure
and goods consumption, is obtained from XZ
LZ
/
/. It is the rate at which an individual is
willing to trade leisure for consumption of goods and services while remaining equally
well off. The results are represented below:
(10) 1
1
1
Tw
X
L
15
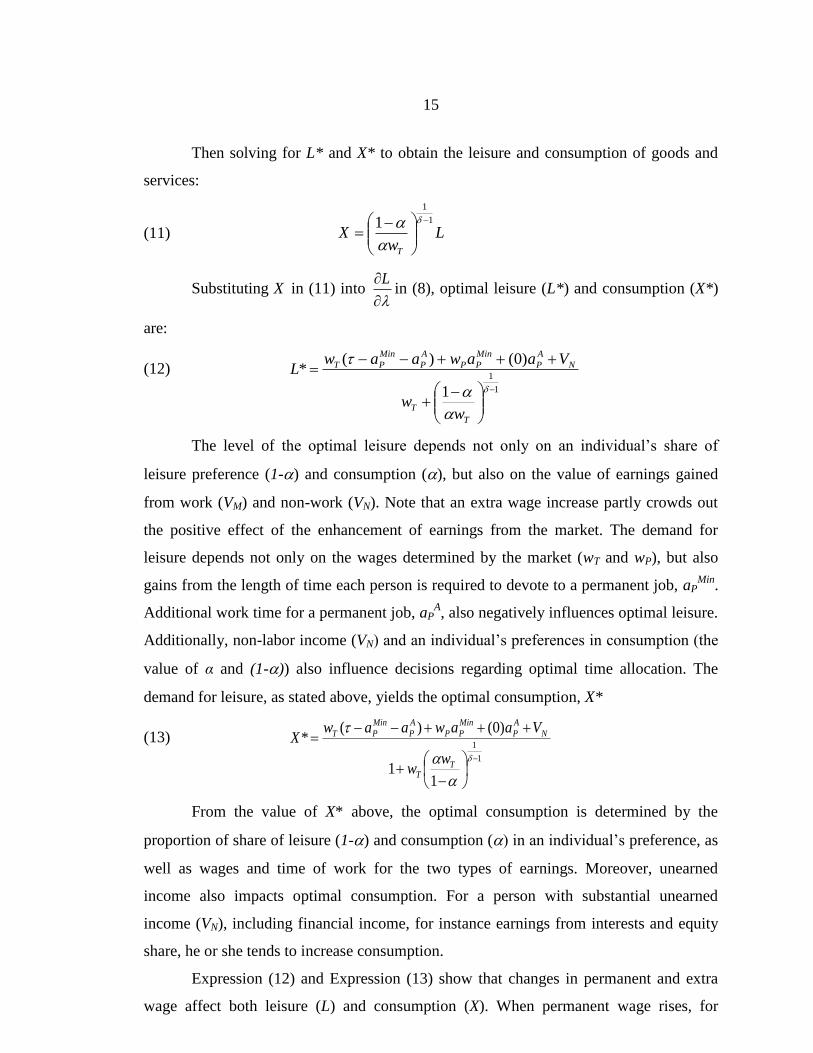
Then solving for L* and X* to obtain the leisure and consumption of goods and
services:
(11) Lw
XT
1
1
1
Substituting X in (11) into
Lin (8), optimal leisure (L*) and consumption (X*)
are:
(12)
1
1
1
)0()(*
T
T
N
A
P
Min
PP
A
P
Min
PT
ww
VaawaawL
The level of the optimal leisure depends not only on an individual’s share of
leisure preference (1-) and consumption (), but also on the value of earnings gained
from work (VM) and non-work (VN). Note that an extra wage increase partly crowds out
the positive effect of the enhancement of earnings from the market. The demand for
leisure depends not only on the wages determined by the market (wT and wP), but also
gains from the length of time each person is required to devote to a permanent job, aPMin
.
Additional work time for a permanent job, aPA, also negatively influences optimal leisure.
Additionally, non-labor income (VN) and an individual’s preferences in consumption (the
value of α and (1-)) also influence decisions regarding optimal time allocation. The
demand for leisure, as stated above, yields the optimal consumption, X*
(13)
1
1
11
)0()(*
TT
N
A
P
Min
PP
A
P
Min
PT
ww
VaawaawX
From the value of X* above, the optimal consumption is determined by the
proportion of share of leisure (1-) and consumption () in an individual’s preference, as
well as wages and time of work for the two types of earnings. Moreover, unearned
income also impacts optimal consumption. For a person with substantial unearned
income (VN), including financial income, for instance earnings from interests and equity
share, he or she tends to increase consumption.
Expression (12) and Expression (13) show that changes in permanent and extra
wage affect both leisure (L) and consumption (X). When permanent wage rises, for

16
instance, a monthly salary increase, it causes positive changes to both leisure and the
consumption of goods and services. On the other hand, an extra wage increase, for
example, higher rate of overtime per hour, certainly brings about the rise of consumption,
while the extra wage increase partly crowds out the enhancement of leisure since the rise
of extra wage induces an individual to increase his or her working hours (aT) for higher
revenue.
1.5 Impact of an Extra Wage Change on Leisure Time
The concept of categorizing income was supported by Gilbert and Pfouts (1958:
quoted in Fan (1972): 481), who explored the responsiveness of hours of work with
respect to change in wage rate. They estimated the impact of a wage increase on work
effort, which is comparable to extra wage. According to the study, how wage change
impacts an individual’s work hours depended on the magnitude of substitution and
income effects. In this model, there are two types of wages, those from extra income (wT)
and wages obtained from permanent income (wP). Estimating the effect of changes in
leisure if there is a movement of income level under the utility maximization hypothesis
can be represented by:
iw
L Substitution Effect + Income Effect
ii w
L
w
L
U = Constant + ai
NV
L
where i = T, P. Total effect on? leisure from the wage change can be categorized into
impact of substitution and income change. The substitution effect is obtained from
differentiating compensated leisure demand with respect to wages earned from extra
income and permanent income, while income effect confirms the reaction to leisure at the
time of the individual’s income shift.
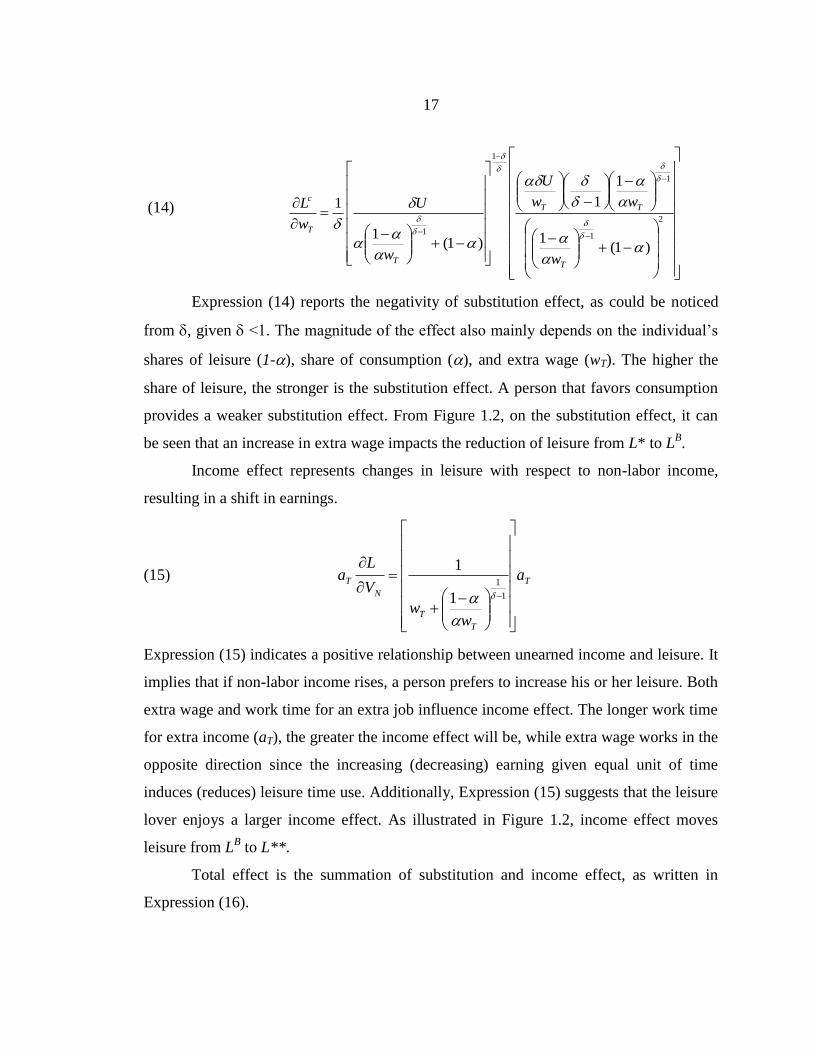
17
(14)
2
1
1
1
1
)1(1
1
1
)1(1
1
T
TT
T
T
c
w
ww
U
w
U
w
L
Expression (14) reports the negativity of substitution effect, as could be noticed
from , given <1. The magnitude of the effect also mainly depends on the individual’s
shares of leisure (1-), share of consumption (), and extra wage (wT). The higher the
share of leisure, the stronger is the substitution effect. A person that favors consumption
provides a weaker substitution effect. From Figure 1.2, on the substitution effect, it can
be seen that an increase in extra wage impacts the reduction of leisure from L* to LB.
Income effect represents changes in leisure with respect to non-labor income,
resulting in a shift in earnings.
(15) T
T
T
N
T a
ww
V
La
1
1
1
1
Expression (15) indicates a positive relationship between unearned income and leisure. It
implies that if non-labor income rises, a person prefers to increase his or her leisure. Both
extra wage and work time for an extra job influence income effect. The longer work time
for extra income (aT), the greater the income effect will be, while extra wage works in the
opposite direction since the increasing (decreasing) earning given equal unit of time
induces (reduces) leisure time use. Additionally, Expression (15) suggests that the leisure
lover enjoys a larger income effect. As illustrated in Figure 1.2, income effect moves
leisure from LB to L**.
Total effect is the summation of substitution and income effect, as written in
Expression (16).

18
(16)
2
1
1
1
1
1
1
1
1
1
111)0()(
1
T
T
TT
N
A
P
Min
PP
A
P
Min
P
T
T
T
ww
wwVaawaa
ww
w
L
Expression (16) reveals the influence of extra wage (wT) and share of leisure time
in utility (1-) on leisure hours. Expression (16) does not clearly indicate whether the
total effect becomes positive or negative. Therefore, an individual can either decrease his
or her leisure time in response to an extra wage increase
0
Tw
L or enhance his or her
leisure time when the extra wage rises
0
Tw
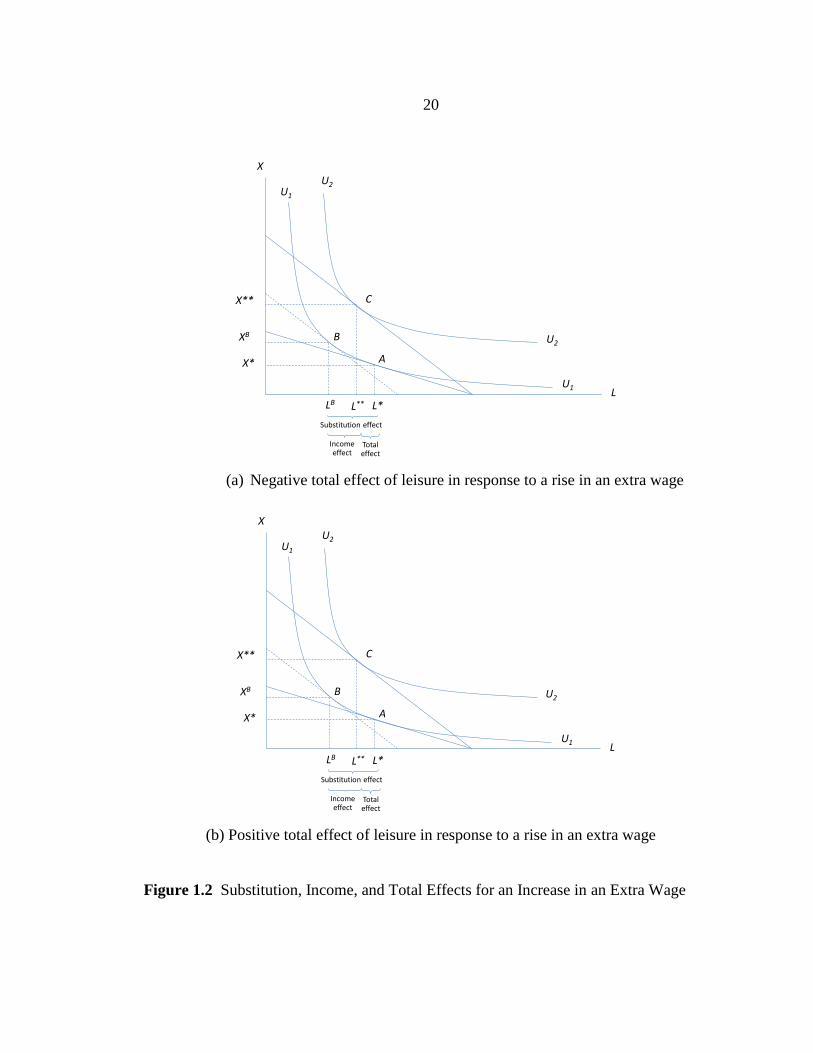
L. This is illustrated in Figure 1.2: as
wage for extra income increases, given the constant level of utility of U1, leisure falls
from L* to LB. Therefore, the substitution effect impacts the movement leftward from A
to B. While income effect shifts leisure to the right hand side, increasing leisure from LB
to L**, it causes the change from B to C. In Figure 1.2a, considering the hours of work
for extra wages, an increase in an extra wage inversely impacts the individual’s work
time. Therefore, an increase in extra wage induces work time for extra income but
diminishes leisure time, while Figure 1.2b illustrates the positive impact on leisure time
change in response to the rise in extra wage. This enormous positive income effect
crowds out the negative impact of the substitution effect and finally provides the total
effect of leisure time change when extra wage rises or falls.
Total effect is the sum of the substitution and income effect. From Expression
(16), total effect could be either positive or negative, while the substitution effect in (14)
is negative. The income effect illustrated in (15) shows the positive direction of leisure
change in the alteration in non-labor income. The huge income effect dominates the
substitution effect, giving a positive total effect, as shown in Figure 1.2b, while the
relatively smaller income effect, compared with the magnitude of the substitution effect,
19
provides a negative total effect, as presented in Figure 1.2a. This finding corresponds
with that found in Fan (1972: 478-482), indicating that the direction of change in leisure
time when an extra wage changes is undetermined.
20
Incomeeffect
Totaleffect
Substitution effect
XU2
U1
U2
U1
A
B
C
X*
XB
X**
LL*LB L**
(a) Negative total effect of leisure in response to a rise in an extra wage
Incomeeffect
Totaleffect
Substitution effect
XU2
U1
U2
U1
A
B
C
X*
XB
X**
LL*LB L**
(b) Positive total effect of leisure in response to a rise in an extra wage
Figure 1.2 Substitution, Income, and Total Effects for an Increase in an Extra Wage

21
Figure 1.3 Total Effect of Change in Leisure Given an Extra Wage Change in Various
Leisure/Consumption Preferences
Figure 1.3 plots the total effect of leisure time change in response to an extra
wage change, Tw
L
, reflecting an individual’s leisure time allocation behavior at various
levels of leisure/consumption preference by conditioning on the , which corresponds to
substitution parameter, . The greater the value of , the more likely is the positive
change on total effect. This means that when there is a higher degree of substitutability
between leisure and consumption, an individual, especially leisure/consumption neutral,
is more likely to allocate positive leisure time in response to an extra wage increase,
except for the leisure lover who possesses a very high proportion of leisure in utility
function. When leisure and consumption are less substitutable, the individual is more
likely to inversely change his or her leisure time given a change in an extra wage, as can
be seen from the higher value of yields a more negative value of Tw
L
.
-0.6
-0.5
-0.4
-0.3
-0.2
-0.1
0
0.1
0.2
0 0.2 0.4 0.6 0.8 1 1.2
L/
wT
Consumption Preference ()
Low Substitutability
Middle Substitutability
High Substitutability

22
For a person preferring leisure more than consumption (low value of ) , Tw
L
is
highly negative. This implies that a fall in extra wage causes a greater change in a rise in
leisure time (Tw
L
< 0). On the other hand, a consumption lover, an individual with a
higher value of , is less negatively responsive (Tw
L
< 0), or even responds positively
(Tw
L
> 0), to an increase or decrease in extra wage. For example, when there is a fall in
extra income, a consumption lover with a moderate degree of is likely to increase
comparatively less leisure time, compared with a leisure lover, when (Tw
L
< 0). For a
consumption lover with a higher value of , he or she would even decrease his or her
leisure time when his or her extra wage fall, or (Tw
L
> 0). Therefore, a leisure lover
inversely responds to an increase or decrease in an extra wage, while a lower degree of
consumption lover reacts less negatively when there is an increase in extra wage.
However, a person with high preference for consumption tends to positively alter his or
her leisure time.
The simulation indicates that the leisure lover (person whose is comparatively
low) is more willing to increase his or her time for leisure as extra wage falls—ceteris
paribus—while the consumption lover pays more attention to leisure time only when his
or her extra wage rises. Furthermore, as leisure and consumption are more substitutable
( is close to 1), a leisure lover tends to allocate more time for leisure in response to a
decrease in extra wage rate and vice versa.
As seen in the two models, it is assumed that a person gains utility by consuming
only leisure and goods. Therefore, this paper compares two types of people, a leisure
lover (person with (1-) > α) and a consumption lover (person with α > 1-). The
comparisons of the substitution effects, the income effects as well as the total effects,
when the share of leisure is greater than the share of consumption, are as follows,

23
1.5.1 Proposition 1: Share of leisure (1-) > Share of consumption (α)
This case is for an individual preferring leisure to consumption, implying a higher
share of leisure in his or her utility function. The effects of changes in both types of
wages on leisure change are represented as follows:
1.5.1.1 Income Effect of Extra Income Change on Leisure
N
TV
La
The income effect describes the changes of leisure in response to revenue
change only. As the share of leisure (1-) is one of the variables that appear in
Expression (15), income effect is higher for a leisure lover than for a consumption lover.
Notice that the greater the extra wage (wT) of the worker, the smaller is the impact of
income change on leisure. This is possibly because a low extra wage takes a smaller
proportion of the whole amount of earnings, given the equal amounts of work time for
permanent income and an individual’s share of leisure and consumption.
For a leisure lover, the value of income effect is simply higher than for a
consumption lover. The person with lower extra income tends to be more affected by an
extra wage change. In total, Expression (15) indicates a positive income effect.
1.5.1.2 Substitution Effect of Extra Income Change on Leisure
T
c
w
L
From Expression (14), it can be seen that the substitution effect depends
on the individual’s shares of leisure (1-) and consumption (α) and extra wage (wT). The
greater share of leisure preference (1-) could provide a more negative substitution
effect. Furthermore, an extra wage (wT) increase (decrease) simply weakens (strengthens)
the substitution effect. In comparison, a leisure lover tends to obtain a higher substitution
effect than a consumption lover does. Expression (14) indicates that an increase in extra
wage (wT) could make a leisure lover and consumption lover less willing to give up
additional extra wages. Expression (15), the substitution effect of leisure alterations on
changes in extra wage implies that an individual preferring leisure is likely to be less
responsive to extra wage decreases (increases) by increasing (decreasing) his or her
leisure than a person that loves to consume goods and services.

24
1.5.1.3 Total Effect of Extra Income Change on Leisure
Tw
L
From the analysis of Expression (16), the total effect of leisure change in
response to an extra wage change can be either positive or negative. The variables
impacting total effect of extra income change on leisure, as shown in Expression (16),
include the extra wage rate itself (wT), permanent income (wPaP), unearned income, as
well as the share of leisure (1-) and consumption (α) in an individual’s utility function.
The higher permanent income a leisure lover earns, the larger is the magnitude of leisure
change that is received in return. This implies that a greater amount of permanent income
causes a leisure time increase. On the other hand, more extra income is likely to reduce
the magnitude of leisure change. The more an individual prefers leisure, the higher will
be his or her responsiveness of leisure deviation when extra wage changes. In total, it is
not indicated whether the total effect is positive or negative since it depends on the utility
function, which represents each person’s preference.
1.5.2 Proposition 2: Share of consumption (α) > Share of leisure (1-)
Since each person provides dissimilar preferences and behaviors regarding both
consumption and leisure, the optimal level of leisure and consumption also varies. The
optimal level, as seen in Expression (12), of leisure (L) for a consumption lover is
certainly lower than for a leisure lover. In this case, the effects of permanent and extra
income change on leisure are analyzed as follows:
1.5.2.1 Income Effect of Extra Income Change on Leisure
N
TV
La
As mentioned above, a consumption lover is likely to react less
responsively than a leisure lover does when non-labor income changes due to the lower
value of share of leisure in the utility function (1-). In this case, according to Expression
(15), the level of the income effect depends on the length of work time for permanent
income and extra wage. A person spending a shorter time working for permanent income
tends to absorb the effect of revenue change more easily. In addition, if that person does
not earn a high rate of extra wage, the income effect of revenue change on leisure would

25
be even larger. The positive income effect for the consumption addicted tends to be
smaller compared with that of a leisure lover.
1.5.2.2 Substitution Effect for Extra Income Change on Leisure
T
c
w
L
As mentioned previously, the magnitude of substitution effect for a
consumption lover is higher than that of a leisure lover, as a consumption lover has a
greater value of α. What impacts the substitution effect includes extra wage rate as well
as share of preference in consumption (α) and share of leisure (1-). From Expression
(14), it can be expected that a person that comparably prefers to consume tends to change
leisure in the opposite direction in response to extra income than a leisure lover does. In
addition, for both people preferring to consume or engage in leisure, if higher extra
income, for example, overtime, is offered, they tend to spend less time on leisure (and
possibly work more) since Expression (14) illustrates the negative change of the
substitution effect in response to an extra wage change (wT).
1.5.2.3 Total Effect of Extra Income Change on Leisure
Tw
L
Since total effect of extra income change on leisure is also dependent on
share of leisure (1-) and share of consumption (α), as shown in Expression (16), a
consumption lover is likely to engage in less leisure time when his or her extra wage
increases. For this type of person, a rise in an extra wage is more likely to negatively
impact leisure. On the other hand, a consumption lover can either positively or inversely
change leisure time allocation given a change in extra wage. Additionally, a consumption
lover whose permanent income and extra wage are higher is more responsive to extra
income fluctuation. On the other hand, the higher share of consumption (α), the smaller is
the amount of leisure change in response to extra wage change.
The analysis of extra wage change on leisure indicates the possibility of both a
positive and negative relationship between change in income and leisure time adjustment.
The substitution effect causes an inverse alteration of leisure given an extra wage change.
The higher value of extra wage is likely to lessen the substitution effect, whereas a
consumption lover is less enthusiastic for a change in extra wage. The income effect

26
reports a positive change of leisure in response to non-labor income change. Considering
the effect in total, a wage increase raises the price of leisure, so an individual chooses to
reduce leisure time and raise his or her work hours for extra income. At the same time,
the income rise boosts leisure demand, causing leisure time enhancement. Finally,
whether a rise in the extra income increases leisure time truly depends on the individual’s
utility and preferences. The finding in this paper is supported by the results in Barnett
(1975: 551) and Kumar (2005: 22), and can also be associated with Owen (1971: 69);
they reported an increase in leisure time as the wage increased. Meanwhile, the result
agrees with the theoretical analysis in Fan (1972: 478-482), who found that the direction
of change in leisure time was undetermined when the wage rate changes.
The result of the total effect analysis demonstrates that a leisure lover prefers
leisure responses inversely, whereas a consumption lover is less responsive to change in
leisure when extra wage rises or falls. It is possible that the leisure lover has already
taken comparatively more leisure time; then he or she is willing to dedicate the larger
stock, compared to that of a consumption lover, of leisure time to work for more extra
income. The higher leisure price when an extra wage increases explains the behavior of
leisure time reduction and vice versa.
1.6 Conclusion
Even though leisure is an activity that plays a critical role in an individual’s time
allocation, empirical research has only recently focused on leisure and its importance to
the economy. At the beginning of the study of time allocation, work time, yielding labor
supply, was the factor highlighted, while leisure time was simply defined as time spent
away from work. The development of the definition of leisure has provided a more
elaborate measure of leisure as well as leisure in the behavioral model of time allocation.
This paper develops a conceptual framework to study the relationships between
types of individuals’ income and leisure by diversifying earnings into permanent income
(for example, fixed monthly salary) and extra income (for example, overtime and bonus).
This aims not only to investigate such relationships, but also to explore the factors
influencing changes in the size of the effects. The paper explores how time devoted to
leisure changes in response to a rise or fall in permanent wage and extra wage. The

27
findings reveal that there are a number of factors influencing total effect, substitution, and
income effect of leisure change given wage changes. Unearned income enhances the
magnitude of the total effect of leisure time change, while an extra wage increase can
both raise and reduce the total effect on leisure. Whether leisure rises or falls totally in
response to extra wage change depends on the individual’s utility and preference. A
leisure lover is more likely to spend more time on leisure when an extra wage is reduced
compared with a consumption lover. The more the substitutability of leisure and
consumption, the more negative the responsiveness of leisure time allocation when an
extra wage increases, especially for a leisure lover.
1.7 Bibliography
Aguiar, Mark and Hurst, Erik. 2006. Measuring Trends in Leisure: The Allocation of
Time Over Five Decades. Working Paper No. 12082. National Bureau of
Economic Research (NBER), Cambridge, M.A.
Albelo, Carmen Alvarez and Serrano. Lluis Diaz. 1998. Human Capital and
Consumption over the Life Cycle: A Synthesis. Documents De Treball De
La Divisio De Ciencies, Juridiques, Economiques I Socials. Retrieved March
3, 2008 from http://www.recercat.net/bitstream/2072/1121/1/44.pdf
Alderman, Harold and Sahn, David E. 1993. Substitution between Goods and Leisure in
a Developing Country. American Journal of Agricultural Economics. 75
(4): 875-883.
Barnett, William A. 1979. The Joint Allocation of Leisure and Goods Expenditure.
Econometrica. 47 (3): 539-563.
Becker, Gary S. 1965. A Theory of the Allocation of Time. The Economic Journal.
75: 493-517.
Becker, Gary S. 1993. Human Capital: A Theoretical and Empirical Analysis with
Special References to Education. 3rd
ed. Chicago: The University of
Chicago Press.
Chen, M. Keith and Chevalier, Judith A. 2007. The Taste for Leisure, Career Choice
and the Returns to Education. Economics Letters. 99: 353-356.

28
Fan, Liang-Shing. 1972. Leisure and Time Element in the Consumer Behavior.
Southern Economic Journal. 38 (4): 478-484.
Fischer, Carolyn. 2001. Read This Paper Later: Procrastination with Time-Consistent
Preferences. Journal of Economic Behavior & Organization. 46 (3): 249-
269.
Greenberg, David H. 1997. The Leisure Bias in Cost-Benefit Analyses of Employment
and Training Programs. The Journal of Human Resources. 32 (2): 413-
439.
Gronau, Reuben. 1973. The Intrafamily Allocation of Time: The Value of the
Housewives’ Time. The American Economic Review. 63 (4): 634-651.
Gronau, Reuben. 1976a. Leisure, Home Production and Work—The Theory of the
Allocation of Time Revisited. Working Paper No. 137. Center for Economic
Analysis of Human Behavior and Social Institutions, National Bureau of
Economic Research (NBER), Cambridge, M.A.
Gronau, Reuben. 1976b. The Allocation of Time of Israeli Women. The Journal of
Political Economy. 84 (2): S201-S203.
Gronau, Reuben. 1986. Home Production—A Survey. In Handbook of Labor
Economics. Vol. 1. O. Ashenfelter and R. Layard eds. London: Elsevier.
Pp. 275-304.
Jara-Diaz, Sergio R.; Munizaga, Marcela A.; Greeven, Paulina; Guerra, Reinaldo and
Axhausen, Kay. 2008. Estimating the Value of Leisure from a Time
Allocation Model. Transportation Research Part B. 42: 946-957.
Juster, F. Thomas and Stafford, Frank P. 1991. The Allocation of Time: Empirical
Findings, Behavioral Models, and Problems of Measurement. Journal of
Economic Literature. XXIX: 471-522.
Kumar, Anil. 2005. Lifecycle Consistent Estimation of Effect of Taxes on Female
Labor Supply in the U.S: Evidence from Panel Data. Research
Department Working Paper 0504. Federal Reserve Bank of Dallas. Retrieved
March 3, 2009 from http://dallasfed.org/research/papers/2005/wp0504.pdf
Nicholson, Walter. 2005. Microeconomic Theory: Basic Principles and Extensions.
9th
ed. Ohio: South-Western.

29
Owen, John D. 1971. The Demand for Leisure. Journal of Political Economy. 79 (1):
56-76.
Rottenberg, Simon. 1952. Income and Leisure in an Underdeveloped Economy. The
Journal of Political Economy. 60 (2): 95-101.
Rutherford, Thomas F. 2008. Calibrated CES Utility Functions: A Worked Example.
Retrieved January 28, 2011 from http://www.mpsge.org/calibration.pdf
Yamada, Tadashi; Yamada, Tetsuji and Kang, J. Moonwon. 1999. A Study of Time
Allocation of Japanese Households. Japan and the World Economy. 11:
41-55.

ESSAY 2
IS LEISURE A NORMAL GOOD FOR THE THAI PEOPLE?
2.1 Abstract
This paper estimates empirical models mainly to find the impact of wage and
income change on Thai people‟s leisure time, as well as the determinants of leisure time,
in order to understand how individuals with different socio-economic characteristics
allocate time for leisure. Leisure time is divided into four measures, from leisure as
merely an activity yielding direct enjoyment to leisure as the residual of work. Using
Thailand‟s Time Use Survey and Labor Force Survey, the estimation of leisure time in
response to wage change among people significantly indicates that people positively
increase their leisure time in response to an increase in hourly wage. This result reveals
that for Thai people, leisure is a normal good. A social structure in which males “make
the first move” indicates that there exists a social structure whereby men have the
opportunity to choose to work in the market while females are responsible for housework
and home production, even they also have to work in the market. This gender gap is
confirmed by the shorter leisure time and longer time for housework for females. Among
the seven days of a week, people spend unequal leisure time, indicating that there exist
leisure gaps among the days of a week for Thais.
Keywords: leisure, wage, income, normal goods, Thailand

31
2.2 Introduction
Among the activities listed in an individual‟s time use, leisure takes a substantial
proportion as it is physically necessary as well as mentally improves activities. This kind
of non-market time is valuable to study since it helps understand the behavior of the
market economy by recognizing how time is allocated away from the market. Currently,
research on leisure is not emphasized very much compared with work time studies, as it
is believed that leisure is merely an unproductive time-consuming activity. However,
according to theory of utility maximization, individuals maximize utility by consuming
goods, services, and leisure time. Previous research focused on market work time and
labor supply much more than on leisure. As people normally spend approximately 8
hours a day on market work and the rest, about 16 hours on non-market activities,
including leisure1, studies on leisure could reveal patterns of time use of people. In
addition, combined with demographic information, a comparison of leisure time use
across different groups is also possible.
The relationship between leisure and wages has been explored since the theory
relating time allocation decisions to wage does not provide a clear prediction. The reason
is that much research work has confirmed the relationship between leisure time and
wages in terms of both wage increase or decrease, causing leisure time change and vice
versa. A lot of those studies have linked their findings to the labor supply issues, which
are strongly related to leisure and time use. Empirical works that illustrate how wage is
related to leisure include Owen (1971: 56-76), Gronau (1977: 1116-1117) and Yamada,
Yamada and Kang (1999: 48). The findings varied because of differences in the time
studied and the characteristics of the observations.
As individuals allocate their time mainly for leisure and work in order to
maximize utility, the length of work time affects people‟s leisure time. Owen (1971: 68)
confirmed that workers supply larger quantities of labor in response to a higher wage
when the wage is relatively low, but when the wage reaches a relatively high level,
further increases in the wage entice workers to reduce the quantity supplied. The supply
1 According to the Labour Protection Law 1988, Chapter 2, Section 3: One working day must not exceed 8
hours. This corresponds to the labor laws of other countries, for example, the USA, the UK and Australia.

32
curve thus bends back on itself, the so-called backward-bending supply curve. This
implies that leisure and wage could be both positively correlated with each other. While
Gronau (1977: 1116-1117) has argued that a wage increase merely creates labor supply
by reducing work at home, the effect on leisure was indeterminate. Labor supply depends
on the decisions that maximize utility, either to spend a portion of the higher wage to buy
more leisure time, and thus work less, or to offer more time for work and take less time
for leisure. Therefore, ideas concerning how a change in wage impacts leisure time are
still not conclusive.
Not only does wage possibly impact labor, previous research using data from
many countries support the idea that some other factors obviously influence leisure time.
Substantial evidence has shown that gender characteristics dissimilarity leaded to unequal
leisure time between males and females. Comparing the two genders, Gronau (1977:
1116-1117) found that employed women had less leisure since they also spent more time
to work at home than males did for both Americans and Israelis. This result contradicted
that in Yamada et al. (1999: 48), which found a negative relationship between wage
change and time for some leisure activities, including childcare, medical care, and time
for radio and TV, by estimating leisure activity elasticities with respect to male‟s and
female‟s own wages in Japan. However, the results correspond with the work of Beblo
and Robledo (2008: 290-291), indicating that men enjoyed more leisure time than women
in Germany. Additionally, a leisure gap between genders (from examining couples) was
found to be determined by their wage gap. Schettkat (2003: 4) also confirmed that both
American and German women apparently spent less leisure time than men. The study in
many developed countries signifies that there exists a leisure time gap between the
genders.
Besides wage and gender, marital status is another factor causing individual
differences in leisure time. Empirical studies have reported on the time use of leisure and
other activities differently across time and countries. Gronau (1976: S209) found a lower
leisure time among married Israelis than among singles, at about half an hour a day, since
the married spent more than two hours working at home. This result was inconsistent
with that of Aguiar and Hurst (2006: 32), which indicated lower hours of married men‟s
leisure time but more leisure time enjoyment of married women than that of single
women for Americans. The dissimilarity in leisure time use between individuals of

33
different marital status indicates the diversity of people‟s behavior in time allocation
across countries. In addition, household heads were likely to allocate a greater share of
time use for work, especially single household heads (Frase and Gornick, 2009: 4).
Empirical findings have also indicated the dissimilarity of leisure time use
between people in diverse regions. Marsden, Reed, Kennedy, and Stinson (1982:1023)
found that people in different regions significantly take dissimilar leisure time use for
arts-related leisure activities. Supported by previous research work, their study revealed
that personal, social, and environmental factors were associated with habitual physical
activity leisure, for example, personal attention, social support, and availability of
facilities (Molina-Garcia, Castillo and Pablos, 2009: 133-134).
Not only is marital status a factor influencing leisure time spending, but also
educational attainment impacts people‟s devotion to leisure time differently. Gronau
(1976: S209) has shown that leisure tends to increase with education since the educated
people spend more time at work and less time at home, and the reduction in time spent on
work exceeds the rise in market time. It was also indicated that the area in which
individuals live also influences their time use due to dissimilar lifestyles. People in rural
areas possibly do not enjoy as much leisure time as expected because they are burdened
with home production and housework, which negatively affect time use for other
activities, including market work and leisure (Ilahi, 2000: 17-21). Not only do
individuals‟ socio-economic characteristics influence leisure time, but so does the day of
the week surveyed. Aguiar and Hurst (2006: 27-28) indicated that this factor is necessary
since there exist differences in activities and time use, especially regarding weekdays and
weekends. This paper also includes this factor in the models in order to test which day of
the week significantly impacts leisure time.
From the literature review of studies on the estimation of leisure time and other
variables that possibly affect leisure, there is still no research on time allocation for
leisure activities for the Thai people, or on how they change their leisure time in response
to wage changes. Since people in different countries have different backgrounds in
economy, life style, and culture, causing dissimilarities in behavior of time allocation as
well as responses to wage changes regarding leisure, it is essential to fill the research gap
by analyzing Thai people‟s time use behavior and allocation of time. The question of how

34
Thai people, with different characteristics, allocate time, especially for leisure activities
as well as leisure behavior allocation, will be discussed.
This paper aims to examine how people change the amount of their leisure time as
wage or income changes. As leisure has been defined differently among empirical works,
this study separates leisure by types of activities and categorize them into four measures,
based on Aguiar and Hurst (2006: 21-25), from the narrowest to the broadest. If people
respond by allocating more leisure time for higher earning, this implies that leisure is a
normal good. Another objective is to understand the behavior of the Thai people by
finding out how time is allocated away for non-market purposes in order to maximize
utility by employing a model estimation to find the determinants of leisure.
The structure of this paper is organized as follows; the next section explains
leisure time according to different measures before an explanation of model specification
and model estimation. This is followed by an empirical analysis of the determinants of
leisure time in order to see how people, with a variety of socio-economic characteristics,
adjust their leisure time in response to a wage change. This is then followed by the
conclusion of this study.
2.3 Leisure: Definitions and Measures
The economic study of leisure was not strongly emphasized in the past, as
researchers were more concerned with wage, work time, as well as time allocation. In
early studies, leisure was not clearly defined, even if it was a topic widely mentioned in
empirical works. The meaning of leisure was quite subjective2 and difficult to define. For
simplicity in economic analysis, many papers researching issues related to work and time
allocation simply defined leisure as the residual of total hours of work.3 However, this
leisure definition neglects other non-market activities, leading to biases because besides
2 Many papers have defined leisure in various ways. According to Wilson (1980: 284), leisure referred to
the activities that were neither static nor a fixed posture, while Neulinger (1984, quoted in Westland (1987:
228)) stated that leisure was the condition of perceived freedom. Westland (1987: 228) equated leisure with
free time for doing something else. Soule (1957: 16) further elaborated leisure activities to be rest, idleness,
play or recreation.
3 See Fischer (2001: 249-269), Kumar (2005: 4-15) and Chen and Chevalier (2007: 353-356).

35
market work, an individual‟s time allocation is also devoted to housework and home
production. A number of empirical studies have distinguished leisure from other non-
work activities in an individual‟s time allocation4, but most papers have not clearly
indicated which activities were categorized as “leisure.” To solve this problem and to
provide more details on “leisure,” the definition of leisure adapted from Aguiar and Hurst
(2006: 21-25) is applied in this study. It illustrates the detailed list of activities and
categorizes them into groups in order to define “leisure”. This provides an alternative
measure of leisure based on the degree of market substitutes. The most extreme measure
defines leisure as an activity for which time input was essential in the sense that the
activity itself provided enjoyment and utility, whereas the broadest measure defines
leisure as the difference of total time available and market work time. These measures
concurred with Ramey and Francis (2006: 8) in the sense that leisure was comprised of
activities yielding high enjoyment.
The first measure of leisure, Leisure Measure 1, is the sum of time spent on
“entertainment/social activities” and “active recreation.” According to researchers, the
activities mentioned provide direct enjoyment as well as not having close market
substitutes. It could also be defined as pure leisure. The broader definition is provided in
Measure 2, the activities giving direct utility, but also viewed as intermediate inputs.
These include Leisure Measure 1 as well as time spent in sleeping, eating, and personal
care. Leisure Measure 3 includes Leisure Measure 2, plus time spent in “primary” and
“educational” childcare. The broadest measure is Leisure Measure 4, providing all
residual work activities. The additional activities include time spent in education, civic
and religious activities, caring for other adults and one‟s own medical care. The
definitions and example lists for leisure activities in each measure are presented in Table
2.1.
As mentioned, this paper adapts the definitions of leisure and lists activities in
each measure as stated in Aguiar and Hurst (2006: 21-25) because their definitions
distinguish leisure in groups of activities, and this will benefit the analysis of how an
individual allocates his or her time. In addition, focusing on activities for allocation of
4 For example, Yamada, Yamada, and Kang (1999: 47) divided allocation of time into market and specific
non-market activities, for example, spending time with the radio and TV and sleeping.

36
time across market work, more elaborated leisure definitions lead to more accurate
findings in behavior change across time in the empirical analysis.

37
Table 2.1 Leisure Activity Classification
Leisure Classification Activities included
"Leisure Measure 1"
"Leisure Measure 2"
"Leisure Measure 3"
"Leisure Measure 4"
Summation of time spent on "entertainment/social activities
relaxing and "active recreation"
- Time use for culture, entertainment, and attending sport
activities, for instance, watching movies and plays,
attending concerts, going to the zoo, amusement parks,
entertainment centers, visiting museums and cultural sights
for entertainment purposes
- Indoor and outdoor sports and recreation and exercising
- Hobbies, games and free time activities
- Media use unrelated to work and for learning purposes
or instance, reading, listening to the radio or other voice media
watching television and Internet use
- Activities related to relaxation
Leisure Measure 1, plus time spent on sleeping,
eating, and personal care
Leisure Measure 2, plus time spent on primary and educational
childcare
Leisure Measure 3, plus time spent on education, civic and
religious activities, caring for other adults as well as
one‟s own medical care
- Education, learning activities and training
for instance, taking classes for degrees, personal interest
courses, and homework
- Participation in the community and volunteering
- Social activities
- Caring for other adults, one‟s own medical care and by others
- Religious activities,
for instance, praying, meditating and religious activity participation
Source: Aguiar and Hurst, 2007: 969-1006.

38
2.4 Model Specification
The study of leisure and determinants requires detailed data on types of activities,
their time lengths, and socio-economic characteristics. In this study, data from Thailand‟s
Time Use Survey 2001 and 2004 by the National Statistical Office (NSO) are applied to
examine Thai people‟s determinants of leisure time. The cross-sectional data obtained are
the combination of direct interview and self-completed questionnaires during the second
week of August 2004. One problem is that the Time Use Survey did not provide wage or
income data. Therefore, this study has to use individual‟s wage and income from the
Labor Force Survey of August 2001 and 2004 by merging each pair of the two data sets,
the Time Use Survey and Labor Force Survey, in order to obtain information on both
individual‟s time use and earning.
Collected simultaneously, the Time Use Survey and Labor Force Survey focused
on dissimilar sets of respondents‟ information. The Time Use Survey attempted to
measure the numerous and diverse ways in which people used in the previous 24 hours,
while the Labor Force Survey mainly emphasized wage, income, work, and employment
status. The first set of data for 2001, with 51,807 observations, was detailed in time use
and activities, whereas the latter, with 67,813 observations, provided fruitful data on
wages and other gains from work. After merging the data, there were 51,172 observations
for which time use and earning details were available. For 2004, there were 54,568
observations of the Time Use Survey to be merged with 67,083 observations of the Labor
Force Survey in order to obtain the merged data with 7,177 observations. In order to
avoid the problem of respondent‟s irregular activities or schedule, only the responses
recorded as “usual scheduled” on the day interviewed were taken into the research.
The data from the Time Use Survey and Labor Force Survey employed in the
regressions includes time for leisure, age, gender, marital status, education, hourly wages,
status in the household (household head or member), respondent‟s area (municipal and
non-municipal), occupation, industry, and firm‟s size. The details on how people with
different socio-economic characteristics allocate their time for leisure are presented in
Table 2.2 and Table 2.3 for 2001 and 2004, respectively.

39
Table 2.2 Descriptive Statistics of Leisure Time of the Thai People in 2001
Separated by Gender
Male
Leisure Measure 1 22,003 264 198.75 0 1,220
Leisure Measure 2 22,003 929 223.31 90 1,440
Leisure Measure 3 22,003 939 225.68 90 1,440
Leisure Measure 4 22,003 979 245.48 90 1,440
Female
Leisure Measure 1 25,939 240 173.26 0 1,139
Leisure Measure 2 25,939 896 224.41 206 1,440
Leisure Measure 3 25,939 928 235.17 206 1,440
Leisure Measure 4 25,939 969 251.03 206 1,440
Separated by Income Level
Low Income Group
Leisure Measure 1 3,083 215 147.02 0 1,220
Leisure Measure 2 3,083 856 174.92 290 1,440
Leisure Measure 3 3,083 870 179.22 290 1,440
Leisure Measure 4 3,083 884 185.42 290 1,440
Middle Income Group
Leisure Measure 1 7,450 191 135.91 0 975
Leisure Measure 2 7,450 804 170.56 90 1,440
Leisure Measure 3 7,450 816 174.50 90 1,440
Leisure Measure 4 7,450 822 177.03 90 1,440
Min MaxNumber of
Observations
Average Leisure
per Day (Min.)
Standard
Deviation

40
Table 2.2 (Continued)
Number of
Observations
Average Leisure
per Day (Min.)
Standard
Deviation Min Max
High Income Group
Leisure Measure 1 37,152 266 182.75 0 1,139
Leisure Measure 2 37,152 937 230.86 137 1,440
Leisure Measure 3 37,152 962 236.59 158 1,440
Leisure Measure 4 37,152 1,012 252.28 158 1,440
Separated by Educational Level
No Education
Leisure Measure 1 2,862 305 208.75 0 1,139
Leisure Measure 2 2,862 1,057 268.81 281 1,440
Leisure Measure 3 2,862 1,083 268.04 281 1,440
Leisure Measure 4 2,862 1,101 265.84 300 1,440
Primary School
Leisure Measure 1 27,277 254 178.01 0 1,220
Leisure Measure 2 27,277 920 225.03 90 1,440
Leisure Measure 3 27,277 944 232.23 90 1,440
Leisure Measure 4 27,277 963 239.91 90 1,440
Secondary School
Leisure Measure 1 7,044 244 171.16 0 1,004
Leisure Measure 2 7,044 891 207.05 260 1,440
Leisure Measure 3 7,044 908 212.64 260 1,440
Leisure Measure 4 7,044 1,042 264.04 260 1,440
High School
Leisure Measure 1 2,650 244 167.07 0 1,080
Leisure Measure 2 2,650 875 198.39 165 1,440
Leisure Measure 3 2,650 892 201.26 165 1,440
Leisure Measure 4 2,650 996 254.30 165 1,440

41
Table 2.2 (Continued)
College
Leisure Measure 1 3,952 229 154.72 0 1,091
Leisure Measure 2 3,952 841 195.75 224 1,440
Leisure Measure 3 3,952 858 200.74 224 1,440
Leisure Measure 4 3,952 869 206.06 224 1,440
Separated by Marital Status
Single
Leisure Measure 1 11,030 257 177.95 0 1,050
Leisure Measure 2 11,030 908 213.63 260 1,440
Leisure Measure 3 11,030 912 215.35 260 1,440
Leisure Measure 4 11,030 1,056 264.38 260 1,440
Married
Leisure Measure 1 31,010 239 167.69 0 1,220
Leisure Measure 2 31,010 890 212.08 90 1,440
Leisure Measure 3 31,010 918 221.59 90 1,440
Leisure Measure 4 31,010 927 224.44 90 1,440
Divorced/ Separated and Others
Leisure Measure 1 5,645 308 206.16 0 1,139
Leisure Measure 2 5,645 1,033 270.90 260 1,440
Leisure Measure 3 5,645 1,058 271.65 260 1,440
Leisure Measure 4 5,645 1,074 273.15 260 1,440
Separated by Age
Age 15-24
Leisure Measure 1 8,378 248 176 0 1,050
Leisure Measure 2 8,378 901 206.58 260 1,440
Leisure Measure 3 8,378 917 213.38 260 1,440
Leisure Measure 4 8,378 1,102 259.27 260 1,440
Number of
Observations
Average Leisure
per Day (Min.)
Standard
Deviation Min Max

42
Table 2.2 (Continued)
Age 25-44
Leisure Measure 1 20,969 222 156.51 0 1,220
Leisure Measure 2 20,969 853 191.26 137 1,440
Leisure Measure 3 20,969 880 202.32 158 1,440
Leisure Measure 4 20,969 887 204.83 158 1,440
Age 45-60
Leisure Measure 1 11,287 244 165.26 0 1,127
Leisure Measure 2 11,287 894 204.38 90 1,440
Leisure Measure 3 11,287 914 214.62 90 1,440
Leisure Measure 4 11,287 923 217.12 90 1,440
Age more than 60
Leisure Measure 1 7,051 353 210.67 0 1,139
Leisure Measure 2 7,051 1,124 244.21 320 1,440
Leisure Measure 3 7,051 1,143 242.62 320 1,440
Leisure Measure 4 7,051 1,162 239.49 329 1,440
Separated by Area
Municipal
Leisure Measure 1 29,554 252 178.42 0 1,220
Leisure Measure 2 29,554 909 229.49 165 1,440
Leisure Measure 3 29,554 930 235.74 165 1,440
Leisure Measure 4 29,554 973 254.98 165 1,440
Non-municipal
Leisure Measure 1 18,131 249 173.21 0 1,127
Leisure Measure 2 18,131 915 216.96 90 1,440
Leisure Measure 3 18,131 239 223.60 90 1,440
Leisure Measure 4 18,131 976 238.60 90 1,440
Number of
Observations
Average Leisure
per Day (Min.)
Standard
Deviation Min Max

43
Table 2.2 (Continued)
Large
Leisure Measure 1 37,220 264 180.80 0 1,139
Leisure Measure 2 37,220 932 229.78 137 1,440
Leisure Measure 3 37,220 957 235.62 158 1,440
Leisure Measure 4 37,220 1,007 252.03 158 1,440
Small
Leisure Measure 1 10,465 206 151.66 0 1,220
Leisure Measure 2 10,465 836 187.88 90 1,440
Leisure Measure 3 10,465 848 192.07 90 1,440
Leisure Measure 4 10,465 856 196.22 90 1,440
Separated by Industry
Agricultural
Leisure Measure 1 12,386 239 152.57 0 970
Leisure Measure 2 12,386 895 170.11 137 1,440
Leisure Measure 3 12,386 910 174.96 158 1,440
Leisure Measure 4 12,386 922 180.71 158 1,440
Manufacturing
Leisure Measure 1 4,190 196 140.75 0 975
Leisure Measure 2 4,190 818 180.69 260 1,440
Leisure Measure 3 4,190 832 184.58 260 1,440
Leisure Measure 4 4,190 839 189.14 260 1,440
Service
Leisure Measure 1 31,109 264 187.55 0 1,220
Leisure Measure 2 31,109 930 244.82 90 1,440
Leisure Measure 3 31,109 956 251.11 90 1,440
Leisure Measure 4 31,109 1,013 268.56 90 1,440
Separated by Size of the Firm Individuals Work for
Number of
Observations
Average Leisure
per Day (Min.)
Standard
Deviation Min Max

44
Table 2.2 (Continued)
Separated by Occupation
Professionals and Executives
Leisure Measure 1 4,875 208 140.93 0 1,080
Leisure Measure 2 4,875 827 176.81 239 1,440
Leisure Measure 3 4,875 837 179.55 239 1,440
Leisure Measure 4 4,875 845 182.09 239 1,440
High-skilled and Machine Related Operators
Leisure Measure 1 5,457 212 152.60 0 1,220
Leisure Measure 2 5,457 844 188.34 90 1,440
Leisure Measure 3 5,457 857 192.46 90 1,440
Leisure Measure 4 5,457 864 196.88 90 1,440
Technicians and Associate Professionals
Leisure Measure 1 1,367 216 144.91 0 810
Leisure Measure 2 1,367 826 178.60 165 1,440
Leisure Measure 3 1,367 838 178.97 165 1,440
Leisure Measure 4 1,367 845 181.79 165 1,440
Clerk, Sales and Service Workers
Leisure Measure 1 7,566 192 146.13 0 1,127
Leisure Measure 2 7,566 802 182.50 200 1,440
Leisure Measure 3 7,566 818 188.31 200 1,440
Leisure Measure 4 7,566 829 194.38 200 1,440
Skilled Agricultural Related Workers
Leisure Measure 1 11,219 240 152.46 0 970
Leisure Measure 2 11,219 895 169.49 137 1,440
Leisure Measure 3 11,219 910 174.31 158 1,440
Leisure Measure 4 11,219 923 179.63 158 1,440
Number of
Observations
Average Leisure
per Day (Min.)
Standard
Deviation Min Max

45
Table 2.2 (Continued)
Source: Author‟s calculation, using Time Use Survey 2001 and Labor Force Survey
2001 data.
Low-skilled and Elementary Occupations
Leisure Measure 1 3,609 203 145.35 0 1,000
Leisure Measure 2 3,609 830 183.41 232 1,440
Leisure Measure 3 3,609 841 187.51 232 1,440
Leisure Measure 4 3,609 850 194.85 232 1,440
Number of
Observations
Average Leisure
per Day (Min.)
Standard
Deviation Min Max

46
Table 2.3 Descriptive Statistics of Leisure Time of the Thai People in 2004
Separated by Gender
Male
Leisure Measure 1 3,754 167 113.63 0 830
Leisure Measure 2 3,754 807 148.66 230 1,440
Leisure Measure 3 3,754 808 149.16 230 1,440
Leisure Measure 4 3,754 850 159.29 230 1,440
Female
Leisure Measure 1 3,423 144 104.11 0 780
Leisure Measure 2 3,423 763 137.78 230 1,440
Leisure Measure 3 3,423 765 138.13 230 1,440
Leisure Measure 4 3,423 797 150.55 260 1,440
Separated by Income Level
Low Income Group
Leisure Measure 1 1,639 182 127.59 0 810
Leisure Measure 2 1,639 847 167.08 310 1,440
Leisure Measure 3 1,639 850 169.13 310 1,440
Leisure Measure 4 1,639 910 205.52 310 1,440
Middle Income Group
Leisure Measure 1 4,783 163 123.77 0 840
Leisure Measure 2 4,783 803 171.21 130 1,440
Leisure Measure 3 4,783 805 171.70 130 1,440
Leisure Measure 4 4,783 851 195.59 130 1,440
Number of
Observations
Average Leisure
per Day (Min.)
Standard
Deviation Min Max

47
Table 2.3 (Continued)
High Income Group
Leisure Measure 1 1,643 201 136.30 0 1,020
Leisure Measure 2 1,643 822 178.36 310 1,440
Leisure Measure 3 1,643 825 177.84 310 1,440
Leisure Measure 4 1,643 874 202.16 310 1,440
Separated by Educational Level
No Education
Leisure Measure 1 338 148 111.66 0 780
Leisure Measure 2 338 818 150.44 380 1,440
Leisure Measure 3 338 820 152.90 380 1,440
Leisure Measure 4 338 865 169.15 440 1,440
Primary School
Leisure Measure 1 2,741 147 106.10 0 830
Leisure Measure 2 2,741 789 142.43 230 1,440
Leisure Measure 3 2,741 790 143.34 230 1,440
Leisure Measure 4 2,741 827 157.93 230 1,440
Secondary School
Leisure Measure 1 953 144 103.90 0 660
Leisure Measure 2 953 783 144.82 260 1,440
Leisure Measure 3 953 784 145.12 260 1,440
Leisure Measure 4 953 822 157.61 260 1,440
High School
Leisure Measure 1 587 173 117.55 0 780
Leisure Measure 2 587 794 158.59 300 1,440
Leisure Measure 3 587 795 158.44 300 1,440
Leisure Measure 4 587 835 168.13 300 1,440
Number of
Observations
Average Leisure
per Day (Min.)
Standard
Deviation Min Max

48
Table 2.3 (Continued)
College
Leisure Measure 1 1,650 176 114.14 0 830
Leisure Measure 2 1,650 780 145.64 310 1,440
Leisure Measure 3 1,650 783 145.12 310 1,440
Leisure Measure 4 1,650 820 155 310 1,440
Separated by Marital Status
Single
Leisure Measure 1 2,401 154 113.66 0 830
Leisure Measure 2 2,401 789 150.31 260 1,440
Leisure Measure 3 2,401 790 150.55 260 1,440
Leisure Measure 4 2,401 831 165.25 260 1,440
Married
Leisure Measure 1 4,224 158 107.26 0 780
Leisure Measure 2 4,224 784 142.24 230 1,440
Leisure Measure 3 4,224 786 142.62 230 1,440
Leisure Measure 4 4,224 821 154.25 230 1,440
Divorced/ Separated and Others
Leisure Measure 1 552 146 111.46 0 700
Leisure Measure 2 552 781 145.23 130 1,430
Leisure Measure 3 552 785 146.15 130 1,430
Leisure Measure 4 552 825 159.28 350 1,430
Separated by Age
Age 15-24
Leisure Measure 1 1,244 145 110.46 0 760
Leisure Measure 2 1,244 785 154.66 260 1,440
Leisure Measure 3 1,244 784 154.71 260 1,440
Leisure Measure 4 1,244 828 168.52 260 1,440
Number of
Observations
Average Leisure
per Day (Min.)
Standard
Deviation Min Max

49
Table 2.3 (Continued)
Age 25-44
Leisure Measure 1 3,608 155 109.54 0 830
Leisure Measure 2 3,608 781 144.80 130 1,440
Leisure Measure 3 3,608 782 144.99 130 1,440
Leisure Measure 4 3,608 815 153.39 310 1,440
Age 45-60
Leisure Measure 1 2,128 164 110.30 0 780
Leisure Measure 2 2,128 791 138.62 230 1,440
Leisure Measure 3 2,128 793 139.53 230 1,440
Leisure Measure 4 2,128 833 153.70 230 1,440
Age more than 60
Leisure Measure 1 197 161 98.53 0 600
Leisure Measure 2 197 828 153.21 380 1,440
Leisure Measure 3 197 828 153.21 380 1,440
Leisure Measure 4 197 880 179 480 1,440
Separated by Area
Municipal
Leisure Measure 1 4,959 159 111.73 0 830
Leisure Measure 2 4,959 787 146.69 130 1,440
Leisure Measure 3 4,959 789 146.79 130 1,440
Leisure Measure 4 4,959 824 157.56 310 1,440
Non-Municipal
Leisure Measure 1 2,118 149 105.07 0 780
Leisure Measure 2 2,118 782 141.85 230 1,440
Leisure Measure 3 2,118 783 142.79 230 1,440
Leisure Measure 4 2,118 826 157.09 230 1,440
Number of
Observations
Average Leisure
per Day (Min.)
Standard
Deviation Min Max

50
Table 2.3 (Continued)
Large
Leisure Measure 1 2,042 180 113.14 0 830
Leisure Measure 2 2,042 789 146.15 130 1,440
Leisure Measure 3 2,042 792 145.38 130 1,440
Leisure Measure 4 2,042 833 156.42 200 1,440
Small
Leisure Measure 1 5,135 146 106.94 0 830
Leisure Measure 2 5,135 784 144.85 230 1,440
Leisure Measure 3 5,135 786 145.64 230 1,440
Leisure Measure 4 5,135 822 157.70 230 1,440
Agricultural
Leisure Measure 1 908 159 105.12 0 630
Leisure Measure 2 908 818 142.25 230 1,440
Leisure Measure 3 908 820 143.77 230 1,440
Leisure Measure 4 908 867 164.96 230 1,440
Manufacturing
Leisure Measure 1 1,714 136 104.05 0 830
Leisure Measure 2 1,714 756 144.16 360 1,440
Leisure Measure 3 1,714 757 145.02 360 1,440
Leisure Measure 4 1,714 788 153.50 360 1,440
Service
Leisure Measure 1 4,555 163 111.92 0 830
Leisure Measure 2 4,555 790 144.33 130 1,440
Leisure Measure 3 4,555 792 144.21 130 1,440
Leisure Measure 4 4,555 830 154.45 260 1,440
Min Max
Separated by Industry
Separated by Size of the Firm Individuals Work for
Number of
Observations
Average Leisure
per Day (Min.)
Standard
Deviation

51
Table 2.3 (Continued)
Leisure Measure 1 1,211 175 114.20 0 770
Leisure Measure 2 1,211 780 148.95 310 1,440
Leisure Measure 3 1,211 783 148.55 310 1,440
Leisure Measure 4 1,211 827 162.96 310 1,440
Leisure Measure 1 2,064 145 105.61 0 830
Leisure Measure 2 2,064 783 144.63 350 1,440
Leisure Measure 3 2,064 784 145.62 350 1,440
Leisure Measure 4 2,064 819 154.68 350 1,440
Leisure Measure 1 704 178 121.63 0 740
Leisure Measure 2 704 804 158.66 300 1,430
Leisure Measure 3 704 805 158.07 300 1,430
Leisure Measure 4 704 840 169.31 300 1,440
Leisure Measure 1 1,379 145 103.89 0 830
Leisure Measure 2 1,379 769 136.30 130 1,440
Leisure Measure 3 1,379 771 136.41 130 1,440
Leisure Measure 4 1,379 805 143.63 400 1,440
Leisure Measure 1 498 162 111.11 0 630
Leisure Measure 2 498 804 149.60 230 1,440
Leisure Measure 3 498 805 150.77 230 1,440
Leisure Measure 4 498 865 175.52 230 1,440
Clerk, Market Sales and Service Workers
Professionals and Executives
High-skilled and Machine Related Workers
Technicians and Associate Professionals
Skilled Agricultural Related Workers
Separated by Occupation
Number of
Observations
Average Leisure
per Day (Min.)
Standard
Deviation Min Max

52
Table 2.3 (Continued)
Source: Author‟s calculation, using Time Use Survey 2004 and Labor Force Survey
2004 data.
Leisure Measure 1 1,320 152 106.92 0 780
Leisure Measure 2 1,320 796 140.29 260 1,440
Leisure Measure 3 1,320 797 140.97 260 1,440
Leisure Measure 4 1,320 829 152.91 260 1,440
Number of
Observations
Average Leisure
per Day (Min.)
Standard
Deviation Min Max
Low-skilled and Elementary Occupations

53
Table 2.2 and 2.3 illustrate the amount of time for Leisure Measure 1-4 of Thai
people separated by different socio-economic characteristics in 2001 and 2004. The data
suggest that even with less amount of time in the latter year, males still took longer
leisure time per day in all measures than females did. One reason explaining the finding
is that females devote more time to housework and home production.5 This corresponds
to Beblo and Robledo‟s (2008: 300) explanation of the social structure in which males
“make the first move,” implying that males have an opportunity to choose to work in the
market only while females are responsible to work both in the market and do housework
and home production. Hence, females corresponded to non-market work, especially
housework. Considering the Thai‟s leisure time at different ages classified by worker
groups, as in Forbes, Barker and Turner (2010: 37), it is not surprising that the old, in
their retired years, took the longest leisure time, while those aged 25-44 spent the shortest
time because this group provided greater enthusiasm for market work. Separated by
marital status, the married seemed to set aside less time for leisure than singles for
Leisure Measure 1, which gave direct enjoyment, since the married were likely to have
more burdens with the market, non-market work, and childcare. Notice that when leisure
includes childcare, Leisure Measure 3, it appears that the married took longer leisure time
than singles in 2001, though the first group provided less amount of leisure time in the
narrower measure, Leisure Measure 1, when time for childcare as not included. Even
though it was anticipated that those living in municipal and non-municipal areas possibly
allocate time dissimilarly, the time spent for leisure in each measure was not so different
according to the data. Nevertheless, the leisure time gaps for leisure were wider for the
broader leisure measures.
The classification of income group is as follows; the low income group included
people whose income was in Percentile 1-20; the middle income group ranged from
Percentile 21-80; and those in Percentile 81-100 were categorized the high income group.
According to the data, workers in the middle income group consumed the least amount of
5 According to Time Use Survey 2004, females spent approximately 250 minutes per day for housework
and home production, while males allocated merely 207 minutes for those activities, and in 2001 females
dedicated 201 minutes, compared with 149 minutes per day, compared to males for those non-market
activities. The finding corresponded to much empirical research, for example, Ilahi (2000: 6-7), Schettkat
(2003: 7) and Aguiar and Hurst (2006: 45-46).
54
leisure time, whereas those that earned comparatively low income had the longest leisure
time compared with others. This indicates that the lowest earners are possibly less
enthusiastic for more work time or the job positions for this group of people were not
provided. The result is supported by the descriptive statistics of Thai people‟s leisure time
according to education if the higher educational level group earning a higher income is
assumed.
Data for both two years indicate that people working in large size firms, with
greater than 200 employees, evidently consumed more leisure time than those employed
by smaller size firms. It is possible that the latter group was responsible for more types of
duties in practice. Furthermore, among the three industries, those working in the
manufacturing sector spent the least time for leisure in all measures, while employees in
the agriculture industry devoted the greatest amount of time for leisure and non-work
activities.
From the descriptive data, how leisure time, individual‟s wage, and other socio-
economic characteristics are related could not be clearly concluded. In the next section,
estimation of leisure in a variety measures in different model specifications using socio-
economic characteristics is elaborated to find the determinants of leisure, using the Time
Use Survey and Labor force Survey.
2.5 Model Estimation
The study focuses on the behavior of Thai people‟s time use for leisure, the non-
market activity that raises an individual‟s utility and welfare. As mentioned, empirical
evidence confirms that wage and some socio-economic characteristics, for instance,
gender and marital status, as well as the influence of the day of the week, did impact each
person‟s leisure time. By employing Thailand‟s Time Use Survey and Labor Force
Survey 2001 and 2004, regressions for the factors influencing leisure time were estimated
by using the least square for each leisure measure. Besides hourly wage and monthly
income, the variables employed include age, square of age, education dummies—
separated into no education, primary, secondary, high school and college graduates,
marital status—as divided into single, married, and others, household head dummy,
area—municipal and non-municipal, occupation—as divided into professionals and

55
executives, technicians, high-skilled and machine related workers, sales, services and
clerk, agricultural related and low skilled workers, the industry that each person is
working for—agricultural, manufacturing and service, firm size of employments—large
for those of at least 100 employees, and small for the firm employing fewer than 100
workers, and day of the week dummies as fixed effect because these factors also
impacted an individual‟s leisure and time allocation, as mentioned previously. Since this
study focuses on the exploration of the relationship between leisure time and monthly
income as well as hourly wage, only the wage workers whose wage and income data are
observed are included in the estimations.
The regression analysis is mainly divided into two different estimation functions.
The first model aims to find how leisure adjusts in response to the increase or decrease in
hourly wage and monthly income. Thus, the estimated regression function takes the form
as follows:
(1) Leisureij = αA + β1wagei + β2 monthly incomei + ASi + ADi + i
where i = 1,… n and j = 1,…,4. Leisureij denotes leisure time in minutes; wagei and
monthly incomei represent hourly wage and monthly income respectively. S refers to
other socio-economic demographic variables, consisting of gender, age, age2, education
dummies, marital status, area, occupation, industry and firm size dummy, and D
represents day of the week. Model (2), presenting percentage of leisure time change in
response to percentage change in hourly wage and monthly income and other socio-
economic characteristics, is formally presented as follows:
(2) ln [Leisureij] = αB + λ1ln[wagei] + λ2 [monthly incomei] +BSi + BDi + εi
This indicates how a percentage change in hourly wage and other variables
influences leisure time changes. The parameters estimated from those different model
specifications are displayed in Table 2.4 and Table 2.5. Table 2.4 presents the estimates
of Leisure Measure 1-4, whereas Table 2.5 provides the regression results of changes in
Leisure Measure 1-4. The findings are presented in the next section.

56
2.6 Empirical Analysis
Comparing leisure time between the two genders, females use less leisure time
than males for all income earners. Females consume less leisure time in narrow measures
(Measure 1)—about 29 minutes a day or 14.5 hours per month. As leisure includes
personal care (Leisure Measure 2), the leisure gap between the two genders expands to 32
minutes per day, or greater than 16 hours a month, which equals the result of the
regression for leisure as a residual of work (Leisure Measure 4). However, when
childcare is included in the leisure activity list, Leisure Measure 3, the leisure gap for the
two genders is approximately 29 minutes a day.
The dissimilarity in leisure time between people of different educational levels
was also found in the regressions. The distinction of leisure time allocation is reflected in
the result for Leisure Measure 1 estimation. The university graduates take relatively the
longest leisure time, more than 4 hours a month, compared with the uneducated group,
whereas high school graduates consume leisure time for direct enjoyment at about 3
hours longer per month. The estimations for leisure gaps in broader measures for various
educational level earners could not confirm the differences of the leisure time of those
people. The estimation also reveals the unequal amount of leisure time for people of
different marital status. With 99% confidence, the married consume 10 minutes per day
or 5 hours a month less for leisure compared with singles for leisure time pursuing direct
enjoyment, Leisure Measure 1, whereas people of marital status other than single or
married took 4.5 hours less a month for the same leisure measure.
Not only do education and marital status influence leisure time allocation, but also
status in the household indicates leisure time use. Estimation for all measures of leisure
indicates that the household head significantly consumes more leisure time than other
members. Each month the household head allocates more time for leisure giving direct
enjoyment or Leisure Measure 1 than others by almost 3 hours. When leisure is in more
broadly measure, the leisure gaps between the two groups are expanded to 25-26 minutes
a day or 12.5-13 hours per month. The longer leisure time as a residual of work implies
that household heads have a shorter market work and non-market work time in total. The
result from the exploration of household head‟s gender reveals that there are in total more
than 16,662 observations of male household heads, while there are only 7,162 female

57
household heads. As mentioned, the study found that males substantially consume greater
leisure time in all measures than females. A high proportion of male household heads is
one of the factors explaining the longer time length of leisure of these individuals.
The regression cannot find a substantial difference in leisure time allocation
among people in different occupations. Taking elementary occupation, for example, low-
skilled workers, only clerks, and sales and service workers significantly take time for
Leisure Measure 1, more than 12 minutes a day or 6 hours a month greater, while for
other measures of leisure, high-skilled machine-related workers consume apparently take
more leisure time at about 11-15 minutes a day or 5.5-7.5 hours a month. Among the
three industries, people working in agricultural-related industries consume comparatively
greater leisure time than those working in manufacturing or the service industry. The
broader the measure of leisure, the wider are the leisure gaps among people in different
industries. Manufacturing industry workers take 25-87 minutes daily or 2.5-43 hours
monthly less leisure time than those in the agricultural industry, while workers in the
service sector spend less than 11-51 minutes per day on leisure or 5.5-25.5 hours per
month less. The result of the regression also reveals that the size of the firm that each
worker is working in influences leisure time. People working in small firms, whose size
is fewer than 200 employees, substantially spend less time for leisure. The gap of leisure
for direct enjoyment, Leisure Measure 1, is nearly 18 minutes a day or 9 hours a month.
When leisure time includes time for personal care activities, Leisure Measure 2, time for
childcare, Leisure Measure 3, and activities excluding work, or Leisure Measure 4, the
leisure gaps are not so different.
Among the 7 days of the week, it is not surprising that people take the longest
leisure time on Sunday. The differences in leisure time between Sunday and other days
are substantial, especially when compared with the magnitudes of other socio-economic
characteristic effects. It appears that people do not allocate the least time for leisure on
Monday, but on Thursday. Evidently, people consume leisure less than on Sunday by at
least almost 58 minutes a day when leisure is defined narrowly. When leisure is defined
as the residual of work, there is more than a one hour and a half per day gap between
Thursday and Sunday.
Comparing the two years used for estimation, 2001 and 2004, the findings
indicate that Thai people spend less leisure time in all measures. Thai people consume
58
less leisure time for direct enjoyment at approximately 25 minutes a day or 12.5 hours a
month, whereas the time as a residual of work is reduced by more than 1 hour a day in the
latter year. This indicates a dramatic reduction in leisure time on the broadest measure of
leisure in the latter year6.
Consider how leisure time changes in response to an individual‟s time change, the
slightly adverse effect on leisure time in all measures except Leisure Measure 2. A one
thousand baht increase for monthly income reduces only a few minutes on Leisure
Measure 1 and deteriorates to 7-8 minutes on Leisure Measure 3 and Leisure Measure 4,
respectively. The negative relationship, even in tiny sizes, implies that Thai people are
more willing to dedicate leisure time to work as income, the summation of wage,
overtime, average bonus per month, and other money income rises. From the robust test,
overtime was found to be strongly and negatively related to leisure time use, while bonus
received provided an inverse impact on leisure in some measures and other money
income provided a tiny positive effect on leisure. As monthly income represents the
combination of various types of earnings, the inverse effect on leisure comes from
income other than wage. Therefore, wage is the factor that more clearly explains whether
leisure is a normal good.
The regression result indicates a positive relationship between hourly wage and
leisure time. The broader measure of leisure time, the greater is the magnitude of the
effect. A one baht increase of hourly wage creates 29 minutes of time for leisure as the
activities providing direct enjoyment in a week, or almost 2 hours in a month. When
leisure includes time for sleeping, eating and personal care, the rise in response to one
baht of hourly wage increases to 45 minutes a week or 8 hours a month. For the two
broadest measures of leisure time, the same amount of increase of hourly wage rises to
approximately 45-55 minutes of leisure time. The findings on the relationship between
each measure of leisure and hourly wage indicate a significant positive correlation,
implying that Thai people are willing to devote more time to leisure as their wage per
hour rises.
6
Average time for Leisure Measure 3 in 2001 and 2004 are 909 and 825 minutes or 15 and, 13 hours and
45 minutes per day respectively.

59
Estimation of log [Leisure Time] confirms the leisure gap between men and
women. When all groups of the observations were regressed, it was seen that females
spend less time for Leisure Measure 1 by 19.5%. When the leisure measures include
more activities as those defined in Leisure Measure 2, Leisure Measure 3, and Leisure
Measure 4, the differences of the two genders in leisure time are around 5.4-5.8%. The
leisure gap is also reflected among people differently educated. The university graduates
take a longer time for pure leisure at around 13%, while it was also confirmed that high
school graduates spend time for the same type of leisure, Leisure Measure 1, at about
10.5%, compared with the uneducated group. Leisure time in the broader measures,
Leisure Measure 3 and Leisure Measure 4, of the higher educated people are about 1.1%-
1.4% more than the uneducated group.
The estimation for Leisure Measure 1 confirms only leisure time differences
among the single, the married, and those of other marital status of high income workers.
The married allocate less time to leisure pursuing direct enjoyment at about 10%, while
singles spend a greater length of time than those of other status at for around 30%.
Leisure gaps become smaller as broader leisure measures are estimated. When leisure
time is defined to include time for personal care and sleeping, as with Leisure Measure 2,
the finding indicates that the married allocate the shortest leisure time, at 2.43% less,
while people of other status consume only 1.86% less.
Among workers in different occupations, professionals significantly take less pure
leisure time at approximately 15% lower than low-skilled workers, while clerks and
service workers allocate less time for Leisure Measure 1 at around 12%. As with the
other findings, leisure gaps appear smaller when broader measures are taken into
consideration. For example, for leisure as the residual of work, Leisure Measure 4,
professionals spend more non-work time at around 1.8%, whereas high-skilled workers
and technicians allocate time for leisure at 2.2%-2.6% more than low-skilled workers.
People working in the manufacturing industry appear to spend less time on leisure in all
measures than those in the agricultural sector at around 6% and a shorter length of time
than workers in the service sector by about 2%. Additionally, manufacturing sector
workers allocate less time for Leisure Measure 2-4 than those in the agricultural sector at
around 7%, while workers in the service sector spend time for the same types of leisure at

60
around 3% less. The empirical result confirms that workers in the agricultural sector
comparatively spend more leisure time than others.
The exploration as to whether firm size influences a worker‟s leisure time
indicates that those working in large firms consume more leisure time generating direct
enjoyment, Leisure Measure 1, at around 7%, while allocating comparatively less leisure
time for broader measures. The broader the leisure measure, the narrower is the leisure
time gap, even with little difference. Workers in smaller size firms take less time spent
for Leisure Measure 2-4 at about 1.7%-1.9%. The finding from the study reveals that
Thai people in municipal and non-municipal areas consume leisure time differently. For
leisure pursuing direct enjoyment, Leisure Measure 1, workers in municipal areas appear
to spend 5.9% greater leisure time. The gaps reduce to 1.3%-1.7% as broader leisure
measures are estimated.
The fixed effect of the days of the week confirms the significant relationship
between leisure time change and day dummies as the variables are estimated. The leisure
gaps are not the widest on Monday or Sunday, but on Thursday and Sunday, with 21.9%
for Leisure Measure 1 and 13.4%-13.6% for Leisure Measure 2 and Leisure Measure 3,
while the gap is highest on Friday when leisure is defined as a residual of work, at 14%.
Differences in leisure time on weekdays appear to be not so high. Again, the empirical
findings confirm that leisure time is likely to be the lowest on either Thursday or Friday,
not Monday.
The empirical findings also suggest that age only slight affects leisure time
change. A ten-year increase deteriorates leisure time by approximately 2.3%-2.5% for
Leisure Measure 2 and Leisure Measure 3, respectively. The impact is the highest for
Leisure Measure 4, which shows about 3.2% in response to a ten-year increase of age.
The evidence from the leisure time change regression confirms the decreasing trend of
leisure time from 2001 to 2004. People spend less time for leisure as the activities
pursuing direct enjoyment, Leisure Measure 1, at around 55.5%. However, for leisure in
broader measures, the leisure time gaps appear to be about 1.3%-2.2% narrower.
The rise in income per month provides a negative effect on leisure time change.
Time for Leisure Measure 1 is the most affected by income increase, with a 44.8%
inverse change in leisure time. Leisure Measure 4 or non-work time is the most
influenced by monthly income change, as presented by a 14.2% inverse change. A one
61
percentage increase in monthly income causes a fall in Leisure Measure 2-4 at around 11-
14%. Similarly, a negative relationship between leisure time change and income change
as caused by income other than wage. Hence, to explore whether leisure is a normal
good, how leisure time changes in response to wage per hour increase or decrease could
be better used for interpretation. Considering the relationship between leisure time
change and hourly wage change, a one percent of hourly wage increase enhances time for
Leisure Measure 1 by approximately 44.7%. Again, leisure gaps become narrower as
leisure is defined in broader measures. A percent upward change in hourly wage raises
leisure time by approximately 9.66%-11.8%. Like the results obtained from regressing
leisure time and hourly wage, the findings confirm a positive relationship between
percentage change in both leisure time and hourly wage, which implies that leisure is a
normal good for the Thai people.

62
Table 2.4 Estimation of Leisure Time, Pooling Data of 2001 and 2004
Independent Variables
Leisure Time (Minutes)
Leisure Leisure Leisure Leisure
Measure 1 Measure 2 Measure 3 Measure 4
Hourly wage 4.22*** 6.40*** 6.62*** 7.80***
(0.38) (0.71) (0.72) (0.73)
Monthly income -0.004*** -0.007*** -0.007*** -0.009***
(0.0003) (0.0006) (0.0006) (0.0006)
Age 0.15 -1.84** -2.07** -3.01***
(0.47) (0.88) (0.89) (0.91)
Age2 -0.00002 0.03*** 0.028*** 0.04***
(0.006) (0.01) (0.011) (0.01)
Female (Male as the -29.55*** -32.21*** -29.16*** -31.94***
reference) (2.05) (3.80) (3.86) (3.93)
Education (No education as the reference)
Primary School -2.32 0.06 -0.60 -1.43
(2.82) (5.25) (5.33) (5.43)
Secondary School -4.56 -11.20* -12.08** -11.09*
(3.26) (6.07) (6.16) (6.27)
High School 6.90* -7.90 -5.16 -0.67
(3.96) (7.37) (7.48) (7.62)
College Graduate 8.41** -7.43 -4.07 -6.08
(3.91) (7.27) (7.38) (7.51)
Marital Status (Single as the reference)
Married -10.89*** -8.14* 4.35 -0.72
(2.32) (4.31) (4.37) (4.45)
Divorced/Separated and Others -9.35** -9.00 1.41 -1.87
(4.07) (7.56) (7.67) (7.81)
Area (Rural as the 5.64*** 12.94*** 12.92*** 9.33**
reference) (2.05) (3.82) (3.88) (3.94)

63
Table 2.4 (Continued)
Independent Variables
Leisure Time (Minutes)
Leisure Leisure Leisure Leisure
Measure 1 Measure 2 Measure 3 Measure 4
Household Head (Non- 5.95*** 26.05*** 24.80*** 26.11***
household head as the (2.09) (3.89) (3.95) (4.02)
reference)
Year 2004 (Year 2001 as -24.84*** 47.14*** 39.63*** 70.48***
the reference) (1.93) (3.60) (3.65) (3.72)
Day (Sunday as the reference)
Monday -54.23*** -83.07*** -82.91*** -90.79***
(3.99) (7.41) (7.52) (7.66)
Tuesday -45.46*** -58.89*** -59.81*** -68.83***
(3.83) (7.11) (7.22) (7.35)
Wednesday -54.59*** -70.37*** -71.56*** -79.59***
(3.78) (7.03) (7.14) (7.27)
Thursday -58.63*** -85.04*** -87.40*** -92.58***
(3.87) (7.19) (7.30) (7.44)
Friday -56.17*** -79.38*** -81.03*** -89.07***
(3.76) (6.98) (7.09) (7.21)
Saturday -22.08*** -29.78*** -30.83*** -33.78***
(3.88) (7.22) (7.33) (7.46)
Firm size: large (Small 17.69*** 14.47*** 14.70*** 15.16***
as the reference) (2.67) (4.97) (5.04) (5.13)
Occupation (Elementary as the reference)
Professionals and executives -5.97 12.52 12.48 23.08**
(4.69) (8.72) (8.85) (9.01)
Technicians 1.70 9.08 8.96 11.50
(4.23) (7.86) (7.98) (8.12)
Sales, services, and clerk -12.64*** -6.87 -5.56 -2.86
(3.30) (6.14) (6.23) (6.34)
Skilled and machinery related -0.82 11.54** 13.04** 15.01***
(2.99) (5.56) (5.64) (5.75)
Agricultural related 16.91*** 7.27 8.69 20.07**
(4.43) (8.24) (8.36) (8.51)
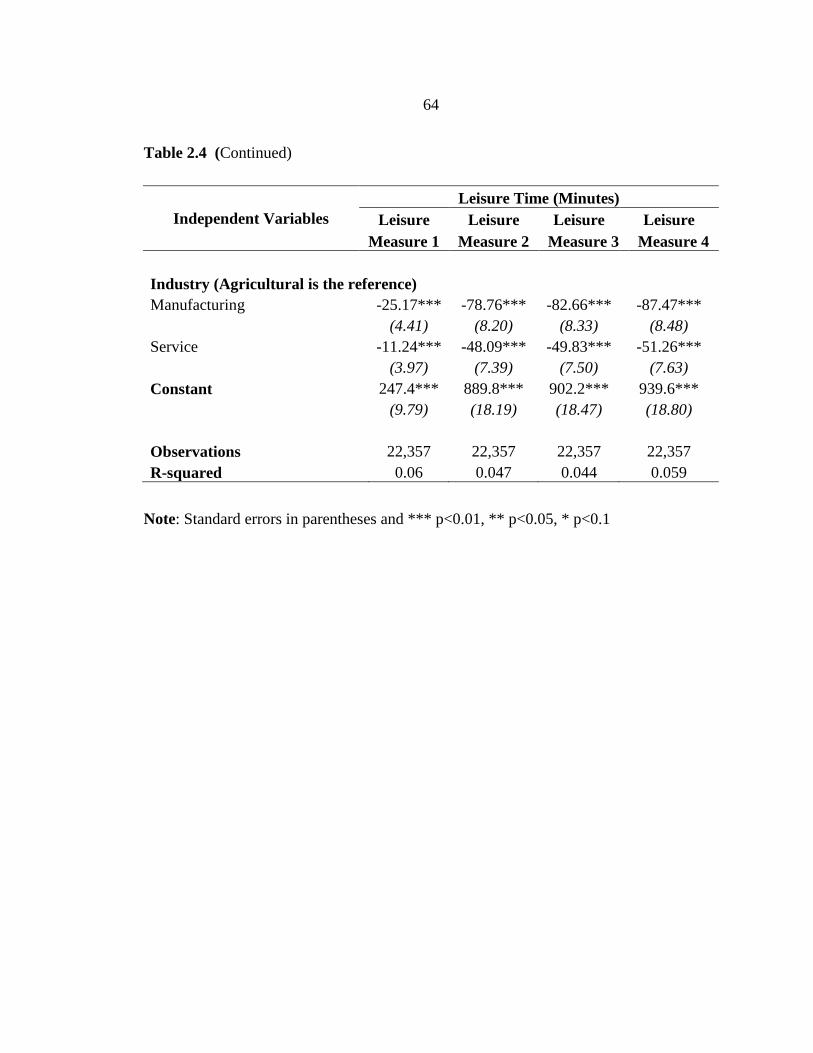
64
Table 2.4 (Continued)
Independent Variables
Leisure Time (Minutes)
Leisure Leisure Leisure Leisure
Measure 1 Measure 2 Measure 3 Measure 4
Industry (Agricultural is the reference)
Manufacturing -25.17*** -78.76*** -82.66*** -87.47***
(4.41) (8.20) (8.33) (8.48)
Service -11.24*** -48.09*** -49.83*** -51.26***
(3.97) (7.39) (7.50) (7.63)
Constant 247.4*** 889.8*** 902.2*** 939.6***
(9.79) (18.19) (18.47) (18.80)
Observations 22,357 22,357 22,357 22,357
R-squared 0.06 0.047 0.044 0.059
Note: Standard errors in parentheses and *** p<0.01, ** p<0.05, * p<0.1
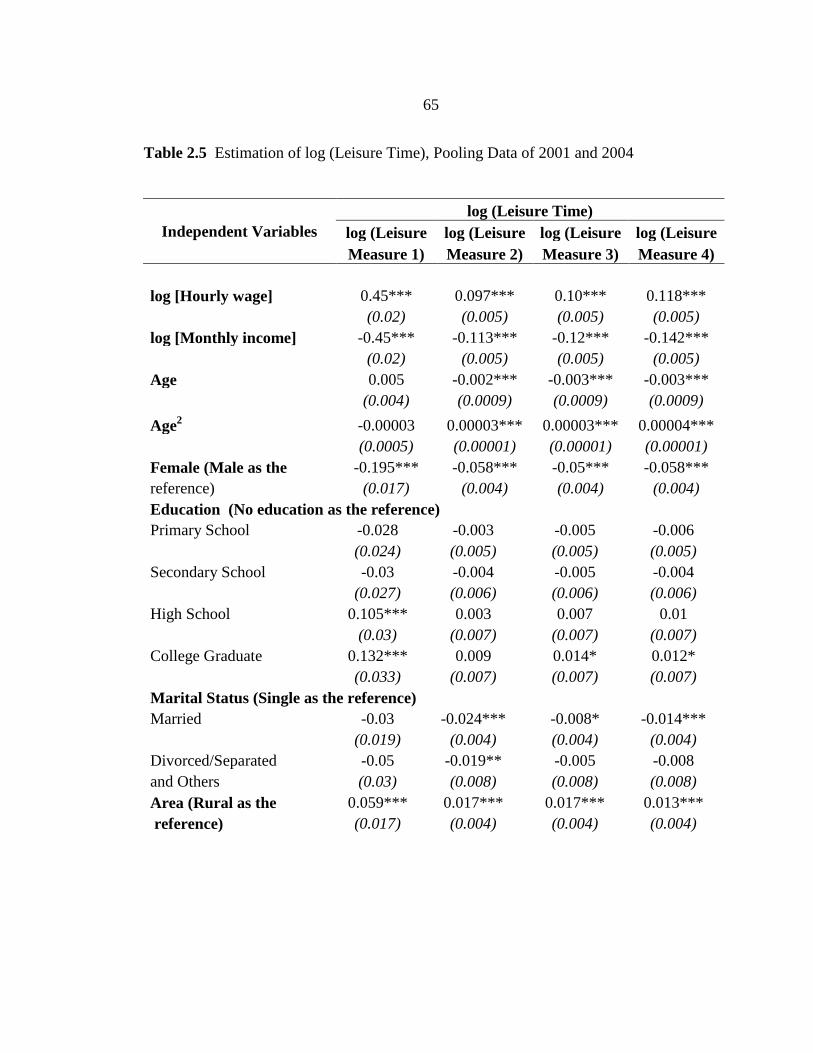
65
Table 2.5 Estimation of log (Leisure Time), Pooling Data of 2001 and 2004
Independent Variables
log (Leisure Time)
log (Leisure log (Leisure log (Leisure log (Leisure
Measure 1) Measure 2) Measure 3) Measure 4)
log [Hourly wage] 0.45*** 0.097*** 0.10*** 0.118***
(0.02) (0.005) (0.005) (0.005)
log [Monthly income] -0.45*** -0.113*** -0.12*** -0.142***
(0.02) (0.005) (0.005) (0.005)
Age 0.005 -0.002*** -0.003*** -0.003***
(0.004) (0.0009) (0.0009) (0.0009)
Age2 -0.00003 0.00003*** 0.00003*** 0.00004***
(0.0005) (0.00001) (0.00001) (0.00001)
Female (Male as the -0.195*** -0.058*** -0.05*** -0.058***
reference) (0.017) (0.004) (0.004) (0.004)
Education (No education as the reference)
Primary School -0.028 -0.003 -0.005 -0.006
(0.024) (0.005) (0.005) (0.005)
Secondary School -0.03 -0.004 -0.005 -0.004
(0.027) (0.006) (0.006) (0.006)
High School 0.105*** 0.003 0.007 0.01
(0.03) (0.007) (0.007) (0.007)
College Graduate 0.132*** 0.009 0.014* 0.012*
(0.033) (0.007) (0.007) (0.007)
Marital Status (Single as the reference)
Married -0.03 -0.024*** -0.008* -0.014***
(0.019) (0.004) (0.004) (0.004)
Divorced/Separated -0.05 -0.019** -0.005 -0.008
and Others (0.03) (0.008) (0.008) (0.008)
Area (Rural as the 0.059*** 0.017*** 0.017*** 0.013***
reference) (0.017) (0.004) (0.004) (0.004)

66
Table 2.5 (Continued)
Independent Variables
log (Leisure Time)
log (Leisure log (Leisure log (Leisure log (Leisure
Measure 1) Measure 2) Measure 3) Measure 4)
Household Head (Non- -0.01 0.003 0.001 0.003
household head as (0.017) (0.004) (0.004) (0.004)
the reference)
Year 2004 (Year 2001 -0.56*** -0.013*** -0.02*** 0.017***
as the reference) (0.016) (0.004) (0.004) (0.004)
Day (Sunday as the reference)
Monday -0.17*** -0.126*** -0.125*** -0.132***
(0.034) (0.007) (0.008) (0.008)
Tuesday -0.17*** -0.11*** -0.114*** -0.12***
(0.032) (0.007) (0.007) (0.007)
Wednesday -0.19*** -0.125*** -0.126*** -0.13***
(0.032) (0.007) (0.007) (0.007)
Thursday -0.22*** -0.134*** -0.136*** -0.14***
(0.033) (0.007) (0.007) (0.007)
Friday -0.18*** -0.132*** -0.134*** -0.14***
(0.032) (0.007) (0.007) (0.007)
Saturday -0.076** -0.075*** -0.06*** -0.08***
(0.033) (0.007) (0.007) (0.007)
Firm size: large (Small 0.071*** -0.02*** -0.019*** -0.017***
as the reference) (0.023) (0.005) (0.005) (0.005)
Occupation (Elementary as the reference)
Professionals and
executives -0.15*** 0.003 0.003 0.018**
(0.039) (0.009) (0.009) (0.009)
Technicians -0.017 0.02** 0.022*** 0.027***
(0.036) (0.008) (0.008) (0.008)

67
Table 2.5 (Continued)
Independent Variables
log (Leisure Time)
log (Leisure log (Leisure log (Leisure log (Leisure
Measure 1) Measure 2) Measure 3) Measure 4)
Sales, services, and clerk -0.12*** -0.012* -0.009 -0.003
(0.028) (0.006) (0.006) (0.006)
Skilled and machinery
related 0.004 0.017*** 0.019*** 0.022***
(0.025) (0.006) (0.006) (0.006)
Agricultural related 0.027 0.0009 0.003 0.015*
(0.036) (0.008) (0.008) (0.008)
Industry (Agricultural is the reference)
Manufacturing -0.13*** -0.066*** -0.067*** -0.07***
(0.037) (0.008) (0.008) (0.008)
Service -0.034 -0.03*** -0.03*** -0.026***
(0.033) (0.007) (0.007) (0.007)
Constant 8.49*** 7.71*** 7.77*** 7.97***
(0.18) (0.04) (0.04) (0.04)
Observations 20,262 21,011 21,012 21,012
R-squared 0.117 0.075 0.076 0.087
Note: Standard errors in parentheses and *** p<0.01, ** p<0.05, * p<0.1

68
2.7 Conclusion
This study mainly examines how Thai people change their allocation of time to
leisure in response to wage and income change. Also, the determinants of leisure time
using Thailand‟s Time Use Survey, together with Labor Force Survey data, are explored.
Leisure time regressed is divided into four measures, Leisure 1-4, from the narrowest to
the broadest.
Comparing the two genders, males obviously allocate more leisure time in all
measures. This is possibly influenced by the culture, where men could choose to only
work in the market while women are responsible for housework, even though Thai
women these days also allocate time for market work. Besides this, level of education
significantly impacts leisure time in the narrowest measure or Leisure Measure 1,
according to the results. High school and university graduates evidently engage in this
type of leisure at around 10% and above compared to the uneducated group. Pure leisure
is also consumed the greatest amount of time by the singles. People living in municipal
areas are likely to take more leisure time in all measures. Sunday is the day during which
Thai people spend longest leisure time, and is more inelastic for leisure time change,
while the day people allocate the shortest leisure time to is Thursday. Moreover, workers
in large firms with hundreds of employees tend to consume relatively more leisure time,
while those in the manufacturing industry tend to spend the least time for leisure
compared with people in the service and agricultural sectors.
The data indicate that people reduce their leisure time in all measures in response
to monthly income change. When wage or income changes, people adjust their time for
Leisure Measure 1 more than time for leisure in other measures. The reason explaining
such a negative relationship is that monthly income is composed of income other than
wage, for example, overtime and bonus, which are found to be inversely related to leisure
time. Therefore, wage per hour is a better factor for analyzing whether leisure is a normal
good. When the relationship between leisure time and hourly wage is estimated, an
increase in hourly wage substantially and significantly induces people to engage leisure
time in all measures, whereas a percentage change in hourly wage also provides a
positive percentage change in leisure time. The result of the study strongly confirms that
leisure is a normal good for the Thai people.

69
2.8 Bibliography
Aguiar, Mark and Hurst, Erik. 2007. Measuring Trends in Leisure: The Allocation of
Time Over Five Decades. Quarterly Journal of Economics. 122 (2): 969-
1006.
Arcand, Jean-Louis and Labar, Kelly. 2005. Health and Wages: Instrumental
Variables Estimates for a Panel of Chinese Workers. Retrieved May 26,
2010 from http://www.cerdi.org/uploads/sfCmsContent/html/199
/Arcand_Labar.pdf
Beblo, Miriam and Robledo, Julio R. 2008. The Wage Gap and the Leisure Gap for
Double Earner Couples. Journal of Population Economics. 21: 281-304.
Blundell, Richard; Duncan, Alan and Meghir, Costas. 1998. Estimating Labor Supply
Responses Using Tax Reforms. Econometrica. 66 (4): 827-861.
Chen, M. Keith and Chevalier, Judith A. 2007. The Taste for Leisure, Career Choice
and the Returns to Education. Economics Letters. 99 (2008): 353-356.
Fischer, Carolyn. 2001. Read This Paper Later: Procrastination with Time-Consistent
Preferences. Journal of Economic Behavior & Organization. 46 (3): 249-
269.
Forbes, Mattew; Barker, Andrew and Turner, Stewart. 2010. The Effects of Education
and Health on Wages and Productivity. Productivity Commission Staff
Working Paper, Melbourne, March.
Frase, Peter and Gornick, Janet C. 2009. The Time Divided in Cross-National
Perspectives: The Work Week, Gender and Education in 17 Countries.
Working Paper No. 526, Luxembourg Income Studies.
Gronau, Reuben. 1976. The Allocation of Time of Israeli Women. The Journal of
Political Economy. 84 (2): S201-S220.
Gronau, Reuben. 1977. Leisure, Home Production and Work--The Theory of the
Allocation of Time Revisited. The Journal of Political Economy. 85 (6):
1099-1123.
70
Ilahi, Nadeem. 2000. The Intra-Household Allocation of Time and Tasks: What
Have We Learnt from the Empirical Literature? Working Paper Series
No. 13. Policy Research Report on Gender and Development, The World
Bank. Retrieved June 20, 2010 from http://www. Worldbank.org/gender/prr
Killingsworth, Mark R. and Heckman, James J. 1986. Female Labor Supply: A Survey.
In Handbook of Labor Economics. Vol. 1. O. Ashenfelter and R. Layard
eds. London: Elsevier. Pp. 103-204.
Kumar, Anil. 2005. Lifecycle Consistent Estimation of Effect of Taxes on Female
Labor Supply in the U.S: Evidence from Panel Data. Research
Department Working Paper 0504. Federal Reserve Bank of Dallas. Retrieved
March 3, 2009 from http://dallasfed.org/research/papers/2005/wp0504.pdf
Marsden, Peter V; Reed, John Shelton; Kennedy, Michael D. and Stinson, Kandi M.
1982. American Regional Cultures and Differences in Leisure Time
Activities. Social Forces. 60 (4): 1023-1049.
Molina-García, Javier; Castillo, Isabel and Pablos, Caros. 2009. Determinants of
Leisure-Time Physical Activity and Future Intention to Practice in Spanish
College Students. The Spanish Journal of Psychology. 12 (1): 128-137.
National Statistical Office. 2001a. Labor Force Survey 2001. Bangkok: National
Statistical Office.
National Statistical Office. 2001b. Time Use Survey 2001. Bangkok: National
Statistical Office.
National Statistical Office. 2004a. Labor Force Survey 2004. Bangkok: National
Statistical Office.
National Statistical Office. 2004b. Time Use Survey 2004. Bangkok: National
Statistical Office.
Owen, John D. 1971. The Demand for Leisure. Journal of Political Economy. 79 (1):
56-76.
Pereira, Pedro Telhado and Martins, Pedro Silva. 2005. Does Education Reduce Wage
Inequality? Quantile Regressions Evidence from Fifteen European
Countries. Retrieved August 1, 2010 from http://www.etla.fi/PURE/
DoesEducApr4.pdf
71
Ramey, Valerie A. and Francis, Neville. 2006. A Century of Work and Leisure.
Working Paper No. 12264. National Bureau of Economic Research (NBER),
Cambridge, M.A.
Schettkat, Ronald. 2003. Differences in US-German Time-Allocation: Why Do
Americans Work Longer Hours than Germans? IZA. Discussion Paper
No. 697. Forschungsinstitut zur Zukunft der Albeit, Institute for the Study of
Labor.
Soule, George. 1957. The Economics of Leisure. Annals of the American Academy
of Political and Social Science. 313: 16-24.
Westland, Cor. 1987. Toward A Leisure-Centred Society: The „Why‟, „What‟ and
„How‟ of Education for Leisure. European Journal of Education. 22 (3/4):
225-232.
Wilson, John. 1980. Sociology of Leisure. Annual Review of Sociology. 6: 21-40.
Yamada, Tadashi; Yamada, Tetsuji and Kang, J. Moonwon. 1999. A Study of Time
Allocation of Japanese Households. Japan and the World Economy. 11:
41-55.

ESSAY 3
DOES LEISURE CONTRIBUTE TO AN INCREASE IN THE WAGES
OF THE THAI PEOPLE?
3.1 Abstract
It is generally believed that skills and productivity leading to wage change are
developed by some non-leisure activities, for example, education, training, and work.
This paper examines whether labor productivity could be improved by consuming leisure.
The findings reveal that some leisure activities do affect wage change. Wage reduction
could be caused by increases in leisure time use for social participation and volunteer
activities. Media use and recreation activities are also found to enhance hourly wages.
However, this study could not conclude how computer use in leisure, learning during
leisure time, sleep and personal care, as well as sport and exercise impact wage changes.
Further exploration of the influence of hourly wage on leisure time indicates a positive
relationship, confirming that leisure is a normal good for the Thai people.
Keywords: leisure, wage, leisure activities, Thailand

73
3.2 Introduction
The time that people spend on activities can mainly be divided into work and non-
work. Empirical research has mainly emphasized work time studies since work provides
economic benefit by creating earnings, consumption, and economic growth; although a
proportion of time use for non-work activities, leisure time is substantially greater.
Leisure benefits by fulfilling physical and psychological needs by driving an individual’s
utility. Generally, leisure is classified as time spent away from work that creates an
individual’s utility. The gain mentioned for leisure includes mostly the enhancement of
preferences and welfare without consideration of whether the activities help increase an
individual’s wage and income by boosting productivity, as they are the determinants of
the rise in living standards (Artige and Nicolini, 2006: 2-7). Benzion and Epstein (n.d.,
10) indicated that deferring leisure was caused by productivity improvement efforts,
leading to wage inducement. Workers substitute leisure in the present to invest efforts for
productivity increases and more wages received. However, some empirical evidence has
claimed that leisure activities themselves cause both physical and mental improvement
(for example, World Health Organization, 2003: 2-3, Bernaards, Jans, Van den Heuvel,
Hendriksen, Houtman and Bongers, 2006: 13-15), enabling positive wage changes.
As there are various leisure activities for individuals to choose from for utility
maximization, it raises the question of whether leisure time use for some of those
activities could help raise wages. These activities include computer use, media use,
personal care, sport and exercise, recreation, learning in leisure time and social
participation and volunteer activities. The computer plays a key role in enhancing
productivity at the workplace (for instance, Lehr and Lichtenbreg, 1996: 1-31 and
Maliranta and Rouvinen, 2006: 605-616). Personal care develops physical appearance
and is proved to be positively correlated with wages since beauty is a factor causing
discrimination in labor market (Harmermesh and Biddle, 1993: 26 and Gergaud and
Gensburgh, n.d.: 3-4), and healthiness boosts an individual’s productivity, which
improves wages. Physical activities by playing sports and exercising generate good health
as well as improved physical and mental condition (Nana, Sanderson and Goodchild,
2002: 29-30 and World Health Organization, 2003: 4-6), whereas learning brings about
higher skills and knowledge, thus yielding better performance and labor productivity

74
(Descy and Tessaring, 2001: 8-16). Social participation and volunteer activities create
social networks, which consequently increases performance of the connected works and
yields rises in wages (Ioannides and Sortevent, 2006: 270-273 and Bandiera, Barankay
and Rasul, 2009: 1073-1078). Until now, whether these leisure time activities improve an
individual’s wages has not been explored. This paper fills the research gap by examining
how leisure time activities promote labor productivity as the main objective. The findings
could be applied to human development issues by encouraging productive leisure
activities in order to raise labor productivity and wages.
This paper is organized as follows; previous findings on how leisure activities are
related to wage changes as well as a conceptual framework are reported in the next
section, followed by an explanation of each leisure activity in detail before model
specification and estimation are offered. The author then presents an empirical analysis of
wage change separated by leisure activity in order to find out how wage change is
affected by leisure activity, as well as how different characteristics of individuals impact
wages. If it is found that the leisure activities influence wage change, the study further
explores how hourly wages and monthly income impact leisure time and whether leisure
is a normal good for the Thai people before the paper’s conclusion and policy
implications.
3.3 Impact of Leisure on Wages
3.3.1 Conceptual Framework
This paper aims to investigate how leisure time influences wage changes.
According to Mincer’s model, an individual’s earning is influenced by human capital
characteristics, which could be obtained from education and experience. To allow for
different returns across various types of education, a series of education dummy variables
is applied as well as potential experience. The model employs a vector of control
variables, signifying demographic characteristics that potentially influence wages. The
distinction of the model presented in this paper is that leisure time is included in the
model as a factor influencing wage changes. The wage model specification is expressed
as follows:
ln wi = αi + β1Si + β2ei + β3ei2 + β4Di + εi

75
where wi represents an individual i’s wage rate; Si is education dummies; ei is measure of
experience, which is included as a proxy of human capital accumulation after formal
schooling, whereas Di represents socio-demographic variables; and εi is the error term.
Leisure time use possibly contributes to psychological improvement, leading to
enhancement as well as knowledge and skill increases, and positively affects productivity
and wage enhancement.
Generally, leisure time activities are believed to provide merely utility, without
considering whether they are markedly related to wage change. Some activities
categorized as leisure are reported to contribute to wage change, for example, computer
use evidently generates higher labor productivity and an increase in wages (Brynjolfsson,
1998: 11 and Revilla E. and Ruiz G., 2008: 163-173). This paper explores whether an
individual’s leisure activities contribute to the development of skills and knowledge that
will improve an individual’s productivity and consequently lead to a wage increase.
Figure 3.1 presents the conceptual framework illustrating how various leisure activities
are related to a rise in wages.
Work Leisure
Sport &Exercise
Productivity Improvement
Wage Increase
Time Allocation
PersonalCare
ComputerUse
MediaUse
Recreation Learning Volunteer
Relax & Knowledge
Health & Mental
Relax & Knowledge
Knowledge ConnectionHealth &Appearance
Skill Improved
Skill development
Figure 3.1 Conceptual Framework for Essay 3

76
As seen in Figure 3.1, an individual’s time allocation is devoted mainly to two
kinds of activities, work and leisure. Work activities include market work and home
production and housework, while leisure time activities are divided into 7 types:
computer use, mass media use, personal care, sport and exercise, recreational activities,
learning and social participation, and volunteer activities. Experience with time allocated
for work, together with leisure activities, lead to the development of an individual’s skills
and productivity, which consequently enhance one’s wages.
Among the leisure activities, computer use directly contributes to technology-
related skills development, while leisure time spent on the mass media through reading,
watching, and listening provide mental relaxation and sometimes it enhances knowledge.
Personal care improves not only health, but also one’s appearance, which is proved to be
a factor contributing to wage increases (Hamermesh and Biddle, 1993: 13-20). Sport and
exercise develop one’s physical condition, improve health, as well as reduce the risk of
illness. People spending time on recreational activities not only improve their knowledge
through learning and enjoying the activities, for example, sightseeing for cultural sites
and joining events, but enjoy these activities which yield psychological improvement.
Learning during leisure time for skill development as well as for the purpose of fulfilling
psychological needs causes the enhancement of knowledge and individuals’ skills. Even
social participation and volunteer activities during leisure time enable the creation of
social networks and skills development. A detailed list of each type of leisure activity is
presented in Section 3.4.
3.3.2 Computer Use Leisure and Wage Change
The greatest increase in productivity has historically been associated with a
particular class of technology, and computer technology has advanced at an exponential
rate of growth for decades (Brynjolfsson: 1998: 2-13). Similarly, computer technology
also positively enhances labor productivity, as proven by a large amount of economic
literature investigating the impact of computers on labor productivity (for example Lehr
and Lichtenbreg (1996: 1-31), Krueger (1993: 33-60), U.S. Department of Labor (1996:
Paragraph 8-14), Maliranta and Rouvinen (2006: 605-616)). They agree that use of the
computer helps to enhance labor productivity, as evidenced by the growth of the firm and
economic development. Brynjolfsson (1998: 11) revealed that computers take part in

77
productivity increases as they are an essential component of a broader system of work in
the organization, and computer skills are highly valued in the workplace—workers using
computers earned 13% more than those that did not use computers at all (Green, 1998,
quoted in Dolton and Pelkonen, 2007: 3) This corresponded to the work of Lehr and
Lichtenbreg (1996: 19), who agreed that computer usage appeared to contribute
positively to productivity growth. Liu, Tsou Hammitt (2004: 48-50) suggested that
highly-paid workers were more likely to use computers, which positively and directly
affected wages caused by productivity enhancement.
Evidence confirms the positive impact of activities related to computer
technology on productivity, including the findings of the efficient combination of
technology use with labor. However, how computer use in leisure time, which certainly
provides utility, contributes to labor productivity change, especially in developing
countries, is still in question and needs further investigation.
3.3.3 Media Use and Wage Change
Leisure time for media use includes time devoted to leisure reading, watching
television, VDOs, VCDs and DVDs, and listening to the radio and music. Reading books
contributes to both knowledge improvement and mental development. Time use for
leisure reading depends on socio-economic characteristics as well as the whole leisure
time available (Greaney, 1980: 347-352). Empirical literature has suggested that the
content of television has four broad types of impacts on people, including knowledge and
cognitive skills. Therefore, television as a learning medium has also been used for
knowledge improving purposes. Moeller (1996: 1-9) has indicated that some television
programs could crucially contribute to knowledge base of the viewers, including work,
learning, and cultural knowledge. Listening to music in leisure time enhances happiness
as well as relieves mental stretch. Gardiner (2000: 84-86) studied the interactions
between music and learning and found the development of thinking skills. In addition,
listening to music induces social, emotional and personal development.
From empirical studies, it can be seen that media use during leisure time can bring
about mental relaxation, skills, and knowledge. So far, there has been no research on how
media use during leisure time correlates with wage changes. As Thai people devote 14-

78
16% of leisure time for media use, exploration of the impact of this type of leisure
becomes important for analyzing time use.
3.3.4 Personal Care and Wage Change
Composing time for personal care, sleeping, and eating, personal care is a group
of necessary activities for individuals that contributes to the both physical and mental
health. Moreover, an individual’s appearance could also be improved with an appropriate
level of personal care. The empirical literature reveals the existence of the link between
wage and appearance. Hamermesh and Biddle (1993: 5-12) found that a person with an
above-average appearance tended to earn 5% more than an average looking person,
while a below-average person received wages of approximately 9% less. They gave
possible reasons for a premium for beauty and a penalty for ugliness; first, the employer
discriminates against the unattractive; second, productivity could be created from
discrimination of the appearance; lastly, the unattractive group’s inability to achieve a
wage gain by moving to occupations dominated by attractive workers. Appearance could
affect confidence and communication, which increase productivity as a consequence.
Gergaud and Ginsburgh (2010: 4) found that physical beauty has even a larger positive
effect on income among celebrities. Gao and Smyth (2009: 13-17) agreed that people that
are taller, one of the indications of physical appearance, significantly earned more wages.
Moreover, one’s height increased the chances for teens to participate in social activities,
which in turn, helped to improve skills, enhance productivity, and increased wages. The
wage differentials confirm that personal care for a good appearance positively correlated
with an individual’s wage. Therefore, how time use for these personal care activities is
related to wage changes is investigated in Section 3.5.
3.3.5 Sport and Exercise, Recreation, and Wage Change
Recreation serves a critical role in most people’s lives by satisfying physical and
mental needs. Some recreational activities, for example, visiting museums or cultural
sites, not only provides enjoyment, but also knowledge and creativity while for some
people it provides improvement in physical health as well as cognitive function—
improving memory, and increasing awareness and alertness, which contribute to
productivity and potentially lead to wage increases. Recreational activities, for instance,
79
playing games, can even enhance creative and other forms of critical thought (Mitchell
and Savill-Smith, 2004: 19). Another type of recreational activity that evidently improves
physical ability, leisure sports, is freeform, voluntary, and a non-competitive activity,
aiming to regulate the mental state of people (Min and Jin, 2010: 99). Sport activities
provide direct enjoyment by boosting an individual’s capabilities and contributing to
people’s better health. From empirical investigation, it can be seen that enhancing
participation in sport and exercise reduces health care costs to both individuals and
society by improving health and preventing diseases (World Health Organization: 2003,
1-6). Nana et al. (2002: 29-30) found a positive relationship between physical activity
and health, as shown by the reduction of the problems of disease, high blood pressure,
and cholesterol. Therefore, sport and physical activities also provide one of the most cost-
effective forms of preventative medicine. Empirical research has also confirmed that with
improved physical condition and health, physical activities increased productivity (Nana
et al., 2002: 29-30, United Nations, 2005: 1-8 and Trigonis, Matsouka, Costa and Tzetzis,
2008: 6-11). Furthermore, the introduction of sport and exercise programs in companies
have been found to be beneficial to workers by inducing creativity and productivity, as
evidenced by the company’s production growth, increasing profits, and improved
workers’ performance (Trigonis et al., 2008: 1-11) This indicates that leisure time use by
playing sports and exercise potentially helps one to maintain good physical condition and
productivity in the long term.
3.3.6 Leisure Learning Activities and Wage Change
It has long been realized that learning is a source of labor productivity growth, as
it is a way to improve human capital, which positively impacts innovation and
technological progress. Technology advancement has reduced work hours and increased
leisure time (Aguiar and Hurst, 2007: 977-987). As productivity growth has played a key
role in obtaining higher wages, workers realize how important training and retraining are
in order to improve skills and boost productivity and earnings. Furthermore,
technological progress has introduced alternative ways of acquiring knowledge, including
learning during leisure time. Characterized as informal learning, learning during leisure
time also enhances one’s skills, leading to better performance and labor productivity

80
increases (Descy and Tessaring, 2001: 8-16). This indicates the substantial impact of
learning on productivity progress.
3.3.7 Social Participation, Volunteer Activities, and Wage Change
Social participation and volunteer activities create connections among people in
the society and the community, which is empirically related to the rise of the opportunity
to be employed for workers. The issue of how relations and social preferences matter in
terms of economic behavior has been discussed, since there exists the idea that human
relations affect behavior in the workplace (Bandiera et al., 2009: 1047). Though unequal
earnings among workers could be explained by individual characteristics, for instance,
age, gender, and education, there are some additional factors that can cause unequal
earnings. Previous studies have revealed that social networks possibly explain the salient
characteristics of the labor market (for example, Ioannides and Loury, 2004: 1056-1093
and Ioannides and Soetevent, 2006: 270-274). Ioannides and Soetevent (2006: 270-273)
showed that on average workers that were better connected socially experienced not only
a lower unemployment rate, but also received higher wages. Bandiera et al. (2009: 1068-
1070) found that social connection enhanced productivity and the performance of
workers, leading to the chance of wage increases. Therefore, time use for social
participation and volunteer activities, contributing to creation of social connection, is
possibly correlated with wage changes, as shown in section 3.5.
3.4 Leisure Activities and Model Specification
This paper focuses on the individual’s time use for leisure activities by exploring
whether they contribute to wage improvement. Computer use leisure includes time using
computer technology for reading, media use, and Internet surfing, which in turn improve
computer use skills. Sport and exercise leisure is comprised of time used for playing
indoor and outdoor sports, exercise, and yoga, for example. Those activities are beneficial
by developing one’s physical condition and health. Learning during one’s leisure time is
believed to be an activity for human capital accumulation for higher productivity.
Learning in leisure excludes education and homework for a higher degree. Leisure time
for mass media use activities includes time for reading books, watching television, and

81
listening to the radio and music, and visiting the library. Leisure time for personal care
includes time for sleeping and eating. Social participation activities and volunteer
activities as a kind of leisure comprise community services, helping other households’
non-market activities, informal group meetings in the community, and volunteering with
organizations. The last group of leisure activities in this study, recreation, includes time
for arts, music, plays, hobbies, and playing games, as well as time for cultural
sightseeing, entertainment shows, and sports events. Table 3.1 presents a detailed list of
these productive leisure activities with examples.

82
Table 3.1 List of Leisure Activities that Potentially Improve Wages
Types of Leisure
Activities Activities included
Computer Use - Computer use for entertainment and media purposes
- Computer technology for reading, watching and listening
to radio
- Computer use for media
- Internet surfing
- Data uploads and downloads for entertainment
Mass Media Use - Reading, watching TV, VDO, VCD and DVD
- Listening to music and radio
- Visiting the library
- Other mass media use for entertainment
Personal Care - Sleep and related activities
- Eating and drinking
- Personal hygiene and health
Sport and Exercise - Walking and jogging for exercise
- Biking, skating, and skateboarding
- Aerobics, yoga, weightlifting and other fitness
programs
- Sports with a ball as the equipment,
for instance, golf, tennis, table tennis, badminton
football, basketball, volleyball, etc.
- Marine sports, winter sports, and horse riding
- Other sports and exercise-related activities
Recreational Activities - Arts, music, hobbies, and related courses
- Playing games
- Spectator sports, exhibitions, museums, cinema,
theatre, concerts, and other performances and events
- Other recreational activities

83
Table 3.1 (Continued)
Types of Leisure
Activities Activities included
Learning - Additional study, non-formal courses during free time
- Self-learning depending on individual's interest,
opportunity, potential, and readiness
- Training for learning and career development
Social Participation - Participating in cultural activities, weddings, funerals
births and other celebrations
- Socializing at home and outside the home
- Community organized construction and repairs
- Community organized work
- Volunteering for an organization (which does not
involve working directly for individuals)
- Volunteer work through organizations extended directly
to individuals and groups
- Participation in meetings of local and informal groups,
tribes, professional associations, unions, and fraternal
and political organizations
- Involvement in civic and related responsibilities, for
example, rallies
- Informal help to other households
Note: This list of the activities was obtained from the Time Use Survey 2001 and 2004
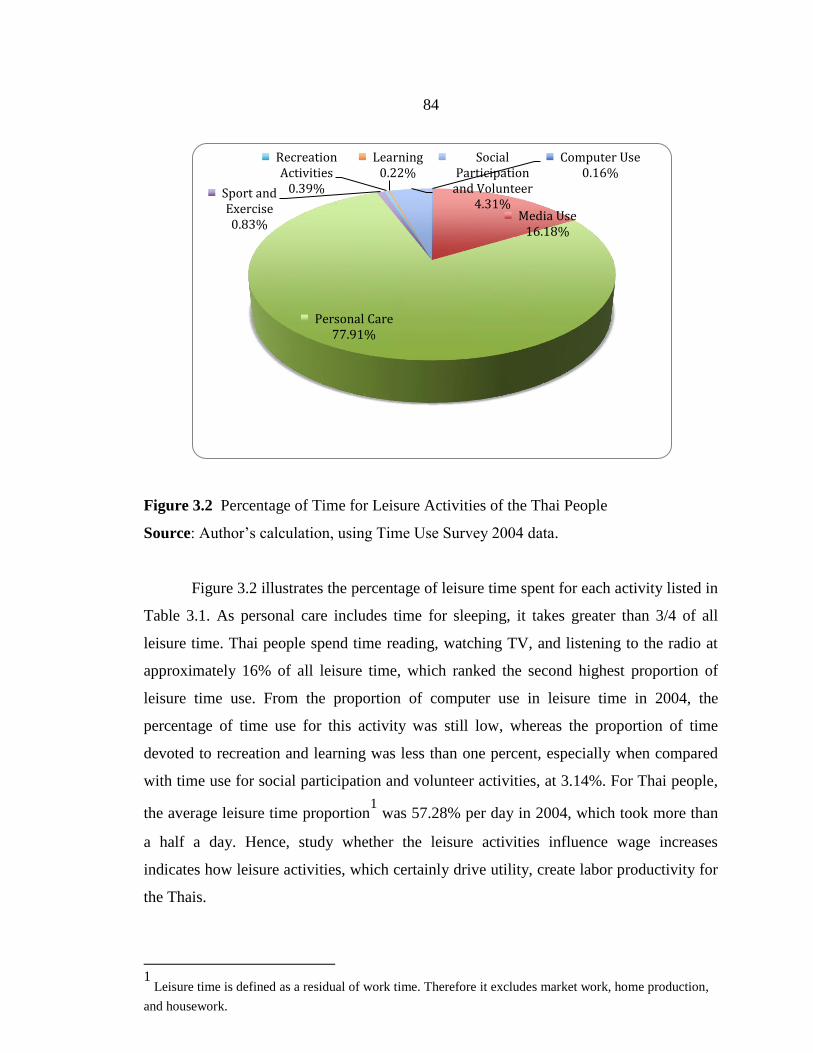
84
Figure 3.2 Percentage of Time for Leisure Activities of the Thai People
Source: Author’s calculation, using Time Use Survey 2004 data.
Figure 3.2 illustrates the percentage of leisure time spent for each activity listed in
Table 3.1. As personal care includes time for sleeping, it takes greater than 3/4 of all
leisure time. Thai people spend time reading, watching TV, and listening to the radio at
approximately 16% of all leisure time, which ranked the second highest proportion of
leisure time use. From the proportion of computer use in leisure time in 2004, the
percentage of time use for this activity was still low, whereas the proportion of time
devoted to recreation and learning was less than one percent, especially when compared
with time use for social participation and volunteer activities, at 3.14%. For Thai people,
the average leisure time proportion1 was 57.28% per day in 2004, which took more than
a half a day. Hence, study whether the leisure activities influence wage increases
indicates how leisure activities, which certainly drive utility, create labor productivity for
the Thais.
1
Leisure time is defined as a residual of work time. Therefore it excludes market work, home production,
and housework.
Computer Use0.16%
Media Use16.18%
Personal Care77.91%
Sport and Exercise0.83%
Recreation Activities
0.39%
Learning0.22%
Social Participation
and Volunteer4.31%

85
Collected by the National Statistical Office (NSO), the data sets applied in this
study, the Time Use Survey 2004, provided the time length devoted to each person’s
activities during 24 consecutive hours, with a number of observations of 54,568. Time
use for each activity is measured in minutes. Since an individual’s productivity data were
not provided in the Time Use Survey or other data sets, wage as the proxy of productivity
in the Labor Force Survey, also provided by the National Statistical Office (NSO), was
employed to examine how those specific leisure activities impact productivity. The Labor
Force Survey was the only individual-level data set collected together with the Time Use
Survey. After merging the two data sets for each year, there were 48,524 observations.
The observations used in the study include those whose wage data were available. The
data applied in this research work include time for leisure in computer use, sport and
exercise, learning, mass media use, personal care, social participation, and volunteer and
recreational activities. Moreover, individual data on hourly wage, age gender, marital
status, education, status in the household (household’s head or member), occupation and
industry, and respondent’s area (municipal and non-municipal) were also included. Table
3.2 details the descriptive statistics for average leisure time in different categories in
minutes, divided by different socio-economic characteristics for the year 2004. They
reflect the change of time use in these activities.
This paper focuses on the study of the relationship between leisure time use in
seven groups of leisure activities and wage. According to many empirical studies, some
leisure activities contribute to one’s wage by enhancing labor productivity (for example,
Lehr and Lichtenbreg (1996: 1-31), Krueger (1993: 33-60), Descy and Tessaring, 2001:
8-16). Comparing wage profile and productivity profile, Serneels (2005: 21-24) found
that wage profiles did reflect productivity profiles on average. This corresponds to the
marginal productivity theory, suggesting that highly productive workers are highly paid
and less productive workers are less highly paid, as productivity causes real wage
changes, and this supports the findings that labor productivity is positively related to real
wages in the long run (Wakeford, 2004: 109-132 and Goh, 2009: 1-20). Goh and Wong
(2010: 1-20) revealed the high responsiveness of wage to a change in productivity. This
implies that productivity reflects wages. Hence, the link of wage and productivity, as well
as the evidence of wage inducement of leisure activities presented in previous studies,
confirms that leisure activities possibly contribute to wage changes of Thai people.
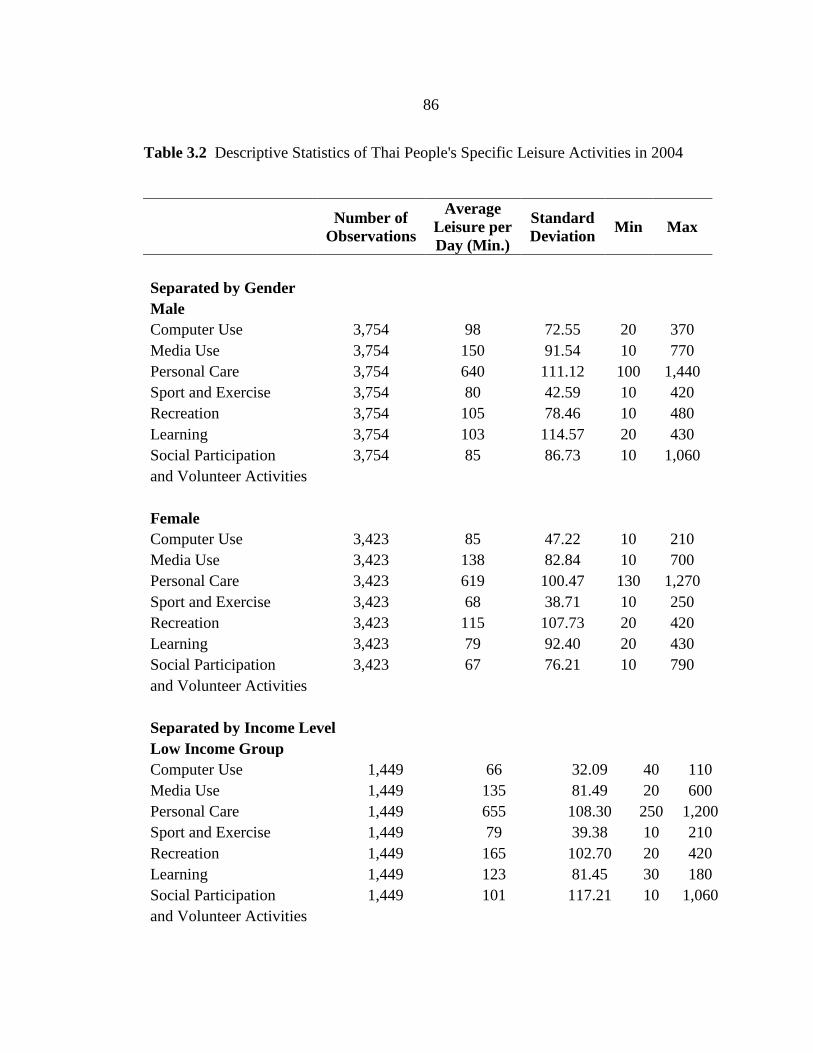
86
Table 3.2 Descriptive Statistics of Thai People's Specific Leisure Activities in 2004
Number of
Observations
Average
Leisure per
Day (Min.)
Standard
Deviation Min Max
Separated by Gender
Male
Computer Use 3,754 98 72.55 20 370
Media Use 3,754 150 91.54 10 770
Personal Care 3,754 640 111.12 100 1,440
Sport and Exercise 3,754 80 42.59 10 420
Recreation 3,754 105 78.46 10 480
Learning 3,754 103 114.57 20 430
Social Participation 3,754 85 86.73 10 1,060
and Volunteer Activities
Female
Computer Use 3,423 85 47.22 10 210
Media Use 3,423 138 82.84 10 700
Personal Care 3,423 619 100.47 130 1,270
Sport and Exercise 3,423 68 38.71 10 250
Recreation 3,423 115 107.73 20 420
Learning 3,423 79 92.40 20 430
Social Participation 3,423 67 76.21 10 790
and Volunteer Activities
Separated by Income Level
Low Income Group
Computer Use 1,449 66 32.09 40 110
Media Use 1,449 135 81.49 20 600
Personal Care 1,449 655 108.30 250 1,200
Sport and Exercise 1,449 79 39.38 10 210
Recreation 1,449 165 102.70 20 420
Learning 1,449 123 81.45 30 180
Social Participation 1,449 101 117.21 10 1,060
and Volunteer Activities
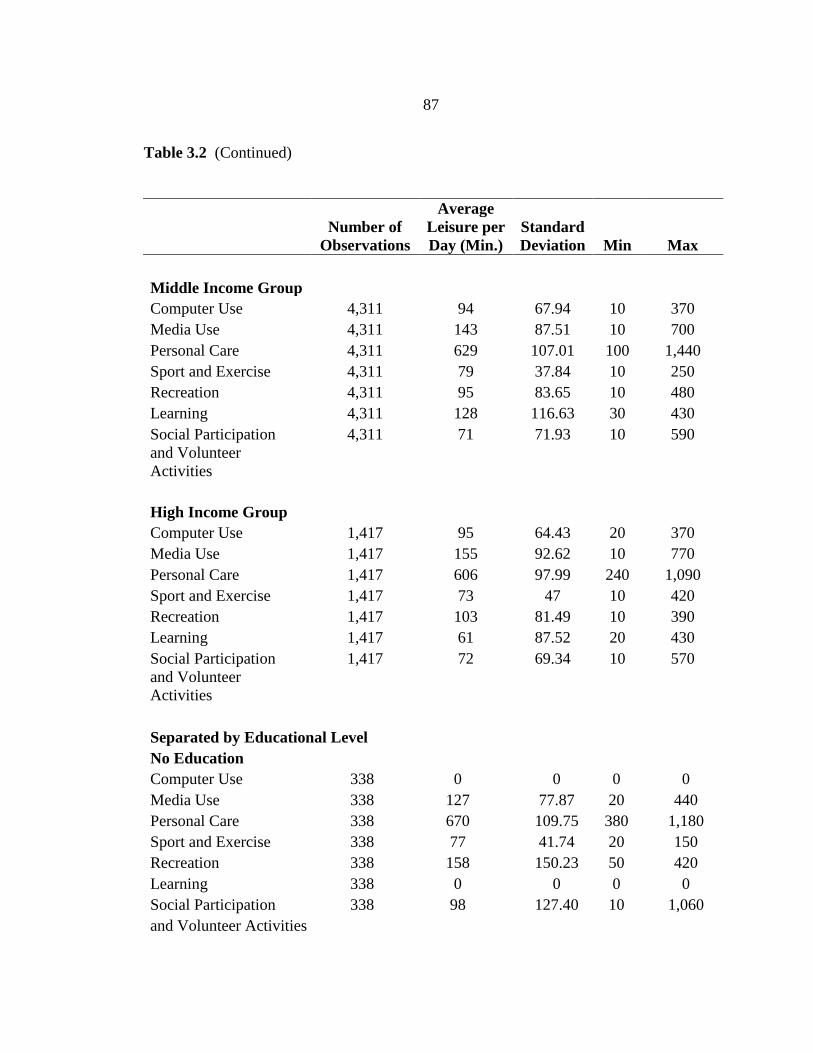
87
Table 3.2 (Continued)
Number of
Observations
Average
Leisure per
Day (Min.)
Standard
Deviation Min Max
Middle Income Group
Computer Use 4,311 94 67.94 10 370
Media Use 4,311 143 87.51 10 700
Personal Care 4,311 629 107.01 100 1,440
Sport and Exercise 4,311 79 37.84 10 250
Recreation 4,311 95 83.65 10 480
Learning 4,311 128 116.63 30 430
Social Participation 4,311 71 71.93 10 590
and Volunteer
Activities
High Income Group
Computer Use 1,417 95 64.43 20 370
Media Use 1,417 155 92.62 10 770
Personal Care 1,417 606 97.99 240 1,090
Sport and Exercise 1,417 73 47 10 420
Recreation 1,417 103 81.49 10 390
Learning 1,417 61 87.52 20 430
Social Participation 1,417 72 69.34 10 570
and Volunteer
Activities
Separated by Educational Level
No Education
Computer Use 338 0 0 0 0
Media Use 338 127 77.87 20 440
Personal Care 338 670 109.75 380 1,180
Sport and Exercise 338 77 41.74 20 150
Recreation 338 158 150.23 50 420
Learning 338 0 0 0 0
Social Participation 338 98 127.40 10 1,060
and Volunteer Activities

88
Table 3.2 (Continued)
Number of
Observations
Average
Leisure per
Day (Min.)
Standard
Deviation Min Max
Primary School
Computer Use 2,741 53 15.28 40 70
Media Use 2,741 136 82.62 20 680
Personal Care 2,741 642 110.33 100 1,340
Sport and Exercise 2,741 75 38.72 10 210
Recreation 2,741 146 107.76 10 420
Learning 2,741 160 0 160 160
Social Participation 2,741 81 87.89 10 790
and Volunteer Activities
Secondary School
Computer Use 953 60 28.28 40 80
Media Use 953 143 85.58 10 660
Personal Care 953 639 111.17 210 1,440
Sport and Exercise 953 42 32.47 10 150
Recreation 953 115 91.09 30 390
Learning 953 120 0 120 120
Social Participation 953 78 75.83 10 490
and Volunteer Activities
High School
Computer Use 587 114 100.44 10 370
Media Use 587 155 93.56 20 660
Personal Care 587 622 103.82 170 1,310
Sport and Exercise 587 83 39.10 30 230
Recreation 587 89 100.29 10 480
Learning 587 143 193.11 30 430
Social Participation 587 70 72.85 10 570
and Volunteer Activities

89
Table 3.2 (Continued)
Number of
Observations
Average
Leisure per
Day (Min.)
Standard
Deviation Min Max
College
Computer Use 1,650 92 59.95 20 370
Media Use 1,650 153 93.31 10 770
Personal Care 1,650 605 93.03 240 1,130
Sport and Exercise 1,650 78 47.20 10 420
Recreation 1,650 95 72.25 20 390
Learning 1,650 59 51.35 20 200
Social Participation 1,650 72 72.30 10 590
and Volunteer Activities
Separated by Marital Status
Single
Computer Use 2,401 97 64.06 10 370
Media Use 2,401 148 90.14 10 770
Personal Care 2,401 636 109.28 100 1,440
Sport and Exercise 2,401 86 42.19 10 250
Recreation 2,401 107 84.47 10 480
Learning 2,401 119 89.39 30 330
Social Participation 2,401 83 81.96 10 660
and Volunteer
Activities
Married
Computer Use 4,224 90 67 20 370
Media Use 4,224 143 86.67 10 700
Personal Care 4,224 626 104.72 170 1,340
Sport and Exercise 4,224 72 41.13 10 420
Recreation 4,224 108 98.08 10 420
Learning 4,224 80 108.61 20 430
Social Participation 4,224 73 83.46 10 1,060
and Volunteer
Activities

90
Table 3.2 (Continued)
Number of
Observations
Average
Leisure per
Day (Min.)
Standard
Deviation Min Max
Divorced/ Separated and Others
Computer Use 552 87 58.88 30 180
Media Use 552 134 84.72 20 650
Personal Care 552 636 108.59 130 1,180
Sport and Exercise 552 63 35.74 20 220
Recreation 552 129 68.75 30 250
Learning 552 35 7.07 30 40
Social Participation 552 80 79.90 10 560
and Volunteer Activities
Separated by Age
Age 15-24
Computer Use 1,244 89 52.68 10 200
Media Use 1,244 146 88 10 600
Personal Care 1,244 640 112.46 170 1,270
Sport and Exercise 1,244 83 40.11 10 210
Recreation 1,244 109 91 20 480
Learning 1,244 110 75 30 180
Social Participation 1,244 82 86.20 10 590
and Volunteer Activities
Age 25-44
Computer Use 3,608 89 61.17 30 370
Media Use 3,608 144 88.90 10 770
Personal Care 3,608 626 105.72 100 1,440
Sport and Exercise 3,608 81 40.72 10 250
Recreation 3,608 101 82.31 10 420
Learning 3,608 119 113.88 30 430
Social Participation 3,608 72 75.09 10 660
and Volunteer Activities
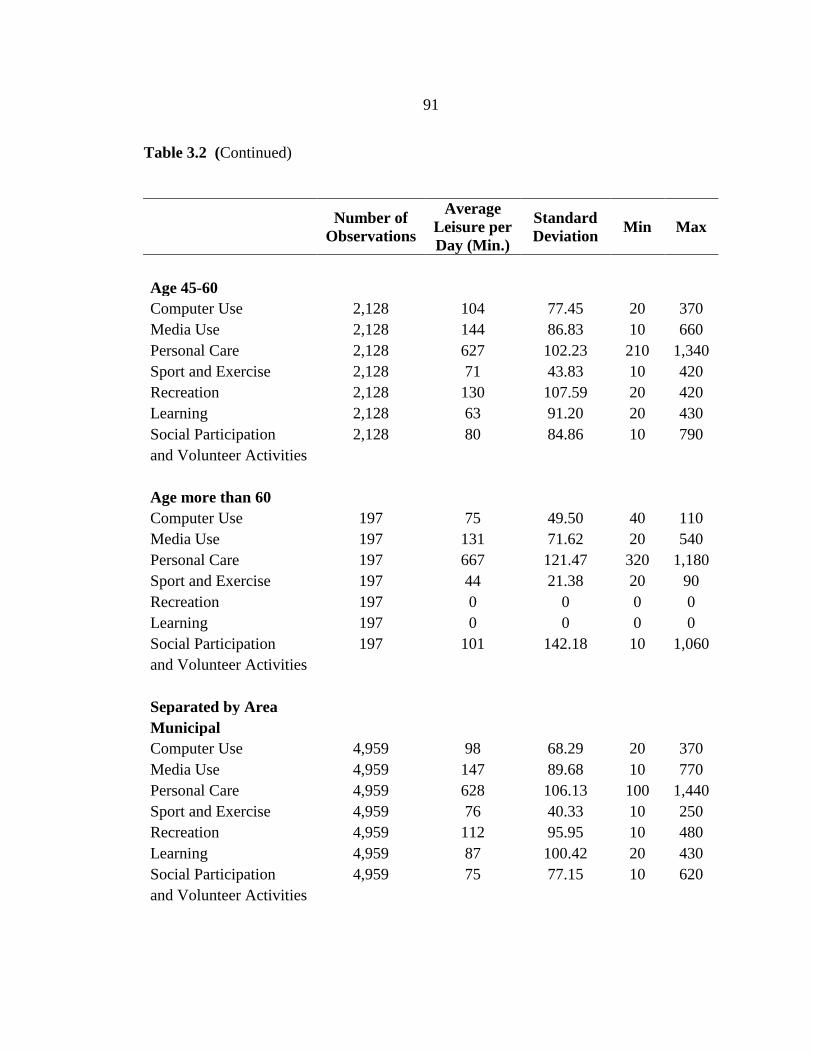
91
Table 3.2 (Continued)
Number of
Observations
Average
Leisure per
Day (Min.)
Standard
Deviation Min Max
Age 45-60
Computer Use 2,128 104 77.45 20 370
Media Use 2,128 144 86.83 10 660
Personal Care 2,128 627 102.23 210 1,340
Sport and Exercise 2,128 71 43.83 10 420
Recreation 2,128 130 107.59 20 420
Learning 2,128 63 91.20 20 430
Social Participation 2,128 80 84.86 10 790
and Volunteer Activities
Age more than 60
Computer Use 197 75 49.50 40 110
Media Use 197 131 71.62 20 540
Personal Care 197 667 121.47 320 1,180
Sport and Exercise 197 44 21.38 20 90
Recreation 197 0 0 0 0
Learning 197 0 0 0 0
Social Participation 197 101 142.18 10 1,060
and Volunteer Activities
Separated by Area
Municipal
Computer Use 4,959 98 68.29 20 370
Media Use 4,959 147 89.68 10 770
Personal Care 4,959 628 106.13 100 1,440
Sport and Exercise 4,959 76 40.33 10 250
Recreation 4,959 112 95.95 10 480
Learning 4,959 87 100.42 20 430
Social Participation 4,959 75 77.15 10 620
and Volunteer Activities

92
Table 3.2 (Continued)
Number of
Observations
Average
Leisure per
Day (Min.)
Standard
Deviation Min Max
Non-Municipal
Computer Use 2,218 75 47.02 10 200
Media Use 2,218 136 82.49 20 650
Personal Care 2,218 633 107.77 170 1,200
Sport and Exercise 2,218 80 46.66 10 420
Recreation 2,218 92 55.98 20 210
Learning 2,218 93 107.36 20 430
Social Participation 2,218 81 93.57 10 1,060
and Volunteer Activities
Employment Industry
Agricultural
Computer Use 908 370 0 370 370
Media Use 908 134 83.32 20 600
Personal Care 908 659 116.72 210 1,340
Sport and Exercise 908 76 29.64 10 130
Recreation 908 105 67.77 30 240
Learning 908 160 0 160 160
Social Participation 908 99 115.59 10 1060
and Volunteer Activities
Manufacturing
Computer Use 664 125 95.95 10 370
Media Use 664 140 87.25 10 700
Personal Care 664 621 104.09 100 1,440
Sport and Exercise 664 69 38.73 10 190
Recreation 664 123 106.99 30 480
Learning 664 100 28.28 80 120
Social Participation 664 64 71.34 10 660
and Volunteer Activities

93
Table 3.2 (Continued)
Number of
Observations
Average
Leisure per
Day (Min.)
Standard
Deviation Min Max
Service
Computer Use 1,633 88 54.85 20 330
Media Use 1,633 148 88.52 10 770
Personal Care 1,633 628 104.57 130 1,310
Sport and Exercise 1,633 79 43.25 10 420
Recreation 1,633 106 88.24 10 420
Learning 1,633 87 105.01 20 430
Social Participation 1,633 78 78.14 10 660
and Volunteer Activities
Occupation
Professionals and Managers
Computer Use 1,211 88 61.59 20 370
Media Use 1,211 107 84.03 20 370
Personal Care 1,211 605 94.22 240 1,310
Sport and Exercise 1,211 72 47.49 10 420
Recreation 1,211 117 81.96 30 390
Learning 1,211 65 70.11 20 330
Social Participation 1,211 79 79.79 10 590
and Volunteer Activities
Technicians
Computer Use 704 106 56.55 10 240
Media Use 704 160 97.36 20 650
Personal Care 704 626 113.73 170 1,130
Sport and Exercise 704 80 42.09 20 230
Recreation 704 100 93.18 10 420
Learning 704 240 268.70 50 430
Social Participation 704 72 72.23 10 470
and Volunteer Activities
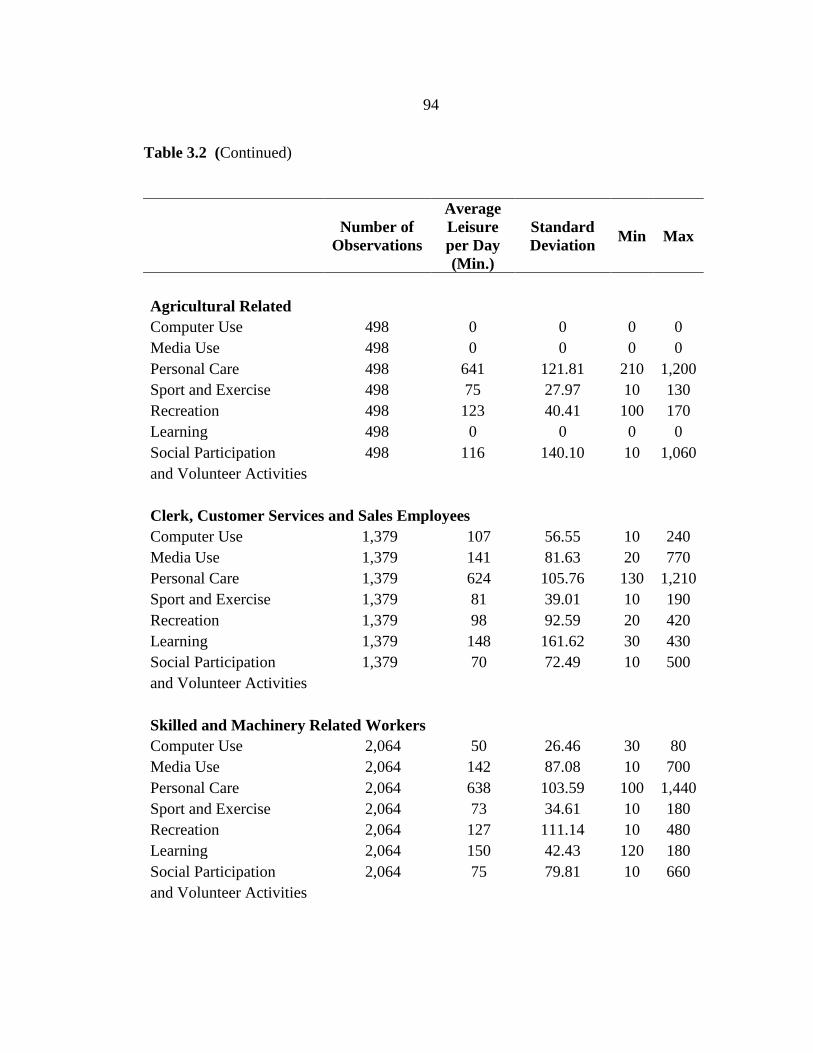
94
Table 3.2 (Continued)
Number of
Observations
Average
Leisure
per Day
(Min.)
Standard
Deviation Min Max
Agricultural Related
Computer Use 498 0 0 0 0
Media Use 498 0 0 0 0
Personal Care 498 641 121.81 210 1,200
Sport and Exercise 498 75 27.97 10 130
Recreation 498 123 40.41 100 170
Learning 498 0 0 0 0
Social Participation 498 116 140.10 10 1,060
and Volunteer Activities
Clerk, Customer Services and Sales Employees
Computer Use 1,379 107 56.55 10 240
Media Use 1,379 141 81.63 20 770
Personal Care 1,379 624 105.76 130 1,210
Sport and Exercise 1,379 81 39.01 10 190
Recreation 1,379 98 92.59 20 420
Learning 1,379 148 161.62 30 430
Social Participation 1,379 70 72.49 10 500
and Volunteer Activities
Skilled and Machinery Related Workers
Computer Use 2,064 50 26.46 30 80
Media Use 2,064 142 87.08 10 700
Personal Care 2,064 638 103.59 100 1,440
Sport and Exercise 2,064 73 34.61 10 180
Recreation 2,064 127 111.14 10 480
Learning 2,064 150 42.43 120 180
Social Participation 2,064 75 79.81 10 660
and Volunteer Activities

95
Table 3.2 (Continued)
Number of
Observations
Average
Leisure per
Day (Min.)
Standard
Deviation Min Max
Total
Computer Use 7,177 93 64.83 10 370
Media Use 7,177 144 87.73 10 770
Personal Care 7,177 630 106.66 100 1,440
Sport and Exercise 7,177 77 41.94 10 420
Recreation 7,177 108 89.23 10 480
Learning 7,177 89 101.85 20 430
Social Participation 7,177 77 82.77 10 1,060
and Volunteer Activities
Source: Author’s calculation, using Time Use Survey 2004 and Labor Force Survey
2004 data.

96
Table 3.2 illustrates the average time for each type of leisure activity. Comparing
the two genders, males obviously consumed more leisure time for computer use than
females. Computer use seemed to be a leisure activity for high income earners, as
evidenced by the longest average computer use leisure time. However, the gap became
smaller when time use for computer leisure reported a slight difference, between the
middle and high income group in 2004. Furthermore, computer use activities were
concentrated among the higher education groups, high school and university graduates.
This confirmed that time for computer use activities was likely to be spent by the better-
educated group, or high-skilled labor, who tended to receive more wages.
According to the data, people in municipal areas chose to devote their leisure time
to using the computer more than those in non-municipal areas. Considering the Thai’s
leisure time at different ages classified by worker groups, as in Forbes, Barker and Turner
(2010: 37), the average time of computer use for leisure was the highest, almost 2 hours a
day, among those aged 45-60, while the younger working age people spent slightly
shorter time. Nonetheless, the leisure time for computer for each age group appeared to
be not so different. Again, the shorter mean time for leisure was confirmed for all age
groups, except the oldest and the youngest. Only people in some occupations spent time
for computer leisure since there were no people working in the agricultural field that took
time for computer leisure at all, while there was only one worker in the agricultural
industry that took this type of leisure activity.
Obviously, there was a slight fall in average time for sport and exercise. Even
though the decrease in sport and exercise time for males was larger, females still
provided less amount of leisure time for this group of activities, as evidenced by 98
minutes for males and 68 minutes for females. Among the three income groups, the low
income group enjoyed the longest time for sport and exercise. The reason was possibly
that playing sports and exercising could be enjoyable, both individually and in groups,
and were activities with lower cost, while the high income group spent slightly shorter
leisure time for sport and exercise than the middle income group. This indicated the
preferences and behaviors in free time spent for physical improvement activities of
people in different income groups. High income earners seemed to prefer play sports and
doing exercise less than others, reflecting the possibility of less improvement in physical
condition.

97
The descriptive statistics also revealed that males still consumed more leisure
time in mass media use, reading, watching TV, listening to music and the radio, and
visiting the library than females. However, leisure time use for this group of activities
reduced approximately 20 minutes for both genders. The statistics also indicated that the
time spent for enjoying mass media was longer for the higher income as well as higher
educated groups. The high income group devoted more than 2 hours and a half per day to
mass media leisure activities, while the low income group consumed media only 2 hours
and 15 minutes; on the other hand, the high school and college graduates were the two
groups that spent the longest mass media leisure hours. This indicates that the better
educated and higher income groups seemed to consume more media, whereas municipal
area dwellers also consumed more leisure time for this type of activities. Singles provided
longer time for mass media, around 5 hours a day. However, the married still consumed
more leisure time for mass media than people of other marital status, for example,
divorced and separated people, but with a slight difference. Mass media use was more
popular among the young, those less than 25 years old, while the old, whose age was
above 60, even in the retied years, time spent receiving mass media information the
shortest length of time. As leisure time for personal care included time for sleeping, the
required human leisure activity, as well as eating, drinking, and personal hygiene and
health, people mostly consumed more than 10 hours a day for this care. Among the three
groups of earners, the low income group dedicated the longest time to sleeping, eating,
drinking, and personal care compared with those of the middle and high income group,
whereas the lower educated spent more time on personal care in their leisure. The
explanation of the findings is that the lower income group, which was likely to be the
lower-educated, worked shorter hours and took longer leisure time. Unlike the time used
for other leisure activities, both genders consumed longer personal care leisure time in the
latter year. It was unsurprising to find that the young and the old took more leisure time
for personal care, especially people over 60, where the average personal care leisure time
went up to greater than 11 hours a day. Due to the tendency toward more flexible time
use for leisure, singles consumed slightly longer personal care leisure than the married,
while those of other status seemed to enjoy their leisure time the least. It was also
revealed that people in municipal areas consumed clearly less leisure time, as evidenced
by the small differences in personal care leisure.
98
People in municipal areas consume less time for sport and exercise than those in
municipal areas. Moreover, it was unsurprising to find that the singles allocated more
time for these physical condition development activities than others since this group,
which was likely to be younger, tended to enjoy sport and exercise more than the older
individuals. This explanation was confirmed by the number of sport and exercise
activities divided by age group. The young, aged 15-24, had the highest average time for
sport and exercise in both years, 83 minutes, while those in their retired years enjoyed the
least for these activities, 44 minutes per day.
Thai people seemed to enjoy recreational activities more than sport and exercise,
as confirmed by the longer time used for recreation. Female’s recreation time rose by
more than 30 minutes and dominated the male’s time for recreational activities. The
lower educated people consumed longer hours for recreation than those that were high
school educated and above by around 20 minutes. The married appear to enjoy slightly
more recreation time than the singles, but less than people of other status at around 20
minutes a day. People aged more than 60, on the other hand, consumed more than 2
hours per day for recreational activities, which was greater than the young. The
enhancement of recreation time was evidenced by the report that workers in municipal
areas consumed less leisure time than the other group by 10 minutes.
Learning, as a kind of leisure time activity, including additional courses taken
during one’s free time for career development and knowledge improvement, leads to
better skills and knowledge, which could increase one’s wage as a consequence. From the
descriptive statistics of average leisure time in learning, males not only preferred playing
sport and exercising for developing their health and physical condition, but also on
average spent longer time for the learning activities. In addition, the data indicated that
the higher the level of education, the longer time spent for more learning, as evidenced by
the average time for this group’s activities separated by educational level. The findings
from the descriptive statistics also indicated that the singles chose to allocate leisure time
to these leisure activities for longer periods than the married and others. Learning time
rose from 108 minutes to about 2 hours per day, while people of other status averagely
spent no more than 1 hour and a half per day learning in their free time. This result
corresponded with the reported data separated by age, as the two youngest groups
consumed learning as their leisure for the longest time, at around two hours.

99
The descriptive statistics on computer use leisure indicated that the activity was
enjoyed by the higher educated, the singles, and municipal area dwellers, whereas a
computer use time gap between genders did exist. This implies that computers, as one of
the technology advancement symbols, were popular among specific groups of Thais,
while physical improvement activities were enjoyed by earners in lower the income
group. Moreover, the younger and lower educated evidently allocated on average less
time for the activities.
The average time for learning as a leisure activity indicated that the more
educated tended to spend longer time for learning, which creates productivity-creating-
activity, whereas the young were likely to allocate more free time to learning than the
old. This was supported by the finding that the singles, who were likely to be
comparatively younger than the married and those of other status, consumed the longest
time for learning. People in the middle income group appeared to be the most enthusiastic
for additional learning, as it was a source to improve skills and wage as a consequence.
It was reported that males consumed more time for social participation and
volunteer activities at around 20 minutes per day or greater than 2 hours per week than
females. Among Thai earners, those categorized in the low income group substantially
spent the longest time for social dedication, 101 minutes, while the middle income group
devoted the least time for these activities, 71 minutes daily, which was slightly less than
the high income earners. The highest educated group spent less time for social
participation and volunteer activities, as confirmed by the average time reported. These
activities seemed to be the least enjoyable for the singles since they chose to consume the
shortest amount of time for social participation and volunteer activities. Nevertheless,
there were not so many time gaps between the time spent for the activities of the singles
and that of people of other status. Still, the higher educated were likely to enjoy less time
for social-related activities. In the retired years, people devoted more time to social
participation and volunteer activities; the average leisure time for social activities among
people above 60 was almost 120 minutes per day. Individuals living in non-municipal
areas enjoyed social participation and volunteer activities more than the other group, as
evidenced by the substantially wide gap of time spent, around half an hour per week.
However, how wage and time for those leisure activities as well as other
socioeconomic characteristics are related could not be concluded by only considering the
100
descriptive data reported in Table 3.2. The next section presents an estimation of the
impact of these specific leisure activities and other factors on wage change in order to
find out how wage, the productivity proxy, is determined by using the Time Use Survey
and Labor force Survey.
3.5 Does Leisure Contribute to an Increase in the Wages of the Thai People?
In the past, empirical research focused on time spent on work activities and did
not emphasize leisure time, even though leisure created direct utility and each person
allocated a substantial proportion of time for this non-work activity. Leisure has been
considered unproductive compared to work as a market activity. This study explores
whether leisure time activities, computer use, mass media use, personal care, sport and
exercise, recreation, and learning, as well as social participation and volunteer, can cause
an increase in wages. Empirical evidence supports that idea that productivity is a source
of wage increase (World Health Organization, 2003: 2-3 and Bernaards et al, 2006: 13-
15). Besides wage change and time devoted to each leisure activity, the variables
employed in the study, including age measured in years, is applied to see how age affects
wage and productivity change. Education dummies are divided into no education,
primary school, secondary school, high school, and undergraduate level as skills
necessary for each leisure activity. Therefore, it is possible that educational level impacts
change in skills, productivity, and wage as a consequence. Marital status dummies are
also included as well as gender, status in the household (household head and non-
household head), and area (municipal and non-municipal area). Additionally, the models
include dummies of occupations, divided by professionals, technicians, clerks, sales and
services, and elementary or low-skilled related occupations. There are also a series of
industry dummies, agricultural, manufacturing and service industry, as control variables
in the models. The size of the workplace dummy is also used in the model, with a large
company defined as having an employment size greater than 200, while those working
with the workplace employing fewer than 200 people are categorized as smaller in size.
As this study focuses on the exploration of the relationship between time for leisure
activities and hourly wage, only the samples of which wage are observed are included in
the regressions.

101
The regression analysis was separated into two different estimation functions.
Both aimed to explore how each of the 7 types of leisure activities and others affects
hourly wage. The first model, Model (A), takes the form of estimation as follows:
(A) ln wagei = αi + α1Di + α2ei + α3ei2 + α4Si + α5Li + i
where wagei denotes an individual’s hourly wage, Di represents education dummies, ei is
the number of year experience, Si represents socio-economic characteristics, and Li
denotes time dedicated to each specific leisure activity. The variable Li is estimated in
minutes.
(B) ln wagei = β0 + β1Di + β2ei + β3ei2 + β4Si + β5Li + β6Ri + εi
Model (B) additionally includes the interaction terms of percentage of time for
each of the 7 leisure activities and socio-demographic dummies, Ri, which includes
gender, household head, area, and marital status. Ri is employed to estimate whether
people with equal percentage of time consumption for each leisure activity earn
differently or not. For example, if a man and a woman take an equal amount of leisure
time for computer use, an Ri indicates how different the hourly wages of these two
persons are. All of the empirical results are illustrated in Tables 3.3-3.6.

102
Table 3.3 Estimation of log (Hourly Wage) Using Computer and Media Use as the
Independent Variable in 2004
Independent Variables
log (Hourly Wage)
Computer Use Media Use
Model (A) Model (B) Model (A) Model (B)
Computer Use Leisure 0.0006 -0.0006 - -
(Minutes) (0.0004) (0.001)
Media Use Leisure - - 0.0003*** 0.0002
(Minutes)
(0.00008) (0.0002)
Female (Male as the reference) -0.07*** -0.158 -0.07*** -0.155
(0.02) (0.19) (0.02) (0.19)
Education (No education as the reference)
Primary School -0.07 -0.07 -0.07 -0.07
(0.06) (0.06) (0.06) (0.06)
Secondary School 0.101*** 0.104*** 0.099** 0.103***
(0.04) (0.039) (0.04) (0.04)
High School 0.065* 0.07* 0.064* 0.07*
(0.04) (0.037) (0.04) (0.04)
College Graduate 0.147*** 0.15*** 0.15*** 0.153***
(0.04) (0.04) (0.04) (0.04)
Municipal Area (Rural 0.115*** -0.24 0.11*** -0.24
as the reference) (0.02) (0.19) (0.02) (0.19)
Experience -0.035*** -0.033*** -0.03*** -0.03***
(0.009) (0.009) (0.009) (0.009)
Experience2 -0.0009*** -0.0009*** -0.0009*** -0.001***
(0.00009) (0.00009) (0.00009) (0.00009)
Marital Status (Single as the reference)
Married 0.07*** 0.295 0.063*** 0.29
(0.02) (0.207) (0.02) (0.21)
Divorced/Separated and Others -0.04 0.667* -0.04 0.67*
(0.04) (0.37) (0.04) (0.37)

103
Table 3.3 (Continued)
Independent Variables
log (Hourly Wage)
Computer Use Media Use
Model (A) Model (B) Model (A) Model (B)
Age 0.05*** 0.049*** 0.049*** 0.05***
(0.01) (0.013) (0.01) (0.013)
Age2 0.0007*** 0.0007*** 0.0007*** 0.0007***
(0.0001) (0.0001) (0.0001) (0.0001)
Household Head (Non-
household 0.068*** 0.111 0.068*** 0.11
head as the reference) (0.02) (0.21) (0.02) (0.21)
Firm Size (Small as 0.22*** 0.226*** 0.215*** 0.23***
the reference) (0.02) (0.02) (0.02) (0.02)
Occupation (Low-skilled as the reference)
Professionals and Managers 0.463*** 0.467*** 0.464*** 0.47***
(0.03) (0.03) (0.03) (0.03)
Technicians 0.368*** 0.367*** 0.364*** 0.37***
(0.03) (0.029) (0.03) (0.029)
Clerk, sales and services 0.257*** 0.256*** 0.255*** 0.26***
(0.03) (0.029) (0.03) (0.029)
Industry (Agricultural is the reference)
Manufacturing 0.05 0.052 0.04 0.053
(0.10) (0.10) (0.10) (0.098)
Service -0.09 -0.083 -0.09 -0.083
(0.09) (0.093) (0.09) (0.094)
Percent of Computer Use Leisure - 0.01 - 0.01
Female
(0.007)
(0.007)
Percent of Media Use Leisure - 0.002 - 0.0015
Female
(0.002)
(0.002)

104
Table 3.3 (Continued)
Independent Variables
log (Hourly Wage)
Computer Use Media Use
Model (A) Model (B) Model (A) Model (B)
Percent of Personal Care - 0.004* - 0.004*
Female
(0.002)
(0.002)
Percent of Sport leisure - -0.002*** - -0.002***
Female
(0.0009)
(0.0009)
Percent of Recreation - 0.006 - 0.006
Female
(0.007)
(0.007)
Percent of Learning time - -0.004 - -0.004
Female
(0.01)
(0.01)
Percent of Volunteer - 0.004 - 0.004
Activities Female
(0.003)
(0.003)
Percent of Computer Use
Leisure - 0.0065 - 0.006
Household Head
(0.008)
(0.008)
Percent of Media Use Leisure - -0.001 - -0.002
Household Head
(0.003)
(0.003)
Percent of Personal Care - 0.0007 - 0.0007
Household Head
(0.002)
(0.002)
Percent of Sport Leisure - -0.0007 - -0.0007
Household Head
(0.001)
(0.001)
Percent of Recreation - -0.005 - -0.006
Household Head
(0.007)
(0.007)
Percent of Learning - 0.0009 - 0.001
Household Head
(0.012)
(0.01)
Percent of Volunteer - -0.002 - -0.002
Activities Household Head
(0.003)
(0.003)
Percent of Computer Use - 0.008 - 0.003
Municipal Area
(0.009)
(0.005)

105
Table 3.3 (Continued)
Independent Variables
log (Hourly Wage)
Computer Use Media Use
Model (A) Model (B) Model (A) Model (B)
Percent of Learning - -0.003 - -0.003
Marry
(0.01)
(0.01)
Percent of Volunteer Activities - -0.003 - -0.003
Marry
(0.003)
(0.003)
Percent of Computer Use Leisure - -0.003 - -0.003
Other Marital Status
(0.019)
(0.02)
Percent of Media Use Leisure - -0.005 - -0.005
Other Marital Status
(0.005)
(0.005)
Percent of Personal Care - -0.002 - -0.002
Other Marital Status
(0.004)
(0.004)
Percent of Sport Leisure - -0.004** - -0.004**
Other Marital Status
(0.002)
(0.002)
Percent of Recreation - -0.012 - -0.01
Other Marital Status
(0.015)
(0.02)
Percent of Learning - -0.02 - -0.02
Other Marital Status
(0.07)
(0.07)
Percent of Volunteer Activities - 0.002 - 0.002
Other Marital Status
(0.006)
(0.006)
Constant -0.417* -0.40* -0.419* -0.42*
(0.23) (0.23) (0.23) (0.23)
Observations 3,651 3,651 3,651 3,651
R-squared 0.706 0.711 0.706 0.711
Note: Standard errors in parentheses and *** p<0.01, ** p<0.05, * p<0.1

106
Table 3.4 Estimation of log (Hourly Wage) Using Sport and Exercise, and Recreation as
the Independent Variable in 2004
Independent Variables
log (Hourly Wage)
Sport and Exercise Recreation
Model (A) Model (B) Model (A) Model (B)
Sport and Exercise 0.0001 0.0002 - -
(Minutes) (0.0003) (0.0003)
Recreation Time - - 0.0001 0.0013*
(Minutes)
(0.0003) (0.0008)
Female (Male as -0.074*** -0.15 -0.07*** -0.15
the reference) (0.02) (0.19) (0.02) (0.19)
Education (No education as the reference)
Primary School -0.07 -0.07 -0.06 -0.07
(0.06) (0.06) (0.06) (0.06)
Secondary School 0.101*** 0.104*** 0.102*** 0.106***
(0.04) (0.04) (0.04) (0.04)
High School 0.065* 0.07* 0.06* 0.07*
(0.04) (0.04) (0.04) (0.04)
College Graduate 0.149*** 0.152*** 0.148*** 0.151***
(0.04) (0.04) (0.04) (0.04)
Municipal Area (Rural 0.116*** -0.255 0.116*** -0.25
as the reference) (0.02) (0.19) (0.02) (0.19)
Experience -0.036*** -0.033*** -0.036*** -0.033***
(0.009) (0.009) (0.009) (0.009)
Experience2 -0.0009*** -0.001*** -0.0009*** -0.001***
(0.00009) (0.00009) (0.00009) (0.00009)
Marital Status (Single as the reference)
Married 0.065*** 0.30 0.0649*** 0.30
(0.02) (0.21) (0.02) (0.21)
Divorced/Separated and
Others -0.037 0.676* -0.04 0.657*
(0.038) (0.37) (0.04) (0.37)

107
Table 3.4 (Continued)
Independent Variables
log (Hourly Wage)
Sport Recreation
Model (A) Model (B) Model (A) Model (B)
Age 0.051*** 0.049*** 0.05*** 0.05***
(0.01) (0.01) (0.01) (0.01)
Age2 0.0007*** 0.0007*** 0.0007*** 0.0007***
(0.0001) (0.0001) (0.0001) (0.0001)
Household Head (Non- 0.067*** 0.098 0.07*** 0.12
household head as (0.02) (0.21) (0.02) (0.21)
the reference)
Firm size (Small as 0.219*** 0.225*** 0.22*** 0.225***
the reference) (0.02) (0.02) (0.02) (0.02)
Occupation (Low-skilled as the reference)
Professionals and Managers 0.46*** 0.467*** 0.463*** 0.466***
(0.03) (0.03) (0.03) (0.03)
Technicians 0.368*** 0.367*** 0.367*** 0.367***
(0.03) (0.03) (0.03) (0.03)
Clerk, sales and services 0.257*** 0.256*** 0.257*** 0.256***
(0.03) (0.03) (0.03) (0.03)
Industry (Agricultural is the reference) Manufacturing 0.04 0.05 0.04 0.05
(0.098) (0.098) (0.10) (0.10)
Service -0.09 -0.08 -0.09 -0.086
(0.09) (0.09) (0.09) (0.09)
Percent of Computer Use - 0.01 - 0.01
Female
(0.007)
(0.007)
Percent of Media Use - 0.002 - 0.002
Leisure Female
(0.002)
(0.002)

108
Table 3.4 (Continued)
Independent Variables
log (Hourly Wage)
Sport Recreation
Model (A) Model (B) Model (A) Model (B)
Percent of Personal - 0.004* - 0.004*
Care Female
(0.002)
(0.002)
Percent of Sport Leisure - -0.002*** - -0.002***
Female
(0.0009)
(0.0009)
Percent of Recreation - 0.006 - 0.00009
Female
(0.007)
(0.008)
Percent of Learning Time - -0.004 - -0.004
Female
(0.01)
(0.01)
Percent of Volunteer - 0.004 - 0.004
Activities Female
(0.003)
(0.003)
Percent of Computer Use - 0.006 - 0.006
Leisure Household Head
(0.008)
(0.008)
Percent of Media Use - -0.001 - -0.001
Leisure Household Head
(0.003)
(0.003)
Percent of Personal Care - 0.0008 - 0.0006
Household Head
(0.002)
(0.002)
Percent of Sport Leisure - -0.0008 - -0.0007
Household Head
(0.001)
(0.001)
Percent of Recreation - -0.005 - -0.009
Household Head
(0.007)
(0.007)
Percent of Learning - 0.001 - 0.001
Household Head
(0.01)
(0.01)
Percent of Volunteer - -0.002 - -0.002
Activities Household Head
(0.003)
(0.003)
Percent of Computer Use - 0.004 - 0.004
Municipal Area
(0.005)
(0.005)

109
Table 3.4 (Continued)
Independent Variables
log (Hourly Wage)
Sport Recreation
Model (A) Model (B) Model (A) Model (B)
Percent of Media Use Leisure - 0.006** - 0.006**
Municipal Area
(0.002)
(0.002)
Percent of Personal Care - 0.002 - 0.002
Municipal Area
(0.002)
(0.002)
Percent of Sport Leisure - 0.002 - 0.002*
Municipal Area
(0.001)
(0.001)
Percent of Recreation - 0.008 - -0.0008
Municipal Area
(0.007)
(0.008)
Percent of Learning time - 0.005 - 0.005
Municipal Area
(0.01)
(0.01)
Percent of Volunteer - -0.003 - -0.003
Municipal Area
(0.003)
(0.003)
Percent of Computer Use - -0.002 - -0.002
Leisure Marry
(0.008)
(0.008)
Percent of Media Use - -0.002 - -0.002
Leisure Marry
(0.003)
(0.003)
Percent of Personal - -0.003 - -0.003
Care Marry
(0.002)
(0.002)
Percent of Sport - 0.0004 - 0.0004
Leisure Marry
(0.0009)
(0.0009)
Percent of Recreation - -0.009 - -0.01
Marry
(0.007)
(0.007)

110
Table 3.4 (Continued)
Independent Variables
log (Hourly Wage)
Sport Recreation
Model (A) Model (B) Model (A) Model (B)
Percent of Learning - -0.003 - -0.003
Marry
(0.01)
(0.01)
Percent of Volunteer - -0.003 - -0.003
Activities Marry
(0.003)
(0.003)
Percent of Computer Use - -0.003 - -0.003
Leisure Other Marital Status
(0.02)
(0.02)
Percent of Media Use Leisure - -0.005 - -0.005
Other Marital Status
(0.005)
(0.005)
Percent of Personal Care - -0.002 - -0.002
Other Marital Status
(0.004)
(0.004)
Percent of Sport Leisure - -0.004** - -0.005**
Other Marital Status
(0.002)
(0.002)
Percent of Recreation - -0.01 - -0.006
Other Marital Status
(0.015)
(0.016)
Percent of Learning - -0.02 - -0.02
Other Marital Status
(0.07)
(0.07)
Percent of Volunteer Activities - 0.002 - 0.002
Other Marital Status
(0.006)
(0.006)
Constant -0.416* -0.40* -0.42* -0.42*
(0.23) (0.23) (0.23) (0.23)
Observations 3,651 3,651 3,651 3,651
R-squared 0.706 0.711 0.706 0.711
Note: Standard errors in parentheses and *** p<0.01, ** p<0.05, * p<0.1

111
Table 3.5 Estimation of log (Hourly Wage) Using Personal Care and Social Participation
and Volunteer Activities as the Independent Variable in 2004
Independent Variables
log (Hourly Wage)
Personal Care Volunteer Activities
Model (A) Model (B) Model (A) Model (B)
Personal care 0.00002 -0.0002 - -
(Minutes) (0.00008) (0.0002)
Social and Volunteer - - -0.0005*** -0.0006**
Activities (Minutes)
(0.0001) (0.0003)
Female (Male as -0.075*** -0.16 -0.079*** -0.17
the reference) (0.02) (0.19) (0.02) (0.19)
Education (No education as the reference)
Primary School -0.07 -0.07 -0.07 -0.07
(0.06) (0.06) (0.06) (0.06)
Secondary School 0.101*** 0.104*** 0.105*** 0.104***
(0.04) (0.04) (0.04) (0.04)
High School 0.065* 0.07* 0.07* 0.07*
(0.04) (0.04) (0.04) (0.04)
College Graduate 0.149*** 0.152*** 0.151*** 0.153***
(0.04) (0.04) (0.04) (0.04)
Municipal Area (Rural 0.116*** -0.22 0.115*** -0.24
as the reference) (0.02) (0.19) (0.02) (0.19)
Experience -0.036*** -0.03*** -0.035*** -0.03***
(0.009) (0.009) (0.009) (0.009)
Experience2 -0.0009*** -0.001*** -0.0009*** -0.001***
(0.00009) (0.00009) (0.00009) (0.00009)
Marital Status (Single as the reference)
Married 0.065*** 0.29 0.06*** 0.29
(0.02) (0.21) (0.02) (0.21)
Divorced/Separated -0.04 0.65* -0.04 0.67*
and Others (0.04) (0.37) (0.04) (0.37)
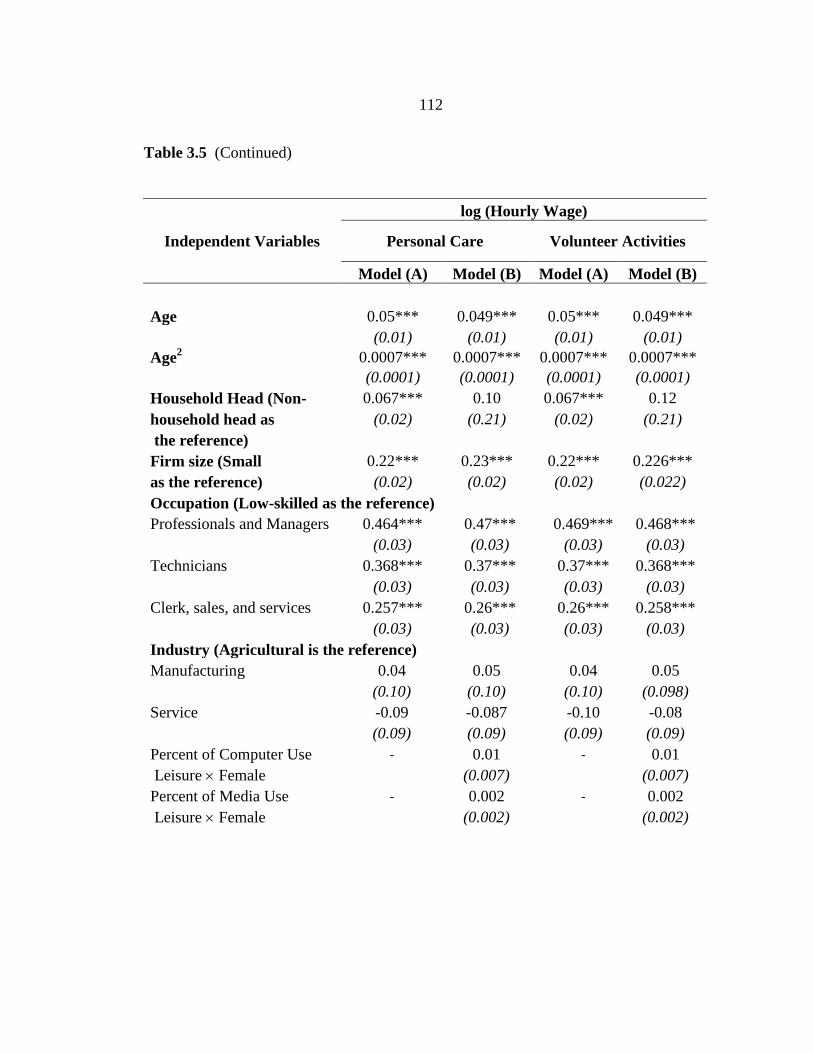
112
Table 3.5 (Continued)
Independent Variables
log (Hourly Wage)
Personal Care Volunteer Activities
Model (A) Model (B) Model (A) Model (B)
Age 0.05*** 0.049*** 0.05*** 0.049***
(0.01) (0.01) (0.01) (0.01)
Age2 0.0007*** 0.0007*** 0.0007*** 0.0007***
(0.0001) (0.0001) (0.0001) (0.0001)
Household Head (Non- 0.067*** 0.10 0.067*** 0.12
household head as (0.02) (0.21) (0.02) (0.21)
the reference)
Firm size (Small 0.22*** 0.23*** 0.22*** 0.226***
as the reference) (0.02) (0.02) (0.02) (0.022)
Occupation (Low-skilled as the reference)
Professionals and Managers 0.464*** 0.47*** 0.469*** 0.468***
(0.03) (0.03) (0.03) (0.03)
Technicians 0.368*** 0.37*** 0.37*** 0.368***
(0.03) (0.03) (0.03) (0.03)
Clerk, sales, and services 0.257*** 0.26*** 0.26*** 0.258***
(0.03) (0.03) (0.03) (0.03)
Industry (Agricultural is the reference)
Manufacturing 0.04 0.05 0.04 0.05
(0.10) (0.10) (0.10) (0.098)
Service -0.09 -0.087 -0.10 -0.08
(0.09) (0.09) (0.09) (0.09)
Percent of Computer Use - 0.01 - 0.01
Leisure Female
(0.007)
(0.007)
Percent of Media Use - 0.002 - 0.002
Leisure Female
(0.002)
(0.002)

113
Table 3.5 (Continued)
Independent Variables
log (Hourly Wage)
Personal Care Volunteer Activities
Model (A) Model (B) Model (A) Model (B)
Percent of Personal - 0.004* - 0.004*
Care Female
(0.002)
(0.002)
Percent of Sport - -0.003*** - -0.002***
Leisure Female
(0.0009)
(0.0009)
Percent of Recreation - 0.006 - 0.006
Female
(0.007)
(0.007)
Percent of Learning Time - -0.004 - -0.004
Female
(0.01)
(0.01)
Percent of Volunteer - 0.004 - 0.007**
Activities Female
(0.003)
(0.003)
Percent of Computer Use - 0.006 - 0.006
Leisure Household Head
(0.008)
(0.008)
Percent of Media Use Leisure - -0.001 - -0.001
Household Head
(0.003)
(0.003)
Percent of Personal Care - 0.001 - 0.0007
Household Head
(0.002)
(0.002)
Percent of Sport Leisure - -0.0009 - -0.0008
Household Head
(0.001)
(0.001)
Percent of Recreation - -0.005 - -0.006
Household Head
(0.007)
(0.007)
Percent of Learning - 0.001 - 0.0009
Household Head
(0.01)
(0.01)
Percent of Volunteer - -0.002 - -0.00001
Activities Household Head
(0.003)
(0.003)
Percent of Computer Use - 0.003 - 0.003
Municipal Area
(0.005)
(0.005)
Percent of Media Use Leisure - 0.005** - 0.006**
Municipal Area
(0.002)
(0.002)

114
Table 3.5 (Continued)
Independent Variables
log (Hourly Wage)
Personal Care Volunteer Activities
Model (A) Model (B) Model (A) Model (B)
Percent of Personal Care - 0.002 - 0.002
Municipal Area
(0.002)
(0.002)
Percent of Sport Leisure - 0.0008 - 0.001
Municipal Area
(0.001)
(0.001)
Percent of Recreation - 0.007 - 0.008
Municipal Area
(0.007)
(0.007)
Percent of Learning time - 0.005 - 0.005
Municipal Area
(0.01)
(0.01)
Percent of Volunteer - -0.003 - -0.00006
Municipal Area
(0.003)
(0.003)
Percent of Computer Use - -0.002 - -0.001
Leisure Marry
(0.008)
(0.008)
Percent of Media Use - -0.002 - -0.002
Leisure Marry
(0.003)
(0.003)
Percent of Personal - -0.003 - -0.003
Care Marry
(0.002)
(0.002)
Percent of Sport - 0.0001 - 0.0003
Leisure Marry
(0.001)
(0.0009)
Percent of Recreation - -0.009 - -0.009
Marry
(0.007)
(0.007)

115
Table 3.5 (Continued)
Independent Variables
log (Hourly Wage)
Personal Care Volunteer Activities
Model (A) Model (B) Model (A) Model (B)
Percent of Learning Marry - -0.003 - -0.003
(0.01)
(0.01)
Percent of Volunteer - -0.003 - -0.001
Activities Marry
(0.003)
(0.003)
Percent of Computer Use - -0.003 - -0.003
Leisure Other Marital Status
(0.02)
(0.02)
Percent of Media Use Leisure - -0.005 - -0.005
Other Marital Status
(0.005)
(0.005)
Percent of Personal Care - -0.002 - -0.002
Other Marital Status
(0.004)
(0.004)
Percent of Sport Leisure - -0.005** - -0.004**
Other Marital Status
(0.002)
(0.002)
Percent of Recreation - -0.02 - -0.01
Other Marital Status
(0.015)
(0.02)
Percent of Learning - -0.02 - -0.02
Other Marital Status
(0.07)
(0.07)
Percent of Volunteer Activities - 0.002 - 0.002
Other Marital Status
(0.006)
(0.006)
Constant -0.43* -0.27 -0.39* -0.38
(0.24) (0.26) (0.23) (0.23)
Observations 3,651 3,651 3,651 3,651
R-squared 0.706 0.711 0.707 0.711
Note: Standard errors in parentheses and *** p<0.01, ** p<0.05, * p<0.1

116
Table 3.6 Estimation of log (Hourly Wage) Using Learning during Leisure Time as the
Independent Variable in 2004
Independent Variables
log (Hourly Wage)
Learning
Model (A) Model (B)
Learning in Leisure Time (Minutes) -0.0003 -0.001
(0.0005) (0.002)
Female (Male as the reference) -0.075*** -0.16
(0.02) (0.19)
Education (No education as the reference)
Primary School -0.07 -0.07
(0.06) (0.06)
Secondary School 0.101*** 0.104***
(0.04) (0.04)
High School 0.065* 0.07*
(0.04) (0.04)
College Graduate 0.148*** 0.152***
(0.04) (0.04)
Municipal Area (Rural 0.116*** -0.24
as the reference) (0.02) (0.19)
Experience -0.036*** -0.03***
(0.009) (0.009)
Experience2 -0.0009*** -0.001***
(0.00009) (0.00009)
Marital Status (Single as the
reference)
Married 0.065*** 0.30
(0.02) (0.21)
Divorced/Separated and Others -0.04 0.666*
(0.04) (0.37)

117
Table 3.6 (Continued)
Independent Variables
log (Hourly Wage)
Learning
Model (A) Model (B)
Age 0.05*** 0.049***
(0.01) (0.01)
Age2 0.0007*** 0.0007***
(0.0001) (0.0001)
Household Head (Non-household 0.067*** 0.11
head as the reference) (0.02) (0.21)
Size of the firm 0.22*** 0.226***
(Small as the reference) (0.02) (0.02)
Occupation (Low-skilled as the reference)
Professionals and Managers 0.464*** 0.467***
(0.03) (0.03)
Technicians 0.368*** 0.367***
(0.03) (0.03)
Clerk, sales, and services 0.257*** 0.256***
(0.03) (0.03)
Industry (Agricultural is the reference)
Manufacturing 0.04 0.05
(0.10) (0.10)
Service -0.09 -0.08
(0.09) (0.09)
Percent of Computer Use Leisure Female - 0.01
(0.007)
Percent of Media Use Leisure Female - 0.002
(0.002)

118
Table 3.6 (Continued)
Independent Variables
log (Hourly Wage)
Learning
Model (A) Model (B)
Percent of Personal Care Female - 0.004*
(0.002)
Percent of Sport leisure Female - -0.002***
(0.0009)
Percent of Recreation Female - 0.006
(0.007)
Percent of Learning time Female - 0.001
(0.01)
Percent of Volunteer Activities Female - 0.004
(0.003)
Percent of Computer Use Leisure - 0.006
Household Head
(0.008)
Percent of Media Use Leisure - -0.001
Household Head
(0.003)
Percent of Personal Care - 0.0007
Household Head
(0.002)
Percent of Sport Leisure - -0.0007
Household Head
(0.001)
Percent of Recreation - -0.005
Household Head
(0.007)
Percent of Learning - 0.006
Household Head
(0.01)
Percent of Volunteer Activities - -0.002
Household Head
(0.003)
Percent of Computer Use - 0.003
Municipal Area
(0.005)
Percent of Media Use Leisure - 0.006**
Municipal Area
(0.002)

119
Table 3.6 (Continued)
Independent Variables
log (Hourly Wage)
Learning
Model (A) Model (B)
Percent of Personal Care - 0.002
Municipal Area
(0.002)
Percent of Sport Leisure - 0.002
Municipal Area
(0.001)
Percent of Recreation - 0.008
Municipal Area
(0.007)
Percent of Learning time - 0.01
Municipal Area
(0.02)
Percent of Volunteer Activities - -0.003
Municipal Area
(0.003)
Percent of Computer Use Leisure - -0.002
Marry
(0.008)
Percent of Media Use Leisure Marry - -0.003
(0.003)
Percent of Personal Care Marry - -0.003
(0.002)
Percent of Sport Leisure Marry - 0.0004
(0.0009)
Percent of Recreation Marry - -0.009
(0.007)
Percent of Learning Marry - -0.001
(0.01)
Percent of Volunteer Activities Marry - -0.003
(0.003)
Percent of Computer Use Leisure - -0.003
Other Marital Statuses
(0.02)
Percent of Media Use Leisure - -0.005
Other Marital Statuses
(0.005)

120
Table 3.6 (Continued)
Independent Variables
log (Hourly Wage)
Learning
Model (A) Model (B)
Percent of Personal Care - -0.002
Other Marital Statuses
(0.004)
Percent of Sport Leisure - -0.005**
Other Marital Statuses
(0.002)
Percent of Recreation - -0.01
Other Marital Statuses
(0.015)
Percent of Learning - -0.03
Other Marital Statuses
(0.07)
Percent of Volunteer - 0.002
Other Marital Statuses
(0.006)
Constant -0.41* -0.40*
(0.23) (0.23)
Observations 3,651 3,651
R-squared 0.706 0.711
Note: Standard errors in parentheses and *** p<0.01, ** p<0.05, * p<0.1
121
3.5.1 Socio-Demographic Variables and Wage Change
The regression of the effect time use behavior in computer use leisure and other
socio-economic characteristics by including data in 2004 illustrates the significant
relationship between wage change and some other variables. Tables 3.3-3.6 present the
determinants of wage change by using each of the 7 leisure activities and other control
variables as in Model (A) and Model (B). The coefficients estimating how other variables
affect hourly wage when comparing the two models are not so different. Most education
dummies substantially affect wage change, especially for high school and college
graduates. The regression reveals that an individual’s wage is induced by 6-7% for high
school graduates and approximately 15% more for university graduates compared with
those that are not educated. Notice that the lower education dummy, primary school,
receives a lower wage than the uneducated group. The reason is that those people are all
categorized as low skilled labor and usually earn the same level of wage, the minimum
level. One year of age increase raises the wage by approximately 5%, while experience
provides a small negative effect on wage change, as a one year increase of experience
reduces by around 3-3.5% of the wage change.
According to the regression model in (A) and (B), the earning gap between the
married and singles is around 6.63-6.67%. Also, the models confirm the result with
approximately 7% higher wages of heads of households. Earners in municipal areas
receive 11.5% greater wages. Considering the relationship between wage change and
occupation, professionals and technicians receive the highest wage per hour, about 46-
47% greater than low-skilled related occupations, whereas clerks and salespersons earn
25-26% higher wages. The findings also confirm that the size of the firm matters, as
evidenced by a 21-22% greater amount of wage for those working in large firms.
3.5.2 Leisure Time Activities and Wage Change
The result obtained from Table 3.3 signifies that, with the confidence level at
95%, a minute change of leisure time consumption of mass media creates a 0.03% change
in wage. This implies that the mass media engaged in during free time through reading,
watching TV, and listening to music and radio contribute to a positive change in wage per
hour. On the other hand, computer use leisure is not significantly related to wage change.
Although sport and exercise have been accepted to be physical and health improvement
122
activities, as well as widely recognized in terms of enjoyment, there are thousands of
observations, out of approximately 20,000 people, allocating leisure time for sport and
exercise. However, the relationship between wage per hour change and time for sport and
exercise leisure presented in Table 3.4 is unclear, whereas the log (wage per hour)
estimation using recreation obtained from Model (B) reveals the significance of the
influence of time for recreation on hourly wage change. The findings indicate that one
minute of recreation time use causes a 0.13% enhancement in wages, with a 90% level of
confidence.
Comprising time for sleeping, eating and personal care, leisure time for personal
care significantly indicates a negative relationship to wage per hour change. The results
presented in Table 3.5 indicate an insignificant negative relationship. The result indicates
that Thai people’s time use for personal care does not contribute to a benefit from good
appearance. In addition, the increase in time use for personal care possibly deteriorates
wage by raising opportunity costs, reducing opportunity to work, and skill improvement
for higher wages. Similarly, even though both social participation within the community
and society develop interpersonal relationships, create a connection and contribute to
wage increase (Ioannides and Sortevent, 2006: 270-273 and Bandiera et al., 2009: 1073-
1078), the finding presented in Table 3.5 indicates a 0.05%-0.06% wage reduction in
response to a one minute increase of time for social activities, as presented in Model (A)
and Model (B). Hence, in this study, by employing the Time Use Survey and Labor Force
Survey of Thailand, leisure time for social participation and volunteer activities is
inversely correlated with hourly wage change with a small effect.
Besides time use for the leisure activities mentioned previously, some people
choose to become involved in additional learning during their free time. Time for
learning during leisure time does not include education for a higher degree or all further
education - related learning and training. The activity of learning, even in leisure time,
also aims to generate more skills and productivity. Whether learning as leisure
significantly improves an individual’s wage by applying Model (A) and Model (B) is
examined and the results are presented in Table 3.6. The regressions, by including time
for learning during leisure in the models estimated, indicate negative changes of wage in
response to a change in learning during leisure time. Although the findings presented in
the same table imply that individuals gain additional returns for a higher educational

123
level, especially for university graduates, the wage gaps compared with the uneducated
range from 14% to 15% higher, so learning during leisure time in each model
specification does not show a considerable impact. An inverse relationship between time
for learning as leisure ratio and wage change is found, but insignificantly. Also, the result
does not confirm wage differences among people with equal leisure time use for learning.
Some interaction terms in Model (B) also influence wage per hour. The
regression result also indicates that when persons spend equal time for media use, those
living in municipal areas receive a higher wage by 0.06%, except when leisure by media
use is included in the regression, which provides only a 0.05% difference in wage
received by earners in these areas. Moreover, people whose marital status other than
single or married earn 0.4% less per hour, given equal time dedicated for sport leisure.
The interaction terms also reveal gender wage inequality. With equal time for
sport activities in leisure, females receive a lower wage than males at around 0.2%-0.3%.
With an equal amount of time use for personal care, females receive a greater hourly
wage by 0.4%, with a 90% level of confidence. This implies that personal care activities
are more beneficial to females than to males. The regression for ln (wage) using social
activities and volunteer activities as an independent variable, as in Table 3.5, additionally
indicates wage inequality among earners devoting time to society. Moreover, females
receive higher hourly wages at around 0.7%, given the equal time contributed to social
participation and volunteer activities, with a p-value of 0.1.
3.6 Is Leisure a Normal Good for the Thai People?—A Reinvestigation
The finding obtained from Essay 2, Is Leisure a Normal Good for the Thai
People?, indicates that leisure is a normal good, as evidenced by the positive relationship
between percentage change in leisure time and hourly wage, while the findings from the
last section reveal that leisure time devoted to some activities significantly impacts wage
change. This implies that wage is endogenous. Therefore, it is possible that the findings,
as expressed in the last section and as regressed by the OLS estimates, are biased. In the
section, an extension was conducted to find out whether leisure is really a normal good
by re-estimating the impact of hourly wage change on percentage change of leisure time
by employing instrumental variable (IV) estimates. Average wage by sub-district or

124
Tambol is applied as the instrumental variable, as wage is highly correlated with wage
average wage, as evidenced by the correlation at 0.57. At the same time, average wage by
Tambol and leisure time in all measures are lowly correlated, from 0.0002 to 0.06.
Leisure is divided into four measures (Aguiar and Hurst, 2007: 983-987). Leisure
Measure 1 refers to the summation of time spent on “entertainment/social
activities/relaxing” and “active recreation.” Those activities involve direct enjoyment,
whereas Leisure Measure 2 includes Leisure Measure 1 as well as time allocated to
sleeping, eating, and personal care, the activities providing direct utility, but also
considered as intermediate inputs at the same time. The broader leisure measure, Leisure
Measure 3, includes time for Leisure Measure 2 plus time dedicated for childcare.
Finally, the broadest measure of leisure, Leisure Measure 4, is defined as the residual of
total work or Leisure Measure 3, as well as time spent for education and civic and
religious activities (going to church, volunteering, social club, etc.). The results of the IV
estimates for Leisure Measure 1-4, compared with the OLS reports, are presented in
Table 3.7 and Table 3.8.

125
Table 3.7 Least Square and Instrumental Variable Estimation for log (Leisure Measure
1) and log (Leisure Measure 2) in 2004
Independent Variables
log (Leisure Time) as the Dependent Variable
log (Leisure Measure 1) log (Leisure Measure 2)
OLS IV OLS IV
Regression Regression Regression Regression
log (Hourly wage) 0.659*** 6.27*** 0.079*** 0.94***
(0.08) (0.44) (0.01) (0.06)
log (Monthly income) -0.67*** -5.22*** -0.08*** -0.78***
(0.08) (0.36) (0.01) (0.05)
Age 0.01 -0.03 -0.003 -0.01***
(0.02) (0.02) (0.002) (0.004)
Age2 -00008 0.0002 0.00004 0.00002
(0.0002) (0.0003) (0.00003) (0.0004)
Female (Male as -0.26*** -0.25*** -0.06*** -0.06***
the reference) (0.05) (0.08) (0.007) (0.01)
Education (No education as the reference)
Primary School -0.167* 0.54*** 0.003 0.11***
(0.10) (0.16) (0.01) (0.02)
Secondary School -0.07 -0.08 -0.002 -0.004
(0.09) (0.15) (0.01) (0.02)
High School 0.207** -0.35** 0.01 -0.07***
(0.09) (0.15) (0.01) (0.02)
College Graduate 0.23*** 0.47*** 0.002 -0.11***
(0.08) (0.14) (0.01) (0.02)
Marital Status (Single as the reference)
Married 0.156*** 0.04 0.0008 -0.02
(0.06) (0.09) (0.008) (0.01)
Divorced/Separated -0.09 -0.19 -0.01 -0.03
and Others (0.11) (0.17) (0.015) (0.02)

126
Table 3.7 (Continued)
Independent Variables
log (Leisure Time) as the Dependent Variable
log (Leisure Measure 1) log (Leisure Measure 2)
OLS IV OLS IV
Regression Regression Regression Regression
Area (Rural as the -0.04 -0.13 0.012 -0.002
reference) (0.07) (0.095) (0.008) (0.01)
Household head (Non- -0.009 0.22*** -0.001 0.03***
household head as (0.05) (0.086) (0.007) (0.01)
the reference) Day (Sunday as the reference)
Monday -0.215** -0.20 -0.147*** -0.15***
(0.10) (0.16) (0.01) (0.02)
Tuesday -0.305*** -0.18 -0.155*** -0.14***
(0.10) (0.15) (0.01) (0.02)
Wednesday -0.344*** -0.37** -0.17*** -0.18***
(0.10) (0.15) (0.01) (0.02)
Thursday -0.375*** -0.27* -0.16*** -0.14***
(0.10) (0.16) (0.01) (0.02)
Friday -0.29*** -0.39*** -0.17*** -0.19***
(0.10) (0.15) (0.01) (0.02)
Saturday 0.03 0.08 -0.043*** -0.04
(0.10) (0.15) (0.0136) (0.02)
Firm size: large (Small 0.14** -1.10*** 0.001 -0.19***
as the reference) (0.07) (0.14) (0.009) (0.02)

127
Table 3.7 (Continued)
Independent Variables
log (Leisure Time) as the Dependent Variable
log (Leisure Measure 1) log (Leisure Measure 2)
OLS IV OLS IV
Regression Regression Regression Regression
Occupation (Elementary as the reference)
Professionals and
executives 0.06 -1.04*** 0.022* -0.15***
(0.09) (0.16) (0.01) (0.02)
Technicians 0.21** -0.43*** 0.055*** -0.14**
(0.08) (0.14) (0.01) (0.02)
Sales, services and clerk 0.234*** -0.58*** 0.03*** -0.09***
(0.08) (0.14) (0.01) (0.02)
Industry (Agricultural is the reference)
Manufacturing 0.07 0.68 -0.08* 0.02
(0.28) (0.44) (0.04) (0.06)
Service 0.11 0.44 -0.02 0.03
(0.27) -0.42 -0.04 (0.06)
Constant 9.20*** 43.08*** 7.46*** 12.68***
(0.70) (2.75) (0.10) (0.41)
Observations 3,657 3,651 3,657 3,651
R-squared 0.089 0.127
Note: Standard errors in parentheses and *** p<0.01, ** p<0.05, * p<0.1

128
Table 3.8 Least Square and Instrumental Variable Estimation for log (Leisure Measure
3) and log (Leisure Measure 4) in 2004
Independent Variables
log (Leisure Time) as the Dependent Variable
log (Leisure Measure 3) log (Leisure Measure 4)
OLS IV OLS IV
Regression Regression Regression Regression
log (Hourly wage) 0.082*** 0.95*** 0.078*** 0.95***
(0.01) (0.06) (0.01) (0.06)
log (Monthly income) -0.082*** -0.79*** -0.092*** -0.80***
(0.01) (0.05) (0.01) (0.05)
Age -0.003 -0.009*** -0.002 -0.008**
(0.002) (0.003) (0.002) (0.004)
Age2 0.00003 0.00002 0.00002 0.000006
(0.00003) (0.00004) (0.00003) (0.00004)
Female (Male as the -0.056*** -0.05*** -0.062*** -0.06***
reference) (0.007) (0.01) (0.007) (0.01)
Education (No education as the reference)
Primary School 0.004 0.11*** 0.001 0.11***
(0.01) (0.02) (0.01) (0.02)
Secondary School -0.003 -0.006 0.003 0.001
(0.01) (0.02) (0.01) (0.02)
High School 0.01 -0.08*** 0.006 -0.08***
(0.01) (0.02) (0.01) (0.02)
College Graduate 0.002 -0.11*** -0.002 -0.11***
(0.01) (0.02) (0.01) (0.02)
Marital Status (Single as the reference)
Married 0.004 -0.01 -0.0005 -0.02
(0.008) (0.01) (0.008) (0.01)
Divorced/Separated -0.008 -0.02 0.005 -0.01
and Others (0.01) (0.02) (0.015) (0.02)

129
Table 3.8 (Continued)
Independent Variables
log (Leisure Time) as the Dependent Variable
log (Leisure Measure 3) log (Leisure Measure 4)
OLS IV OLS IV
Regression Regression Regression Regression
Area (Rural as the 0.01 -0.009 0.006 -0.008
reference) (0.008) (0.01) (0.009) (0.01)
Household Head (Non- -0.0003 0.036*** 0.002 0.04***
household head as (0.007) (0.01) (0.007) (0.01)
the reference) Day (Sunday as the reference)
Monday -0.149*** -0.15*** -0.177*** -0.17***
(0.01) (0.02) (0.01) (0.02)
Tuesday -0.157*** -0.14*** -0.187*** -0.17***
(0.01) (0.02) (0.01) (0.02)
Wednesday -0.173*** -0.18*** -0.20*** -0.21***
(0.01) (0.02) (0.01) (0.02)
Thursday -0.16*** -0.14*** -0.18*** -0.16***
(0.01) (0.02) (0.01) (0.02)
Friday -0.176*** -0.19*** -0.199*** -0.21***
(0.01) (0.02) (0.01) (0.02)
Saturday -0.047*** 0.04* -0.06*** -0.056**
(0.01) (0.02) (0.01) (0.02)
Firm's size: large (Small 0.001 -0.19*** 0.018* -0.18***
as the reference) (0.009) (0.02) (0.009) (0.02)

130
Table 3.8 (Continued)
Independent Variables
log (Leisure Time) as the Dependent Variable
log (Leisure Measure 3) log (Leisure Measure 4)
OLS IV OLS IV
Regression Regression Regression Regression
Occupation (Elementary as the reference)
Professionals and executives 0.021* -0.15*** 0.043*** -0.13***
(0.01) (0.02) (0.01) (0.02)
Technicians 0.055*** -0.04** 0.066*** -0.03**
(0.01) (0.02) (0.01) (0.02)
Sales, services, and clerk 0.029** -0.096*** 0.04*** -0.08
(0.01) (0.02) (0.01) (0.02)
Industry (Agricultural is the reference)
Manufacturing -0.076** 0.02 -0.079** 0.02
(0.04) (0.06) (0.04) (0.06)
Service -0.02 0.03 -0.02 0.03
(0.04) (0.06) (0.04) (0.06)
Constant 7.48*** 12.74*** 7.60*** 12.89***
(0.10) (0.41) (0.10) (0.41)
Observations 3,657 3,651 3,657 3,651
R-squared 0.130 0.155
Note: Standard errors in parentheses and *** p<0.01, ** p<0.05, * p<0.1

131
The result shows a greater magnitude when IV regression is applied. The
Hausman test confirms the significant differences reported between the OLS and IV
regression2. The gender gap remains unchanged, as considered from leisure in all
measures. Males take approximately 25-26% longer time for Leisure Measure 1, while
the leisure gaps in other measures are around 5-6%. Females’ shorter daily leisure
emphasizes the social structure in Thailand whereby males have the opportunity to
choose to work in the market while females are responsible to devote time for housework
and home production even those females also have to work in the market. Neither least
square nor IV estimations confirm how marital status is related to leisure time use. On the
other hand, higher level of education is found to affect leisure time use. These two groups
appear to take comparatively longer leisure than the uneducated and lower educated.
Again, the widest leisure gaps can be detected in the Leisure Measure 1 estimates, with
35% and 47% shorter daily leisure for the high school and university graduate,
respectively, while leisure the gaps of leisure in other measures are only 7%-11%. The
secondary school graduated are leisure lovers, compared with other groups, as evidenced
by the significant report of 54% longer than the uneducated for Leisure Measure 1 and
11% greater for leisure in other measures, according to the IV regression. The social
structure is also supported by the estimates of household heads. From the Time Use
Survey, it was seen that there are 13,330 male household heads while there were only
6,551 females leading the household. The significantly longer leisure time of household
heads also highlights gender leisure time inequality in Thailand.
The IV estimates also prove the negative relationship between age and leisure
time change. A one year age increase reduces one percent or less for Leisure Measure 2-
4. While the findings do not reveal how areas, (municipal and non-municipal), affect the
leisure time, the impact of occupation on leisure time use is as shown in the result,.
According to the detailed estimation in Tables 3.7-3.8, professionals and managers turns
out to be the group that spend the shortest leisure time; these results are different from
what was reported in the least square regression. Professionals and managers significantly
take less leisure time, especially for Leisure Measure 1, at more than one hundred percent
2
The Hausman test results for Leisure Measure 1-4 are 442.58***, 543.09***, 558.21*** and 554.61***
respectively, indicating the significant differences between OLS and IV estimates.

132
higher compared with the unskilled workers, and approximately 13-15% less for the other
measures of leisure. Technicians, clerks, sales and service employees consume 43% less
pure leisure time. The results for the broader leisure measures change mostly indicate
wider gaps among people in dissimilar occupations.
While occupation plays a significant role in leisure time, only the manufacturing
industry is found to influence the allocation of time for Leisure Measures 2-4; however,
the IV estimates do not confirm any significant relationship between leisure time and the
industry each person is working in. Opposite the finding from the OLS regression, the IV
estimation results report that employees in large firms clearly allocate less leisure time
for Leisure Measure 1 at more than one hundred percent less, and for other measures of
leisure, around 18-19%.
From the regressions of the days of a week, it is unsurprising to find that people
spend the greatest amount of time for leisure on Sunday, and Saturday is the day
individuals significantly take the second-longest time for Leisure Measure 3-4. The
estimations clearly indicate leisure time differences among the days of the week. The IV
estimates indicate that the day people take the least leisure time is Friday for pure leisure
giving direct enjoyment, Leisure Measure 1, 39% less than Sunday, and other measures,
19-21% less, followed by Wednesday, with 18-37% less amount of leisure time than on
Sunday.
The IV estimation indicates a much stronger magnitude of log (hourly wage) and
log (monthly income) on log (leisure time). Whereas hourly wage is the average wage per
hour received by wage earners, monthly income is the summation of wage, overtime,
bonus, and other money income. People seem to be the most responsive to pure leisure
time use, Leisure Measure 1. A one percent increase in hourly wage boosts leisure time
by more than 600 percent. However, the impact is offset by the effect of monthly income
change on leisure. A percentage of monthly income enhancement deteriorates Leisure
Measure 1 at around 522 percent. For leisure in the broader measures, a one percent
change in hourly wage leads to a 94-95% positive change. At the same time, a percent of
the entire monthly income change reduces leisure time consumption by around 78-80%.
As monthly income is the total of an individual’s earned income, wage and other
types of income, the effect of monthly income on leisure is likely to be caused by a
combination of the types of income other than wage. From the result from the robust test
133
for overtime, bonuses and other money income, leisure time is evidently and inversely
related to overtime, while bonuses and other money income have only a tiny negative
effect on leisure time use. In the regression models, monthly income is a control variable.
Hourly wage reflects the price effect of leisure time, which can explain wage earner time
use behavior more efficiently. Therefore, the positive impact of hourly wage change on
leisure time change implies that leisure is a normal good for wage earners.
3.7 Conclusion and Policy Implications
In general, it is understood that wage is directly correlated with education and
work experience. Additionally, there are some socio-economic characteristics that
possibly contributing to wage. However, the activity that is generally recognized for
physical and mental relaxation, such as leisure, has not been examined as to whether it
could result in wage improvement. Besides the findings on the socio-economic
characteristics that affect wage change, as well as wage gaps among people of different
status, educational levels occupations, industries, and geographical zones. The study tests
how time use for seven leisure activities is related to the wages of Thai people. Taking
the highest proportion of leisure time, personal care provides a small negative impact on
change of wage, indicating that a higher proportion of time use for media consumption
and recreation provides an increase in hourly wage, while an increase in time for social
participation and volunteer activities slightly reduces wage per hour. This implies that
time consumption for this group of activities possibly raises the opportunity cost of time
for work. Nevertheless, the study could not conclude how computer use, learning during
leisure time, personal care, and sport and exercise impact one’s wage.
The study further re-explores the determinant of leisure time by employing a IV
regression using average wage by sub-district or Tambol as the IV. The findings report a
positive relationship between leisure time and hourly wage, while leisure time use is
inversely related to monthly income. The explanation of the negative effect of monthly
income on leisure time is that monthly income is comprised of an individual’s wage as
well as other income such as overtime, bonus and others, which are evidently and
negative correlated with leisure time use, while the relationship between wage and leisure
time reports positive. This implies that the negative sign is caused by income other than

134
wage. Hence, that the rise in hourly wage leads to a greater amount of leisure time, as
could be interpreted from the estimation results, confirms that leisure is a normal good
for the Thai people.
This paper has proved that it is not necessary to substitute leisure time for wage
improvement, but some leisure activities themselves can create a wage rise, and not just
fulfill and individual’s utility by generating enjoyment. Therefore, supporting productive
leisure time helps raise Thai people’s work efficiency, as well as develops their welfare
through pleasure from leisure and the possibility of consumption gain through wage
increases. For example, stimulating Thai people to read by promoting learning centers
and by developing more recreational parks for increasing time for recreational activities
is a potentially way to create channels to improve Thai workers’ productivity and wages,
which would not only provide economic benefits, but would also improve the utility and
welfare of the Thai people.
Although this empirical study provides time use activity details, additional data
are needed for an exploration of how leisure time use is correlated with wage. For
example, details on the types of programs viewed by audiences are necessary for
analyzing the relations of media time use and wage change. Additionally, more
supporting evidence is needed, for example, an individual’s expenditure for personal care
activities, in order to see how they are related to wage.
3.8 Bibliography
Aguiar, Mark and Hurst, Erik. 2007. Measuring Trends in Leisure: The Allocation of
Time Over Five Decades. Quarterly Journal of Economics. 122 (2): 969-
1006.
Artige, Lionel and Nicolini, Rosalla. 2006. Labor Productivity in Europe: Evidence
from a Sample of Regions. CREPP Working Paper 2006/08. Retrieved
August 31, 2010 from http://www2.ulg.ac.be/crepp/papers/crepp-
wp200706.pdf
Bandiera, Oriana; Barankay, Iwan and Rasul, Imran. 2009. Social Connections and
Incentives in the Workplace: Evidence from Personnel Data. Econometrica.
77 (4): 1047-1094.

135
Benzion, Uri and Epstein, Gil S. 2010. Productivity and Deferring Leisure. Retrieved
August 31, 2010 from http://www.ecosoc.org.au/files/File/TAS/ACE07/
presentations%20(pdf)/Benzion.pdf
Bernaards, C. M.; Jans, M. P.; Van den Heuvel, S. G.; Hendriksen, I. J.; Houtman, I. L.
and Bongers, P. M. 2006. Can Strenuous Leisure Time Physical Activity
Prevent Psychological Complaints in a Working Population? Occupational
and Environmental Medicine. 63 (1): 10-16.
Biddle, Jeff and Hammermesh, Daniel. 1990. Sleep and the Allocation of Time. The
Journal of Political Economy. 98 (5): 922-943.
Brynjolfsson, Erik. 1998. Beyond the Productivity Paradox: Computers are the
Catalyst for Bigger Changes. Retrieved September 3, 2010 from
http://ebusiness.mit.edu/erik/bpp.pdf
Descy, Pascaline and Tessaring, Manfred. 2001. Training and Learning for
Competence: Second Report on Current Vocational Training Research in
Europe: Executive Summary. Codefop Reference Series. Luxembourg:
EUR-OP.
Dolton, Peter and Pelkonen, Panu. 2007. The Impact of Computer Use, Computer
Skills and Computer Use Intensity: Evidence from WER 2004. Retrieved
August 31, 2010 from http://www.bis.gov.uk/assets/biscore/corporate/
migratedD/publications/D/DIUS_Research_Brief_07-CEE-01.
Forbes, Mattew; Barker, Andrew and Turner, Stewart. 2010. The Effects of Education
and Health on Wages and Productivity. Productivity Commission Staff
Working Paper, Melbourne, March.
Gao, Wenshu and Smyth, Russell. 2009. Health Human Capital, Height and Wages
in China. Discussion Paper 05/09. Monash University. Retrieved September
3, 2010 from http://www.buseco.monash.edu.au/eco/research/papers/
2009/0509healthhumangaosmyth.pdf
Gardiner, Martin F. 2000. Music, Learning, and Behavior: A Case for Mental
Stretching. Journal for Learning through Music. Summer: 72-93.
Retrieved September 22, 2010 from http://www.music-in-
education.org/articles/1-R.pdf

136
Gergaud, Olivier and Ginsburgh, Victor. 2010. Success: Talent, Intelligence or
Beauty? Retrieved September 18, 2010 from http://olivier.gergaud.free.fr/
files/Success.pdf
Goh, Soo Khoon. 2009. Is Productivity Linked to Wages? An Empirical
Investigation in Malaysia. CenPRIS WP 102/09. Retrieved September 3,
2010 from http://www.usm.my/cenpris/Is%20Productivity%20Linked%20To
%20Wages%20An%20Empirical%20Investigation%20in%20Malaysia.pdf
Goh, Soo Khoon and Wong, Koi Nyen. 2010. Analyzing the Productivity-Wage-
Unemployment Nexus in Malaysia: Evidence from the Macroeconomic
Perspective. Discussion Paper 12/10. Monash University. Retrieved
September 3, 2010 from http://www.buseco.monash.edu.au/eco/research/
papers/2010/1210productivitygohwong.pdf
Ioannides, Yannis M. and Loury, Linda D. 2004. Job Information Networks,
Neighborhood Effects, and Inequality. Journal of Economic Literature. 42
(4): 1056-1093.
Ioannides, Yannis M. and Soetevent, Adriaan R. 2006. Wages and Employment in a
Random Social Network with Arbitrary Degree Distribution. Consequences
of Social Interactions. 96 (2): 270-274.
Kenny, Charles. 2003. The Internet and Economic Growth in Less-Developed
Countries: A Close of Managing Expectations? Oxford Development of
Studies. 31 (1): 99-113.
Lehr, William and Lichtenberg, Frank R. 1996. Computer Use and Productivity
Growth in Federal Government Agencies, 1987-1992. Working Paper No.
5616. National Bureau of Economic Research (NBER), Cambridge, M.A.
Liu, Jin-Tan; Tsou, Meng-Wen and Hammitt, James K. 2004. Computer Use and
Wages: Evidence from Taiwan. Economics Letters. 82: 43-51.
Maliranta, Mika and Rouvinen, Petri. 2006. Informational Mobility and Productivity:
Finnish Evidence. Economics of Innovation and New Technology. 15 (6):
605-616.
Marcela, C.; Revilla, E. and Jenny, Ruiz G. 2008. Implications of Knowledge Transfer
and ICT on the Level of Labor Productivity in Mexico: An International
Comparative Analysis. Communications of the IBIMA. 2 (22): 163-173.

137
Min, Jie and Jin, Houzhong. 2010. Analysis on Essence, Types and Characteristics of
Leisure Sports. Modern Applied Science. 4 (7): 99-103.
Mitchell, Alice and Savill-Smith, Carol. 2004. The Use of Computer and Video
Games for Learning: A Review of the Literature. United Kingdom:
Learning and Skills Development Agency.
Moeller, Babette. 1996. Learning from Television: A Research Review. CCT Reports.
11: 1-37. Retrieved September 22, 2010 from http://www.aect.org/edtech/
12.pdf
Nana, Ganesh; Sanderson, Kel and Goodchild, Mark. 2002. Economic Impact of
Sport. BERL ref# 4084. Hong Kong Sport Development Board. Retrieved
September 10, 2010 from http://citeseerx.ist.psu.edu/viewdoc/download?
doi=10.1.1.123.8386&rep=rep1&type=pdf
National Statistical Office. 2004a. Labor Force Survey 2004. Bangkok: National
Statistical Office.
National Statistical Office. 2004b. Time Use Survey 2004. Bangkok: National
Statistical Office.
Serneels, Pieter. 2005. Do Wages Reflect Productivity? GPEG-WPS-029. Retrieved
September 3, 2010 from http://www.gprg.org/pubs/workingpapers/pdfs/gprg-
wps-029.pdf
Trigonis, Ioannis; Matsouka, Ourania; Costa, George and Tzetzis, George. 2008. The
Role of Employers’ Demographic and Socio-Economical Characteristics in
Their Decision to Introduce Sports Program in Their Companies.
International Journal of Sport Management, Recreation & Tourism. 1:
1-14.
United Nations. 2005. Sport as a Tool for Development and Peace: Towards
Achieving the United Nations Millennium Development Goals. Retrieved
June 30, 2009 from www.un.org/sport2005/resources/task_force.pdf
United States Department of Labor. Office of the Chief Economist. 1996. Generating
Productivity Growth: A Review of the Role of Workplace Practices and
Computers. Retrieved August 31, 2010 from http://www.dol.gov/oasam/
programs/history/reich/reports/grow.pdf

138
Wakeford, Jeremy. 2004. The Productivity-Wage Relationship in South Africa: An
Empirical Investigation. Development Southern Africa. 21: 109-132.
World Health Organization. 2003. Health and Development Through Physical
Activity and Sport. Retrieved August 20, 2010 from http://whqlibdoc.
who.int/hq/2003/WHO_NMH_NPH_PAH_03.2.pdf

BIOGRAPHY
NAME Siriwan Saksiriruthai
ACADEMIC BACKGROUND B.A. (Economics), Thammasat University,
Bangkok, 1994
LL.B. (Law), Ramkhamhaeng University,
Bangkok, 2008
M.A. (International Economics and Finance),
Chulalongkorn University, Bangkok, 1999