essays on growth and intergenerational links
TRANSCRIPT

Essays on Growth and Intergenerational Links
Dottorando: Giovanni Prarolo
Relatore: Prof. Gianmarco I.P. Ottaviano
Coordinatore: Chiar.mo Prof. Luca Lambertini
Alma Mater Studiorum - Università di Bologna
Dipartimento di Scienze Economiche
Dottorato di Ricerca in Economia - XIX Ciclo
Esame �nale anno 2007
Settore scienti�co disciplinare: SECS-P/01 Economia Politica

ii

Contents
0.1 Motivations . . . . . . . . . . . . . . . . . . . . . . . . . . . . . . v0.2 Intergenerational links: "micro" aspects in a mutable "macro"
world . . . . . . . . . . . . . . . . . . . . . . . . . . . . . . . . . . vi0.3 Chapter 1: "Intergenerational Links and Growth: a Preferences
Approach" . . . . . . . . . . . . . . . . . . . . . . . . . . . . . . . vi0.4 Aging, technology adoption and growth . . . . . . . . . . . . . . vii
0.4.1 Life expectancy and growth literature . . . . . . . . . . . viii0.4.2 Technology adoption literature . . . . . . . . . . . . . . . viii
0.5 Chapter 2: "Aging, Technology Adoption and Growth: a Taxon-omy" . . . . . . . . . . . . . . . . . . . . . . . . . . . . . . . . . . ix
0.6 Chapter 3: "A Politico-Economic Model of Aging, TechnologyAdoption and Growth" . . . . . . . . . . . . . . . . . . . . . . . . x
1 Intergenerational Links and Growth: a Preferences Approach 11.1 Introduction . . . . . . . . . . . . . . . . . . . . . . . . . . . . . . 11.2 The Model . . . . . . . . . . . . . . . . . . . . . . . . . . . . . . 5
1.2.1 Endowments . . . . . . . . . . . . . . . . . . . . . . . . . 51.2.2 Preferences . . . . . . . . . . . . . . . . . . . . . . . . . . 61.2.3 Technologies . . . . . . . . . . . . . . . . . . . . . . . . . 7
1.3 The Equilibrium . . . . . . . . . . . . . . . . . . . . . . . . . . . 71.3.1 Consumers . . . . . . . . . . . . . . . . . . . . . . . . . . 71.3.2 Firms . . . . . . . . . . . . . . . . . . . . . . . . . . . . . 101.3.3 Intertemporal Equilibrium . . . . . . . . . . . . . . . . . . 10
1.4 Dynamics in the intermediate habit case . . . . . . . . . . . . . . 151.4.1 The short run . . . . . . . . . . . . . . . . . . . . . . . . . 151.4.2 The long run . . . . . . . . . . . . . . . . . . . . . . . . . 16
1.5 Simulations . . . . . . . . . . . . . . . . . . . . . . . . . . . . . . 181.6 Conclusions . . . . . . . . . . . . . . . . . . . . . . . . . . . . . . 23
2 Aging, Technology Adoption and Growth: a Taxonomy 292.1 Introduction . . . . . . . . . . . . . . . . . . . . . . . . . . . . . . 292.2 Overview on historical trends . . . . . . . . . . . . . . . . . . . . 302.3 Aging and technology adoption literatures . . . . . . . . . . . . . 322.4 A uni�ed view . . . . . . . . . . . . . . . . . . . . . . . . . . . . 332.5 The model . . . . . . . . . . . . . . . . . . . . . . . . . . . . . . . 34
iii

iv CONTENTS
2.5.1 Agents . . . . . . . . . . . . . . . . . . . . . . . . . . . . . 352.5.2 Production . . . . . . . . . . . . . . . . . . . . . . . . . . 362.5.3 Probability of surviving . . . . . . . . . . . . . . . . . . . 362.5.4 Political mechanism . . . . . . . . . . . . . . . . . . . . . 372.5.5 Timing . . . . . . . . . . . . . . . . . . . . . . . . . . . . 382.5.6 Optimizations . . . . . . . . . . . . . . . . . . . . . . . . . 382.5.7 Intertemporal equilibrium . . . . . . . . . . . . . . . . . . 40
2.6 Policy implications . . . . . . . . . . . . . . . . . . . . . . . . . . 422.7 Conclusions . . . . . . . . . . . . . . . . . . . . . . . . . . . . . . 43
3 A Politico-Economic Model of Aging, Technology Adoption andGrowth (with Francesco Lancia) 473.1 Introduction . . . . . . . . . . . . . . . . . . . . . . . . . . . . . . 473.2 Systemic Innovation . . . . . . . . . . . . . . . . . . . . . . . . . 493.3 The model . . . . . . . . . . . . . . . . . . . . . . . . . . . . . . . 51
3.3.1 Utility, budget constraints and production functions. . . . 523.3.2 Individual optimization with given innovation policy . . . 533.3.3 Endogenous life expectancy . . . . . . . . . . . . . . . . . 533.3.4 Endogenous innovation policy . . . . . . . . . . . . . . . . 563.3.5 Political outcome . . . . . . . . . . . . . . . . . . . . . . . 60
3.4 A simple dynamic exercise . . . . . . . . . . . . . . . . . . . . . . 643.5 Conclusions . . . . . . . . . . . . . . . . . . . . . . . . . . . . . . 66

Introduction
0.1 Motivations
If we think about the history of human society as we know it, we can statethat it began around 10000 years ago, when the �rst populations settled in thefertile lands of the middle east. Under a macroeconomic and demographic pointof view, the more impressive and sizeable changes took place only in the last2% of this period: until the beginning of 18th century, per capita income wereconstant and around 1400$, then, growing at around 1.3-1.4% per year, theper capita income reached today, in industrialized countries, 20000$ (Maddison,2003). At the same time, population multiplied by more than six: in 1800people were less than a billion. Again during the last 200 years, life expectancy,that for millennia swinged between 20 and 35 years, soared up to almost 80years in most industrialized countries. Average formal education, despite theinvention of writing took place 5000 years ago, were still negligible 200 yearsago, while nowadays people spend up to 20 years in acquiring education, fromparental nurture to tertiary education (Lee 2001). One hundred years ago aworker could enjoy less than three years of retirement (usually associated tobad health conditions), now people retire for almost one quarter of their lifeand their pension bene�ts are often paid by people of younger generations.The aim of this dissertation is to jointly study, by means of microfounded
growth models, the abovementioned macroeconomic and demographic aspectsand some intergenerational, microeconomic issues that are described below. Thekind of microeconomic issues that we analyze share the common feature of de-scribing links among generations, in a social and interpersonal fashion. Ouridea, based on the evidence shown above, is that, for millennia, the intergener-ational behavior of di¤erent generations kept replicating itself, since the macro-economic and demographic environment were stable and immobile. Conversely,from the beginning of the Industrial Revolution onward, people face very signi�-cant changes in the macroeconomic and demographic variables within their ownlife span and, in some ways, their behaviors contributes to the changes in the"macro" environment itself. The links among generations are therefore mutablebecause they are embedded in an economic environment that is all-changing inits fundamental features.This introduction is organized as follows: section 2 broadly describes the two
v

vi CONTENTS
microeconomic e¤ects on which we focus our analysis, section 3 resumes the �rstpaper of the thesis, that addresses the presence of habit in education amonggenerations. Section 4 reviews the literatures on aging, technology adoptionand growth. Section 5 presents the second paper, where a taxonomy basedon demographic and economic features of economies is formulated. Section 6resumes the third paper, where a politico-economic model of aging, technologyadoption and growth is implemented.
0.2 Intergenerational links: "micro" aspects ina mutable "macro" world
In this work we focus our attention on two intergenerational aspects that in thelast two centuries experienced big transformations in their nature, due to the im-pressive changes in the macroeconomic and demographic environment stressedabove: the inertia we �nd in the transmission of education from one generationto the next one and the e¤ects (and causes) of the increase in longevity on indi-vidual and collective choices in terms of education and innovation technology.Education at individual level shows a low degree of vertical mobility all over
the world: the inertia in the intrafamiliar transmission of education from onegeneration to the next one seems to be, for a sizeable share, unexplainable bystandard economic theory (Checchi, Ichino and Rustichini, 1999). The evidencecollides with the fact that in many counties di¤erent form of roughly egalitarianschools were introduced decades ago. The �rst chapter of the thesis is devotedto the issues of inertia in educational choices and macroeconomic e¤ects.The lengthening of life expectancy that humanity is experiencing in the last
two centuries comes together with an impressive shift of production systemstoward knowledge and human capital intensive productions. In terms of in-tergenerational links, two are the possible implications of these events: �rst,speci�c institutions are needed in order to maintain, hand down, process andimprove knowledge, such as schools, libraries, databases, etc. (Mokyr, 2002).Second, having knowledge (and, in some ways, human capital) characteristics ofboth an investment and a public good, the need for coordination mechanisms inproducing it is stronger than in the case of other types of factors of production(i.e. physical capital). The aim of the second and third chapters is to introducethis kind of analysis in a theoretical framework where the lengthening of lifeexpectancy is a cause, and in part a consequence, of people�s behavior, lookingat these people as at "generations of societies".
0.3 Chapter 1: "Intergenerational Links and Growth:a Preferences Approach"
The paper in the �rst chapter initially reviews the theoretical literatures onhabit formation (de la Croix, 1996 and 2001 and Banerjee, 2004 among others),

0.4. AGING, TECHNOLOGY ADOPTION AND GROWTH vii
multidimensional bequeathing (Viaene and Zilcha, 2001, Zilcha, 2003, Mookher-jee and Ray, 2005) and "reference group" theory (Piketty, 2000 and Ray, 2003).Empirical evidence about intra-family inertia in educational choices is reported(Brunello and Checchi, 2003 and Checchi, Ichino and Rustichini, 1999). Ermischand Francesconi (2001) stress that an important step that needs to be done isto disentangle the production process of human capital from the preferences ofindividuals upon education.
In order to address this issue, we build an overlapping generations model ableto capture the inertia in individuals�educational choices, that are driven by in-dividual and aggregate variables. Agents are characterized by a utility functionwhere, together with the usual consumption, there are two altruistic ("warmglow" speci�cation) components: the �nancial bequest that their children willget once adult and the investment in their children�s education. The innovationwe introduce in the design of preferences is the presence of the habit term ineducation expenditure, rather than in consumption. Moreover, the habit termis constructed in order to take into account both familiar and social past his-tory: the idea is that a parent more educated than the average of her generationwill invest a higher fraction of her income in her children�s education, and viceversa. This mechanism, joint with the usual general equilibrium adjustmentof factors�prices (human and physical capital�s rental rates), leads to di¤erentsteady states that are driven, in their nature, by the intensity of the habit. Asmall habit concern leads the economy to a separate equilibrium: highly edu-cated people will grow at a rate that is higher relative to the rate of growththat characterized less educated people. Conversely, a big habit concern booststhe counterbalancing e¤ect of general equilibrium adjustment and the economy,after some oscillatory periods, converges to a unique steady state growth rate.However, people separate completely in the investment they do: less educatedpeople end getting no education (and they only pass physical capital to theirchildren) while more educated people only end educating their children.
0.4 Aging, technology adoption and growth
The second and third chapters of this thesis jointly tackle some issues that char-acterize nowadays economies, in particular the lengthening of life expectancy,the increase in years spent both in education and in retirement (at the expensesof working years), the shift toward knowledge and human capital intensive pro-ductions, the big di¤erences in technological policies among quite similar coun-tries. The idea is to joint together, into a unique theoretical framework, twostrands of literature: the one that studies the interactions among demographicvariables (in particular life expectancy) and economic growth and the otherthat explores the politico-economic mechanisms that drives an economy towarddi¤erent innovation policies.

viii CONTENTS
0.4.1 Life expectancy and growth literature
One idea in this literature is that a causal link running from wealth indicators,such as income or human capital, to life expectancy is in place and it is positive.Historians, Biologists and economists support this view: Mokyr (1998) stresseshow both centralized innovations (R&D in chemistry, cures against cancer devel-oped in hospitals and research centers, etc.) and knowledge-driven individualbehaviors (water sanitation, food storage, personal hygiene, etc.) led to thedramatic rise of life expectancy in the last two centuries. Galor (2005) reportsthat at the beginning of Industrial Revolution life expectancy was around 40years. Lee (2001), for the US, �nds that together with the increase in life ex-pectancy, more than proportional increases in education and retirement periodstook places, making the share of lifetime devoted to work to shrink.From a theoretical point, an increase in life expectancy has always been as-
sociated with more time spent in education, more human capital and thereforehigher level (or rates) of economic performance (Kuznets, 1973, Ram and Shultz,1979, Kalemli-Ozcan et al., 2000). Only in the last decade some contributionsthat call into question this conclusion appeared: de la Croix and Licandro (1999)and Boucekkine et al. (2002), through the introduction of vintage human capi-tal, show that a growth-diminishing e¤ect arise because the more the populationages, the more the human capital used in production depreciates, possibly lead-ing to smaller growth rates. Blackburn and Cipriani (2002), Blackburn and Issa(2002) and Castellò-Climent and Doménech (2005), introducing the hypothesisof endogenous life expectancy in the level of human capital, show that multipleequilibria can exist: people living in economies in which life expectancy is tooshort do not �nd optimal to invest in human capital. In turns they will get alow level of human capital, avoiding the next generation to experience increasesin life expectancy. This kind of poverty trap is avoided in the case initial lifeexpectancy is high enough to permit agents to invest in human capital: thisleads, generation by generation, to reach a higher steady state level (or growthrate) in income.
0.4.2 Technology adoption literature
Among the vast strands of literature on technology, we focus on the one thatstudies implementation, rather than the one on the invention, of new tech-nologies. The latter literature is based on the Shumpeterian view of creativedestruction that takes place among competitive �rms, or the processes of learn-ing by doing and research and development that take place within the �rms. Inthe former literature, that we review in deep in chapter two, attention is on theprocess that makes an already disposable technology1 to be put in place and ex-ploited in the productive process. The analysis is about the costs and bene�ts of
1The term "technology" has to be thought in a broad sense: it can include, apart fromthe usual economic meaning, laws, norms, standardization systems, productive organization,etc. that are not productivity-enhancing by themselves, but make the production of newtechnology easier.

0.5. CHAPTER 2: "AGING, TECHNOLOGYADOPTION ANDGROWTH: A TAXONOMY"ix
the single actors of the economy and on the con�ict of interests that arise amongthem: being economic units heterogeneous in di¤erent dimensions (consumersvs producers, old vs adults, riches vs poors, etc.), rarely they will be together infavour or against the introduction of a new technology. The decision to adoptor not a superior technology is not the simple pro�t maximization problem ofproducers, but comes out from a more complex political and economic mecha-nism in which di¤erent groups (lobbies, governments, productive systems, etc.)act together, driven by their own interests. The crucial point is, therefore, howto �nd the optimal "social" choice as the re�ection of the behaviors of the singleactors. Fundamental contributions in this literature come from the works ofOlson (1982), Bauer (1995) and Mokyr (2002).
0.5 Chapter 2: "Aging, Technology Adoptionand Growth: a Taxonomy"
The paper in chapter 2, by means of a simple OLG general equilibrium model,puts together the links between the endogenous lengthening of life expectancy,the technology adoption process and economic growth. Allowing life expectancyto be endogenous, we introduce both the direct positive e¤ect on savings (drivenby the concern of agents in old age consumption) and the feedback e¤ect, run-ning from the aggregate choices in terms of innovation and the life expectancyitself. The main aim of this paper is to classify into three categories the wayeconomies develop, in terms of innovation choices and growth rates. The keyvariables that characterize the economies come out to be the initial life ex-pectancy, the cost-bene�t scheme of the innovation and the political weight ofdi¤erent age classes. Two di¤erent e¤ects, coming from the population aging,are isolated. One is called economic e¤ect and positively relates the incentiveof adults to innovate with life expectancy: the longer is agents�life, the morethey �nd pro�table to pay the �x cost of adopting a new technology, since theyneed to �nance a longer stream of consumption when old. The other is calledpolitical e¤ect and negatively relates the aggregate incentive to innovate to lifeexpectancy: the bigger is the share of old people in the population, the heavieris their political power. Since old are, by construction, against innovation (theyshould pay today a cost that will give bene�ts tomorrow, once they are dead),in a simple majoritarian voting mechanism they will be pivotal once they getthe absolute majority.Therefore, according to the initial and the upper bound2 of life expectancy,
the individual political weight3 and the parameters of utility function, produc-tion function and technologic structure, an economy ends in one of the threefollowing states. A "stagnant economy" occurs whenever initial life expectancyis very short or very long: in the former case is the economic e¤ect that binds, in
2The biological limit, say hundred and twenty years.3Galasso and Profeta (2004) show that the turnout rate in political elections is increasing
with age.

x CONTENTS
the latter is the political one. A "stopping economy" is the case of a favorablecost-bene�t of innovation but old people political weight is heavy. Finally, a"growing economy" turns out to be the outcome when innovation is cheap andold people have a light weight in the political mechanism.
0.6 Chapter 3: "A Politico-Economic Model ofAging, Technology Adoption and Growth"
The last paper (joint with Francesco Lancia) presents a model built upon thesame scheme of the one in chapter 2, introducing some simpli�cations but ex-panding in several dimensions the analysis. The main simpli�cation is to elim-inate physical capital: in this way we can introduce a PAYGO pension systemand focus on the only other kind of investment, human capital. In fact we in-troduce a third period in the agents�life: youth. They choose how to split theiryouth time between education and unskilled work: as it happened in chapter2, an increase in life expectancy makes people to invest more in the invest-ment good. This time it is human capital, and in fact the model replicatesthe empirical evidence of increasing in education with life expectancy. More-over, adding one more age class makes the mechanism of preferences aggregationmore interesting: it can be the case that with a long enough life expectancy,an innovation-oriented policy has to be supported by a coalition of age classes(young and adults in our case).The space of analysis is therefore over two dimensions: the private one and
the public one. The former refers to the incentives that young face when decid-ing how long they will stay in school, given a certain life expectancy. It can bethe case that a poverty trap arises, because of a unfavorable private incentivescheme. The latter must keep into account the way the individual incentives areaggregated in one public choice: it can be the case that the same policy inter-vention impacts di¤erently on di¤erent age classes. Given these two dimensionsand the fact that the economic and demographic environments evolve in time,the timing of policy intervention is crucial when the aim of such policies is toenhance growth.Concluding, the lengthening of life expectancy, in the presence of technolo-
gies that allow to accumulate human capital, is a necessary, but not su¢ cient,condition for sustained economic growth. Adverse conditions both on the pri-vate side (high costs of investments in human capital, small productivity ofeducation system) and the public side (high social costs of entering in a newtechnological paradigm, heavy weight of more conservative age classes) can minethe reaching of a stage of economic evolution characterized by sustained growth.

Bibliography
[1] Banerjee, A. V. (2004). "Educational Policy and the Economics of theFamily", Journal of Development Economics, 74, 3-32.
[2] Bauer, M. (1995). Resistance to New Technology, Cambridge UniversityPress.
[3] Blackburn, K., Cipriani, G. P. (2002). "A Model of Longevity, Fertility andGrowth", Journal of Economic Dynamic and Control 26, 187-204.
[4] Blackburn, K., Issa, H. (2002). "Endogenous Life Expectancy in a SimpleModel of Growth", CGBCR working paper n. 13.
[5] Boucekkine, R., de la Croix, D., Licandro, O. (2002). "Vintage Human Cap-ital, Demographic Trends, and Endogenous Growth", Journal of EconomicTheory, 104, 340-375.
[6] Brunello, G., Checchi, D. (2003). "School Quality and Family Backgroundin Italy", FEEM Working Paper No. 10.
[7] Castellò-Climent, A., Doménech, R. (2005). "Human Capital Inequality,Life Expectancy and Economic Growth", mimeo.
[8] Checchi, D., Ichino, A., Rustichini, A. (1999). "More Equal but Less Mo-bile? Education Financing and Intergenerational Mobility in Italy and inthe US", Journal of Public Economics, Vol.74-3, 351-393.
[9] de la Croix, D. (1996). "The Dynamics of Bequeathed Tastes", EconomicsLetters, 51, 89-96.
[10] de la Croix, D. (2001). "Growth Dynamics and Education Spending: theRole of Inherited Tastes and Abilities", European Economic Review, 45,1415-1438.
[11] de la Croix, D., Licandro, O. (1999). "Life Expectancy and EndogenousGrowth", Economics Letters, 65, 255-263.
[12] Ermisch, J., Francesconi, M. (2001). "Family Matters: Impact of FamilyBackground in Educational Attainment", Economica, 68, 137-156.
xi

xii BIBLIOGRAPHY
[13] Galasso, V., Profeta, P. (2004). "Politics, Ageing and Pensions", EconomicPolicy, April, 63-115.
[14] Galor, O. (2005). Handbook of Economic Growth, Vol. 1A, edited by P.Aghion and N. Durlauf.
[15] Kuznets, S. (1973). "Population Trends and Modern Economic Growth".Economic Growth Center Discussion paper, Yale University.
[16] Lee, C. (2001). "The Expected Length of Male Retirement in the UnitedStates, 1850-1990", Journal of Population Economics, 14, 641-650.
[17] Maddison, A. (2003). The World Economy: Historical Statistics. CD-ROM.OECD, Paris.
[18] Mokyr, J., (1998). "Induced Technical Innovation and Medical History:an Evolutionary Approach", Journal of Evolutionary Economics, Vol. 8,119-137.
[19] Mokyr, J. (2002). "The Gifts of Athena: Historical Origins of the Knowl-edge Economy", (Princeton University Press).
[20] Mookherjee, D., Ray, D. (2005). "Occupational Diversity and EndogenousInequality", Working Paper.
[21] Olson, M. (1982). The Rise and Decline of Nations-Economic Growth,Stag�ation and Social Rigidities, Yale University Press.
[22] Piketty, T. (2000). "Theories in Persistent Inequality and IntergenerationalMobility", in Handbook of Income Distribution, Vol.1, Atkinson, A.,B. andBourguignon, F., eds., (North-Holland Edition).
[23] Ram, R., Schultz, T. (1979). "Life Span, Health, Savings and Productiv-ity", Economic Development and Cultural Change, 13, 399�421.
[24] Ray, D. (2003). "Aspirations, Poverty and Economic Change", mimeo.
[25] Viaene, J.M., Zilcha, I. (2001). "Human Capital Formation, Income In-equality and Growth", CESifo Working Paper 512.
[26] Zilcha, I. (2003). "Intergenerational Transfers, Production and Income Dis-tribution", Journal of Public Economics, 87, 489-513.

Chapter 1
Intergenerational Links andGrowth: a PreferencesApproach
1.1 Introduction
Links between intergenerational transfers and economic growth have been stud-ied extensively in many di¤erent ways and in several contexts. What we �ndin the growth and human capital accumulation literature is that the emphasisis often put on the production process of human capital and the choice of howagents behave is functionally taken to be coherent with the assumed productionfunctions. We notice that the e¤ort macroeconomists put on micro-founding theproduction side of growth models (human capital production, di¤erent compet-itive environments, multi-sectoral production, etc.) does not �nd a counterpartin the "human" side, i.e. the agents�behaviour. In this paper our aim is toshift the emphasis from the production process of human capital to the deci-sional process that heterogeneous agents (di¤erentiated both in the level of their�nancial wealth and in their level of human capital) face when they have to allo-cate their wealth between their own consumption and resources left to the nextgenerations. Two speci�c questions encouraged us to face this approach. First,how does parents�education (of heterogeneous agents) at individual and aggre-gate level in�uence consumption, bequest and education decisions taken by theirchildren? Second, how do these decisions in�uence aggregate economic growthand individual wealth? The latter question has been quite deeply exploredunder di¤erent viewpoints. Galor and Zeira (1993) introduce credit market im-perfections and �xed costs in human capital investment allowing for multiplesteady states: their second assumption, in contrast with Loury (1986), makesan equilibrium with persistent inequality to possibly exist. Galor and Tsiddon(1997) allow for two di¤erent types of externalities in the production side of the
1

2CHAPTER 1. INTERGENERATIONAL LINKS ANDGROWTH: A PREFERENCES APPROACH
economy: one is local and refers to the intra-generational bequeathing of hu-man capital, the other is global and refers to the TFP-augmenting e¤ect of theaverage human capital in the economy. The main result is that poor but equaleconomies face a trade-o¤ between two alternative growth-oriented policies: aninequality-augmenting redistribution that brings to a high long run growth ratewith long run equality or an equality-preserving policy that, instead, brings to alower long run growth rate. Galor and Moav (2004), inspired by Moav (2002)�swork, build a general equilibrium model that uses the Classical approach ofincreasing saving rates and a fully private human capital production functionto show how economic growth can be coherent with a time-varying relation be-tween inequality and growth. The growth engine of the economy is, in the earlystage of industrial development, physical capital accumulation, while in morerecent development it is human capital accumulation that makes the economyto grow. Viaene and Zilcha (2001) focus on the production-side of the humancapital accumulation process, introducing both public and in-house educationin a general equilibrium model of endogenous growth. The policy implicationsthat they draw are that high growth and inequality reduction can be achieved ifthe resources left by parents to children are redistributed through a proportionaltax-public school scheme. If private e¤ort in educating children is dominant onpublic education (or subsidized by government) the growth level could be thesame, but associated with a higher inequality level. What encouraged us tofocus both on human and physical capital investments comes from Mookherjeeand Ray (2005): they introduce a two-side bequeathing behavior of adults andthis assumption helps to expand the set of possible equilibria (and their types)in which an economy ends up. In their paper adults care about the consequencesof bequests that they leave to their children: �nancial bequest is a sort of "aid"to the son because parent could not a¤ord the �xed costs of education. In thecase of a wide range of training costs for the di¤erent kinds of education and aweak bequest motive inequality is persistent in the long run.Regarding the �rst question motivating our analysis, Zilcha (2003) analyzes
di¤erent motivations of altruism of parents towards their children. He calls thesemotives "education-inclined" and "bequest-inclined" types of altruism relatedto parents�investments in education of their o¤spring and to �nancial bequests,respectively. He �nds that economies face a trade-o¤ between growth and in-equality, and the more an economy is "education-inclined", the more equal,but slower, it will grow. Banerjee (2004) reviews very di¤erent ways to modeldecision-making by families about human capital investments. He �nds, in acase that allows for joy-of-giving bequeathing of human capital, that the para-meters describing the preferences of the adults about di¤erent kinds of bequestsdrive the long run accumulation of human capital, conversely to the case ofpure altruism in which the long run behavior of the economy is only driven bytechnological parameters and exogenous policy variables. Checchi, Ichino andRustichini (1999) try to solve what they call the "Italian puzzle": a countrywhere a roughly egalitarian education is associated with a strong social immo-bility in terms of work and educational attainments. The authors explain thisanomaly considering the self con�dence that every agent puts on her talent, built

1.1. INTRODUCTION 3
through the observation of the past history of her own family. This mechanism,combined with the distortion that public school introduces in the incentives tospend in educating the descendents, gives rise to the observed inertia in themobility within each family.Evidence regarding signi�cant di¤erences in investments in education and
in school attainment between countries has been documented in recent years(among the OECD countries see, for example, Education at a Glance: OECD In-dicators (2002), for other countries see: World Development Indicators (2000)).Looking at the causality running from parental educational investment to schoolattainment of children we �nd that educational level and its dynamic show awide variety of scenarios. The determinants of children�s school attainment hasbeen widely empirically studied and we are particularly interested in analyzingwealth and past educational determinants (i.e. the wealth of the parents andtheir educational level). For example, Brunello and Checchi (2003) as well asErmisch and Francesconi (2001) found a positive correlation between parentaleducation and descendents� education attainment. This correlation has beenfound to be more signi�cant than the one with parents�income. Glewwe andJacoby (2004) found that children enrolment is not signi�cantly driven by ex-pected return on education, supporting our hypothesis that education is notprimarily an investment good but essentially, using Banerjee�s terminology, asymbolic consumption good.What characterizes our model is what de la Croix (1996, 2001) and Artige,
Camacho and de la Croix (2004) formalize in the agents�choices: an intergen-erational handing down of "behaviors", called habit1 . The authors, analyzinghistorical patterns of countries and cities� cyclical rise and fall, �nd how theinherited consumption level of the economies can be taken into account to ex-plain these waves. As it will become clear in a while, we prefer to investigatethe case of a habit attached to education. In our view it is crucial that whenagents make their choices, especially for what concerns the education of theirdescendents, they take into account their personal history but also what hap-pens around them. Indeed, they are in�uenced by the level of education of thewhole society or neighborhood to which they belong, in a fashion that will beexplained in the next section. Another reason is an empirical one: data oneducation are easily and straightforward to �nd, relatively to data on house-holds�consumption, and the use of mincerian functions can allow us to derivetestable equations about the intergenerational persistence of human capital (i.e.social immobility), whose explanation is far from clear. In facts, Ermisch andFrancesconi (2001), at the beginning of their paper, stress that "[...] in thelast two decades there has been an extensive body of empirical work concernedwith the links between parental investment in children and children�s outcomes,particularly educational attainment. Most of these studies are implicitly em-bedded in the household production model [...] but only a few of them attemptto disentangle the household�s tastes from its technology in "producing" young
1We could have used other words instead of habit, for example reference point, aspirations,etc. but, due to the strong similarity between our work and de la Croix�s articles, we preferredhabit.

4CHAPTER 1. INTERGENERATIONAL LINKS ANDGROWTH: A PREFERENCES APPROACH
people�s human capital". This statement, joint with Ray (2003)�s2 and Piketty(2000)�s views of how people set their goals (and together with additional microliterature), encourage us to explore this �eld of research.3 To resume the ideaspresented above, our work can be described by three main characteristics: theanalysis is carried on for a simple dynamic economy populated by heterogeneousagents, the focus is on what happens before the production of human capital(at individual and aggregate level) and the social and familiar environments inwhich agents live enter as driving forces of the economic behavior of the agentsthemselves.The model setting is an economy in which bi-dimensional heterogeneous
agents (in both human and �nancial capital endowments) interact in both pro-duction of �nal good and in passing on �nancial wealth and education to theirdescendents. There is another type of interaction, a social one, due to the com-parison of every agent�s educational level with that of the whole communityto which they belong. This comparison is instrumental to the decision of ed-ucational investment of each agent4 . The particular behavior that arises leadsthe economy to be characterized by two di¤erent types of steady states: onethat shows high-educated agents growing faster than the others and another, inwhich habit matters are stronger, where all agents grow at the same rate butfully divide, in terms of kind of supplied factors of production.Anticipating a feature of the model, we �nd that there is a sort of "hierarchy"
in educational choice, in the sense of bequeathing decisions: a parent will decideto educate her descendent only if she is educated enough, given a �xed amountof wealth. Another feature of the model is that the benchmark that individualsrefer to in choosing whether to spend (and how much) or not in education is nota function of their human capital alone (used as a proxy of their education), butit is combined with the average human capital in the population. Accordingly,above-average educated adults, conditionally on their wealth, will invest in theirdescendents�education a larger share of their wealth, relatively to below-averageeducated adults. We will come back deeply to this point in the next section.To conclude this introduction, we add that our view of education as a symbolicconsumption good (and not as an investment good) comes from the evidence ofa "myopic view" about return rates of education. One simple but representativeexample in Italy is the strong reduction in enrolment rate in technical-scienti�cuniversity in the last ten year (for Italy: ISTAT (2005)) and, at the same time,
2 In a sense, in our model we put in practice the "aspirations window" to which Ray refersto: we construct this window with the parents�and the average level of education. The gapbetween this two measures is the goal that peope take as a benchmark level.
3"The reference group theory [...] has been particularly in�uential. The basic idea of thetheory is that individuals tend to compare their social achievements to the reference groupfrom which they come from. [...] Assuming that dynastic heterogeneity in tastes does explaina signi�cant fraction of the intergenerational persistence of inequality, the policy implicationsare far from clear, however. The key question is where the heterogeneity of tastes comes fromand whether it can be altered", Piketty (2000).
4Gramsci (1975) stresses how familiar and social environments act, separately, in the for-mation of "educational production attitude" of young children. What we introduce is theinteraction between the two environments (by means of the comparison between the familiarand social human capital), focusing in particular on the choices of individuals.

1.2. THE MODEL 5
vast enrolment rates (up to thirty times the e¤ective demand, as Checchi andJappelli (2004) stress) in degrees like law or literature.The paper is organized as follows. In section 2 we present the main features
of the model, in section 3 we show the optimal behavior of agents and �rmsand the di¤erent equilibria that the habit component can lead to, in section 4we analyze in deep the dynamics driven by the habit weight, in section 5 somesimulations are shown and in section 6 we conclude.
1.2 The Model
The framework we adopt derives from the models by Zilcha (2003) and Artige,Camacho and de la Croix (2004). The former allows for two type of bequests(educational investment and �nancial bequest) and heterogeneous agents, whilethe latter, even if it is speci�ed in a representative-agent environment, uses thehabit formation mechanism in a way that is easy to be modi�ed for our purposes.Agents live for two periods. The growth rate of the population is zero and
the size of population is normalized to one. When young, agents only acquirehuman capital through educational expenditure of their parents, during adult-hood they receive a �nancial bequest from their parents and sell their humancapital inelastically on the labour market. Thus, their wealth derives from thewage and the interest rate combined with the amounts of human capital and�nancial bequest, respectively, that they are endowed with. Adults split theirwealth among consumption, a �nancial bequest for their descendents and aneducational expenditure. In every period �rms produce, in a perfectly competi-tive environment, a single good that can be consumed, accumulated as physicalcapital or spent by adults in children�s education.
1.2.1 Endowments
The economy starts in t0 = 0 with an adult generation (named "0") and a younggeneration: the name of a generation comes from the time in which it becomesadult. At time t all the capital stock is owned by the adults and the endowmentof agent i is bit�1 = xit, the �nancial bequest given by adult i of the foregoinggeneration. Each adult is endowed with hit units of human capital.The wealth of agent i is given by
yit = wthit +Rtxit (1.1)
where wt is the competitive market wage and Rt is the return rate on �nan-cial investments. This wealth will be used by the agent to �nance consumption,cit, leave a �nancial bequest bit and spend on education for her descendent, eit:
cit + bit + eit � yit (1.2)

6CHAPTER 1. INTERGENERATIONAL LINKS ANDGROWTH: A PREFERENCES APPROACH
1.2.2 Preferences
Every agent has the same utility function, given by:
Uit = log cit + � log bit + � log(eit � ait) (1.3)
where bit is the �nancial bequest given by the adult and eit is the contribu-tion of educational expenditure to the utility function. We have joy-of-givingmotivation in both the kinds of bequest. The term ait is the stock of educationalhabit. We assume that while evaluating the utility gain given by educationalexpenditure, the adult faces a certain habit: the higher her habit, the more shewill spend to educate her descendent, in order to gain a given utility level. Theconstant weights this habit, that is de�ned in the following way:
ait = hit � �ht
where �ht is the average human capital of the adult generation in the economy(assuming population dimension constant and equal to one). In this speci�ca-tion the more an adult is above the average (in terms of human capital, i.e."broad education"), the more she will spend in her descendant�s education. Animportant aspect is that ait can take also negative values, and this happens foradults with below-average human capital. Our choice for the habit term comesfrom two considerations.The �rst is that human capital is quite di¤erent from a consumption or in-
vestment good: usually, in works allowing for habit formation in consumption,there is an habit term given by a fraction of the consumption of the previ-ous period�s generation. Sometimes the reference level is set to be the averageconsumption in the population: this is the catching-up-with-the-Johneses liter-ature. In this work our aim is to give to human capital a more social, ratherthan a strictly atomistic, economic interpretation: what we want to build up isa "...benchmark [...] level determining a goal to reach for the new generation"(de la Croix (2001)) introducing a measure for this "human capital benchmark"that embodies both intra-family and inter-family comparison. The idea is thata reasonable benchmark level would be the educational level of the person whodecides for the education of her descendent, relatively to the educational levelthat prevails in the community where she lives. What we have in mind is thatwith low level of average education it is easier for the high-skilled professions tobe passed vertically from one generation to the next one. Or, in other words,less inequality in education tends to minimize the inertia of this habit to bebequeathed through successive generations. We again stress that here we aremodeling the preferences of individuals, included education: issues concerningthe production of human capital will be faced in the next subsection.The second consideration is a technical one. We could have used a parameter
to weight the term �ht, but with the speci�cation we use we can ideally separatethe general equilibrium e¤ect (GEE) from the habit e¤ect (HE). The GEE refersto the inverse relation between the relative abundance of a factor of productionand its relative market price: in a dynamic economy this e¤ect describes the

1.3. THE EQUILIBRIUM 7
"natural" tendency of the rates of return of the factors of production to stabilizearound a steady state level. As in a Solow model with human and physicalcapital (Mankiw, Romer and Weil (1992)), at the steady state the return ratesof both factors are constant (or both growing at a given rate, for example, equalto an exogenous TFP growth rate) and their relative rate is constant. The HErefers to the dynamic handing down of the bias in agents�investing behavior. Aswe will show clearly in subsection 3.3, the distance-from-average speci�cationmakes the disentanglement of the two discussed e¤ects easier.
1.2.3 Technologies
The production technology of the single good in the economy can be describedby a constant return to scale Cobb-Douglas function that uses human capitaland physical capital as inputs. At time t production is:
Yt = AK�t H
1��t 0 < � < 1 (1.4)
where A is a constant TFP, Kt is the aggregate physical capital (that fullydepreciates in one period) and Ht is the aggregate human capital. These ag-gregates are given by the total amount of �nancial bequests left by adults ofgeneration t � 1 and by the total amount of human capital of the adults ofgeneration t, respectively.Adult i�s human capital, hit, is privately produced, as in Artige, Camacho
and de la Croix (2004), with a linear technology that transforms one to oneeducational expenditure of the parents in human capital of their descendents(1.5). This simple production function is used in order to focus the analysis onthe choice-side of the economy, leaving computations lighter .
hit = eit�1 (1.5)
1.3 The Equilibrium
In this section we describes the optimization problems of the two sides: con-sumers maximize their utility, �rms maximize their pro�ts.
1.3.1 Consumers
The member i of generation t maximizes her utility function (2.1), choosing eitand bit, under the budget constrain, (1.1) and (1.2), and the two other constrains(1.6) and (1.7):
max f0; aitg � eit � yit (1.6)
bit � 0 (1.7)
The double inequality in (1.6) indicates that the habit could have a widerange of in�uence on educational decisions. In what follows, we will see formallyhow this can be the case.
8CHAPTER 1. INTERGENERATIONAL LINKS ANDGROWTH: A PREFERENCES APPROACH
As in Zilcha (2003) and Cardak (2004), adults do not care about earningcapacity of their descendents, and they do not have nested utility functions àla Barro, either. They are only interested in the educational expenditure thatthey do and in the amount of �nancial bequest leaved to their descendants. Thisallows us to separate the motivations that drive intergenerational bequeathingin this model: the former of "status" motivation, as in Glomm and Ravikumar(1992), and the latter for the "economic" motivation. Within this speci�cation,adults only form expectations about next period�s rate of return for what con-cerns the �nancial bequest. FOCs, (1.5) and the simplifying identity xit+1 = bitbring, for agent i, the optimal choice of eit and bit:
e�it =�
1 + �+ �(wthit +Rtxit) +
(1 + �)
1 + �+ �(hit � �ht) (1.8)
b�it =�
1 + �+ �(wthit +Rtxit)�
�
1 + �+ �(hit � �ht) (1.9)
where hit+1 and xit+1 are the human and physical capital owned by agenti�s descendent. These equations hold until the habit term is not too high or toolow relatively to the agent�s wealth. With a too high habit term, we would nothave a well-de�ned utility function and we assume that the habit weight cannot be "too large". Later on we will de�ne the exact magnitude of UB , theUpper Bound value that the habit weight can not exceed and how to calculate it.Conversely, a very low habit (for example when the agent is so poorly educatedto be much below the average) makes the marginal utility of the educationalinvestment always lower than its marginal cost: the agent will split her wealthonly between consumption and �nancial bequest. In this case the agent willmaximize her utility function in the corner solution de�ned by eit = 0. The�nancial bequest will be:
b�it =�
1 + �(wthit +Rtxit)
Referring to 1.8 and 1.9 and taking into account the example above, it is clearthat the shares of wealth that agents invest in education and �nancial bequestsare not the same for everybody. On the contrary, for each agent they dependboth on the private and average human capital. This shows how important are,in determining the individual and aggregate investments in human and physicalcapital that �ow from one generation to the other, both the magnitude and thecomposition of individual wealth: in fact, for example, agents endowed with thesame wealth can split it in very di¤erent ways, depending on where their wealthcomes from. This is a point that we want to underline: also variables other thanthe "pure" wealth can (and, actually, do) drive the choices of individuals andwe are proposing a way to do it. At this stage of the analysis, it is very useful toshow our results by means of a graph. Figure 1 shows how agents choose how tosplit their wealth as a function of their human and physical capital endowments.The loci (HH) and (XX) divide the �rst quadrant in three regions: region (I),corresponding to relatively low educated agents, region (II) where agents have

1.3. THE EQUILIBRIUM 9
an educational level around the average of the distribution in the economy (�ht)and region (III) where agents are high educated. People in region (I) choose toinvest only in �nancial bequests, people in region (II) invest in both educationaland �nancial bequest and people in region (III) pass on only education. Thedashed isowealth line represents the idea stressed above: it could be the caseof agents endowed with the same wealth that choose di¤erently how to split it.The loci (HH) and (XX) are characterized by the equations
xit =�ht (1 + �)
�Rt�� (1 + �) + �wt
�Rt
�hit (HH)
xit = �
Rt�ht +
� wtRt
hit (XX)
that are obtained, for given values of wt and Rt, equating (1.8) and (1.9) tozero and solving for xit. It is easy to verify that if equals zero the two locidisappear because the "bequests biases" due to the habit are zero.
Figure 1. Agents behave conditionally on their endowments of human andphysical capital. The dashed isowealth line shows that agentswith the same wealth can behave in three di¤erent ways.
The intuition behind the behavior described above is that an agent with alittle amount of human capital (relatively to the average human capital in theeconomy) would not feel educating her descendent crucial, and if her �nancialendowment is not so high, she would prefer to consume and to leave only �nan-cial bequest. Di¤erently to the case of other works (for example Galor and Zeira(1993)) in which there are indivisibilities in human capital accumulation, thistime it is the particular utility function that allows for non-convexities in bothhuman and �nancial capital production at individual level. In �gure 2 we show,now looking at a single agent with a given wealth and with di¤erent habits, the

10CHAPTER 1. INTERGENERATIONAL LINKS ANDGROWTH: A PREFERENCES APPROACH
di¤erent choices that she can make.
Figure 2. How di¤erent habits lead agentsto split the same total wealth.
The grey simplex represents the budget constrain of the agent in the space ofconsumption, �nancial investment and educational investment. The maximiza-tion of utility under the budget constrain can give rise to the three di¤erentbehavior described above. The choice is of type (I) if the habit term is stronglynegative (imagine a standard convex isoutility surface that is shifted to the leftby the negative term a0it): educational expenditure will be zero due to its highmarginal cost, higher than its marginal utility. Choice of type (II), thereforean interior solution, is the result of a low habit concern: in the limiting caseof = 0 the wealth�s shares that goes in consumption, educational investmentand �nancial bequest are 1
1+�+� ,�
1+�+� and�
1+�+� , respectively. The more thehabit term increases, the more the choice is biased toward investment in educa-tion. Once the habit term reaches a00it, all agent�s wealth goes in educationalinvestment, represented by type (III).
1.3.2 Firms
Firms produce in a perfectly competitive environment. The producers�inversedemand for factors of production is: Rt = �Ak
��1t and wt = (1��)Ak�t , where
kt =Kt
Ht. In turns, Kt =
Pi
xit and Ht =Pi
hit.The share of production that
goes to human capital is therefore (1��), while the one going to physical capitalis �.
1.3.3 Intertemporal Equilibrium
A competitive equilibrium, given historical distributions of human and physicalcapital in the population in t = 0, is a sequence of xit; hit; wt; Rt;Ht;Kt and �ht;t = 1; 2; : : : such that:

1.3. THE EQUILIBRIUM 11
a) each adult i selects the amounts of the two type of bequest optimally,given her endowments, market prices and habit;b) this decisions aggregate to Ht+1 and Kt+1, according to (1.5) and the
identity xit+1 = bit;c) wt and Rt equal the marginal productivity of human capital and phys-
ical capital, respectively.The �rst step is to show the individual accumulation functions (of human and
physical capital). Agent i behaves accordingly to her endowments of human andphysical capital, that enter both in the determination of her wealth and habit.Moreover, the average level of human capital enters in the agent�s decisions, too.Therefore the accumulation functions for agent i takes di¤erent forms when sheis in di¤erent situation: if the agent is in region (I), that means that she isendowed with relatively low wealth and a low level of education, she will passto her descendent only physical capital, independently on the magnitude of thehabit weight:
hit+1 = 0 (8 I)
xit+1 =�
1 + �(wthit +Rtxit) (9 I)
An agent in region (II), that is to say not too far from the average wealthand education, will pass both physical and human capital accordingly to thetwo following equations:
hit+1 =�
1 + �+ �(wthit +Rtxit) +
(1 + �)
1 + �+ �(hit � �ht) (8 II)
xit+1 =�
1 + �+ �(wthit +Rtxit)�
�
1 + �+ �(hit � �ht) (9 II)
An agent in region (III), very (relatively) highly educated and not too muchwealthy, will spend everything she got in educating her descendent, indepen-dently from the habit weight:
hit+1 = wthit +Rtxit (8 III)
xit+1 = 0 (9 III)
We focus on individuals because of the intractability of aggregate dynamicbehavior of the economy. The impossibility to give an analytical characteri-zation of the dynamics originates from the technical way in which human andphysical capital aggregates: in the previous subsection we have derived the ex-pressions of the wage and the rate of return and they are both dependent onkt , that in turns depends on the aggregate value of human and physical capital.The heterogeneity of agents (complicated by the two types of heterogeneity:in human and �nancial capital) makes impossible to write the expressions ofwt+1 and Rt+1. Notice that the same behavior could have been obtained withother more complex human capital production functions, due to the double joy-of-giving speci�cation in the utility function. The use of a linear speci�cation

12CHAPTER 1. INTERGENERATIONAL LINKS ANDGROWTH: A PREFERENCES APPROACH
allow us to derive some analytical properties of the equilibria in the steady stateanalysis.Now we want to investigate what types of equilibria and dynamics our model
allows for: the two-dimensional heterogeneity of individuals is a source of verydi¤erent initial con�gurations that can describe a broad types of economies. Forexample it is easy to show that an "equal" economy, in terms of personal wealth,can be populated by individuals with very di¤erent endowments of physical andhuman capital. Indeed, this could bring agents of each type to behave in di¤erentways with respect to educational investment, consumption and �nancial bequest.Moreover, what we will �nd is that the habit weight change radically the kindof steady state reached, while, due to the strong linearity of the model, initialconditions impact only on the transitiondynamics and not on the steady statesfeatures.Our strategy is to split the population in two groups 1 and 2, weight them
� and (1��) and check which are the determinants of the steady state reachedand how it is reached. We assume, from now on, that, at time t = 0, agentsbelonging to group 2 are relatively more abundant in human capital than theones in group 1, i.e. h20 � h10 > 0. Notice that the expression of the intensivecapital is given by kt =
��x1t+(1��)x2t�h1t+(1��)h2t
�.
The benchmark case: representative agent or = LB = 0
In this subsection, we begin with what we call the benchmark case, that can beboth the case of representative agent or the case of habit weight equal to zero(we refer to this zero-weight, the Lower Bound value of , with LB): using(2.3), (1.8), (1.9) and noting that the habit term equals zero, we get the growthrate (common for wealth, human capital and physical capital):
gLB =A���1��
1 + �+ �� 1 (1.10)
Regions (I) and (III) disappear due to = 0, the representative agent (or theagents) evolves always in region (II). Both physical and human capital grow atthe same steady state growth rate gLB and the intensive capital kt is constant:k�LB =
�� . This is, trivially, the rate between the share of wealth passed by in
�nancial bequest and the share of wealth spent in education of the adult�s (or theadults�) descendent(s). The dynamics are driven by equations (8II) and (9II),without the second additive terms that describes the habit formation mechanism(with or without the su¢ x i, that disappear in the case of the representativeagent). In the representative agent case, due to the homotheticity of the utilityfunction and the linear production function of human capital, the wealth sharesthat each agent spends in education and in �nancial bequeathing are the same,so the growth rate is the same for both the groups, as we showed before. Theonly e¤ect that acts in this case is the GEE that sets, instantaneously, therelative return rate between the two factors of production constant.

1.3. THE EQUILIBRIUM 13
The "extreme case": = UB
Before describing how to �nd UB and what it represents we have to make oneassumption about the parameters of utility and production functions, in orderto have a coherent behavior of agents. We impose, from now on5 :
1� ��
>�
1 + �(1.11)
This assumption, that concerns the "net-of-habit" link between productivityof factors of production and bequeathing behavior of agents, states that the ratebetween the share of production going to human capital (1 � �) and the shareof production going to physical capital (�) is bigger than the rate between theshare of wealth devoted to education (�) and the share of wealth devoted toother causes (1+�), i.e. consumption and �nancial bequest. In dynamic terms,this means that there is a natural primacy in earning power of education: theassumption above avoids that the advantage that agents get being educated isnot harmed by the preferences for education (�), in the sense that the investmentin human capital does not make the return rate on education to be so small (dueto the relative accumulation of human capital itself with respect to physicalcapital) to make more educated agents worst. Our assumption plausibly holdbecause, from the literature, we �nd for � a value around 0.25, and we assumethat the main argument in the utility function is consumption: � and � arehypothesized to be smaller than one.We de�ne the "extreme case" a steady state in which the economy evolves
with the two groups completely separated: one passes only human capital, theother only �nancial capital. In the following of this subsection we study theproperties of the steady state and the conditions on the parameters that makeit happen. Analytically, we impose that group 1 evolves according to equations(8 I) and (9 I) and group 2 evolves according to equations (8 III) and (9 III), thatis group 1 passes only �nancial capital while group 2 invests only in educatingtheir descendents. Expliciting the expression of wt, Rt and then kt, we get:
h2t+1 = wth2t = h2t(1� �)A�
�x1t(1� �)h2t
��(8 III�)
x1t+1 =�
1 + �Rtx1t =
�
1 + �x1t�A
��x1t
(1� �)h2t
���1(9 I�)
Notice that, since we have assumed that the two groups evolve in region(I) and (III), respectively, these equations are independent from . Due toexpressions (8 III�) and (9 I�) we have endogenous growth, so the equilibriumwill be a constant and equal growth rate of human and physical capital and,
5We make this assumption at this stage to leave the description above as general as we can.If this condition would not hold, the implied dynamics of the economy would give birth toequilibria, with persistent or diverging oscillating dynamics of the economy�s stock variables.Although these cases are very interesting to study, we are mainly interested in more tractablecases, that are the ones described in this section.

14CHAPTER 1. INTERGENERATIONAL LINKS ANDGROWTH: A PREFERENCES APPROACH
as a consequence, a constant k. We can write the expression of steady stateintensive capital, kUB , looking at the steady state ratio between (9 I�) and (8III�):
kUB =�x1
(1� �)h2=
�
1 + �
�
1� � (1.12)
For this to be the case, agents in group 1 have to pass only physical capitaland agents in group 2 have po pass only education. Since the two loci (XX) and(HH) are dynamic and their evolution depend on the investments in physicaland human capital done by the agents, we have to impose that two dynamicconditions have to hold simultaneously:
x1t+1(x1t;h2t) < x1t+1(x1t;h2t) \ h1t+1(x1t;h2t) > h1t+1(x1t;h2t)
where x1t+1 and h1t+1 are the intercept of (HH) with the xit axis and theintercept of (XX) with the hit axis in �gure 1, respectively. In other words, insteady state the evolution of the two bounds does not have to make the agentsto change their behaviors. Simple calculations using (8 III�), (9 I�), (XX), (HH)and (1.12), combined with assumption (1.11), lead to:
> UB =(1� �)(1��)��A
�
��
1 + �
��(1.13)
In (1.13) we have a condition on the parameters that ensures that the twogroups evolve exactly in the way we have described above. The steady stategrowth rate of the economy is, in this case,
gUB =x1t+1 � x1t
x1t=h2t+1 � h2t
h2t= � UB�1 = (1��)(1��)��A
��
1 + �
���1
(1.14)As expression (1.14) shows, the growth rate is common for both the groups
and independent on : the idea is that, having a very high concern about pastbehavior ( equal to UB), each group "choose" a single type of capital in whichinvest, that means that the two groups completely specialize. In this extremecase the growth rate does not depend on � because agents in group 1 split theirwealth only between consumption and �nancial bequest, while agents in group 2spend everything in educating their descendents. The two groups are therefore"forced" to stay on the two opposite corner solutions (in �gure 2, the choices (I)and (III)) at the hand of their own high habits: this implicitly impedes themto bene�t from the further "degree of freedom" of investing in the other kindof capital. In this case the strong HE separates completely the two groups andthe GEE can work only in the domain of x1 and h2: this restriction makes theonly possible equilibrium the one in which the growth rate is the same for bothgroups. In the next section it will become clear how the possibility to invest inboth types of capital gives, to one of the two groups, the possibility to exploitone additional degrees of freedom with respect to the other group.

1.4. DYNAMICS IN THE INTERMEDIATE HABIT CASE 15
1.4 Dynamics in the intermediate habit case
In this section we study the dynamics in the case of LB < < UB . We hy-pothesize, in this section, that the two groups are endowed with similar amountsof human capital and �nancial capital and that their total wealth is the same.These assumptions do not change our qualitative results but help us to betterdescribe the dynamic behaviors of the agents. In this section it is important tokeep in mind how the economy behaves in correspondence of the two extremebounds of and which are the e¤ects that enter the game: only the GEE inthe case of = LB = 0 and the HE and a "restricted" GEE in the case of = UB .Now we analyze the temporary equilibrium in the case of small values of
. This means that adults face a mild habit (a sort of positive or negativeexternality) in doing their educational expenditure.
1.4.1 The short run
Using (8 II) and (9 II) and the expressions of wage and return rate, we get, atleast for some periods, again the same stationary results for aggregate humanand physical capital than in the previous sub-case. The intensive capital is con-stant because of the habit terms�forms we choose in (8 II) and (9 II): addingup h1t+1 (x1t+1) and h2t+1 (x2t+1) to get the stock of human (physical) capital,the distance-from-average speci�cation makes the habit terms to cancel6 . As aconsequence we claim that when both groups belong to region (II) wage andreturn rate are constants. In other words, in this model�s speci�cation aggregatehuman and physical capital are independent from the distribution of the humancapital itself across the population. What changes is the relative wealth and thedynamics of human and physical capital at group level, due to the externalitygiven by the inherited habit, that drives up or down the opportunity cost ofthe di¤erent investments that each adult can do. Accordingly to the forego-ing de�nitions, the force that drives the dynamics of the economy comes fromthe HE, rather than from the GEE. Given the hypotheses of "similar agents"endowed with the same wealth, referring to �gure 1 there are two groups thatbelong to a generic isowealth line, in the segment between (XX) and (HH). Inother words, both the two groups choose an internal point of the simplex in�gure 2. Two pairs of equations describe the dynamics, one set of (8 II) and(9 II) for each group. It is possible to show that the growth rates of the twogroups diverge from one period to the other combining (8 II), (9 II) and (1.1),remembering that the wealth of the two groups at time t are assumed to beequal and (h2t � h1t) > 0 by assumption:
gy1t =y1t+1 � yt
yt= gLB + G1
�h2t � h1t
yt
�(1.15)
6As we stressed in subsection 2.3 and (not reported) simulations show, an alternativespeci�cation of the habit term could have been something like: ait = hit � ��ht. The furtherweight � that people attach to the social measure of human capital would only complicate themathematics but would not add signi�cant new issues to tackle.

16CHAPTER 1. INTERGENERATIONAL LINKS ANDGROWTH: A PREFERENCES APPROACH
gy2t =y2t+1 � yt
yt= gLB + G2
�h2t � h1t
yt
�(1.16)
where the constants G1 and G2 are negative and positive, respectively, holding(1.11). Both G1 and G2 are constants, functions of A, �, �, � and �.7 Theexpressions above show clearly how the two e¤ects described above work: theGEE contributes with a growth rate equal to gLB , while the HE, proportionallyto , boosts in opposite directions the second addictive terms of the growthrates. We summarize that (11) makes the habit to have a positive (negative)level e¤ect on the educational investment of the more (less) educated group(look at expression (1.8)) and a positive (negative) growth rate e¤ect on thewealth of the more (less) educated group. We claim that if two groups attime t are characterized by the same wealth level and similar endowments ofhuman and physical capital, the one more educated will show, at least for someperiods, a higher and increasing growth rate. In fact, the assumption of similarendowments makes agents to be in region (II) and to choose a compositionof human and physical capital that leads them again to region (II). With thesame wealth the expression h2t+1 � h1t+1 > 0 holds from (8 II) and, underassumption (1.11), y2t+1 � y1t+1 > 0 holds, too. It is so straightforward that,for some periods, gy2t > gy1t.
1.4.2 The long run
We have described how the economy behaves in the �rst periods: in fact, aftersome periods the less educated group will end to be "trapped" in region (I)and therefore will stop to invest in education. This is because the di¤erentialterm (h2t� h1t) is always increasing, lowering the growth rate and, at the sametime, the level of human capital of group 1. This causes the habit of thisgroup to decrease the marginal utility of education so much that its opportunitycost would not justify the investment in the education itself. The dynamicthat arise from now on is one in which group 1 passes only education, whilegroup 2 continues to pass both �nancial and human capital. When group 1stops to invest in human capital, the relative rate of return between the twofactors of productions adjusts through the GEE: the intertemporal equilibriumis reached once the production factors�rates of growth and the intensive capitalare constant. The main message is, therefore, that after some period the lesseducated group loses its educational lever while the other group can adjustbetween both educational and �nancial bequeathing to reach the maximumutility level.As we have explained above, the case of group 1 evolving in region (I) and
group 2 in region (II) could be the dynamic that arises at the end of a transitorytime span during which the two groups invest in both education and �nancialcapital. It could be the case, however, of an economy that begins already inthis situation (that can arise from higher values of ): a part of its population
7Precisely, G1 = (1��)A(�
�)�(���(1+�)(1��))1+�+�
and G2 = G1(��1�� ). The signs come
straightforwardly from (1.11).

1.4. DYNAMICS IN THE INTERMEDIATE HABIT CASE 17
is more educated and, apart from passing some �nancial capital, educates theirdescendents. The other part of the population only passes �nancial capital. Welet (1.11) to hold, so we can also analyze the evolution of the economy describedabove: an economy in which two groups start with similar endowments of humanand physical capital but, because of habit in educational investment, one of thetwo groups ends stopping to invest in education, once its opportunity cost istoo high relatively to its marginal utility.Formally we describe these cases (both the one with higher and the second
time span of the case of lower , when group 1 have already stop to investin human capital) with three accumulation equations. The �rst describe theevolution of �nancial bequests in group 1 : note that the bequest is a constantfraction of the wealth characterizing each agent belonging to the group. Thesecond and third equations describe the evolution of physical and human capitalof agents in group 2, respectively:
x1t+1 =�
1 + �
��Ak��1t x1t
�
x2t+1 =�
1 + �+ �
�(1� �)Ak�t h2t + �Ak��1t x2t
�� ��
1 + �+ �h2t
h2t+1 =�
1 + �+ �
�(1� �)Ak�t h2t + �Ak��1t x2t
�+ (1 + �)�
1 + �+ �h2t
The analyses of the steady state and the dynamic will be carry on throughsimulations because, as it will become clearer in a while, a simple analyticalsolution for the steady state is not available: the strategy is to look at thebehavior of the economy, conditional on the value of the habit weight, . Firstof all, notice that kt =
�x1t+(1��)x2t(1��)h2t . Remember that, maybe after a transitory
as described in the previous subsection, h1t+1 = h1t = 0: this means that agentsin group 1 have no human capital and choose not to invest in human capital fortheir descendents. The growth rate of intensive capital is constant if and onlyif:
gx1t
1 +�1���
�x2tx1t
+gx2t
1 +�
�1��
�x1tx2t
= gh2t:
This relation between growth rates and levels of endowments of human andphysical capital directly arises taking the di¤erence of the expression of kt aboveand equating it to zero. The key issue is that, in equilibrium, two only possiblecases can arise: (i) g�x1 = g
�x2 = g
�h2 or (ii) g
�x1 < g
�x2 = g
�h2, where the inequality
sign comes from (1.11). The equality between g�x2 and g�h2 holds because, dur-
ing the transition toward the steady state, under the hypothesis gx1t < gx2t8
eventually x2tx1t
goes toward in�nity and in this case the contribution of gx1t in
8This, in turn, is implied by the short run analysis above through the hypothesis that(h20 � h10) > 0.

18CHAPTER 1. INTERGENERATIONAL LINKS ANDGROWTH: A PREFERENCES APPROACH
determining gh2t weights zero and, in an analogous way, the denominator of thesecond fraction equals one. The �rst main conclusion here is that two are thepossible types of steady state: the former implies a wealth�s growth rate equalfor the two groups, the latter an higher growth rate for the group that investsin human capital.The kind of equilibrium reached and the dynamics that lead the economy
to the speci�c equilibrium depend on the weight of the forces that interplayin the economy: remember that in subsection 3.3.1, in which = 0, only theGEE is in action while in subsection 3.3.2, where the habit is very strong, theHE forces the economy to experience a corner solution. We stress that in thisintermediate case it is not possible to disentangle the GEE from the HE (dueto the impossibility to properly characterize the dynamics and the steady stateof the three-equations system above), but what we can say is that these e¤ectswork together and we can describe the adjusting mechanism as a two-blockscontrol system: the GEE works until kt is constant, no matter if, in the end,x1t vanishes with respect to x2t or it grows at the same rate. The GEE doesnot depend on , it is an intrinsic characteristic of this kind of models. The HEworks independently from the GEE: what it does is to bias (toward or againsteducational expenditure, according to the sign of the expression (hit � �ht)) thechoices of how to split the wealth of each adult. The higher is , the strongeris the HE. Our aim is to �nd the threshold value of the habit weight, L, belowwhich the economy ends up with di¤erent growth rates for the two groups andabove which the two groups grow at the same rate.
1.5 Simulations
In the simulations that we run we set the parameters� values following theconsiderations mentioned in subsection 3.3.2. From the literature we set � =0:25. Since we have assumed that the main subject in the utility function isconsumption, the weights of the �nancial and educational bequests are less thanunity (� = 0:3 and � = 0:5). Thinking about generations that born every thirtyyears, we chose the TFP, A, to be equal to 10, in order to have a standard annualgrowth rate of about 3%9 . This parameters�values make (1.11) to strongly hold,so we rule out the case of a di¤erent inequality sign that would make possibledi¤erent dynamics, as explained in the notes. Without loss of generality, theeconomy is splitted in two groups of the same size, so � = 0:5. We let tovary and we observe how the economy behaves, in terms of both dynamics andsteady states.With low values of (in our simulations positive values smaller than L =
9From expression (1.10) the ratio between production in generation t + 1 and production
in generation t equals A���1��
1+�+�: If a new generation borns every 30 years, we have to solve
gann =hA���1��
1+�+�
i 130 � 1 to obtain the annual growth rate of the economy. We call gann
the standard growth rate because we look at the growth rate that would prevail without thehabit mechanism.

1.5. SIMULATIONS 19
6:8867) the steady state that is reached by the economy is one that involvesdi¤erent growth rate for the two groups: this is case (ii). What we can say isthat if habit is weak (once that we have assumed to be in the case of group1 in region (I) and group 2 in region (II), the only habit intensity to takeinto account is the one of group 2 ) the positive (negative) contribution in theaccumulation of human (physical) capital for group 2 is not enough to raise thereturn rate on physical capital so much to make group 1�s wealth to grow fasterthan group 2�s wealth. In other words, the GEE "does its job" before the HEhave given to group 1�s agents the possibility to exploit the high return rates onphysical capital given by the GEE itself. The result is that the two groups growat di¤erent rates: group 1�s agents�wealth grows at the same rate than their�nancial capital�s growth rate, g�x1, while group 2�s agents�wealth grows at therate g�x2 = g
�h2, higher than g
�x1. Moreover, this case of low values of is the only
case compatible with a past history characterized by all the agents in region (II)investing in both types of capital, described in the previous subsection.Higher values of (with L < < UB = 7:8996) imply a stronger HE
and this leads to a strongly unbalanced habit-driven accumulation biased to-ward human capital (for group 2, while there is a strong preference toward�nancial investment for group 1 ). The e¤ects are again shown by the threedynamic equations above: for given y2t and h2t a high value of leads group2 to strongly accumulate human capital and weakly accumulate physical cap-ital (anyway, we stress that the constraints (1.6) and (1.7) have to hold). Asbefore the GEE raises the return rate on physical capital and lowers the wagerate, but this time habit-induced variations are so big (especially looking at Rt)that in later periods group 1�s agents, whose wealth comes only from physicalcapital, experience a high growth. This in turn contributes one to one to thehigh level of gx1t so, at some point in time, the growth rate of the aggregatephysical capital will be higher that the growth rate of human capital: the GEEnow reverses and an opposite situation occurs. So, conversely to the case ofsmall habit, the GEE works only asymptotically because the HE is so strongto make the economy�s characteristic variables (growth rates, intensive capitaland return rates) to �uctuate around a steady state level. In other words, theHE acts as a feedback that stabilize the growth rate of the three accumulatingvariables around the same steady state growth rate. Being all equal the growthrates, ratios between di¤erent stock variables are constants, in particular y2ty1t isconstant and its steady state value decreases as increases: this means thatif the habit is high, educated people invest a lot in their children�s educationand these massive investments in education make the wage rate to fall and,as a consequence, to lose the earning advantage that, in the case of the GEEcompletely exhausted, education would give.When reaches UB , the economy perfectly separates: one group will invest
only in human capital and the other only in physical capital. This is the casethat we have studied in subsection 3.3.2.In the following simulations, group 1 is always represented by a continuous
line, group 2 by a dashed line. In this �rst simulation (�gure 3a) the two groupbegin with the same wealth level, but group 2, as we have assumed in section

20CHAPTER 1. INTERGENERATIONAL LINKS ANDGROWTH: A PREFERENCES APPROACH
3.3, is more educated (i.e. has more human capital). We set = 1:4: boththe two groups pass, for 12 periods, both �nancial and educational bequests.Wage and return rate are temporarily constant. Since (1.11) holds, referring to(1.16) is clear that agents of group 2 experience a growth rate always higherthan agents of group 1. After this time span educational investment is no morepreferred to agents belonging to group 1, due to the decreasing marginal utilitydriven by the habit term, and from now on the economy evolves with the twogroups proceeding at two paces. This is the case in which, using the terminologyof the previous section, there is a mild habit, where the GEE fully works beforethe HE had time to change "too much" the relative return rate of the factorsof production. The higher is the habit weight , the shorter is the time spanduring which all agents invest in both types of capital.
When we look at the di¤erential between the two groups�steady state growthrates, we do not �nd a clear relationship with the habit weight, because it de-pend in a non-trivial way also on parameters other than : in �gures 3b and 3cwe graph the steady state wealth�s growth rates as functions of both in ourstandard case and in a case in which we change parameter � from 0:5 to 0:1(that is, to give less weight to descendents�education in adults�utility function).Note that, holding (1.11), UB does not depend on �: what happen is that theregion in which non-complete-separation and same growth rate coexist narrows.
�gure 3a: dynamics of growth rates with low habit ( =1:4)
5 10 15 20 25periods
0.5
1
1.5
2
2.5
g

1.5. SIMULATIONS 21
�gure 3b: steady state growth rates as a function of (�=0:5)
1.5 5 gL gUB
g
1.5
2
2.5
3
3.5
4
g*
�gure 3c: steady state growth rates as a function of (�=0:1)
1.5 5 gLgUB
g
0.5
1.5
2
2.5
3
3.5
4
g*
For higher values of the habit�s weight (but, in any case, < UB) wehave that the contribution of the GEE and the HE act together and, aftersome �uctuations, the growth rate is constant and common for the two groups,although group 1 passes, as in the previous case, only �nancial capital. In �gure4a we set = 7:1 , while in �gure 4b = 7:5. In �gure 4b the high growth ratepeak experienced by group 1 is very clear: after some periods in which group 2invests strongly in human capital, the increased return rate on physical capital

22CHAPTER 1. INTERGENERATIONAL LINKS ANDGROWTH: A PREFERENCES APPROACH
boosts group 1�s growth.
�gure 4a: dynamics of growth rates with high habit ( =7:1)
10 20 30 40 50periods
1
2
3
4
g
�gure 4b: dynamics of growth rates with high habit ( =7:5)
10 20 30 40 50periods
1
2
3
4
5
g
In �gure 5a and 5b we show how the relative wealth of the two groups evolves:after some �uctuation, as expected from the previous �gure, y2y1 reach a constantvalue. The higher is , the lower is the steady state value of y2y1 . Again, in thetwo �gures below we have = 7:1 in �gure 5a and = 7:5 in �gure 5b.
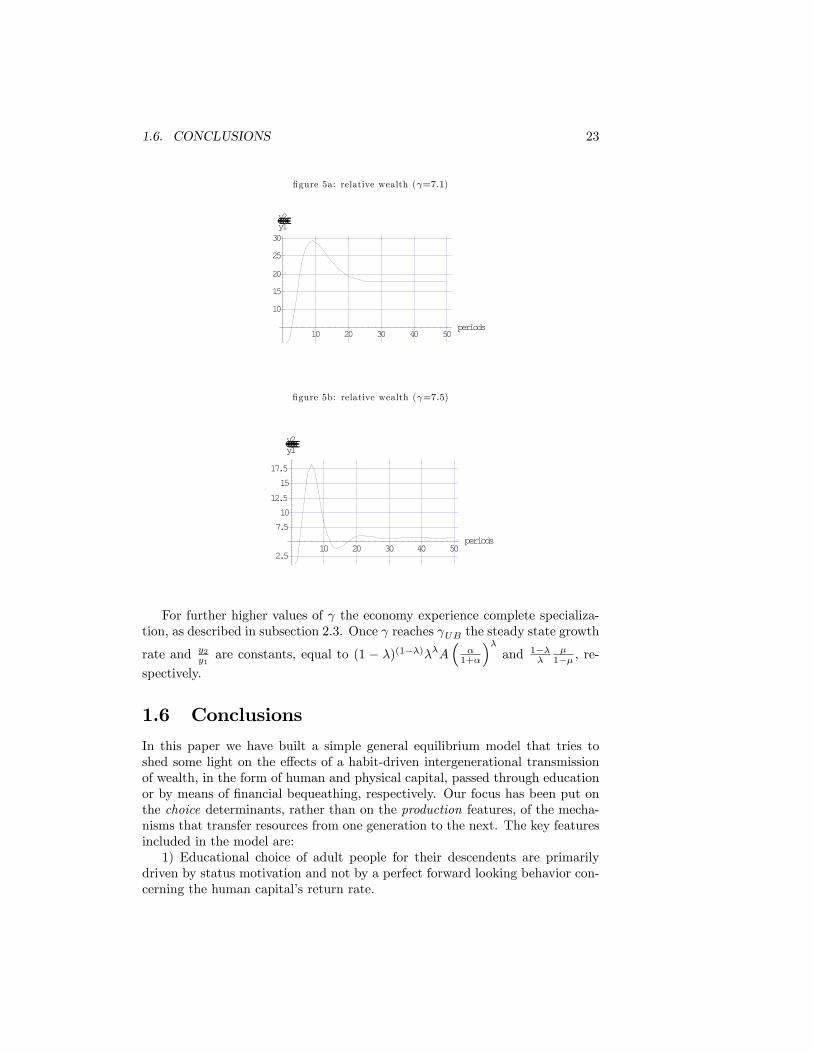
1.6. CONCLUSIONS 23
�gure 5a: relative wealth ( =7:1)
10 20 30 40 50periods
10
15
20
25
30
y2€€€€€€€y1
�gure 5b: relative wealth ( =7:5)
10 20 30 40 50periods
2.5
7.5
10
12.5
15
17.5
y2€€€€€€€y1
For further higher values of the economy experience complete specializa-tion, as described in subsection 2.3. Once reaches UB the steady state growth
rate and y2y1are constants, equal to (1 � �)(1��)��A
��1+�
��and 1��
��1�� , re-
spectively.
1.6 Conclusions
In this paper we have built a simple general equilibrium model that tries toshed some light on the e¤ects of a habit-driven intergenerational transmissionof wealth, in the form of human and physical capital, passed through educationor by means of �nancial bequeathing, respectively. Our focus has been put onthe choice determinants, rather than on the production features, of the mecha-nisms that transfer resources from one generation to the next. The key featuresincluded in the model are:1) Educational choice of adult people for their descendents are primarily
driven by status motivation and not by a perfect forward looking behavior con-cerning the human capital�s return rate.

24CHAPTER 1. INTERGENERATIONAL LINKS ANDGROWTH: A PREFERENCES APPROACH
2) The "educational story" of each person is an important determinant of herattitude toward education, that results in her decision about her descendent�seducation.3) The "educational story" involves both personal and social aspects of a
person�s past (as stressed by Ray (2003)): the family�s educational background,as well as the "educational environment" to which the family belongs, contributeto form the habit that a person faces in her educational choices.4) People are heterogeneous both in educational and wealth endowment:
these di¤erent types of heterogeneity could, in principle, drive the economythrough di¤erent paths.The straightforward translation of these ideas into the hypothesis of a model
are summarized in the utility function (2.1) where the independence of theeducational investment from the return rate of next period�s human capital andthe presence of a habit term that includes both personal and average humancapital can be noted, and the composition of the total wealth of a person isde�ned by expression (1.1).The benchmark case that we refer to is an economy without habit10 : in this
case each agent split her wealth in constant proportions between consumption,�nancial bequest and educational investment. No matter what are the initialdistributions of human capital and physical capital in the economy, all the ac-cumulating variables grow at the constant rate gLB and, as a consequence, theratio between the wealth of the two groups does not change from its initial value.In this case the general equilibrium e¤ect (GEE, explained in section 2.2) actsimmediately and the steady state is instantaneously reached.The extreme case is characterized by a very high habit concern by the side
of adults: the strong habit e¤ect (HE, explained in section 2.2), forces thebetter educated group to pass only human capital through education and theless educated group to pass only physical capital through �nancial bequest. Theresulting equilibrium is one in which the GEE sets a common growth rate forboth the groups due to the lack of degrees of freedom for the two groups: bothare fully specialized in supplying only one of the two production factors andthere is only one value of intensive capital that guarantees a constant growthrate. The steady state ratio between the wealth of the two groups is, in thiscase, independent from initial endowments.The case of intermediate habit weight induces di¤erent behavior of the econ-
omy, depending on the value of , the habit weight parameter. We claim thatfor positive but low values of that bring to a steady state in which one groupgrow faster than the other, initial values of human and physical capital matter:letting (1.11) to hold and assuming people in group 2 to be more educated, thisgroup will grow faster than group 1. In other words the group relatively moreeducated will end up growing faster than the other group. In the case of thetwo groups that begin one close to the other (in the sense of human and physi-cal capital endowments and, consequently, in wealth) the dynamics are initially
10Or, from another point of view, an economy characterized by a representative agent, wherethe hypothesized habit term loses its sense.
1.6. CONCLUSIONS 25
characterized by some periods in which both groups invest in both physical andhuman capital. Once the habit of people less endowed in human capital becametoo negative, these people will stop to educate their descendents and will passonly �nancial capital. The direct consequence is that people in group 2 willgrow at a rate higher than those in group 1.The case of quite higher values of the habit weight leads again to the same
groups�bequeathing behavior described in the previous paragraph, but this timethe HE is so strong that the GEE cannot set, alone, the economy�s growth rates.In this case the quite strong HE forces group 1 to pass only physical capital and,due to its intensity, to temporarily make the return rate on �nancial investmentvery high, through the overaccumulation of human capital by group 2. Thishigh return rate on �nancial investments makes group 1 to grow faster and thisimpedes the GEE to set the intensive capital in the economy. Conversely, thegrowth rate of group 1 soars until the circumstances reverse: the overaccumu-lation of physical capital by group 1 leads now to a decrease in its return rate.At the steady state the growth rates (of wealths, physical capital of agents ofgroup 1 and human and physical capital of agents of group 2 ) are all equalto gUB , reached after some smoothing �uctuations. Also the ratio between thewealth of the two groups, at the steady state, is a �nite constant, and the �nalvalue is reached, like the steady state growth rate, after some smoothing �uc-tuations. The more the habit weight increases, the more the above-mentionedratio decrease and its limit is reached once that approaches UB .The framework that arise is one in which the intensity of the habit motive
in educational investment drives the type of steady state and dynamics that aneconomy experiences. We have shown that with little habit the economy willgrow with di¤erent growth rate and only one group will invest in education. Ifthe habit is quite stronger the bias induced (by the habit itself) in educationalinvestment makes the GEE intervention relatively stronger and in this case the"earning advantage" of educated people is eroded by the declining wage: theeconomy ends with the same growth rate for each agent, whether or not she�seducated11 .A lesson that we want to retain is that in an economy in which agents
are endowed with a multiplicity of production factors (in this case two), thesefactors are "mixed" in order to achieve the maximum utility, under the givenconstraints. If constraints are too reinforced by externalities (or new constraintsarise along the evolution of the economy) it can be the case that some degrees offreedom are no more available to agents and the behavior of the whole economychanges in type. In our case a mild habit externality restricts the choices ofless educated agents, leading them to grow slower than the other group becauseof the constraint to not invest in education for their sons. With a little bitstronger habit weight the behavior is the same, but in this case the low relativeintensity of the GEE prevents the better educated group to exploit its "education
11This conclusion is in a way consistent with the empirical evidence found by Checchi, Ichinoand Rustichini (1999) that indicates for Italy (where we suppose habit forces are higher thanin the US) a lower inequality (that in our model must be translated in a lower or null growthrates gap between groups).

26CHAPTER 1. INTERGENERATIONAL LINKS ANDGROWTH: A PREFERENCES APPROACH
advantage" and the two groups grow at the same rate of growth. A strongerhabit weight leads to another behavior, forcing each group to choose only onefactor of production to invest in: again the two groups grow at the same rate,but because of very di¤erent reasons compared with the previous cases.To conclude, we again stress that our analysis focuses on the choice-side of
the economy, so simulations�results have to be carefully interpreted: we believethat human capital production function can not be so "�at" as we built it, butthis is the easier way to show our idea. Using our framework a high habit weightnulli�es the growth advantage of educated people and, as a consequence, policiesaddressed to make the slower group (in principle, the less educated) to catch up(for example proportional taxation and lump-sum transfers) would be useless.Of course we have to keep in mind that the conclusions we have reached involvesa linear human capital production function and no government intervention atall. For example, the higher is the habit�s weight, the higher are the growth ratesof the two groups (and, eventually, they reach the same plateau): although weknow that a high rate of growth is a good goal for an economy, we �nd that,in the extreme case of high , it comes from a completely polarized economy inwhich agents�optimal choices are on corner solutions. It is straightforward toclaim that, with a human capital production function involving human capitalexternalities and/or public education �nanced through taxation, things wouldbe somehow di¤erent.

Bibliography
[1] Artige, L., Camacho, C., de la Croix, D. (2004). "Wealth Breeds Decline: Re-versals of Leadership and Consumption Habit", Journal of Economic Growth,9, 423-449.
[2] Banerjee, A. V. (2004). "Educational Policy and the Economics of the Fam-ily", Journal of Development Economics, 74, 3-32.
[3] Brunello, G., Checchi, D. (2003). "School Quality and Family Backgroundin Italy", FEEM Working Paper No. 10.
[4] Cardak, B. (2004). "Education Choice, Neoclassical Growth and Class Struc-ture", Oxford Economic Papers 56, 643-666.
[5] Checchi, D., Ichino, A., Rustichini, A. (1999). "More Equal but Less Mobile?Education Financing and Intergenerational Mobility in Italy and in the US",Journal of Public Economics, Vol.74-3, 351-393.
[6] Checchi, D., Jappelli, T. (2004). "La Laurea Inutile". www.lavoce.info.
[7] de la Croix, D. (1996). "The Dynamics of Bequeathed Tastes", EconomicsLetters, 51, 89-96.
[8] de la Croix, D. (2001). "Growth Dynamics and Education Spending: theRole of Inherited Tastes and Abilities", European Economic Review, 45, 1415-1438.
[9] Ermisch, J., Francesconi, M. (2000). "The E¤ect of Parents�Employmenton Children�s School Attainment", IZA Discussion Paper, 215.
[10] Ermisch, J., Francesconi, M. (2001). "Family Matters: Impact of FamilyBackground in Educational Attainment", Economica, 68, 137-156.
[11] Loury, G. (1981). "Intergenerational Transfers and the Distribution ofEarnings", Econometrica, 49(4), 843-867.
[12] Galor, O., Moav, O. (2004). "From Physical to Human Capital Accumu-lation: Inequality and the Process of Development", Review of EconomicStudies, 71, 1001-1026.
27

28 BIBLIOGRAPHY
[13] Galor, O., Tsiddon, D. (1997). "The Distribution of Human Capital andEconomic Growth", Journal of Economic Growth, 2, 93-124.
[14] Galor, O., Zeira, J. (1993). "Income Distribution and Macroeconomic",Review of Economic Studies, 60, 35-52.
[15] Glewwe, P., Jacoby, H. (2004). "Economic Growth and the Demand forEducation: Is There a Wealth E¤ect?", Journal of Development Economics,74, 33-51.
[16] Glomm, G., Ravikumar, B. (1992). "Public Versus Private Investment inHuman Capital: Endogenous Growth and Income Inequality", Journal ofPolitical Economy, 100, 818-834.
[17] Gramsci, A. (1975). Quaderni dal Carcere. Gli Intellettuali, 130. Roma,Editori Riuniti.
[18] ISTAT (2005). "Indicatori di Contesto Chiave Regionali QCS 2000-06 -Asse III", http://www.istat.it/dati/db_siti/contesto/fonti02.html
[19] Moav, O. (2002). "Income Distribution and Macroeconomics: The Persis-tence of Inequality in a Convex Technology Framework", Economics Letters,75, 187-192.
[20] Mookherjee, D., Ray, D. (2005). "Occupational Diversity and EndogenousInequality", Working Paper.
[21] OECD (2002). Education at a Glance, Paris.
[22] Piketty, T. (2000). "Theories in Persistent Inequality and IntergenerationalMobility", in Handbook of Income Distribution, Vol.1, Atkinson, A.,B. andBourguignon, F., eds., (North-Holland Edition).
[23] Ray, D. (2003). "Aspirations, Poverty and Economic Change", mimeo.
[24] Viaene, J.M., Zilcha, I. (2001). "Human Capital Formation, Income In-equality and Growth", CESifo Working Paper 512.
[25] World Bank (2000). World Development Indicators, Washington.
[26] Zilcha, I. (2003). "Intergenerational Transfers, Production and Income Dis-tribution", Journal of Public Economics, 87, 489-513.

Chapter 2
Aging, TechnologyAdoption and Growth: aTaxonomy
2.1 Introduction
In the economic and political debate, especially in Europe, both technologic ad-vancing and population aging are gaining increasing importance. The politicaloutcome of these debates is part of the Lisbon Agenda of 2000. Speci�cally, onthe one hand, particular e¤ort needs to be spent in transforming the EuropeanUnion in "the world�s most dynamic and competitive economy", by means ofwidespread knowledge-based technology. Reading between the lines allows us tothink about this process of moving from a technological paradigm to a new oneas the will of policymakers to actively drive this shift: economic history (andthe related theoretical literature) is full of examples in which the best availabletechnology is not implemented, due to intrinsic con�icts of interests between dif-ferent actors of the economy. On the other hand, the fact that member countriesare experiencing a rapid aging of the population (a combination of low fertilityrates and a rise in life expectancy) led the European Commission to put increas-ing weight on it in judging member countries�policies, especially in the �eld ofdebt management and sustainability of pension systems. Within this context ofaging population, Cremer and Pastieu (2000) are right in saying that pensionsystems�management is mainly a political, rather than economic, issue. Galassoand Profeta argue that the projected political power of older generations1 canexplain the high support that electors put on generous pension systems, despitetheir expected decreasing return rates in the future. Our concern is that also
1They calculate for the UK the age of the median voter to be 45 and 53 in 1997 and 2050,respectively. Patterns are similar for median voter�s age in other european countries such asItaly, Spain and France.
29

30CHAPTER 2. AGING, TECHNOLOGYADOPTION ANDGROWTH: A TAXONOMY
long run economic growth could be (if not mainly, at least partially) a politi-cal issue if we allow the process of technology improvement to be the outcomeof a centralized choice characterized by a con�ict of interests among di¤erentage classes, as in Krusell and Rios-Rull (1996). The relation linking aging andtechnological improvement is, however, not at all clear. Focusing on the agecomposition of population could be misleading when we analyze the politicaland economic interplays among di¤erent types of economic actors, namely peo-ple studying, working, or retired. To this end, one of the focal points that wewant to underline is how, in the last two centuries, the roles of students andretireds became very important in terms of size, economic needs and, moreover,political representativity. Our contribution is, in particular, to identify andanalyze the two-sided link between aging and technologic innovation: one iseconomic and makes innovation preferred by adults once they have enough timeto enjoy their savings in old age. The other is political and refers to the powerthat the old people have, once they have reached a certain size, to veto a costlytechnologic innovation whose gains can not be enjoyed by the old themselves.The paper proceeds as follows. In section 2 we review historical data on
education, retirement age and life expectancy. Section 3 reviews the literatureon aging, technology adoption and growth. Section 4 proposes our uni�ed view.Section 5 presents the model, some policy implication and further research lines.Section 6 concludes.
2.2 Overview on historical trends
In this section we review, under an historical point of view, the age structure ofdeveloped countries, in terms of the role of di¤erent age class in the economiclife. Our aim is to stress how impressive are these changes in the composition ofthe population, in the light of the political and economic implication we suggestin our theoretical model. At the beginning of 19th century people entered thelabor market when very young (almost no public school where in place at thattime), they worked for almost their entire lifetime and used to retire at thevery end of their life. Around 1850 things did not changed very much: peopleaged 5-14 enrolled in primary school were less than 10% in United Kingdom(Galor, 2005) and the expected length of retirement at age 20 was, in the US,below three years (Lee, 2001). At the same time, life expectancy at birth wasaround 40 (Galor, 2005). In 1930 average years of education was less than 8years and life expectancy rose to 59.7 years, with an expected retirement periodlength of 5 years. When focusing just on retirement and life expectancy2 wenote substantial changes occurred in the last century, both in magnitudes andtrends of the series. In �gure 1 we show, for US males aged 20, that the steady
2Though the dynamics of education are very impressing, in terms of growth and di¤usion,in this paper we only address aging matters in term of increasing relative weight of old peoplewith respect to adult, without analyzing students. We think that a natural extension of thisstudy is to include the formation of human capital, allowing for a di¤erent class of agent withspeci�c economic and political interests.

2.2. OVERVIEW ON HISTORICAL TRENDS 31
increase of life expectancy at birth is positively correlated with retirement agebetween late ninetieth century 1950, while it reversed once the welfare statedeveloped. At the same time the percentage of life spent as a retiree changedfrom 2.7% in 1880 to 17.4% in 1990, respectively.
55
57
59
61
63
65
67
69
71
73
75
1880
1890
1900
1910
1920
1930
1940
1950
1960
1970
1980
1990
year
year
s
0%
2%
4%
6%
8%
10%
12%
14%
16%
18%
20%
Life Expectancy(left scale)
Retirement Age(left scale)
% of retired yearsover lifetime (rightscale)
Fig.1. Life expectancy, Expected length of retirement period andpercentage of life spent as a retiree for US males. Souce: Lee (2001), our
calculations.
For european economies these kinds of trends are similar but magni�ed inseveral senses. First of all life expectancy is increasing more in Europe thanwhat is happening in the US. In 2004 it was 76.3 for EU-12 males and 75.2for US males, while it is projected to be 82.1 and 79.5 in 2050, respectively(www.cdc.gov/nchs/ and Carone and Costello, 2006). European welfare sys-tems are more developed than US welfare state, so european workers retire, onaverage, before their homologues in the US (in 2000 US male workers retiredat age 62.6, while in Western Europe the average was 60). Finally, the lowerfertility rates that european countries are experiencing nowadays3 shrink frombelow the demographic distribution, shifting upward mean and median age. Theincreasing weight of retired population, combined with their historically higherturnout rate at elections4 , makes their presence always more sizeable and impor-tant in political choices involving changes that applies to agents with di¤erentroles.
3Total fertility rate in 1997 was 2.06 in the US while it was 1.40 in EU-12. In 1980 theywere similar around 1.82, then started to diverge. (www.europa.eu.int/comm/eurostat/).
4Galasso and Profeta (2004) report that the turnout rate among people aged 60-69 relativeto people 18-29 is double in the US and 50% higer in France.

32CHAPTER 2. AGING, TECHNOLOGYADOPTION ANDGROWTH: A TAXONOMY
2.3 Aging and technology adoption literatures
The literature linking aging and economic growth mainly focuses on empirical,country-speci�c studies about the sustainability of the pension system. A com-mon feature of these studies is to simulate the projected social expenditure (andother signi�cant economic variables such as the amount of savings, the govern-ment balance, etc.) under di¤erent scenarios of growth rates and demographicdynamics. Due to this approach, in this kind of framework the interaction be-tween demography and growth are not explicited. One exception is Lindh andMalmberg (1999), where they test how the demographic structure a¤ects thegrowth rate of OECD economies. They �nd, but do not justify theoretically, anegative correlation between output growth and the share of people over 65 anda positive one with the share of people aged 50-64. Thus the (relative) aging thatOECD countries are experiencing in the last years should lead to a decrease ofthe growth rate of per capita income. Conversely, in developing countries Barroand Sala-i-Martin (1995) �nd signi�cant positive e¤ect of life expectancy on thegrowth rate of per capita income. In this paper we suggest an explanation tothis non-monotonic relation between aging and economic growth, highlightingthe di¤erent determinants of the abovementioned relation.In the theoretical �eld, most of the work concentrates on the study of the
demographic transition occurred during the industrial revolution. In particularGalor and Weil (2000), Kalemli-Ozcan (2002) and Doepke (2004) studied the in-terrelation between the switch to quality of children (rather than quantity) andthe beginning of a regime of sustained economic growth. A key feature of anydemographic transition is the lengthening of life expectancy of people. Againin the context of the industrial revolution (and, in general, in the transitionfrom agriculture to industrial production) work have been concentrated on thedecreasing opportunity cost of acquiring human capital with the lengtheningof life expectancy, in the usual framework used, between others, by Cervellatiand Sunde (2005) and Boucekkine et al. (2002). Both built on a monotonic in-crease of human capital investment with life expectancy, but the former showsa monotonic relation between life expectancy and growth rates, while the latterallows for a decrease in growth rate after some values of life expectancy, deter-mined by the use of a vintage capital formulation for the production of humancapital. Without contrasting this view, supported by the empirics of Barro andSala-i-Martin, we focus on another issue, namely the lengthening of people�sretirement period. The reason is simple: the cited works essentially study thedemographic transition occurred before and during the industrial revolution,while the dynamics we observe in the last decades (mainly in developed coun-tries) show a somehow di¤erent picture. Beside the evidence we presented inSection 2, Lee (2001) shows that for 20-year-old american people, between theend of nineteenth century and 1990, the retirement period�s length has increasedfour-fold and its ratio to life expectancy has increased three-fold. These datasuggest how the retirement period is becoming a signi�cant share of human lifeand how fast this share is growing in magnitude, relatively to the whole lifetimeand the working life.
2.4. A UNIFIED VIEW 33
The literature on technology adoption is very wide, ranging from Schum-peterian growth model to agent-based model of knowledge di¤usion. We re-strict our attention to OLG models of vested interests: the reason is becausein our model we need to aggregate choices between agents of di¤erent genera-tions and to characterize the property of di¤erent ages within each generation.The mechanism behind every model of vested interests in technology adoptionis the asymmetric gain that agents experiencing a new technology get, due totheir heterogeneity: heterogeneity can be either within the same generation (forexample skilled/unskilled workers) or between generations (youngs and adults,having di¤erent time-horizon). The two formulations have been jointly studiedby Krusell and Rios-Rull (1996) in a model where three generations are alive atthe same time and the generations themselves are internally heterogeneous interms of skills. Their main conclusion is a methodological one: it is relativelysimple to �nd a policy that leads to sustained growth, but the very hard taskis to �nd the determinants of this policy, once it is endogeneized in the model.In fact their results are speci�c to the distribution of skilled (managers) andunskilled agents, but regularities are hard to �nd in determining links betweenthese distributions and the kind of equilibrium achieved (growth, stagnation,cycles). Bellettini and Ottaviano (2005) built a model of innovation througha regulator that reacts to lobbing activity of the di¤erent generations alive ineach period. Cycles of innovation-stagnation can arise in equilibrium and theyare characterized by dynamic ine¢ ciency: the introduction of a in�nitely livedsocial planner would lead the economy to a sustained growth path, with alwaysincreasing technologic level, per capita income and utility. The possibility ofcycles is determined by the short time horizon of old workers: since they wouldlost from the introduction of a new technology because of their human capitalthat is speci�c to the previous technology, they lobby for a policy of "no inno-vation" using their resources. If their resources are high enough to beat youngs�contributions to the regulator, a "no innovation" policy is implemented by theregulator.
2.4 A uni�ed view
Until nowadays, technologic adoption and population aging have been studiedseparately in two di¤erent strands of literature. One paper that attempts tounify the analysis is Canton et al. (2002) where authors describe a three-periodOLG model in which agents choose to adopt a new technology by means of ma-jority voting mechanism. Their comparative static results are that an increaseof life expectancy or a reduction in the productivity gap between contiguoustechnologies can harm the adoption of a new technology. Our purpose is toadopt the mechanism of voting on a new technology but to allow for an endoge-nous increase in life expectancy (the retirement period length of old people)and a clear separation of the role of di¤erent age classes in the economy. Inour view the mean by which people get their income in di¤erent stages of theirlife is crucial in determining their political choices due to the di¤erent interests

34CHAPTER 2. AGING, TECHNOLOGYADOPTION ANDGROWTH: A TAXONOMY
involved (i.e. labor/capital income). Two mechanism are in place in our view:one runs from technology adoption toward aging and is described in the nextparagraph, the other runs in the opposite direction and incorporates both eco-nomic and political matters. The former refers to cost-bene�t analysis basedon the returns from capital investment, labor income, productivity increase andlife expectancy itself. The latter counts for the shift of political power towardold agents, which are against technology adoption as in the standard literature.The interplay of these forces makes economies to evolve in di¤erent fashions,driven by initial conditions and production and utility parameters.In our model we endogeneize the probability of surviving in old age linking
it positively to the technology level reached by the economy, namely the TFP.Another way to study this issue could have been to introduce in the model di-rectly the length of life, rather than the probability of surviving, but this wouldhave needed more assumptions and a slightly more cumbersome modelling ofthe time structure5 . One facet that we want to stress is the nature of the de-terminant of expected probability of surviving in the old age: as Mokyr (1998)underlines, in the last century people�s length of life is a matter of widespreadhealth/knowledge conditions, such as vaccines and health infrastructures, ratherthan individual knowledge (such as water sanitation, food-cooking habit, etc.)that characterized earlier periods. Following him, we decided to relate life ex-pectancy to an economy-wide measure, such as the TFP, rather than to anindividual-speci�c measure like human capital6 .
2.5 The model
We set up a model whose aim is to incorporate the demographic and politico-economic features of nowadays economies, in order to point out the links betweenaging and technology adoption. To this end, we design a clear separation be-tween the stages of agents�life, in terms of economic roles, incentives, politicalpower and interests. Our economy is populated by agents living at most fortwo periods, with a probability pt of surviving from adult to old age7 . In everyperiod of their life agents vote in favor or against the adoption of a new tech-nology, that will be available in the next period. The adoption is decided bymeans of a majority voting rule and the political weight of an adult and an oldagent are 1 and � > 0, respectively8 . The political power of old people increaseswith the number of people alive in old age and this probability is assumed to be
5 In what follows, we will use the terms life expectancy and probability of surviving in oldage as if they had the same meaning.
6 In this paper things would not change because we have identical agents and, introducinghuman capital, there are no di¤erences between individual and economy-wide measures. Infact, both human capital and technologic level are non-decreasing in time in all standard modelof growth. Thus the di¤erence here is just conceptual, but it would change some conclusionintruducing heterogeneity of agents.
7Though we model the probability pt to depend on the past technologic level At�1, in therest of the paper we avoid the use of the notation p(At�1), where unnecessary, and we simplywrite pt.
8Detailes are in subsection 5.4.

2.5. THE MODEL 35
positively related with the technological level achieved by the economy. For anew technology to be implemented after the vote, every agent (adults and old)has to pay a �xed proportion of their income. Adults work and split their netlabor income between consumption and saving for their retirement. Moreover,once people become old (but before any other events including, in case, dying),each of them give birth to one adult9 . Old people consume the net return fromtheir investment and then die. If, at any point in time, a new technology is notimplemented, the net income of each agent coincides with her gross income.Production uses labor and capital to produce a single output, that can be
either consumed or saved.
2.5.1 Agents
At time t agents of generation t born already adults. They are homogeneous ofmeasure one and they get utility from adult and old age consumption. Theweight they attach to old age consumption increases with their probability(whose realization is unknown when adult) of reaching old age pt 2 [p; �p]; wherep is the probability of surviving in old age at time t0 and �p is the the biologi-cal upper bound of the probability of surviving. Their ranges are summarizedas 0 < p � �p � 1. Later we will show how pt evolves. The utility of therepresentative agent adult at time t is:
ut = log ct + �pt log ct+1 (2.1)
Every adult supply inelastically one unit of labor and get the gross laborincome wt, where wt is the wage, taken as given. If a new technology is decidedto be adopted at time t, every adult has to pay a fraction it = i of her income.Otherwise, in the case of a no-innovation policy, it = 0. The net income isdivided between consumption ct and savings st. In the old age, she consumesthe return from her investment, net of a fraction it+1 = i, if a new technologyis adopted at time (t+ 1). The budget constraint is represented by8<:
st + ct � wt(1� it)
ct+1 = stRt+1
pt(1� it+1)
(2.2)
The variables it and it+1 are discrete and they can either take the valuesi� = 0 or i� = i, with � 2 ft; t+ 1g and 0 < i < 1. We think about i as thefrictional cost of innovation, rather than a tax used to �nance some kind ofinvestment. As in Blackburn and Issa (2002) we allow for a fair annuity marketthat redistribute the savings of deceased to people that remain alive: this isexplicited dividing Rt+1 by pt.
9We could restate the model in terms of a three-period OLG, where, during youth, peopleare totally passive and once they became adult they behave as described in the text.

36CHAPTER 2. AGING, TECHNOLOGYADOPTION ANDGROWTH: A TAXONOMY
2.5.2 Production
The production technology of the single good in the economy is described by aconstant return to scale Cobb-Douglas function that uses labor and capital asinputs. At time t production is:
Yt = AtK�t L
1��t 0 < � < 1 (2.3)
where At is the level of technology available at time t, Kt is the aggregatecapital (that fully depreciates in one period) and Lt = L = 1 is the aggregatelabor. In the production process, a new technology brings about a better way ofproducing the �nal good through an higher TFP: At = At�1(1+ �), with � > 0,if a new innovation is chosen at time (t�1), At = At�1 otherwise. A technologyimprovement is undertaken if the political majority of the population votes infavor of it (i.e. the weighted median voter). The new technology is �nanced bythe frictional cost that we have de�ned above: the share i of both adults�wagesand old people�s savings.
2.5.3 Probability of surviving
In the introduction we have already outlined what drives our choice of thedeterminants of the probability of surviving in old age: we assume that ptfollows a bounded, monotonic increase from p, the initial expected probabilityof surviving, to �p as a function of the level of technology in the economy, theTFP parameter At. We model this as an externality, out of the control of agents.More precisely, we assume that pt, the probability of living in old age of peopleadult at time t, is a function of At�1, that is the technology implemented in theeconomy during the period before people of generation t are born. The functionis described by (2.4). This means that innovations experienced by people duringtheir own adulthood and old age do not a¤ect their probability of surviving.
8>>>><>>>>:pt = p; At�1 < A
pt = p(At�1); A � At�1 � �A
pt = �p; At�1 > �A
(2.4)
where limAt�1!A+
pt = p; limAt�1! �A�
pt = �p and p0 > 0. With this kind of
speci�cation, we want to emphasize the way in which technology impacts onthe life expectancy of people. In �gure 1 we show one of the possible form of

2.5. THE MODEL 37
the function p(A).
Fig.2. Probability of surviving as a function of TFP
Below the threshold A the determinants of probability of surviving could beexplicited (for example the human capital level of agents) but, since this isnot the aim of our research, we take pt as given and constant, equal to p.Above the threshold �A, probability of surviving reaches its biological limit, andno technological improvements can further prolong it. Between A and �A lifeexpectancy increases every time a new technology is implemented: again, wethink about extensive innovations, like cures against cancer, better nutritionalguidelines or widespread vaccines that depends on the existing technologicalenvironment in the economy, rather than the human capital that agents areendowed with.
2.5.4 Political mechanism
The decision to implement or not a new technology is undertaken by means of aweighted majority voting rule at every period t. The two groups involved in thevoting are adults and old of generation t and t� 1, respectively. The standardresult is that the bigger of the two groups is the one to decide upon the socialchoice involved. In this case adults weight one and are numerically of measureone, while old weight pt� (where pt is their size, obviously less than one, and �is their individual political power). In the case of pt < 1
� = ~p the adults decide,while, with an opposite inequality sign, the old set the agenda10 . We call ~p thepolitical threshold.
10Of course we need � to be higher than one in order to have the political power in thehands of old agents: what Galasso and Profeta (2004) report about turnout rates (note 4)helps us in allowing for this case.

38CHAPTER 2. AGING, TECHNOLOGYADOPTION ANDGROWTH: A TAXONOMY
2.5.5 Timing
The timing of the agent�s relevant choices is described below. Steps from 1 to 4represent agent�s adulthood and steps 5 to 9 span the old age:1) Agent is born2) Votes over technology innovation (e¤ective in the next period, step 5)3) Works getting wt(1� it)4) Consumes and saves5) Originates one descendant6) With probability pt she stays alive7) Votes over technology innovation (e¤ective in the next period, when the
agent is passed away)8) Gets the net returns from savings st
Rt+1
pt(1� it+1)
9) Consumes and dies
2.5.6 Optimizations
We now solve the optimization problems of both �rms and agents, and for theagents we will solve the problem for both adults and old.
Firms
Since �rms produce in a perfectly competitive environment, the producers�in-verse demand for factors of production, from (2.3), is:8<: Rt = �Atk
��1t
wt = (1� �)Atk�t(2.5)
where kt = Kt
Lt= Kt, wt is the wage per unit of labor and, given a complete
capital depreciation, Rt = rt is the return rate on investment in this factor ofproduction. Since Kt = st�1Nt�1 and Lt = 1, we can write kt = st�1, wherest�1 are the savings of the representative adult of generation (t� 1).
Agents
Agents have three choice variables: in every period of their life they vote infavor or against a technologic innovation policy, and during their adulthood theychoose how much to save of their net labor income. Saving is the only choicecompletely under agent�s control, while votes of di¤erent agents are summedup by means of a weighted median voter mechanism. In every stage of herlife, an agent take as given past outcomes of the voting mechanism, perfectlyforesee next period values of the economic variables (i.e. future rates of returnon capital) and maximize her utility. She can not commit herself to a speci�cvote from one period to the next. Due to the log speci�cation of the utilityfunction, its maximization with respect to st involves, after replacing ct and

2.5. THE MODEL 39
ct+1, only predetermined variables such as wt and pt and the variable it, chosenby majority rule at time t.
@ut@st
= 0, s�t =
��pt
1 + �pt
�wt(1� it) (2.6)
The optimal saving s�t is, therefore, a share of net labor income, whose mag-nitude increases with old-age life expectancy pt. Plugging the optimal savinginto (2.1) we get the indirect utility function as a function of the two dichotomicchoices of innovation/not innovation in the di¤erent periods of her life.
uINDt = log
��1
1 + �pt
�wt(1� it)
�+�pt log
���pt
1 + �pt
�wt(1� it)
rt+1pt(1� it+1)
�(2.7)
In the next grid we summarize the costs and the direct e¤ects in the case ofthe adoption of a new technology in the two stages of agent�s life.
ADULTHOOD OLD AGECost of Innovation wti strt+1iDirect E¤ects At+1 ") rt+1 " None
When adult, the cost associated to innovation is a share i of her labor incomeand the advantage she gets is a better productivity parameter: this, in turns,makes rt+1 to rise. When old, she has to pay for a new technology to beimplemented, but she does not experience any direct e¤ect: it is straightforwardto note that elderly people, since they are modeled to be not altruistic towardstheir progenies, are always against innovation.
Political-economic outcomes
In this subsection we describe the speci�c problem the agent (of generation t)faces at the two di¤erent stages of her life when the pivotal voter belongs, inevery period, to the same age group.Old age. When old, the agent faces the decision to vote in favor or against
innovation, taking as given everything else. Looking at (2.7) it is clear that thebest choice is to vote against innovation: with no gains from innovation, she hasto minimize her costs setting it+1 = 0.Adulthood. When adult, she takes as given the variables wt and pt, forms
correct expectations about it+1 (taking them as given and out of control) andvotes over it. Since the utility function is additively separable, expectationsabout next period�s adults�choice on it+1 do not change the agent�s problem,therefore she will vote in favor of innovation if and only if the di¤erential utilitybetween innovate and not innovate is positive:
�uAt = (1 + �pt) log(1� i) + �pt log�rIt+1rNt+1
�> 0 (2.8)
where �uAt stands for the di¤erential utility innovate/not innovate from theviewpoint of an adult, the superscript I stands for innovate and N for not

40CHAPTER 2. AGING, TECHNOLOGYADOPTION ANDGROWTH: A TAXONOMY
innovate. Note that there is no time subscript attached to the i in the �rst logbecause that is the ex-post cost of innovation, once the decision to innovate isundertaken. From (2.5) and the e¤ects of technologic innovations on At+1 wesimplify the expression above:
pt >�1
��(1 + �) + log(1+�)
log(1�i)
� = p (2.9)
We call p the economic threshold. It is positive if and only if the denominatoris negative, so we study the cases in which (1 + �) + log(1+�)
log(1�i) < 0. Given thisrestriction we can state that an adult will be more likely in favor of innovationthe smaller is the frictional cost i. Her propensity to vote for innovation willalso be increased by high values of �, the direct e¤ect of technology adoption onTFP, and �: this because the adult is willing to pay the frictional cost i only ifshe would enjoy a large increase of utility deriving from old age consumption.Moreover, the higher is the share of production going to capital, �, the lower isthe propensity to innovate: this because high values of �, through (1� i)��1 inthe expression of rIt+1, drain a lot of net saved resources and make innovationless attractive.
2.5.7 Intertemporal equilibrium
We can now derive how an economy evolves, starting from its characteristicparameters of production and utility functions, the shape of the function linkingpt to At�1 and the political weight of old people, �. At time t = 0 there arep�1 old and (a measure of) one adults alive, the generation named 0. Old areendowed with capital k0. With the hypothesis that at time t� 1 no innovationhad occurred, we can write p0 = p�1. Obviously, A0 has to be consistent withthe relation p(A) described in section 5.3 above. To obtain the intertemporalequilibrium we need that the savings at time t form the capital used at time
(t+1): kt+1 =�
�pt1+�pt
�(1��)Atk�t (1� it): The other dynamic equation is the
one that rules how the technologic parameter A evolves: we have At+1 = Atin the case of no innovation and At+1 = (1 + �)At in the case of innovation,and the decision to innovate or not is undertaken by the weighted majoritariangroup.Formally, a competitive equilibrium, given the initial stock of per capita
capital k0, the initial level of life expectancy p0 and a (coherent) initial TFPlevel A0, is a sequence of kt; wt; Rt; At and pt; t = 1; 2; : : : such that:a) innovation is decided by means of a weighted majority voting. This
a¤ects At+1 and pt+1;b) each adult selects the amounts of savings optimally, given her en-
dowment and the correctly anticipated innovation policy, market prices and lifeexpectancy pt;c) savings aggregate in kt+1;d) wt and Rt equal the marginal productivity of labor and capital, re-
spectively.

2.5. THE MODEL 41
There are three di¤erent cases in which an economy can end up: we callthese cases stagnant, stopping and growing economy, respectively.
Stagnant economy
A stagnant economy is characterized by a constant steady state per capita cap-
ital k� =h�
�p
1+�p
�(1� �)A0
i 11��
and no innovations at any point in time:
At+1 = At = A0. This equilibrium can be reached under two di¤erent con�gura-tions on the initial value p0: either (i) the innovation process is not attractive dueto a too low probability of surviving, i.e. p0 < p, and in this case is the economicthreshold that binds, or (ii) the political power of old people is high enough toavoid innovation from the beginning, i.e. p0 > ~p. This is the case in which thepolitical threshold binds. Moreover, independently on the initial value A0 (and
p0), we observe a stagnant economy whenever � > ���(1 + �) + log(1+�)
log(1�i)
�, that
explicits the condition p > ~p. The main point to note is that a stagnant econ-omy can be the outcome of two very di¤erent economic processes: in the formeris the decision to not innovate, decided by adults, that avoid the economy toinnovate and, as a consequence, harms the old not permitting them to increasetheir life expectancy. In the latter is the old generation, due to its great politicalpower, that makes its choice to be implemented: no expenditure in innovationin order to sustain old-age consumption. Under a descriptive point of view, wecould view the former case the one of sub-saharan african countries, while thelatter case the one of so-called Old Europe.
"Stopping" economy
A stopping economy is characterized by some initial periods of growth of bothper capita capital and technology and then a sudden stop, once the old getthe majority in the voting mechanism. In order to get this case, we need thechain of inequalities p < p0 < ~p < �p to hold. The �rst inequality states that, atleast initially, innovation is attractive. For some periods two equations drive the
economy: kt+1 =�
�pt1+�pt
�(1 � �)Atk�t (1 � i) and At+1 = (1 + �)At. At some
point in time, let�s say t = s, pt reaches the political threshold ~p that makes oldgeneration to be the political majority. This is ensured by the third inequality:old�s majority is reached before the probability of surviving reaches its biologicalmaximum �p. From t = s onward the economy evolves as in the case of stagnanteconomy described above, but with the steady state per capita capital k�s =h�
�~p1+�~p
�(1� �) ~A
i 11��
, where ~A = A�1(~p), that is uniquely de�ned since p(A)
is increasing between A and �A (look at Section 5.3 for details). Without forcingtoo much the predictive power of the model, we can think about India: highfertility rates are slowly decreasing, preparing the �eld for a relative aging ofpopulation once the demographic dividend11 vanishes: this could bring in the
11The demographic dividend refers to the time window in which there is an increase ofworkforce relative to non-workers, such as retired and youngs (de la Croix et al., 2006).

42CHAPTER 2. AGING, TECHNOLOGYADOPTION ANDGROWTH: A TAXONOMY
next future a stop in technologic innovation once the large share of today�syoung people will age.
Growing economy
The economy grows forever, governed by the equations kt+1 =�
�pt1+�pt
�(1 �
�)Atk�t (1�it) and At+1 = (1+�)At, in the case of p < p0 < �p < ~p. This because,
apart from the initial propensity to innovate ensured by the �rst inequality, olddo never get the majority: the third inequality states this condition. In thesame fashion as before, we can think, in this example, to China. In this casevery low fertility rates are beginning to grow, leading the economy to a fall inrelative aging: this is one of the factors that could sustain China in its, at leastfor now, steady growth.
2.6 Policy implications
We now discuss some policies and their e¤ectiveness in moving an economyfrom a steady state characterized by constant per capita capital to a steadygrowth state. First of all, referring to �gure 3, in order to have a non-emptyset characterizing the growth region, we need that p < ~p. Remember that thismeans that, at the some point in time, old people are not too in�uent in theinnovation choice and the net adults�bene�t from innovation are not negligible.Referring again to �gure 3 we �nd that for a poor country, characterized bya low TFP level (below A) and, as a consequence, short life expectancy, themore e¤ective policy is to rise exogenously the life expectation by means of animprovement in health (widespread vaccines against lethal illness, investment inhospital, water sanitation, etc.). This policy is represented by the upward shiftof the left branch of the function p(A): once a higher p0 is implemented, for thegiven A0, the economy will experience innovation up to ~A = A�1(~p).
Fig.3. E¤ect of widespread vaccine in least developed countries.

2.7. CONCLUSIONS 43
Other policies can be designed in order to shift downward the abovemen-tioned economic threshold p, as the mechanism in subsection 5.6.2 describes.In �gure 4 we show that once a lower economic threshold p0 is implemented,every economy starting before ~A grows until ~A itself. More important, policiesonly oriented toward the narrowing of political power of old (every policies thatlowers �) are completely ine¤ective for economies below A, since the politicalthreshold ~p does not bind.
Fig.4. E¤ect of policies that enhance innovations�net returns
The other way round is true for developed economies: in this case is thepolitical threshold ~p that binds, so the only policy that are e¤ective are policiesthat increase the relative political weight of adults with respect to old people.
2.7 Conclusions
We have presented a simple framework designed to address the links between ag-ing, technology adoption and growth. We have identi�ed two channels throughwhich people act in the economy. One is economic and refers to the choicean agent makes in terms of evaluating the cost and bene�t associated to theadoption of a new technology. With this respect, an increase in life expectancyalways leads adults to adopt a new technology more likely, in line with standardliterature. The other channel, the political one, makes old people to be pivotalin the process of voting upon a new technology once the life expectancy is longenough. Being the old always against innovation, at some point they will stopthe process of innovation. Our main �nding is that technology adoption can beprevented in the case of both very short or very long life expectancy. The formercase corresponds to the one in which adults are not willing to innovate becausethe frictional cost of innovation does not "pay back" in the old age, that is tooshort. The latter case refers to the case of a gerontocracy, where old impose, bymeans of majority voting, their opposition to technologic improvements, whose

44CHAPTER 2. AGING, TECHNOLOGYADOPTION ANDGROWTH: A TAXONOMY
gains are not internalized by them in future periods. Though the empiricalevidence of this mechanism can be very di¢ cult to isolate, we think that theimplication of aging on economic growth via the adoption of new technologiesneeds to be taken into account in the process of designing sound policies in thefuture. The political feedback running from aging to technology adoption shouldbe deeply studied in future research as well as all the other political channelsalready addressed such as the problem of pension systems sustainability anddebt management.

Bibliography
[1] Barro, R.J., Sala�i�Martin, X. (1995). Economic Growth, New York(McGraw�Hill).
[2] Bellettini, G., Ottaviano, G. (2005). "Special Interests and TechnologicalChange", Review of Economic Studies, 72, 43-56.
[3] Blackburn, K., Issa, H. (2002). "Endogenous Life Expectancy in a SimpleModel of growth", CGBCR Discussion Paper 13, September.
[4] Boucekkine, R., de la Croix, D., Licandro, O. (2002). "Vintage Human Cap-ital, Demographic Trends, and Endogenous Growth", Journal of EconomicTheory, 104, 340-375.
[5] Canton, E.J.F., de Groot, H.L.F., Nahuis, R. (2002). "Vested Interests,Population Ageing and Technology Adoption", European Journal of Polit-ical Economy, 18, 631-652.
[6] Carone, G., Costello, D. (2006). "Can Europe A¤ord to Grow Old?", Financeand Development, Vol. 43, N. 3.
[7] Cervellati, M., Sunde, U. (2005). "Human Capital Formation, Life Ex-pectancy, and the Process of Development", American Economic Review,Vol. 95, N. 5, 1653-1672.
[8] Cremer, H.,Pastieau, P. (2000). "Reforming Our Pension System: Is it aDemographic, Financial or Political Problem?", European Economic Review,44, 974-983.
[9] de la Croix, D., Lindh, T., Malmberg, B. (2006). "Growth and Longevityfrom the Industrial Revolution to the Future of an Aging Society", mimeo.
[10] Doepke, M. (2004). "Accounting for Fertility Decline During Transition toGrowth", Journal of Economic Growth, 9(3), 347-383.
[11] Galasso, V., Profeta, P. (2004). "Politics, Ageing and Pensions", EconomicPolicy, April, 63-115.
[12] Galor, O. (2005). Handbook of Economic Growth, Vol. 1A, edited by P.Aghion and N. Durlauf.
45

46 BIBLIOGRAPHY
[13] Galor, O., Weil, D. (2000). "Population, Technology, and Growth: fromMalthusian Stagnation to the Demographic Transition and Beyond", Ameri-can Economic Review, Vol. 90, N. 4, 806-828.
[14] Kalemli-Ozcan, S. (2002). "Does the Mortality Decline Promote EconomicGrowth?", Journal of Economic Growth, 7(4), 411-439.
[15] Krusell, P., Rios-Rull, J-V. (1996). "Vested Interests in a Positive Theory ofStagnation and Growth", Review of Economic Studies, Vol. 63, N. 2, 301-329.
[16] Lee, C. (2001). "The Expected Length of Male Retirement in the UnitedStates, 1850-1990", Journal of Population Economics, 14, 641-650.
[17] Lindh, T., Malmberg, B. (1999). "Age Structure E¤ects and Growth in theOECD, 950-1990", Journal of Population Economics, 12, 431-449.
[18] Mokyr, J., (1998). "Induced Technical Innovation and Medical History: anEvolutionary Approach", Journal of Evolutionary Economics, Vol. 8, 119-137.
Chapter 3
A Politico-Economic Modelof Aging, TechnologyAdoption and Growth (withFrancesco Lancia)
3.1 Introduction
Over the recent past�no more than two hundred years�the Western World hasexperienced an extraordinary change in the economic environment and in allaspects of human life. We can observe that, in this period, all OECD countrieshave experienced a dramatic increase both in the longevity of their citizens andin the aggregate and per capita income. Simultaneously, the traditional socialenvironment changed profoundly: the proportions of the population that wereeducated, and that were retired, increased signi�cantly, causing the proportionof working people to shrink.
Looking at the details, we can stress some qualitative and quantitative factsbehind these features of the economies. Life expectancy in the last centuryand a half increased tremendously: in 1850 it was below 60 years in US (Lee,2001) and around 40 in England (Galor, 2005), while today it almost reaches80 years (Fogel, 1994). At the same time, both the shares of lifetime thatpeople devoted to education and retirement increased. In 1850 the percentageof people enrolled in primary education was less than 10%, so, on average, thetime devoted to schooling was negligible. Now people, adding up informal (childcaring carried out by parents) and formal schooling, study for around 20 years,one quarter of their expected lifetime. The participation of people in retirementshows similar trends: in 1850 less than three years were devoted to retirement,while today, especially in Europe, thanks in particular to the introduction of
47

48CHAPTER 3. A POLITICO-ECONOMICMODEL OF AGING, TECHNOLOGYADOPTION ANDGROWTH (WITH FRANCESCO LANCIA)
social security systems after World War II, people retire for almost 20 years:1
again, one quarter of their lifetime (Latulippe, 1996).2 In �gure 1 we showhow life expectancy and its components, in terms of economic roles of people,evolved in the last century and a half, for the USA. In Europe some trendspresented here are even more evident: in particular, life expectancy increasedmore rapidly (from a lower level to a higher level than in the US) and retirementlength increased more.
Fig.1. Life expectancy and economic roles in the US. Source: Lee (2001), www.bls.gov, and our calculations.
One of the most important implications of these trends is that developedcountries are changing their political structures, moving from a form of "work-ers�dictatorship" to a more diluted political representation: the voices of bothyoung and retired people in the political debate continually increase, and in-tuitively their interests should not coincide with the interests of adult workers.This almost certainly impacts on the composition of the aggregate demand.Consider, for example, the increasing demand for expenditure in health care forelderly people, residential structures for retired people, old age entertainment,etc. Here we are, however, interested in the production side of the economy,speci�cally in the mechanisms that run from individual and aggregate prefer-ences to the production process and which could be a¤ected by demographic,and therefore political, changes. A con�ict of interests among age classes, interms of production choices, will probably arise between workers and students,if these are innovation-prone, and retired people, who are not interested in tech-nologic innovation, since their real income is not tied to their own labour income,which is linked to the past innovation choices. Moreover, a con�ict of interestscan also arise between young people and adults: for the former innovation haslong lasting e¤ects, since it a¤ects both their productivity in the labour marketonce they will be adult and their children�s capacity to acquire human capital.For the latter, a new technology impacts on the ability of their children to paythem a pension. These di¤erent incentive schemes would hardly be identical.
1All data come from www.census.org and our calculations.2For European data see Galasso and Profeta (2004).

3.2. SYSTEMIC INNOVATION 49
Since our theory rests on the idea that human capital and technology arethe two engines that boost economic growth,3 we analyze how a longer life ex-pectancy a¤ects the dynamics of these two variables. In this framework weanalyze, by means of a three-periods overlapping generation model in which lifeexpectancy endogenously changes, the interactions among education, techno-logical change, aging and growth.4 What we have in mind are the potentialcon�icts of interests that arise among di¤erent generations. Due to di¤erenttime horizons and economic incentives, individual and aggregate choices canendogenously change because of the demographic evolution of population.The purpose of this work is to provide an illustration of how an econ-
omy might evolve when life expectancy mainly a¤ects both private and pub-lic choices concerning the production side of the economy and, therefore, thegrowth process. The paper is organized as follows. In section 2 we specify whatwe consider "systemic innovation". Section 3 presents the model. Section 4contains a simple dynamic example. Section 5 concludes.
3.2 Systemic Innovation
Innovation is a discontinuity in knowledge and, therefore, in production tech-niques, whose outcome is an appreciable increase in productivity. With thesame resources the system is capable of producing more goods, or it is capa-ble of producing the same quantity of goods with less resources. We refer toa systemic innovation5 as to a type of innovation that, in order to be imple-mented, has to pass through the endorsement of a political mechanism, where,in general, the interests of di¤erent groups of agents (consumers, producers, thegovernment, high/low skill groups, etc.),6 do not coincide. The public natureof systemic innovation, in contrast with the Schumpeterian view of innovationsdeveloped by �rms running for the best cost-saving technology, comes from thehistorical point of view where the implementation of a new technology is rarelythe outcome of pure pro�t-maximizing by �rms.The public nature of systemic innovation requires a di¤erent innovation
model in comparison with linear ones based on R&D and, consequently, on in-novation and technological transfer. Accordingly to Mansell and When (1998),
3 It has been increasingly recognized that both human capital formation and technologi-cal changes play important roles in economic growth (Lucas, 1988; Romer 1986). That is,the improvement of knowledge and skills embodied in labour, as well as changes in technol-ogy, mostly embodied in physical capital, determine the potential for moving the productionfrontier outward.
4Recent studies have shown, at least theoretically, that economic growth is helped by anincrease in life expectancy (Galor and Weil, 1998; Blackburn and Cipriani, 2002; Cervellatiand Sunde, 2005).
5We take it that there is no uncertainty in the outcome of a new technology of this kind:once the decision to shift to the new technology is undertaken, with probability one a pro-ductivity enhancement takes place. It follows that we are not dealing with risky process ofproducing new ideas, but with the process of implementing existing ideas in new ways thatare more e¢ cient, although not for everybody in the same way.
6 In our framework the contrast evolves among di¤erent age groups.
50CHAPTER 3. A POLITICO-ECONOMICMODEL OF AGING, TECHNOLOGYADOPTION ANDGROWTH (WITH FRANCESCO LANCIA)
the systemic innovation model can be de�ned as a "chain model", characterizedby interdependence between both the development of knowledge and its appli-cation to the production processes and negotiation of interests among di¤erentagents. Innovation used to be a linear trajectory from new knowledge to newproduct, now it becomes neither singular nor linear, but systemic. It arisesfrom complex interactions between many individuals, organizations, and theiroperating environment.
Following the historical point of view delineated by economists like Mokyr(1998a, 2002) and Olson (1982), in this study we focus our attention on systemicinnovation as a growth-enhancing technology. Bauer (1995) points out that adecentralized market outcome seems to be a poor description of many technologybreakthroughs. Economic convenience is certainly not irrelevant, but, as Mokyr(1998a) suggests: "there usually is, at some level, a non-market institution thathas to approve, license or provide some other imprimatur without which �rmscannot change their production methods. The market test by itself is not alwaysenough. In the past, it almost never was." (p. 219) Thus, as reported by Olson,the decision whether to adopt a new technology is likely to be resisted by thosewho lose by it through some kind of activism aimed at in�uencing the decisionby the above-mentioned institutions.
Consequently, we construct a model in which, for endogenous reasons, tech-nology adoption is delegated to a regulatory institution, the democratic vote.We formalize the idea that an innovation, before being introduced in large-scaleproduction, has to be approved by some non-market institution. Its adoptionis ex-post disposable for all individuals in the economy, but ex-ante the choiceto adopt it or not can be a¤ected by the interests of di¤erent age groups. Ac-cording to Bellettini and Ottaviano (2005), the central authority can be seenas a licensing system that has some agency to approve new technologies be-fore they are brought to the market. Again in Mokyr (1998a)�s words: "almosteverywhere some kind of non-marketing control and licensing system has beenintroduced". A recent example is the creation of standard-setting agencies suchas the International Organization of Standardization (ISO) or, about propertyrights, the European Patent O¢ ce (EPO).
To capture the evolving clash between resistive and innovative interests, weconsider an economy that, at any point in time, is populated by three di¤er-ent overlapping groups of agents di¤ering in terms of their life horizons andincentives schemes. In fact, besides the increasing human capital accumulation,productivity improvements come from the innovation process. A systemic inno-vation is implemented if and only if there is a political consensus for it: becauseits net bene�ts are not equal among the di¤erent age classes, in a heterogeneoussetting there is always room for suboptimal provision of the innovation itself.Among di¤erent political mechanisms (majority vote, lobby intervention andso on) for implementing a new innovation, according to Krusell and Rios-Rull(1996) as well as Aghion and Howitt (1998), we assume that the public choiceis carried out by means of a democratic majority voting where the interests ofthe absolute majority of the population prevail.

3.3. THE MODEL 51
3.3 The model
Time is discrete and indexed by t 2 N+: The economy is populated by homo-geneous agents of measure one living up to three periods: they survive withprobability one from youth to adulthood and with probability pt to old age.When people of generation t are young they split their unit time endowmentbetween schooling (et) and working as unskilled (1� et), using the average hu-man capital that their parents bequeathed them (in the form of an externality).Their income is linear in human capital and is, in case, taxed for a new pro-ductive technology to be implemented in the next period.7 From now on, wecall this operation of taxation simply innovation tax. It is a �x share of incomeand takes the values i ; 0 < i < 1, or zero in case innovation is decided or not,respectively. As adults, each of them has a single child. Adults�human capi-tal is a function of past human capital and the e¤ort they made when young.They combine their human capital with a TFP parameter that increases if anew technology is endorsed the period before. Their income is divided betweenconsumption, a constant share s that goes, in a PAYGO fashion, in payingtheir parents�pensions8 and, in case, the innovation tax it+1. When old, theyconsume the pension that their children pass to them, net of the innovationtax it+2. The complete scheme of the timing for an agent born at time t isrepresented in �gure 2.
Born with Ht
Votes over itChooses et
Consumes ct
Technology At+1 is in place
ht+1 is achieved
Votes over it+1
Consumes ct+1
Votes over it+2
Gets Pt+2
Consumes ct+2
Born with Ht
Votes over itChooses et
Consumes ct
Technology At+1 is in place
ht+1 is achieved
Votes over it+1
Consumes ct+1
Votes over it+2
Gets Pt+2
Consumes ct+2
Fig.2. Timing for an agent born at time t.
Agents�political lever is characterized by their ability to vote, every periodof their life, for a systemic innovation to be implemented in the next period. Inorder to take into account the increasing and, in some cases, crucial power of oldretired, we assume that young people show a lower turnout rate with respect toadults and old.9 Thus, their weight in the political process is represented by anexogenous parameter � 2 (0; 1]. All adults and old can vote, so their measureis 1 and pt, respectively, where pt is the share of old alive.
7Using a school/leisure choice it would have been di¢ cult to introduce the tax on innova-tion.
8We do not discuss the way in which the pension system is implemented and if it can bepolitically self-sustaining, as Bellettini and Berti Ceroni (1999) do. We assume instead that acommitment between generations is in place and no one can default on it.
9Galasso and Profeta (2004) report that the turnout rate among people aged 60-69 relativeto people 18-29 is double in the US and 50% higher in France.

52CHAPTER 3. A POLITICO-ECONOMICMODEL OF AGING, TECHNOLOGYADOPTION ANDGROWTH (WITH FRANCESCO LANCIA)
Production output is undertaken by �rms: competitive �rms employ thehuman capital supplied by agents as the only input, using a technology At,taken as given and out of their control.
3.3.1 Utility, budget constraints and production functions.
The expected lifetime utility for an agent born at time t (3.1) is non altruisticand its arguments are the consumption levels in the three periods. � 2 (0; 1) isthe usual discount parameter, while pt is the probability to survive in old age.In this subsection, despite the time su¢ x, we consider pt as a constant. Thus,we could just write p, but below we will endogenize it and it will be importantfor the analysis to let this variable change over time.
ut = log ct + � log ct+1 + pt log ct+2 (3.1)
The budget constraints in the three periods are as follows. Note that inevery period the incomes are taxed in case a new technology is decided to beimplemented in the next period.
ct = Ht(1� et)(1� it) (3.2)
ct+1 = yt+1(1� s� it+1) (3.3)
ct+2 = Pt+2(1� it+2) (3.4)
Production of �nal good in the skilled sector (i.e. by adult) takes the formof a decreasing return function of human capital (3.6). The TFP parameter Atis equal to At�1 in case a new technology is not implemented (it�1 = 0), whileAt = (1+ �)At�1; � > 0 in case a new technology is implemented (it�1 = i). Attime t = 0; At = A0 = A: A compact formulation for At is:
At = (1 + �it�1i)At�1 (3.5)
where � denotes the growth rate of the technology and is a strictly positivescalar. The straightforward expression for skilled production at time t is asfollows, with 0 < < 1:
yt = Ath t = At�1(1 + �
it�1i)h t (3.6)
Human capital of an adult born at time t (3.7) increases with the humancapital with which she is born (Ht) and the e¤ort she exerted in schoolingwhen young (et). The human capital depreciates by a factor (1� �) in case aninnovation is decided at time t. The assumption is that when new technologiesare implemented, human capital produced in schools based upon previous types

3.3. THE MODEL 53
of technology is less useful (Boucekkine et al., 2002, 2005). Ranges for theparameters are � > 0, 0 � � < 1 and 0 < � < 1.
ht+1 = �
�(1� � it
i)etH
�t
�(3.7)
At the same time, an old of generation (t�2) receives (3.8) that is the shares of income that an adult of generation (t�1) disbursed in the PAYGO system,multiplied by the coe¢ cient p�1t that takes into account the share of peoplesurviving to old age.
Pt =sytpt=sAth
t
pt(3.8)
3.3.2 Individual optimization with given innovation policy
In every period of her life an agent takes as given the innovation policy. We willadd the case of majority voting on the innovation policy later. Agents choosethe schooling time when young. From the �rst order condition @ut
@et= 0 we
obtain the optimal schooling time:
e�t = [�+ �pt]
1 + [�+ �pt](3.9)
It is easy to �nd a positive relationship between pt and the equilibriumvalue of et: the longer is the life expectancy of people, the higher is the timeinvestment needed to �nance their prolonged consumption, consistently withexisting literature. Substituting (3.9) in (3.7) and writing ht instead of Ht (dueto straightforward equilibrium considerations) we get the accumulation functionof human capital as a function of past human capital, the innovation policychosen the period before and the fraction of time youth spend in education. Attime t we obtain:
ht+1 = �
�1� � it
i
� [�+ �pt]
1 + [�+ �pt]h�t (3.10)
The human capital accumulation function shows the usual concave shape(given that 0 < � < 1) and the role of human capital depreciation in the case ofinnovation,
�1� � iti
�, is clear. Moreover, the human capital augmenting e¤ect
of life expectancy can be evaluated by looking at the expression of e�t .
3.3.3 Endogenous life expectancy
In this subsection we allow for the level of life expectancy to increase withthe aggregate human capital level as in, among others, Blackburn and Cipriani(2002) as well as Cervellati and Sunde (2005).10 The probability to reach old age
10Empirically, both private and aggregate endowment of human capital are conductive toa longer life, although we focus on the aggregate view: on the one hand, demographic and

54CHAPTER 3. A POLITICO-ECONOMICMODEL OF AGING, TECHNOLOGYADOPTION ANDGROWTH (WITH FRANCESCO LANCIA)
is, therefore, pt = p(Ht�l); where l is a lag of at least two periods for ensuringthat people are not internalizing changes in life expectancy when optimizingtheir human capital level. We impose some restrictions on p(H), in order to getsimple results. p(0) = p0 > 0 avoids the extreme case of a disappearing old age,while @P (H)
@H = pH > 0 replicates the empirical evidence of a positive correlationbetween life expectancy and education. Because p is a probability, we assumethat limH!+1 p(H) = pL � 1. Simple algebra and the equilibrium identityht = Ht allow us to rewrite the expression of human capital accumulation(3.10):
ht+1 = �1(ht; it)h�t
The function �1 is always greater than zero, increasing in h and, for the re-strictions imposed on the function p, limited from above by some �nite number.In the case of both innovation and no innovation it is possible to show that mul-tiple �nite equilibria can arise, as we show in �gure 3. In this �gure we representthe case of innovation, where it = i: hS1 and hS2 are stable equilibria, whilehU1 is the unstable equilibrium. Of course, in the case of innovation the wholegraph of ht+1 lies below the one of no innovation: it can be, therefore, the casethat if innovation takes place there is room, due to the depreciation of humancapital, for two stable steady states, while in the case of no innovation only onestable steady state arises. In �gure 4 we show the case of no innovation (it = 0):
historical evidence suggests that the level of human capital profoundly a¤ect the longevity ofpeople. For example, the evidence presented by Mirowsky and Ross (1998) supports stronglythe notions that better educated people are more able to coalesce health-producing behaviourinto a coherent lifestyle, are more motivated to adopt such behaviour by a greater sense ofcontrol over the outcomes in their own lives, and are more likely to inspire the same typeof behaviour in their children. Schultz (1993, 1998) evidences that children�s life expectancyincreases with parent�s human capital and education. On the other hand, there is evidence thatthe human capital intensive inventions of new drugs increases life expectancy (Lichtenberg,1998, 2003) and societies endowed with an higher level of human capital are more likely toinnovate, especially in research �elds like medicine (Mokyr, 1998b).

3.3. THE MODEL 55
the graph of ht+1 is higher and only one stable steady state, hS3, arises.
ht
ht+1
ht+1=Γ1(p0;i)htε
ht+1=Γ1(pL;i)htε
ht+1=Γ1(p(ht);i)htε
hU1hS1 hS2 ht
ht+1
ht+1=Γ1(p0;i)htε
ht+1=Γ1(pL;i)htε
ht+1=Γ1(p(ht);i)htε
hU1hS1 hS2
Fig.3. Equilibria of human capital level in the case of innovation and endogenous life expectancy.
ht
ht+1
ht+1=Γ1(p0;0)htε
ht+1=Γ1(pL;0)htε
ht+1=Γ1(p(ht);0)htε
hS3 ht
ht+1
ht+1=Γ1(p0;0)htε
ht+1=Γ1(pL;0)htε
ht+1=Γ1(p(ht);0)htε
hS3
Fig.4. Equilibrium of human capital level in the case of no innovation and endogenous life expectancy.
Apart from the innovation policy, increases of �, �, and � shift ht+1 upward,leading both to higher level of human capital for any steady state and to thedisappearance of the low steady state, hS1 in �gure 3.The fact that (i) the growth of human capital is bounded from above and
(ii) human capital is the only factor of production and its accumulation functiondoes not depend upon the value of the TFP parameter allows us to study, inan "additive" way, how human capital and production evolve. For example,once human capital reaches a steady state, using (3.6) we can keep track of the
56CHAPTER 3. A POLITICO-ECONOMICMODEL OF AGING, TECHNOLOGYADOPTION ANDGROWTH (WITH FRANCESCO LANCIA)
�nal production just looking at the innovation policy undertaken. Thereforethe steady state production is a constant level in the case of no innovation(y� = A0(hS�) ), while it will be an increasing level (at the constant rate �) inthe case of innovation (yt = A0(1+ �)t(hS�) ). The value hS� represents one ofthe stable steady states that we can �nd in �gure 3 or 4.
3.3.4 Endogenous innovation policy
Up to this point the innovation policy has been taken as given, either innovationor no innovation, and the same in every period. From now on we will use, whennecessary, I or N , respectively. Now we allow agents to vote upon the innovationpolicy, and the decisions aggregate by means of a majority mechanism. With oursetup the shares of young, adult and old voters are �
�+1+pt; 1�+1+pt
and pt�+1+pt
,respectively. The more the life expectancy increases, the more important is therelative weight of old and the less important are the weights of young and adultin the political process.
Proposition 1 For values of life expectancy smaller than
p = 1� �
a "workers� dictatorship" arises: no matter what young and old prefer, adultalone will set the agenda in terms of innovation. There are no values of ptsuch that another form of dictatorship (i.e. a single age group has the absolutemajority) can arise.
Proof. Adult get the absolute majority if and only if their share is biggerthan 1
2 : imposing1
�+1+pt> 1
2 we obtain, solving for pt, the expression in theproposition. For similar considerations it is possible to show that both �
�+1+pt
and pt�+1+pt
can not exceed 12 .
In early stages of development process the political power is, therefore, inthe hands of adult alone, while the more the human capital increases, the longerlife expectancy is and the smaller the share of adult is. It can be the case that ptexceeds p: from this moment on decisions about innovation need the consensusof two age groups over three, so the political process becomes a little morecomplex. We call this stage "diluted power". The speci�c cost-bene�t setup ofthe innovation implies that old people are always against innovation: they aresupposed to pay today a fraction of their income for a new technology that willbe available once they are dead. This simpli�es our analysis: in the case of"workers� dictatorship" this feature is not in�uential, since only adult decide,while in the case of pt > p we need to know, to be sure that innovation will bevoted, whether both adult and young will vote for I. Otherwise N will be theimplemented policy.Our strategy is to check, for all the three-period sequences of policies,11
if agents�vote and policy outcome is consistent with the con�guration under11Being the two states of voting variable fI;Ng and the three periods that an agent live,
the possible streams of policies are 23 = 8: fIt; It+1; It+2g; fIt; It+1;Nt+2g; fIt;Nt+1; It+2g;fIt;Nt+1;Nt+2g; fNt; It+1; It+2g; fNt; It+1;Nt+2g; fNt;Nt+1; It+2g; fNt;Nt+1;Nt+2g:

3.3. THE MODEL 57
analysis. Let us now de�ne some variables that will be useful in the policysetting framework and describe agents�behaviour in the three di¤erent stagesof their life.We call vjt the choice of innovation policy voted by an agent of type j (with
j 2 J = fY ;A;Og) at time t and it can take the values f�; �g, that stand forinnovation and no innovation, respectively. Note that old�s choice is always tovote against innovation, as will be clear below: vOt = �;8t 2 N+. In everyperiod the function Mt aggregates the votes of the three generations alive andits outcome is the majority choice:
Mt(vYt ; v
At ; v
Ot ) =
8>><>>:I if
�vYt = v
At = � and pt > p
vAt = � and pt < p
N otherwise
(3.11)
A new innovation will be, therefore, implemented at time (t+1) if and onlyif Mt = I.Now the optimization problem for the agent is to vote, in every period of her
life, upon the innovation policy and, taking the outcome of the voting mechanismin every periods as given, to allocate her youth time between schooling andworking. We study the choice of the three generations backward, from the oldto the young, at time t. Thus, the individuals under analysis are old agentsborn at time (t� 2), adult agents born at time (t� 1) and young born at timet. The time structure of our political problem can be represented in �gure 5.
t t+2t1 t+1
vO
vA
vY
t2
Mt2 Mt1 Mt Mt+1 Mt+2
t t+2t1 t+1
vO
vA
vY
t2
Mt2 Mt1 Mt Mt+1 Mt+2
Fig.5. Scheme of votes aggregation.
Old
As we stated above, old people, in the case of innovation policy, only incur incosts: once the new technology is in place, they will be dead. Their optimalchoice is always to vote against, since vOt is their only choice that has to bemade. Moreover, they do not need to anticipate future political outcomes.

58CHAPTER 3. A POLITICO-ECONOMICMODEL OF AGING, TECHNOLOGYADOPTION ANDGROWTH (WITH FRANCESCO LANCIA)
Adult
When adult, agents vote over the innovation that will be implemented nextperiod. In principle, the decision to vote for an innovation or not depends onthe di¤erential utility that has to be computed for every future outcome of themajority choiceMt+1. Due to the functional form of the utility, adult do not careabout tomorrow�s outcome of the innovation policy: income and substitutione¤ects cancel out for what concerns tomorrow�s cost of innovating. They decideto innovate, i¤:
�uAt (Mt+1 = I) = �uAt (Mt+1 = N) = u
At (v
At = �)� uAt (vAt = �) > 0 (3.12)
where uAt depends on ht�1 and Mt�1. Writing explicitly (3.12), we �nd:
�uAt = � log(1� i� s)+ pt log(1+ �)+ pt log(1� �)�� log(1� s) > 0 (3.13)
Let us assume from now on that � > (1 � �)� � 1: this condition on therelative magnitude of TFP improving parameter and human capital depreci-ation parameter states that, in the case that an innovation takes place, theimprovement in the production of �nal good exceeds the worsening of the qual-ity of human capital used in production. Algebraically, this condition makesthe denominator of PA to be positive. It is easy to show that the same consid-eration will be e¤ective also for PY , which we will de�ne in the next paragraph.Moreover, note that limi!0+ p
A = 0 and limi!(1�s)� pA = +1.
In (3.13), under the assumption above, adults enjoy a higher utility, in thecase of innovation, the higher is their life expectancy: they experience a bene�tfrom the technology parameter � that augments, proportionally with pt, theirpension when old. Conversely, they experience a cost, proportional with pt,from the depreciation of their children�s human capital (even though this costis mitigated by the elasticity of human capital in the production of the �nalgood).Simple calculations lead to the following expression, where pA is the value
of life expectancy above which adults are in favour of innovation:
pt >� log
�1�s1�s�i
�log(1 + �) + log(1� �) � p
A (3.14)
Adults vote for an innovation if and only if they will get higher resources (netof innovation costs) when old, in the form of pensions paid by their children12 .The threshold PA is a positive function of i: the more expensive the adoptionof a new innovation is, the less the adult will be innovation-prone. The sameconsideration holds for �: due to the adoption of a new technology, the more thehuman capital depreciates, the less the adult will be in favour of implementingthe new technology itself. Conversely, an increase in the growth rate of TFPis conducive for a new technology to be preferred by adult. Note that theelasticity of past human capital in the production of the new human capital (�)
12 In the meantime, adult�s children are became adult themselves.

3.3. THE MODEL 59
is not involved in adult�s decisions: we will see below that only young take intoaccount how the past level of human capital a¤ects the next period�s humancapital accumulation. The higher the share is of adult�s income going to �nanceold�s pensions, the less the adult will vote for innovation.13 The more peopleare oriented toward adult age consumption (i.e. for high values for �), the lessthey will be in favour of innovation. Lastly, an increase in the elasticity ofhuman capital in the production of �nal good ( ) works against innovation: toinnovate is to make a part of human capital achieved during youth depreciate,and the higher its e¤ectiveness in production is, the higher the loss is in termsof pensions paid by adult.
Young
Young vote over innovation taking into account bothMt+1 andMt+2, so in prin-ciple there are four possible future con�gurations: fIt+1; It+2g, fIt+1;Nt+2g,fNt+1;Nt+2g and fNt+1; It+2g. For the same argument stated above, what willhappen at time (t+1) and (t+2) does not in�uence young�s vote today. Thus,they only base their decision on achieved state variables. The condition underwhich young will be in favour of innovation is:
�uYt (Mt+1 = I;Mt+2 = I) = �uYt (Mt+1 = I;Mt+2 = N) = (3.15)
= �uYt (Mt+1 = N ;Mt+2 = N) = �uYt (Mt+1 = N ;Mt+2 = I) =
= uYt (vYt = �)� uYt (vYt = �) > 0
and again uYt depends on ht�1 and Mt�1. An explicit expression of (3.15)is:
�uAt = log(1� i)+� log(1+�)+� log(1��)+pt log(1+�)+pt� log(1��) > 0(3.16)
Here young, in case of innovation, again directly bene�t from the technologicparameter �, but now it impacts both their labour income when adults and thepension bene�ts when retired. In this last case the bene�t from innovation isproportional to pt, so a longer life gives more time to enjoy higher consumption.The cost structure is similar: a constant cost is due to the depreciation of humancapital when young become adults, through a smaller marginal productivity inthe production of �nal good. Another cost, proportional to pt, takes into accountthe depreciation of human capital of young�s children: two periods later, infact, today�s young will get a pension that will be, in terms of human capital,depreciated because of today�s choice to innovate. Therefore the depreciationterm is mitigated by two terms, � and : the �rst takes into account the elasticitybetween the production of new human capital and the past stock of humancapital, the latter the elasticity of human capital in the production of �nalgood.
13There is a strand of literature that studies how pension systems are implemented, whythey are so big, which policies are enforceable in this context, etc. For simplicity we take s asgiven, but we think this could be one of the �rst improvements to our work.
60CHAPTER 3. A POLITICO-ECONOMICMODEL OF AGING, TECHNOLOGYADOPTION ANDGROWTH (WITH FRANCESCO LANCIA)
Simple calculations lead to the expression of pY , the value of life expectancyabove which young are in favour of innovation:
pt >� [log(1� i) + � log(1 + �) + � log(1� �)]
log(1 + �) + � log(1� �) � pY (3.17)
Young�s choices over innovation shows similar determinants as adult�s. Againthe threshold level is negatively correlated with the TFP growth rate (�) inducedby innovation. The depreciation of human capital in the case of innovation (�)is a factor that discourages young, as long as adult, to vote for innovation.Moreover, with the assumption about the sign of the denominator made above,we can state what follows.
Proposition 2 For small values of the innovation costs young are in favour ofinnovation, whatever value the other parameters take.
Proof. We need that pY < 0 for some small values of i. With the assumptionthat log(1+�)+ log(1��) > 0, being log(1��) < 0 and 0 < " < 1, log(1+�)+� log(1� �) > 0 and 0 < log(1+�)+ log(1��)
log(1+�)+� log(1��) < 1. Since pY (i) is continuous and
increasing in 0 < i < (1 � s) and limi!0+ pY = ��
�log(1+�)+ log(1��)log(1+�)+� log(1��)
�< 0,
the proposition is proved. Moreover, if limi!(1�s) pY (i) < 0, young are in favour
of innovation for any value of innovation costs.The e¤ect of the elasticity of past human capital in the production of hu-
man capital (�) can be, in principle, either negative or positive. The interesting
range of pY is, however, the positive one: here @pY
@� > 0. A high inertia in thetransmission of human capital from one generation to the other leads to lessinterest in innovation because, as in Boucekkine et al. (2002), human capitaldepreciates and the more it ages, the more its obsolescence makes it less pro-ductive. Conversely to the case of adult, for young a higher concern for adultage consumption � is conducive to innovation: since they can, innovating, boostthe production in adult age, they are in favour of new technologies.
3.3.5 Political outcome
We now deal with the political analysis: we show, for di¤erent parameters�ranges and initial conditions of life expectancy, which innovation policy is un-dertaken and which policy implications are implied. In table 1 we resume thepartial e¤ects that the single parameters have on the thresholds we de�nedabove, in particular pA, pY and p. They correspond to the value of life ex-pectancy above which adults are in favour of innovation, young are in favour ofinnovation and the value below which adults alone choose (since they representthe absolute majority of the constituency), respectively.

3.3. THE MODEL 61
pA pY p� 0 0 -� + - 0� - - 0i + + 0� + + 0 + + 0� 0 + 0s + 0 0
Tab.1. Partial e¤ects of parameters on thresholds.
In �g. 6, we represent, for generic values of parameters, the function (3.11)indicating which are the choices of agents. Shaded areas represent the setsin the space fi; ptg in which innovation is undertaken. Since vOt = �; 8t 2N+, we only report on the graph the choice vector of adult and young, Ct =(vAt ; v
Yt ). Resuming, below the line p adult choose the policy, no matter what
young choose. Above pA and pY adult and young are in favour of innovation,respectively. Note that above p, in order to implement an innovation, both adultand young have to be innovation-prone. On the horizontal axis we put the costof innovation, while on the vertical axis we have the life expectancy at time t.
Fig.6. Political choices and outcomes. Shaded areas mean "innovation". In brackets, votes of adult and young.
In �gure 6 young are particularly hostile to innovation: only for very smallvalues of i they vote �. Innovation is ensured, however, for higher values of iand intermediate values of life expectancy, in the shaded area characterized bythe choice vector (�; �): here adults are "dictators" and they choose innovation,against young�s will. In �gure 7 we again show the function (3.11) for eight dif-ferent con�gurations of parameters: the �rst (a) is what we call the benchmark,the other seven are graphed changing, one by one, the values of the parameters�; �; ; �; �; � and s.

62CHAPTER 3. A POLITICO-ECONOMICMODEL OF AGING, TECHNOLOGYADOPTION ANDGROWTH (WITH FRANCESCO LANCIA)
a)� � � � � s0.5 0.3 0.5 0.4 0.1 0.5 0.1
b)� � � � � s0.85 0.3 0.5 0.4 0.1 0.5 0.1
c)� � � � � s0.5 0.9 0.5 0.4 0.1 0.5 0.1
d)� � � � � s0.5 0.3 0.5 2 0.1 0.5 0.1
e)� � � � � s0.5 0.3 0.5 0.4 0.4 0.5 0.1
f )� � � � � s0.5 0.3 0.02 0.4 0.1 0.5 0.1
g)� � � � � s0.5 0.3 0.5 0.4 0.1 0.05 0.1
h)� � � � � s0.5 0.3 0.5 0.4 0.1 0.5 0.4
Fig.7. Plots of pA (thin line), pY (bold line) and p (dashed line) for di¤erent parameters� con�gurations.

3.3. THE MODEL 63
Analyzing �g.6, in case (b) a larger representativeness of young (i.e. higher �)leads to the vanishing of the region in which adult alone decide for innovation.In case (c) we note that a high concern of adult age consumption leads thetwo curves pAand pY to separate: the former shifts up, the latter shifts down.Moreover, in case the two curves do not intersect, the position of p does nota¤ect the political outcome: adult�s threshold binds for all (pt; i) pairs, so theyhave a veto power against young�s willingness to innovate. A general result:
Remark 3 In the case pA > pY : 8i 2 (0; 1 � s) the political outcomes in thecase of "workers�dictatorship" and "diluted power" are the same.
Case (d) shows the intuitive e¤ect of an increase in �: both the curves shiftdown, leading innovation to be preferred for a wide set of i and pt. p doesnot move and there is room for adult�s choice of innovation in early stages ofdevelopment (i.e. when life expectancy is short). In (e) a higher depreciationrate of human capital in the case of innovation makes both adult and young lessfavourable to innovate. pY is more sensitive than pA to this change: for young adepreciation of human capital re�ects in less labour income when adult and lesspensions when old. A very low elasticity of human capital in the �nal sector, in case (f), makes education almost useless in terms of adulthood income andpeople choose to work the most of their youth time, see (3.9), and so innovationis relatively more preferred because it substitutes human capital in production.A decrease in the elasticity of past human capital in the production of humancapital, � in case (g), shows a similar e¤ect. An increase in the share s of adultincome going to pension contribution (h) leaves unchanged pY and p, while pA
shifts upward, shrinking the set of i and pt where innovation is implemented.Resuming the purely political stage of the analysis, we can conclude that at
individual level, people�s willingness to innovate increases with life expectancy,the growth rate of innovation itself and, for young, the preference for adult ageconsumption. Conversely it decreases with the cost of innovation, the depreci-ation rate of human capital introduced by innovation, the elasticity of humancapital in �nal production and, for adult, the share of income going to payingold people�s pensions. Once we turn to the aggregate level, that is the politicalchoice implemented, we look, at the same time, to pA, pY and, more important,to p: given the structure of the generations, the economy as a whole chooses toimplement a new technology if and only if the majority of its voting inhabitantsare in favour of innovation. In the case of pt < p this maps one to one to thedecision of adult, while for values of pt above p we need adult and young tobe contemporaneously in favour. In the case that, for some con�gurations ofparameters, young are relatively more averse to innovation14 than adult (i.e.small �, large �, small ), for small values of life expectancy innovation is notimplemented, if life expectancy of agents increases a bit, then innovation isimplemented without the consensus of young. One more increase in life ex-pectancy can lead again to stop innovation due to the loss of absolute majority
14With "more averse" we mean that there are regions of the parameters�space where pY >pA.
64CHAPTER 3. A POLITICO-ECONOMICMODEL OF AGING, TECHNOLOGYADOPTION ANDGROWTH (WITH FRANCESCO LANCIA)
by adult. In the case that a further increase of life expectancy can again bringinnovation, then young support innovation and form a coalition with adult. Weshow this example in the next section, analyzing the political and the economicmechanisms jointly.
3.4 A simple dynamic exercise
In this section we simulate the behavior of an economy characterized by thefeatures described at the end of the section above. The reason is that thisexample can embrace dynamically all the four interesting political con�gurationsdescribed: (i) an aversion to innovation caused by a too short life expectancy; (ii)a short-lived innovation period guaranteed by adult workers�absolute majority;(iii) another period without innovation caused by young�s aversion and (iv)again innovation, once the life expectancy is long enough. Since we want toshow the possibility of multiple equilibria, we run the simulation for both highand low initial human capital: with same parameters, in the former case theeconomy reaches, in the end, sustained growth, while in the latter it ends in apoverty trap, with short life expectancy, no innovation and not much education.We make some simpli�cation in order to have easily readable results. First ofall we assume that, in the case an innovation takes place, the human capitaldoes not depreciate (i.e. � = 0). In this way the human capital accumulationfunction is the same in both the cases of innovation and no innovation. Withthis assumption, it comes out that the parameter � a¤ects only the shape of thehuman capital accumulation function and not pY . About p(ht), among manyfunctions characterized by a mapping [0;1)! (0; 1], we opt out for the simple,but �exible, speci�cation chosen by Blackburn and Cipriani (2002)15 :
p(ht) =p+ p�h�t1 + �h�t
; with �; � > 0
Where � and � jointly determine the speed at which the function goes fromp to p and the value of ht where the function shows the turning point thatseparates the initial convexity with the concavity that characterize higher levelsof ht16 . In line with Blackburn and Cipriani, we choose to set � = 0:001, � = 2,p = 0:1 and p = 1. � is bigger than one in order to ensure that p00(h) is initiallypositive and then negative, with a turning point in hT = 18:2574. The utilityfunction shows � = 0:3. In the human capital production function � = 5 and� = 0:9, while in the production of �nal good � = 0:1, = 0:6 and A0 = 2. Theshare of adult�s labour income going to fund pensions is s = 0:1, while the costof innovation is a share i = 0:1. We assume that the political weight of youngis � = 0:5.15The authors report a detailed analysis of this function: we suggest referring to their work
for all the technicalities.16For a given value of �(�); an increase (decrease) in �(�) reduces the turning point, while
for a given value of such a point, an increase (decrease) in �(�) raises the speed of transition(the limiting case of which is when p(:) changes value from p to p instantaneously, whichcorresponds to the case of a step function).

3.4. A SIMPLE DYNAMIC EXERCISE 65
With this setup, the human capital production function shows the fea-tures of �gure 3. The steady states are four, alternatively unstable and sta-ble: h� = f0; 0:59; 19:56; 1610:96g. In the case initial human capital is belowh0 = 19:56, the economy converges, without ever innovating, to a poverty trapwhere the equilibrium youth time devoted to education is e�P = 0:189, old agelife expectancy decreases until p� = 0:100134, and human capital level decreaseuntil the lowest stable steady state value 0:59.In case the initial human capital is above h0 = 19:56 (which corresponds
to an initial life expectancy p0 = 0:349), human capital starts to increase. Werefer to �gure 8 in order to give a graphical intuition to the explanation.
Fig.8. The evolution of life expectancy when h0>19:56. Shaded areas mean "innovation".
The initial state is point (A): here life expectancy is below both pA and p,so adult alone decides not to innovate. Human capital, however, accumulatesand life expectancy, in turn, increases. This occurs for some periods, thenlife expectancy lengthening makes adult prefer innovation (B): the economyexperiences some periods during which both human capital and production (thelatter at a higher speed than the former) grow. Then life expectancy passes thethreshold p: at this time adults lose the absolute majority and young, beingagainst innovation (pt > p), force the political outcome to be "no innovation"(C). Here the economy evolves, again showing increases in both human capitaland �nal good production level, but at the same pace. Once young also feelsthe net bene�ts of innovation (D), the economy reaches the upper bound oflife expectancy p, the higher steady state of human capital h�H = 1610:96, theschooling time e�H = 0:4185 and the production of �nal good increases at a rate�.Of course the aim of this exercise is not to show the real evolution of a given
economy, but to understand what the political and economic forces are thatlead the economy toward its destiny: to understand the type and the timing ofthe policies that need to be implemented is crucial when constraints on humancapital accumulation and/or innovation are in place.

66CHAPTER 3. A POLITICO-ECONOMICMODEL OF AGING, TECHNOLOGYADOPTION ANDGROWTH (WITH FRANCESCO LANCIA)
3.5 Conclusions
Over the past century, all OECD countries were characterized by a dramaticincrease in economic conditions, life expectancy and qualities and quantitiesof di¤erent kinds of knowledge. So, it is natural to suppose that the increasein longevity of citizens is an important factor in determining the life-cycle be-haviour of individuals. At the same time, it is unnatural to suppose that lifeexpectancy is exogenous and independent of economic conditions. The purposeof this paper is to provide a theory that explains how an economy might evolvewhen the longevity of its citizens both in�uences and is in�uenced by the processof economic development, especially when choices are upon two dimensions: theprivate choice of education and the public one of innovation policy.Assuming, con�dently, that longevity is positively correlated with the level
of human capital, the increase of life expectancy that economies are experienc-ing is, in principle, growth-enhancing. However, its e¤ectiveness can be harmedby, at least, two phenomena. First, building on Blackburn and Cipriani (2002),we reach their same conclusions about the pure economic e¤ects of an increasein longevity: due to the positive e¤ect of human capital on expected life ex-pectancy, it can be the case that lower levels of human capital lead to a tooshort life, and this in turns disincentives people to invest in education, givingrise to a poverty trap. At this stage of development, life expectancy is shortand human capital stock is small. Second, we deal with the political featuresof an economy where the engines of growth are human capital accumulationand systemic technologic innovation. Our idea is that, as we are stressing fromthe introduction onward, a variation in life expectancy a¤ects the individualincentives to innovate and it alters also the aggregate choices of the economy,since political representativeness of di¤erent age classes changes. Our argumentis that during �rst stages of development, when human capital is negligible, lifeexpectancy is short and retired people are few, the political power is in the handof adult workers alone. The decision to innovate or not coincides, therefore, withadult�s choice. In the case their incentives to innovate are small (for examplea large share of labour income going to �nance the PAYGO pension system,a large elasticity of the human capital used in production or a high concernin adult age consumption) they impose to the whole economy a no innovationregime. In developed economies, where life expectancy is higher, human capitalendowment is large, life expectancy is long and retired people are several, apolitical majority that enforces an innovation policy can be achieved only bymeans of a coalition. Since elderly people are innovation averse, the only wayfor an innovation to be implemented is that both young and adult are in favourof innovation. Therefore, if on the one hand a longer life expectancy pushespeople�s incentives toward innovation, on the other hand it makes the politicalweight of old increase, making the achievement of a consensus for innovationpotentially more di¢ cult. This is true, in particular, when young�s incentivesfor innovation are lower than the ones of adult, especially in the case of a highinertia in the transmission of human capital from one generation to the nextone and when the concern for adult age consumption is small.

3.5. CONCLUSIONS 67
The road that leads to sustained growth is far from being straight: we can�nd path dependency in the human capital accumulation, because in some casesan initial small amount of human capital can lead to a poverty trap, where theequilibrium longevity is not enough for adult (or adult and young in the caseof not-so-short life expectancy) to vote for innovation. In case the initial levelof human capital is high enough (or there is no room, in the accumulationfunction of human capital, for multiple equilibria), a high equilibrium level ofhuman capital is achieved, with longer life expectancy. Again, an innovation isvoted if and only if both adult and young are in favour.With this paper we provide the basis for joining together two strands of the
literature on economic growth that are gaining importance in the research andpolitical debate: technologic innovation and aging population. We stress howdi¤erent links run between these two phenomena, de�ning the possible con�ictof interests among di¤erent generations and showing how the lengthening of lifeexpectancy changes the way this con�ict of interests is solved. Moreover, westress how private and public choices combine (or not) in order to give birth toa human capital abundant, growing economy.

68CHAPTER 3. A POLITICO-ECONOMICMODEL OF AGING, TECHNOLOGYADOPTION ANDGROWTH (WITH FRANCESCO LANCIA)

Bibliography
[1] Aghion, P., Howitt, P. (1998). Endogenous Growth Theory, MIT Press.
[2] Bauer, M. (1995). Resistance to New Technology, Cambridge UniversityPress.
[3] Bellettini, G., Berti Ceroni, C. (1999). "Is Social Security Really Bad forGrowth?", Review of Economic Dynamics 2, 796-819.
[4] Bellettini, G., Ottaviano, G. I. P. (2005). "Special Interest and TechnologicalChange", Review of Economic Studies 72, 43-56.
[5] Blackburn, K., Cipriani, G. P. (2002). "A Model of Longevity, Fertility andGrowth", Journal of Economic Dynamic and Control 26, 187-204.
[6] Blackburn, K., Issa, H. (2002). "Endogenous Life Expectancy in a SimpleModel of Growth", CGBCR working paper n. 13.
[7] Boucekkine, R., de la Croix, D., Licandro, O. (2002). "Vintage human capi-tal, demographic trends, and endogenous growth", Journal of Economic The-ory, 104, 340-375.
[8] Boucekkine, R., Licandro, O. (2002), Puch, L. A., del Rio, F. (2005). "Vin-tage Capital and the Dynamics of the AK Model", Journal of Economic The-ory, 120, 39-72.
[9] Cervellati, M. Sunde, U. (2005). "Human Capital Formation, Life Ex-pectancy and Process of Economic Development", American Economic Re-view 95, 1653�1672.
[10] Fogel, R.W. (1994). "Economic Growth, Population Theory and Physiol-ogy: The Bearing of Long-Term Process on the Making of Economic Policy",American Economic Review 84, 369-395.
[11] Galasso, V., Profeta, P. (2004). "Politics, Ageing and Pensions", EconomicPolicy, April, 63-115.
[12] Galor, O. (2005). Handbook of Economic Growth, Vol. 1A, edited by P.Aghion and N. Durlauf.
69

70 BIBLIOGRAPHY
[13] Galor, O., Weil, D. N. (2000). "Population, Technology and Growth: FromMalthusian Stagnation to the Demographic transition and Beyond", Ameri-can Economic Review 90, 807-828.
[14] Krusell, P., Rioss-Rull, J. V. (1996). "Vested Interest in a Positive Theoryof Stagnation and Growth", Review of Economic Studies 63,301-329.
[15] Latulippe, D. (1996). "E¤ective Retirement Age and Duration of Retire-ment in the Industrial Countries Between 1950 and 1990", ILO Issues in SocialProtection Discussion Paper No. 2.
[16] Lee, C. (2001). "The Expected Length of Male Retirement in the UnitedStates, 1850-1990", Journal of Population Economics, 14, 641-650.
[17] Lichtenberg, N. P., (1998). "Pharmaceutical Innovation, Mortality Reduc-tion and Economic Growth", NBER Working Paper, 6569.
[18] Lichtenberg, N. P, (2003). "The Impact of New Drugs Launches onLongevity: Evidence from Longitudinal, Disease-Level Data from 52 Coun-tries, 1998-2001", NBER Working Paper, 9754.
[19] Lucas, R. E. (1988). "On the Mechanism of Economic Development", Jour-nal of Monetary Economics 22, 3-42.
[20] Mansell, R. and U. When, (1998). Knowledge Societies: Information Tech-nology for Sustainable Development, Oxford University Press.
[21] Mirowsky, J., Ross, C.E., (1998). "Education, Personal Control, Lifestyleand Health - A Human Capital Hypothesis", Research on Ageing 20, 415-449.
[22] Mokyr, J. (1998a). "The Political Economy of Technological Change: Re-sistance and Innovation in Economic History", in M. Bergand and K. Bruland(eds.) Technological Revolutions in Europe (Cheltenham: Edward Elgar) 39�64.
[23] Mokyr, J., (1998b). "Induced technical innovation and medical history: anevolutionary approach", Journal of Evolutionary Economics, Vol. 8, 119-137.
[24] Mokyr, J. (2002). "The Gifts of Athena: Historical Origins of the Knowl-edge Economy" (Princeton University Press) 218-284.
[25] Olson, M. (1982). The Rise and Decline of Nations-Economic Growth,Stag�ation and Social Rigidities, Yale University Press.
[26] Romer, P. (1986). "Increasing Return and Long Run Growth" Journal ofPolitical Economy 94, 1002-37.
[27] Schultz, P. T., (1993). "Mortality Decline in the Low-IncomeWorld: Causesand Consequences", American Economic Review, 83 (2), 337-342.
[28] Schultz, P. T., (1998). "Health and Schooling Investments in Africa", Jour-nal of Economic Perspectives, 13 (3), 67-88.