essays on geography and gis, vol. 4
DESCRIPTION
A collection of essays written by academicians and scientists, and dealing with trends in geography, geospatial matters, and GIS.TRANSCRIPT

Essays on Geography and GIS Volume 4
May 2012

Essays on Geography and GIS, Vol. 4 May 2012 2
Table of Contents
3 Through the Macroscope: Geography's View of the World
12 A Role for Old-Fashioned Geographia in Education
15 Zen and the Art of GIS Communication
19 Ecosystem Services—Learning to Leverage Natural Capital
26 Looking Forward: Five Thoughts on the Future of GIS
30 The Future Looks Bright for Spatial Thinkers
32 Scaling Up Classroom Maps
35 Managing Our Man-Made Ecosystems
37 GIS and Geography: Interactions with the Humanities
39 The Challenge of Defining Geo-Literacy
42 Let's Exchange Competition for Cooperation
46 A National GIS Infrastructure for Health Research
50 The Intersection of GIS and Gaming
52 Understanding Our World
56 From Maps to GeoDesign
60 Making Sense of Our Sensored Planet
63 Hand in Hand—Spatial Information for Latin America
71 Delivering GIS in a Period of Unsustainable Growth

Essays on Geography and GIS, Vol. 4 May 2012 3Through the Macroscope: Geography's View of the World
We have in our hands a new
scientific instrument as powerful
as any that have come before
it, including the microscope and
telescope. Collectively, GIS, GPS,
satellite remote sensing, and
popular geographics constitute a
macroscope that allows scientists,
practitioners, and the public alike
to view the earth as never before.
Today, this geographically enabled macroscope (which was first
proposed by Joël de Rosnay in 1975) allows humans to visualize
earth processes extending over vast regions or even the whole
globe while still maintaining the finest measurable detail. We who
use it can capture and analyze far more complete representations
of places and features than ever before. We can "see" earth
features, such as gravity and magnetism, that are invisible to the
naked eye and yet as real and commanding as the mountains and
valleys we've seen all along. Most important, we can marshal this
diverse information into working models of earth processes large
and small.
The microscope allowed humans to see smaller particles and
organisms and led to scientific revolutions in biology, medicine,
and nuclear physics. The telescope allowed humans to see farther
away with greater detail and led to revolutions in astronomy and
geodesy.
Through the Macroscope: Geography's View of the WorldBy Jerome E. Dobson, Professor of Geography, University of Kansas

Essays on Geography and GIS, Vol. 4 May 2012 4Through the Macroscope: Geography's View of the World
Will the macroscope similarly lead to scientific revolutions of its
own? Will it change the way science itself is conducted, as those
earlier instruments did? Has this scientific revolution already
begun? Yes, but it has done so slowly and mostly unrecognized
by pundits and the public alike.
In 2008, the Proceedings of the National Academy of Sciences
announced that cattle and deer can sense magnetism. Biologists
in Germany and the Czech Republic discovered this amazing and
previously unsuspected phenomenon not by sensing brainwaves
or measuring body chemistry but by "analysis of satellite images,
field observations, and measuring 'deer beds' in snow."
In the 1990s, a geophysicist solved a mystery that had perplexed
hydrologists for decades—a significant portion of the global
transport of water had never been explained. Perusing satellite
imagery, he suddenly realized that the answer lay in vast currents
of water vapor drifting through the atmosphere. He calculated
their mass and followed their flows and found the H2O that had
been missing from the global water cycle equation.
Thus, in two diverse realms of science, the geographically
enabled macroscope actively bolstered the analytic powers of
specialized disciplines. Where will this lead?
Geography in the Crucible of Science
Is geography a science? Yes, most definitely, because science
would be diminished too much without it.
In classical times, geography was viewed as a fundamental
science and humanity on par, at least, with the specialized
disciplines of today. During the Middle Ages in Europe, however,
notions of real-world geography devolved into fantasies, and no
term for geography was in common usage even in the highest
realms of government and academe. The discipline thrived again
from the mid-15th to mid-20th centuries based on an evolving
chain of influences from exploration to westward expansion to
geopolitics. Since 1948, however, geography has undergone a
second academic purge, primarily in the United States, and the
word itself has lost ground to a host of popular aliases, geospatial
not least among them.
Finally, we practitioners have an instrument that potentially
enables us to reinstate geography in science as it was practiced
in classical times and in the Renaissance. What will science,
enhanced by the macroscope, look like a generation or more
from now?

Essays on Geography and GIS, Vol. 4 May 2012 5Through the Macroscope: Geography's View of the World
First, we, its stewards, must decide what to do with this new
instrument and what role we will play in the science that follows.
Will geographers and GIScientists drive the revolution or
merely go along for the ride? In the case of animal magnetism,
for instance, why didn't we, who worked intensely with such
imagery for decades, notice this odd phenomenon long before
the biologists did? In the case of global water circulation, why
didn't we, who used the imagery routinely and knew its spectral
characteristics so well, make that discovery ourselves? Instead,
we spent enormous efforts trying to get rid of the haze that was
blocking our view of the ground but was, for the geophysicist, the
key to a scientific breakthrough of historic proportions.
Bluntly, how did we get scooped on major discoveries so
easily resolved with our own data? Why was science held
back until biologists and geophysicists discovered those
insights themselves? Surely, we must rethink our own functions,
motivations, and pursuits if we want to be the ones making
discoveries, grabbing headlines, and gaining financial and
administrative support for our work.
How Will Geography Itself Fare?
By any measure, geography has been remarkably productive
in the past half-century, and yet department after department
has been closed. In 2007, I wrote in ArcNews that only two
geography departments remained in the top 20 private
universities in the United States. Four years later, no viable
ones are left. The University of Southern California abolished
its geography department in favor of a geospatial technology
program, and Johns Hopkins University's Department of
Geography and Environmental Engineering slipped to only two
geographers in a faculty of 18.
To anyone who values education, it should be self-evident that
such widespread blindness toward any discipline inevitably must
have a damaging impact on science itself. Accordingly, I offer two
propositions:
• Proposition 1—Science itself is rife with errors and omissions
due to lack of geographic input in formulation and testing of
theory.
• Proposition 2—Any well-trained geographer or GIScientist
who focuses on any popular tenet of conventional theory,
emphasizes the missing spatial components, and works
conscientiously can make groundbreaking discoveries in one
year of elapsed time. In common English, I am suggesting
that earth science as a whole is so flawed by lack of spatial
thinking that there will be "easy picking" and lots of "low-
hanging fruit." Discoveries will come easily, but acceptance
may take decades, since that depends on the culture of
science far more than factual evidence.

Essays on Geography and GIS, Vol. 4 May 2012 6Through the Macroscope: Geography's View of the World
To illustrate, let's focus on continental drift, as suggested by de
Rosnay in The Macroscope: "Around the concept of continental
drift it is possible to teach the complementary aspects of
geography, geology, biology, and ecology. . . ." Then I will focus
on another of my favorite topics, the origins of human culture.
Continental Drift and Plate Tectonics
There is no better case than plate tectonics to demonstrate the
abiding value of spatial evidence and, simultaneously, society's
habitual rejection of it. Starting with the European discovery of
the Americas, it took about half a century to produce a decent
map of their coasts and only another half-century for Abraham
Ortelius to notice the fit between South America and Africa and
propose they must once have been joined. In the third edition
of his popular text Thesaurus Geographicus (1596), he proposed
the theory of continental drift in no uncertain terms. Yet there is
no known instance of anyone citing his remarkable insight over
the next four centuries. Others did reach the same conclusion—
Lilienthal (1756), DeBrahm (1771), Snider-Pellegrini (1858)—always
based on the fit of coasts, but all were ignored or dismissed until
Alfred Wegener in 1912. Soon, he too was rejected and ridiculed
for his unconventional theory until ocean floor spreading was
discovered and accepted as proof in the early 1960s.
For thousands of years, the interplay of our community—
geographers, cartographers, geodesists, and surveyors—with the
rest of science was central to the advancement of fundamental
The Macroscope
The macroscope was first proposed by Joël de Rosnay in 1975. His
foresighted book, The Macroscope, brilliantly proclaims the need and
lays the intellectual foundation for such a technological advancement.
Writing so early in the history of GIS, however, he does not seem to
be aware that work had already begun on his marvelous instrument.
He mentions geography, but only as one of many disciplines that one
learns in school and that can be illuminated by posing great questions
about how the world works. He says, for instance, "Around the concept
of continental drift it is possible to teach the complementary aspects of
geography, geology, biology, and ecology. . . ."
Essays on Geography and GIS, Vol. 4 May 2012 7Through the Macroscope: Geography's View of the World
theories, including plate tectonics. Sometimes we led science
theory, as when Bouguer found that mountains are lighter than
other crust (1737–1740) and the Great Trigonometrical Survey of
India confirmed his findings (early 1850s), and together they laid
the foundations for current understandings of plate tectonics.
Sometimes we proved the grand theories of others, as when de
Maupertuis (1736) and La Condamine (1736–1743) proved that the
earth bulges at its middle, thus confirming Isaac Newton's theory
that centrifugal force opposes gravity in planetary motions.
Still, we somehow never managed to claim a place among the
authoritative disciplines in that realm of science, even though
much of it is called paleogeography. One major factor is the
scientific community's overwhelming preference for process
logic over spatial logic. Spatial logic accepts morphology, spatial
distribution, and spatial association as primary evidence of earth
processes that must be tested through process-oriented research.
Conversely, process logic accepts contemporary knowledge
about individual earth processes; synthesizes general theory;
and proposes all sorts of tests, though rarely are the tests overtly
spatial.
Today, the macroscope has much to offer, opportunities abound,
and dramatic new insights are likely. Geographers, cartographers,
and GIScientists are ideally suited, for instance, to verify
previously discovered continental fits and search for new ones.
Likewise, our community is the one most capable of developing a
spatial statistic to measure the probability of fit among coastlines.
In GIS per se, it's up to us to develop the functionality to move
land masses independent of earth coordinates. When available,
this new capability should be used to follow all paths connecting
known or suspected continental fits. The ultimate challenge, of
course, will be to disassemble all land masses into their geologic
formations; run spatial statistics, such as principal components
analysis, to determine their affinities to one another based on
age, lithology, paleontology, polarity, and elevation/bathymetry;
and then reassemble the whole earth based on evidence rather
than theory.
The rewards may be invaluable for understanding deep
earth processes, estimating seismic risks, reconstructing
the paleogeography of plant and animal life, predicting the
distributions of oil and other essential minerals, and scores of
revelations yet to come.
Origins of Human Culture
Take a look at the graph of global sea level rise below, annotated
to show how long each zone was exposed. Has anyone ever told
you that for 104,000 years, the world ocean remained at least
25 meters lower than it is today? That for 59,000 years, it was at
least 68 meters lower, and for 35,000 years, it was at least
85 meters lower? That geographic information has to be the
single most important clue to how and where humans developed
into the sentient beings of today. Yet scientists routinely call the
old coast a "land bridge," as if it were only good for getting from

Essays on Geography and GIS, Vol. 4 May 2012 8Through the Macroscope: Geography's View of the World
one place exposed today to another place exposed today (e.g.,
Siberia to Alaska, Asia to Japan, Australia to Tasmania).
Make no mistake. That was a vast coastal plain, and people surely
lived there.
The rise and fall of sea level during the ice ages—due to water
tied up in ice sheets and then released during interglacial
periods—is like a vast millennial tide, and its total area is
equivalent to the continent of North America in size. It is flat,
coastal, and mostly tropical and would have been the best
place to live during the ice ages. Yet we collectively have never
mapped it or agreed on a name for it.
Here again, the opportunities for geographic revelations are
boundless. Our community is the one best suited to map the
land that was inundated. We can trace the old coasts at various
stages and times over the past 120,000 years and predict
likely settlement sites and trade routes. We can document
authoritative and unproven claims of ancient structures on land
and underwater, entering them into a proper GIS with precise
coordinates, attributes, and confidence levels. Ultimately, we can
build a 3D geovisualization so the land now below sea level can
be studied like the land above.
The rewards will be invaluable for understanding the human and
biophysical processes operating during the ice ages. Consider,
for instance, that sediments deposited from the ice sheets of
20,000 years ago do not lie in the deltas of today but rather in
the old deltas, 400 feet down. The greatest scientific revolution,
however, may lie in better understanding of human evolution
itself, since several glaciation cycles coincide with the time period,
120,000 years, in which modern humans are known to have
existed.
Global sea level rise and the number of years each zone was exposed.

Essays on Geography and GIS, Vol. 4 May 2012 9Through the Macroscope: Geography's View of the World
"Aha!" Revolution Under Way. Mind Your Step.
I've had a few "aha" moments enabled by the macroscope.
First, once, while conducting fieldwork in the Adirondack
Mountains of New York State at the center of the acid rain debate,
I found myself in a forest so dense and disturbed that I could
shoulder forward at no more than one-half mile per hour. I could
see merely a few feet ahead, but I had with me a map of land-
cover types previously classified in the laboratory—a bit of the
macroscope, one might say. Checking the map, I realized the
unusual forest before me went on for miles in every direction.
More important, it displayed a discernible pattern that revealed
dramatic new insights into the lake acidification process that so
concerned the nation at the time.
Second, while working in Liberia in 1981, my attention was drawn
to the geographic distribution of mineral deposits in West Africa,
which I later compared to those of South America. That line of
reasoning, enhanced by the macroscope, soon led to numerous
continental fits that had never been noted before. Now, as always
since 1596, the question is: Do continental fits imply adjacency?
In terms of pure geometry, South America fits beautifully when
turned 90 degrees clockwise from its traditional fit with Africa,
and Australia exquisitely matches eastern North America. Both
fits have considerable geologic evidence in their favor as well. But
does that mean each pair actually did lie side by side at some
time in its geologic past? The centuries-old lopsided debate
lumbers on.
Third, years later, reading a science magazine, I ran across a
forthright statement that sea level had risen 400 feet over the
past 20,000 years. I immediately saw it as the key to a mystery
that had puzzled me since boyhood. That aha moment prompted
a series of geographic questions: What is missing from the
The macroscope enables, and even entices, its users to view old questions in new ways. In terms of pure geometry, for instance, South America may fit Africa better when rotated 90 degrees clockwise than it does in the fit that has been observed for four centuries.

Essays on Geography and GIS, Vol. 4 May 2012 10Through the Macroscope: Geography's View of the World
archaeological record? Were coastal populations identical to
inland populations? Might there have been some factor, cultural
or physical, that caused systematic differences between coastal
and interior people? My brother Jeff Dobson, also a geographer,
pointed out that iodine is primarily a coastal resource. Noting that
Neanderthals lived primarily in places that are iodine deficient
today, I spent several years investigating iodine in human
evolution.
My purpose here is not to discuss the insights themselves, and
certainly not to prove that I was right, but rather to share some
lessons learned from the overall experience.
These three experiences in diverse realms of science support,
first and foremost, both of the propositions stated above. Clearly,
there is much left to discover, and our community is in an ideal
position to advance the macroscope and support or lead the
coming revolution in science theory.
Furthermore, there is much personal satisfaction awaiting those
who take up the gauntlet and wield the macroscope to advance
science theory. After each of the aha moments listed above,
I came down from the mountain—literally in one case and
figuratively in the others—so elated that adrenaline fueled my
research for several years to come.
But the road will not be easy. Revolutions always stir passions.
Prepare yourself for praise from those who appreciate spatial
logic but rejection, even humiliation at times, from those who
don't.
Fervor is essential. Wegener's own father-in-law, the renowned
climatologist Wladimir Köppen, advised him not to publish his
revolutionary theory for fear of the damage it would do to his
reputation and career. How different the history of earth science
might have been if Wegener had shown less fervor . . . or Ortelius
had shown more.
Ultimately, it will be essential to upgrade the scientific method.
Our community must insist on testing all earth science
hypotheses for space as well as time, entity, and process. We
must insist that all other disciplines live up to our standards,
which are far more demanding in terms of space.
It will be essential to allow investigators to ask "stupid" questions
arising from spatial evidence without penalty, as long as they truly
ask and do not proclaim unproven truths. Otherwise, science will
throttle its best and brightest minds—those most suited to the
new way of thinking—and hold back the advancement of science
theory.
A concrete step in this direction will be to recognize a new
grade of hypotheses so encompassing that testing requires
simultaneously or subsequently rethinking many related
hypotheses and even widely accepted theories. Perhaps they
should be called hypertheses (meaning "above or beyond")
rather than hypotheses. At present, there is no middle ground

Essays on Geography and GIS, Vol. 4 May 2012 11Through the Macroscope: Geography's View of the World
between an individual hypothesis proposed for testing and
an encompassing theory widely accepted by many scholars in
any given field. Hence, conventional wisdom based on popular
theory often trumps the facts at hand without prompting much
reconsideration of existing theory. Alternatively, hypertheses
could be tested first for their central claim and then, if found solid,
would force rigorous testing of related hypotheses and theories.
The macroscope is here today, and science is already changing
in response to it. We are entering a new scientific era that may
be every bit as exciting and enlightening as the revolutions
prompted earlier by the microscope and telescope. Surely our
professional lives will be richer, and science itself will gain, if
we, who know the marvelous instrument best, insist on using it
ourselves to tackle the greatest mysteries of our time. Surely we
must insist on reviving the classical model in which geography is
viewed as a fundamental discipline.
Again, I urge, bring back geography! To science . . . education
. . . business . . . and government! The benefits to science and
society will be incalculable.
About the Author
Jerome Dobson is president of the American Geographical
Society and a professor of geography at the University of Kansas.
He is a Jefferson Science Fellow, a fellow of the American
Association for the Advancement of Science, and chair of
fellows of the University Consortium for Geographic Information
Science. He formerly served as senior scientist in the Office of
the Geographer and Global Issues, United States Department
of State, and as a member of the distinguished research and
development staff, Oak Ridge National Laboratory. For further
reading, see the author's previous ArcNews article "Bring Back
Geography!" (Spring 2007). Also see:
Dobson, Jerome E., Richard M. Rush, and Robert W. Peplies.
1990. "Forest Blowdown and Lake Acidification," Annals of the
Association of American Geographers 80(3): 343–361.
Dobson, J. E. 1992. "Spatial Logic in Paleogeography and the
Explanation of Continental Drift," Annals of the Association of
American Geographers 82(2): 187–206.
Dobson, J. E. 1996. "A Paleogeographic Link Between Australia
and Eastern North America: A New England Connection?"
Journal of Biogeography 23: 609–617.
Dobson, J. E. 1998. "The Iodine Factor in Health and Evolution,"
Geographical Review 88(1): 1–28.
For more information, contact Jerome E. Dobson, University of
Kansas (e-mail: [email protected]).
See also "The STEP Model" and "Popular Geographics."
(This article originally appeared in the Winter 2011/2012 issue of ArcNews.)

Essays on Geography and GIS, Vol. 4 May 2012 12A Role for Old-Fashioned Geographia in Education
The word geography comes from the Greek geographia, which
means "writing or describing the world." I frequently hear people
say that the word geography is outdated because modern
geography is about much more than just describing the world.
I tend to be sympathetic to that view because I believe that
the power of modern geography is in its approaches to solving
problems and answering questions. However, I think that
describing the world is an essential component of geography,
and it should have a central part in geography education.
I have been thinking about this a lot lately because I have been
thinking about the challenges of teaching young people about
human impacts on the environment. I have become convinced
that the biggest challenge in teaching about the environment is
students' lack of familiarity with their environment. How do you
teach children about changes to the environment if they do not
know what the environment is currently like?
But how, you might ask, is it possible to not be familiar with one's
environment? In the modern world, there are two ways in which
children are unfamiliar with their environment.
First, the environment they live
in is increasingly circumscribed.
Middle-class youth in our society
live largely in enclosed, interior
spaces. When they need to
travel through external spaces,
they tend to do so in enclosed
vehicles that are piloted by
an adult. Today's typical K–12
students go to school in a car or bus that picks them up very
close to their homes and delivers them to the front door of their
schools. They typically spend their afternoons in their school
or another building, which they are transported to, again, in
a bus or a car, until they return home by the same modes of
transportation.
Second, they have little opportunity or motivation to notice their
environments. They are isolated from the external environment
by various forms of cocoon, and they are not responsible for
navigating by themselves, protecting themselves, or caring for
any aspect of the environment.
A Role for Old-Fashioned Geographia in EducationA column by Daniel C. Edelson, Vice President for Education, National Geographic Society

Essays on Geography and GIS, Vol. 4 May 2012 13A Role for Old-Fashioned Geographia in Education
I do not want to romanticize the past, but I do want to point out
that only two generations ago, most Americans still depended
directly on their environment for their livelihood and were not
isolated from the external world by fully climate-controlled,
protective buildings and vehicles. I also cannot ignore the fact
that most people on earth still live that way.
Middle-class American children no longer have much need to be
aware of their environment. They are isolated and protected from
it, particularly during the part of the day set aside for education.
The result is that we have created an excellent environment for
young people to learn math, language arts, and abstract science
and social studies, but we have created a terrible environment for
young people to learn about their world. I worry about my own
middle school daughter, who is studying earth science right now
in a classroom that seals her off from any direct interaction with
the natural processes that she is studying.
Worrying about how to teach children about a world from
which they are so isolated eventually led me back to the original
concept of geographia. Before students can understand the
world, they need to observe it. To observe it, they need to
experience it, of course, but they also need to notice it. It's not
just about looking; it's about seeing. And teachers have known
forever that the best way to get students to be good observers is
to engage them in documentation and description.
At National Geographic, we have begun exploring ways to
turn students into old-fashioned geographers—in other words,
describers of their world. One of the strategies we have been
using is engaging students in what different people call citizen
science, public participation in research, and volunteered
geographic information initiatives. In these projects, participants
collect and share geographic information with each other and, in
some cases, conduct investigations or solve problems with the
information. At National Geographic, we've adopted our own
term for these projects. We call them community geography
Young people learning to notice patterns in nature.

Essays on Geography and GIS, Vol. 4 May 2012 14A Role for Old-Fashioned Geographia in Education
projects, and with support from the National Science Foundation
and Esri, we're developing a web-based GIS and social
networking platform to support community geography initiatives.
I like to use Project BudBurst as an example of how these
projects foster noticing. Project BudBurst is an educational
outreach initiative of the National Ecological Observatory
Network that focuses on phenology (seasonal changes) in plants.
The concept behind BudBurst is very simple. You pick a specific
tree or shrub and monitor it throughout the year, recording your
observations in a database that is shared among thousands of
people monitoring other trees and shrubs throughout the United
States. You note when flower and leaf buds appear and open.
You also note when they fade, turn color, and fall off.
It's safe to say that virtually every student in every classroom in
America knows that plants have seasonal cycles. But how many of
them know the specific cycle of any specific types of plants? And
how many know how these cycles change from place to place
and year to year? And how many know what the natural variability
of those cycles is in a specific location or a specific year?
It is only when people are familiar with these kinds of patterns
and cycles that they can begin to understand what it might mean
for human activities to change the environment.
So, ironically, the key to achieving the understanding and
problem solving that we associate with modern geography is to
start with the observation, documentation, and description that
are characteristics of traditional geography.
Information about National Geographic Education's Community
Geography initiative is available at natgeoed.org
/community-geography.
(This article originally appeared in the Winter 2011/2012 issue of ArcNews.)

Essays on Geography and GIS, Vol. 4 May 2012 15Zen and the Art of GIS Communication
I work in a basement. I bet many of you probably do, as well, or
at least don't have windows. How do you figure out if it is raining
outside at lunchtime? I go to isitraining.in/Columbus (enter your
own city—it's awesome), and it gives me a simple answer in giant
letters: Yes or No. Congratulations, you just "did" GIS. But notice
that when you go to the site, there is no map or GIS logo, and
it is not a rich Internet application full of flashy things. Even if it
does some amazing spatial analysis and data gathering, to the
consumer, it simply answers the question.
While this example is of something that is lighthearted and
fun, albeit extremely practical, the take-home lesson for our
profession is that we can have even more impact effecting
change and influencing the world if we hone our skills as spatial
communicators.
As the world's population is becoming more geographically
literate (knowingly or unknowingly), expectations of us as spatial
knowledge providers have risen. To meet these demands and
facilitate spatial thinking, we must not only be able to deliver
accurate, timely data but also provide it in a way that is easily
found, consumed, and understood on any device.
We have been responding to these challenges by growing our
skills in GIS tradecraft, data storage, and web technologies, all
making great, new solutions possible. While providing these
solutions, we need to remember to find balance in system design,
Zen and the Art of GIS CommunicationBy Brandon B. Brown, GIS Administrator, City of Dublin, Ohio
For annual street maintenance, there is a very simple way for residents to gauge the impact of projects on their neighborhoods.

Essays on Geography and GIS, Vol. 4 May 2012 16Zen and the Art of GIS Communication
application design, data uses, and cartography. For if the solution
is not inviting, fast, and easy to use, our customers may simply
move on.
The following are selected Zen-based sayings, with our
interpretation of them as strategies that we follow toward GIS
communication enlightenment in our work at the City of Dublin.
In all things, success depends on previous
preparation, and without such previous preparation
there is sure to be failure.
As we set out to develop new web applications, we quickly found
that we had not scheduled enough time to focus on building our
base. There were so many questions, each with many answers.
How many servers should we have? How many services? Should
services be cached or dynamic? What about security? How do we
best ensure good performance? We were thoroughly confused.
To move forward, we had to find a balance between learning
and doing while overcoming our fear of making a wrong choice.
Using this balance and newfound courage, we focused on
planning and building not only a technical infrastructure but
also a cartographic infrastructure. To guide service creation, we
considered how we wanted to visually present and group our
data to create consistency among our applications, maximize
server resources, and minimize service management. These
activities have allowed us to spend more time focusing on what
we are trying to communicate with our final products.
Water which is too pure has no fish.
When we began developing services and applications, we were
excited to have web applications that finally utilized our live
data. This was the highly detailed, accurate, and up-to-date data
we had been trained to collect and maintain, and of course, we
wanted our customers to see it.
We found a problem, though. For most of our applications, the
level of detail maintained in the main data store was simply
not necessary, and using it was having a negative impact on
application performance. The lower performance drove away
customers. We were left with a clean pond with no fish.
To speed things up and bring users back, we had to let go of
the idea that the "pure" data was the best data. We do this by
utilizing a presentation-tier data store. The data residing here has
been cleansed of unnecessary fields and indexed, and it's had
its geometries generalized. For example, there is no requirement
An example of a tool designed to quickly answer a question.
Essays on Geography and GIS, Vol. 4 May 2012 17Zen and the Art of GIS Communication
to serve our street centerline as intersection-to-intersection
segments, so we simply merge them by street name and
functional class, creating a much more responsive feature class.
Eliminate what does not matter to make more room
for what does.
There is great development and sharing going on in the GIS
community, especially when it comes to widgets for web
applications. We quickly ran into the trap of adding cool new
tools to applications for no other reason than that they were cool
new tools. We found that this quickly confused and alienated
our customers. We now follow a strict rule that if a tool is not
required for an application, it does not exist in that application.
Simplicity can also pay great dividends when applied to basemap
creation. Removing decision points from the customer, such as
when to turn on/off certain layers, eases the user experience. We
manage layers and symbology for over 15 layers utilizing scale
levels, leaving the customers' focus on more important aspects of
the application.
The application level is the most visible area where we try to
enforce simplicity. We do have a business case for having a
traditional web GIS application. When creating it, it was done so
with this strategy in mind, and even though it is full of data and
tools, we try to minimize the clutter. More effective are what we
call "maplications"—our version of focused applications.
No snowflake ever falls in the wrong place.
To effectively communicate, we must act as the gentle wind acts
on a snowflake and guide our customers to the place they need
to be. Rather than directing customers to the GIS home page, we
try to incorporate our maplications into the appropriate city web
page. We see the maplication as just another supporting piece,
like an image or chart, to an existing story. Our goal is to have
appropriate applications appear contextually during any customer
experience with the city's web presence. For example, if they
are visiting the main website, they may find more intricate data
and tools than if they are visiting our mobile site. If they are on
the road construction page, they will find the road construction
maplication rather than a list of street names and dates.
See with your eyes, hear with your ears. Nothing is
hidden.
While we try to guide our customers to the appropriate
application and then guide their experience by making some
decisions for them, sometimes it backfires. For this reason, we
have placed a higher value on budgeting time to spend with
customers during the design process and after release. We watch,
we ask questions, and we encourage criticism.
During these sessions, we try to remove ourselves from our GIS
role and think even more like the customer. A helpful question we
ask ourselves is, "Would my mother understand this?" We also try
to get input from customers that do not know much about GIS.

Essays on Geography and GIS, Vol. 4 May 2012 18Zen and the Art of GIS Communication
No flower ever sees the seed.
We try to create applications that help people become spatial
thinkers and better decision makers. If we do our job correctly,
they will be greeted by an application that is inviting, informing,
and easy to use. They may never know they are using GIS.
This is hard for us as GIS professionals; for years, we have been
trying to explain what we do and all the great benefits of our
robust systems. Now, we are trying to train ourselves that we will
probably be most impactful if we can remove jargon and buttons
and if we can just roll with it if people call a map a picture or an
intricate GIS web application a map. Of course, if they ask, feel
free to blast them with a stream of acronyms and technical jargon
that would make the GIS forefathers blush.
Conclusion
Our customers' demands are simple—they want to be able
to find without looking, understand without learning, and
do it all fast. We can satisfy these demands by building our
base, releasing some of our long-held notions about data and
techniques, create reusable resources, show only what is needed,
tell a story, and listen to feedback. Good luck, and GIS be with
you. Now, it's time for lunch—I wonder if it's raining.
About the Author
Brandon Brown is the GIS administrator for the City of Dublin,
Ohio, where he has worked for the past eight years. Previous
experience includes three years as an analyst/programmer at the
Auditor's office of Lucas County, Ohio, and a short but wonderful
time at Livingston County.
For more information, contact Brandon B. Brown, GIS
administrator, City of Dublin, Ohio (e-mail: [email protected]).
(This article originally appeared in the Winter 2011/2012 issue of ArcNews.)

Essays on Geography and GIS, Vol. 4 May 2012 19Ecosystem Services—Learning to Leverage Natural Capital
The ecosystem services concept helps
us understand and describe the
benefits that the environment provides
to humans, benefits that we have
traditionally viewed as free and would
have to supply for ourselves if our
surroundings ceased to furnish them.
The environment provides direct services, including air, minerals,
food, water, and energy. It furnishes regulating services, such as
the purification of water, carbon sequestration, climate mitigation,
waste decomposition and detoxification, crop pollination, and
pest and disease control. The environment supplies support
services, including nutrient dispersal and cycling, as well as seed
dissemination. The environment also yields cultural benefits, such
as intellectual and spiritual inspiration, recreation, ecotourism,
and scientific discovery.
The United Nations 2005 Millennium Ecosystem Assessment
stressed the value of ecosystem services. For instance, the
authors of the assessment noted the following:
The assessment focuses on the linkages between
ecosystems and human well-being and, in particular,
on "ecosystem services." An ecosystem is a dynamic
complex of plant, animal, and microorganism
communities and the non-living environment
interacting as a functional unit. . . . Ecosystem
services are the benefits people obtain from
ecosystems. . . . The human species, while buffered
against environmental changes by culture and
technology, is fundamentally dependent on the flow
of ecosystem services.
The Galápagos Islands provide an example of ecosystem services
at work. After Europeans discovered the archipelago in 1535,
these hardscrabble, barren volcanic islands suffered centuries of
abuse by buccaneers, whalers, settlers, and scientists before the
Ecuadorian government created a national park in 1959. Some
97 percent of the Galápagos Islands (1,714,000 acres [693,700
hectares]) is in the national park. In 1986, the waters surrounding
the islands received protection through the creation of the
Galápagos Marine Reserve.
As a result, global science and the Ecuadorian economy have
benefited. The Galápagos Islands continue to generate new
biologic and geologic knowledge. Meanwhile, the archipelago
Ecosystem Services—Learning to Leverage Natural CapitalBy Frederick Steiner, Dean, School of Architecture, The University of Texas at Austin
Essays on Geography and GIS, Vol. 4 May 2012 20Ecosystem Services—Learning to Leverage Natural Capital
has become a popular destination for ecotourism and recreation.
These activities create jobs and revenue for Ecuador.
New York City's watershed protection efforts provide another
example of ecosystem services. The watershed covers
approximately 2,000 square miles (5,180 km²). Nineteen
reservoirs supply 1.2 billion gallons (4.5 billion liters) of drinking
water daily to nine million New Yorkers. In the 1990s, faced with
the prospect of spending $8 billion on a new water filtration plant
that would cost $300 million annually to operate, the city instead
decided to invest $1.2 billion over 10 years to restore and protect
its watersheds. These funds were used to purchase land and
invest in environmentally sound economic development in the
watershed.
In addition to benefiting New York City residents and reducing
costs to urban taxpayers, the people who live in the watershed
gained value from the ecosystem services approach. Everyone
has good, clean water. Farmland has been preserved, habitat
created, and recreational opportunities expanded.
Landscape architects, community and regional planners,
conservationists, architects, engineers, and policy makers can
employ the ecosystem services concept at many scales—from
the megaregion to the site. GIS and GeoDesign technologies
can contribute to these cross-scale applications because of their
capacities to capture, manage, analyze, and display geographic
information, as well as assist in the processes of planning and
design.
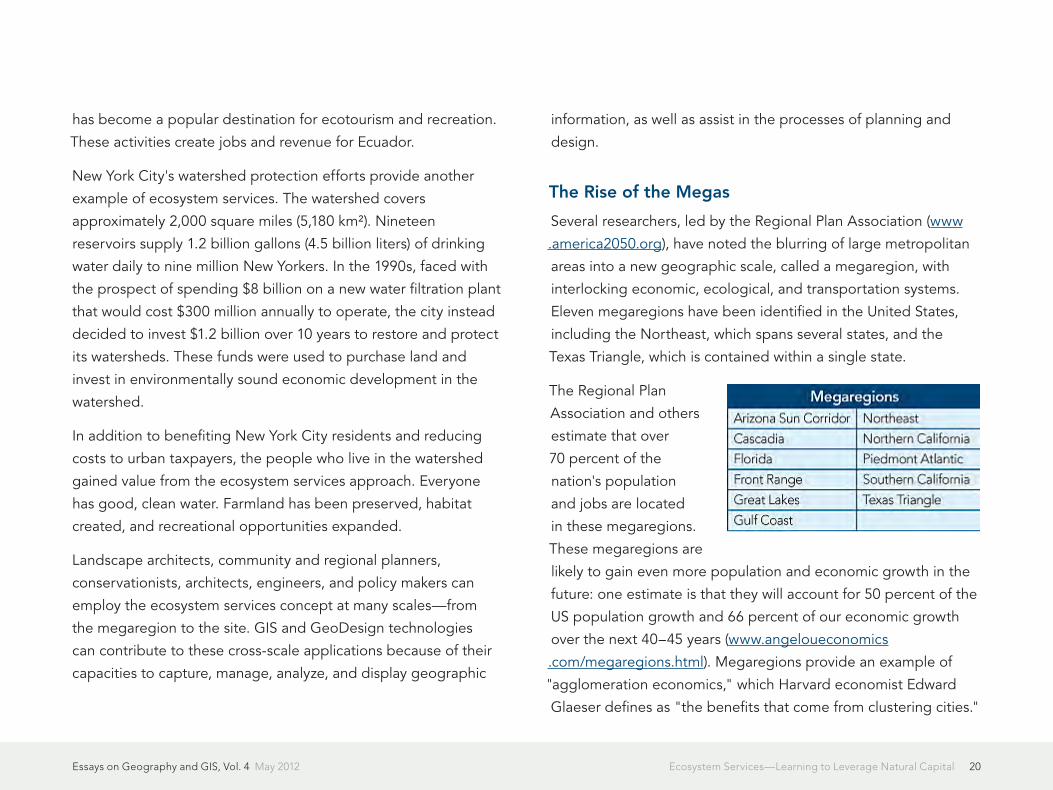
The Rise of the Megas
Several researchers, led by the Regional Plan Association (www
.america2050.org), have noted the blurring of large metropolitan
areas into a new geographic scale, called a megaregion, with
interlocking economic, ecological, and transportation systems.
Eleven megaregions have been identified in the United States,
including the Northeast, which spans several states, and the
Texas Triangle, which is contained within a single state.
The Regional Plan
Association and others
estimate that over
70 percent of the
nation's population
and jobs are located
in these megaregions.
These megaregions are
likely to gain even more population and economic growth in the
future: one estimate is that they will account for 50 percent of the
US population growth and 66 percent of our economic growth
over the next 40–45 years (www.angeloueconomics
.com/megaregions.html). Megaregions provide an example of
"agglomeration economics," which Harvard economist Edward
Glaeser defines as "the benefits that come from clustering cities."

Essays on Geography and GIS, Vol. 4 May 2012 21Ecosystem Services—Learning to Leverage Natural Capital
This growth provides opportunities and challenges for
environmental design and planning. One opportunity is to
view environmental processes at the scales at which they occur:
watersheds, rivers, mountain ranges, aquifers, and weather
patterns. A challenge is that the detrimental effects associated
with rapid growth are threatening environmental quality. Large-
landscape protection can help mitigate negative environmental
impacts.
Northeast Megaregion
In response, the Regional Plan Association has joined others to
produce the Northeast Landscapes Initiatives Atlas (www.rpa.org
/northeastlandscapes). The goal is to protect watersheds, wildlife
habitat, and other landscape-scale processes in the 13-state
Northeast megaregion. The Regional Plan Association-led team
is using GIS to understand spatial interrelationships. The team
has produced an inventory of public and private landscape
conservation initiatives in the Northeast megaregion.
The GIS-based atlas will contain three types of data: landscape
initiatives, conservation context, and development context.
Robert Pirani of the Regional Plan Association notes that the
delivery and valuation for ecosystem services are key values
added for landscape planning:
Many ecosystem services are delivered through
landscape-scale processes: source water protection,
riverine and coastal flood management, sustaining
fish and wildlife populations, and the agglomeration
needed for viable agricultural and forestry
economies.
Monetizing these services depends on creating a
market. Landscape conservation initiatives are the
right scale for enabling viable markets. As institutions,
land trusts and conservancies potentially can be the
institutions that bridge upstream and downstream
sellers and buyers.
The Texas Triangle Megaregion
The Texas Triangle megaregion is formed with Houston and San
Antonio at the base and Dallas and Fort Worth at the apex. By
2050, some 35 million people, or 70 percent of the population of
Texas, will live in the triangle's four metropolitan areas: Dallas-Fort
Worth, Houston, San Antonio, and Austin. The Edwards Aquifer
supplies water to metropolitan San Antonio and Austin, as well
as to many farmers and ranchers. In fact, this immense, prolific
aquifer is the sole source of water for San Antonio. As a result,
the protection of the aquifer is essential for the future of the
Texas Triangle.
The Edwards Aquifer roughly underlies what is known as Texas
Hill Country. In addition to being a rich source of water, the
landscape contains important wildlife habitats and a significant

Essays on Geography and GIS, Vol. 4 May 2012 22Ecosystem Services—Learning to Leverage Natural Capital
cultural history. The landscape is also quite scenic and valuable
for recreation. As a result, the ecosystem services provided by
the Hill Country are many. In response to growth pressures in the
Hill Country and over the aquifer, the cities of San Antonio and
Austin, as well as several counties, have purchased conservation
easements to protect the assets of the Hill Country.
The nonprofit Hill Country Conservancy contributes much to
these government efforts. In addition to purchasing easements,
this land trust is also engaged in the GIS mapping of the
landscape assets of the Hill Country. The conservancy employs
GIS at several scales—from individual parcels with conservation
easements to the entire Hill Country region. While the Hill
Country Conservancy has not quantified the ecosystem services
provided by the land it protects, it certainly contributes to
enhancing conservation values that benefit the whole region.
These conservation values are the basis on which the Internal
Revenue Service may grant tax credits for easement donations.
Some benefits/services that have been documented include
scenic views, aquifer recharge, high-quality storm runoff, habitat,
and prime farmland. Beyond the explicitly documented benefits,
the land trust is preserving grasslands that have the potential to
sequester carbon and riparian areas that help prevent flooding
and erosion.
Sustaining Sites
The ecosystem
services concept
is also being
employed at the
site level. The
Sustainable Sites
Initiative, known
as SITES, is a
joint effort by the
American Society
of Landscape
Architects; Lady
Bird Johnson
Wildflower Center of The University of Texas at Austin; and the
US Botanic Garden (www.sustainablesites.org). A goal of SITES
is to produce the outdoor equivalent to the US Green Building
Council's successful Leadership in Energy and Environmental
Design (LEED) program. The SITES team has both learned from
LEED and relied on ecosystem services. The team identified
specific ecosystem services that designers can strive to protect or
regenerate at the site scale, which include
• Global climate regulation—Maintaining balance of
atmospheric gases at historic levels, creating breathable air,
and sequestering greenhouse gases

Essays on Geography and GIS, Vol. 4 May 2012 23Ecosystem Services—Learning to Leverage Natural Capital
• Local climate regulation—Regulating local temperature,
precipitation, and humidity through shading,
evapotranspiration, and windbreaks
• Air and water cleansing—Removing and reducing pollutants
in air and water
• Water supply and regulation—Storing and providing water
within watersheds and aquifers
• Erosion and sediment control—Retaining soil within an
ecosystem, preventing damage from erosion and siltation
• Hazard mitigation—Reducing vulnerability to damage from
flooding, storm surge, wildfire, and drought
• Pollination—Providing pollinator species for reproduction of
crops or other plants
• Habitat functions—Providing refuge and reproduction
habitat to plants and animals, thereby contributing to
conservation of biological and genetic diversity and
evolutionary processes
• Waste decomposition and treatment—Breaking down
waste and cycling nutrients
• Human health and well-being benefits—Enhancing physical,
mental, and social well-being as a result of interaction with
nature
• Food and renewable nonfood products—Producing food,
fuel, energy, medicine, or other products for human use
• Cultural benefits—Enhancing cultural, educational, aesthetic,
and spiritual experiences as a result of interaction with nature
Rating System
As a result of four years of research, the SITES team released
guidelines and performance benchmarks in 2009. This rating
system includes 15 prerequisites and 51 credits that cover all
stages of development—from site selection to landscape
maintenance. The rating system is currently being tested through
over 150 pilot projects representing a diverse cross section of
project types, sites, and geographic locations. The pilot projects
include a range of types and sizes. The project types include
parks and open spaces, educational and institutional, commercial,
residential, streetscapes and transportation, gardens and
arboretums, government complexes, mixed use, and industrial.
The project sizes range from less than 1 acre (.4 hectares) to over
500 acres (202.3 hectares). Existing land uses include grayfield,
greenfield, and brownfield sites.
Pilot Projects
Thirty-four states and the District of Columbia, Canada, Iceland,
and Spain are represented in the pilot projects. Two examples of
these pilot projects are Tempe Transportation Center in Arizona
Essays on Geography and GIS, Vol. 4 May 2012 24Ecosystem Services—Learning to Leverage Natural Capital
and Burnham Centennial-Midewin National Tallgrass Prairie in
Illinois. The Tempe Transportation Center project team includes
A Dye Design; City of Tempe; Michael Baker, Jr., Consulting
Engineers; and Otak+Architekton. This transit plaza replaces a
2.7-acre (1.1-hectare) parking lot, linking the new METRO light
rail to local/regional bus routes, bike facilities, and Arizona State
University. The mixed-use LEED building provides transit-oriented
retail/restaurant facilities at the plaza, where storm water and
gray water collection for irrigating native plants and vegetated
bus shelters sustainably integrate public spaces with pedestrian
circulation at a busy urban multimodal hub.
Burnham Centennial-Midewin National Tallgrass Prairie is located
in Wilmington, Illinois. Its design team includes the Conservation
Design Forum, dbHMS, and Wheeler Kearns Architects. Two
separate but integrated open-air visitor and education areas are
proposed for construction in this area, which was once part of the
Joliet Army Ammunition Plant. Design elements include outdoor
classrooms, picnic areas, overlook stations, trails, and interpretive
signage about the natural and cultural history of the site. All
aspects of the project are intended to demonstrate green design
principles, including capturing and cleaning runoff before release
into the restored prairie.
The pilot project stage will be completed in June 2012. Lessons
learned from the pilot projects will be incorporated into the
formal release of the SITES rating system to the marketplace in
2013.
From the pilot projects, it is already clear that GIS plays an
important role in designing sustainable landscapes, which could
be expanded through GeoDesign. In addition to the mapping
ability of GIS, it is also useful for calculations and data submittals.
For example, a site assessment is required as a prerequisite,
which can be submitted in GIS.
Advancing Ecosystem Services
National and local organizations and agencies increasingly use
ecosystem services to advance their missions. For instance, the
Trust for Public Land notes that the environmental and social
benefits of parks and open space (such as improved recreation
and health, as well as cleaner water and air) also engender
economic benefits (such as increased tax revenue and an
advantageous ability to attract businesses) (www.tpl.org).
The Trust for Public Land has pursued this mission through its
GIS-based Greenprinting tool. Greenprinting enables local
officials and conservationists to identify and rank environmentally
significant and fragile areas. Central Texas is one place where
Greenprinting has been employed. The Edwards Aquifer
and other environmental assets have been mapped with the
Greenprinting tool.
In Philadelphia, University of Pennsylvania's student-faculty
clinical design consulting practice, Penn Praxis, used economic
arguments as the basis for its 2010 plan to add 500 acres
(202.3 hectares) to the city's park system. In Green 2015: An

Essays on Geography and GIS, Vol. 4 May 2012 25Ecosystem Services—Learning to Leverage Natural Capital
Action Plan for the First 500 Acres, the Penn Praxis team notes
that converting vacant lots into community gardens can raise
local property taxes and reduce the need for police and fire
services. Furthermore, the team observes that replacing
impervious asphalt surfaces with rain-absorbing green areas has
already saved the city $35 million since 2006. In addition, the
Penn Praxis team reports that the city's existing open space has
generated over $400 million in health-related cost savings.
The Gund Institute for Ecological Economics at the University
of Vermont has joined others to create a web-based tool
for advancing ecosystem services globally called Artificial
Intelligence for Ecosystem Services, or ARIES (www.uvm.edu
/giee). ARIES researchers map benefits, beneficiaries, and service
flows to help users visualize, value, and manage ecosystems.
This technology assists users in making rapid ecosystem service
assessment and valuation. It is open-source software that is
free to all nonprofit users. ARIES integrates information from an
extensive database, from global- to local-scale GIS, combined
with ecosystem service models. ARIES is helping open new
possibilities for the use of ecosystem services in environmental
design and planning.
The ecosystem services concept can add value to large-
landscape planning endeavors, such as the Regional Plan
Association's Northeast Landscapes Initiative Atlas and the Hill
Country Conservancy's efforts to protect the Edwards Aquifer.
The concept has already proved to advance more sustainable
landscape design through SITES. Ecosystem services help us
protect the benefits nature provides for our health and well-
being, as well as our very existence.
About the Author
Frederick Steiner is the dean of the School of Architecture
and Henry M. Rockwell Chair in Architecture, The University
of Texas at Austin. Steiner is the current president of the Hill
Country Conservancy (a land trust) and past chair and current
secretary of Envision Central Texas (a nongovernmental regional
planning organization). As a Fulbright-Hays scholar in 1980, he
conducted research on ecological planning at the Wageningen
University, the Netherlands. In 1998, he was a Rome Prize Fellow
at the American Academy in Rome. He received his PhD and
MA degrees in city and regional planning from the University of
Pennsylvania. Steiner's books include Design for a Vulnerable
Planet (2011) and The Essential Ian McHarg: Writings on Design
and Nature (2006). His next book, Urban Ecological Design (with
Danilo Palazzo), will be available in January 2012.
For more information, contact Frederick Steiner, The University of
Texas at Austin (e-mail: [email protected]).
(This article originally appeared in the Fall 2011 issue of ArcNews.)

Essays on Geography and GIS, Vol. 4 May 2012 26Looking Forward: Five Thoughts on the Future of GIS
Any attempt to forecast the future is dangerous, and attempts
to prophesy about GIS are especially fraught, so what follows
should be taken with a large grain of salt. But it is good to think
about where we—the GIS community—might be headed, and
perhaps this short contribution will stimulate other members of
the community to ponder and discuss the possibilities.
The 13 Percent Technology
The GIS domain has always been the outdoors, where GPS signals
are strong and reliable, two spatial dimensions are generally
adequate, and spatial resolutions are rarely better than a meter.
Not surprisingly, the earliest applications of GIS were in forestry,
resource management, and land-use planning. But the average
American only spends 13 percent of the time outdoors. GIS-
based services help us find restaurants and hotels, but they offer
almost no support for navigating in the complex indoor spaces of
shopping centers, hospitals, mines, or airports.
Two major problems currently stand in the way of moving GIS
indoors. Several years ago, I was involved in a study sponsored
by Defense Advanced Research Projects Agency (DARPA) to
examine the potential of a fully three-dimensional GIS. There are
several billion buildings on the planet, and we estimated that a
database representing all of them, surface and interior (CityGML
Level of Detail 3 and above), would occupy 3 petabytes (3,000
terabytes or 3,000,000 gigabytes), a not-unmanageable volume
given today's technology. But the effort to assemble such a
Looking Forward: Five Thoughts on the Future of GISBy Michael F. Goodchild
A visualization of part of the University of California, Santa Barbara, campus shows 3D representations of buildings superimposed on a more traditional 2D GIS representation of the ground surface. (Image courtesy of Keith Clarke)

Essays on Geography and GIS, Vol. 4 May 2012 27Looking Forward: Five Thoughts on the Future of GIS
database using then-available technology would require an
expenditure equivalent to 10 percent of the U.S. gross domestic
product (GDP) for 10 years—in other words, it would need to
employ 10 percent of the U.S. workforce for that period. And
that figure would not include updates. We need techniques for
the rapid, cheap, and accurate capture of 3D geometries and
attributes.
Furthermore, we need effective methods for determining
indoor position. Several technologies are under development:
Wi-Fi, using known positions of transmitters; radio-frequency
identification (RFID), using networks of fixed detectors;
ultrasound or laser imaging matched to 3D geometry; and many
more. At this point, we don't know which of these—if any—will
eventually succeed. However, we do know that the market for
solutions to the problem of moving GIS indoors—and integrating
the indoors and outdoors—holds enormous potential.
Knowing Where Everything Is
I can now express the location of my house in half a dozen ways,
ranging from the National Grid reference 11SKU3614611561 to
"Mike Goodchild's House," and expect Web services to make
sense of all of them. Anything from the formal coordinates
of GIS to the informal, everyday language of humans (street
addresses, named points of interest, place-names) is now readily
understood. This level of interoperability between different ways
of specifying location is, in my view, one of the great geospatial
achievements of the past decade. With GPS, RFID, and up-to-
date databases, we can now imagine a time when it will be
possible to know where everything is at all times. This is already
true over surprisingly large domains: every vehicle in some major
fleets, every farm animal in some countries, every commercial
flight, every mobile phone, and every credit or debit card when it
is swiped.
While there are obvious benefits in each of these cases, the
possibility of knowing where every person is at all times is far
more problematic. While a mobile phone user only has to turn
the phone off, face-recognition software, coupled with the dense
networks of video cameras now installed in many major cities,
make it possible to track individuals without their knowledge and
offer no way to opt out that is not itself grounds for suspicion. Yet
consider the possibilities during emergencies: if every inhabitant
of the Wenchuan area of China had been tracked prior to the
May 2008 earthquake, it would have been much easier to search
for possible victims.
An Internet of Things
Knowing where everything is, and where it has been, creates a
host of interesting possibilities that is currently being explored
by the Tales of Things project in the United Kingdom. All that is
required is a Quick Response (QR) code (one of those random-
looking square patterns of black and white that now appears
on packages, airline boarding passes, and mail) attached to the

Essays on Geography and GIS, Vol. 4 May 2012 28Looking Forward: Five Thoughts on the Future of GIS
object. When
this pattern is
scanned by a
smartphone with
the appropriate
app, an online
database of the
object's history
is accessed, and
the object's
current location
is captured
along with any
other useful
information. The
result is a readily
accessible
geographic
history of the
object. Of
course, QR
technology is
already widely used, but the smartphone enables many new and
interesting applications. Imagine the possibilities of a QR tattoo.
Real-Time GIS
Maps take time to make, and to justify the cost of making
them, it is important that they be valid for as long as possible.
Traditionally, this has meant that maps are made up only of the
more permanent features of the earth's surface: roads, rivers,
mountains, and streets. Over the past two decades, however,
the widespread availability of GPS and mapping software has
changed the balance in this equation, making it possible to create
maps of virtually anything for almost nothing. Neogeography
is one result: the possibility of making personal maps, showing
personal views that may be of interest only to the maker and for
just a brief time. A GPS navigation system, fed by sensors, might
show the state of congestion of the road system in real time; an
air-traffic controller might see a real-time map of airplane traffic;
an emergency manager might view the real-time situation of
disaster response; and a public health researcher might monitor
the real-time state of a disease outbreak.
All these possibilities and more are shifting GIS from the relatively
leisurely process of analyzing static data to a far more dynamic
process of real-time monitoring and decision making. In the
future, GIS will involve much more real-time situation monitoring
and assessment and will need new kinds of tools that treat
information as continually changing. Decisions will have to be
made on the basis of information available at the time and deal
with uncertainties about the future in rational ways.
A QR code tattooed on a human back is readable by a smartphone app. (Image courtesy of Karen Doehner)

Essays on Geography and GIS, Vol. 4 May 2012 29Looking Forward: Five Thoughts on the Future of GIS
Multiple Views of the World
In the early 1990s, GIS came in for plenty of criticism from social
scientists for its implied assumption that all aspects of the
world could be measured and represented scientifically—that
geographic truth was absolute rather than personal and relative.
Too often GIS presented a single point of view, often that of
government, rather than the multiple points of view of individuals
and groups. Recently there have been several international
incidents involving Google's maps and its portrayal of disputed
boundaries and place-names, as reported in an article in
Maclean's, a Canadian weekly current-affairs magazine. In the
Himalayas, for example, the view presented by google.com is
now sharply different from those presented to Indian users via
google.in or to Chinese users via google.cn. In both countries,
the law requires that maps displayed by local servers reflect
official national policy. Thus, google.in shows Kashmir as part of
India, whereas google.com shows it as disputed between India
and Pakistan.
Maps reflect the agendas and beliefs of their makers, a point
that sits uncomfortably with the prevailing scientific approach of
GIS. In principle, the name given to a place is not absolute but
is an attribute of the individual or group giving the name. To the
English, the body of water separating England from France is
the English Channel, whereas to the French it is La Manche. Will
multiple views be manageable, or will GIS descend into a chaos
of conflicting perspectives?
Multiple Futures for GIS
I hope these brief comments have stimulated an interest in
discussing these five topics further. Are they equally important,
and are there other ways in which the GIS of the future will be
different from that of today? One fact is inescapable: the world of
GIS has always been full of surprises, and there is every reason to
believe the future will be just as exciting.
Michael F. Goodchild welcomes feedback on this topic. Contact
him at [email protected].
(This article originally appeared in the February 2011 issue of ArcWatch.)

Essays on Geography and GIS, Vol. 4 May 2012 30The Future Looks Bright for Spatial Thinkers
Many industries have suffered during the current economic
downturn. So why is it that during this same period, demand for
geospatial technology professionals has grown significantly?
I think that this trend is due to the growing understanding of
the value of spatial information and analysis. There are many
reasons to implement GIS, but the benefits that we see driving
organizations in lean times are cost savings resulting from greater
efficiency. And as we come out of this economic downturn, the
efficiencies realized from GIS will become a standard way of
doing business, so the need for geospatial professionals will
increase even more.
Government has long been at the forefront of this movement,
and there will be opportunities here for people with geospatial
knowledge, most notably in the area of homeland security and
in anything to do with increased transparency and accountability.
But we're now seeing a huge shift in momentum in the
commercial arena. Many of the future career opportunities
for geospatial professionals will be in the private sector, as
businesses increasingly realize the benefits that government has
understood for some time.
The current high unemployment rate is sending a lot of
experienced workers "back to school" to learn new skills more
relevant for the 21st-century workplace. This is one factor driving
the growth of focused geospatial programs at universities and
community colleges, both at the degree level and the certificate
level. These programs are doing a great service by training
The Future Looks Bright for Spatial ThinkersBy Jack Dangermond
As the reach of spatial information expands, new opportunities are created for spatial thinkers in many areas.

Essays on Geography and GIS, Vol. 4 May 2012 31The Future Looks Bright for Spatial Thinkers
the geospatial workforce of tomorrow. They are also providing
many opportunities for seasoned geospatial professionals to
take on new roles themselves—passing on their vast knowledge
by instructing and teaching the next generation of geospatial
professionals.
But the career opportunities here are not just for the people who
sit in front of keyboards and "do GIS." It's much bigger than that.
I think that the real growth opportunity is in the area of spatial
thinking. As people in all types of positions become more familiar
with the value of geography, they begin to ask more intelligent
questions about the world, and they begin to make more
informed decisions. The coming opportunities for spatial thinkers
will be even greater than those we are seeing for geospatial
technology professionals.
(This blog post originally appeared in Esri Insider on October 3, 2011.)

Essays on Geography and GIS, Vol. 4 May 2012 32Scaling Up Classroom Maps
Usually, when you talk about
the scale of a map, you're
talking about the ratio of
distances on the map to
distances in the real world.
These days, however, when
educators working with
National Geographic maps
talk about scale, they may
be talking about how big the
map is. For example, a teacher may have her students working
on a map at the "scale" of a tabletop, a large wall, or even a
basketball court.
So what's going on with all these big maps? Well, we've learned
that kids find large maps to be magnetic. And not just young kids.
Teens and adults find large maps irresistible as well.
Imagine walking into your school gym and finding half of the floor
covered in a glorious, full-color, National Geographic map of Asia.
If your school is one of those that has signed up for a visit from
one of National Geographic's Giant Traveling Maps, you could.
Most people find they can't just look at these maps. They must
walk on them. They count how many steps it takes to get from
Beijing to Moscow. They lie down to see if they can reach from
the southern tip of India to the northern tip. They find the maps
amusing, just like the oversized cereal boxes at Costco.
Scaling Up Classroom MapsA column by Daniel C. Edelson, Vice President for Education, National Geographic Society
Two Middlebury, Vermont, third graders explore the Atlantic coast of South America (photo: Dan Beaupré).
Essays on Geography and GIS, Vol. 4 May 2012 33Scaling Up Classroom Maps
Frankly, people find the scale of these maps fascinating. And
educational. Unlike regular-sized maps, you can see lots of detail
and a large portion of the earth's surface at the same time.
Similarly, you don't shift your eyes or turn the page if you want to
look at a different location. You move your whole body, like you
do in the real world. These maps allow people to interact with a
map kinesthetically, experiencing scale and direction as physical
sensation.
Now imagine taking 136 sheets of 8.5" x 11" paper and putting
them together to form a mosaic map of the world that is
17 sheets wide and 8 sheets tall. If you download one of the free
NatGeo MapMaker Kits, you could. These "megamaps" are only
10 feet wide and 7 feet tall, but they still take several strides to
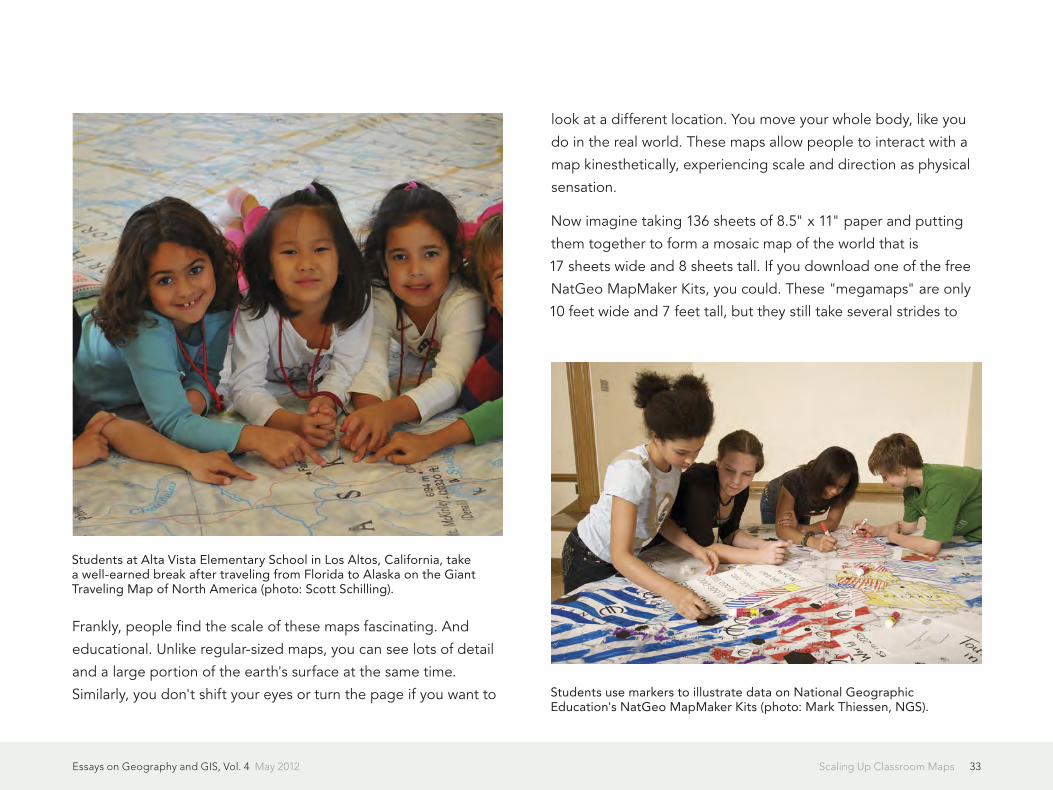
Students at Alta Vista Elementary School in Los Altos, California, take a well-earned break after traveling from Florida to Alaska on the Giant Traveling Map of North America (photo: Scott Schilling).
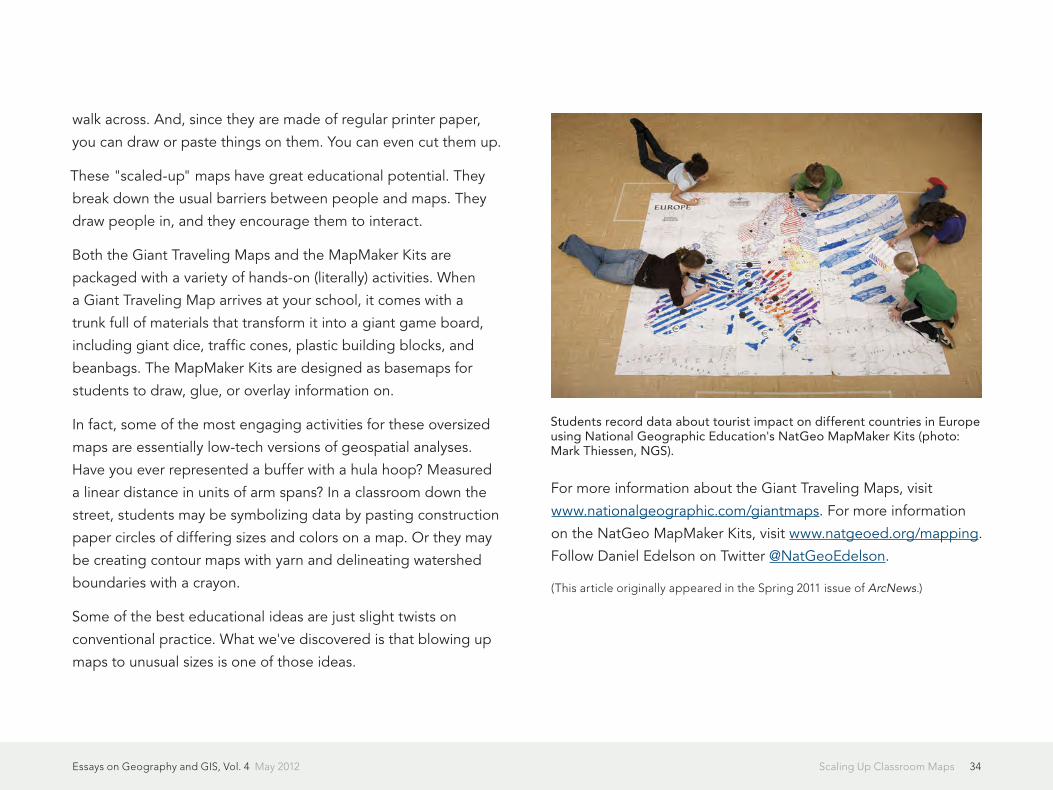
Students use markers to illustrate data on National Geographic Education's NatGeo MapMaker Kits (photo: Mark Thiessen, NGS).
Essays on Geography and GIS, Vol. 4 May 2012 34Scaling Up Classroom Maps
walk across. And, since they are made of regular printer paper,
you can draw or paste things on them. You can even cut them up.
These "scaled-up" maps have great educational potential. They
break down the usual barriers between people and maps. They
draw people in, and they encourage them to interact.
Both the Giant Traveling Maps and the MapMaker Kits are
packaged with a variety of hands-on (literally) activities. When
a Giant Traveling Map arrives at your school, it comes with a
trunk full of materials that transform it into a giant game board,
including giant dice, traffic cones, plastic building blocks, and
beanbags. The MapMaker Kits are designed as basemaps for
students to draw, glue, or overlay information on.
In fact, some of the most engaging activities for these oversized
maps are essentially low-tech versions of geospatial analyses.
Have you ever represented a buffer with a hula hoop? Measured
a linear distance in units of arm spans? In a classroom down the
street, students may be symbolizing data by pasting construction
paper circles of differing sizes and colors on a map. Or they may
be creating contour maps with yarn and delineating watershed
boundaries with a crayon.
Some of the best educational ideas are just slight twists on
conventional practice. What we've discovered is that blowing up
maps to unusual sizes is one of those ideas.
For more information about the Giant Traveling Maps, visit
www.nationalgeographic.com/giantmaps. For more information
on the NatGeo MapMaker Kits, visit www.natgeoed.org/mapping.
Follow Daniel Edelson on Twitter @NatGeoEdelson.
(This article originally appeared in the Spring 2011 issue of ArcNews.)
Students record data about tourist impact on different countries in Europe using National Geographic Education's NatGeo MapMaker Kits (photo: Mark Thiessen, NGS).

Essays on Geography and GIS, Vol. 4 May 2012 35Managing Our Man-Made Ecosystems
In modern society, buildings are where we spend the vast
majority of our waking and sleeping hours. Our facilities are man-
made ecosystems—vast assemblages of interdependent living
and non-living components. Facilities have become the primary
habitat for the human species.
As technology advances at a record pace, our man-made
ecosystems are becoming ever more complex and sophisticated.
These intricate collections of materials, infrastructure, machinery,
and people, with countless spatial and temporal relationships and
dependencies, require progressively more sophisticated tools to
help us design and manage them.
The recognition of facilities as habitat for modern man is leading
to a revolution in facilities management. GIS technology is
designed specifically for the management and analysis of
spatial relationships, and offers many benefits to the facilities
management community. It only seems logical to manage, model,
and design our new man-made ecosystem with the same tried
and true tools used to manage, model, and design traditional
ecosystems. And this is already happening.
GIS has long been used to help measure the impact of a facility
on a natural ecosystem, but today it is increasingly being used
to plan, manage, and operate the man-made ecosystem that is
the facility. Facilities managers are finding that these powerful
GIS tools, used successfully for many years in fields such as
environmental analysis and landscape planning, also support a
broad range of applications inside and outside of buildings and
Managing Our Man-Made EcosystemsBy Jack Dangermond
Staff at the City of Masdar use GIS to model building information throughout the life cycle of the project.

Essays on Geography and GIS, Vol. 4 May 2012 36Managing Our Man-Made Ecosystems
facilities—applications such as operations planning, emergency
management, ADA compliance, safety/security planning, space
utilization and optimization, and more. In fact, GIS can be used
throughout the life cycle of a facility—from siting, design, and
construction through ongoing use, maintenance, and adaptation,
and ultimately through closing, repurposing, and reclamation.
In the last several years there has been much interest in the
integration of building information models (BIM) with GIS. These
highly detailed 3D representations of buildings can be imported
into GIS, integrated with your existing GIS database, synthesized
with legacy 2D CAD data, and used for visualization and analysis
at the building or facility scale.
There is an emerging understanding that GIS can be extended
into the built environment of individual buildings and campuses.
Integrating BIM data into GIS data models provides the ability
to leverage this information using the tools and applications
of geoprocessing and visualization. In ArcGIS 10, we extended
the data model and 3D tools to accommodate BIMs and
other 3D building abstractions, and we have seen government
organizations such as the National Institutes of Health as well as a
number of universities and health care organizations integrating
their BIM and 3D building models with GIS to better analyze and
manage their facilities.
In Abu Dhabi, Masdar City uses a combination of BIM and GIS
to plan and design buildings and infrastructure. And at NASA
Langley Research Center's New Town project in Virginia, building
designers are working with GIS and facility managers to develop
BIM and GIS interoperability. Organizations with large and small
building portfolios, public or private, are capitalizing on this
ability with applications to support facility planning, operations
and maintenance, space utilization and move management,
emergency planning, energy and sustainability management, and
much more. Esri is actively evolving its platform for not only these
applications but also other 3D applications in the GeoDesign
space.
BIM and GIS integration is not just about the building or the
facility; it's about the relationship between natural and man-
made ecosystems. Our challenge is to design our man-made
ecosystems to achieve the maximum benefit to society while
minimizing short- and long-term impacts on the natural
environment. As an integrative platform for management and
analysis of all things spatial, I believe that GIS can meet this
challenge.
(This blog post originally appeared in Esri Insider on November 10, 2011.)

Essays on Geography and GIS, Vol. 4 May 2012 37GIS and Geography: Interactions with the Humanities
The AAG will be continuing a
decade-long arc of sustained
activity around the theme of
"Geography and the Humanities"
with a special set of sessions
on these interactions during its
upcoming Annual Meeting in
Seattle, Washington. We invite
all interested GIS specialists,
geographers, artists, writers, and
humanities scholars to attend and participate in these sessions, to
be held April 12–16, 2011.
As noted previously in this column ("Geography, GIS, and the
Humanities," ArcNews, Summer 2006, Vol. 28, No. 2, p. 39),
there has been a remarkable resurgence of intellectual interplay
between geography, GIS, and the humanities in both academic
and public circles. Metaphors and concepts of geography and
GIS now permeate literature, philosophy, the arts, and other
humanities. Terminology and concepts, such as space, place,
landscape, mapping, and geography, are increasingly pervasive
as conceptual frameworks and core metaphors in recent
publications in the humanities.
The diffusion of ideas between geography and the humanities
is significant for the insights and connections it has spawned.
Scholars and writers outside the field of geography have
developed new understandings from interrogating a sense of
place or by examining the changing landscapes of globalization
and complex new international realities in traditionally geographic
terms. The core traditions of geography, combined with recent
geographic technologies, such as GIS, have opened new lines
of intellectual inquiry in the humanities and changed research
methodologies in numerous fields. And, of course, the mutually
beneficial interactions between the discipline of geography and
such humanities fields as the philosophy of science, cultural and
ethnic studies, and various literatures in postmodernist thought
have also had far-reaching implications for GIScience and
geographic research and education.
For many years, the AAG has focused on developing ideas,
methods, and partnerships through which we might further
explore, showcase, and foster the emerging interactions between
geography, GIS, and the humanities. These efforts resulted
in a seminal Symposium on Geography and the Humanities,
sponsored jointly by the AAG, the American Council of Learned
Societies, and the University of Virginia, in 2007. This symposium
GIS and Geography: Interactions with the HumanitiesBy Doug Richardson, Executive Director, Association of American Geographers

Essays on Geography and GIS, Vol. 4 May 2012 38GIS and Geography: Interactions with the Humanities
explored how geography informs the humanities and vice
versa, took stock of the new and evolving connections between
geography and the humanities, and identified promising new
research paths along which such interaction can proliferate and
be strengthened in the future.
These geography and humanities interactions are now the subject
of two new books, emanating in part from the AAG Symposium
and supported by grants from the National Endowment for
the Humanities and the Virginia Foundation for the Humanities.
The first of these complementary explorations, Envisioning
Landscapes, Making Worlds: Geography and the Humanities,
focuses a lens on the deep traditions of the humanities within
the discipline of geography, with contributions from many of
the most prominent authors in the humanities traditions of
geography. The second book, Geohumanities: Art, History,
Text at the Edge of Place, reaches outward to explore the new,
rapidly evolving experimental and experiential engagements by
humanities disciplines themselves as they seek to understand
and incorporate geographic methods and concepts of space
and place into their own work, which encompasses the rapidly
expanding use of GIS throughout the humanities and the
burgeoning field of historical GIS. Both of these new books,
published by Routledge this spring, will be the subject of
featured discussions during the AAG Annual Meeting's special
Geography and the Humanities sessions in Seattle, together with
the books' editors and authors.
Another highlight of the Geography and the Humanities track
at the Seattle meeting for me will be a keynote presentation
by the exquisite writer and longtime friend of geography, Barry
Lopez, who won the National Book Award for his book Arctic
Dreams and recently authored Home Ground: Language for an
American Landscape. I am delighted to note as well that he has
been selected as the AAG's 2011 Honorary Geographer, a fitting
award in light of this year's special focus on geography and the
humanities. Lopez's keynote talk will be presented on Friday,
April 15, 2011.
The AAG welcomes and encourages broad participation by the
Esri GIS community in these Geography and the Humanities
sessions. An online program detailing these, as well as many
other sessions of interest to GIS users (including three full days of
special sessions on space-time integration in GIS and GIScience),
is available at www.aag.org/annualmeetings. I look forward to
seeing you in Seattle, a beautiful and most apt setting for these
sessions on geography and the humanities.
Doug Richardson
(This article originally appeared in the Spring 2011 issue of ArcNews.)

Essays on Geography and GIS, Vol. 4 May 2012 39The Challenge of Defining Geo-Literacy
For quite some time, I've been struggling
with the challenge of how to explain to
the general public what geo-literacy is
and why it is important. Over more than
a year, with a lot of help from others, I've
developed a definition that captures the
essence of geo-literacy and resonates
with both academic and applied geographers.
As I've written in this space before, geo-literacy is preparation
for making geographic and far-reaching decisions. Geographic
decisions are decisions about location or transportation; far-
reaching decisions are decisions that have remote consequences.
Geo-literacy requires three abilities:
• The ability to reason about human systems, environmental
systems, and human-environment interactions
• The ability to reason about geography
• The ability to reason through decisions systematically
If you are an ArcNews reader, then the odds are good that these
three bullets mean something pretty specific to you and that your
interpretation of these bullets is pretty close to mine.
My challenge is that these bullets do not mean much to most
Americans. Not only do most Americans lack these abilities, I
believe that most of them have never even heard anyone talk
about them. Phrases like reasoning about systems, geographic
reasoning, and systematic decision making do not convey much
meaning to people who have never been taught those skills.
Worse, they do not have the power of name recognition the way
algebra and calculus do.
The challenge here is how to convey a message about the
importance of knowing something to people who don't know
it themselves and to do it without (a) making them feel bad for
something that is not their fault or (b) putting them off with a
tone of superiority.
I am writing this column because I don't know how to solve this
challenge, and I am looking for help. I am pretty sure, however,
that the path to the solution lies through compelling examples.
I argue that the reason modern societies need to provide their
citizens with geo-education is the big cost that people pay
individually and collectively for geo-illiteracy. My hunch is that the
right examples of these costs will convince people.
The Challenge of Defining Geo-LiteracyA column by Daniel C. Edelson, Vice President for Education, National Geographic Society

Essays on Geography and GIS, Vol. 4 May 2012 40The Challenge of Defining Geo-Literacy
I have collected a few examples, but I am hoping that, through
the power of social networking, the readers of this column will
help me build a compelling library of examples. Please give me
feedback on my examples and share yours with me on Twitter
(@NatGeoEdelson) or Facebook (www.facebook.com/geoliteracy).
Here are a few examples drawn from modern American life, some
of them from my own experiences:
A geo-literate individual should be able to take constraints and
considerations into account to optimize choices about locations.
This is a case of geographic reasoning. For example, when
people are not able to identify and weigh their commuting
options successfully, they pay costs in the forms of wasted
money, lost time, and frustration that only grow over time. When
owners of small retail businesses or decision makers in large retail
businesses make poor decisions about location, they pay for their
failures in geographic reasoning in lost business, which translates
directly into lower revenues for the company and reduced
economic opportunity for the workforce.
The cost of a store or restaurant closing because of a poorly
chosen location goes far beyond the business owner. It is an
economic loss for the community. We currently consider the
frequent failure of retail establishments to just be a part of life.
However, a substantial percentage of these failures is a direct
result of poor geographic reasoning that could be prevented,
leading to substantial economic benefits.
Another important kind of geographic reasoning is not about
where to do something but about whether to do something in
a particular location. For example, in the last decade, citizens
of America and many other nations have faced decisions about
whether they should send troops to fight wars in foreign lands,
such as Iraq and Afghanistan. A geo-literate individual should
be able to analyze information about locations to form an
independent assessment of the appropriateness of a proposed
action in those locations.
I would have more confidence in the democratic decision-
making process about military deployments in America if more
Americans were able to interpret thematic maps showing
topography, ethnic and religious populations, and distribution of
natural resources. I believe there are many valid arguments on
both sides for whether the United States should have gone to war
in Iraq and Afghanistan, some of which may outweigh geographic
considerations. However, I worry about the role of the public in
making decisions like these in a society where many are not able
to reason systematically about geographic factors.
Even though there is no way to determine, even in retrospect,
whether we have made the right decision about military
deployments, we can still assess the costs associated with those
decisions. In the case of these large-scale military deployments,
the costs are measured in billions of dollars, thousands of lost
lives, and hundreds of thousands of lives permanently changed.

Essays on Geography and GIS, Vol. 4 May 2012 41The Challenge of Defining Geo-Literacy
A geo-literate individual should be able to anticipate remote
impacts of local decisions. This is a case of reasoning about
systems. For example, in the Chesapeake Bay watershed where
I live, state governments advise residents to only wash their cars
at car washes because the runoff affects water quality in the
bay. If most people who receive this advice do not understand
the impact of detergent and other runoff from roads on aquatic
ecosystems—which most don't—and do not understand where
the water that leaves the bottom of their driveway goes—which
most also don't—then the odds that they will follow that advice
are very low.
The same goes for farmers and fertilizer, though farmers in the
Chesapeake watershed are subject to laws restricting runoff,
not just advisories. If farmers do not understand the effects of
fertilizer runoff and they know that their state government cannot
afford to enforce runoff laws, they are unlikely to expend much
effort to obey them.
The result of uninformed decision making about runoff is an
enormous environmental and financial cost resulting from millions
of individual decisions with far-reaching consequences. The
fisheries in the Chesapeake Bay, the Gulf of Mexico, the San
Francisco Bay, Puget Sound, and many others, are all threatened
by runoff. The livelihoods of hundreds of thousands of individuals
who depend directly or indirectly on fishing in those locations are
threatened.
Those are three examples of how the widespread lack of geo-
literacy can add up to huge societal costs. What do you think?
Are these compelling? Do you have others you can share with
me? Let me know.
(This article originally appeared in the Summer 2011 issue of ArcNews.)

Essays on Geography and GIS, Vol. 4 May 2012 42Let's Exchange Competition for Cooperation
I would like to invite you on a trip back to our childhood. Let's
think of the time that we were around two or three years old.
Do you remember how the playground rules were back at that
time? Lots of children playing with lots of toys. It was so hard to
share our toys with somebody else. But then, all of a sudden, a
little kid would come from nowhere wanting to play with our toys
and keep offering his for us to play with until we finally decided
to give it a try. It was always a hard decision to make—sharing
our toys and playing with somebody else's—but it was always
enjoyable and rewarding doing so because then we had a friend
to play with, and things from that point on became way more fun
than when we played alone!
Fast-forwarding and getting back to our current time, when we
think of GIS collaboration, things are not much different from
the playground rules. We have our data, our applications, our
techniques, our models, our layers, and our services—our toys.
And it's so hard to share them with others for reasons that vary
on a case-by-case basis. Sometimes we have unique techniques
and we don't want to share that with the competition. Other
times, we just don't want to go through the entire documentation
process that can take time to be completed. Yet other times,
we just forget to scope time in our projects to share the final
product with the GIS community via the clearinghouses and
other resources, not to mention what it takes to collaborate in
terms of stretching our comfort zone, exposing our work to peer
evaluation, and many other reasons that we could write an entire
new article about. But then your coworker encourages you to
attend a local GIS user group meeting, and you listen to that
presentation that gives you hints about how to improve your own
Let's Exchange Competition for CooperationBy Claudia Paskauskas, GIS Manager, East Central Florida Regional Planning Council
Photo credit: Gina Marchica

Essays on Geography and GIS, Vol. 4 May 2012 43Let's Exchange Competition for Cooperation
project. Another situation could be how great it feels networking
with other GIS professionals during a conference or during a
GIS professional organization after-hours event just because
you could help someone else answer a question that had been
puzzling them. The point I am trying to make here is that it takes
a leadership attitude to enable and accomplish collaboration.
One of the most basic leadership principles emphasizes the
importance of individuals taking single steps to create big
impacts. A leader doesn't need to be someone that's in a
decision-making position or have formal authority. A leader
is someone who can socially influence others to accomplish
a common goal. Leaders come in various shapes and flavors.
Leaders are simply messengers of new ways of thinking or
transitioning processes or are simply supportive of new ideas
and concept development. Leaders often are mentors. Leaders
are passionate about what they do. Leaders engage. Leaders
share, guide, and facilitate accomplishments. Leaders always
strive and shine in what they do. Usually when you teach, you end
up learning and knowing way more than that audience you are
trying to educate. And that is just one of the beauties of having a
leadership attitude.
Some people freeze when the word leadership is said aloud.
Others think that being a leader is too much trouble, and they
are already busy enough at work to get one more thing added
to their plates. A common mind-set when the subject is leading
can be easily illustrated in the following question: Why would
my county, city, or even self want to collaborate and promote
common professional growth in local GIS user group meetings,
write articles, or mentor someone when I alone can deliver the
highest-quality GIS projects on a daily basis?
One might also wonder why a GIS professional would want
to do more than their own daily work. Why would a GIS
professional want to contribute time, knowledge, and expertise
to GIS professional organizations, local GIS groups, and data
clearinghouses, aiding other peers and/or organizations and
enabling them to grow stronger?
The problem embedded when someone thinks of these questions
is more fundamental than it seems. The reality is that some
professionals think they can survive forever by just flying solo.
That notion clouds their ability to see the benefits of working and
growing together.
By simply not being on the same page, this thinking may have
effectively caused several significant duplications of effort and
service. Loss of time. Loss of money. Loss of momentum to
grow strong together as a knowledgeable GIS community. Loss
of the opportunity to make a difference and be part of the
solution. That's what happens when we don't have the mind-set
of collaborating and sharing.
If all sides of our GIS community collectively discuss the common
wants, needs, standards, and guidelines, duplication of efforts
will not be an issue. Then, through collaboration, we can support

Essays on Geography and GIS, Vol. 4 May 2012 44Let's Exchange Competition for Cooperation
the GIS community during these difficult economic times
where budget constraints can unfortunately hinder success.
History shows why collaborating is better than competing.
When team players, being competitors or not, get together to
help communities recover from unforeseen events like natural
disasters, everybody wins. The community gets back to its
normal life faster, jobs are created, knowledge is shared, and
professionals get their skill sets sharpened. It's a win-win situation.
No competition. Just collaboration!
The overwhelming support and participation of many GIS
professionals, counties, cities, and organizations indicate that the
GIS community would like to continue to work together. Pulling
and tugging in different directions does not seem to make sense
when we have collaboratively achieved better results shortcutting
in project development by simply utilizing data that has been
shared. Other successful proof that working together as a solid
regional GIS community is worth it is reflected in the relationships
built during several GIS functions, such as user groups, GIS Day
celebrations, workshops, conferences, and specialized training.
For our GIS community to succeed, we must work together on
projects and educational opportunities that make sense. Let
us not be mistaken—competition is out there, and it is healthy.
However, our spirit of competition needs to be a productive one
that only makes us work harder and be that much stronger.
Working as a solid community means that everyone involved gets
a little dirty, because we'll have to work at it. It's going to be work,
but it's work worth doing. But the greater goal—not personal
gain—has to be at the heart of what's driving us.
Ultimately, building a strong regional GIS community isn't
something that can be accomplished by a handful of people. If
something is to get done, it will be by individuals that simply have
a passion for some segment of the work that's to be done.
Maybe that passion is in improving education and mentoring
someone, developing grassroots efforts by being a mentor in
local schools or maybe supporting the planning and execution
of user groups, regional events, and newsletter publications. It
could also be by volunteering with GIS professional organizations
or even simply sharing data or supporting the development of
new, needed data guidelines.
Regardless of the specific area of interest, the important factor is
to simply become involved and help be a solution to some of our
GIS community's issues and needs. One action at a time. Being a
leader or just following one. Sharing your toys.
The sooner we all realize that cities; counties; organizations;
companies; and, most importantly, professionals cannot
survive without each other's collaboration, participation, and
understanding, the better off we will all be.

Essays on Geography and GIS, Vol. 4 May 2012 45Let's Exchange Competition for Cooperation
I encourage you to share your toys. Going solo is good, but by
traveling the journey together, we can accomplish much more.
About the Author
Claudia Paskauskas, PMP, MCSD, GISP, is the GIS manager for
the East Central Florida Regional Planning Council (ECFRPC).
She brings more than 18 years of IT professional experience,
including GIS, working for private and government sectors. She is
the vice president of the Florida URISA Chapter (FLURISA), chair
of the URISA Leadership Academy, and the 2011 GIS-Pro URISA
conference program chair.
For more information, or if you are looking to get involved in the
GIS community or learn how to start your own collaborative GIS
program, contact me (e-mail: [email protected], tel.: 407-262-
7772). There are plenty of opportunities out there where you
could start making a difference.
Acknowledgments
Photo credit: Gina Marchica (e-mail: [email protected]).
Credits for the passion to carry on my mission of inspiring GIS
peers to give their best and make a difference: the ECFRPC GIS
team and CFGIS community, FLURISA, and URISA members.
(This article originally appeared in the Summer 2011 issue of ArcNews.)

Essays on Geography and GIS, Vol. 4 May 2012 46A National GIS Infrastructure for Health Research
The AAG has been working closely
with the US National Institutes of
Health (NIH) on the integration of
geography and GIS in medical and
health research for nearly a decade.
Two years ago, we began building
on the foundation of these research
collaborations and multiple NIH
relationships with a far-reaching
new initiative for GIScience, health,
and geography, called the AAG Initiative for an NIH-Wide GIS
Infrastructure. This ongoing initiative, including a recent AAG-NIH
joint workshop to explore and further develop such a complex
and large-scale undertaking, is described in more detail below.
The AAG Initiative
The rationale for this AAG initiative is the unmet need for spatial
and spatiotemporal data and analyses, as well as for geographic
context, across nearly all NIH's 30 individual institutes. This need
is pressing for research undertaken at NIH ranging from gene-
environment interaction in biomedical research to the tracking of
disease outbreaks and the assessment of health service delivery.
While some progress has been made in recent years in
developing geographic information systems, geocoding services,
mapping, and associated standards, problems nevertheless
abound in the lack of interoperability among proprietary systems,
longitudinal variation in data collection, difficulties of sharing
inadequately documented data, issues of confidentiality of
location-specific data, and lack of understanding of the basic
concepts of geographic/environmental context and of spatial
and spatiotemporal data and analysis. Although these problems
and their solutions vary somewhat by institute across NIH, they
also share a great deal in common, and therefore very substantial
scale economies can be achieved by addressing them collectively.
Some individual NIH institutes have made independent
and fragmented investments in spatial data and tools. The
inefficiencies of this approach suggest that a common GIS
infrastructure offers significant advantages. The AAG Initiative
for an NIH-Wide GIS Infrastructure has been exploring the
potential for such a collective solution, in consultation with many
individual institutes and the NIH leadership. We are addressing
opportunities and obstacles to establishing such an ambitious
infrastructure, strategies for optimizing the long-term research
value of an NIH-wide GIS infrastructure, common standards
A National GIS Infrastructure for Health ResearchBy Doug Richardson, Executive Director, Association of American Geographers
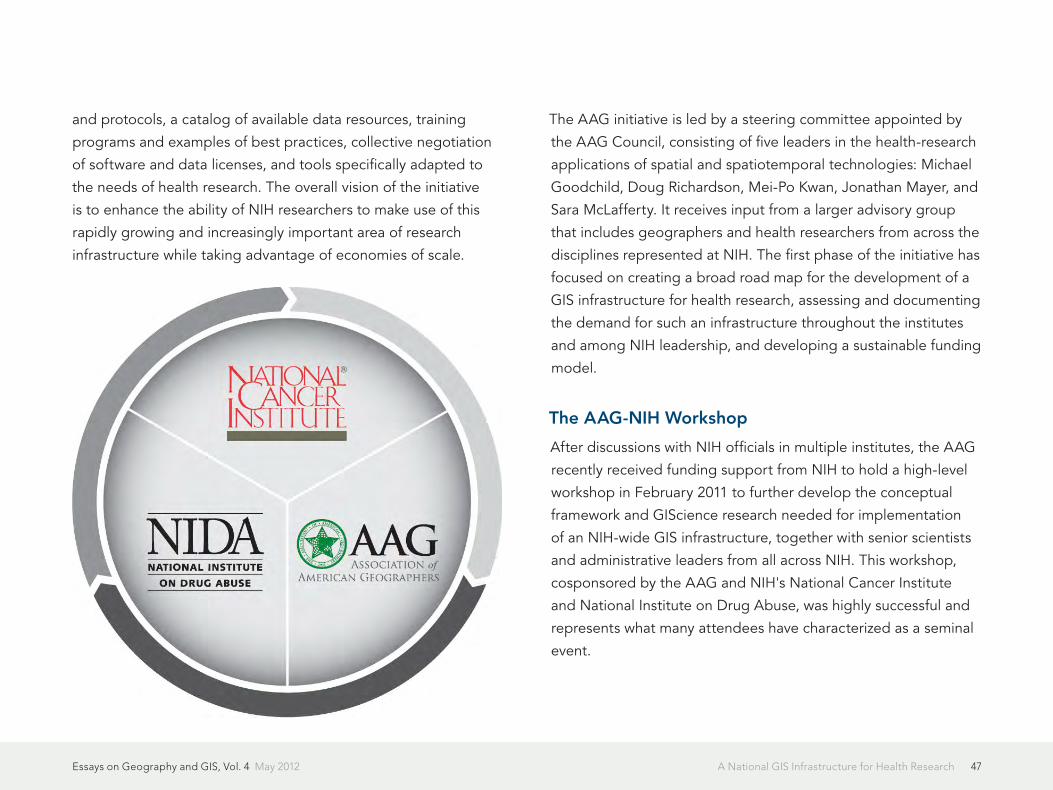
Essays on Geography and GIS, Vol. 4 May 2012 47A National GIS Infrastructure for Health Research
and protocols, a catalog of available data resources, training
programs and examples of best practices, collective negotiation
of software and data licenses, and tools specifically adapted to
the needs of health research. The overall vision of the initiative
is to enhance the ability of NIH researchers to make use of this
rapidly growing and increasingly important area of research
infrastructure while taking advantage of economies of scale.
The AAG initiative is led by a steering committee appointed by
the AAG Council, consisting of five leaders in the health-research
applications of spatial and spatiotemporal technologies: Michael
Goodchild, Doug Richardson, Mei-Po Kwan, Jonathan Mayer, and
Sara McLafferty. It receives input from a larger advisory group
that includes geographers and health researchers from across the
disciplines represented at NIH. The first phase of the initiative has
focused on creating a broad road map for the development of a
GIS infrastructure for health research, assessing and documenting
the demand for such an infrastructure throughout the institutes
and among NIH leadership, and developing a sustainable funding
model.
The AAG-NIH Workshop
After discussions with NIH officials in multiple institutes, the AAG
recently received funding support from NIH to hold a high-level
workshop in February 2011 to further develop the conceptual
framework and GIScience research needed for implementation
of an NIH-wide GIS infrastructure, together with senior scientists
and administrative leaders from all across NIH. This workshop,
cosponsored by the AAG and NIH's National Cancer Institute
and National Institute on Drug Abuse, was highly successful and
represents what many attendees have characterized as a seminal
event.

Essays on Geography and GIS, Vol. 4 May 2012 48A National GIS Infrastructure for Health Research
Presentations included an overview of current GIS activities
at NIH institutes, perspectives from the GIScience research
community, extramural researchers' views on GIS needs at NIH,
and discussions of system architecture options for an NIH-wide
geospatial infrastructure. Bill Davenhall of Esri also participated
in the workshop and provided excellent background on a number
of health-related GIS activities. Breakout groups in the workshop
focused on identifying common needs, key challenges, and
implementation alternatives. Recommendations, priorities, and
next steps in this process were discussed and are the subject of
a recent report prepared by the AAG and NIH (www.aag.org/
health_geographies).
There was consensus among the participants in the workshop that
developing a broader and deeper GIS infrastructure throughout
NIH for medical research is needed. The discussion highlighted
numerous benefits of geography and GIScience to NIH's
health research programs. Examples of the benefits of a large-
scale GIS infrastructure to health and biomedical researchers
include generation of research hypotheses through discovering
geographic patterns and by analyzing data in ways that would
not otherwise be possible, increased ability to understand gene-
environment interactions and their role in disease occurrence,
ability to advance mobile health systems by incorporating real-
time GPS/GIS technologies, and the potential to integrate and
link other major health databases with such an infrastructure.
Workshop participants also discussed the substantial challenges
to the implementation of such an ambitious project. These
challenges include dealing with locational privacy and
confidentiality issues; developing and disseminating GIS
and analytic modeling tools specific to the needs of health
and biomedical researchers; and incorporating training and
education in GIS, geospatial tools, and spatial thinking for health
and biomedical researchers. Participants also recognized the
importance of having a forward-looking strategy in developing an
NIH-wide GIS infrastructure, being mindful of new and emerging
technologies, including, for example, the geospatial web, social
media, new information from electronic medical records, real-
time health monitoring, and developments in sensor and
location-aware technologies.
The next steps for pursuing the concept of a large-scale, NIH-
wide geospatial infrastructure to support health research will
include wide dissemination of the AAG-NIH Workshop Report
to both the geography and health and biomedical research
communities, preparing a more detailed inventory of the portfolio
of intramural and extramural GIS projects supported by NIH, and
developing NIH requests for proposals and focused workshop
proposals that address specific research needs related to such
a complex infrastructure. Potential research would need, for
example, to address spatiotemporal analysis in health research,
where issues of scale, privacy, large datasets, and computational
capacity are just some of the areas that need to be investigated;

Essays on Geography and GIS, Vol. 4 May 2012 49A National GIS Infrastructure for Health Research
defining a distributed computing architecture (including
cloud computing) for an NIH-wide GIS; developing a common
language, or ontology, shared by biomedical researchers and
geographers to foster collaboration; and addressing other needs
and challenges described above. The workshop concluded with
an executive briefing for senior leadership from many institutes in
the NIH.
If successful, I believe this AAG initiative will open new doors for
geographic research and discovery at NIH in collaboration with
biomedical scientists at most institutes within NIH and in related
public health fields, as well. For geographers, GIScientists, and
medical researchers alike, it also holds real promise for making
a meaningful difference in the health and lives of people around
the world.
Doug Richardson, [email protected]
(This article originally appeared in the Summer 2011 issue of ArcNews.)

Essays on Geography and GIS, Vol. 4 May 2012 50The Intersection of GIS and Gaming
Video games have moved beyond the stereotype of simple
entertainment and are now a serious technological and cultural
force to be reckoned with. Millions of people spend many hours
each week immersed in the rich virtual environments of today's
sophisticated games. And the multibillion dollar market for
games has moved beyond teen males, with adults and women
now more engaged than ever.
Most games today have a spatial component, and these virtual
worlds are becoming more complex and sophisticated. There is
no doubt that video games have a high potential for effective
education, with individuals often learning valuable skills and
gaining experience from within a simulated environment. But
beyond education, where else do GIS and gaming intersect?
As the virtual worlds in video games become increasingly difficult
to design and manage, it's easy to see the benefits of using
proven geospatial tools to manage, model, and design this
virtual geography. And making virtual worlds more realistic is key
to leveraging them for geospatial research and analysis. In fact,
some game designers and even players are already exporting
rich spatial datasets from GIS to create new realistic levels or
worlds within video games. But can we do more? How can the
geospatial community leverage the talent and infrastructure
of the gaming community? Can we use these virtual worlds as
testing or prototype environments to help improve conditions in
the real world?
Online, cooperative citizen science platforms such as
PlanetHunters.org and eBird are becoming increasingly popular
and successful. The next logical step would be to leverage
existing online environments—specifically, online gaming
environments—as platforms for research, analysis, and design.
By testing alternative designs in the virtual world of a video
game, people simply "playing games" could actually be playing
a valuable role in designing future buildings, roads, cities,
and parks. If this was done to be both representative of the
real world and entertaining at the level expected in a video
game, participants could make potentially important societal
contributions while still having fun playing their games.
Leveraging online gaming environments as a resource could add
a whole new dimension to geospatial research and analysis. But
merging elements of "work" and "play" is a delicate balance and
needs to be done without disrupting the gaming experience.
The Intersection of GIS and GamingBy Matt Artz

Essays on Geography and GIS, Vol. 4 May 2012 51The Intersection of GIS and Gaming
Because once you remove the entertainment from a game, it's
just work.
(This blog post originally appeared in Esri Insider on October 7, 2011.)
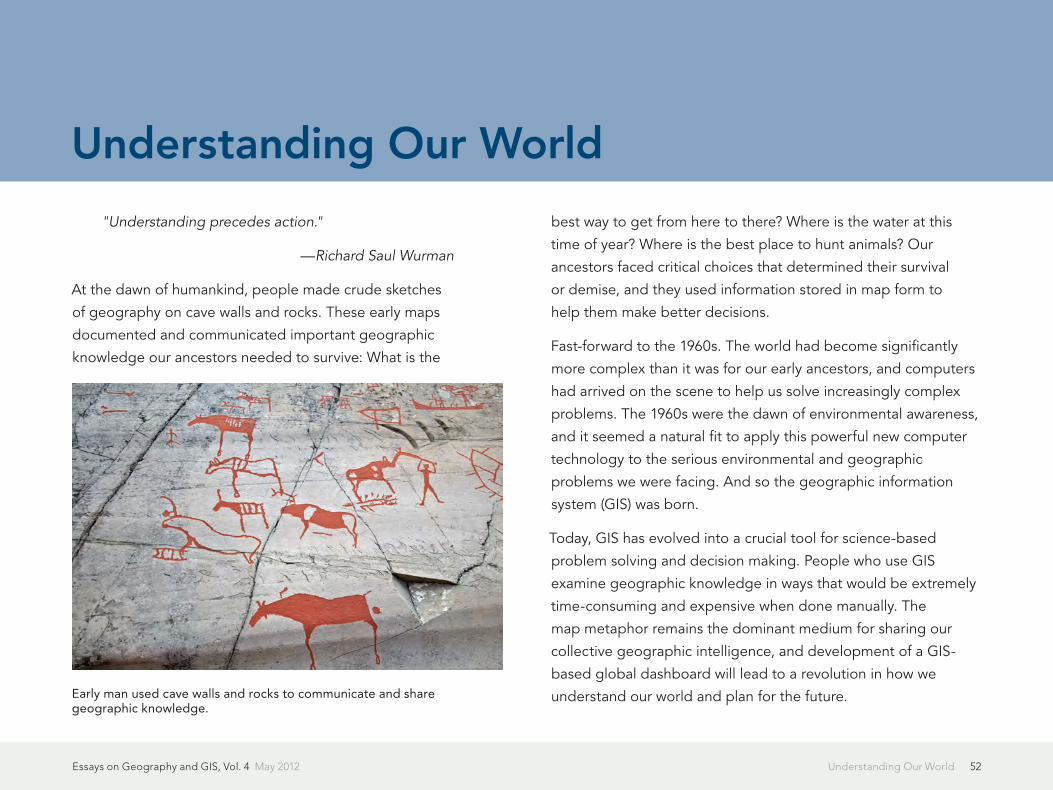
Essays on Geography and GIS, Vol. 4 May 2012 52Understanding Our World
"Understanding precedes action."
—Richard Saul Wurman
At the dawn of humankind, people made crude sketches
of geography on cave walls and rocks. These early maps
documented and communicated important geographic
knowledge our ancestors needed to survive: What is the
best way to get from here to there? Where is the water at this
time of year? Where is the best place to hunt animals? Our
ancestors faced critical choices that determined their survival
or demise, and they used information stored in map form to
help them make better decisions.
Fast-forward to the 1960s. The world had become significantly
more complex than it was for our early ancestors, and computers
had arrived on the scene to help us solve increasingly complex
problems. The 1960s were the dawn of environmental awareness,
and it seemed a natural fit to apply this powerful new computer
technology to the serious environmental and geographic
problems we were facing. And so the geographic information
system (GIS) was born.
Today, GIS has evolved into a crucial tool for science-based
problem solving and decision making. People who use GIS
examine geographic knowledge in ways that would be extremely
time-consuming and expensive when done manually. The
map metaphor remains the dominant medium for sharing our
collective geographic intelligence, and development of a GIS-
based global dashboard will lead to a revolution in how we
understand our world and plan for the future.
Understanding Our World
Early man used cave walls and rocks to communicate and share geographic knowledge.
Essays on Geography and GIS, Vol. 4 May 2012 53Understanding Our World
Geographic Knowledge Leads to Geographic Intelligence
Geographic knowledge is information describing the natural and
human environment on earth. For our ancestors, geographic
knowledge was crucial for survival. For our own survival,
geographic knowledge plays an equally fundamental role. The
biggest differences between then and now are that our problems
are much more complex, and the sheer volume of data—of
geographic knowledge—at our disposal is daunting. And
whereas passing down geographic knowledge in the past was
limited to a few cave paintings or rock drawings, GIS technology
now enables a collective geographic intelligence that knows no
spatial or temporal bounds.
Today we have more geographic data available than ever before.
Satellite imagery is commonplace. Scientists are producing
mountains of modeled data. And an ever-increasing stream of
data from social media, crowdsourcing, and the sensor web are
threatening to overwhelm us. Gathering all this information—this
geographic knowledge—and synthesizing it into something
actionable is the domain of GIS. More data does not necessarily
equate with more understanding, but GIS is already helping
us make sense of it, turning this avalanche of raw data into
actionable information.
Human-Made Ecosystems
Our traditional understanding of ecosystems as natural
landscapes is changing. Anthropogenic factors are now the
dominant contributor to changing ecosystems. Human beings
have not only reshaped the physical aspects of the planet by
literally moving mountains but also profoundly reshaped its
ecology.
And it's not just landscape-scale geographies that can be
considered human-made ecosystems. In modern society,
buildings are where we spend the vast majority of our waking
and sleeping hours. Our facilities are themselves man-made
ecosystems—vast assemblages of interdependent living and
nonliving components. Facilities have become the primary
habitat for the human species, and this is changing the way we
think about collecting, storing, and using information describing
our environment.
A key aspect of our social evolution is to recognize the effects we
have already had on ecosystems, as well as to predict what future
impacts will result from our actions. Once we achieve this level of
understanding, we can direct our actions in a more responsible
manner. This type of long-term thinking and planning is one of
the things that make humans human.
Recognition of the overwhelming dominance of man-made
ecosystems also makes us cognizant of the tremendous
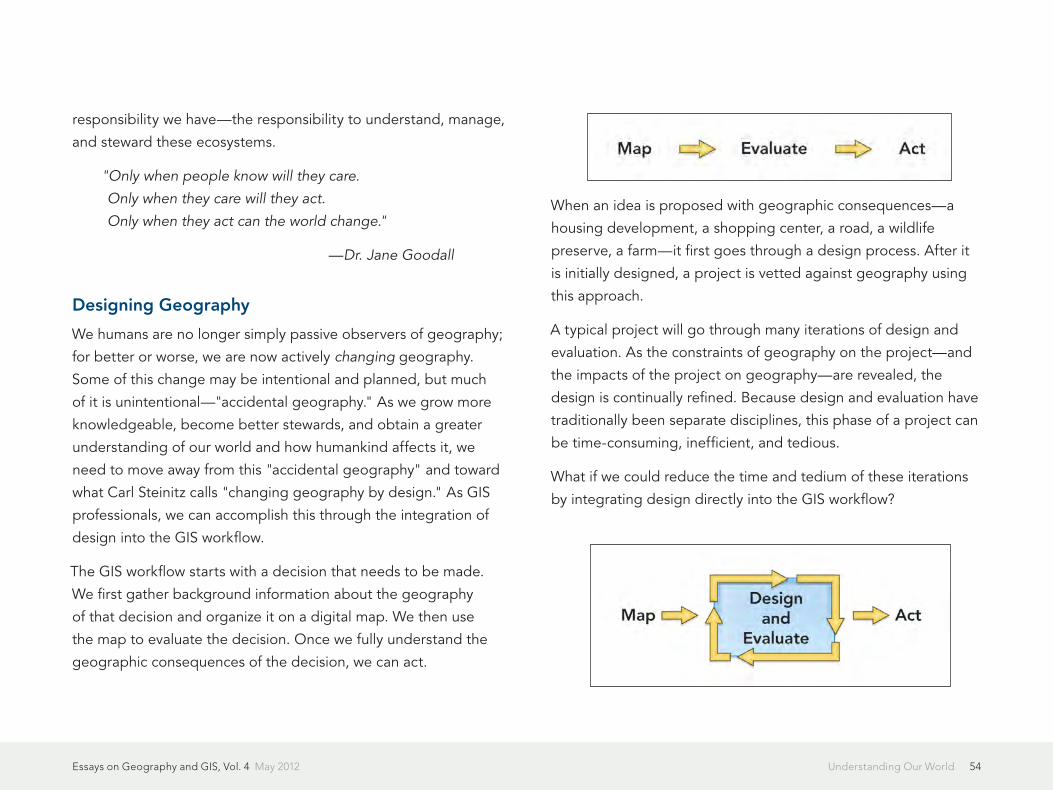
Essays on Geography and GIS, Vol. 4 May 2012 54Understanding Our World
responsibility we have—the responsibility to understand, manage,
and steward these ecosystems.
"Only when people know will they care.
Only when they care will they act.
Only when they act can the world change."
—Dr. Jane Goodall
Designing Geography
We humans are no longer simply passive observers of geography;
for better or worse, we are now actively changing geography.
Some of this change may be intentional and planned, but much
of it is unintentional—"accidental geography." As we grow more
knowledgeable, become better stewards, and obtain a greater
understanding of our world and how humankind affects it, we
need to move away from this "accidental geography" and toward
what Carl Steinitz calls "changing geography by design." As GIS
professionals, we can accomplish this through the integration of
design into the GIS workflow.
The GIS workflow starts with a decision that needs to be made.
We first gather background information about the geography
of that decision and organize it on a digital map. We then use
the map to evaluate the decision. Once we fully understand the
geographic consequences of the decision, we can act.
When an idea is proposed with geographic consequences—a
housing development, a shopping center, a road, a wildlife
preserve, a farm—it first goes through a design process. After it
is initially designed, a project is vetted against geography using
this approach.
A typical project will go through many iterations of design and
evaluation. As the constraints of geography on the project—and
the impacts of the project on geography—are revealed, the
design is continually refined. Because design and evaluation have
traditionally been separate disciplines, this phase of a project can
be time-consuming, inefficient, and tedious.
What if we could reduce the time and tedium of these iterations
by integrating design directly into the GIS workflow?
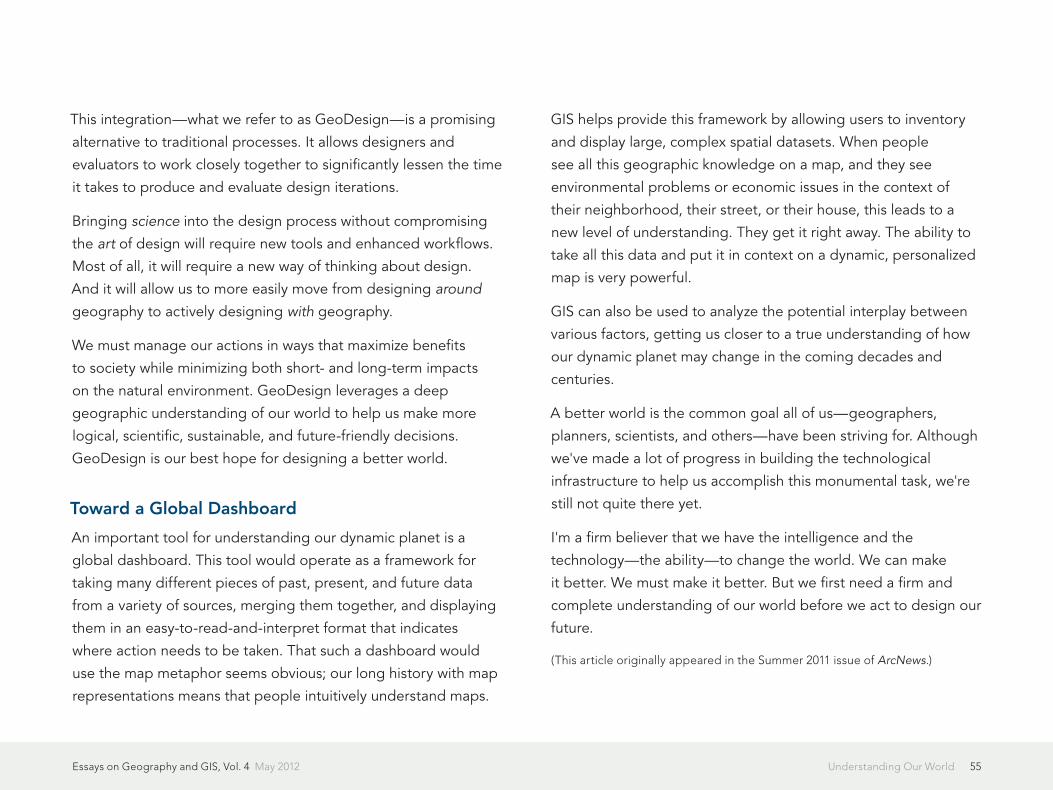
Essays on Geography and GIS, Vol. 4 May 2012 55Understanding Our World
This integration—what we refer to as GeoDesign—is a promising
alternative to traditional processes. It allows designers and
evaluators to work closely together to significantly lessen the time
it takes to produce and evaluate design iterations.
Bringing science into the design process without compromising
the art of design will require new tools and enhanced workflows.
Most of all, it will require a new way of thinking about design.
And it will allow us to more easily move from designing around
geography to actively designing with geography.
We must manage our actions in ways that maximize benefits
to society while minimizing both short- and long-term impacts
on the natural environment. GeoDesign leverages a deep
geographic understanding of our world to help us make more
logical, scientific, sustainable, and future-friendly decisions.
GeoDesign is our best hope for designing a better world.
Toward a Global Dashboard
An important tool for understanding our dynamic planet is a
global dashboard. This tool would operate as a framework for
taking many different pieces of past, present, and future data
from a variety of sources, merging them together, and displaying
them in an easy-to-read-and-interpret format that indicates
where action needs to be taken. That such a dashboard would
use the map metaphor seems obvious; our long history with map
representations means that people intuitively understand maps.
GIS helps provide this framework by allowing users to inventory
and display large, complex spatial datasets. When people
see all this geographic knowledge on a map, and they see
environmental problems or economic issues in the context of
their neighborhood, their street, or their house, this leads to a
new level of understanding. They get it right away. The ability to
take all this data and put it in context on a dynamic, personalized
map is very powerful.
GIS can also be used to analyze the potential interplay between
various factors, getting us closer to a true understanding of how
our dynamic planet may change in the coming decades and
centuries.
A better world is the common goal all of us—geographers,
planners, scientists, and others—have been striving for. Although
we've made a lot of progress in building the technological
infrastructure to help us accomplish this monumental task, we're
still not quite there yet.
I'm a firm believer that we have the intelligence and the
technology—the ability—to change the world. We can make
it better. We must make it better. But we first need a firm and
complete understanding of our world before we act to design our
future.
(This article originally appeared in the Summer 2011 issue of ArcNews.)

Essays on Geography and GIS, Vol. 4 May 2012 56From Maps to GeoDesign
The Jane Goodall Institute (JGI) has been very interested in the
evolution of the new field of GeoDesign, which offers the vision
and the infrastructure to bring people, disciplines, data, and
technology together to not only better describe landscapes but
also develop more successful conservation strategies and actions.
One practical application of GeoDesign has been the successful
use of geospatial and conservation sciences to inform decisions
in the Greater Gombe Ecosystem in Tanzania. JGI greatly
improved village land use in this very sociopolitically difficult
and historic setting. We were successful not only because of
the technology we employed but also because the JGI staff
understood human values and decision-making processes that
influence landscape change in that particular region. We learned
that helping develop the region (e.g., through working together
to provide clean water sources, among many projects) opened
the door to communities and motivated them to "buy in" to our
efforts, creating a window of opportunity to apply conservation
science to threatened ecological systems. Some of these
programs are discussed in detail below.
At the core of JGI's applied conservation science program
is using geography as a common framework to support our
projects in Africa by connecting people, their values and
activities, and conservation data and developing a shared
understanding and vision of landscapes and how they should
be changed. This in turn enables us to implement, monitor, and
measure the success of those changes for both human and
chimpanzee livelihoods.
From Maps to GeoDesignConserving Great Ape Landscapes in Africa
By Lilian Pintea, Africa Programs, The Jane Goodall Institute
Jane Goodall with Freud (courtesy The Jane Goodall Institute).

Essays on Geography and GIS, Vol. 4 May 2012 57From Maps to GeoDesign
We Need to Make More Enlightened Decisions
Time is running out for many endangered species, including our
closest living relatives, chimpanzees. Chimpanzee and human
populations are part of the same life support system, embedded
in ecological systems that are intimately linked and dependent
upon ecosystem services to survive. Unsustainable uses of natural
resources by humans result in loss of those ecosystem services,
with negative consequences for both chimpanzee and human
livelihoods. The fundamental problem is that, despite advances
in science and technology, we have not yet developed the
methodologies to apply these to conservation and make more
enlightened decisions about how to achieve a better balance
between environmental and economic results.
Fifty years ago, on July 14, 1960, Jane Goodall stepped for the
first time onto the shores of Lake Tanganyika and, through her
groundbreaking discoveries about chimpanzees in what is now
Gombe National Park in Tanzania, opened a new window to the
natural world and to ourselves. This unique long-term research
continues today with daily chimpanzee data collected by the
JGI Gombe Stream Research Center and digitized, stored, and
analyzed at the Jane Goodall Center at Duke University.
GIS and Imagery for Clearer Understanding
GIS has been used to georeference and digitize hundreds of
thousands of chimpanzee behavior locations and analyze ranging
and feeding patterns and relations with habitat characteristics
as detected by remote-sensing and field surveys. The use of
geospatial data for chimpanzee research was straightforward.
Spatial tools and variables derived from GIS and remote sensing
were directly used as part of research collaborations to test
hypotheses. For example, a vegetation map derived from
4-meter IKONOS imagery helped demonstrate that chimpanzee
hunts on colobus monkeys are more likely to occur and succeed
in woodland and semideciduous forest than in evergreen forest,
emphasizing the importance of visibility and prey mobility. JGI
also worked with the Tanzania National Parks to improve the
management of the park by using geospatial technology to
visualize habitat change, map the park boundary, and support the
development of the Gombe National Park Management Plan.
In addition to continuing Jane Goodall's pioneering research,
JGI has been accumulating decades of experience and practical
knowledge outside protected areas on how to successfully
engage local communities and decision makers in the sustainable
use of their natural resources. While the technology to map
land cover inside and outside Gombe National Park was mostly
the same, the way geospatial information was used to inform
decisions was very different.

Essays on Geography and GIS, Vol. 4 May 2012 58From Maps to GeoDesign
The use of geospatial information to inform decisions outside the
park has been more complex. Gombe National Park was created
in 1968. The park inherited a history of conflict with the local
communities that started in 1943 when the colonial government
established for the first time Gombe Stream Game Reserve. In
1994, JGI began working with the local communities outside
Gombe through the Lake Tanganyika Catchment Reforestation
and Education (TACARE, pronounced "take care") project to
seek ways of arresting the rapid degradation of natural resources.
TACARE project staff quickly learned that community buy-in
was essential for success. Therefore, the TACARE project added
agriculture, health, social infrastructure, community development,
and clean water components to the range of interventions it
employed. These interventions initially focused mostly on areas
close to village centers.
However, forest change detection using Landsat imagery from
1972 and 1999 showed that most chimpanzee habitats outside
the park had been in areas away from the village centers and
almost 80 percent of it converted to farmland and oil palm
plantations. Remote-sensing and GIS analysis led to a landscape
approach by focusing conservation efforts geographically
on areas away from village centers and on forest patches
with the most benefits to chimpanzees. In 2005, adopting
the recommendations obtained through analysis of satellite
imagery and with funds from the US Agency for International
Development (USAID) and other donors, JGI and its partners
embarked on a five-year Greater Gombe Ecosystem (GGE)
project.
A Conservation Action Plan approach was developed to identify
and prioritize conservation strategies. Village land-use planning
was identified as one of the top strategies. GIS was used to
overlay deforestation layers, historic distribution of chimpanzees
and habitats, slope, footpaths, roads, streams, watersheds,
density of human structures, and 60-centimeter QuickBird
imagery to prioritize a conservation area that, if protected, would
substantially increase the viability of chimpanzees inside and
outside the park and stabilize the watersheds to support human
livelihoods.
Participatory village land-use plans were prepared by the
communities according to Tanzanian laws and with full
involvement of government and community stakeholders. JGI
facilitated the process and provided technical support, including
maps and geospatial tools to record and manage spatial data.
The planning process followed seven steps and required villagers
to settle any existing land disagreements and agree on village
boundaries and how land resources located within the villages
should be used to meet specific human livelihood needs and
environmental objectives.
At the end of the project in 2009, 13 villages within GGE
completed their participatory village land-use plans, which
became ratified by the Tanzanian government. Local communities
Essays on Geography and GIS, Vol. 4 May 2012 59From Maps to GeoDesign
voluntarily assigned 9,690 hectares, or 26 percent, of their
village lands as Village Forest Reserves. These reserves
are interconnected across village boundaries to minimize
fragmentation and cover 68 percent of the priority conservation
area identified by the GGE Conservation Action Plan.
With renewed financial support from USAID, JGI and
partners are now engaged in facilitating community-based
organizations, developing bylaws and building local capacity
to implement these village land-use plans and restore and
manage newly established Village Forest Reserves. The plan is
to use DigitalGlobe imagery continuously to provide detailed
information on village land-cover change, such as increases in
forest cover in Kigalye Village Forest Reserve, and monitor both
new threats and conservation successes.
About the Author
Dr. Lilian Pintea brings more than 15 years of experience in
applying remote sensing and GIS to the job of protecting
chimpanzees and their vanishing habitats in Africa. As vice
president of conservation science at JGI, Pintea directs the
scientific department at the institute and conducts applied
conservation research in Tanzania, Uganda, the Democratic
Republic of the Congo, and the Republic of the Congo.
For more information, contact Lilian Pintea (e-mail: lpintea
@janegoodall.org).
(This article originally appeared in the Summer 2011 issue of ArcNews.)
Participatory village land-use plans were prepared by the communities according to Tanzanian laws (courtesy The Jane Goodall Institute).

Essays on Geography and GIS, Vol. 4 May 2012 60Making Sense of Our Sensored Planet
Geography—the scientific foundation of GIS—has for many
years been concerned with exploring and describing our world.
Historically, explorers led grand expeditions to the farthest
reaches of the globe. This golden age of exploration contributed
greatly to our understanding of how our world works.
This was followed by the space age—an era where we left the
planet and turned our cameras and sensors to look back on
our home, giving us an entirely new perspective. Bound to the
surface of earth for millennia, humankind was getting its first
opportunity to look at our planetary system as a whole—from a
few hundred miles up in space.
Exploration 2.0
While data remotely sensed from satellites continues to play
an important role in monitoring and understanding our planet,
"earth observation" has more recently taken on a whole new
dimension thanks to deployment of an increasingly complex and
pervasive network of earthbound sensors. These sensors are
practically everywhere you look—and in places you could never
imagine. From stream gauges to seismographs, from weather
stations to air quality monitors, from ocean buoys to even our
cell phones, countless sensors are measuring and collecting
important data about our planet at a rate that seemed impossible
just a short time ago.
We're collecting more information about the geography of planet
Earth today than ever before. New data sources, along with
the sheer volume of data being collected, are spawning a new
Making Sense of Our Sensored PlanetBy Matt Artz
Live Stream Data Displayed via USGS Real-Time KML File.

Essays on Geography and GIS, Vol. 4 May 2012 61Making Sense of Our Sensored Planet
age of exploration. But the new explorers are navigating a vast,
uncharted sea of data. What do we do with all of this sensed
data? How can we make sense of the sensor web?
A Global Dashboard
Modern science and advanced technology have resulted in
unprecedented access to global environmental information
through the placement of countless sensors across the planet—
and the linking together of this information through the Internet.
The sensor web has inundated us with data that needs to be
stored, managed, analyzed, and used to inform better decisions
about our many social and environmental challenges. Integrating
and synthesizing all of this disparate sensor data into a single,
comprehensive view—a global dashboard—is our next great
opportunity for exploring our world.
A global dashboard is a decision support tool that helps monitor
current conditions, identify change, and drive informed action.
It enables exploration at scales from local to global. It allows
people to visualize large, complex spatial datasets in the context
of their neighborhood, their street, and their house. The ability
to explore a world of data from a personal perspective is a very
powerful idea.
The rise of crowdsourcing applications means that every citizen becomes a sensor, empowering everyone to participate and contribute.
GIS enables real-time integration of sensors from multiple sources, using maps as a means to help us understand our world.

Essays on Geography and GIS, Vol. 4 May 2012 62Making Sense of Our Sensored Planet
The New Explorers
We live in a world full of sensors. Thanks to the rich information
flow they provide, and the availability of new mapping tools to
display and analyze this information in context, now everyone
can be an explorer. This has far-reaching benefits to both society
and the environment, ushering in a new era of understanding
and leading us toward more informed, equitable, and sustainable
action.
(This blog post originally appeared in Esri Insider on November 2, 2011.)
Essays on Geography and GIS, Vol. 4 May 2012 63Hand in Hand—Spatial Information for Latin America
In order to better implement spatial
information in developing countries,
training and institutional development
must go hand in hand.
A good number of national development
plans in Latin America prioritize
education based on new technologies
and state that digital illiteracy must
be eradicated, as it constitutes an obstacle to access to the
opportunities offered in today's globalized world. However,
very little, if ever, is said about the fundamental need for spatial
information, and thus the subject should be incorporated
into national development plans and broad interdisciplinary
processes. GIS is a key tool to critically understand geographic
problems and put geographic thought into practice, especially
now that citizens enjoy the benefits of instant geography through
map services, dynamic photo files, and 360-degree street maps,
for example.
The Pan American Institute of Geography and History (PAIGH)
is the oldest organization in the Organization of American
States (OAS) and the one in charge of providing it with
the spatiotemporal component necessary to promote the
comprehensive development of the region. Among other
activities, PAIGH fosters the development of spatial data
infrastructure in the Americas and to that end carries out
workshops and regional projects every year.
Development Is Relative and Highly Subjective
When using the term development, we are referring to a relative,
extremely subjective and often contradictory concept in which
what some regard as progress is often viewed by others, from an
equally subjective perspective, as a setback. Take, for example,
the United Nations Development Programme's annual report on
global development. The 2007 report, prior to the 2008 financial
crisis, asserted that the global economy was growing at a steady
pace and that, in spite of increased inequality, the human
development gap was in sharp decline. More recently, the 2010
report stated the world was on an inexorable path to compliance
with the Millennium Development Goals, as evidenced by graphs
and statistics that critics might disagree with. Personally, I feel it
has been quite a feat for the United Nations to make its members
agree upon an effective, well-intentioned global strategy.1
Hand in Hand—Spatial Information for Latin AmericaBy Santiago Borrero, Secretary General, Pan American Institute of Geography and History

Essays on Geography and GIS, Vol. 4 May 2012 64Hand in Hand—Spatial Information for Latin America
Now let's look at our region with the same magnifying glass.
In 2010, a significant number of countries held bicentennial
celebrations with great fanfare. One thing was made patently
clear to me during the commemorations: Although the nations of
the American continent are indeed young, and the economic and
social progress achieved by countries such as the United States
and Canada is impressive, for the great majority of our countries,
the twenty-first century holds a geopolitical vision quite unlike
that of the days of independence in the early nineteenth century.
Nowadays, the challenges of the Pan-American movement are
very different and focus on the war on poverty, climate change,
the scale of natural disasters and their mitigation, management
and organization of land and natural resources, development
of global markets and their local impact, and the social and
economic significance of knowledge. Today, the objectives of the
PAIGH 2010–2020 Pan American Agenda include
• To consolidate PAIGH as a regional Pan-American forum
to advance geographic information and assist with the
comprehensive development of its member states
• To encourage the development of spatial databases so they
can be used in decision-making processes, to make early-
warning systems more efficient, and to improve disaster
response times
• To identify actions that will contribute to regional integration
in specific fields, such as climate change, territorial
organization, and natural disasters
• To assist with development of high-quality geographic
information infrastructure essential to analysis processes
To successfully deal with these challenges, information
technologies, such as earth observation systems, GIS, and
spatial data infrastructure, play an increasingly relevant role.
Although they are revolutionary in and of themselves, from
the development perspective, the same relativity I mentioned
with regard to global growth could apply here as well. Take,
for example, the principle of sharing and accessing spatial
data through the Global Earth Observation System of Systems
(GEOSS). In the short term, application of technologies may be
limited, such as when the international community tries to react,
in the midst of serious coordination and logistical difficulties, to
natural disasters in impoverished countries, as was the case of
Haiti in early 2010.
Two Sides of the Coin
The United Nations Platform for Space-based Information for
Disaster Management and Emergency Response (UN-SPIDER)
agency, a key instrument in the process of expansion that has
provided incremental results acknowledged by the specialized
community, highlights how reality is often quite different from

Essays on Geography and GIS, Vol. 4 May 2012 65Hand in Hand—Spatial Information for Latin America
what even the keenest supporters had envisioned. Here are
excerpts from the UN-SPIDER report on Haiti's 2010 disaster.2 On
one hand, the report says
When the devastating earthquake of magnitude 7
struck Haiti on 12 January 2010, the UN-SPIDER
SpaceAid framework was immediately activated and
UN-SPIDER experts became involved in supporting
the early response efforts less than 30 minutes after
the earthquake hit . . . Without delay, UN-SPIDER
experts began to coordinate through their well
established network with providers of space-based
information, including public and private satellite
operators, informed them of the most pressing
needs and requested tasking of their satellites . . .
Precious hours were saved because of these efforts.
Eventually, post-disaster imagery was made available
within less than 24 hours after the event . . . In a
second step, UN-SPIDER coordinated with several
value adding providers to ensure that the available
imagery could be used immediately to produce
required services as for example maps to display
accessible roads and suitable areas to set up relief
facilities . . .
But the report also states
Unfortunately, due to the disrupted infrastructure in
Haiti, the huge amount of compiled data could not
be downloaded by the partners on the ground via
internet. Interrupted networks and low bandwidth
pose a serious bottle neck, and this was also the
case in Haiti.2
Certainly, responsibility in the case of developing countries lies
not only in the international community. National authorities
responsible for spatial information must enhance their capacity
to offer assistance during disasters. In Haiti's case, the National
Center for Geospatial Information collapsed, and its director, an
enterprising woman who was doing a fine job, died together
with a group of colleagues. In the case of the 2010 earthquake in
Chile, the Military Geographic Institute provided significant help
in response and recovery efforts. Moreover, upon realizing that
available information was insufficient, the national government
recently allocated resources to take national cartography to
1:25,000 scale.
In the case of spatial data infrastructure in the Americas,3 the
region is progressing at its own pace, and headway has been
made thanks to a set of national efforts at all levels, together
with contributions from the private sector and regional projects.
Nonetheless, availability of high-quality data at the supranational
level is still wanting. One critical problem is the lack of effective

Essays on Geography and GIS, Vol. 4 May 2012 66Hand in Hand—Spatial Information for Latin America
implementation of the international standards promoted by
the International Organization for Standardization (ISO), not to
mention those of Open Geospatial Consortium, Inc. Several
programs and initiatives are making relevant contributions, such
as the joint Andean Development Corporation/PAIGH program,
known as GeoSUR, and the Geocentric Reference System for the
Americas that successfully espouse the continental unification of
the geodesic system.3
The Future of the Region's Geographic Institutes
Institutions responsible for national cartography in Latin America
and the Caribbean are at a critical juncture and face the
challenge of transforming their functions, skills, and human and
technological resources.
PAIGH Highlights
Founded in 1928 and headquartered in Mexico, PAIGH assists member
states with geographic and historical analyses of their territories from a
continental perspective.
It is a decentralized intergovernmental agency with 21 member states,
each of which has its own national section.
Four technical commissions are responsible for the scientific program:
cartography (1941), geography (1946), history (1946), and geophysics
(1969).
The Institute is currently implementing a strategic plan entitled The
PAIGH 2010–2020 Pan American Agenda, aimed at furthering regional
integration through multidisciplinary actions and prioritizing natural
disasters and territorial organization in a climate change scenario.

Essays on Geography and GIS, Vol. 4 May 2012 67Hand in Hand—Spatial Information for Latin America
Geographic institutes are no longer the sole producers of spatial
information. Various public, private, local, and international
institutions are equally, or better, equipped to produce
fundamental spatial data and applications and make them
accessible. ArcGIS Online, Google Maps, OpenStreetMap, and
Bing have more and superior maps than many countries have
through their institutions. The matter of who should pay for
geographic information continues to be an issue. Geographic
institution budgets are usually insufficient, bearing in mind the
expense of the activities required to have complete spatial
databases that encourage development. Guardianship, quality,
integrity, and pertinence of fundamental data, as well as the
tasks of coordination, certification, and verification of productive
processes, access mechanisms, and data availability, are basic
duties that should be assumed by geographic institutions.
Here are some key areas on which to focus to consolidate
production, access, and application of the region's fundamental
databases:4
• Geodesic networks (control stations, altitude and geoidal
models)
• Base geographies (rectified prints, elevation models,
hydrography)
• Spatial management (territorial units, geographic names, rural
and urban land management)
• Infrastructure (transportation, communications, utilities)
• Soil and environment (soil coverage, geology)
To consolidate the Institute's position as the foremost Pan-
American regional forum on geographic information in the region,
PAIGH endorses the modernization of the geographic institutes
that are responsible for national cartography in its member
states, the development of spatial data infrastructures, and ISO
international standards certification.
Three Types of Cartographic Institutions
There are basically three types of cartographic institutions in
the region: (i) military, as is the case of Chile, the Dominican
Republic, Ecuador, Paraguay, Peru, and Uruguay; (ii) civilian,
including some in transition, as is the case of Brazil, Colombia,
Mexico, and Venezuela; and (iii) what we could call the Central
American model, in which cartographic production is a function
of the priority given to cadastre information within the framework
of land management, as in Costa Rica, El Salvador, Honduras,
Jamaica, Nicaragua, and Panama.
It would be fitting for the region to ask itself what purpose
and mandate national geographic institutes should have in the
twenty-first century and what the long-term plans to obtain basic
strategic information in order to operate effectively are. Many
variables will determine the results, and surely some are part of
the decision-making process of each country, but it is clear that
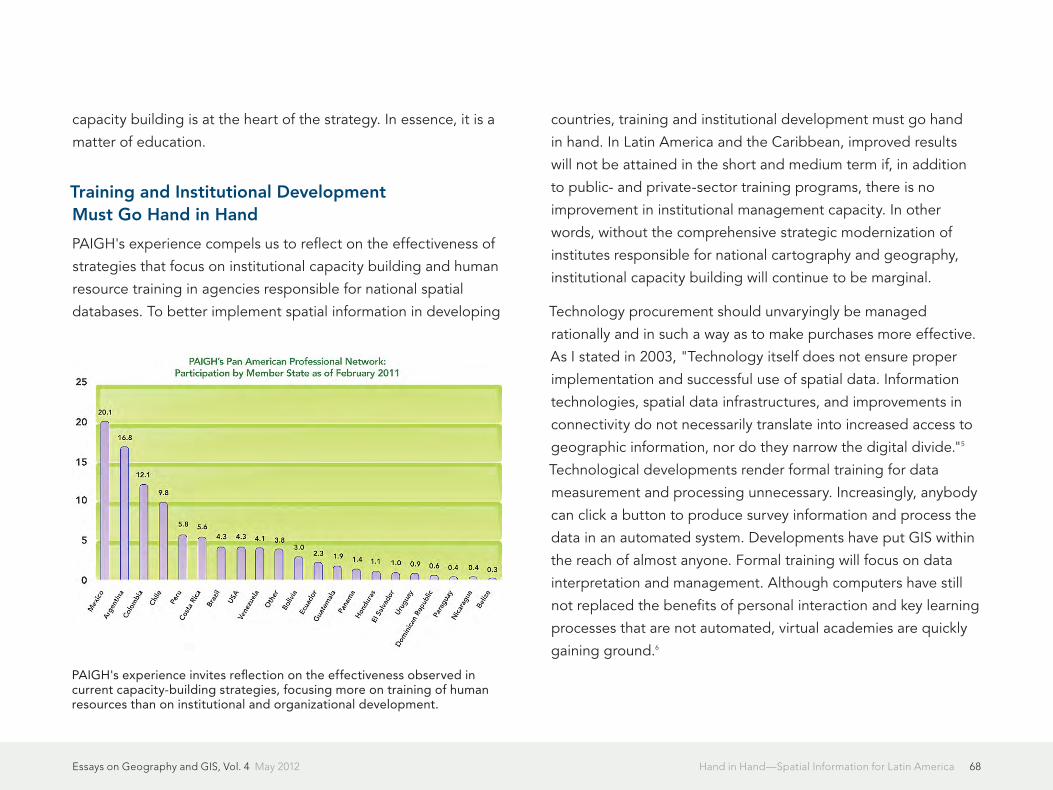
Essays on Geography and GIS, Vol. 4 May 2012 68Hand in Hand—Spatial Information for Latin America
capacity building is at the heart of the strategy. In essence, it is a
matter of education.
Training and Institutional Development Must Go Hand in Hand
PAIGH's experience compels us to reflect on the effectiveness of
strategies that focus on institutional capacity building and human
resource training in agencies responsible for national spatial
databases. To better implement spatial information in developing
countries, training and institutional development must go hand
in hand. In Latin America and the Caribbean, improved results
will not be attained in the short and medium term if, in addition
to public- and private-sector training programs, there is no
improvement in institutional management capacity. In other
words, without the comprehensive strategic modernization of
institutes responsible for national cartography and geography,
institutional capacity building will continue to be marginal.
Technology procurement should unvaryingly be managed
rationally and in such a way as to make purchases more effective.
As I stated in 2003, "Technology itself does not ensure proper
implementation and successful use of spatial data. Information
technologies, spatial data infrastructures, and improvements in
connectivity do not necessarily translate into increased access to
geographic information, nor do they narrow the digital divide."5
Technological developments render formal training for data
measurement and processing unnecessary. Increasingly, anybody
can click a button to produce survey information and process the
data in an automated system. Developments have put GIS within
the reach of almost anyone. Formal training will focus on data
interpretation and management. Although computers have still
not replaced the benefits of personal interaction and key learning
processes that are not automated, virtual academies are quickly
gaining ground.6
PAIGH's experience invites reflection on the effectiveness observed in current capacity-building strategies, focusing more on training of human resources than on institutional and organizational development.

Essays on Geography and GIS, Vol. 4 May 2012 69Hand in Hand—Spatial Information for Latin America
Needed: Better Quality Spatial Data
If I had to point to one crucial aspect of training processes, I
would say it is the need for better quality spatial data. It is
not unusual to find digitized, nonstandardized, obsolete data
generated by means of uncontrolled methods with significant
margins of error, among other drawbacks. Perhaps we should
begin with a clear definition of the term better quality, which
would seem a simple matter but is neither evident nor accurate
and, above all, is subject to a wide variety of interpretations.
To summarize, let us return to the regional vision and the
meaning of the recent bicentennial celebrations. The economy
is improving, and after a lost decade, many studies refer to the
rise of Latin America and, on a hopeful note, to the fact that over
the past 10 years, the region has experienced sustained annual
growth of close to 6 percent. Nonetheless, the economies of the
region have competitiveness issues or, to a great degree, are
operating outside the formal economy; inequities persist. In this
context, regardless of the progress achieved, I believe accessing
spatial information, incorporating pertinent technologies, and
designing applications to contribute to solve multiple economic
and social problems, such as those related to climate change,
territorial organization, and natural disasters, are essential to
regional development and integration and fields in which our
community has much to do.
A Note from the Author
In autumn 2010, I was asked to speak at the Latin American GIS
in Education Conference held in Mexico City. There, I shared my
thoughts on the connection between development, education,
and spatial information technologies in Latin America and the
Caribbean based on my years of experience in the field of
information and development and as secretary general of PAIGH,
and the above paper is the essence of my presentation, which
is my personal assessment and does not necessarily reflect the
views of PAIGH.
About the Author
Santiago Borrero received his master's degree from the
Massachusetts Institute of Technology and has nearly three
decades of experience in information and development.
Previous appointments include the chair of the Global Spatial
Data Infrastructure Association and the Permanent Committee
on SDI for the Americas, as well as the general director of the
Agustin Codazzi Geographic Institute in Colombia (1994–2002).
In Colombia, he has also been general manager of Bogotá's
Water Supply Company and the National Fund for Development
Projects.
For more information, contact PAIGH secretary general Santiago
Borrero (e-mail: [email protected]).

Essays on Geography and GIS, Vol. 4 May 2012 70Hand in Hand—Spatial Information for Latin America
Footnotes
1. www.undp.org/publications/index.shtml.
2. Excerpts taken from "UN-SPIDER Report on Haiti."
3. www.geosur.info/geosur; www.sirgas.org.
4. Clarke, Derek. Determining the Fundamental Geo-Spatial
Datasets for Africa, 2007. www.agrin.org/feature.php?id=22
5. Borrero, Santiago, UNSIS, CERN, 2003.
6. Williamson, Enemark, Wallace, Rajabifard. Land Administration
for Sustainable Development, Esri Press, 2010.
(This article originally appeared in the Summer 2011 issue of ArcNews.)
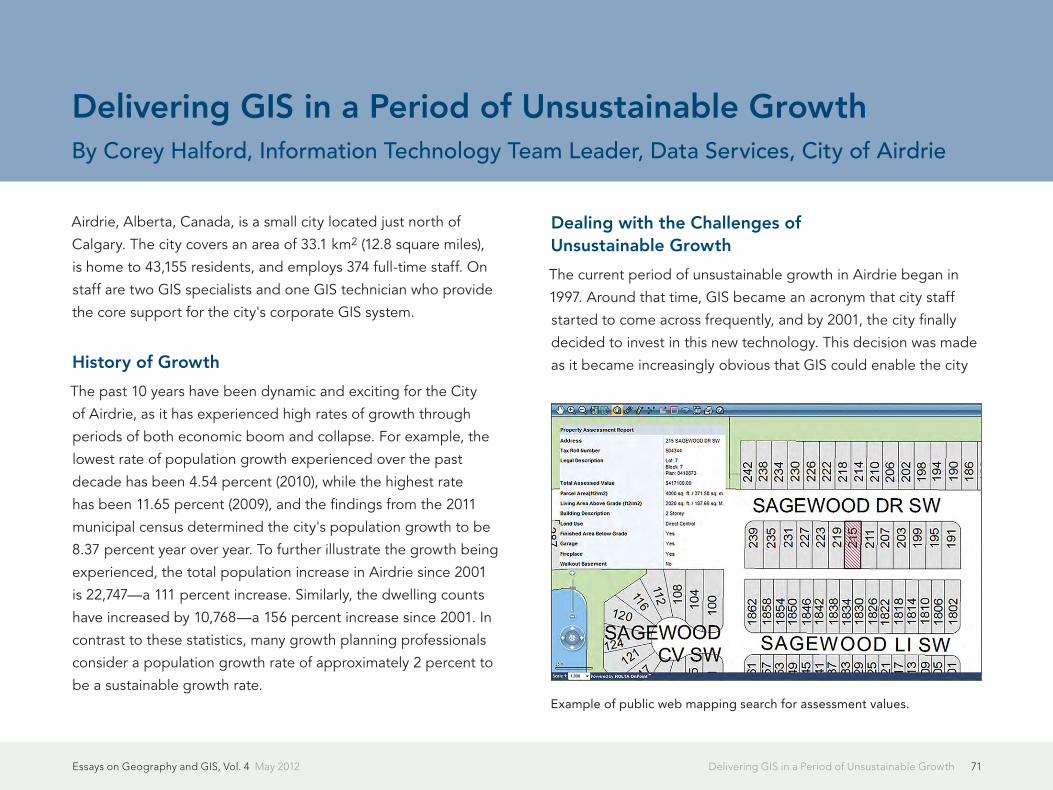
Essays on Geography and GIS, Vol. 4 May 2012 71Delivering GIS in a Period of Unsustainable Growth
Airdrie, Alberta, Canada, is a small city located just north of
Calgary. The city covers an area of 33.1 km2 (12.8 square miles),
is home to 43,155 residents, and employs 374 full-time staff. On
staff are two GIS specialists and one GIS technician who provide
the core support for the city's corporate GIS system.
History of Growth
The past 10 years have been dynamic and exciting for the City
of Airdrie, as it has experienced high rates of growth through
periods of both economic boom and collapse. For example, the
lowest rate of population growth experienced over the past
decade has been 4.54 percent (2010), while the highest rate
has been 11.65 percent (2009), and the findings from the 2011
municipal census determined the city's population growth to be
8.37 percent year over year. To further illustrate the growth being
experienced, the total population increase in Airdrie since 2001
is 22,747—a 111 percent increase. Similarly, the dwelling counts
have increased by 10,768—a 156 percent increase since 2001. In
contrast to these statistics, many growth planning professionals
consider a population growth rate of approximately 2 percent to
be a sustainable growth rate.
Dealing with the Challenges of Unsustainable Growth
The current period of unsustainable growth in Airdrie began in
1997. Around that time, GIS became an acronym that city staff
started to come across frequently, and by 2001, the city finally
decided to invest in this new technology. This decision was made
as it became increasingly obvious that GIS could enable the city
Delivering GIS in a Period of Unsustainable GrowthBy Corey Halford, Information Technology Team Leader, Data Services, City of Airdrie
Example of public web mapping search for assessment values.

Essays on Geography and GIS, Vol. 4 May 2012 72Delivering GIS in a Period of Unsustainable Growth
to make more accurate business decisions and assist in dealing
with the population and development growth that was being
experienced.
The implementation phase of GIS at the city was initiated in
2001 and completed in 2003. Since 2002, the city has been
using Esri technologies to support its GIS and is currently a
subscriber to the Esri Small Municipal and County Government
Enterprise License. At that time, however, GIS faced its first major
operational concern—who would own it? There were many
departments interested in GIS at the city, but finally, after much
debate, corporate leadership determined that GIS would be a
tool that could support the entire organization and therefore
decided that GIS would sit in the information technology (IT)
department. This wasn't a decision supported by everyone in the
organization, but in light of the dependency of GIS on IT and its
related infrastructure, this is, in actuality, the best place for it.
Following the implementation of GIS at the City of Airdrie,
departments were able to justify new GIS-related positions based
on Airdrie's increasing growth issues; however, this posed two
major challenges to the GIS team. The first was that many of
the individuals hired were ill equipped to offer the GIS support
needed by their department, as they had only taken a GIS
course or two and didn't fully understand the principles of GIS.
The second was that some individuals began working alone in
departmental silos without seeking support from the actual GIS
team. Furthermore, these individuals began offering support to
other departments, which resulted in significant confusion and
conflicts with staff. To address this challenge, the GIS team, in
collaboration with the rest of the organization, defined roles and
responsibilities that all parties were able to agree on in an effort
to properly support the city's GIS needs.
In recognition of the obstacles being faced by departments
pursuing GIS initiatives, the GIS team developed a new method
of customer engagement to be proactively involved, assigning
a department to each GIS team member for which they would
become the direct GIS support. Originally initiated as a pilot
project with the parks department, this new approach started
with four dedicated, on-site hours from a GIS specialist. At
first, no one was sure how these visits would go, but after only
a few weeks, it became apparent that the project could be
considered a success, and it was soon rolled out to the rest of
the organization. This model was so effective because it allowed
the GIS specialist to witness the everyday operations of the parks
department and find ways to use GIS as a tool to make those
operations more efficient. Another benefit of this process is that
it allows adaptability and customization per department. For
example, while the parks department works well with four hours
per week, the planning department prefers one, whereas public
works requires even less time than that, and so on.
The implementation of the service model described above has
also created a more organized and efficient environment for the
GIS team. By having dedicated departments to support, there

Essays on Geography and GIS, Vol. 4 May 2012 73Delivering GIS in a Period of Unsustainable Growth
is less ambiguity over who is going to do what and when, which
makes for a smoother response to requests. In addition, as
demands for GIS resources increase and GIS staff reach their
capacity, it is easier to justify the need for more staff and/or
consulting dollars, as there is more tangible proof of the work
being done. Lastly, all this has increased the team's customer
satisfaction and engagement to a level better than experienced
prior to the implementation of this service model.
Managing GIS during a time of growth has been very challenging.
One would assume that, during a period of high population
increase, obtaining funding would be easy; however, this has
certainly not been the case in Airdrie. Since 2001, all aspects of
the GIS program have been scrutinized on an annual basis, and
the ability to secure adequate funding has relied directly on how
effective budget justifications communicate the organizational
need for GIS services. These needs are now being better
demonstrated in the form of outcomes and deliverables so
corporate leaders can clearly understand what they are investing
in. Therefore, it is essential for GIS to deliver on its outcomes
in order to justify additional resources and maintain corporate
support.
An effective GIS program is built on the foundation of
knowledgeable and skilled professionals, but it is the dynamics
around people management that make staffing complicated.
Staffing consists of more than just hiring and firing, as it involves
discipline, recognition, rewards, and a strong organizational
culture. In regard to the hiring processes, there have been
challenges in the recruitment of skilled individuals. This has been
mostly attributable to the economic boom in Alberta from 2002
to 2007, which reduced the pool of skilled GIS professionals
that was available. Coupled with this, the financial benefits of
working in the private sector have often placed the city at a
disadvantage when recruiting staff. Unfortunately, this problem
persists, but one method in which the city has attempted to
overcome this disadvantage has been its commitment to an open
and honest culture that fosters personal growth, development,
and professional creativity. For the GIS team, this has resulted
in only one cycle of significant staff turnover in the past
10 years. Ultimately, if you can make work a fun place to be and
demonstrate that each person has the power to make valuable
changes, people will want to work for you; at the City of Airdrie,
this is where most success can be attributed.
Overall, it may not matter whether you are supporting a GIS
in a municipality that is experiencing increasing or decreasing
growth and budget pressures, as many of the difficulties facing
GIS operations are the same. There remains a continuous need
to justify how GIS adds value to the organization. This is a
burden that every GIS professional has, and it is the knowledge,
skills, experience, and creativity that each of us possess as GIS
professionals that will help us meet the challenges of today and
the future.
Essays on Geography and GIS, Vol. 4 May 2012 74Delivering GIS in a Period of Unsustainable Growth
Recognitions
In 2009, the City of Airdrie was the recipient of the URISA
Exemplary Systems in Government (ESIG) Award in the Single
Process category for its development of the Online Census. In
2010, Airdrie's Tourist map, created by GIS specialist Jessica
Letizia, won first place in the Best Cartographic Design in the
Single Map Product category at the Esri International User
Conference.
About the Author
Corey Halford, BSc, is the information technology team leader of
Data Services at the City of Airdrie, where he is responsible for
the management of the city's GIS program. In 2009, Halford was
the recipient of the URISA Exemplary Systems in Government
Award. He now sits on the ESIG Award review committee, and
he is a graduate of URISA Leadership Academy. Halford is also
president of the Prairies Chapter (Alberta, Saskatchewan, and
Manitoba) of the Municipal Information Systems Association
and chair of the Calgary Regional Partnership's GIS technical
committee.
For more information, contact Corey Halford, information
technology team leader, Data Services (e-mail: corey.halford
@airdrie.ca).
(This article originally appeared in the Fall 2011 issue of ArcNews.)

Copyright © 2012 EsriAll rights reserved.Printed in the United States of America.
The information contained in this document is the exclusive property of Esri. This work is protected under United States copyright law and other international copyright treaties and conventions. No part of this work may be reproduced or transmitted in any form or by any means, electronic or mechanical, including photocopying and recording, or by any information storage or retrieval system, except as expressly permitted in writing by Esri. All requests should be sent to Attention: Contracts and Legal Services Manager, Esri, 380 New York Street, Redlands, CA 92373-8100, USA.
The information contained in this document is subject to change without notice.
US Government Restricted/Limited RightsAny software, documentation, and/or data delivered hereunder is subject to the terms of the License Agreement. The commercial license rights in the License Agreement strictly govern Licensee’s use, reproduction, or disclosure of the software, data, and documentation. In no event shall the US Government acquire greater than RESTRICTED/LIMITED RIGHTS. At a minimum, use, duplication, or disclosure by the US Government is subject to restrictions as set forth in FAR §52.227-14 Alternates I, II, and III (DEC 2007); FAR §52.227-19(b) (DEC 2007) and/or FAR §12.211/12.212 (Commercial Technical Data/Computer Software); and DFARS §252.227-7015 (DEC 2011) (Technical Data – Commercial Items) and/or DFARS §227.7202 (Commercial Computer Software and Commercial Computer Software Documentation), as applicable. Contractor/Manufacturer is Esri, 380 New York Street, Redlands, CA 92373-8100, USA.
Esri Trademarks and Service Marks: @esri.com, 3D Analyst, ACORN, Address Coder, ADF, AML, ArcAtlas, ArcCAD, ArcCatalog, ArcCOGO, ArcData, ArcDoc, ArcEdit, ArcEditor, ArcEurope, ArcExplorer, ArcExpress, ArcGIS, ArcGlobe, ArcGrid, ArcIMS, ARC/INFO, ArcInfo, ArcInfo Librarian, ArcLessons, ArcLocation, ArcLogistics, ArcMap, ArcNetwork, ArcNews, ArcObjects, ArcOpen, ArcPad, ArcPlot, ArcPress, ArcPy, ArcReader, ArcScan, ArcScene, ArcSchool, ArcScripts, ArcSDE, ArcSdl, ArcSketch, ArcStorm, ArcSurvey, ArcTIN, ArcToolbox, ArcTools, ArcUSA, ArcUser, ArcView, ArcVoyager, ArcWatch, ArcWeb, ArcWorld, ArcXML, Atlas GIS, AtlasWare, Avenue, BAO, Business Analyst, Business Analyst Online, BusinessMAP, CommunityInfo, Database Integrator, DBI Kit, EDN, Esri, Esri—Team GIS, Esri—The GIS Company, Esri—The GIS People, Esri—The GIS Software Leader, FormEdit, GeoCollector, Geographic Design System, Geography Matters, Geography Network, GIS by Esri, GIS Day, GIS for Everyone, GISData Server, JTX, MapIt, Maplex, MapObjects, MapStudio, ModelBuilder, MOLE, MPS—Atlas, PLTS, Rent-a-Tech, SDE, SML, Sourcebook·America, SpatiaLABS, Spatial Database Engine, StreetMap, Tapestry, the ARC/INFO logo, the ArcGIS logo, the ArcGIS Explorer logo, the ArcPad logo, the Esri globe logo, the Esri Press logo, the GIS Day logo, the MapIt logo, The Geographic Advantage, The Geographic Approach, The World’s Leading Desktop GIS, Water Writes, arcgis.com, esri.com, geographynetwork.com, gis.com, gisday.com, and Your Personal Geographic Information System are trademarks, service marks, or registered trademarks or service marks of Esri in the United States, the European Community, or certain other jurisdictions.
Other companies and products mentioned herein may be trademarks or registered trademarks of their respective trademark owners.

Printed in USA
Contact Esri
380 New York Street Redlands, California 92373-8100 usa
1 800 447 9778 t 909 793 2853 f 909 793 5953 [email protected] esri.com
Offices worldwide esri.com/locations
Esri inspires and enables people to positively impact their future through a deeper, geographic understanding of the changing world around them.
Governments, industry leaders, academics, and nongovernmental organizations trust us to connect
them with the analytic knowledge they need to make the critical decisions that shape the planet.
For more than 40 years, Esri has cultivated collaborative relationships with partners who share our
commitment to solving earth’s most pressing challenges with geographic expertise and rational resolve.
Today, we believe that geography is at the heart of a more resilient and sustainable future. Creating
responsible products and solutions drives our passion for improving quality of life everywhere.
G48520 ESRI5/12kh