essay 1 the price impact of open market share repurchases
TRANSCRIPT
Essay 1
The price impact of open market share repurchases*
* Financial support from the NASDAQ OMX Nordic Foundation and the Signeuls Foundation is gratefully
acknowledged. The paper was presented at Nordic Finance Network (NFN) Research Workshop 2011 in
Helsinki and at the 2012 annual meeting of Eastern Finance Association in Boston. I would like to thank seminar
participants for their comments.

2
1. Introduction
Share repurchases have become a common phenomenon worldwide in recent years.
According to Vermaelen (2005), the global increase in repurchase activity is a result of
deregulation, tax changes, shareholder value maximization as a growing corporate objective,
and the growth of stock options in executive compensation packages. Share repurchases have
also become an important way of distributing cash to shareholders since they are viewed by
managers as more flexible than dividends. The survey results of Brav et al. (2005) report that
managers use this flexibility to alter payout in response to the availability of good investment
opportunities and to accelerate or initiate share repurchases when their stock is perceived as
undervalued.1 Studies of open market share repurchase programs in Hong Kong (Brockman
and Chung, 2001), Japan (Zhang, 2002), the US (Cook et al., 2004) and Canada (McNally et
al., 2006) also find empirical support that firms exhibit timing skills with their repurchase
trades.
In the US, there is a rich literature studying the price impact of open market share
repurchase authorization announcements. Ikenberry and Vermaelen (1996) argue that open
market repurchase authorizations effectively give managers an option to repurchase shares
when they view their stock as undervalued. If managers are able to detect valuation errors, the
stock price should increase at the time of the authorization announcement to reflect the value
of this option even if the shares are correctly valued at the time of the announcement. In
general, US studies also find that repurchase authorization announcements are associated with
a positive excess return of approximately 3%.2 Lasfer (2000) and Rau and Vermaelen (2002)
find a much smaller announcement effect in Europe.3 However, in most European countries
share repurchases have to be authorized by the shareholders at a general meeting, while in the
US the repurchase authorization is given by the Board of Directors. Studies of European open
market repurchase announcements, therefore, generally examine stock price reactions around
the announcement that the company intends to ask for the shareholders’ authorization to
repurchase shares at the next shareholder meeting. Since the authorizations have a limited
lifespan and do not require the company to follow up, many European companies regularly
1 Brav et al. (2005) report that 86.4% of all surveyed firms agree or strongly agree with the supposition that the
stock price is an important or very important factor to the firm’s repurchase decision. 2 See, e.g., Vermaelen (1981), Comment and Jarrell (1991), Ikenberry et al. (1995), Grullon and Michaely
(2004), and Peyer and Vermaelen (2005). 3 Lasfer (2000) finds a 5 day announcement effect of 1.64% in the UK, 0.78% in France and 0.63% in Italy. Rau
and Vermaelen (2002) find a 5 day announcement effect of 1.08% in the UK.

3
ask the shareholders to approve share repurchases so that the company always has the option
to repurchase shares.4 Since these intention announcements are often expected, it is not
surprising that the abnormal returns (ARs) around these announcements are relatively low.
As in other countries within the EU, share repurchases in Sweden have to be authorized by
the shareholders at a general meeting. However, Sweden is unique with regard to the
disclosure requirements of open market share repurchase programs. Decisions by the
company to utilize repurchase authorizations must be disclosed as soon as possible according
to the disclosure rules of the Stockholm Stock Exchange (SSE). These intention
announcements are generally followed by actual share repurchases within the next 2 days.
Given that market participants believe that firms exhibit market timing abilities due to
asymmetric information, the intention announcements may be perceived as a signal of
undervaluation and a price increase may occur. Since the SSE also requires Issuers to disclose
their repurchase activities on a daily basis, it is also possible to study liquidity related price
effects from the actual repurchase trading.
This study exploits a detailed data set of open market share repurchase programs initiated
between March 2000 and March 2010 by Swedish firms listed on the SSE.5 The purpose of
the study is to examine the share price behavior around the initiation announcements of open
market share repurchase programs, the price impact of repurchase trading, and the long-run
abnormal stock performance following the initiation announcements. Studying the price
impact of open market share repurchases in Sweden is interesting for several reasons. First,
Swedish disclosure rules enable market participants to be informed of upcoming repurchase
trading, which could have an impact on the stock price if the investors perceive the
information to be valuable. Second, the repurchase volume on the repurchase days is quite
substantial. On average, the repurchase volume represents 31% (median = 22%) of the total
traded volume in the repurchasing firm’s stock on the repurchase days. This large demand-
driven volume could lead to a price support on the repurchase days. Third, it is useful to
investigate if there is evidence of a positive long-run abnormal stock performance subsequent
to repurchase announcements in Sweden as documented in other countries (see, e.g.,
Ikenberry et al., 1995, 2000; Mitchell and Stafford, 2000; Zhang, 2002, 2005; Chan et al.,
2004; McNally and Smith, 2007; Peyer and Vermaelen, 2009; and Yook, 2010).
4 According to Vermaelen (2005), the common European practice is to ask shareholders to approve a repurchase
authorization up to the maximum legal limit during the general meeting (often 10% of the shares outstanding). 5 Open market share repurchases were first allowed in Sweden on March 10, 2000.

4
The results show a significant negative AR over the 20 trading days preceding initiation
announcements and a statistically significant 2 day AR of 1.94% at the time of the initiation
announcement. When announcements are stratified by the stated reason for the repurchase
program, repurchase programs motivated by employee stock ownership plans (ESOPs) show
a smaller 2 day AR (0.86%) relative to programs with other motives. The average AR is
significant and positive on the three first repurchase days in a repurchase program, with an
AR of approximately 0.7% on the first repurchase day. Since the market reaction is
permanent, the result indicates that the market perceives the actual repurchases as a signal of
undervaluation.6 On average, repurchase days have a small but statistically significant AR of
0.12% with an equally-weighted stock return index as benchmark. The price impact on the
repurchase days is positively correlated with the repurchase volume, which suggests that a
price increase is also a result of a liquidity effect. Ibbotson’s (1975) RATS methodology and
the calendar-time portfolio approach are used to determine long-term ARs. Over the 12
months following the month of the initiation announcement, the AR is on average 6-7% and
statistically and economically significant. In the second year, there is no evidence of a
positive AR - a finding inconsistent with Ikenberry et al. (1995, 2000) and Peyer and
Vermaelen (2009). The long-run abnormal performance is positively associated with the
fraction of shares bought in the program.
This study is organized into seven sections. Section 2 presents relevant previous research.
Section 3 describes the regulation of open market share repurchases in Europe and Sweden.
Section 4 describes the data and sample. Section 5 explains the methodology while section 6
contains the empirical results. Concluding remarks are provided in section 7.
2. Previous research
In the US, Dann (1981), Vermaelen (1981), Comment and Jarell (1991), Stephens and
Weisbach (1998), Ikenberry et al. (1995), Grullon and Michaely (2004), and Peyer and
Vermaelen (2005), find a positive and significant excess return around authorization
announcements of approximately 3%. This indicates that repurchase announcements have a
positive economic benefit for shareholders. In the UK and Continental Europe, Lasfer (2000)
and Rau and Vermaelen (2002) find a smaller excess return of approximately 1%. However,
they examine share price performance around announcements that the company intends to ask
6 The submission of buy limit orders by repurchasing firms may otherwise result in a temporary price impact.

5
the shareholders for repurchase authorization at the next general meeting - an announcement
that often is expected.
There are only a few studies that examine ARs on the actual repurchase days, since
repurchases are not disclosed on a daily basis in most countries. Skjeltorp (2004), Zhang
(2005) and McNally et al. (2006) examine actual share repurchases in Norway, Hong Kong
and Canada, respectively. They all find positive excess returns on the actual repurchase days
and McNally et al. (2006) find evidence that repurchases provide price support and that
repurchasing companies have superior timing.
Ikenberry et al. (1995) argue that if managers can detect the undervaluation of the firm’s
shares and, therefore, decide to buy back shares, the announcement of the repurchase program
is a valuable signal to the less informed marketplace. If the capital market is semi-efficient,
the new equilibrium price should immediately and fully reflect the “true” value of the new
information. However, studies such as Ikenberry et al. (1995, 2000), Chan et al. (2004),
Zhang (2005), and Peyer and Vermaelen (2009), find long-run ARs up to 48 months
following repurchase announcements. Thus, the market seems to under react to the
information conveyed in repurchase announcements. Why the market reaction extends for
such a long time is still puzzling. One explanation for the reported long-run excess returns is
that they could be caused by chance and may be sample-specific, as argued by Kothari and
Warner (1997) and Fama (1998). Another explanation is that the repurchase trades themselves
support the stock price, as argued by McNally et al. (2006).
3. Regulatory environment of open market share repurchases in Sweden
and trading structure on the Stockholm Stock Exchange
3.1. Regulation of open market share repurchases in Europe and Sweden
Share repurchases in the European Union (EU) are regulated by Articles 19 to 24 of the
Second Company Law Directive 77/91/EEC of 13 December 1976. The aim of the Directive
is to ensure minimum equivalent protection for both shareholders and creditors in public
limited companies. The Directive states the minimum regulation in the Member States and it
is up to each member state to prohibit share repurchases or implement a stricter regulation.
According to Article 19 in the Directive, a public limited company may acquire its own shares
after an authorization given by the shareholders at a shareholders’ meeting. The maximum
length of the authorization shall be determined by national law, but may not exceed 5 years. A

6
company can either buy back its own shares to keep them as treasury stock or to reduce the
company’s share capital. The share repurchase may not have the effect of reducing the net
assets in the company’s annual accounts to a level below the sum of its share capital and non-
distributable reserves.
In Sweden, share repurchases were prohibited from 1895 until March 10, 2000, when
changes in the Companies Act 1975 made it possible for public limited companies to
repurchase their own shares and keep them as treasury stock.7 The purpose of the prohibition
was originally to protect the company’s creditors, but later it was motivated by the risk of
speculation or price support by the company. A decision to repurchase shares must be made
by the shareholders at a general shareholder meeting. However, the shareholder meeting can
authorize the Board of Directors to make such a decision.8 The authorization to repurchase
shares may not last longer than until the next annual general meeting and the maximum
treasury stock the company is allowed to keep at any time is limited to 10% of the total
number of shares in the company. Companies may repurchase their own stock on an
authorized market or another regulated market within the European Economic Area, or
through a tender offer directed to all shareholders.9
In order to ensure the integrity of financial markets in the EU and to enhance investor
confidence in those markets, a new Directive on insider trading and market manipulation was
published in 2003 (Directive 2003/6/EC). Sweden implemented the Directive into Swedish
law on July 1, 2005.10
The prohibitions provided in the Directive do not apply to trading in
own shares if such trading is carried out in accordance with the Commission Regulation (EC)
No 2273/2003 of December 22, 2003.11
However, it is important to note that share
repurchases not carried out as in regulation 2273/2003 should not per se be deemed to
constitute market abuse.
In many countries, corporate insiders such as officers, directors and major shareholders,
are prohibited from trading in the firm’s stock when the informational advantage is expected
to be particularly high. In Sweden, companies are also defined as insiders and, according to
7 Before March 10, 2000, it was possible for firms to buy back shares directly from the shareholders and
thereafter cancel them in a relatively slow and cumbersome administrative procedure (redemption of shares). 8 The repurchase decision is valid only if approved by shareholders holding at least two-thirds of the votes cast
and the shares represented at the meeting. In general, the shareholder meeting authorizes the Board of Directors
to make decisions about share repurchases. 9 Companies may also repurchase their own stock on an authorized market or another regulated market outside
the European Economic Area after approval from the Swedish Financial Supervisory Authority (FI). 10
Market Abuse Penal Act (SFS 2005:377). 11
A regulation is directly applicable, which means that it creates law which takes immediate effect, on the day of
its publication, in all the Member States without any further action on the part of the national authorities.

7
Swedish law, firms may not engage in trading in their own shares during the 30 days prior to
the publishing of interim reports, the day of publication included.12
Companies repurchasing their own shares on the SSE must comply with the Exchange’s
rules regarding share repurchases.13
The rule book for issuers issued by the SSE states the
following regarding share repurchases; the company’s resolution at a general shareholder
meeting to purchase the company’s own shares and decisions by the Board of Directors to
utilize possible authorizations to purchase the company’s own shares must be disclosed as
soon as possible. The disclosure must contain information on:
The period during which the decision to purchase the company’s own shares is to be
effected or the period during which the authorization may be utilized;
Existing holdings of the company’s own shares and the maximum number of shares
intended to be purchased;
The highest and lowest repurchase price per share;
The purpose of the repurchase program.
The company must report to the SSE all repurchase transactions as soon as possible, and not
later than 30 minutes before the Exchange opens on the trading day immediately following
the repurchase day. With the exception of block transactions, the company may not purchase
more than 25% of the average daily turnover during the four calendar weeks immediately
preceding the week of the repurchase.14
The company may only place orders or close
transactions in the company’s own shares within the bid-ask spread applying on the
Exchange.
3.2. Trading structure on the Stockholm Stock Exchange
Trading in shares listed on the SSE is conducted in an electronic order-driven trading system.
Traders submit orders in the trading system through Exchange members. There are no
designated market makers; however, some smaller firms engage liquidity providers. Buy and
sell orders entered into the trading system are automatically matched. Limit orders are first
prioritized by price and then by time. If a trader requires immediate execution, the trader must
submit a buy (sell) limit order that hits the current best ask (bid) price. Traders can submit
12
The Act concerning Reporting Obligations for Certain Holdings of Financial Instruments (SFS 2000:1087). 13
Rules regarding purchase and sale of a company’s own shares in the Rule book for issuers. 14
A block transaction is defined as a single transaction of at least 5 million SEK for companies traded at the
Large Cap segment and 2.5 million SEK for companies traded at the Mid and Small Cap segments on the SSE.

8
hidden limit orders, where only a portion of the order volume is displayed in the limit order
book. However, the hidden portion has lower priority than the displayed limit orders with the
same price. Exchange members can choose between trading on-exchange or outside the
Exchange. On-exchange, the Exchange member can either make trades in the electronic
order-driven trading system or outside the order book as a manual trade. In both cases, the
trades must comply with the requirements of the Exchange. Manual trades that take place
during the trading hours of the Exchange must be reported as close to real-time as possible,
but no later than three minutes from the trading agreement. Manual trades that take place after
trading hours must be reported prior to the opening of the Exchange the following trading
day. The SSE offers a high degree of transparency. Traders observe, in real-time, bid and ask
prices with corresponding depth, concluded transactions, as well as the identities of Exchange
members behind executed transactions.
4. Data and sample
The initial sample includes all initiated open market share repurchase programs that were
authorized between March 2000 and December 2009. In Sweden, a repurchase program must
be authorized by the shareholders at a shareholder’s meeting; details of the programs were
collected from the meetings’ resolutions. Announcements by the Board of Directors to utilize
repurchase authorizations (initiation announcements) were obtained from AffärsData and
from the companies’ websites.15
Data of share repurchase conducted on the SSE was collected from NASDAQ OMX
Stockholm.16
The data includes the name of the repurchasing firm, the repurchase date, the
total number of shares repurchased during the day distributed by class of share, and the
average repurchase price. NASDAQ OMX Stockholm also provided data on daily trading
volumes for on-exchange trades executed both inside and outside the electronic order-driven
trading system (automatic and manual trades). The first repurchase in the sample is on March
30, 2000 and the last repurchase is on April 9, 2010.
The Thomson Reuters Datastream database was used to obtain price and total return data
on individual shares as well as data on the book values of equity. The total number of
15
Decisions by the Board of Directors to utilize possible authorizations to purchase the company’s own shares
must be publicly disclosed as soon as possible according to rules by the SSE. 16
Data of repurchases between March 10, 2000, and December 18, 2000, was collected from the Swedish
Financial Supervisory Authority (Finansinspektionen), since NASDAQ OMX Stockholm did not keep track of
share repurchases during this period.

9
registered shares was provided by Euroclear Sweden and hand-collected from annual
reports.17
Table 1
Statistics of initiated open market share repurchase programs authorized from 2000 to 2009
No. of authorized
rep. programs
Authorized fraction Sought fraction
Acquired fraction
Year Mean Median Mean Median Mean Median
2000 43 9.2 10.0 8.2 10.0 4.8 4.0
2001 35 9.1 10.0 7.0 10.0 2.8 2.2
2002 41 9.5 10.0 7.0 10.0 2.7 1.8
2003 30 9.2 10.0 6.3 5.7 2.1 1.5
2004 25 8.8 10.0 6.2 5.0 2.1 1.0
2005 15 9.1 10.0 5.9 6.8 1.9 0.9
2006 29 9.2 10.0 5.2 5.0 3.2 2.8
2007 58 8.5 10.0 5.0 4.1 2.0 1.2
2008 53 8.2 10.0 5.1 2.5 1.8 1.2
2009 22 7.7 10.0 5.2 4.4 1.7 0.9
All years 351 8.8 10.0 6.0 5.1 2.6 1.6
The table shows summary statistics of initiated open market share repurchase programs by Swedish firms listed
on the SSE. The year of the repurchase program is the year the program was authorized by the shareholders at a
shareholders’ meeting. The authorized fraction is the fraction of the total number of shares in the company that
the shareholders authorize the Board of Directors to repurchase or keep as treasury shares. The sought fraction is
the fraction of the total number of shares in the company that the Board of Directors intends to repurchase or
keep as treasury shares in the initiation announcement of the share repurchase program. The initiation
announcement is the announcement by the Board of Directors to utilize the repurchase authorization by the
shareholders. The acquired fraction is the fraction of the total number of shares in the company that is
repurchased in the repurchase program. Due to missing initiation announcements, the sought fraction is based on
a total of 227 initiation announcements. Fraction numbers in the table are in percent.
Table 1 reports summary statistics of the repurchase programs. The total number of
initiated open market share repurchase programs during the sample period was 351 (executed
by 125 different firms). The repurchase activity tends to fall during recessions and rise during
boom periods.
On average, shareholders authorized the company to repurchase 8.8% of the total number
of shares. However, this figure is skewed since approximately 83% of the authorizations are
for the maximum allowed fraction of shares that the company is allowed to keep at any time
(10%).18
Shareholders generally authorize the Board of Directors to initiate a share repurchase
program. Decisions by the Board of Directors to utilize a repurchase authorization must be
17
Euroclear Sweden provided data on the total number of shares at the end of each year. The total number of
shares within years was hand-collected from annual reports. 18
According to the Swedish Companies Act, the maximum treasury stock the company is allowed to keep at any
time is limited to 10% of the total number of shares in the company (SFS 1975:1385 and SFS 2005:551).
10
publicly disclosed immediately, and the initition announcement must include the maximum
number of shares the company intends to repurchase. On average, the Board of Directors
sought 6.0% of the shares.19
The fraction of shares acquired was however on average
significantly less. In the mean (median) repurchase program, 2.6% (1.6%) of the shares were
bought.20
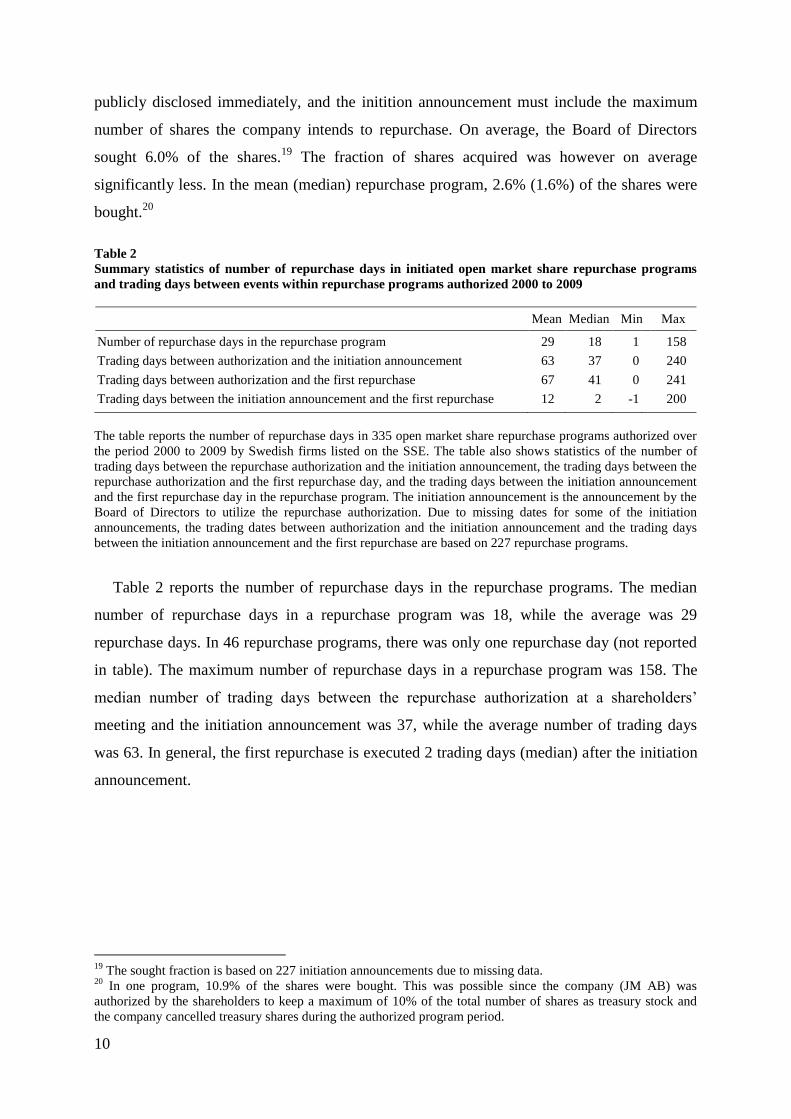
Table 2
Summary statistics of number of repurchase days in initiated open market share repurchase programs
and trading days between events within repurchase programs authorized 2000 to 2009
Mean Median Min Max
Number of repurchase days in the repurchase program 29 18 1 158
Trading days between authorization and the initiation announcement
63 37 0 240
Trading days between authorization and the first repurchase 67 41 0 241
Trading days between the initiation announcement and the first repurchase
12 2 -1 200
The table reports the number of repurchase days in 335 open market share repurchase programs authorized over
the period 2000 to 2009 by Swedish firms listed on the SSE. The table also shows statistics of the number of
trading days between the repurchase authorization and the initiation announcement, the trading days between the
repurchase authorization and the first repurchase day, and the trading days between the initiation announcement
and the first repurchase day in the repurchase program. The initiation announcement is the announcement by the
Board of Directors to utilize the repurchase authorization. Due to missing dates for some of the initiation
announcements, the trading dates between authorization and the initiation announcement and the trading days
between the initiation announcement and the first repurchase are based on 227 repurchase programs.
Table 2 reports the number of repurchase days in the repurchase programs. The median
number of repurchase days in a repurchase program was 18, while the average was 29
repurchase days. In 46 repurchase programs, there was only one repurchase day (not reported
in table). The maximum number of repurchase days in a repurchase program was 158. The
median number of trading days between the repurchase authorization at a shareholders’
meeting and the initiation announcement was 37, while the average number of trading days
was 63. In general, the first repurchase is executed 2 trading days (median) after the initiation
announcement.
19
The sought fraction is based on 227 initiation announcements due to missing data. 20
In one program, 10.9% of the shares were bought. This was possible since the company (JM AB) was
authorized by the shareholders to keep a maximum of 10% of the total number of shares as treasury stock and
the company cancelled treasury shares during the authorized program period.

11
5. Methods for measuring the price impact of open market share
repurchases
The main objective of this study is to measure the price impact of open market share
repurchases. The price impact is examined in the short-term around the initiation
announcements of repurchase programs as well as around the actual repurchase days.
Studying the short-term price effects of different events is fairly straightforward, and most
studies today use the event study methodology introduced in the seminal paper by Fama et al.
(1969). Later studies by, e.g., Brown and Warner (1980, 1985) and Patell (1976), consider
implementation issues in the event-study methodology.21
In addition to short-term price effects, the paper examines the long-run stock performance
following repurchase initiation announcements. Care must be taken in measuring long-run
performance, since bad-model errors in expected returns grow faster with the return horizon
than the volatility of returns, and according to Fama (1998) most long-term anomalies tend to
become marginal or disappear when exposed to different models for expected returns or when
different statistical approaches are used to measure them. In the next sections, the methods
used in the paper to measure short- and long-term ARs are described.
5.1. Measuring abnormal returns surrounding the initiation announcements of open
market share repurchase programs
To study the price impact surrounding initiation announcements, a standard event study
methodology with the market model as a benchmark is used. The market model is:
(1)
where Ri,t is the total return on security i over day t, Rm,t is the return on the value-weighted
OMXSPI over day t, αi and βi are the parameters of the market model, and εi,t is the zero mean
disturbance term. Returns are indexed in the event-time with the event-date at τ=0. The event-
date is the date of the initiation announcement. τ=T1+1 to τ=T2 represents the event window
and τ=T0+1 to τ=T1 represents the estimation window. The length of the estimation window is
250 trading days and is defined as L1=T1-T0. ARs 20 trading days before and 20 trading days
after the announcement event are studied. The length of the event window is thus 41 trading
days and is defined as L2=T2-T1. Under general conditions, ordinary least squares (OLS) is a
21
Brown and Warner (1980, 1985) deal with implementation issues for data sampled at monthly and daily
intervals, respectively, while Patell (1976) deals with standardized abnormal returns.
titmiiti RR ,,,

12
21,,, T ..., ,1T ˆˆ mjjjj RRAR
consistent estimation procedure for the market model parameters. The OLS estimators of the
market model are estimated for each event j over the estimation window L1.22
Using the
market model to measure the normal return, the AR for event j at event day τ in the event
window is computed as:
(2)
where ̂ and ̂ are OLS values from the market model and estimated during the estimation
period L1 for each event j.
For each event in the sample, the cumulative AR is calculated from event day τ1 to τ2. The
cumulative average AR across all the events, N, in the sample is then:
(3)
The null hypothesis to be tested is that the cumulative average AR during the event window is
equal to zero. The test statistic proposed by Patell (1976) is used. This test statistic allows the
AR to have a different standard deviation each day and considers any increase in variance due
to prediction outside the estimation period. Under the null hypothesis - conditional upon the
event window market returns - the standard deviation of the AR each event day τ for event j
is:
(4)
where is the standard deviation of the residual for event j over the estimation period L1 in
the market model regression (1) and μm,j is the average market return over the estimation
period for event j. The AR each event day is standardized by the estimated standard deviation
of the AR. By standardizing the ARs, identical distributed ARs across events are obtained.
The standardized AR for each event day τ and event j is:
(5)
22
To reduce the potential bias from non-synchronous trading, Betas are also adjusted using the Scholes and
Williams (1977) procedure. However, the procedure does not change the results significantly.
2
1
21
270
2
,,,
2
,,,
1
,
)(
)(11)(
jmjm
jmjm
j
R
R
LAR
j
)( ,
,
,
j
j
jAR
ARSAR
N
j
jARN
CAR1
,21
2
1
1) ,(
13
and the standardized cumulative AR from τ1 to τ2 for event j is estimated as:
(6)
The standardized cumulative AR for each event j is distributed as a Student t statistic with L1-
2 degrees of freedom. To test whether the average cumulative abnormal return (CAR) is zero,
I calculate the following test statistic:
(7)
where the estimation window, L1, for each event j is 250 trading days. Since the estimation
window is large, the distribution of the test statistic tends to the unit normal N(0, 1).
The use of event study methodology with daily returns is subject to a number of potential
problems of concern. First, the evidence suggests that distributions of daily returns for an
individual security are fat-tailed relative to a normal distribution. However, Brown and
Warner (1985) show that the non-normality of daily returns has no obvious impact on event
study methodologies, since the mean excess return in a cross-section of securities converges
to normality as the number of sample securities increases.23
Second, non-synchronous trading
may result in biased OLS estimates of Beta. However, Beta parameter estimations based on
the methodology procedure suggested by Scholes and Williams (1977) to control for non-
synchronous trading produce similar results to OLS estimates of market model parameters.
Third, autocorrelation and cross-sectional dependence in the time-series of mean daily excess
returns may be a concern, and the adjustment of the variance estimate to account for these
issues may be necessary. However, Brown and Warner (1985) find that only in special cases
is it necessary to adjust the variance estimates to account for these issues.
In an event study, it is important to identify the exact date of the event. Since initiation
announcements of share repurchases must be publicly disclosed as soon as possible after the
decision by the Board of Directors to utilize the authorization, the exact date of the event is
23
If the returns in the cross-section of securities are independent and identically distributed, the distribution of
the sample mean return will increasingly approximate a normal distribution according to the Central Limit
Theorem.
)1( 12
,
2
1
j
j
SAR
SCAR
2
1 1
1
1
4
2
N
j j
j
N
j
j
L
L
SCAR
z
14
easily identified. To accommodate for announcements after the Exchange’s trading hours, a 2
day event window (0 to +1) is used to analyze the market reaction.
5.2. Measuring abnormal returns on share repurchase days
To test whether repurchase trading causes a price impact, the AR is measured on the actual
repurchase days. To measure the price impact surrounding the first repurchase day in a
repurchase program, the market model - described in section 5.1 - is used as a benchmark.
The market model specification is, however, not suitable to estimate the AR for all repurchase
days in the sample since the estimation windows will overlap the events. The market-adjusted
model, which does not require any pre-event estimations, is therefore used as benchmark. The
market adjusted model is:
(8)
where ARi,t is the AR on security i over calendar day t, Ri,t is the total return on security i over
calendar day t, and Rm,t is the total return on an equal-weighted index of all shares listed on
the SSE over calendar day t.24
ARs are indexed with the sequence number of the repurchase day in each repurchase
program with the first repurchase day in each repurchase program j at τ=1. The average AR
over repurchase day τ, across all repurchase programs is:
(9)
where ARj,τ is the AR over repurchase day τ in repurchase program j, and N is the number of
share repurchase programs.
The test statistic used to evaluate the significance of the average AR each repurchase day τ,
is the ratio of the average AR across repurchase programs, to its standard deviation:
(10)
24
The return on the value-weighted OMXSPI is also used as Rm in the estimations and results.
N
AR
AR
N
j
j
1
,
)(
AR
ARt
tmtiti RRAR ,,,

15
where σ(ARτ) is the standard deviation of the ARs on repurchase day τ across repurchase
programs.25
If the ARs each repurchase day τ are independent and identically distributed, and
normal, the test statistic is distributed Student-t under the null hypothesis.26
5.3. Measuring long-run abnormal performance following initiation announcements of
open market share repurchase programs
To measure the long-run abnormal performance following the initiation announcements of
open market share repurchase programs, Ibbotson’s (1975) Returns Across Time and
Securities (RATS) methodology and the calendar-time portfolio approach advocated by Fama
(1998) and Mitchell and Stafford (2000) are used.27
In the RATS approach, security excess returns are regressed, each month in the event-time,
on the three Fama-French (1993) factors and the additional momentum factor advocated by
Carhart (1997). The estimated intercept represents the monthly average AR for each event
month τ with the month of the initiation announcement indexed zero (τ=0). ARs 6 months
prior to the initiation announcement up to 24 months following the initiation announcement
are considered in the analysis.28
The following cross-sectional regressions are run each event
month:
(11)
(12)
where Ri,t is the monthly total return on security i in the calendar month t that corresponds to
the event month τ, with τ=0 being the month of the share repurchase initiation announcement.
Rf,t is the return on the 3 month T-bill and MKTt is the monthly market return on the value-
weighted OMXSPI stock index adjusted for the 3 month T-bill rate in the calendar month t
that corresponds to the event month τ. HMLt, SMBt and MOMt are the returns on the book-to-
market, size and momentum factor, respectively in calendar month t. The returns on the book-
25
To control for the potential risk of variance changes in the returns surrounding the repurchase transactions, a t-
statistic based on the cross-sectional standard deviation of the abnormal returns is used instead of a t-statistic
based on the times-series standard deviation of the abnormal returns. 26
Since the repurchase days are spread out within the repurchase programs and over the years, there is no
adjustment for cross-sectional dependence in the abnormal returns. Brown and Warner (1985) also argue that if
the degree of dependence is small, ignoring the dependence induces little bias in the variance estimates. 27
The buy-and-hold methodology is not used in the study because imperfect expected returns from bad-models
are compounded with long horizons and because the methodology suffers from the cross-sectional dependence
of the individual firms’ abnormal returns, as argued by Fama (1998) and Mitchell and Stafford (2000). 28
Returns are truncated for June 2010 and the post-event period is truncated if the firm initiates a subsequent
repurchase program. Observations in the six event-months prior to the initiation announcement are excluded if
they overlap with event-months in a firm’s prior repurchase program.
titttttfti
tittttfti
MOMmHMLhSMBsMKTRR
HMLhSMBsMKTRR
,,,
,,,
16
to-market and size factor are calculated as in Fama-French (1993).29
All firms listed on the
SSE are ranked on market capitalization at the end of December each year from 1999 to 2009.
The median market capitalization is then used to split the firms into two groups - small (S)
and big (B). All firms listed on the SSE are also ranked on book-to-market equity values and
split into the bottom 30% (L), the middle 40% (M) and the top 30% (H). From the
intersections of the two market capitalization groups and the three book-to-market equity
groups, six portfolios are constructed. The SMB factor is the difference, each month, between
the simple average of the returns on the three small-stock portfolios (S/L, S/M and S/H) and
the simple average of the returns on the three big-stock portfolios (B/L, B/M and B/H).30
The
HML factor is the difference, each month, between the simple average of the returns on the
two high book-to-market equity portfolios (S/H and B/H) and the simple average of the
returns on the two low book-to-market equity portfolios (S/L and B/L).31
The momentum
factor, MOM, is the difference between the equal-weighted average return of firms with the
highest 30% 11 month returns minus the equal-weighted average of firms with the lowest
30% 11 month returns as in Carhart (1997).
The CAR over different time-event windows is calculated in the analysis. The t-statistic for
the CAR is the CAR divided by the square root of the sum of squares of the monthly standard
errors over the event-time period. The advantage of the RATS methodology is that it accounts
for any changes in riskiness of the equity over the event window and the drawback of the
method is that the estimators are not minimum variance because the disturbances (εi,t) are
heteroscedastic, caused by the differing risk parameters and σ2(εi,t) that correspond to the
different securities in the regression. To alleviate this issue, portfolios are formed using the
calendar-time portfolio approach advocated by Fama (1998) and Mitchell and Stafford
(2000).32
In the calendar-time portfolio approach, portfolios of event firms are formed each
calendar month. Firms that have initiated an open market share repurchase program are
included in the portfolio the calendar month after the announcement month, and excluded
from the portfolio after a 12 or 24 month holding period. At the beginning of each calendar
month, the portfolio is rebalanced so that the portfolio is equally weighted. Excess returns are
29
With the exception that Fama and French (1993) rank the firms on size in June each year. In this study, the
firms are ranked on size in December each year. 30
According to Fama and French (1993), the SMB factor is meant to mimic the risk factor in returns related to
firm size. 31
According to Fama and French (1993), the HML factor is meant to mimic the risk factor in returns related to
book-to-market equity. 32
The calendar-time portfolio approach was originally used by Jaffe (1974) and Mandelker (1974).

17
regressed on the three Fama-French (1993) factors as well as on the four Carhart (1997)
factors, as follows:
(13)
(14)
where Rp,t is the monthly return on the equally-weighted portfolio of event firms in calendar
month t. The other variables are defined as above. By forming portfolios of event firms, any
cross-sectional dependence of the individual event firm ARs are accounted for in the portfolio
variance at each point in calendar time. At least 10 firms are required in the event portfolio
each point in time to mitigate the heteroscedasticity problem from changing the number of
firms in the event portfolio through time.
6. Empirical results
The empirical results are separated into three parts. In the first part in section 6.1, the price
impact surrounding initiation announcements of share repurchase programs is evaluated. In
the second part, in section 6.2, the price impact of the actual share repurchases is examined. In
the third and final part, in section 6.3, the long-run stock performance following the initiation
announcements is examined.
6.1. Price impact of initiation announcements of open market share repurchase
programs
Figure 1 illustrates the average CAR around the initiation announcement of open market share
repurchase programs. The CAR begins 20 trading days before the initiation announcement
and continues until 20 trading days after the announcement. The daily AR for each firm is the
total daily return in excess of the return estimated by the market model. The parameters of the
market model are calculated over days -270 to -21 relative to the announcement day. The
sample comprises 126 initiation announcements, with no other price affecting information on
tptptptptpptftp
tptptptpptftp
MOMmHMLhSMBsMKTRR
HMLhSMBsMKTRR
,,,
,,,

18
the same day or the trading day prior to the announcement day over the period March 2000 to
March 2010.33
Figure 1 shows that announcements of open market share repurchase programs are, on
average, preceded by a period of negative abnormal performance, and that there is a
significant positive price impact of the repurchase announcement with a possible
overreaction. In the post-event period, the excess return appears to disappear. This result is
similar to the findings reported by several prior studies examining repurchase announcements
in other markets and time periods, e.g., Vermaelen (1981), Comment and Jarrell (1991),
Ikenberry et al. (1995), and Hatakeda and Isagawa (2004).
Figure 1
Illustration of the average cumulative CAR around the initiation announcements of open market share
repurchase programs
The figure illustrates the average CAR in percent surrounding the initiation announcements of open market share
repurchase programs by Swedish firms listed on the SSE. The sample includes 126 initiation announcements
with no other price affecting information on the same day or the trading day prior to the announcement over the
period March 2000 to March 2010. The CAR is the accumulated average AR from 20 trading days before the
initiation announcement until 20 trading days afterwards. The ARs are measured with the market model as
benchmark. The parameters of the market model are calculated over days -270 to -21 relative to the initiation
announcement.
33
80 announcements are excluded because they are on the same day or the day after an interim report. Another 4
announcements are also excluded due to other coincident confounding news or due to a short return history for
estimating market model parameters.
-2.50%
-2.00%
-1.50%
-1.00%
-0.50%
0.00%
0.50%
-20 -18 -16 -14 -12 -10 -8 -6 -4 -2 0 2 4 6 8 10 12 14 16 18 20
Trading day relative to announcement day

19
In Table 3, the average CAR with t-statistics is reported for the different event windows
around the share repurchase initiation announcement. For the full sample there is a
significantly negative average CAR during the 20 trading days prior to the initiation
announcement of -1.83% (t-statistic of -2.27), which suggests that the initiation
announcement is triggered by a period of share price underperformance. The average 2 day
AR around the initiation announcement is 1.94% (from day 0 to +1) and statistically
significant at the 1% level (t-statistic of 7.61). This is consistent with the 2 day AR of 2.39%
reported by Peyer and Vermaelen (2009) for the US market over the period 1991 to 2001, and
the 2 day AR of 2.15% reported by Hatakeda and Isagawa (2004) for the Japanese market
over the period 1995 to 1998. In the period following the repurchase announcement (from day
+2 to +20), the cumulative average AR is not significantly different from zero (t-statistic of -
0.67) for the whole sample.
Table 3
Abnormal returns surrounding the initiation announcements of open market share repurchase programs
Trading days relative to announcement day
-20 to -1 0 to +1 +2 to +20
n CAR t-statistic CAR t-statistic CAR t-statistic
Full sample 126 -1.83**
-2.27 1.94***
7.61 -0.53
-0.67
Fraction sought
Less than 5% 54 -1.47
-1.23 1.50***
3.96 -3.24***
-2.77
5 to 10% 72 -2.10*
-1.92 2.28***
6.69 1.50
1.40
The table reports the average CAR in percent surrounding the initiation announcements of open market share
repurchase programs by Swedish firms listed on the SSE. The sample includes 126 initiation announcements
with no other price affecting information on the same day or the trading day prior to the announcement over the
period March 2000 to March 2010. The ARs are measured with the market model as a benchmark. The
parameters of the market model are calculated over days -270 to -21 relative to the initiation announcement. ARs
are reported for the full sample and stratified by the fraction of the total numbers of shares sought in the
initiation announcement. *, ** and *** indicate two-tailed significance levels of 10%, 5% and 1%, respectively.
In Table 3, the sample is split by the fraction of the total number of shares that the
company sought in the initiation announcement.34
The average 2 day AR for companies that
sought less than 5% of the shares is 1.50%, and for companies that sought 5% or more of the
shares the AR is 2.28%. This result is consistent with the findings of Comment and Jarrell
(1991) and Ikenberry et al. (1995), who find that larger repurchase programs are received
more favorably by the market. In the post-announcement period (from day +2 to +20), the
34
Most firms state the maximum number of shares that the firm intends to repurchase in the initiation
announcement of the share repurchase program.
20
cumulative average AR is -3.24% and significantly negative for the smaller repurchase
programs and not significantly different from zero for the larger programs.
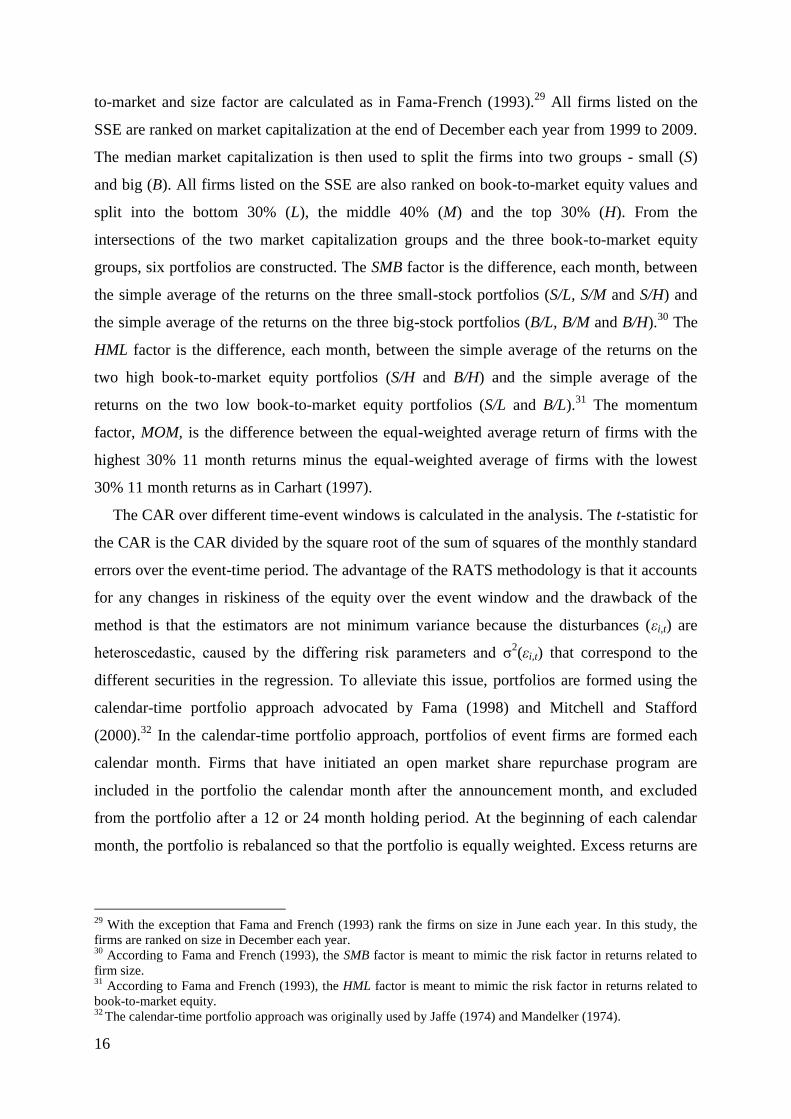
Table 4 reports the average CAR around the initiation announcement of open market share
repurchase programs stratified by the reason for the repurchase programs stated in the
announcement. The reasons are classified according to the following five categories:
1. Capital structure: Adjustment of the capital structure or distribution of excess cash.
2. ESOP: Provide shares for ESOPs or convertibles.
3. Acquisitions: Use of the repurchased shares in acquisitions.
4. Key ratios: Improve the firm’s key ratios or avoid the dilution of shares.
5. Good investment: The stock is a good investment.
Table 4
Frequency distribution and announcement returns of open market share repurchase programs stratified
by the stated reason for the repurchase program
Reason stated in the share repurchase initiation announcement
Number of reasons per
announcement Capital structure ESOP Acquisitions Key ratios Good investment
1 48 25 5 4 5
2 23 5 15 6 1
3 12 12 13 2 0
Total 83 42 33 12 6
CAR (-20, -1) -2.57**
-2.24 -2.15
0.94
-1.89
(-2.49)
(-1.68)
(-1.34)
(0.44)
(-0.57)
CAR (0, +1) 2.60***
0.86**
2.50***
1.97**
3.09**
(7.96)
(2.04)
(4.92)
(2.90)
(2.95)
CAR (+2, +20) 0.18
-3.27**
-1.52
3.13
2.23
(0.18) (-2.52)
(-0.97)
(1.49)
(0.69)
The table reports the frequency distribution and announcement returns of open market share repurchase
programs stratified by the stated reason for the repurchase program. One announcement might refer to several
reasons. The sample includes 126 initiation announcements with no other price affecting information on the
same day or the trading day prior to the announcement over the period March 2000 to March 2010. The reasons
for the repurchase programs are classified into the following categories:
Capital structure: Adjustment of the capital structure or distribution of excess cash.
ESOP: Provide shares for ESOPs or convertibles.
Acquisitions: Use of the repurchased shares in acquisitions.
Key ratios: Improve the firm’s key ratios or avoid the dilution of shares.
Good investment: The stock is a good investment.
The ARs are measured with the market model as a benchmark. The parameters of the market model are
calculated over days -270 to -21 relative to the initiation announcement. CARs are reported for various event
windows surrounding the initiation announcement (t-statistics in parentheses). ** and *** denote two-tailed
significance levels of 5% and 1%, respectively.
21
Multiple reasons are often cited in the repurchase announcements and the frequency with
which one particular reason is stated together with any of the other four reasons is, therefore,
also reported. For example, in 83 announcements “Capital structure” was stated as a reason
for the repurchase program; however, only 48 announcements state “Capital structure” as the
sole reason for the repurchase program.
Interestingly, share repurchase programs motivated by an ESOP experience a smaller
market reaction around the initiation announcement of the repurchase program than programs
with other stated reasons. The excess return around the initiation announcement of a share
repurchase program motivated by an ESOP is 0.86% and is consistent with the option-funding
hypothesis in Kahle (2002), which predicts that the announcement return of repurchase
programs initiated to fund employee stock option exercises should not be as positive as if the
repurchase were due to undervaluation or as a method to mitigate agency costs. Share
repurchase programs motivated by ESOPs also experience a significantly negative post-
announcement return with a cumulative average AR of -3.27%.
To further analyze the price impact around the initiation announcement of open market
share repurchase programs the 2 day AR over days 0 to 1 is regressed relative to firm and
repurchase program characteristics that previous studies have found to be significantly related
to the initial market reaction to repurchase program announcements. The following cross-
sectional regression with the 2 day AR as the dependent variable is run:
(15)
where CARi is the 2 day cumulative AR over days 0 to 1 relative to repurchase announcement
i. SIZEi is the natural log market capitalization and BMi is the book-to-market equity value of
the firm with the repurchase announcement i at the end of the prior year. SOUGHTi is the
stated maximum fraction of the firm’s total number of shares that the company intends to
repurchase or keep as treasury shares in initiation announcement i. PRECARi is the
cumulative AR from trading day -20 to trading day -1 relative to announcement i. ESOPi is a
dummy variable coded as 1 if at least one motivation for the repurchase program in the
announcement i is that the repurchased shares are for an ESOP, and zero otherwise.
Table 5 shows the results from the regression. The coefficient of firm size (SIZE) is
significantly negative, which implies that the initial market reaction to the announcement of a
share repurchase programs decreases with firm size. If firm size is a proxy for informational
asymmetry, the result is consistent with the signaling hypothesis in which the repurchase
iiiiiii ESOPPRECARSOUGHTBMSIZECAR 54321

22
announcement serves as a signal from the more informed managers that the firm is
undervalued. If the informational asymmetry is higher for smaller firms, then the market
reaction to repurchase announcements made by smaller firms should be more favorable than
for larger firms.35
Table 5
Regression results of the initial market reaction to open market share repurchase program
announcements
Dependent variable
CAR (0, +1)
Independent variable Coefficient t-statistic
Intercept 0.1335***
3.63
SIZE -0.0050***
-3.38
BM -0.0011
-0.19
SOUGHT 0.0154
0.18
PRECAR -0.0718**
-2.10
ESOP -0.0119*
-1.82
Adjusted R2
0.10
Number of obs. 126
The table reports regression results from the following regression:
iiiiiii ESOPPRECARSOUGHTBMSIZECAR 54321
where CARi is the 2 day CAR over trading days 0 to 1 relative to the day of the initiation announcement i. SIZEi
is the natural log market capitalization and BMi is the book-to-market equity value of the firm with the initiation
announcement i at the end of the prior year. SOUGHTi is the stated maximum fraction of the firm’s total number
of shares that the firm intends to repurchase or keep as treasury shares in initiation announcement i. PRECARi is
the CAR from 20 trading days before the initiation announcement i until 1 trading day before. ESOPi is a dummy
variable coded as 1 if at least one stated reason for the repurchase program in the initiation announcement i is
that the repurchased shares are for an ESOP, and zero otherwise. The standard errors of the coefficients have
been adjusted for heteroscedasticity using White’s (1980) procedure. *, ** and *** indicate two-tailed
significance levels of 10%, 5%, and 1%, respectively.
The book-to-market equity value (BM) is commonly used as a proxy for growth
opportunities, but sometimes also for undervaluation. Firms with relatively high book-to-
market equity values are then considered undervalued and, therefore, more likely to have
undervaluation as their primary motivation for share repurchases. A positive relationship
between the initial market reaction to share repurchase announcements and the book-to-
market equity value is thus expected. However, in the regression, the coefficient of the book-
to-market equity variable (BM) is not significantly different from 0. This result is consistent
35
Smaller firms are less frequently followed by analysts and the media and are therefore subject to higher
information asymmetries than larger firms.

23
with the findings in Ikenberry et al. (1995), which find no indication that the book-to-market
ratio has any impact on the market reaction to repurchase announcements.
Comment and Jarell (1991) and Ikenberry et al. (1995) find that the announcement return
is positively related to the maximum number of shares sought in the initiation announcement,
presumably because a relatively large sought fraction is a stronger signal of undervaluation.
However, the results show that the fraction of shares that the firm intends to repurchase in the
initiation announcement (SOUGHT) does not explain the initial market reaction to the
announcement of a share repurchase program. This is not surprising, since 48% of the
initiation announcements in the sample are for the maximum allowed repurchase size of 10%
and as such there is little variation in the SOUGHT variable to account for any variation in the
AR.
In the analysis of the cumulative average AR around the initiation announcements (Table
3), the average CAR was significantly negative in the pre-announcement period (trading day -
20 to -1 relative to the announcement). To control for any mean-reversion effect arising from
the negative AR in the pre-announcement period, a variable for the CAR over days -20 to -1
relative to the announcement (PRECAR) is included in the regression. The coefficient of the
PRECAR variable is significantly negative, which implies that there is a negative relationship
between the market reaction to the initiation announcement and the pre-announcement
CAR.36
Kahle (2002) argues that if companies repurchase shares to fund employee stock option
exercises then, in an efficient market, the repurchase announcement return should not be as
positive as if the repurchases were due to undervaluation (the option-funding hypothesis). In
the regression, a dummy variable is therefore included (i.e., ESOP). The variable is coded as 1
if any of the stated reasons in the initiation announcement is for an ESOP and zero otherwise.
The coefficient of the ESOP variable is significantly negative and therefore consistent with
Kahle’s (2002) option-funding hypothesis.
6.2. Price impact of actual share repurchases
In this section, the short-term price effect of actual share repurchases in open market share
repurchase programs is examined. If repurchasing firms have market timing capability and
repurchases shares when the shares are temporarily undervalued, then other traders will find it
36
Comment and Jarrell (1991), Ikenberry et al. (1995), and Hatakeda and Isagawa (2004) also find a negative
relationship between the abnormal return in the pre-announcement period and the announcement effect.

24
valuable to identify repurchase trades. A permanent positive price impact is, therefore,
expected when other market participants detect that a company repurchases shares.37
Alternatively, the submission of buy limit orders by repurchasing firms may result in a
temporary price impact.
The initial sample of actual share repurchases covers 9,624 repurchase events over the
period March 2000 to April 2009 in 312 share repurchase programs initiated by 121 Swedish
firms listed on the SSE. At first, the price performance around the first repurchase day in
share repurchase programs is examined using a similar event study methodology as described
in section 5.1. Figure 2 illustrates the average CAR from 10 trading days before to 10 trading
days after the first repurchase in 245 open market share repurchase programs.38
Figure 2 Average CAR surrounding the first repurchase day in open market share repurchase programs
The figure shows the average CAR surrounding the first repurchase day in 245 open market share repurchase
programs initiated over the period March 2000 to March 2009 by Swedish firms listed on the SSE. The CAR is
the accumulated average AR from 10 trading days before the first repurchase day until 10 trading days
afterwards. The ARs are measured with the market model as a benchmark. The parameters of the market model
are calculated over trading days -270 to -21 relative to the first repurchase day. Observations the same day or the
day after an interim report are excluded from the sample.
37
Firms that repurchase shares on the Stockholm Stock Exchange must publicly disclose their repurchase
transactions as soon as possible and not later than 30 minutes before the opening of the stock exchange the
following trading day. Repurchase volumes each repurchase day are also often quite substantial. Market
participants are therefore often able to identify repurchase trades with ease. 38
From the initial sample, I exclude repurchase programs in which the first repurchase transaction in the
program is on the same day or the day after an interim report. I also exclude five repurchase programs with too
short a history to estimate the parameters in the market model.
-0.40%
-0.20%
0.00%
0.20%
0.40%
0.60%
0.80%
-10 -9 -8 -7 -6 -5 -4 -3 -2 -1 0 1 2 3 4 5 6 7 8 9 10
Trading day relative to first repurchase day in repurchase program

25
The pre-event excess return seems stable, which indicates that firms do not as a rule time
the beginning of their repurchase trades to a period of prior underperformance. On the first
repurchase day and the following three days, there is a strong positive price impact. After a
reversal in the ARs later in the post-event period, the prices seem to stabilize on a higher level
than in the pre-event period. These results are consistent with a signaling hypothesis of
undervaluation, but also with a hypothesis of a liquidity-driven price impact, since there is a
small degree of reversal in the post-event period.
In Table 6, the average CAR and their t-statistics for the different event windows are
reported. The sample is also stratified by the stated reason for the share repurchase program in
the initiation announcement. For the full sample, the pre-event AR from day -10 to day -1
relative to the first repurchase day is not significantly different from zero. The average AR
over days 0 to +1 is 0.74% and significantly positive, with a t-statistic of 3.98. Over the post-
event period, the average AR is not significantly different from zero. The permanent and
significantly positive price impact is consistent with an undervaluation signaling hypothesis in
which the first repurchase transaction in the repurchase program signals that the shares are
undervalued. However, the price impact is not as large as the price impact of initiation
announcements.
Table 6
The abnormal return surrounding the first repurchase day in open market share repurchase programs
Trading days relative to the first repurchase day in the repurchase
program
-10 to -1 0 to +1 +2 to +10
n CAR t-statistic CAR t-statistic CAR t-statistic
Full sample 245 -0.20
-0.49 0.74***
3.98 -0.13
-0.32
Motivation
Capital structure 177 -0.36
-0.73 0.89***
4.07 0.15
0.32
ESOP 74 -0.43
-0.59 0.40
1.21 -0.49
-0.71
Acquisitions 69 -0.65
-0.77 0.32
0.85 0.49
0.61
Key ratios 31 0.87
0.76 0.03
0.05 1.51
1.38
Good investment 14 0.87
0.47 0.17
0.21 1.12
0.64
The table reports the CAR in percent surrounding the first repurchase day in 245 open market share repurchase
programs initiated over the period March 2000 to March 2009. ARs are reported for the full sample and stratified
by the stated reason for the share repurchase program. The definitions of the stated reasons are found in table 4.
The ARs are measured with the market model as a benchmark. The parameters of the market model are
calculated over trading days -270 to -21 relative to the first repurchase day. Observations on the same day or the
day after an interim report are excluded from the sample. *, ** and *** indicate two-tailed significance levels of
10%, 5% and 1%, respectively.

26
When the sample is split by the stated reason for the share repurchase program, the price
impact on the first repurchase day is positive for all programs, whatever the stated reason for
the program in the initiation announcement. However, the AR is only significantly positive
for repurchase programs that are motivated by capital structure adjustments or excess cash
distributions. For these programs, the 2 day AR over day 0 to +1 is on average 0.89% with a t-
statistic of 4.07.
If the first repurchase trade in a repurchase program is a valuable signal of undervaluation,
subsequent repurchase days are expected to have less signaling value. Table 7 reports the
average AR for each of the first ten repurchase days in a repurchase program and also for all
repurchase days in the sample. The market-adjusted model with the equal- or value-weighted
market return as a benchmark is used to estimate the AR.39
The average AR for all repurchase
days in the sample is 0.12%, with the equal-weighed market return index as a benchmark. It is
worthwhile to note that repurchasing firms repurchase almost one third (31.8%) of the total
traded volume each repurchase day. The persistent submission of buy limit orders from the
repurchasing firms would likely support the share price temporarily.
Table 7
Abnormal return on repurchase days
EW benchmark VW benchmark Rep. fraction
tot. trad. vol. Repurchase day N AR t-statistic AR t-statistic
1 250 0.70***
4.20 0.64***
3.79 42.0%
2 259 0.38***
2.74 0.40***
2.85 36.0%
3 238 0.40***
3.15 0.45***
3.31 34.7%
4 230 -0.04
-0.26 0.01
0.06 33.0%
5 225 0.07
0.53 0.11
0.68 33.1%
6 214 0.33**
2.08 0.26
1.60 31.9%
7 206 -0.21
-1.41 -0.21
-1.30 31.8%
8 199 0.21
1.42 0.22
1.47 30.3%
9 200 0.29**
1.97 0.39**
2.30 32.9%
10 189 -0.01 -0.08 -0.03
-0.18 30.8%
All 9,375 0.12***
5.72 0.15***
6.43 31.8%
The table shows the average ARs in percent on repurchase days over the period March 2000 to April 2009 in 311
repurchase programs initiated by 120 firms. The AR in the EW Benchmark column is the total stock return
minus the equal-weighted return of all shares listed on the SSE. The AR in the VW Benchmark column is the
total stock return minus the return on the value-weighted OMXSPI representing all shares listed on the SSE. The
table also reports the average repurchase fraction of the total daily trading volume in the share. Repurchase
events the same day or the day after an interim report are excluded from the sample as well as repurchase events
September 11-12, 2001. ** and *** denote two-tailed significance levels of 5% and 1%, respectively.
39
I have five more “first repurchase day” observations in Table 7 than I have in Table 6, since five observations
are dropped in Table 6 due to a too short return history for calculating market model normal returns. The market-
adjusted model used in Table 7 to calculate normal returns does not require any historical returns.

27
Table 7 also shows that the first repurchase day in a repurchase program has the greatest
price impact, which indicates - as predicted - that the first repurchase in a repurchase program
has the most valuable signal. The average repurchase fraction is, however, relatively higher
(42.0%) on the first repurchase day than on the other reported repurchase days; thus, the
larger price impact on the first repurchase day may be due to a liquidity effect.
Table 8
Firm fixed effects regression on AR on repurchase days
Dependent variable
AR (EW benchmark) AR (VW benchmark)
Independent variable Coefficient t-statistic Coefficient t-statistic
Intercept 0.0001
0.31 0.0003
0.67
REPFRAC 0.0026**
1.92
0.0030**
2.22
FIRST 0.0071***
3.99 0.0062***
3.52
TENDAYS 0.0028
1.56 0.0030
1.61
Adjusted R2
0.0064 0.0039
Number of firms 120 120
Number of obs. 9,375 9,375
The table reports regression results from the following firm fixed effects regression:
jijijijiiji TENDAYSFIRSTREPFRACAR ,,3,2,1,
where ARi,j is the AR for firm i on repurchase day j. The AR is calculated using the market-adjusted model with
the equal-weighted return of all shares on the SSE (EW benchmark) and the value-weighted OMXSPI (VW
benchmark) as benchmarks, respectively. REPFRACi,j is the fraction of the total number of traded shares that
firm i repurchases on day j. FIRSTi,j is a dummy variable coded as 1 if the repurchase day j is the first repurchase
day in the repurchase program initiated by firm i, zero otherwise. TENDAYSi is a dummy variable coded as 1 if
there are 10 or more trading days between the repurchase day j and the prior repurchase day in the repurchase
program initiated by firm i. The sample includes repurchase days over the period March 2000 to April 2009 in
311 repurchase programs initiated by 120 firms. Repurchase events the same day or the day after an interim
report are excluded from the sample as well as repurchase events September 11-12, 2001. Estimation is done
with firm fixed effects and standard errors adjusted for group-wise heteroscedasticity. *, ** and *** indicate
two-tailed significance levels of 10%, 5% and 1%, respectively.
To analyze the ARs on the actual repurchase days more in detail, the following firm fixed
effects regression is run:
(16)
where ARi,j is the AR for firm i on repurchase day j. The AR is calculated using the market-
adjusted model with the equal-weighted return of all shares on the SSE and the value-
weighted OMXSPI as benchmarks, respectively. REPFRACi,j is the fraction of the total
number of traded shares that firm i repurchase on day j. FIRSTi,j is a dummy variable coded as
jijijijiiji TENDAYSFIRSTREPFRACAR ,,3,2,1,

28
1 if the repurchase day j is the first repurchase day in the repurchase program initiated by firm
i, zero otherwise. TENDAYSi is a dummy variable coded as 1 if there are 10 or more trading
days between the repurchase day j and the prior repurchase day in the repurchase program
initiated by firm i.
In Table 8, the results from the firm fixed effects regression are reported. The coefficient
of the repurchase size variable REPFRAC is positive and statistically significant at the 5%
level, which indicates a positive association between the repurchase fraction and the AR. As
noted earlier in the univariate analysis, the first repurchase in a repurchase program is, on
average, greeted with the largest AR. A dummy variable FIRST coded as 1 if the repurchase is
the first in a repurchase program - zero otherwise - is therefore included. The coefficient of
the FIRST variable is positive and highly significant, even though the repurchase fraction is
controlled for. Finally, a dummy variable TENDAYS coded as 1 if there are at least 10 non-
repurchasing days before the repurchase - zero otherwise - is included. The coefficient of the
variable is positive. However, it is not statistically different from zero at any conventional
levels.
Figure 3 Monthly average CAR surrounding open market share repurchase initiation announcements
The figure plots the monthly average CAR from 6 months before the initiation announcement until 24 months
afterwards. ARs are calculated each event month using Ibbotson’s (1975) RATS methodology and applying the
Carhart (1997) four-factor model.
-2%
0%
2%
4%
6%
8%
10%
12%
14%
-6 -5 -4 -3 -2 -1 0 1 2 3 4 5 6 7 8 9 10 11 12 13 14 15 16 17 18 19 20 21 22 23 24
Month relative to announcement month

29
6.3. Long-run stock performance of repurchasing firms
Figure 3 illustrates the monthly average CAR 6 months prior to and up to 24 months
following the initiation announcements. The figure shows that firms that initiate repurchase
programs tend to perform abnormally well on average during the announcement month and
for the first year following the initiation announcement.40
During the second year following
the initiation announcement, the abnormal performance seems to subside.
In Table 9, the ARs for each month during the first year following the initiation
announcement and the average CAR for six time periods are reported.41
The ARs for each
event month are calculated using Ibbotson’s (1975) RATS methodology, applying both the
Fama-French (1993) three-factor model and the Carhart (1997) four-factor model.
Stock performance in the half-year prior to the initiation announcement is slightly positive,
with a CAR of 1.78% relative to the Carhart (1997) model specification. This indicates that
firms do not on average time the initiation announcement to a prior period of share price
underperformance, as found in, e.g., Ikenberry et al (2000) and Yook (2010). In the month of
the initiation announcement (event month 0), the average AR is approximately 2.1% and
statistically significant at the 1% level. The average AR in the month of the initiation
announcement is thus similar to the 2 day AR of 1.94% around the initiation announcement
found in section 6.1. In the first year following the initiation announcement (event months +1,
+12), the average CAR is approximately 7% and statistically significant at the 1% level. This
result is similar to the 12 month CAR of 7.27% found by Ikenberry et al. (2000) in a sample
of 1,060 Canadian repurchase programs between 1989 and 1997, but higher than the first year
CAR of 2.67% found by Peyer and Vermaelen (2009) in the US market over the period 1991-
2001.42
Interestingly, the major part of the abnormal performance is concentrated during
months 7 to 12 following the initiation announcement. In the same time period, the fraction of
firms that actually repurchase shares declines. This pattern is consistent with the market
timing hypothesis, which suggests that managers repurchase shares in response to
undervaluation. The results are also similar to Ikenberry et al. (2000), who find that abnormal
performance decreases in periods where firms were active buyers. However, in contrast to
40
The monthly abnormal returns in the figure are calculated using Ibbotson’s (1975) RATS methodology and
applying the Carhart (1997) four-factor model. 41
Since historical returns are truncated June 2010 and the post-event period is truncated if the firm initiates a
subsequent repurchase program, the number of observations decreases each event month following the initiation
announcement. 42
Ikenberry et al. (2000) and Peyer and Vermaelen (2009) found these results using Ibbotson’s (1975) RATS
methodology and applying the Fama-French (1993) three-factor model.

30
Table 9
Long-run performance following initiation announcements of open market share repurchase programs
estimated with Ibbotson’s (1975) RATS methodology
Fraction
rep. firms
Fama-French (1993) Carhart (1997)
Event month n AR t-statistic AR t-statistic
0 231 70.6% 2.15***
3.65 2.05***
3.46
+1 229 66.8% 0.44
0.78 0.43
0.76
+2 224 46.4% -0.28
-0.52 -0.20
-0.37
+3 222 37.8% 0.52
0.91 0.33
0.55
+4 218 33.9% 0.47
0.84 0.23
0.42
+5 207 30.4% -0.52
-0.80 -0.27
-0.41
+6 204 28.4% 0.87
1.29 0.86
1.23
+7 200 23.0% 1.12*
1.65 1.20*
1.78
+8 187 13.9% 1.44**
1.93 1.61**
2.19
+9 180 14.4% 0.89 1.26 1.09*
1.61
+10 174 13.2% 1.60**
2.61 1.63**
2.48
+11 162 8.6% 0.05
0.10 0.02
0.04
+12 121 0.8% 0.67 0.75 0.49
0.54
Event months CAR t-statistic CAR t-statistic
(-6, -1) 2.35*
1.77 1.78 1.33
(+1, +6) 1.51
1.03 1.39
0.93
(+7, +12) 5.78***
3.36 6.04***
3.50
(+1, +12) 7.29***
3.23 7.43***
3.26
(+1, +24) 8.12*
1.86 9.21**
2.03
(+13, +24) 0.83
0.22 1.78 0.45
The table reports monthly AR and CAR in percent following initiation announcements of open market share
repurchase programs over the period March 2000 to June 2010. ARs are calculated each event month using
Ibbotson’s (1975) RATS methodology and applying the Fama-French (1993) three-factor model (i) and the
Carhart (1997) four-factor model (ii):
titttttfti
tittttfti
MOMmHMLhSMBsMKTRRii
HMLhSMBsMKTRRi
,,,
,,,
)(
)(
where Ri,t is the monthly total return on security i and Rf.t is the return on the 3 month T-bill in the calendar
month t that corresponds to event month τ. MKTt is the monthly market return on the value-weighted OMXSPI
stock index adjusted for the 3 month T-bill rate in the calendar month t that corresponds to event month τ. SMBt,
HMLt and MOMt are the returns on the size, book-to-market, and momentum factor, respectively, in calendar
month t that corresponds to event month τ. The returns on the size and book-to-market factors are calculated as
in Fama-French (1993), using all shares listed on the SSE, but with a size ranking at the end of December each
year. The return on the momentum factor is calculated as in Carhart (1997) using all of the shares listed on the
SSE. Using Ibbotson’s (1975) RATS method, ατ is the AR in event month τ. Event month 0 is the month of the
initiation announcement. CAR is the ARs cumulated over different event-time periods. The t-statistic of the CAR
is the CAR divided with the square root of the sum of squares of the monthly standard errors during the event-
time period. The table also reports the number (n) of sample firms each event month and the fraction of sample
firms that repurchase shares each event month. *, ** and *** indicate two-tailed significance levels of 10%, 5%
and 1%, respectively.

31
Ikenberry et al. (1995, 2000) and Peyer and Vermaelen (2009), no further AR is found
following the first year after the initiation announcement.43
To eliminate any possible dependence between observations within calendar months,
Ibbotson (1975) selected at random one event per calendar month. As a robustness check, this
procedure is followed and one observation is randomly selected per calendar month. The
results are omitted for the sake of brevity, but they are qualitatively similar to the average
CARs reported in Table 9.
As an alternative to Ibbotson’s (1975) RATS methodology, to estimate long-run abnormal
performance, a calendar-time portfolio approach advocated by Fama (1998) and Mitchell and
Stafford (2000) is also applied. The results of the calendar-time portfolio approach are
reported in Table 10 for a sample of 231 initiation announcements of open market share
repurchase programs over the period May 2000 to June 2010.44
In the calendar-time portfolio approach, a portfolio is formed each calendar month
consisting of firms that had an initiation announcement of a share repurchase program in a
certain period relative to a given calendar month. Monthly average ARs of the event portfolio
are measured relative to both the three-factor Fama-French (1993) model and the four-factor
Carhart (1997) model. Table 10 reports the results of the regression of equally-weighted
repurchase portfolio returns for three holding periods - event months 1-12, event months 1-24
and event months 13-24 - relative to the initiation announcement month (month 0).
The monthly average AR for the one year holding period following the initiation
announcement is 0.53% (t-statistic of 2.19) with the Fama-French (1993) model specification
and 0.52% (t-statistic of 2.27) with the four-factor Carhart (1997) model specification. These
results translate to an annual AR of approximately 6% that match the first year average CAR
of 7% obtained using Ibbotson’s (1975) RATS methodology in Table 9. For holding periods
up to 2 years following the initiation announcement, the monthly average AR decreases to
0.41% (t-statistic of 1.98) with the Carhart (1997) model specification. The AR performance
thus seems to decline during the second year following initiation announcements of open
market share repurchase programs. The portfolios of firms included 13 months following the
initiation announcement and dropped 12 months later show no ARs. This finding also
matches the insignificant cumulative average AR during the second year obtained using
43
Because event-months following repurchase programs are not permitted to overlap with event months in
subsequent repurchase programs, the number of observations in the event-months following the initiation
announcement decreases. Due to the relatively small sample, the abnormal performance is only examined up to
24 months following the initiation announcement. 44
Our first calendar-month is May 2000, since at least 10 firms are required in the portfolio to reduce the
idiosyncratic risk of the portfolio.

32
Ibbotson’s (1975) RATS methodology. In summary, a positive abnormal stock performance is
found over the first year following the initiation announcement, regardless of the
methodology employed.
Table 10
Long-run performance following initiation announcements of share repurchase programs estimated with
the calendar-time portfolio approach
Holding period
months 1-12
Holding period
months 1-24
Holding period
months 13-24
Coefficient t-statistic Coefficient t-statistic Coefficient t-statistic
Panel A: Fama-French (1993)
Intercept (αp) 0.53**
2.09 0.44**
1.95 0.07 0.20
MKT 0.88***
13.54 0.90***
16.95 1.00***
19.00
SMB 0.29***
3.84 0.37***
6.13 0.57***
7.33
HML 0.41***
4.83 0.42***
6.10 0.42***
5.24
R
2 0.78 0.82 0.83
Number of obs.
108 121 92
Panel B: Carhart (1997)
Intercept (αp) 0.52**
2.27 0.41**
1.98 0.06 0.20
MKT 0.97***
12.55 0.97***
15.45 1.01***
15.40
SMB 0.35***
4.31 0.42***
6.26 0.57***
7.12
HML 0.38***
4.22 0.39***
5.39 0.42***
5.02
MOM 0.11***
2.69 0.09**
2.39 0.15
0.36
R
2 0.79 0.83 0.83
Number of obs.
108 121 92
The table reports monthly average ARs in percent of equal-weighted calendar-time portfolios over the period
May 2000 to June 2010. Using the calendar-time portfolio approach, excess returns of the event portfolio are
measured relative to the three-factor Fama-French (1993) model (i) and the four-factor Carhart (1997) model (ii):
tptptptptpptftp
tptptptpptftp
MOMmHMLhSMBsMKTRRii
HMLhSMBsMKTRRi
,,,
,,,
)(
)(
where Rp,t is the monthly total return on the equal-weighted portfolio of event firms and Rf,t is the return on the 3
month T-bill in calendar month t. MKTt is the monthly market return on the value-weighted OMXSPI stock
index adjusted for the 3 month T-bill rate in calendar month t. SMBt, HMLt and MOMt are the returns on the
size, book-to-market and momentum factor, respectively, in calendar month t. The returns on the size and book-
to-market factors are calculated as in Fama-French (1993), using all of the shares listed on the SSE, but with a
size ranking at the end of December each year. The return on the momentum factor is calculated as in Carhart
(1997), using all of the shares listed on the SSE. The intercept, αp, measures the average monthly AR on
portfolios of event firms in percent. Equal-weighted portfolios of firms that have initiated an open market share
repurchase program within the previous 12 or 24 months are formed each calendar month. Equal-weighted
portfolios of firms in which firms are included 13 months following the initiation announcement and dropped 12
months later (holding period 13-24) are also formed. Panel A shows the results with the three-factor Fama-
French (1993) model as a benchmark and Panel B shows the results with the four-factor Carhart (1997) model as
a benchmark. Only calendar months with a minimum of 10 stocks in the portfolio are included in the regression
(5 firms over months 13-24). The standard errors of the coefficients have been adjusted for heteroscedasticity
using White’s (1980) procedure. ** and *** indicate two-tailed significance levels of 5% and 1%, respectively.

33
Table 11
Long-run performance surrounding announcements of share repurchase programs conditional upon a
fraction of the total number of shares bought in the program
Holding period
months -6 to -1
Holding period
months 1 to12
Coefficient t-statistic Coefficient t-statistic
Panel A: Bought up to 2% of the total number of shares
Intercept (αp) 1.01*
1.91 0.24
0.86
RMRF 1.14***
14.75 0.92***
13.14
SMB 0.32*
1.92 0.26***
2.70
HML 0.25**
2.60 0.37***
3.69
MOM 0.17***
2.94 0.06 0.89
R2
0.74 0.76
Number of obs.
60 102
Panel B: Bought more than 2% of the total number of shares
Intercept (αp) 0.13
0.34 0.75**
2.42
RMRF 0.96***
11.03 1.08***
14.62
SMB 0.40***
3.50 0.53***
4.99
HML 0.50***
6.36 0.40***
4.55
MOM 0.04
0.34 0.16**
4.22
R
2 0.70 0.76
Number of obs.
46 90
The table reports monthly average ARs in percent of equal-weighted calendar-time portfolios over the period
May 2000 to June 2010. Portfolios are formed in calendar time and conditional upon the fraction of outstanding
shares bought in the program. Using the calendar-time portfolio approach, excess returns of the event portfolio
are measured relative to the four-factor Carhart (1997) model:
tptptptptpptftp MOMmHMLhSMBsMKTRR ,,,
where Rp,t is the monthly total return on the equal-weighted portfolio of event firms and Rf,t is the return on the 3
month T-bill in calendar month t. MKTt is the monthly market return on the value-weighted OMXSPI stock
index adjusted for the 3 month T-bill rate in the calendar month t. SMBt, HMLt and MOMt are the returns on the
size, book-to-market, and momentum factor, respectively, in month t. The returns on the size and book-to-market
factors are calculated as in Fama-French (1993) using all of the shares listed on the SSE, but with a size ranking
at the end of December each year. The return on the momentum factor is calculated as in Carhart (1997) using all
of the shares listed on the SSE. The intercept, αp, measures the average monthly AR on portfolios of event firms
in percent. Only calendar months with a minimum of 5 stocks in the portfolio are included in the regression. The
standard errors of the coefficients have been adjusted for heteroscedasticity using White’s (1980) procedure. **
and *** indicate two-tailed significance levels of 5% and 1%, respectively.
Table 11 reports the long-run abnormal performance surrounding initiation announcements
of share repurchase programs conditional upon the fraction of total number of shares bought
in the programs. The repurchase programs are separated into two groups - repurchase
programs in which less than 2% of the total number of shares have been bought and programs
in which more than 2% of the total number of shares have been bought. The ARs are

34
estimated with the calendar-time portfolio approach over the 6 months prior to the initiation
announcement and over the 12 months following the initiation announcement.45
In the 6
month period prior to the initiation announcement, there is no significant AR for programs
with a repurchased fraction of more than 2% of the total number of shares. However,
programs with a repurchased fraction of less than 2% of the total number of shares are
preceded by an average monthly AR of 1.01% (t-statistic of 1.91).
Over the 12 months following the initiation announcement, there is also a difference in
ARs between the two groups. Interestingly, only when firms have repurchased more than 2%
of the total number of shares is there a positive and significant AR over the 12 months
following the initiation announcement. The average monthly return is 0.75% and statistically
significant at the 5% level (t-statistic of 2.42). The average monthly AR corresponds to an AR
of 9% on an annual basis. This result suggests that the long-run AR following repurchase
initiation announcements is positively associated with the fraction of shares bought in the
program.
7. Conclusion
This study examines the price impact of open market share repurchases in Sweden, which has
a unique disclosure environment for repurchase announcements and actual share repurchases.
As in other countries within the EU, a share repurchase program has to be authorized by the
shareholders at a general meeting in Sweden. However, and in contrast to most other
countries in Europe, companies must announce when they intend to utilize the repurchase
authorization (initiation announcements). In addition, they have to disclose their repurchase
activities on a daily basis. These unique disclosure requirements of share repurchases enable a
detailed analysis of the price impact of share repurchases.
The purpose of this study is to examine the stock price behavior surrounding initiation
announcements, the price impact of repurchase trading, and the long-run abnormal stock
performance following the initiation announcements. The study uses a detailed data set of
open market share repurchase programs initiated between March 2000 and March 2010 by
Swedish firms listed on the SSE.
The results show that initiation announcements are associated with a 2 day AR of 1.94%.
This is similar to the announcement effect found in prior US studies (e.g., Comment and
45
As a robustness check, the abnormal returns are also estimated with Ibbotson’s (1975) RATS methodology.
The results are qualitatively the same.

35
Jarell, 1991; Stephens and Weisbach, 1998; Ikenberry et al., 1995; Grullon and Michaely,
2004; and Peyer and Vermaelen, 2005). The positive AR indicates that initiation
announcements of open market share repurchases are perceived by market participants as a
signal of undervaluation. Interestingly, the announcement effect is lower for repurchase
programs motivated by stock option plans, which is consistent with the hypothesis that
programs motivated by stock option plans are not driven by a perceived undervaluation of a
firm’s shares.
The price impact on the actual repurchase days is positively correlated with the daily
repurchase volume, and is both statistically and economically significant during the first 3
repurchase days in a repurchase program. These results indicate that repurchase trading
provides price support and that the market detects and perceives the first repurchase days in a
repurchase program as a signal of undervaluation.
Finally, using Ibbotson’s (1975) RATS methodology and the calendar-time portfolio
approach, a positive and significant 12 month AR of approximately 6-7% is found subsequent
to the initiation announcement.

36
References
Brown, S.J., Warner, J.B., 1980. Measuring security price performance, Journal of Financial
Economics 8, 205-258
Brown, S.J., Warner, J.B., 1985. Using daily stock returns: the case of event studies, Journal
of Financial Economics 14, 205-258.
Barber, B.M., Lyon, J.D., 1997. Detecting long-run abnormal stock returns: the empirical
power and specification of test statistics, Journal of Financial Economics 43, 341-372.
Brav, A., Graham, J.R., Harvey, C.R., Michaely, R., 2005. Payout policy in the21st century,
Journal of Financial Economics 77, 483-527.
Brockman, P., Chung, D.Y., 2001. Managerial timing and corporate liquidity: evidence from
actual share repurchases, Journal of Financial Economics 61, 417-448.
Carhart, M.M., 1997. On persistence in mutual fund performance, Journal of Finance 52, 57-
72.
Chan, K., Ikenberry, D., Lee, I, 2004. Economic sources of gain in stock repurchases, Journal
of Financial and Quantitative Analysis 39, 461-479.
Comment, R., Jarrell, G.A., 1991. The relative signaling power of Dutch-auction and fixed-
price self-tender offers and open-market share repurchases, Journal of Finance 46, 1243-
1271.
Cook, D.O., Krigman, L., Leach, C.J., 2003. An analysis of SEC guidelines for executing
open market repurchases, Journal of Business 76, 289-315.
Cook, D.O., Krigman, L., Leach, C.J., 2004. On the timing and execution of open market
repurchases, Review of Financial Studies 17, 463-498.
Dann, L.Y., 1981. Common stock repurchases: an analysis of returns on bondholders and
stockholders, Journal of Financial Economics 9, 113-138.
Fama, E.F., 1998. Market efficiency, long-term returns, and behavioral finance, Journal of
Financial Economics 49, 283-306.
Fama, E.F., French, K.R., 1993. Common risk factors in the returns on stocks and bonds,
Journal of Financial Economics 43, 3-56.
Fama, E.F., Fisher, L., Jensen, M., Roll, R., 1969. The adjustment of stock prices to new
information, International Economic Review 10, 1-21.
Grullon. G., Michaely, R., 2004. The information content of share repurchase programs,
Journal of Finance 59, 651–680.
Hatakeda, T., Isagawa, N., 2004. Stock price behavior surrounding stock repurchase
announcements: evidence from Japan, Pacific-Basin Finance Journal 12, 271-290.
Ibbotson, R.G., 1975. Price performance of common stock new issues, Journal of Financial
Economics 2, 235-272.
Ikenberry, D., Vermaelen T., 1996. The option to repurchase stock, Financial Management
25, 9-24.
Ikenberry, D., Lakonishok, J., Vermaelen, T., 1995. Market under reaction to open market
share repurchases, Journal of Financial Economics 39, 181–208.
Ikenberry, D., Lakonishok, J., Vermaelen T., 2000. Stock repurchases in Canada:
performance and strategic trading, Journal of Finance 55, 2373-2398.
Jagannathan, M., Stephens, C., 2003. Motives for multiple open-market repurchase programs,
Financial Management 32, 71-91.
Jaffe, J., 1974. Special information and insider trading, Journal of Business 47, 411-428.
Kahle, K.M., 2002. When a buyback isn’t a buyback: open market repurchases and employee
options, Journal of Financial Economics 63, 235-261.

37
Keswani, A., Yang, J., Young, S., 2007. Do share buyback provide support? Evidence from
mandatory non-trading periods, Journal of Business Finance and Accounting 34, 840-860.
Lasfer, M.A., 2002. The market valuation of share repurchases in Europe, Working paper,
City University Business School.
MacKinlay, C.A., 1997. Event studies and finance, Journal of Economic Literature 35, 13-39.
Mandelker, G., 1974. Risk and return: the case of merging firms, Journal of Financial
Economics 1, 303-335.
McNally, W., Smith, B.F., 2007. Long-run returns following open market share repurchases,
Journal of Banking and Finance 31, 703-717.
McNally, W., Smith, B.F., Barnes, T., 2006. The price impact of open market repurchase
trades, Journal of Business Finance and Accounting 33, 735-752.
Mitchell, M.L., Stafford, E., 2000. Managerial decisions and long-term stock price
performance, Journal of Business 73, 287-329.
Patell, J., 1976. Corporate forecasts of earnings per share and stock price behavior: empirical
test, Journal of Accounting Research 14, 246-276.
Peyer, U., Vermaelen, T., 2005. The many facets of privately negotiated share repurchases,
Journal of Financial Economics 75, 361-395.
Peyer, U., Vermaelen, T., 2009. The nature and persistence of buyback anomalies, Review of
Financial Studies 22, 1693-1745.
Rau, R., Vermaelen, T., 2002. Regulation, taxes and share repurchases in the United
Kingdom, Journal of Business 75, 245-282.
Scholes, M., Williams, J., 1977. Estimating betas from nonsynchronous data, Journal of
Financial Economics 5, 309-328.
Skeltorp, J.A., 2004. The market impact and timing of open market share repurchases in
Norway, Working paper 2004/8, Norges bank.
Stephens, C.P., Weisbach, M.S., 1998. Actual share re-acquisitions in open-market repurchase
programs. Journal of Finance 53, 313–333.
Vermaelen, T., 1981. Common stock repurchases and market signaling, Journal of Financial
Economics 9, 139–183.
Vermaelen, T., 2005. Share repurchases, Foundations and Trends in Finance, Vol. 1, No. 3.
Yook, K.C., 2010. Long-run stock performance following stock repurchases, The Quarterly
Review of Economics and Finance 50, 323-331.
Zhang, H., 2002. Share repurchases under the commercial law 212-2 in Japan: Market
reaction and actual implementation, Pacific-Basin Finance Journal 10, 287-305.
Zhang, H., 2005. Share price performance following actual share repurchases, Journal of
Banking and Finance 29, 1887-1901.
White, H., 1980. A heteroscedasticity-consistent covariance matrix estimator and a direct test
for heteroscedasticity, Econometrica 48, 817-838.