esrp532 lect 1 introfeql.wsu.edu/esrp532/esrp532 lect 1 intro.pdfes/rp 532 applied environmental...
TRANSCRIPT
ES/RP 532 Applied Environmental Toxicology
ESRP532 Lect 1 Intro.doc
Page 1 of 15
August 30, 2004
Lecture 1 Chemical Technology; Environmental Chemodynamics; Toxicodynamics
I. Course IntroductionA. InstructorB. Synopsis & SyllabusC. Evaluation system
II. Chemical Technology (statistics & graphs from Chemical & Engineering News, vol. 82 (27),2004, http://pubs.acs.org/subscribe/journals/cen/82/i27/toc/toc_i27.html , and earlier issues)A. Trends in Production
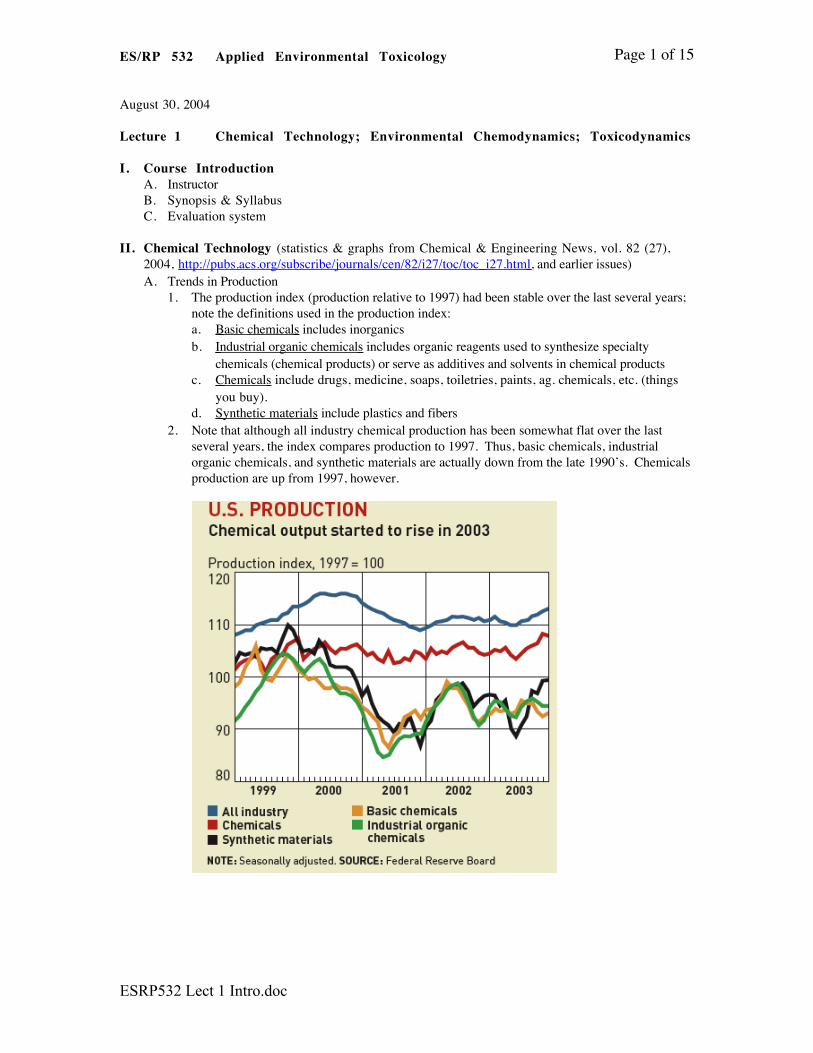
1. The production index (production relative to 1997) had been stable over the last several years;note the definitions used in the production index:a. Basic chemicals includes inorganicsb. Industrial organic chemicals includes organic reagents used to synthesize specialty
chemicals (chemical products) or serve as additives and solvents in chemical productsc. Chemicals include drugs, medicine, soaps, toiletries, paints, ag. chemicals, etc. (things
you buy).d. Synthetic materials include plastics and fibers
2. Note that although all industry chemical production has been somewhat flat over the lastseveral years, the index compares production to 1997. Thus, basic chemicals, industrialorganic chemicals, and synthetic materials are actually down from the late 1990’s. Chemicalsproduction are up from 1997, however.

ES/RP 532 Applied Environmental Toxicology
ESRP532 Lect 1 Intro.doc
Page 2 of 15
3. Note in the graph above that global output of chemicals is up substantially from 1997,indicating that rapidly developing countries like those in Asia (especially China) are nowmajor contributors to the “load” of manufactured/processed chemicals and materials.
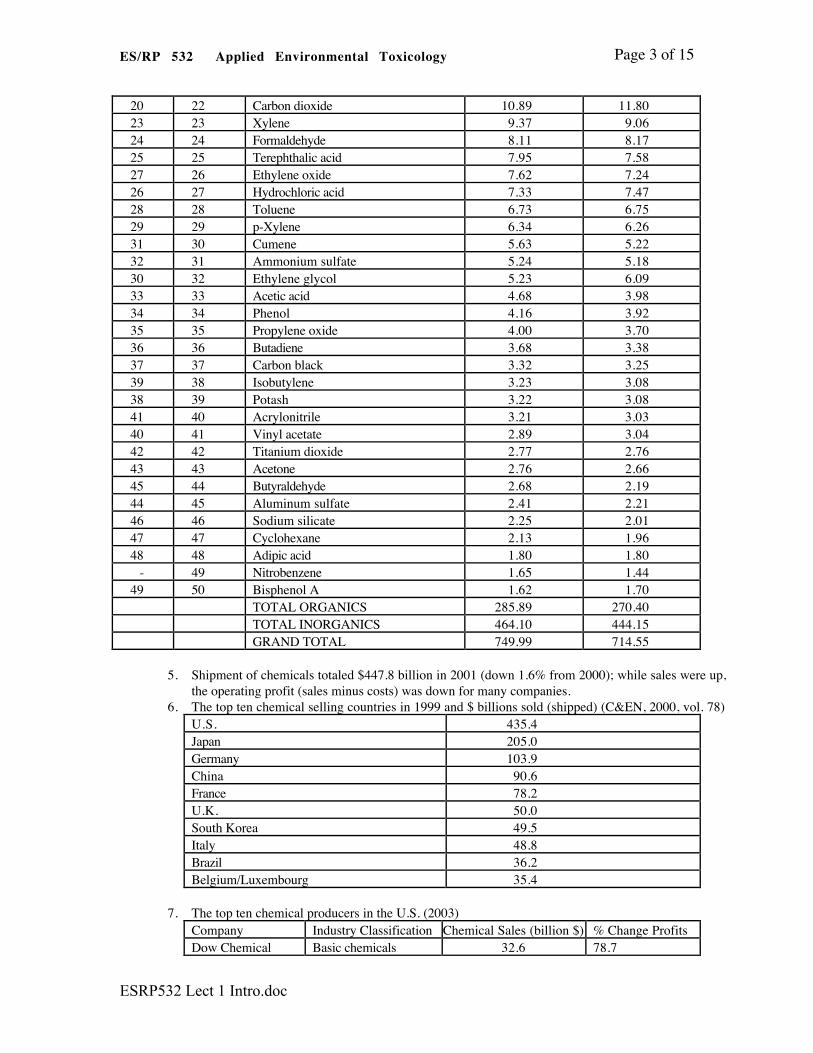
4. The top chemical produced in the U.S. was sulfuric acid (95.4 x 10⁹) lbs in 1995; for allchemicals, 750 x 109 lbs were produced in 1994. Note that these statistics were not updatedafter the 1995 fiscal year because the U.S. government stopped collecting such data(C&Enews, 1994, 74 :38).
TOP 50 CHEMICALS: Production in 1994 & 1995Rank Rank Billions of lbs Billions of lbs1 9 9 5 1 9 9 4 Chemical 1 9 9 5 1 9 9 4
1 1 Sulfuric acid 95.36 89.632 2 Nitrogen 68.04 63.913 3 Oxygen 53.48 50.084 4 Ethylene 46.97 44.605 5 Lime 41.23 38.376 6 Ammonia 35.60 34.517 7 Phosphoric acid 26.19 25.588 8 Sodium hydroxide 26.19 25.11
10 9 Propylene 25.69 23.949 10 Chlorine 25.09 24.37
11 11 Sodium carbonate 22.28 20.5618 12 Methyl tert-butyl ether 17.62 13.6114 13 Ethylene dichloride 17.26 16.7612 14 Nitric acid 17.24 17.2213 15 Ammonium nitrate 15.99 17.0316 16 Benzene 15.97 15.2715 17 Urea 15.59 15.9017 18 Vinyl chloride 14.98 13.8522 19 Ethylbenzene 13.66 10.7621 20 Styrene 11.39 11.2919 21 Methanol 11.29 12.18
ES/RP 532 Applied Environmental Toxicology
ESRP532 Lect 1 Intro.doc
Page 3 of 15
20 22 Carbon dioxide 10.89 11.8023 23 Xylene 9.37 9.0624 24 Formaldehyde 8.11 8.1725 25 Terephthalic acid 7.95 7.5827 26 Ethylene oxide 7.62 7.2426 27 Hydrochloric acid 7.33 7.4728 28 Toluene 6.73 6.7529 29 p-Xylene 6.34 6.2631 30 Cumene 5.63 5.2232 31 Ammonium sulfate 5.24 5.1830 32 Ethylene glycol 5.23 6.0933 33 Acetic acid 4.68 3.9834 34 Phenol 4.16 3.9235 35 Propylene oxide 4.00 3.7036 36 Butadiene 3.68 3.3837 37 Carbon black 3.32 3.2539 38 Isobutylene 3.23 3.0838 39 Potash 3.22 3.0841 40 Acrylonitrile 3.21 3.0340 41 Vinyl acetate 2.89 3.0442 42 Titanium dioxide 2.77 2.7643 43 Acetone 2.76 2.6645 44 Butyraldehyde 2.68 2.1944 45 Aluminum sulfate 2.41 2.2146 46 Sodium silicate 2.25 2.0147 47 Cyclohexane 2.13 1.9648 48 Adipic acid 1.80 1.80
- 49 Nitrobenzene 1.65 1.4449 50 Bisphenol A 1.62 1.70
TOTAL ORGANICS 285.89 270.40TOTAL INORGANICS 464.10 444.15GRAND TOTAL 749.99 714.55
5. Shipment of chemicals totaled $447.8 billion in 2001 (down 1.6% from 2000); while sales were up,the operating profit (sales minus costs) was down for many companies.
6. The top ten chemical selling countries in 1999 and $ billions sold (shipped) (C&EN, 2000, vol. 78)U.S. 435.4Japan 205.0Germany 103.9China 90.6France 78.2U.K. 50.0South Korea 49.5Italy 48.8Brazil 36.2Belgium/Luxembourg 35.4
7. The top ten chemical producers in the U.S. (2003)Company Industry Classification Chemical Sales (billion $) % Change ProfitsDow Chemical Basic chemicals 32.6 78.7

ES/RP 532 Applied Environmental Toxicology
ESRP532 Lect 1 Intro.doc
Page 4 of 15
DuPont Diversified chemicals 30.2 Data not availableExxon-Mobil Petroleum 20.2 72.5General Electric Diversified chemicals 8.4 -28.6Chevron Phillips Petroleum 8.4 85.4Huntsman Corp. Basic chemicals 7.0 Data not availablePPG Industries Diversified chemicals 6.6 28.8Equistar Chemicals Basic chemicals, polymers 6.5 Net lossAir Products Gases, intermediates 6.1 -20.2Eastman Chemical Diversified chemicals 5.8 4.7
8. Investment in capital spending (as % of sales) in 2003 was slightly up (2.2%) from theprevious year but about the same in total dollars as 10 years ago. Investments in R&D roseslightly in 2003 (0.1%) but was about the same in total dollars as 10 years ago.
9. Productivity was up slightly in 2003 for the chemical industry but unit labor costs also increased.
a. The chemical industry employed about 908 thousand people during 2003, which represents a dropof 2.1% from 2002.
b. The chemical industry has continued to be a strong employer of scientists and engineers, but jobprospects are poorer than during the 1990’s.
10. The effects of regulations on production can be seen with manufacture of chloroflurocarbons, which arebeing phased out in accord with worldwide agreement (known as the Montreal Protocol) to protectstratospheric ozone.a. For chlorofluorocarbons, 1995 was the last year of legal U.S. production for U.S. use under the
Clean Air Act and the Montreal Protocol on Substances That Deplete the Ozone Layer. CFC-22production fell 14% in 1995 and CFC-12 production dropped 57%. Note that production of CFC-11 was nearly nil by 1994. CFCs are now being replaced by HCFCs (i.e., less chlorinatedmaterial with more hydrogen).
B. Trends in Demand (graphics from Chem. Eng. News, June 24, 2002, http://pubs.acs.org/cen )
ES/RP 532 Applied Environmental Toxicology
ESRP532 Lect 1 Intro.doc
Page 5 of 15
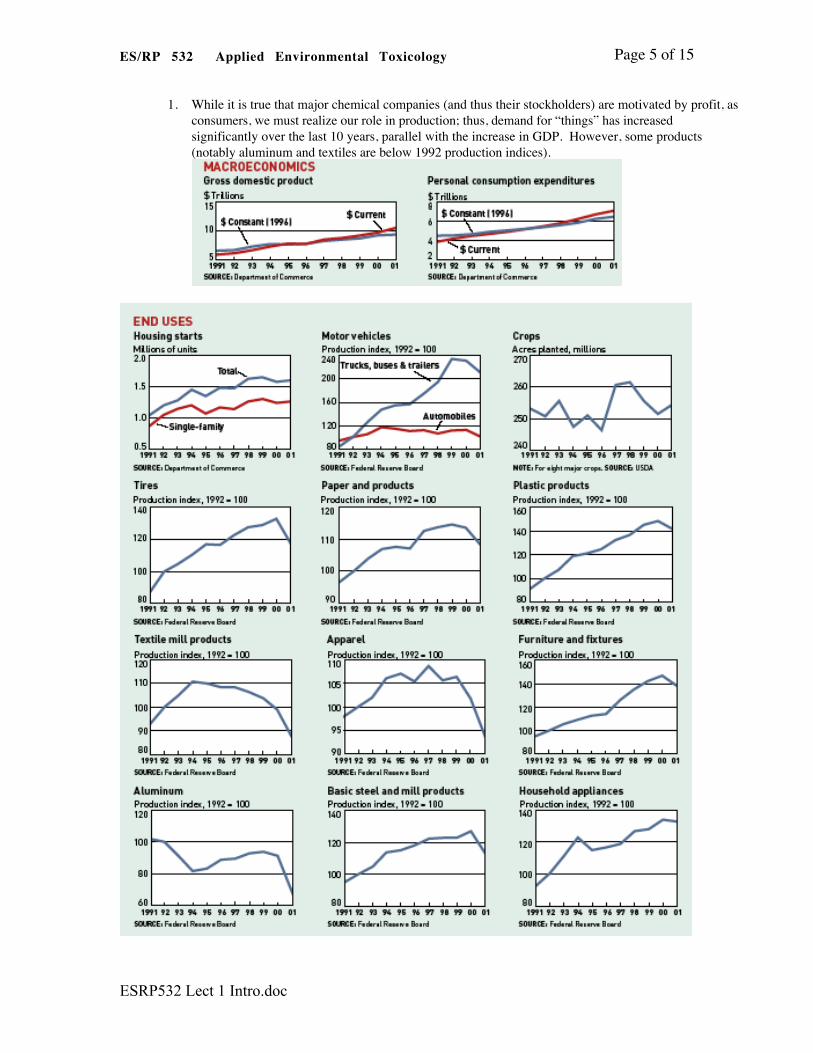
1. While it is true that major chemical companies (and thus their stockholders) are motivated by profit, asconsumers, we must realize our role in production; thus, demand for “things” has increasedsignificantly over the last 10 years, parallel with the increase in GDP. However, some products(notably aluminum and textiles are below 1992 production indices).

ES/RP 532 Applied Environmental Toxicology
ESRP532 Lect 1 Intro.doc
Page 6 of 15
2. Pesticide and fertilizer production and use over the last ten years has not risen much, showing that theperception of an ever-spiraling use of agricultural chemicals is lacking in substance. The year to yearvariation in pesticide and fertilizer use reflects acreage in production, commodity prices, and weather.
a. The production graph shows domestic production of separate pesticide groups (i.e., herbicides,insecticides, and fungicides; the total production graph includes nematicides and plant growthregulators and sales outside of the U.S.) (Based on Anonymous in Chemical & Engineering News1993, 1996, 1997, 1999)1. Note that herbicide production in 1995 was not too different from 1981 (first graph)
(a) The chemistry of the new herbicides requires substantially lower application rates per acrethan in 1981. Although the statistics in the graph below are somewhat dated, the trendsfrom today’s perspective are still stable to downward for total synthetic organic pesticideuse.1. Today, however, we see a lot more use of reduced risk pesticides, especially
biopesticides.2. Production efficiency of agriculture has been highly significant (USDA stats); for example,
(a) In 1910, 102 million acres of corn were harvested with a per acre yield of 27.9 bushels.(b) In 200, 72.7 million acres of corn were harvested with a per acre yield of 137.1 bushels.
3. The fertilizer graphs represent consumption (Based on Anonymous in Chemical & Engineering News1993, 1996, 1997, 2000)

ES/RP 532 Applied Environmental Toxicology
ESRP532 Lect 1 Intro.doc
Page 7 of 15
BBBBBB
BBBBBBBBBB
B
B
JJJJJJJJJJJJJJJJJ
J HHHHHHHHHHHHHHHHH
H
FFFFF
FFFFF
FFFF
FF
F
F
0
5000
19801982
19841986
19881990
19921994
19961998
2000
10000
15000
20000
25000
Nitrogen
Total Fertilizer
Potash (postassium)
Phosphate
Year
Fertilizer Consumption, Millions of Tons
C. Trends in Trade (Balance of Trade)1. The net value of U.S.chemical exports relative to imports has historically been positive, but recently
the trade balance has dropped along with a drop in the share of world chemical trade.
III. Contemporary & Historical Significance of High Chemical Productivity andEnvironmental ContaminationA. Spills are not uncommon as evidenced by the 30,000 spills per year reported to the National Response
Center1. Federal law requires reporting all soil and chemical spills, releases of nuclear material, chemical and
biological warfare agents, train derailments, and pipeline releases.
ES/RP 532 Applied Environmental Toxicology
ESRP532 Lect 1 Intro.doc
Page 8 of 15
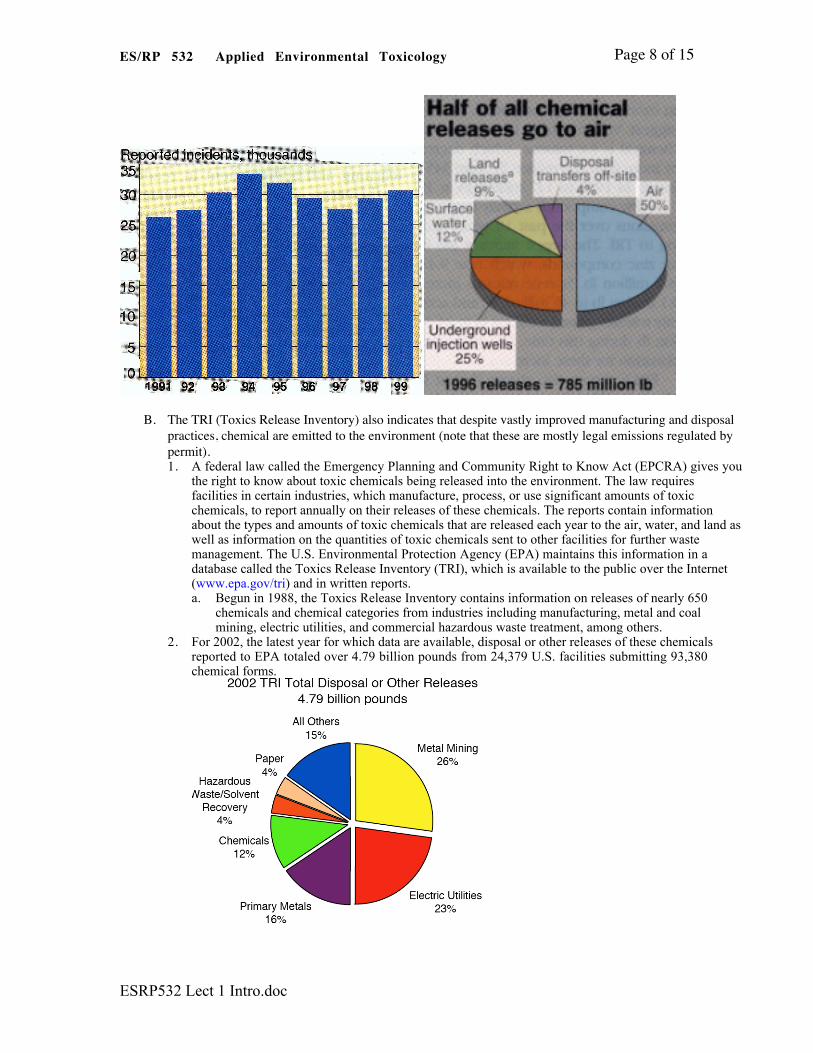
B. The TRI (Toxics Release Inventory) also indicates that despite vastly improved manufacturing and disposalpractices, chemical are emitted to the environment (note that these are mostly legal emissions regulated bypermit).1. A federal law called the Emergency Planning and Community Right to Know Act (EPCRA) gives you
the right to know about toxic chemicals being released into the environment. The law requiresfacilities in certain industries, which manufacture, process, or use significant amounts of toxicchemicals, to report annually on their releases of these chemicals. The reports contain informationabout the types and amounts of toxic chemicals that are released each year to the air, water, and land aswell as information on the quantities of toxic chemicals sent to other facilities for further wastemanagement. The U.S. Environmental Protection Agency (EPA) maintains this information in adatabase called the Toxics Release Inventory (TRI), which is available to the public over the Internet(www.epa.gov/tri) and in written reports.a. Begun in 1988, the Toxics Release Inventory contains information on releases of nearly 650
chemicals and chemical categories from industries including manufacturing, metal and coalmining, electric utilities, and commercial hazardous waste treatment, among others.
2. For 2002, the latest year for which data are available, disposal or other releases of these chemicalsreported to EPA totaled over 4.79 billion pounds from 24,379 U.S. facilities submitting 93,380chemical forms.

ES/RP 532 Applied Environmental Toxicology
ESRP532 Lect 1 Intro.doc
Page 9 of 15
3. PBTs (Persistent Bioaccumulative Toxins), although banned from manufacture according to UNagreements, may still be by-products of manufacturing processes, and in some cases include “naturalchemicals” (for example, metals, polyaromatic hydrocarbons, combusted derived chlorinated dioxins.The TRI shows that PBTs are accounted for in reported emissions.
C. Owing to the nature of some of the chemicals we had been using, there was a good correlation betweenproduction and sediment contamination in the Great Lakes1. (Eisenreich et al. 1989. The role of atmospheric deposition in organic contaminant cycling in the
Great Lakes. In D. Allen, Ed., Intermedia Pollutant Transport: Modelling and Field Measurements,Plenum, New York.--graph published in Schwarzenbach et al. 1993, Environmental OrganicChemistry)a.

ES/RP 532 Applied Environmental Toxicology
ESRP532 Lect 1 Intro.doc
Page 10 of 15
2. This information raises several questions:a. Are the trends for DDT & PCBs expected for all chemicals?b. What is the biological significance of environmental residues of any chemical?c. Can we predicts fate and exposure?
IV. Regulatory ConsiderationsA. What we know today about environmental chemistry and toxicology of contaminants has been pushed
forward by specific statutory Federal Laws that have evolved over the years. These laws in essenceproscribe chemical use and set environmental criteria for protection of human and ecological health
B. The oldest laws regulating chemicals are those pertaining to pesticides, namely the Federal InsecticideFungicide and Rodenticide Act (FIFRA, originally passed in 1947; evolved from the Insecticide Act of1910) and the Federal Food, Drug, and Cosmetic Act (FFDCA, originally passed in 1938; evolved from thePure Drug & Food Act)
C. Two laws regulate contaminants in water, the Safe Drinking Water Act (SDWA, recently amended, 1996),which pertains to potable water supplies, and the Clean Water Act (CWA, amended about two years ago),which affects navigable waters (i.e., not potable waters, but water used for fishing, swimming, navigation,etc.)
D. The Toxic Substances Control Act (TSCA) pertains to all chemical manufacturing (originally passed in1976)1. Section 5 provision of TSCA mandates that any manufacture of a new substance or any manufacture or
process of a substance for a significant new use requires notification of the EPA at least 90 days priorto manufacture or processing;a. Data must be submitted to show that manufacture, processing, distribution in commerce, use, and
disposal of the chemical substance or any combination of such activities will not present anunreasonable risk of injury to health or the environment.
2. Section 8 of TSCA mandates submission of lists of health and safety studies; a manufacturer mustsubmit any information about the substance to the EPA that indicates a substantial risk of injury tohealth or the environment
E. Clean Air Act (amended 1990)1. The original passage of the Clean Air Act in 1963 and amendments that followed addressed deteriorating
air quality from all perspectives: particulates, gaseous emissions, and hazardous substances2. The 1990 amendments were the most stringent; specific standards were set for nearly 200 “air toxics”
with the goal of substantial emission reductions

ES/RP 532 Applied Environmental Toxicology
ESRP532 Lect 1 Intro.doc
Page 11 of 15
F. Under the provisions of the Emergency Planning and Community Right to Know Act (EPCRA), theToxics Release Inventory (TRI) requires businesses to report an inventory of chemical releases (only certainchemicals are listed as reportable); however, the TRI allows the creation of an emission database that servesto not only track potentially hazardous substances released into the environment, but also to monitorchanges over the years in compliance and pollution prevention.
V. Theoretical Framework for Understanding (Predicting) Fate and Effects of Chemicals inthe EnvironmentA. Complexity of Chemical Behavior in the Environment
1. To acquire the capability of predicting the fate and effects of environmental contaminants, one mustunderstand literally all possible interactions between the chemical, the environment, and the biota. Asshown on the next page for just an aquatic system, the processes to study are quite numerous (figurefrom Schwarzenbach et al. 1993) .a. The task, however, has been made somewhat more approachable by a realization of how
thermodynamics and kinetics controls chemical fate; thus, a new theoretical paradigm has evolvedto help us understand environmental behavior of chemicals.
2. With the new paradigm, we can dispel the myth of a difference between natural and synthetic, for allchemicals behave in accordance with the “laws” of thermodynamics (direction and extent of change orreaction); changes in a system or reactions, however, could be fast or slow (kinetics).
B. Our goal is prediction of the potential for adverse effects; risk assessment is the process that allowspredictions and can be thought of as the information gathering phase involving direct experimentation ormodeling based on tested observations and principles.1. Predicting of adverse effects partly rests on the toxicological maxim--”Dose Makes the Poison”
a. Thus, biological effects are dependent on dose and exposure
Processes that determine the distribution, residence time, and sinks of ananthropogenic organic compound in a lake (Schwarzenbach et al. 1993, p. 4).
2. Environmental distribution determines potential for exposure3. Toxicological studies determine potential effects

ES/RP 532 Applied Environmental Toxicology
ESRP532 Lect 1 Intro.doc
Page 12 of 15
4. In summary, risk assessment includes four processes:a. Hazard identification (what are the significant toxicological endpoints)b. Dose-response characterization (at what dose do the endpoints appear)c. Exposure assessment (environmental chemistry)d. Risk characterization (probability of hazard occurring under certain set of circumstances; need
benchmark or standard of what is acceptable).C. Environmental Chemodynamics has developed as an interdisciplinary study of the relationship between
physicochemical properties and environmental behavior, and has brought us one step closer to adequatepredictions of chemical behavior and biological exposure.1. A holistic perspective
a. Viewing the biosphere as compartments with interfaces between all compartments1. exception: sediment at bottom of aquatic system does not interface directly with the
atmosphereb. The compartments are thought of as phases; knowing the magnitude of each phase would allow a
“back-of-the-envelope” calculation of concentrations of contaminants if one knew their totalemissions (from Haque and Freed 1974)1. air (atmosphere) [5.3 x 10¹⁸ kg]2. water (lithosphere) [1.3 x 10²¹ kg]3. soil (lithosphere) [to 6 inches = 1.1 x 10¹⁷ kg]4. biota
(a) plants [1.1 x 10¹⁵ kg](a) animals [2 x 10¹³ kg]
2. Focus areasa. Physicochemical properties
1. vapor pressure2. water solubility
b. Partitioning (phase transfer)1. air:water2. soil:water3. organic solvent:water4. organism:environmental phase
c. Attenuation (reactions: degradation, transformation)1. abiotic degradation/transformation2. biotic degradation/transformation
d. Transport (mass transfer)1. volatilization2. leaching3. runoff
e. Modeling1. deterministic (based on empiricism; i.e., observations)2. stochastic (inductive; based on mechanistic understanding and probability)
VI. Toxicodynamics (Pharmacodynamics) & Toxicokinetics (pharmacokinetics)A. Use of bioassays to measure toxicity defines the relationship between dose and response. Thus, we can
determine what dose might be safe, but as different chemicals have unique behaviors owing tothermodynamic & kinetic relationships, different species have different susceptibilities to toxicologicaleffects.
B. A theoretical framework is needed to predict toxicity (or at least the likely outcome of an exposure).Toxicodynamics serves in an analogous sense to environmental chemodynamics to help us approach theobjective of toxicity prediction or understand the potential biological responses following exposure;1. Organisms can be considered interfaced compartments that an absorbed chemical must partition across.
In any one compartment (usually considering a cell), transformation reactions occur. Input and outputis through the organ system.
C. Important Processes to Consider
ES/RP 532 Applied Environmental Toxicology
ESRP532 Lect 1 Intro.doc
Page 13 of 15
1. Absorption rate/amount2. Distribution3. Metabolism4. Excretion5. Target site interactions
VII. The Thermodynamic Perspective of Chemical BehaviorA. When we want to predict chemical behavior in the environment, we are essentially focusing on the final
chemical composition of a given system when no more net changes occur; at this point the system hasattained minimum energy, and the system is said to be in equilibrium.1. Thermodynamics is concerned with direction and extent of a reaction (i.e., chemical equilibria), but we
are also interested in pathways and time course of processes, which is described by chemical kinetics(the speed of a reaction).a. To illustrate the difference between thermodynamic considerations and kinetics consider two
environmental processes:1. Movement of a molecule from a dilute solution of water into the air immediately above the
water(a) The tendency to move from one phase or another is controlled by the expected equilibrium
of the molecules between the air and water; in this case the movement or phase transfer isreversible, but the overall direction of movement depends on how far the system is fromequilibrium (thermodynamics)
2. Biotransformation of a highly toxic molecule to a less toxic compound that can be excreted bycells(a) In this situation we would be interested in how quickly this process occurred (kinetics)
b. Thus, when two phases (or compartments) are not in equilibrium, thermodynamics tells whichdirection substances tend to diffuse to reach equilibrium1. Note that within a phase, a mass of substance moves or diffuses directionally because of
concentration differences in different parts of the phase;2. Substances move across interfaces between phases (i.e., they partition) because of tendency of
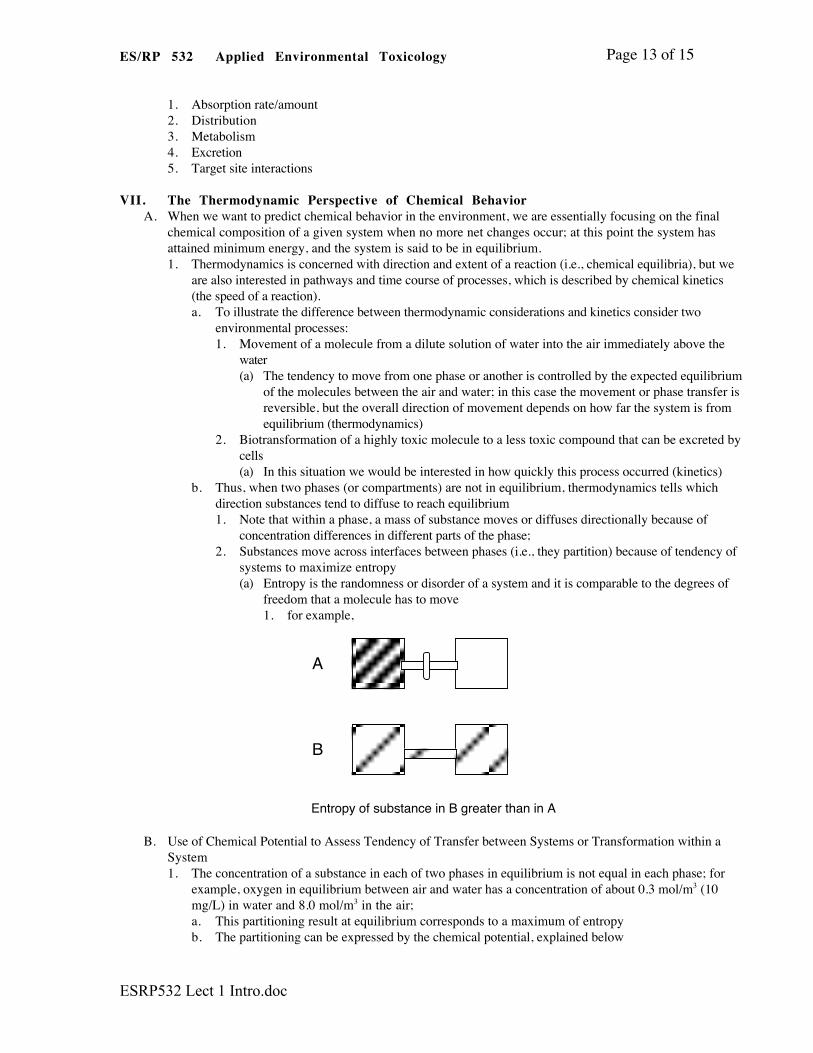
systems to maximize entropy(a) Entropy is the randomness or disorder of a system and it is comparable to the degrees of
freedom that a molecule has to move1. for example,
A
B
Entropy of substance in B greater than in A
B. Use of Chemical Potential to Assess Tendency of Transfer between Systems or Transformation within aSystem1. The concentration of a substance in each of two phases in equilibrium is not equal in each phase; for
example, oxygen in equilibrium between air and water has a concentration of about 0.3 mol/m3 (10mg/L) in water and 8.0 mol/m3 in the air;a. This partitioning result at equilibrium corresponds to a maximum of entropyb. The partitioning can be expressed by the chemical potential, explained below

ES/RP 532 Applied Environmental Toxicology
ESRP532 Lect 1 Intro.doc
Page 14 of 15
2. The average energy status of a group of i molecules is the total free energya. Each molecule has an internal energy resulting from its chemical bonds (i.e., bond vibrations,
flexations, and rotations)b. Each molecule has an external energy resulting from whole-molecule translations, orientation, and
especially interactions of the molecules with the surroundings (which can include other like and/ordifferent molecules)
c. The total free energy is expressed as the sum of the contributions from all of the differentcomponents in a system; the total free energy of a system can also be expressed as the sum ofchemical potentials of all the components in the system, as shown below
3. At a constant temperature (T), pressure (P), and composition, the free energy added to the system witheach added increment of i is referred to as the chemical potential (µi) of component i.a. G ( Total Free Energy ) = in
i∑ iµ where ni is the molar concentration of
component i in the system.b. Thus, chemical potential changes as a function of the abundance of componentsc. Chemical equilibrium is characterized by equal chemical potentials for all constituents in two
phases (or systems)d. Chemical potential can be illustrated by an analogy with hydrostatic water pressure and tendency to
move between two vessels as controlled by height of water in a given volume (hydrostaticpressure)
chemical potential (1) > (2)
benzene concentration (1) > (2)
hydrostatic systemwater pressure (1) > water pressure (2)
water pressure (1) = water pressure (2) volume water (2) > volume water (1)
(1(2
(1(2
chemical system
(1) (2)
(1 (2
Systems Not At Equilibrium
Systems At Equilibrium
1. In the above analogy, at time 0, the two systems, (1) and (2) are connected by a valvewhich has just been opened. In the water (or hydrostatic) system and the chemical(benzene liquid) system, a measurable pressure (head pressure and vapor pressure,respectively) exists in each container.
2. When the valves are open, water and benzene move into the containers of lowerrelative pressure (i.e., system 2). Think of pressure in this model as a surrogatemeasure for the chemical potential. The movement is caused not by the number of

ES/RP 532 Applied Environmental Toxicology
ESRP532 Lect 1 Intro.doc
Page 15 of 15
molecules but by the chemical potential. In other words the chemical potential ofbenzene in the liquid state is higher than in the vapor state.
3. Movement stops when equilibrium is reached. Equilibrium occurs in the watersystem when the head pressures (aka head potenital or hydrostatic potential) are equal.In the chemical system, equilibrium occurs when the pressure in (2) is equal to thepressure in (1). This is equivalent to saying that the chemical potenital of x in (1)and (2) are equal.a. However, when the potentials are equalized after the valves are opened, the
volumes are not equal; thus, in the water system, there is more water in system(2) at equilibrium, but the head potentials are now equal.
b. In the chemical system, after the valve is opened, the pressure (as a surrogate forchemical potential) in the gas phase becomes equalized, but the amount of x ineach system is unequal (and the volume of x would be different).
c. Thus, the amount of chemical present in two systems at equilibrium can beunequal. This model will aid an understanding of phase transfers, but thedirection of transfer and the resulting equilibrium depends largely on thephysicochemical properties of water solubility and vapor pressure.
4. Chemical potentials cannot be directly observed; therefore,the concept of fugacity (asa surrogate for chemical potential) was used to describe the "urge" of a molecule towant to "flee" a system; i.e.., the escaping tendency.a. Thus in the above systems, when the valves are closed, the material x in vessel
(1) of the chemical system and vessel (1) of the water system are said to havehigher fugacities than in the opposite vessels.
b. When the valves are open, the fugacities in the two systems become equalized;thus at equilibrium, the fugacity of the molecules in vessels (1) and (2) are thesame.
c. Note that at equilibrium, the chemical potential of components in flask 1 and 2are equal, but the concentration of components and thus, the free energy isgreater in flask 1 than in flask 2.
C. Fugacity1. Rather than attempt to quantify the chemical potential energies of all components in a system, it is
more practical to assess the tendency or “urge” to escape or flee that system; thus fugacity (from theLatin fugere, to flee) is the escaping tendencya. Relative tendencies to flee various environments is indicative of the relative chemical potentials in
those environments;1. By measuring parameters that lead to a calculation of fugacity and thus coincidentally relative
chemical potentials, the direction and extent of transfer and transformation could be quantified2. Can be expressed in pressure units (for ex., atmospheres)3. A compound with a high fugacity in a phase has a strong tendency to want to leave that phase to a
phase where its fugacity is lower [i.e., partition from high fugacity to low fugacity, or in other words,direction of a process is from higher (µI) to lower (µi)].
4. Utilization of fugacity conceptualizationa. Can convert concentrations in a phase to the fugacity term that can be compared between phases;
thus can predict the potential to transfer (or the direction of transfer) from one phase to another.b. Prediction of the likely environmental fate of a compound which is being marketed for the first
time.5. A equilibrium, fugacities of a substance in different phases are identical (in pressure units)
a. Fugacity is linearly proportional to concentration when dealing with the comparatively lowconcentrations characteristic of environmental contamination
6. Natural systems do not really come to equilibrium; thus one must consider the effects of inputs,outputs, and degradation or transformations within the system; thus kinetic considerations in additionto thermodynamic considerations are important.