esg: the family business model
TRANSCRIPT
DISCLOSURE APPENDIX AT THE BACK OF THIS REPORT CONTAINS IMPORTANT DISCLOSURES, ANALYST CERTIFICATIONS, AND THE STATUS OF NON-US ANALYSTS. US Disclosure: Credit Suisse does and seeks to do business with companies covered in its research reports. As a result, investors should be aware that the Firm may have a conflict of interest that could affect the objectivity of this report. Investors should consider this report as only a single factor in making their investment decision.
CREDIT SUISSE SECURITIES RESEARCH & ANALYTICS BEYOND INFORMATION®
Client-Driven Solutions, Insights, and Access
08 July 2015
Global
Equity Research
ESG: The Family Business Model Environmental, Social and Governance (ESG) Research
The Credit Suisse Global Family 900 universe
High-profile family-owned corporate collapses and management control
concerns have led minority investors to question whether the returns warrant
the risk. For this report, we have constructed the Credit Suisse Global Family
universe of more than 900 companies with a market cap over $1bn to analyse
the family business model and establish whether the risks of concentrated
ownership and limited control are justified by superior returns.
Key findings:
■ The Credit Suisse Global Family 900 universe has shown an excess CAGR
of 4.5% vs MSCI ACWI since 2006.
■ We find that family businesses have been superior in creating value,
generating higher cash flow returns as measured by Credit Suisse HOLT®
CFROI® along with less volatile growth and returns through the cycle. This
warrants their slight premium valuation, in our view.
■ Investing alongside the company founder tends to generate the highest
returns for minorities, while share price returns typically decline as
ownership passes down successive generations.
■ Corporate governance can be a source of concern. However, our analysis of
accounting risks suggests that some corporate governance risks are
overstated. Better accounting practices indicate the alignment of owners'
and minorities' interests.
■ We highlight three case studies to illustrate the differences in family
business performance and have published an accompanying
presentation (link) highlighting 18 stocks rated Outperform by Credit
Suisse analysts that offer exposure to this theme.
Figure 1: CS Global Family 900 universe vs MSCI ACWI - (sector adjusted) (%)
0
50
100
150
200
250
2006 2007 2008 2009 2010 2011 2012 2013 2014 2015
CS Global Family 900 (sector/mkt adj) MSCI AC World, Mkt Wt
Source: the BLOOMBERG PROFESSIONAL™ service, Credit Suisse research
Credit Suisse Environmental, Social
and Governance (ESG) research seeks
to focus on sustainability and
accountability factors that are then
integrated into the investment process.
Research Analysts
Julia Dawson
44 20 7883 3715
Richard Kersley
44 20 7888 0313
Marcelo Preto
44 207 888 0873
Catherine Tillson
44 20 7888 6052
For analysis of the 18 companies
exposed to this theme, please see our
primer, Thematic and ESG Research
08 July 2015
ESG: The Family Business Model 2
Table of contents Key highlights 4 Introduction 5 Are family businesses a good investment? 6 Top picks 9 The CS Global Family 900 universe 11 The business case for family-owned companies 12
Superior and more stable growth 12 Return on equity fails to capture value creation 12 Higher cash flow returns – CFROI 14 Economic Profit – the real value creation 15
US case study: Wal-Mart vs Costco and Whole Foods 17 European case study: Alfa Laval vs Hochtief 18 Asian case study: Sino Biopharmaceutical vs CR Sanjiu Pharma 19
Leverage – lower in the US and Europe, as expected 20 R&D intensity 21 Are family-owned companies better at M&A? 22 So what are the negatives to family-owned businesses? 23 The risk of succession and survivorship 24 Accounting quality is in fact superior 26 Diversity 26
The investment case for family-owned companies 28 When should you invest? 31 Dividends 32 Are there 'supergroups' within the family-owned universe? 34
ESG: Do families make good managers? 35 So what to buy? 37 Appendix 1: The Credit Suisse Global Family 900 universe 41 Appendix 2: Credit Suisse ESG Indices 47 Selected reading 48
The authors of this report wish to acknowledge the contribution made by Mahadevan
Subramanian and Akanksha Kharbanda, employees of CRISIL Global Research and
Analytics, a business division of CRISIL Limited, a third-party provider of research services
to Credit Suisse.
08 July 2015
ESG: The Family Business Model 3
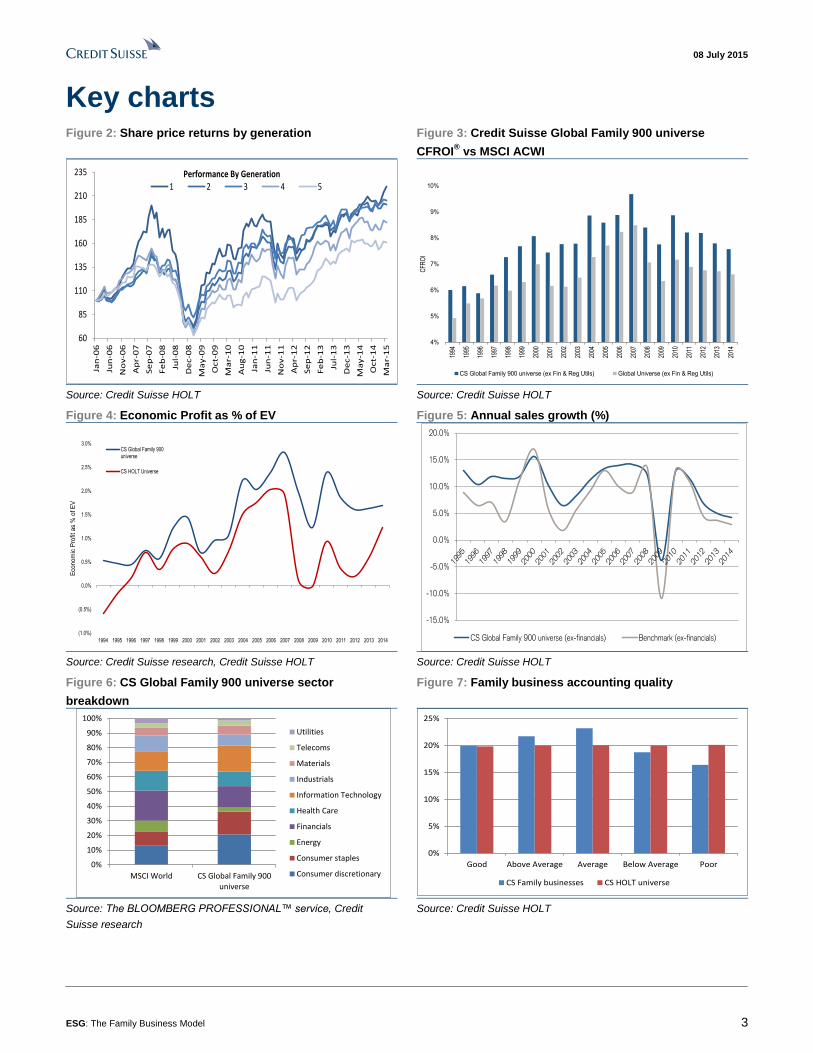
Key charts Figure 2: Share price returns by generation Figure 3: Credit Suisse Global Family 900 universe
CFROI® vs MSCI ACWI
60
85
110
135
160
185
210
235
Jan
-06
Jun
-06
No
v-0
6
Ap
r-0
7
Se
p-0
7
Fe
b-0
8
Jul-
08
De
c-0
8
Ma
y-0
9
Oct-
09
Ma
r-1
0
Au
g-1
0
Jan
-11
Jun
-11
No
v-1
1
Ap
r-1
2
Se
p-1
2
Fe
b-1
3
Jul-
13
De
c-1
3
Ma
y-1
4
Oct-
14
Ma
r-1
5
Performance By Generation1 2 3 4 5
4%
5%
6%
7%
8%
9%
10%
1994
1995
1996
1997
1998
1999
2000
2001
2002
2003
2004
2005
2006
2007
2008
2009
2010
2011
2012
2013
2014
CFR
OI
CS Global Family 900 universe (ex Fin & Reg Utils) Global Universe (ex Fin & Reg Utils)
Source: Credit Suisse HOLT Source: Credit Suisse HOLT
Figure 4: Economic Profit as % of EV Figure 5: Annual sales growth (%)
(1.0%)
(0.5%)
0.0%
0.5%
1.0%
1.5%
2.0%
2.5%
3.0%
1994 1995 1996 1997 1998 1999 2000 2001 2002 2003 2004 2005 2006 2007 2008 2009 2010 2011 2012 2013 2014
Eco
nom
ic P
rofit
as
% o
f E
V
CS Global Family 900universe
CS HOLT Universe
-15.0%
-10.0%
-5.0%
0.0%
5.0%
10.0%
15.0%
20.0%
CS Global Family 900 universe (ex-financials) Benchmark (ex-financials)
Source: Credit Suisse research, Credit Suisse HOLT Source: Credit Suisse HOLT
Figure 6: CS Global Family 900 universe sector
breakdown
Figure 7: Family business accounting quality
0%
10%
20%
30%
40%
50%
60%
70%
80%
90%
100%
MSCI World CS Global Family 900universe
Utilities
Telecoms
Materials
Industrials
Information Technology
Health Care
Financials
Energy
Consumer staples
Consumer discretionary
0%
5%
10%
15%
20%
25%
Good Above Average Average Below Average Poor
CS Family businesses CS HOLT universe
Source: The BLOOMBERG PROFESSIONAL™ service, Credit
Suisse research
Source: Credit Suisse HOLT
08 July 2015
ESG: The Family Business Model 4
Key highlights Here are the key findings from our analysis, which covers 920 companies with a market
cap over $1bn and family ownership of at least 20%:
■ The Credit Suisse Global Family 900 universe has shown an excess return of 4.5%
CAGR vs the MSCI All Countries World Index (ACWI) since 2006.
■ Investing alongside the founder tends to generate the best share-price returns, but we
see the outperformance decreasing over subsequent generations.
■ Family-owned companies are a lower Return on Equity (ROE) business model in the
more developed markets of US and Europe. They demonstrate higher ROEs in Asia
and EMEA. Lower ROEs tend to be indicative of more conservative strategies as well
as broader priorities for family ownership beyond simply financial returns.
■ However, over the longer term, family companies in the CS Global Family 900 have
generated 2x the Economic Profit – earnings in excess of the opportunity cost of
utilising assets or capital – compared to benchmarks. We illustrate this with case
studies of Wal-Mart, Alfa Laval and Sino Biopharmaceuticals.
■ Family-owned companies trade on slightly higher EV/EBITDA and PB multiples
compared to benchmarks. Share-price appreciation is closely correlated to economic
profit generation.
■ Leverage is lower at US and European family businesses in line with previous
academic research. We are able to show the faster de-leveraging post-crisis
compared to benchmarks. Asian family business leverage is higher, on the other hand.
■ The business cycle is smoother and more stable. We show that sales growth is less
volatile through the cycle with lower peaks and less pronounced troughs.
■ Family companies tend to invest less in R&D. In the US, R&D intensity is just 25% of
benchmark levels; in Europe it is 20% below benchmark. Whilst this is indicative of the
more conservative style of management, we also believe that it reflects more efficient
R&D given the relatively limited difference in returns.
■ Family business growth is typically organic. Since 1990, M&A has been just 2.1% of
sales vs 5.8% at non-family businesses. We also find that family businesses generally
make better and cheaper acquisitions as they drive better growth and returns in the
three-year period post-acquisition.
■ Corporate governance risks appear overstated. Whilst there have been high-profile
corporate collapses at family-owned businesses in recent decades, we evaluate
empirical measures of accounting performance as a corporate governance proxy and
find there is a closer alignment between owner and minority interests than is generally
perceived. Based on our HOLT analysis, accounting quality at family-owned
companies is superior, reflecting the owners' focus on preserving wealth over the long
term.
■ We find 'survivorship' and transition to be easier in sectors that are more reliant on
tangible assets. We see a quicker dilution of ownership in companies founded on
intellectual property. This may reflect that successor generations do not share the
founder's vision or interests.
■ We discuss potential risks and weaknesses that include related-party risks, closed
pools of managers, employment of under-qualified family members and different
voting rights.
08 July 2015
ESG: The Family Business Model 5
Introduction There has been considerable research into family-owned businesses to establish whether
or not there is a positive correlation between close corporate ownership and company
performance. To date, there are no definitive findings, although most reports tend to find
positive benefits. However, studies are typically limited to single markets and relate to
different time periods so that an overall, broad conclusion is hard to establish.
With the Credit Suisse Family 900 universe introduced in this report, we look to further the
findings from a number of previous Credit Suisse reports into family businesses,
specifically the Credit Suisse White Paper 01 "Family Businesses in Europe: Growth
Trends and Challenges" (February 2007), The Life-Cycle of UK Family Businesses (July
2008), Credit Suisse Research Institute's Asian Family Businesses Report (2011) and
Family Businesses: Sustaining Performance (2012) and focus on whether there is a
business case for family-owned companies on a global basis and indeed an investment
case for external shareholders.
In the Credit Suisse White Paper 01 "Family Businesses in Europe: Growth Trends and
Challenges" (February 2007), we highlighted six strengths that characterise family
businesses:
■ Long-term commitment of owners
■ Visible and identifiable ownership, in contrast to ownership by numerous institutional
investors
■ Track record of standing by their companies during hard times
■ Trademark names that continue to open doors in the business community
■ Consistency in decision-making and business practice, thereby lowering the business
risks for external providers of capital
■ Better alignment of owner and management interests
To this, we would now add a number of characteristics that help to elucidate why family
businesses stand apart and why the return profile is different to that of the broader
corporate universe:
■ Desire to maintain control leads to more cautious and also more efficient management
and strategies
■ Focus on value-added products and brand development, the corollary of which is the
negatives for family owners from public failure
■ Focus on core activities means they are less acquisitive and growth is organic
■ Investment intensity, be it R&D or broader capex, is lower but the more limited
compression to ROEs suggests that investment and R&D is more efficient
■ Lower volatility in family-owned company returns vs more broadly held companies
■ Value creation through superior cash flow return spreads and asset growth
Entrepreneurship is borne of opportunity and necessity. As the macro-economic backdrop
has moved towards increased deregulation and decreased involvement of the State, we
have seen that family-owned businesses are not just key drivers of economic growth but
are today key employers. It is therefore imperative to understand how and why these
companies perform and how they will impact macroeconomic policies and stock market
performance. With the lessening of the role of the State in the economy across the globe,
entrepreneurs will likely be the innovators and drivers of future growth and development.
08 July 2015
ESG: The Family Business Model 6
Are family businesses a good investment? With high-profile family-owned corporate collapses such as Barings Group, Parmalat and
Banco Espirito Santo in recent decades, as well as questions over management controls
and appointments at News Corporation in more recent times, some investors may
question whether investing alongside controlling family shareholders is worth the risk.
In our analysis, we find that family-owned companies in the CS Global Family 900
universe have seen returns on equity (ROEs) that have been on average 4.3% higher than
benchmark and cash flow returns on investment (CFROI) over 90% higher. This underpins
the small premium vs MSCI ACWI since 2006 of 12% on EV/EBITDA and 5% on P/B.
Whilst we find regional differences in returns, typically lower in more mature businesses in
Europe and US, investors appear prepared to pay this slight premium for a more stable
sales and return cycle relative to benchmarks as well as the sustained longer-term value
creation reflected in superior CFROI and economic profit metrics.
Figure 8: Family-owned company returns and valuations – 2014
ROE CFROI EV/EBITDA P/B Net debt/Equity Net debt/EBITDA
Global 11.5% 6.4% 10.6 2.1 52.0% 1.8
US 12.0% 9.1% 13.2 3.3 30.7% 1.1
Europe 12.1% 7.5% 9.2 2.0 42.7% 1.3
Asia 10.8% 5.5% 9.7 1.7 44.4% 1.7
Latam 9.3% 6.7% 10.1 2.1 86.6% 2.6
EMEA 17.9% 8.1% 18.6 1.8 82.6% 1.9
Source: Company data, Credit Suisse HOLT, Credit Suisse research
Figure 9: Comparative returns and valuations vs MSCI ACWI – 2014
ROE CFROI EV/EBITDA P/B Net debt/Equity Net debt/EBITDA
Family businesses 11.5% 6.4% 10.6 2.1 52.0% 1.8
MSCI ACWI 12.1% 6.3% 9.5 2.1 48.2% 1.5
Premium/(discount) -4.8% 1.0% 12.3% -1.2% 7.9% 17.1%
Source: Company data, Credit Suisse HOLT, Credit Suisse research
Figure 10: Comparative returns and valuations vs MSCI ACWI – since 2006
ROE CFROI EV/EBITDA P/B Net debt/Equity Net debt/EBITDA
Family businesses 13.2% 7.5% 9.2 2.1 54.7% 1.7
MSCI ACWI 12.6% 6.9% 8.2 2.0 48.6% 1.4
Premium/(discount) 5.0% 9.1% 11.8% 5.1% 12.4% 19.8%
Source: Company data, Credit Suisse HOLT, Credit Suisse research
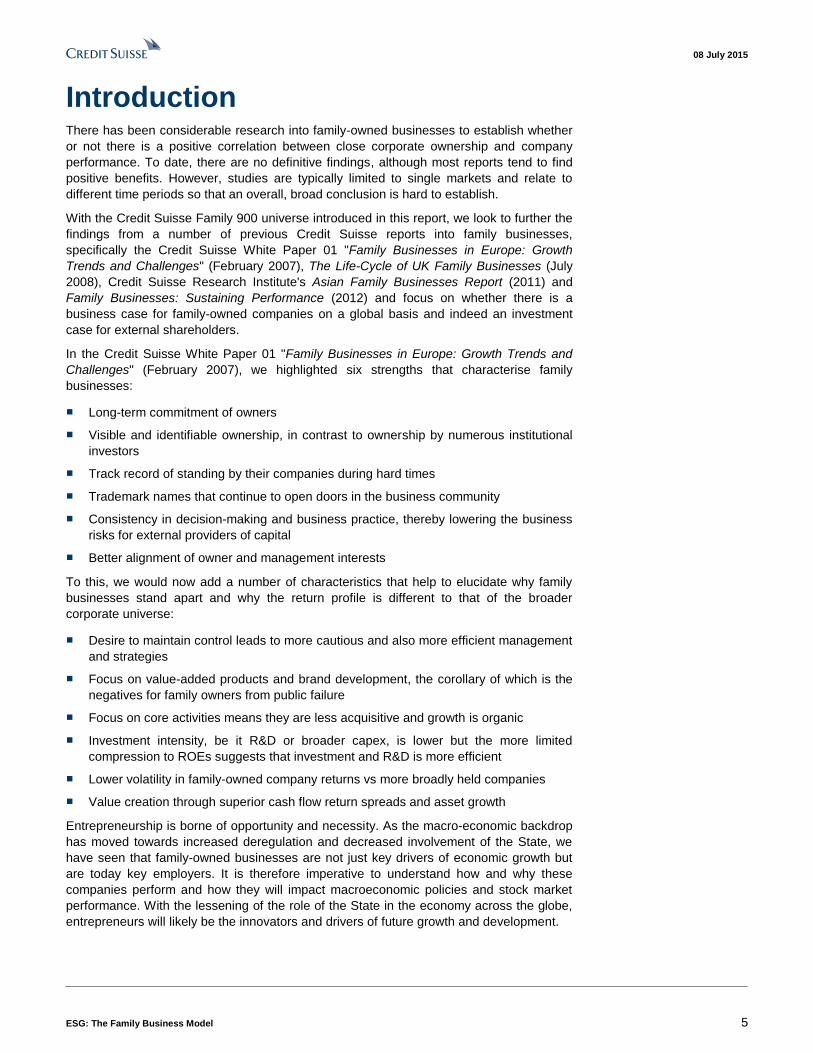
The question for investors of course is whether family-business success creates a good
investment opportunity for minority investors. Looking on a sector adjusted and market
weighted basis, the 920 companies in our family business universe have demonstrated a
47% outperformance compared to the MSCI ACWI over the nine years to the end of April
2015 (Figure 11). This equates to an annual excess return of 4.5% over the same period.
We acknowledge that there is survivorship bias in our sample and that past returns are no
guarantee of future performance. However, we find relatively few examples of risks to
owning family companies and believe that the focus of family ownership may in fact
provide ideal circumstances in which minorities should co-invest. We illustrate the superior
accounting practices which mitigate some of the perceived corporate governance risks in
our section on ESG issues below.
08 July 2015
ESG: The Family Business Model 7
Figure 11: CS Global Family 900 universe vs MSCI ACWI – (sector adjusted) (%)
0
50
100
150
200
250
2006 2007 2008 2009 2010 2011 2012 2013 2014 2015
CS Global Family 900 (sector/mkt adj) MSCI AC World, Mkt Wt
Source: the BLOOMBERG PROFESSIONAL™ service, Credit Suisse research
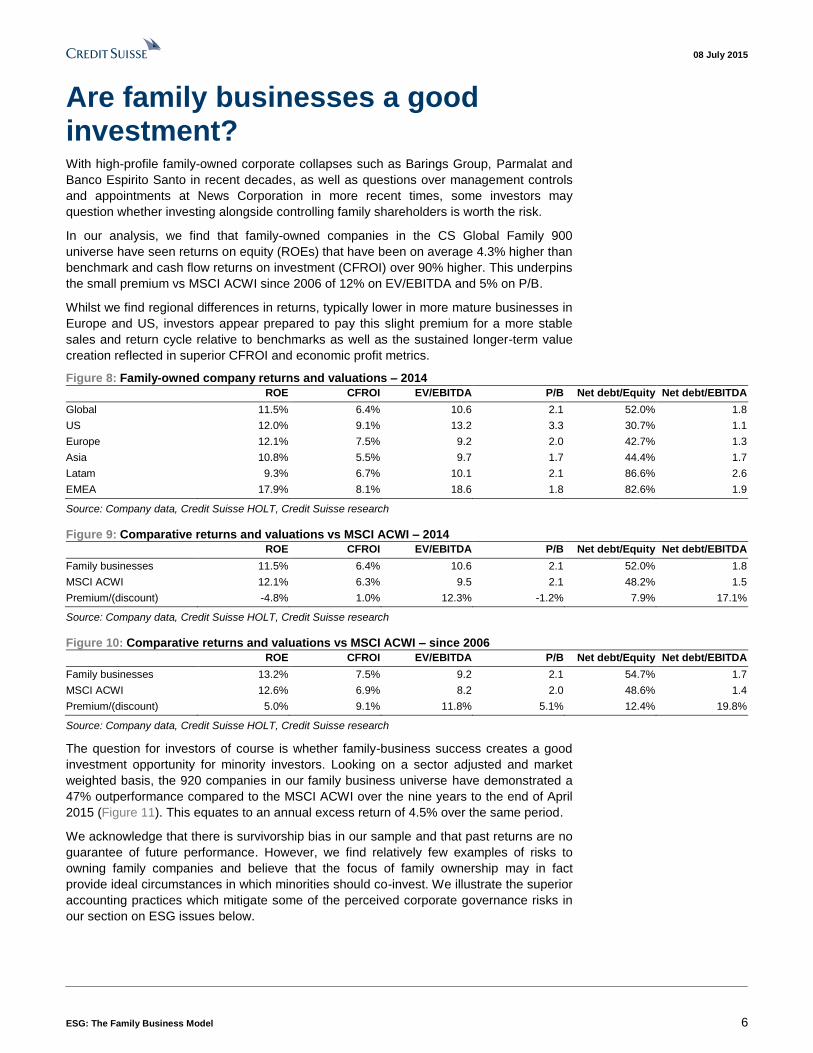
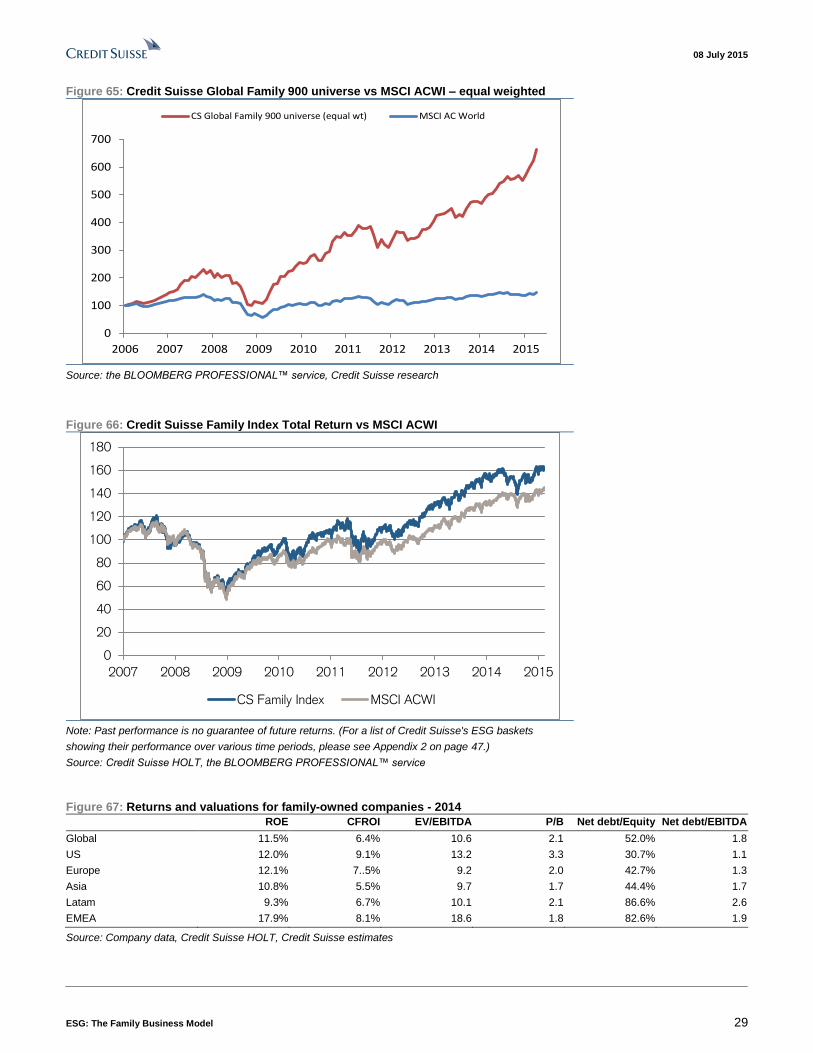
On a simple equal weighted basis illustrated in Figure 12, our universe has beaten the
MSCI ACWI index by 351% over the same period. This is a CAGR of 21.6% for these
family-owned stocks compared to 3.6% for the index. Clearly, investing alongside family
owners appears to have been a significant positive for outsiders, too.
Figure 12: Credit Suisse Global Family 900 universe vs MSCI ACWI – equal weighted
0
100
200
300
400
500
600
700
2006 2007 2008 2009 2010 2011 2012 2013 2014 2015
CS Global Family 900 universe (equal wt) MSCI AC World
Source: the BLOOMBERG PROFESSIONAL™ service, Credit Suisse research
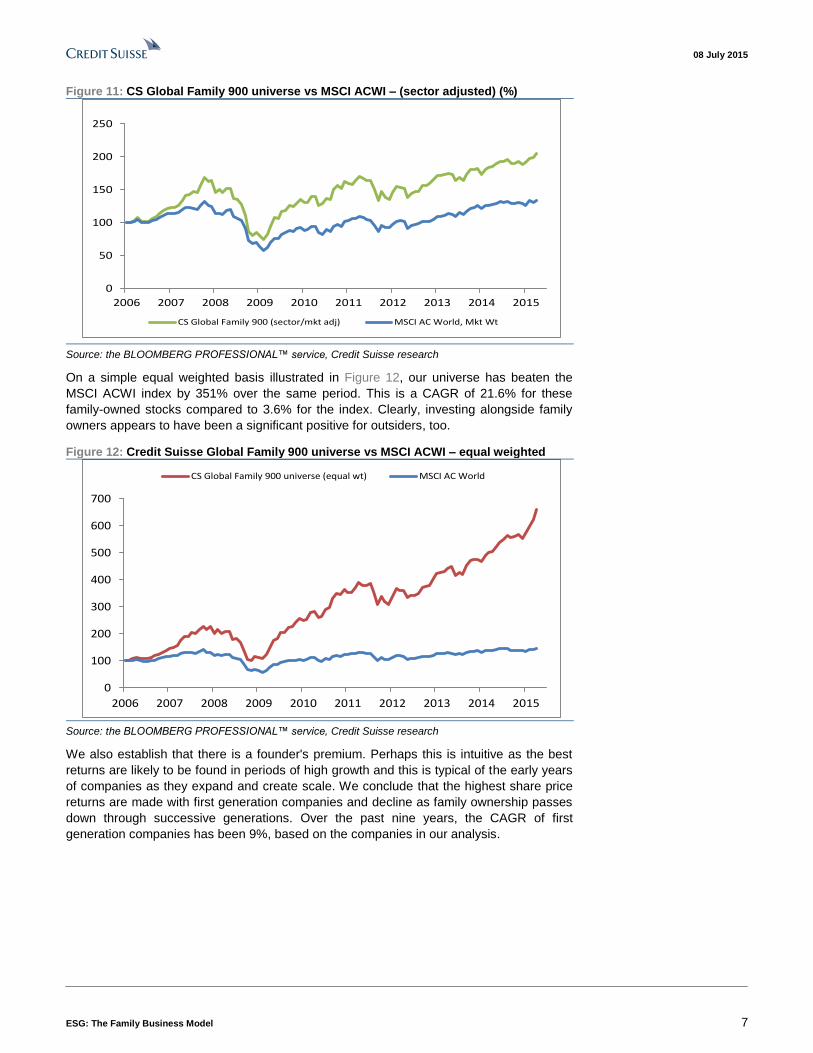
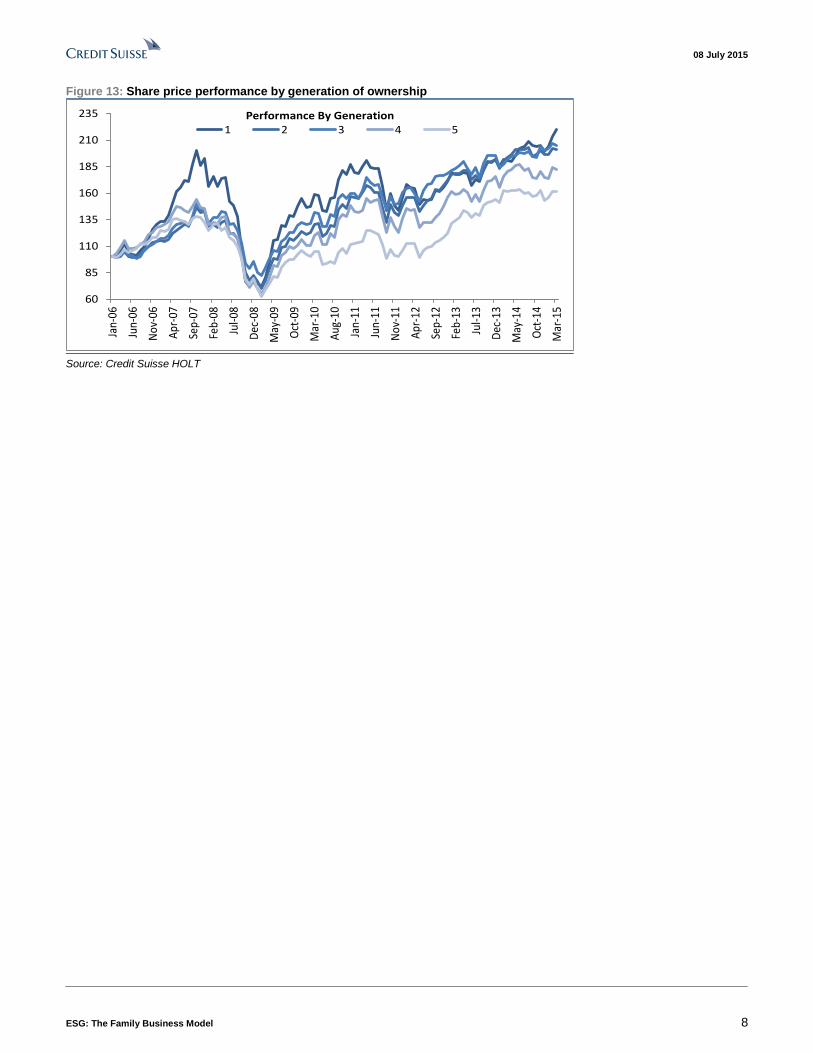
We also establish that there is a founder's premium. Perhaps this is intuitive as the best
returns are likely to be found in periods of high growth and this is typical of the early years
of companies as they expand and create scale. We conclude that the highest share price
returns are made with first generation companies and decline as family ownership passes
down through successive generations. Over the past nine years, the CAGR of first
generation companies has been 9%, based on the companies in our analysis.
08 July 2015
ESG: The Family Business Model 8
Figure 13: Share price performance by generation of ownership
60
85
110
135
160
185
210
235Ja
n-06
Jun-
06
Nov
-06
Apr
-07
Sep-
07
Feb-
08
Jul-0
8
Dec
-08
May
-09
Oct
-09
Mar
-10
Aug
-10
Jan-
11
Jun-
11
Nov
-11
Apr
-12
Sep-
12
Feb-
13
Jul-1
3
Dec
-13
May
-14
Oct
-14
Mar
-15
Performance By Generation1 2 3 4 5
Source: Credit Suisse HOLT
08 July 2015
ESG: The Family Business Model 9
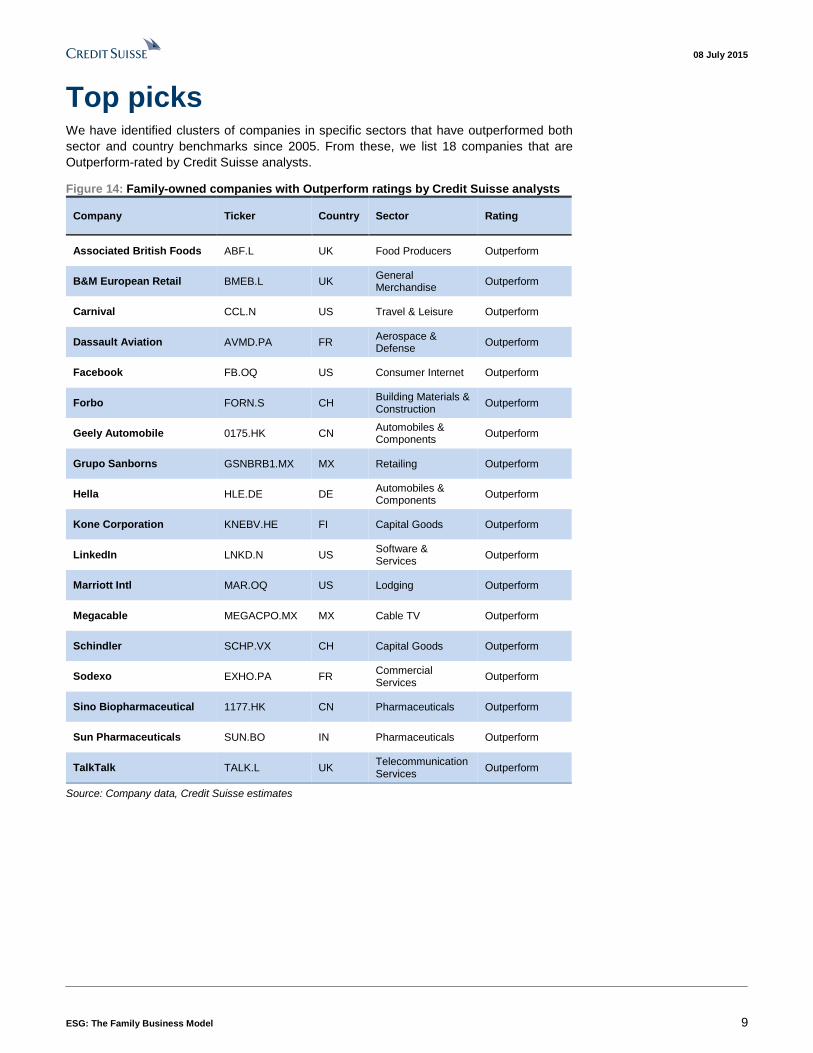
Top picks We have identified clusters of companies in specific sectors that have outperformed both
sector and country benchmarks since 2005. From these, we list 18 companies that are
Outperform-rated by Credit Suisse analysts.
Figure 14: Family-owned companies with Outperform ratings by Credit Suisse analysts
Company Ticker Country Sector Rating
Associated British Foods ABF.L UK Food Producers Outperform
B&M European Retail BMEB.L UK General Merchandise
Outperform
Carnival CCL.N US Travel & Leisure Outperform
Dassault Aviation AVMD.PA FR Aerospace & Defense
Outperform
Facebook FB.OQ US Consumer Internet Outperform
Forbo FORN.S CH Building Materials & Construction
Outperform
Geely Automobile 0175.HK CN Automobiles & Components
Outperform
Grupo Sanborns GSNBRB1.MX MX Retailing Outperform
Hella HLE.DE DE Automobiles & Components
Outperform
Kone Corporation KNEBV.HE FI Capital Goods Outperform
LinkedIn LNKD.N US Software & Services
Outperform
Marriott Intl MAR.OQ US Lodging Outperform
Megacable MEGACPO.MX MX Cable TV Outperform
Schindler SCHP.VX CH Capital Goods Outperform
Sodexo EXHO.PA FR Commercial Services
Outperform
Sino Biopharmaceutical 1177.HK CN Pharmaceuticals Outperform
Sun Pharmaceuticals SUN.BO IN Pharmaceuticals Outperform
TalkTalk TALK.L UK Telecommunication Services
Outperform
Source: Company data, Credit Suisse estimates
08 July 2015
ESG: The Family Business Model 10
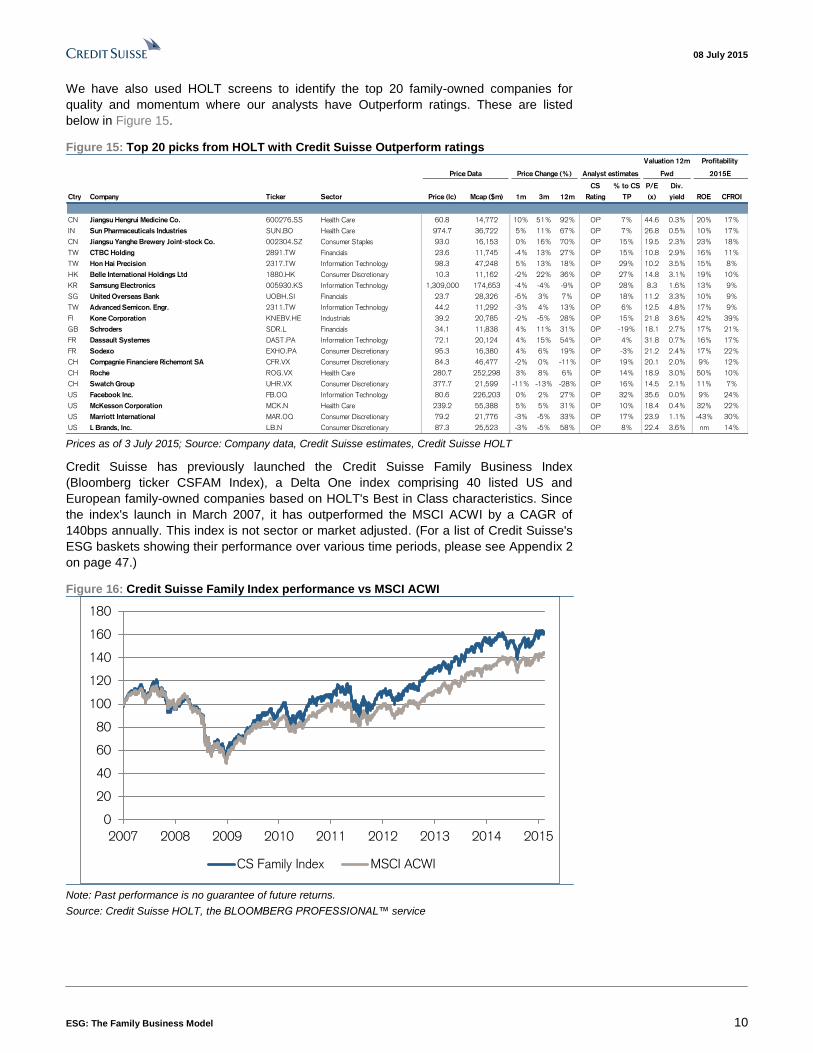
We have also used HOLT screens to identify the top 20 family-owned companies for
quality and momentum where our analysts have Outperform ratings. These are listed
below in Figure 15.
Figure 15: Top 20 picks from HOLT with Credit Suisse Outperform ratings
Price Data Price Change (%) Analyst estimates
Valuation 12m
Fwd
Profitability
2015E
H
O
Ctry Company Ticker Sector Price (lc) Mcap ($m) 1m 3m 12m
CS
Rating
% to CS
TP
P/E
(x)
Div.
yield ROE CFROI
CN Jiangsu Hengrui Medicine Co. 600276.SS Health Care 60.8 14,772 10% 51% 92% OP 7% 44.6 0.3% 20% 17%
IN Sun Pharmaceuticals Industries SUN.BO Health Care 974.7 36,722 5% 11% 67% OP 7% 26.8 0.5% 10% 17%
CN Jiangsu Yanghe Brewery Joint-stock Co. 002304.SZ Consumer Staples 93.0 16,153 0% 16% 70% OP 15% 19.5 2.3% 23% 18%
TW CTBC Holding 2891.TW Financials 23.6 11,745 -4% 13% 27% OP 15% 10.8 2.9% 16% 11%
TW Hon Hai Precision 2317.TW Information Technology 98.3 47,248 5% 13% 18% OP 29% 10.2 3.5% 15% 8%
HK Belle International Holdings Ltd 1880.HK Consumer Discretionary 10.3 11,162 -2% 22% 36% OP 27% 14.8 3.1% 19% 10%
KR Samsung Electronics 005930.KS Information Technology 1,309,000 174,653 -4% -4% -9% OP 28% 8.3 1.6% 13% 9%
SG United Overseas Bank UOBH.SI Financials 23.7 28,326 -5% 3% 7% OP 18% 11.2 3.3% 10% 9%
TW Advanced Semicon. Engr. 2311.TW Information Technology 44.2 11,292 -3% 4% 13% OP 6% 12.5 4.8% 17% 9%
FI Kone Corporation KNEBV.HE Industrials 39.2 20,785 -2% -5% 28% OP 15% 21.8 3.6% 42% 39%
GB Schroders SDR.L Financials 34.1 11,838 4% 11% 31% OP -19% 18.1 2.7% 17% 21%
FR Dassault Systemes DAST.PA Information Technology 72.1 20,124 4% 15% 54% OP 4% 31.8 0.7% 16% 17%
FR Sodexo EXHO.PA Consumer Discretionary 95.3 16,380 4% 6% 19% OP -3% 21.2 2.4% 17% 22%
CH Compagnie Financiere Richemont SA CFR.VX Consumer Discretionary 84.3 46,477 -2% 0% -11% OP 19% 20.1 2.0% 9% 12%
CH Roche ROG.VX Health Care 280.7 252,298 3% 8% 6% OP 14% 18.9 3.0% 50% 10%
CH Swatch Group UHR.VX Consumer Discretionary 377.7 21,599 -11% -13% -28% OP 16% 14.5 2.1% 11% 7%
US Facebook Inc. FB.OQ Information Technology 80.6 226,203 0% 2% 27% OP 32% 35.6 0.0% 9% 24%
US McKesson Corporation MCK.N Health Care 239.2 55,388 5% 5% 31% OP 10% 18.4 0.4% 32% 22%
US Marriott International MAR.OQ Consumer Discretionary 79.2 21,776 -3% -5% 33% OP 17% 23.9 1.1% -43% 30%
US L Brands, Inc. LB.N Consumer Discretionary 87.3 25,523 -3% -5% 58% OP 8% 22.4 3.6% nm 14% Prices as of 3 July 2015; Source: Company data, Credit Suisse estimates, Credit Suisse HOLT
Credit Suisse has previously launched the Credit Suisse Family Business Index
(Bloomberg ticker CSFAM Index), a Delta One index comprising 40 listed US and
European family-owned companies based on HOLT's Best in Class characteristics. Since
the index's launch in March 2007, it has outperformed the MSCI ACWI by a CAGR of
140bps annually. This index is not sector or market adjusted. (For a list of Credit Suisse's
ESG baskets showing their performance over various time periods, please see Appendix 2
on page 47.)
Figure 16: Credit Suisse Family Index performance vs MSCI ACWI
0
20
40
60
80
100
120
140
160
180
2007 2008 2009 2010 2011 2012 2013 2014 2015
CS Family Index MSCI ACWI
Note: Past performance is no guarantee of future returns.
Source: Credit Suisse HOLT, the BLOOMBERG PROFESSIONAL™ service
08 July 2015
ESG: The Family Business Model 11
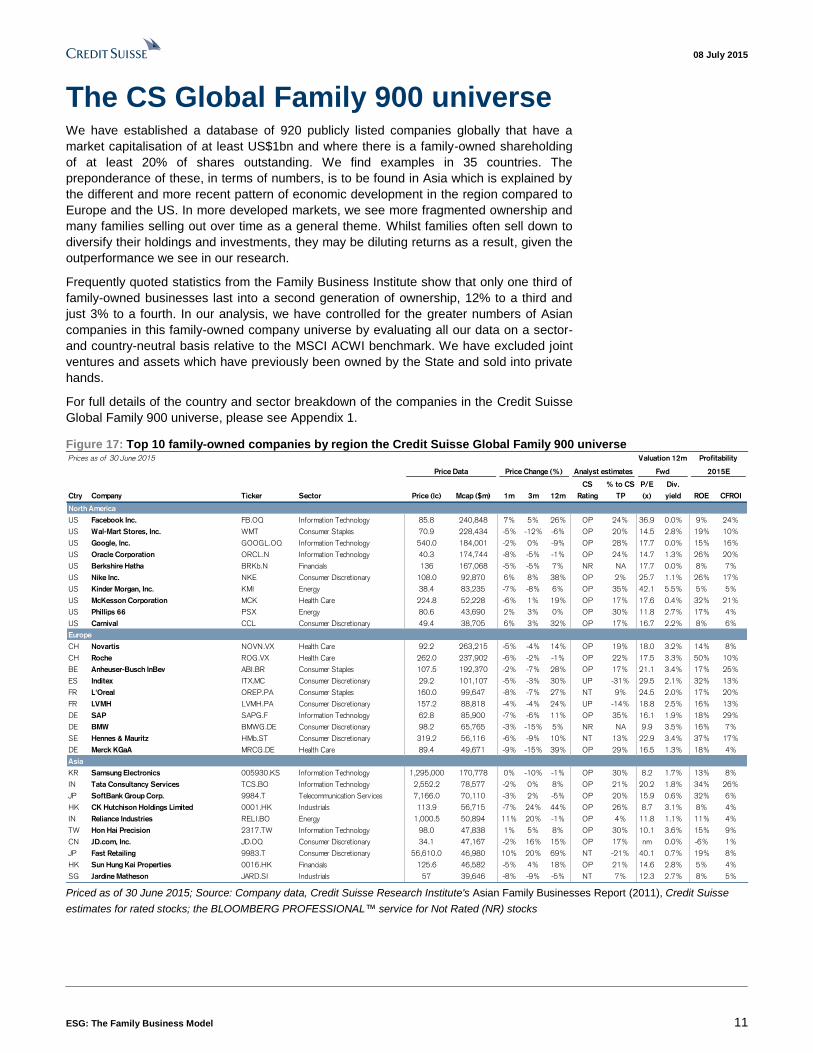
The CS Global Family 900 universe We have established a database of 920 publicly listed companies globally that have a
market capitalisation of at least US$1bn and where there is a family-owned shareholding
of at least 20% of shares outstanding. We find examples in 35 countries. The
preponderance of these, in terms of numbers, is to be found in Asia which is explained by
the different and more recent pattern of economic development in the region compared to
Europe and the US. In more developed markets, we see more fragmented ownership and
many families selling out over time as a general theme. Whilst families often sell down to
diversify their holdings and investments, they may be diluting returns as a result, given the
outperformance we see in our research.
Frequently quoted statistics from the Family Business Institute show that only one third of
family-owned businesses last into a second generation of ownership, 12% to a third and
just 3% to a fourth. In our analysis, we have controlled for the greater numbers of Asian
companies in this family-owned company universe by evaluating all our data on a sector-
and country-neutral basis relative to the MSCI ACWI benchmark. We have excluded joint
ventures and assets which have previously been owned by the State and sold into private
hands.
For full details of the country and sector breakdown of the companies in the Credit Suisse
Global Family 900 universe, please see Appendix 1.
Figure 17: Top 10 family-owned companies by region the Credit Suisse Global Family 900 universe Prices as of 30 June 2015
Price Data Price Change (%) Analyst estimates
Valuation 12m
Fwd
Profitability
2015E
Ctry Company Ticker Sector Price (lc) Mcap ($m) 1m 3m 12m
CS
Rating
% to CS
TP
P/E
(x)
Div.
yield ROE CFROI
North America
US Facebook Inc. FB.OQ Information Technology 85.8 240,848 7% 5% 26% OP 24% 36.9 0.0% 9% 24%
US Wal-Mart Stores, Inc. WMT Consumer Staples 70.9 228,434 -5% -12% -6% OP 20% 14.5 2.8% 19% 10%
US Google, Inc. GOOGL.OQ Information Technology 540.0 184,001 -2% 0% -9% OP 28% 17.7 0.0% 15% 16%
US Oracle Corporation ORCL.N Information Technology 40.3 174,744 -8% -5% -1% OP 24% 14.7 1.3% 26% 20%
US Berkshire Hatha BRKb.N Financials 136 167,068 -5% -5% 7% NR NA 17.7 0.0% 8% 7%
US Nike Inc. NKE Consumer Discretionary 108.0 92,870 6% 8% 38% OP 2% 25.7 1.1% 26% 17%
US Kinder Morgan, Inc. KMI Energy 38.4 83,235 -7% -8% 6% OP 35% 42.1 5.5% 5% 5%
US McKesson Corporation MCK Health Care 224.8 52,228 -6% 1% 19% OP 17% 17.6 0.4% 32% 21%
US Phillips 66 PSX Energy 80.6 43,690 2% 3% 0% OP 30% 11.8 2.7% 17% 4%
US Carnival CCL Consumer Discretionary 49.4 38,705 6% 3% 32% OP 17% 16.7 2.2% 8% 6%
Europe
CH Novartis NOVN.VX Health Care 92.2 263,215 -5% -4% 14% OP 19% 18.0 3.2% 14% 8%
CH Roche ROG.VX Health Care 262.0 237,902 -6% -2% -1% OP 22% 17.5 3.3% 50% 10%
BE Anheuser-Busch InBev ABI.BR Consumer Staples 107.5 192,370 -2% -7% 28% OP 17% 21.1 3.4% 17% 25%
ES Inditex ITX.MC Consumer Discretionary 29.2 101,107 -5% -3% 30% UP -31% 29.5 2.1% 32% 13%
FR L'Oreal OREP.PA Consumer Staples 160.0 99,647 -8% -7% 27% NT 9% 24.5 2.0% 17% 20%
FR LVMH LVMH.PA Consumer Discretionary 157.2 88,818 -4% -4% 24% UP -14% 18.8 2.5% 16% 13%
DE SAP SAPG.F Information Technology 62.8 85,900 -7% -6% 11% OP 35% 16.1 1.9% 18% 29%
DE BMW BMWG.DE Consumer Discretionary 98.2 65,765 -3% -15% 5% NR NA 9.9 3.5% 16% 7%
SE Hennes & Mauritz HMb.ST Consumer Discretionary 319.2 56,116 -6% -9% 10% NT 13% 22.9 3.4% 37% 17%
DE Merck KGaA MRCG.DE Health Care 89.4 49,671 -9% -15% 39% OP 29% 16.5 1.3% 18% 4%
Asia
KR Samsung Electronics 005930.KS Information Technology 1,295,000 170,778 0% -10% -1% OP 30% 8.2 1.7% 13% 8%
IN Tata Consultancy Services TCS.BO Information Technology 2,552.2 78,577 -2% 0% 8% OP 21% 20.2 1.8% 34% 26%
JP SoftBank Group Corp. 9984.T Telecommunication Serv ices 7,166.0 70,110 -3% 2% -5% OP 20% 15.9 0.6% 32% 6%
HK CK Hutchison Holdings Limited 0001.HK Industrials 113.9 56,715 -7% 24% 44% OP 26% 8.7 3.1% 8% 4%
IN Reliance Industries RELI.BO Energy 1,000.5 50,894 11% 20% -1% OP 4% 11.8 1.1% 11% 4%
TW Hon Hai Precision 2317.TW Information Technology 98.0 47,838 1% 5% 8% OP 30% 10.1 3.6% 15% 9%
CN JD.com, Inc. JD.OQ Consumer Discretionary 34.1 47,167 -2% 16% 15% OP 17% nm 0.0% -6% 1%
JP Fast Retailing 9983.T Consumer Discretionary 56,610.0 46,980 10% 20% 69% NT -21% 40.1 0.7% 19% 8%
HK Sun Hung Kai Properties 0016.HK Financials 125.6 46,582 -5% 4% 18% OP 21% 14.6 2.8% 5% 4%
SG Jardine Matheson JARD.SI Industrials 57 39,646 -8% -9% -5% NT 7% 12.3 2.7% 8% 5% Priced as of 30 June 2015; Source: Company data, Credit Suisse Research Institute's Asian Family Businesses Report (2011), Credit Suisse
estimates for rated stocks; the BLOOMBERG PROFESSIONAL™ service for Not Rated (NR) stocks
08 July 2015
ESG: The Family Business Model 12
The business case for family-owned companies Superior and more stable growth
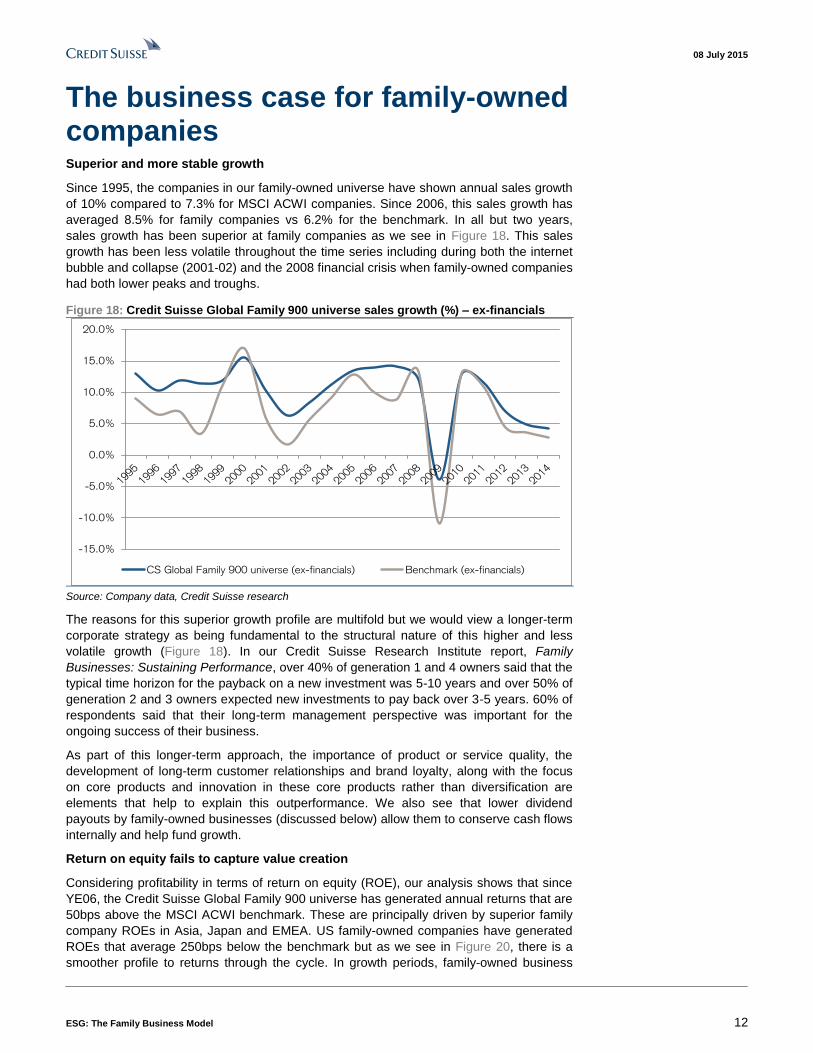
Since 1995, the companies in our family-owned universe have shown annual sales growth
of 10% compared to 7.3% for MSCI ACWI companies. Since 2006, this sales growth has
averaged 8.5% for family companies vs 6.2% for the benchmark. In all but two years,
sales growth has been superior at family companies as we see in Figure 18. This sales
growth has been less volatile throughout the time series including during both the internet
bubble and collapse (2001-02) and the 2008 financial crisis when family-owned companies
had both lower peaks and troughs.
Figure 18: Credit Suisse Global Family 900 universe sales growth (%) – ex-financials
-15.0%
-10.0%
-5.0%
0.0%
5.0%
10.0%
15.0%
20.0%
CS Global Family 900 universe (ex-financials) Benchmark (ex-financials)
Source: Company data, Credit Suisse research
The reasons for this superior growth profile are multifold but we would view a longer-term
corporate strategy as being fundamental to the structural nature of this higher and less
volatile growth (Figure 18). In our Credit Suisse Research Institute report, Family
Businesses: Sustaining Performance, over 40% of generation 1 and 4 owners said that the
typical time horizon for the payback on a new investment was 5-10 years and over 50% of
generation 2 and 3 owners expected new investments to pay back over 3-5 years. 60% of
respondents said that their long-term management perspective was important for the
ongoing success of their business.
As part of this longer-term approach, the importance of product or service quality, the
development of long-term customer relationships and brand loyalty, along with the focus
on core products and innovation in these core products rather than diversification are
elements that help to explain this outperformance. We also see that lower dividend
payouts by family-owned businesses (discussed below) allow them to conserve cash flows
internally and help fund growth.
Return on equity fails to capture value creation
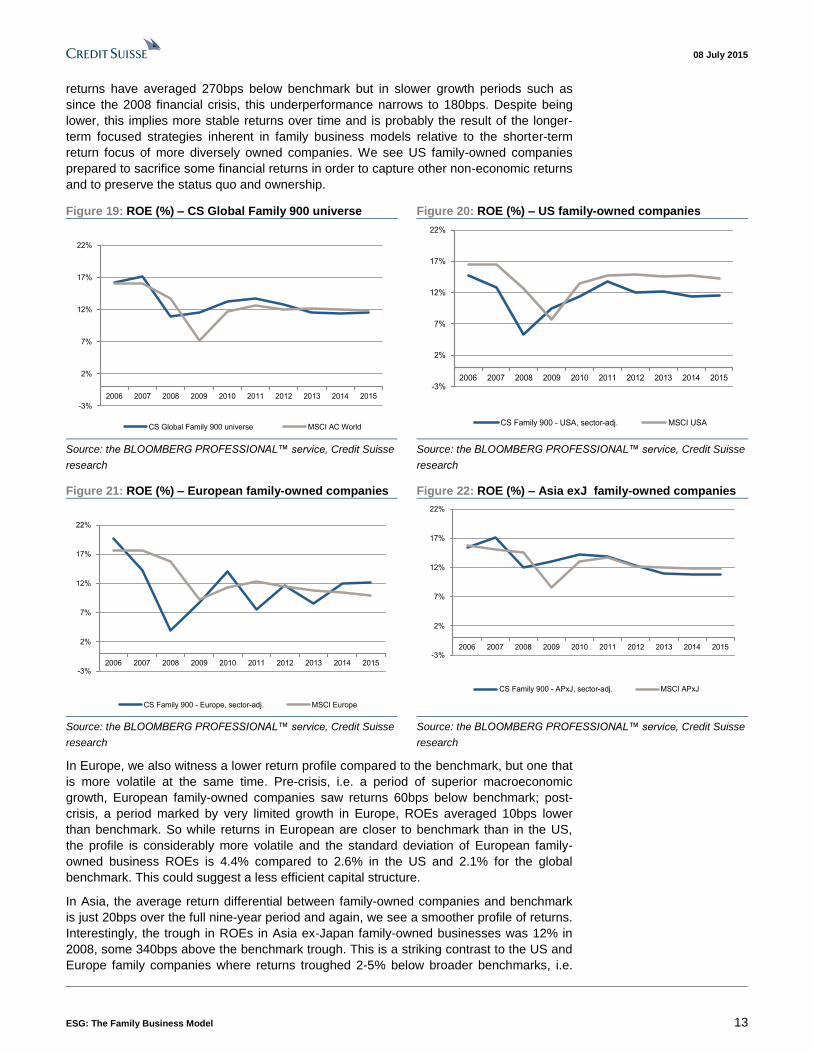
Considering profitability in terms of return on equity (ROE), our analysis shows that since
YE06, the Credit Suisse Global Family 900 universe has generated annual returns that are
50bps above the MSCI ACWI benchmark. These are principally driven by superior family
company ROEs in Asia, Japan and EMEA. US family-owned companies have generated
ROEs that average 250bps below the benchmark but as we see in Figure 20, there is a
smoother profile to returns through the cycle. In growth periods, family-owned business
08 July 2015
ESG: The Family Business Model 13
returns have averaged 270bps below benchmark but in slower growth periods such as
since the 2008 financial crisis, this underperformance narrows to 180bps. Despite being
lower, this implies more stable returns over time and is probably the result of the longer-
term focused strategies inherent in family business models relative to the shorter-term
return focus of more diversely owned companies. We see US family-owned companies
prepared to sacrifice some financial returns in order to capture other non-economic returns
and to preserve the status quo and ownership.
Figure 19: ROE (%) – CS Global Family 900 universe Figure 20: ROE (%) – US family-owned companies
-3%
2%
7%
12%
17%
22%
2006 2007 2008 2009 2010 2011 2012 2013 2014 2015
CS Global Family 900 universe MSCI AC World
-3%
2%
7%
12%
17%
22%
2006 2007 2008 2009 2010 2011 2012 2013 2014 2015
CS Family 900 - USA, sector-adj. MSCI USA
Source: the BLOOMBERG PROFESSIONAL™ service, Credit Suisse
research
Source: the BLOOMBERG PROFESSIONAL™ service, Credit Suisse
research
Figure 21: ROE (%) – European family-owned companies Figure 22: ROE (%) – Asia exJ family-owned companies
-3%
2%
7%
12%
17%
22%
2006 2007 2008 2009 2010 2011 2012 2013 2014 2015
CS Family 900 - Europe, sector-adj. MSCI Europe
-3%
2%
7%
12%
17%
22%
2006 2007 2008 2009 2010 2011 2012 2013 2014 2015
CS Family 900 - APxJ, sector-adj. MSCI APxJ
Source: the BLOOMBERG PROFESSIONAL™ service, Credit Suisse
research
Source: the BLOOMBERG PROFESSIONAL™ service, Credit Suisse
research
In Europe, we also witness a lower return profile compared to the benchmark, but one that
is more volatile at the same time. Pre-crisis, i.e. a period of superior macroeconomic
growth, European family-owned companies saw returns 60bps below benchmark; post-
crisis, a period marked by very limited growth in Europe, ROEs averaged 10bps lower
than benchmark. So while returns in European are closer to benchmark than in the US,
the profile is considerably more volatile and the standard deviation of European family-
owned business ROEs is 4.4% compared to 2.6% in the US and 2.1% for the global
benchmark. This could suggest a less efficient capital structure.
In Asia, the average return differential between family-owned companies and benchmark
is just 20bps over the full nine-year period and again, we see a smoother profile of returns.
Interestingly, the trough in ROEs in Asia ex-Japan family-owned businesses was 12% in
2008, some 340bps above the benchmark trough. This is a striking contrast to the US and
Europe family companies where returns troughed 2-5% below broader benchmarks, i.e.
08 July 2015
ESG: The Family Business Model 14
family-owned businesses bore the brunt of the 2008 hit. So up until 2013, we can see
stronger performance from family-owned companies in years of superior macro growth
and more limited downside during more challenging macro backdrops.
Higher cash flow returns – CFROI
However, a simple ROE analysis provides an inadequate description of the family
business model, as cash is a key consideration in general due to the focus on maintaining
ownership and independence. To capture this, we have looked beyond a simple ROE
analysis: we have again used our Credit Suisse HOLT database to look at a more
comprehensive view of profitability, HOLT's proprietary metrics of CFROI (cash flow return
on investment) and Economic Profit (EP), to assess these companies' real economic
performance and to see if family companies create value by using capital effectively over
time.
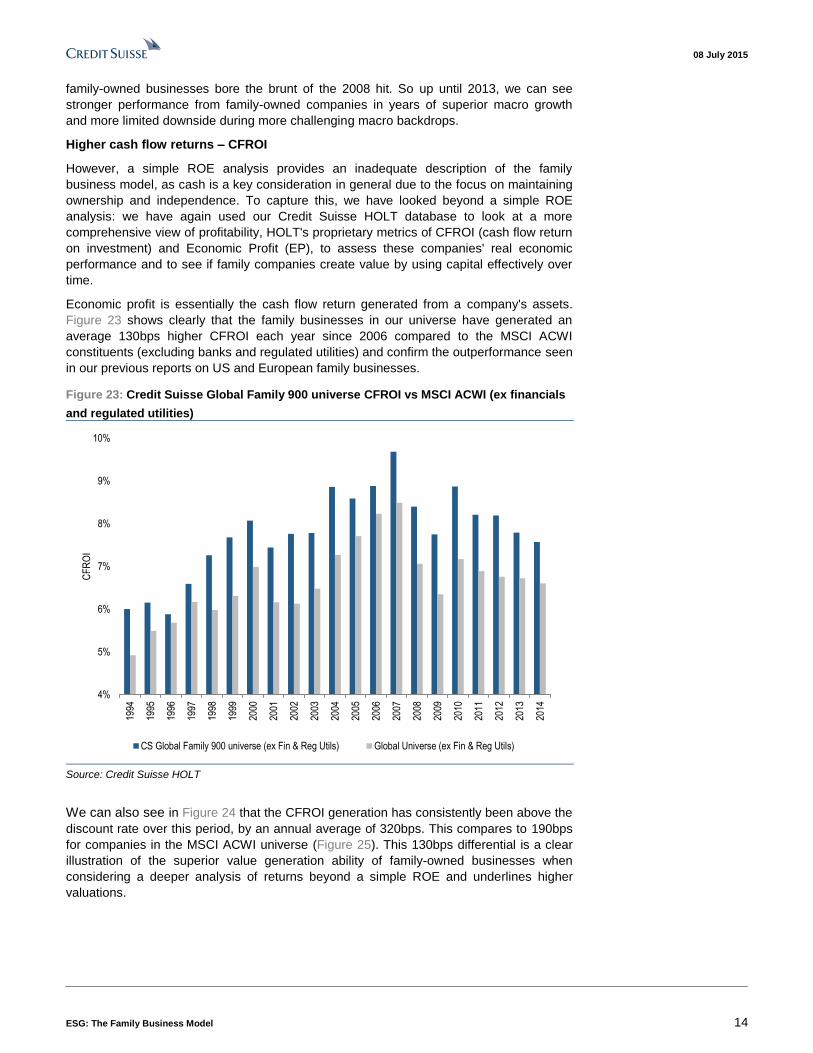
Economic profit is essentially the cash flow return generated from a company's assets.
Figure 23 shows clearly that the family businesses in our universe have generated an
average 130bps higher CFROI each year since 2006 compared to the MSCI ACWI
constituents (excluding banks and regulated utilities) and confirm the outperformance seen
in our previous reports on US and European family businesses.
Figure 23: Credit Suisse Global Family 900 universe CFROI vs MSCI ACWI (ex financials
and regulated utilities)
4%
5%
6%
7%
8%
9%
10%
1994
1995
1996
1997
1998
1999
2000
2001
2002
2003
2004
2005
2006
2007
2008
2009
2010
2011
2012
2013
2014
CF
RO
I
CS Global Family 900 universe (ex Fin & Reg Utils) Global Universe (ex Fin & Reg Utils)
Source: Credit Suisse HOLT
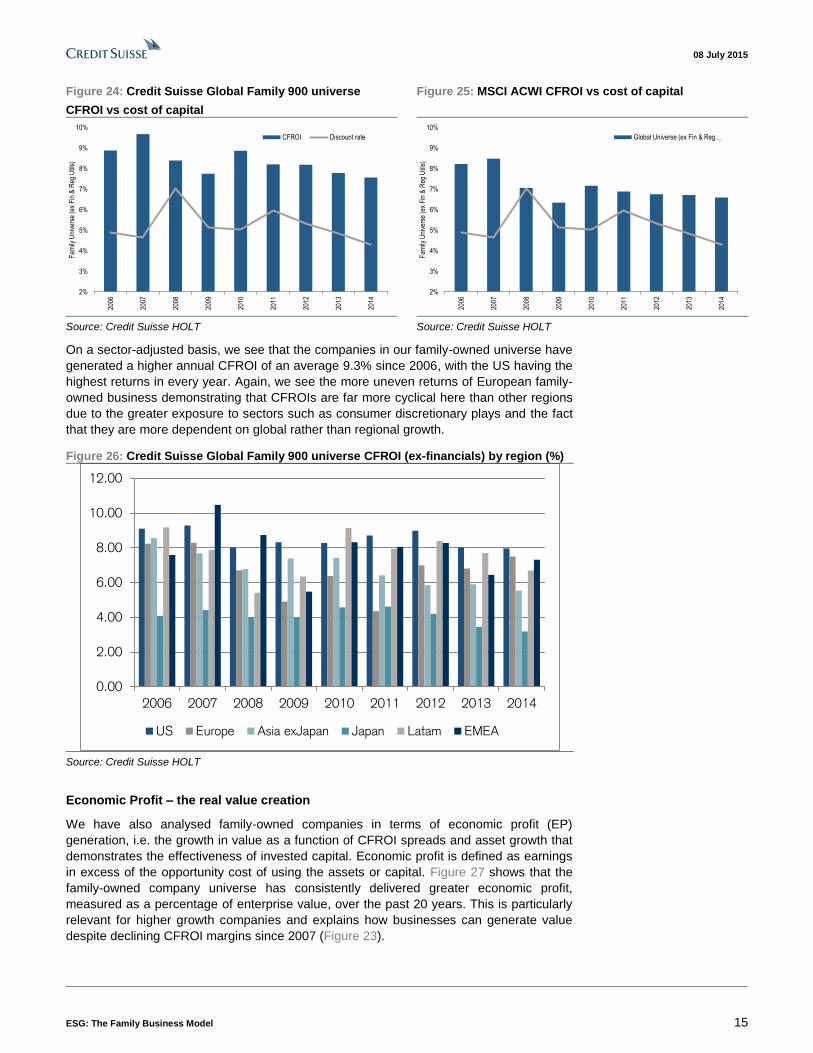
We can also see in Figure 24 that the CFROI generation has consistently been above the
discount rate over this period, by an annual average of 320bps. This compares to 190bps
for companies in the MSCI ACWI universe (Figure 25). This 130bps differential is a clear
illustration of the superior value generation ability of family-owned businesses when
considering a deeper analysis of returns beyond a simple ROE and underlines higher
valuations.
08 July 2015
ESG: The Family Business Model 15
Figure 24: Credit Suisse Global Family 900 universe
CFROI vs cost of capital
Figure 25: MSCI ACWI CFROI vs cost of capital
2%
3%
4%
5%
6%
7%
8%
9%
10%
2006
2007
2008
2009
2010
2011
2012
2013
2014
Fam
ily U
nive
rse
(ex
Fin
& R
eg U
tils)
CFROI Discount rate
2%
3%
4%
5%
6%
7%
8%
9%
10%
2006
2007
2008
2009
2010
2011
2012
2013
2014
Fam
ily U
nive
rse
(ex
Fin
& R
eg U
tils)
Global Universe (ex Fin & Reg…
Source: Credit Suisse HOLT Source: Credit Suisse HOLT
On a sector-adjusted basis, we see that the companies in our family-owned universe have
generated a higher annual CFROI of an average 9.3% since 2006, with the US having the
highest returns in every year. Again, we see the more uneven returns of European family-
owned business demonstrating that CFROIs are far more cyclical here than other regions
due to the greater exposure to sectors such as consumer discretionary plays and the fact
that they are more dependent on global rather than regional growth.
Figure 26: Credit Suisse Global Family 900 universe CFROI (ex-financials) by region (%)
0.00
2.00
4.00
6.00
8.00
10.00
12.00
2006 2007 2008 2009 2010 2011 2012 2013 2014
US Europe Asia exJapan Japan Latam EMEA
Source: Credit Suisse HOLT
Economic Profit – the real value creation
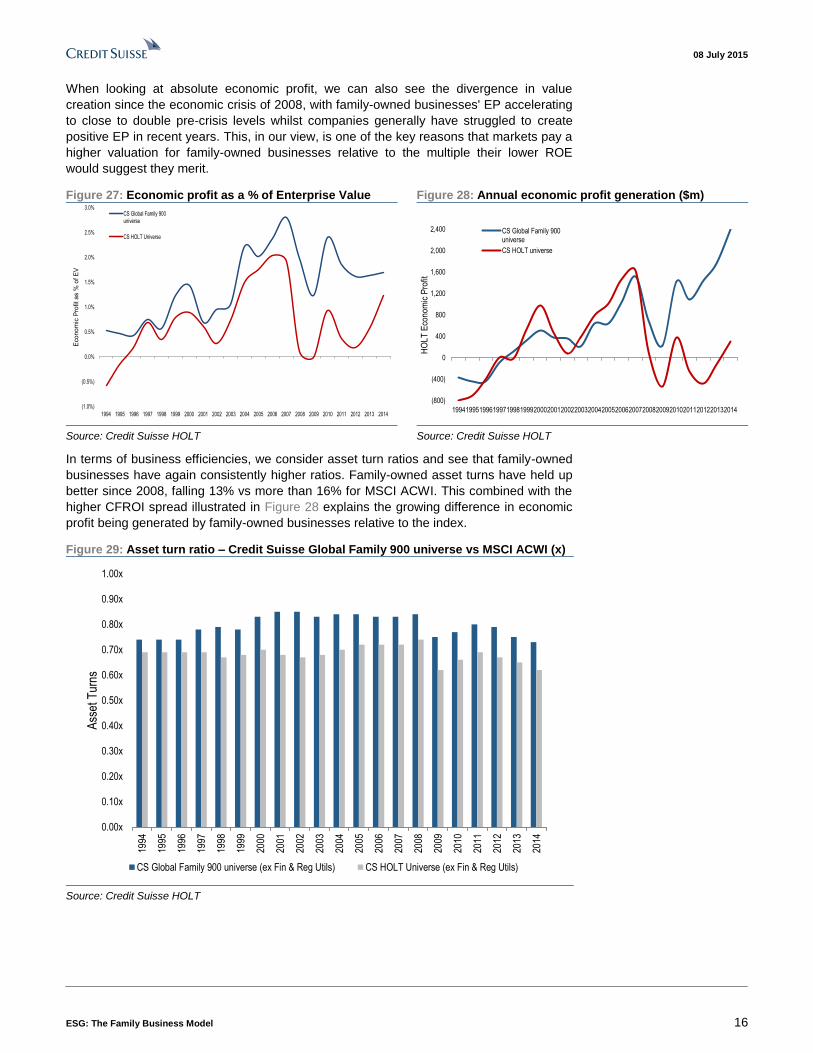
We have also analysed family-owned companies in terms of economic profit (EP)
generation, i.e. the growth in value as a function of CFROI spreads and asset growth that
demonstrates the effectiveness of invested capital. Economic profit is defined as earnings
in excess of the opportunity cost of using the assets or capital. Figure 27 shows that the
family-owned company universe has consistently delivered greater economic profit,
measured as a percentage of enterprise value, over the past 20 years. This is particularly
relevant for higher growth companies and explains how businesses can generate value
despite declining CFROI margins since 2007 (Figure 23).
08 July 2015
ESG: The Family Business Model 16
When looking at absolute economic profit, we can also see the divergence in value
creation since the economic crisis of 2008, with family-owned businesses' EP accelerating
to close to double pre-crisis levels whilst companies generally have struggled to create
positive EP in recent years. This, in our view, is one of the key reasons that markets pay a
higher valuation for family-owned businesses relative to the multiple their lower ROE
would suggest they merit.
Figure 27: Economic profit as a % of Enterprise Value Figure 28: Annual economic profit generation ($m)
(1.0%)
(0.5%)
0.0%
0.5%
1.0%
1.5%
2.0%
2.5%
3.0%
1994 1995 1996 1997 1998 1999 2000 2001 2002 2003 2004 2005 2006 2007 2008 2009 2010 2011 2012 2013 2014
Eco
no
mic
Pro
fit
as %
of
EV
CS Global Family 900universe
CS HOLT Universe
(800)
(400)
0
400
800
1,200
1,600
2,000
2,400
199419951996199719981999200020012002200320042005200620072008200920102011201220132014
HO
LT
Eco
no
mic
Pro
fit
CS Global Family 900universe
CS HOLT universe
Source: Credit Suisse HOLT Source: Credit Suisse HOLT
In terms of business efficiencies, we consider asset turn ratios and see that family-owned
businesses have again consistently higher ratios. Family-owned asset turns have held up
better since 2008, falling 13% vs more than 16% for MSCI ACWI. This combined with the
higher CFROI spread illustrated in Figure 28 explains the growing difference in economic
profit being generated by family-owned businesses relative to the index.
Figure 29: Asset turn ratio – Credit Suisse Global Family 900 universe vs MSCI ACWI (x)
0.00x
0.10x
0.20x
0.30x
0.40x
0.50x
0.60x
0.70x
0.80x
0.90x
1.00x
1994
1995
1996
1997
1998
1999
2000
2001
2002
2003
2004
2005
2006
2007
2008
2009
2010
2011
2012
2013
2014
Ass
et T
urns
CS Global Family 900 universe (ex Fin & Reg Utils) CS HOLT Universe (ex Fin & Reg Utils)
Source: Credit Suisse HOLT
08 July 2015
ESG: The Family Business Model 17
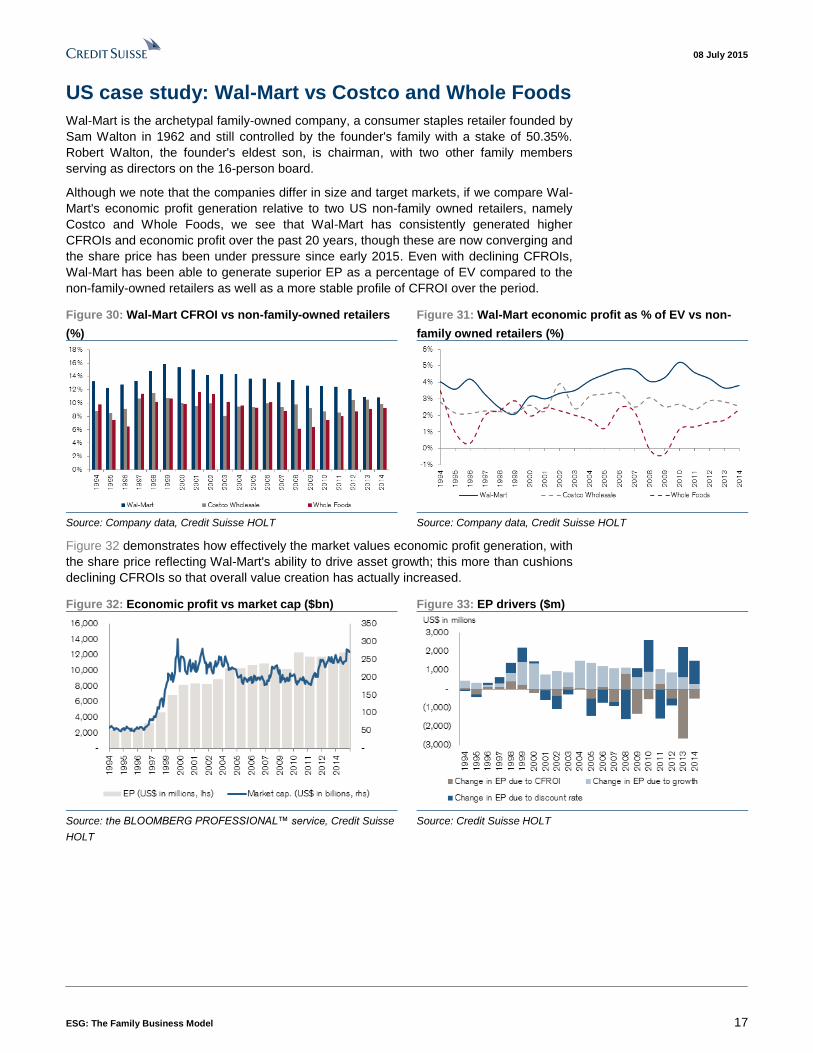
US case study: Wal-Mart vs Costco and Whole Foods
Wal-Mart is the archetypal family-owned company, a consumer staples retailer founded by
Sam Walton in 1962 and still controlled by the founder's family with a stake of 50.35%.
Robert Walton, the founder's eldest son, is chairman, with two other family members
serving as directors on the 16-person board.
Although we note that the companies differ in size and target markets, if we compare Wal-
Mart's economic profit generation relative to two US non-family owned retailers, namely
Costco and Whole Foods, we see that Wal-Mart has consistently generated higher
CFROIs and economic profit over the past 20 years, though these are now converging and
the share price has been under pressure since early 2015. Even with declining CFROIs,
Wal-Mart has been able to generate superior EP as a percentage of EV compared to the
non-family-owned retailers as well as a more stable profile of CFROI over the period.
Figure 30: Wal-Mart CFROI vs non-family-owned retailers
(%)
Figure 31: Wal-Mart economic profit as % of EV vs non-
family owned retailers (%)
Source: Company data, Credit Suisse HOLT Source: Company data, Credit Suisse HOLT
Figure 32 demonstrates how effectively the market values economic profit generation, with
the share price reflecting Wal-Mart's ability to drive asset growth; this more than cushions
declining CFROIs so that overall value creation has actually increased.
Figure 32: Economic profit vs market cap ($bn) Figure 33: EP drivers ($m)
Source: the BLOOMBERG PROFESSIONAL™ service, Credit Suisse
HOLT
Source: Credit Suisse HOLT
08 July 2015
ESG: The Family Business Model 18
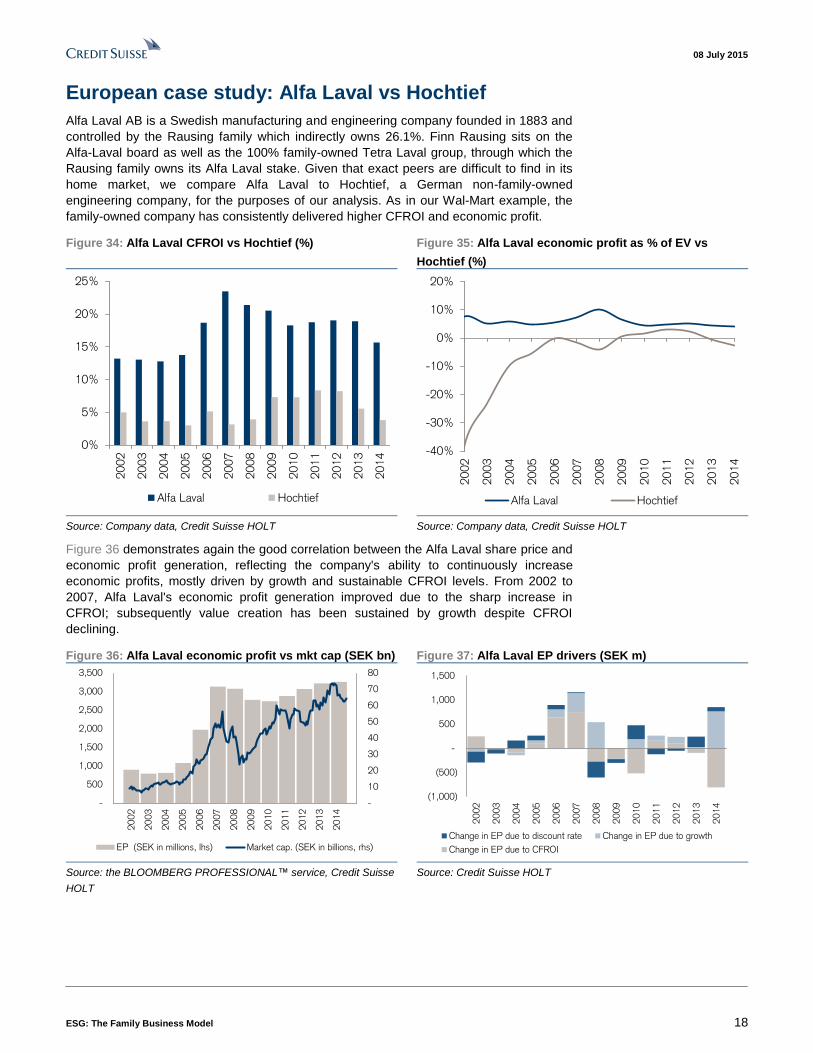
European case study: Alfa Laval vs Hochtief
Alfa Laval AB is a Swedish manufacturing and engineering company founded in 1883 and
controlled by the Rausing family which indirectly owns 26.1%. Finn Rausing sits on the
Alfa-Laval board as well as the 100% family-owned Tetra Laval group, through which the
Rausing family owns its Alfa Laval stake. Given that exact peers are difficult to find in its
home market, we compare Alfa Laval to Hochtief, a German non-family-owned
engineering company, for the purposes of our analysis. As in our Wal-Mart example, the
family-owned company has consistently delivered higher CFROI and economic profit.
Figure 34: Alfa Laval CFROI vs Hochtief (%) Figure 35: Alfa Laval economic profit as % of EV vs
Hochtief (%)
0%
5%
10%
15%
20%
25%
20
02
20
03
20
04
20
05
20
06
20
07
20
08
20
09
20
10
20
11
20
12
20
13
20
14
Alfa Laval Hochtief
-40%
-30%
-20%
-10%
0%
10%
20%
20
02
20
03
20
04
20
05
20
06
20
07
20
08
20
09
20
10
20
11
20
12
20
13
20
14
Alfa Laval Hochtief
Source: Company data, Credit Suisse HOLT Source: Company data, Credit Suisse HOLT
Figure 36 demonstrates again the good correlation between the Alfa Laval share price and
economic profit generation, reflecting the company's ability to continuously increase
economic profits, mostly driven by growth and sustainable CFROI levels. From 2002 to
2007, Alfa Laval's economic profit generation improved due to the sharp increase in
CFROI; subsequently value creation has been sustained by growth despite CFROI
declining.
Figure 36: Alfa Laval economic profit vs mkt cap (SEK bn) Figure 37: Alfa Laval EP drivers (SEK m)
2001 2002 2003 2004 2005 2006 2007 2008 2009 2010 2011 2012 2013 2014 2015
-
500
1,000
1,500
2,000
2,500
3,000
3,500
-
10
20
30
40
50
60
70
80
20
01
20
02
20
03
20
04
20
05
20
06
20
07
20
08
20
09
20
10
20
11
20
12
20
13
20
14
20
15
EP (SEK in millions, lhs) Market cap. (SEK in billions, rhs)
(1,000)
(500)
-
500
1,000
1,500
20
02
20
03
20
04
20
05
20
06
20
07
20
08
20
09
20
10
20
11
20
12
20
13
20
14
Change in EP due to discount rate Change in EP due to growth
Change in EP due to CFROI
Source: the BLOOMBERG PROFESSIONAL™ service, Credit Suisse
HOLT
Source: Credit Suisse HOLT
08 July 2015
ESG: The Family Business Model 19
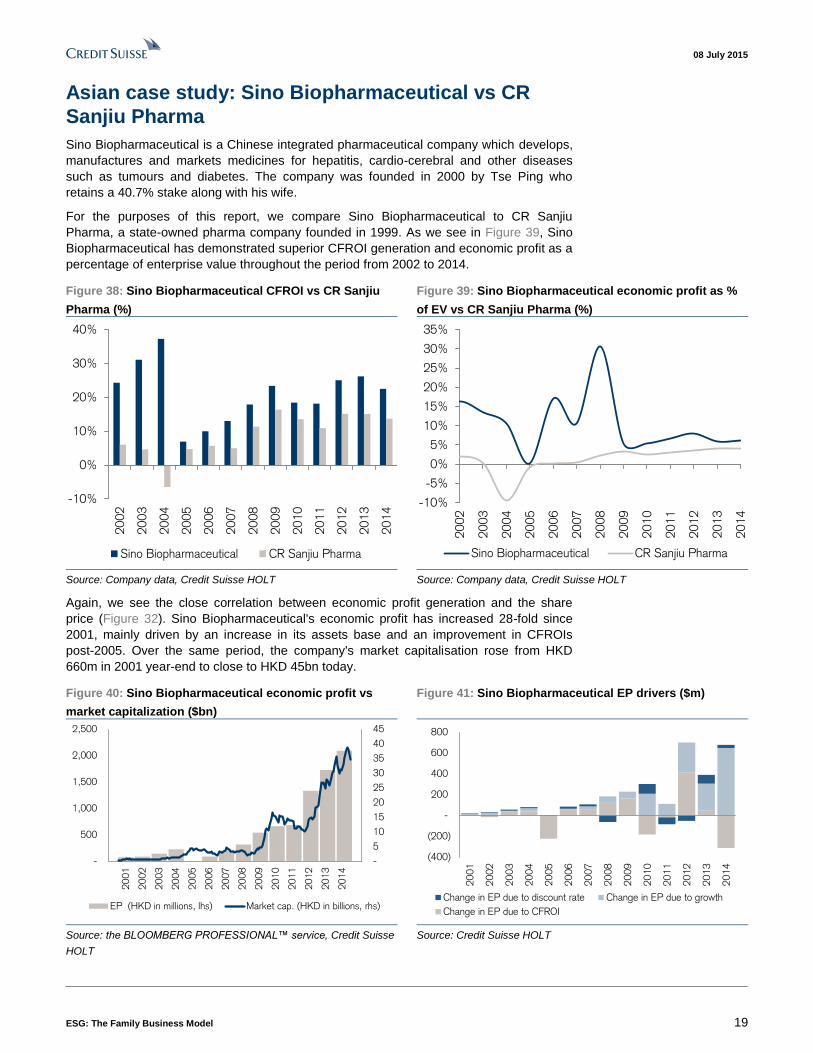
Asian case study: Sino Biopharmaceutical vs CR
Sanjiu Pharma
Sino Biopharmaceutical is a Chinese integrated pharmaceutical company which develops,
manufactures and markets medicines for hepatitis, cardio-cerebral and other diseases
such as tumours and diabetes. The company was founded in 2000 by Tse Ping who
retains a 40.7% stake along with his wife.
For the purposes of this report, we compare Sino Biopharmaceutical to CR Sanjiu
Pharma, a state-owned pharma company founded in 1999. As we see in Figure 39, Sino
Biopharmaceutical has demonstrated superior CFROI generation and economic profit as a
percentage of enterprise value throughout the period from 2002 to 2014.
Figure 38: Sino Biopharmaceutical CFROI vs CR Sanjiu
Pharma (%)
Figure 39: Sino Biopharmaceutical economic profit as %
of EV vs CR Sanjiu Pharma (%)
-10%
0%
10%
20%
30%
40%
20
02
20
03
20
04
20
05
20
06
20
07
20
08
20
09
20
10
20
11
20
12
20
13
20
14
Sino Biopharmaceutical CR Sanjiu Pharma
-10%
-5%
0%
5%
10%
15%
20%
25%
30%
35%
20
02
20
03
20
04
20
05
20
06
20
07
20
08
20
09
20
10
20
11
20
12
20
13
20
14
Sino Biopharmaceutical CR Sanjiu Pharma
Source: Company data, Credit Suisse HOLT Source: Company data, Credit Suisse HOLT
Again, we see the close correlation between economic profit generation and the share
price (Figure 32). Sino Biopharmaceutical's economic profit has increased 28-fold since
2001, mainly driven by an increase in its assets base and an improvement in CFROIs
post-2005. Over the same period, the company's market capitalisation rose from HKD
660m in 2001 year-end to close to HKD 45bn today.
Figure 40: Sino Biopharmaceutical economic profit vs
market capitalization ($bn)
Figure 41: Sino Biopharmaceutical EP drivers ($m)
2000 2001 2002 2003 2004 2005 2006 2007 2008 2009 2010 2011 2012 2013 2014 2015
-
500
1,000
1,500
2,000
2,500
-
5
10
15
20
25
30
35
40
45
20
00
20
01
20
02
20
03
20
04
20
05
20
06
20
07
20
08
20
09
20
10
20
11
20
12
20
13
20
14
20
15
EP (HKD in millions, lhs) Market cap. (HKD in billions, rhs)
(400)
(200)
-
200
400
600
800
20
01
20
02
20
03
20
04
20
05
20
06
20
07
20
08
20
09
20
10
20
11
20
12
20
13
20
14
Change in EP due to discount rate Change in EP due to growth
Change in EP due to CFROI
Source: the BLOOMBERG PROFESSIONAL™ service, Credit Suisse
HOLT
Source: Credit Suisse HOLT
08 July 2015
ESG: The Family Business Model 20
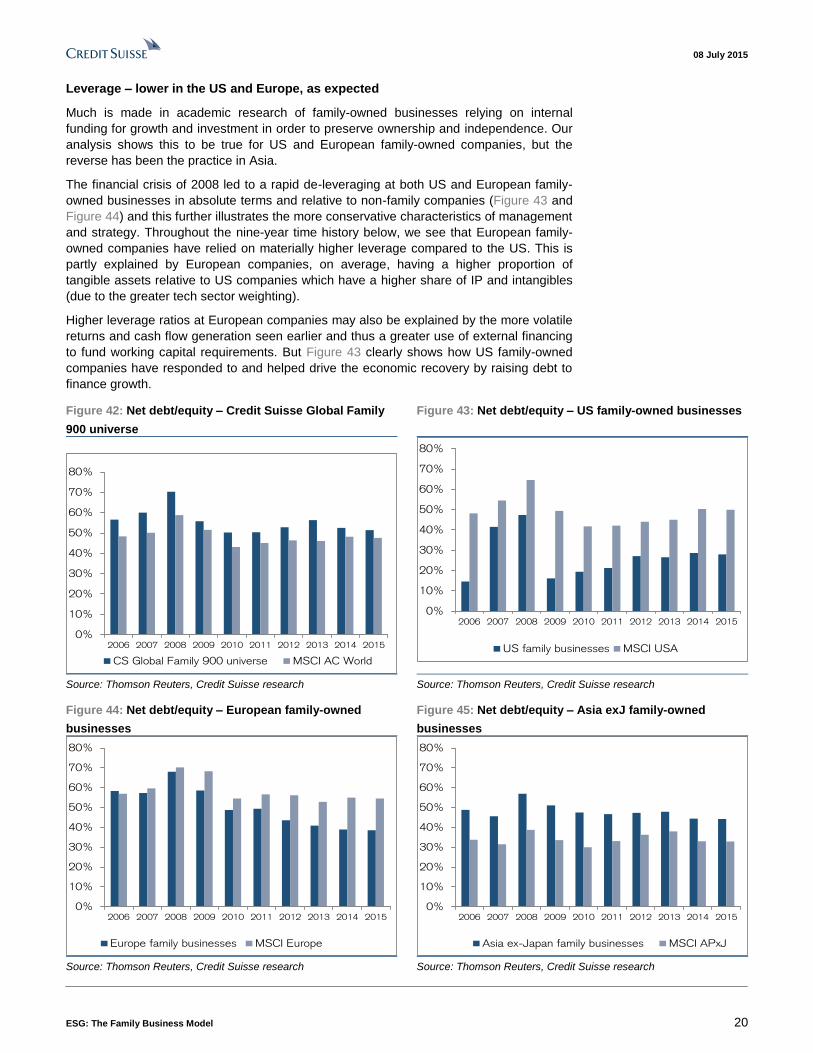
Leverage – lower in the US and Europe, as expected
Much is made in academic research of family-owned businesses relying on internal
funding for growth and investment in order to preserve ownership and independence. Our
analysis shows this to be true for US and European family-owned companies, but the
reverse has been the practice in Asia.
The financial crisis of 2008 led to a rapid de-leveraging at both US and European family-
owned businesses in absolute terms and relative to non-family companies (Figure 43 and
Figure 44) and this further illustrates the more conservative characteristics of management
and strategy. Throughout the nine-year time history below, we see that European family-
owned companies have relied on materially higher leverage compared to the US. This is
partly explained by European companies, on average, having a higher proportion of
tangible assets relative to US companies which have a higher share of IP and intangibles
(due to the greater tech sector weighting).
Higher leverage ratios at European companies may also be explained by the more volatile
returns and cash flow generation seen earlier and thus a greater use of external financing
to fund working capital requirements. But Figure 43 clearly shows how US family-owned
companies have responded to and helped drive the economic recovery by raising debt to
finance growth.
Figure 42: Net debt/equity – Credit Suisse Global Family
900 universe
Figure 43: Net debt/equity – US family-owned businesses
0%
10%
20%
30%
40%
50%
60%
70%
80%
2006 2007 2008 2009 2010 2011 2012 2013 2014 2015
CS Global Family 900 universe MSCI AC World
0%
10%
20%
30%
40%
50%
60%
70%
80%
2006 2007 2008 2009 2010 2011 2012 2013 2014 2015
US family businesses MSCI USA
Source: Thomson Reuters, Credit Suisse research Source: Thomson Reuters, Credit Suisse research
Figure 44: Net debt/equity – European family-owned
businesses
Figure 45: Net debt/equity – Asia exJ family-owned
businesses
0%
10%
20%
30%
40%
50%
60%
70%
80%
2006 2007 2008 2009 2010 2011 2012 2013 2014 2015
Europe family businesses MSCI Europe
0%
10%
20%
30%
40%
50%
60%
70%
80%
2006 2007 2008 2009 2010 2011 2012 2013 2014 2015
Asia ex-Japan family businesses MSCI APxJ
Source: Thomson Reuters, Credit Suisse research Source: Thomson Reuters, Credit Suisse research
08 July 2015
ESG: The Family Business Model 21
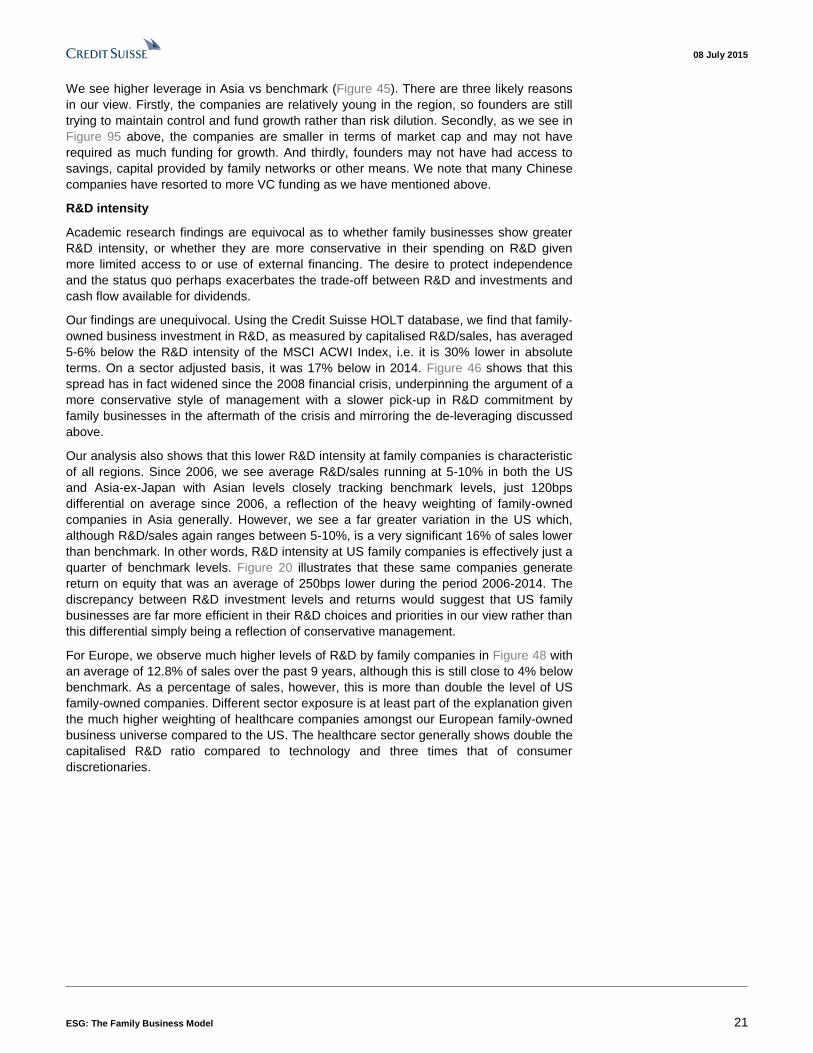
We see higher leverage in Asia vs benchmark (Figure 45). There are three likely reasons
in our view. Firstly, the companies are relatively young in the region, so founders are still
trying to maintain control and fund growth rather than risk dilution. Secondly, as we see in
Figure 95 above, the companies are smaller in terms of market cap and may not have
required as much funding for growth. And thirdly, founders may not have had access to
savings, capital provided by family networks or other means. We note that many Chinese
companies have resorted to more VC funding as we have mentioned above.
R&D intensity
Academic research findings are equivocal as to whether family businesses show greater
R&D intensity, or whether they are more conservative in their spending on R&D given
more limited access to or use of external financing. The desire to protect independence
and the status quo perhaps exacerbates the trade-off between R&D and investments and
cash flow available for dividends.
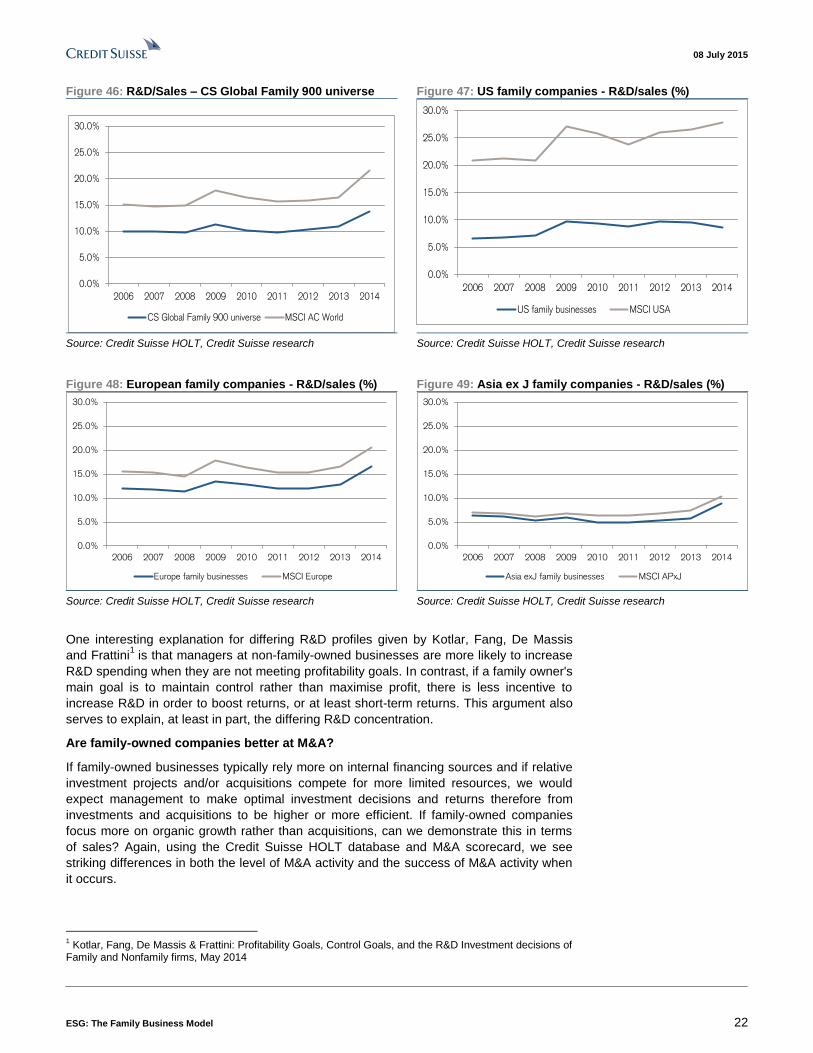
Our findings are unequivocal. Using the Credit Suisse HOLT database, we find that family-
owned business investment in R&D, as measured by capitalised R&D/sales, has averaged
5-6% below the R&D intensity of the MSCI ACWI Index, i.e. it is 30% lower in absolute
terms. On a sector adjusted basis, it was 17% below in 2014. Figure 46 shows that this
spread has in fact widened since the 2008 financial crisis, underpinning the argument of a
more conservative style of management with a slower pick-up in R&D commitment by
family businesses in the aftermath of the crisis and mirroring the de-leveraging discussed
above.
Our analysis also shows that this lower R&D intensity at family companies is characteristic
of all regions. Since 2006, we see average R&D/sales running at 5-10% in both the US
and Asia-ex-Japan with Asian levels closely tracking benchmark levels, just 120bps
differential on average since 2006, a reflection of the heavy weighting of family-owned
companies in Asia generally. However, we see a far greater variation in the US which,
although R&D/sales again ranges between 5-10%, is a very significant 16% of sales lower
than benchmark. In other words, R&D intensity at US family companies is effectively just a
quarter of benchmark levels. Figure 20 illustrates that these same companies generate
return on equity that was an average of 250bps lower during the period 2006-2014. The
discrepancy between R&D investment levels and returns would suggest that US family
businesses are far more efficient in their R&D choices and priorities in our view rather than
this differential simply being a reflection of conservative management.
For Europe, we observe much higher levels of R&D by family companies in Figure 48 with
an average of 12.8% of sales over the past 9 years, although this is still close to 4% below
benchmark. As a percentage of sales, however, this is more than double the level of US
family-owned companies. Different sector exposure is at least part of the explanation given
the much higher weighting of healthcare companies amongst our European family-owned
business universe compared to the US. The healthcare sector generally shows double the
capitalised R&D ratio compared to technology and three times that of consumer
discretionaries.
08 July 2015
ESG: The Family Business Model 22
Figure 46: R&D/Sales – CS Global Family 900 universe Figure 47: US family companies - R&D/sales (%)
0.0%
5.0%
10.0%
15.0%
20.0%
25.0%
30.0%
2006 2007 2008 2009 2010 2011 2012 2013 2014
CS Global Family 900 universe MSCI AC World
0.0%
5.0%
10.0%
15.0%
20.0%
25.0%
30.0%
2006 2007 2008 2009 2010 2011 2012 2013 2014
US family businesses MSCI USA
Source: Credit Suisse HOLT, Credit Suisse research Source: Credit Suisse HOLT, Credit Suisse research
Figure 48: European family companies - R&D/sales (%) Figure 49: Asia ex J family companies - R&D/sales (%)
0.0%
5.0%
10.0%
15.0%
20.0%
25.0%
30.0%
2006 2007 2008 2009 2010 2011 2012 2013 2014
Europe family businesses MSCI Europe
0.0%
5.0%
10.0%
15.0%
20.0%
25.0%
30.0%
2006 2007 2008 2009 2010 2011 2012 2013 2014
Asia exJ family businesses MSCI APxJ
Source: Credit Suisse HOLT, Credit Suisse research Source: Credit Suisse HOLT, Credit Suisse research
One interesting explanation for differing R&D profiles given by Kotlar, Fang, De Massis
and Frattini1 is that managers at non-family-owned businesses are more likely to increase
R&D spending when they are not meeting profitability goals. In contrast, if a family owner's
main goal is to maintain control rather than maximise profit, there is less incentive to
increase R&D in order to boost returns, or at least short-term returns. This argument also
serves to explain, at least in part, the differing R&D concentration.
Are family-owned companies better at M&A?
If family-owned businesses typically rely more on internal financing sources and if relative
investment projects and/or acquisitions compete for more limited resources, we would
expect management to make optimal investment decisions and returns therefore from
investments and acquisitions to be higher or more efficient. If family-owned companies
focus more on organic growth rather than acquisitions, can we demonstrate this in terms
of sales? Again, using the Credit Suisse HOLT database and M&A scorecard, we see
striking differences in both the level of M&A activity and the success of M&A activity when
it occurs.
1 Kotlar, Fang, De Massis & Frattini: Profitability Goals, Control Goals, and the R&D Investment decisions of
Family and Nonfamily firms, May 2014
08 July 2015
ESG: The Family Business Model 23
We have measured M&A activity in the family-owned universe and compared it to non-
family-owned companies in the Credit Suisse HOLT database. We find that since 1990,
family-owned business have spent an average of 2.1% of sales on M&A annually
compared to 5.8% at non-family-owned companies. This is more than 60% lower in
absolute terms and goes hand in hand with lower R&D, underpinning the interpretation of
conservatism and a reliance on organic rather than acquisition-led growth.
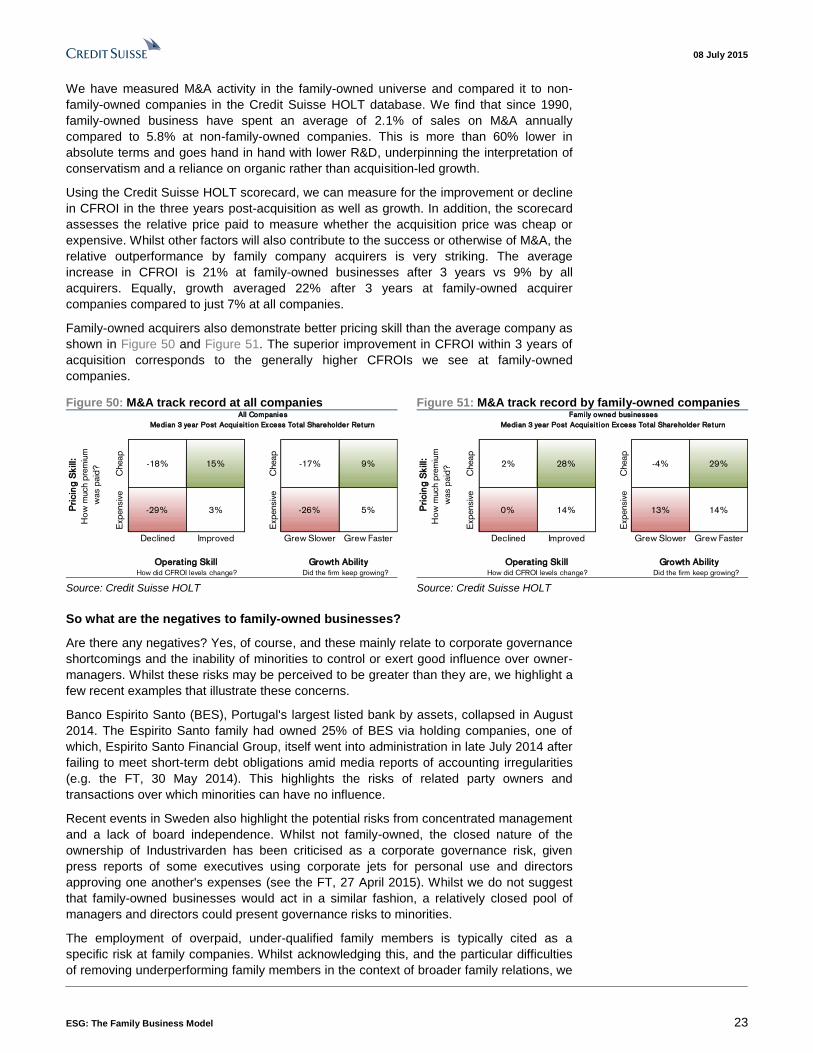
Using the Credit Suisse HOLT scorecard, we can measure for the improvement or decline
in CFROI in the three years post-acquisition as well as growth. In addition, the scorecard
assesses the relative price paid to measure whether the acquisition price was cheap or
expensive. Whilst other factors will also contribute to the success or otherwise of M&A, the
relative outperformance by family company acquirers is very striking. The average
increase in CFROI is 21% at family-owned businesses after 3 years vs 9% by all
acquirers. Equally, growth averaged 22% after 3 years at family-owned acquirer
companies compared to just 7% at all companies.
Family-owned acquirers also demonstrate better pricing skill than the average company as
shown in Figure 50 and Figure 51. The superior improvement in CFROI within 3 years of
acquisition corresponds to the generally higher CFROIs we see at family-owned
companies.
Figure 50: M&A track record at all companies Figure 51: M&A track record by family-owned companies
Cheap
-18% 15%
Cheap
-17% 9%
Exp
ensiv
e
-29% 3%
Exp
ensiv
e
-26% 5%
Declined Improved Grew Slower Grew Faster
How did CFROI levels change? Did the firm keep growing?
All Companies
Median 3 year Post Acquisi t ion Excess Total Shareholder Return
Pri
cin
g S
kill:
Ho
w m
uch p
rem
ium
was p
aid
?
Operat ing Skill Growth Ability
Cheap
2% 28%
Cheap
-4% 29%E
xpensiv
e
0% 14%
Exp
ensiv
e
13% 14%
Declined Improved Grew Slower Grew Faster
How did CFROI levels change? Did the firm keep growing?
Fami ly owned businesses
Median 3 year Post Acquisi t ion Excess Total Shareholder ReturnP
ric
ing
Sk
ill:
Ho
w m
uch p
rem
ium
was p
aid
?
Operat ing Skill Growth Ability
Source: Credit Suisse HOLT Source: Credit Suisse HOLT
So what are the negatives to family-owned businesses?
Are there any negatives? Yes, of course, and these mainly relate to corporate governance
shortcomings and the inability of minorities to control or exert good influence over owner-
managers. Whilst these risks may be perceived to be greater than they are, we highlight a
few recent examples that illustrate these concerns.
Banco Espirito Santo (BES), Portugal's largest listed bank by assets, collapsed in August
2014. The Espirito Santo family had owned 25% of BES via holding companies, one of
which, Espirito Santo Financial Group, itself went into administration in late July 2014 after
failing to meet short-term debt obligations amid media reports of accounting irregularities
(e.g. the FT, 30 May 2014). This highlights the risks of related party owners and
transactions over which minorities can have no influence.
Recent events in Sweden also highlight the potential risks from concentrated management
and a lack of board independence. Whilst not family-owned, the closed nature of the
ownership of Industrivarden has been criticised as a corporate governance risk, given
press reports of some executives using corporate jets for personal use and directors
approving one another's expenses (see the FT, 27 April 2015). Whilst we do not suggest
that family-owned businesses would act in a similar fashion, a relatively closed pool of
managers and directors could present governance risks to minorities.
The employment of overpaid, under-qualified family members is typically cited as a
specific risk at family companies. Whilst acknowledging this, and the particular difficulties
of removing underperforming family members in the context of broader family relations, we
08 July 2015
ESG: The Family Business Model 24
witness an increasing level of professional education and qualifications amongst later
generations taking over from the founding entrepreneur. These issues are of course more
important when families retain a greater stake in the company.
A number of family-owned companies offer different classes of shares, most typically non-
voting shares to external shareholders. This has been a trend in many tech companies
that have IPOed in recent years enabling founders to sell down whilst securing control
nonetheless. The Renault AGM of April 2015 highlighted the drawbacks of different voting
rights proposals when the French government used the Florange Law to ensure double
voting rights for its 15% stake in the company and secure control. Given that most retail
shares are held in bearer form and it is the larger shareholders and particularly key
shareholders who are named on the register, this law has served to further entrench and
concentrate family control. Most of the family-owned companies in France have double
voting rights now; the most notable exception is L'Oreal, which voted in April 2015 to
maintain one share one vote. The adoption of double voting rights to reward long-term
investors is a clear negative, in our view.
The risk of succession and survivorship
Succession and the business risks around succession within a family-owned company are
cited as a key potential cost to external investors. We have looked to see if there is any
evidence of the challenges for family companies as they switch from wealth creation to
wealth inheritance. Of the 920 companies in our universe, 384, or 42% were listed after
2000. In fact, 3% were listed in the past five years. The vast majority of these have been
Asian companies, underlining both the more recent economic development of the region
and the long established role of entrepreneurship. The higher number of Asian IPOs vs
European and US ones is also explained by the depressed state of capital markets in
recent years and the reluctance of founders and families in the latter markets to sell at
these valuations.
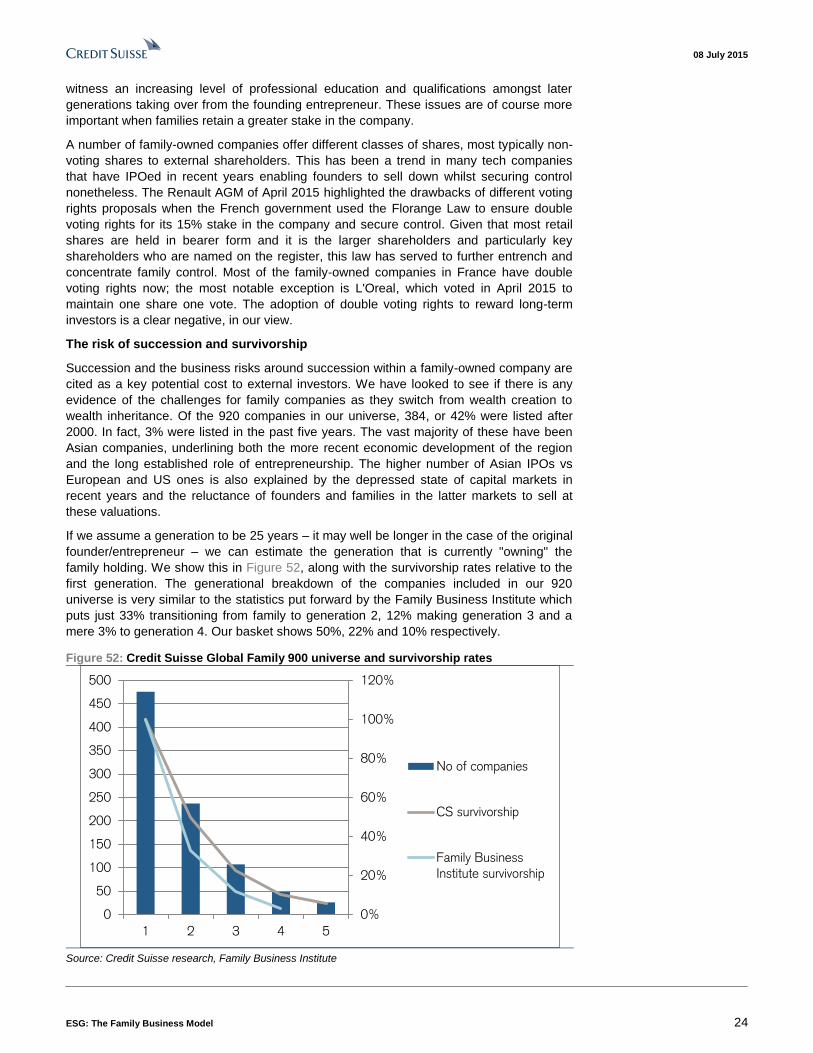
If we assume a generation to be 25 years – it may well be longer in the case of the original
founder/entrepreneur – we can estimate the generation that is currently "owning" the
family holding. We show this in Figure 52, along with the survivorship rates relative to the
first generation. The generational breakdown of the companies included in our 920
universe is very similar to the statistics put forward by the Family Business Institute which
puts just 33% transitioning from family to generation 2, 12% making generation 3 and a
mere 3% to generation 4. Our basket shows 50%, 22% and 10% respectively.
Figure 52: Credit Suisse Global Family 900 universe and survivorship rates
0%
20%
40%
60%
80%
100%
120%
0
50
100
150
200
250
300
350
400
450
500
1 2 3 4 5
No of companies
CS survivorship
Family Business
Institute survivorship
Source: Credit Suisse research, Family Business Institute
08 July 2015
ESG: The Family Business Model 25
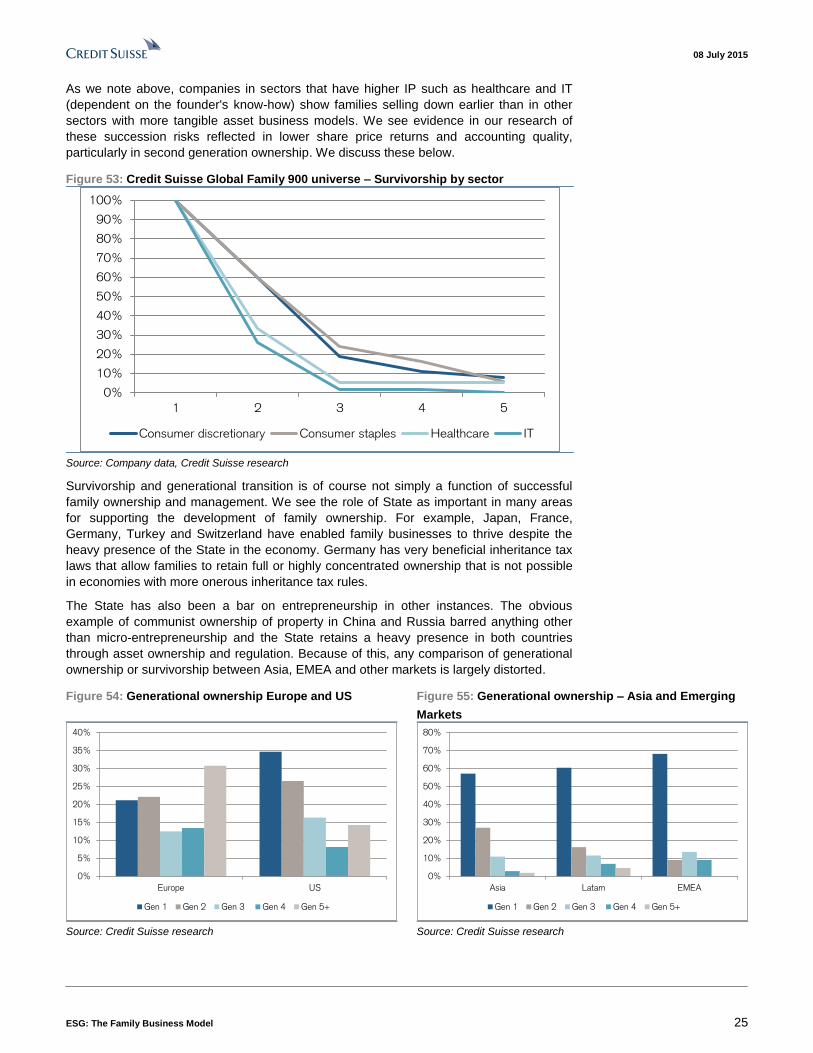
As we note above, companies in sectors that have higher IP such as healthcare and IT
(dependent on the founder's know-how) show families selling down earlier than in other
sectors with more tangible asset business models. We see evidence in our research of
these succession risks reflected in lower share price returns and accounting quality,
particularly in second generation ownership. We discuss these below.
Figure 53: Credit Suisse Global Family 900 universe – Survivorship by sector
0%
10%
20%
30%
40%
50%
60%
70%
80%
90%
100%
1 2 3 4 5
Consumer discretionary Consumer staples Healthcare IT
Source: Company data, Credit Suisse research
Survivorship and generational transition is of course not simply a function of successful
family ownership and management. We see the role of State as important in many areas
for supporting the development of family ownership. For example, Japan, France,
Germany, Turkey and Switzerland have enabled family businesses to thrive despite the
heavy presence of the State in the economy. Germany has very beneficial inheritance tax
laws that allow families to retain full or highly concentrated ownership that is not possible
in economies with more onerous inheritance tax rules.
The State has also been a bar on entrepreneurship in other instances. The obvious
example of communist ownership of property in China and Russia barred anything other
than micro-entrepreneurship and the State retains a heavy presence in both countries
through asset ownership and regulation. Because of this, any comparison of generational
ownership or survivorship between Asia, EMEA and other markets is largely distorted.
Figure 54: Generational ownership Europe and US Figure 55: Generational ownership – Asia and Emerging
Markets
0%
5%
10%
15%
20%
25%
30%
35%
40%
Europe US
Gen 1 Gen 2 Gen 3 Gen 4 Gen 5+
0%
10%
20%
30%
40%
50%
60%
70%
80%
Asia Latam EMEA
Gen 1 Gen 2 Gen 3 Gen 4 Gen 5+
Source: Credit Suisse research Source: Credit Suisse research
08 July 2015
ESG: The Family Business Model 26
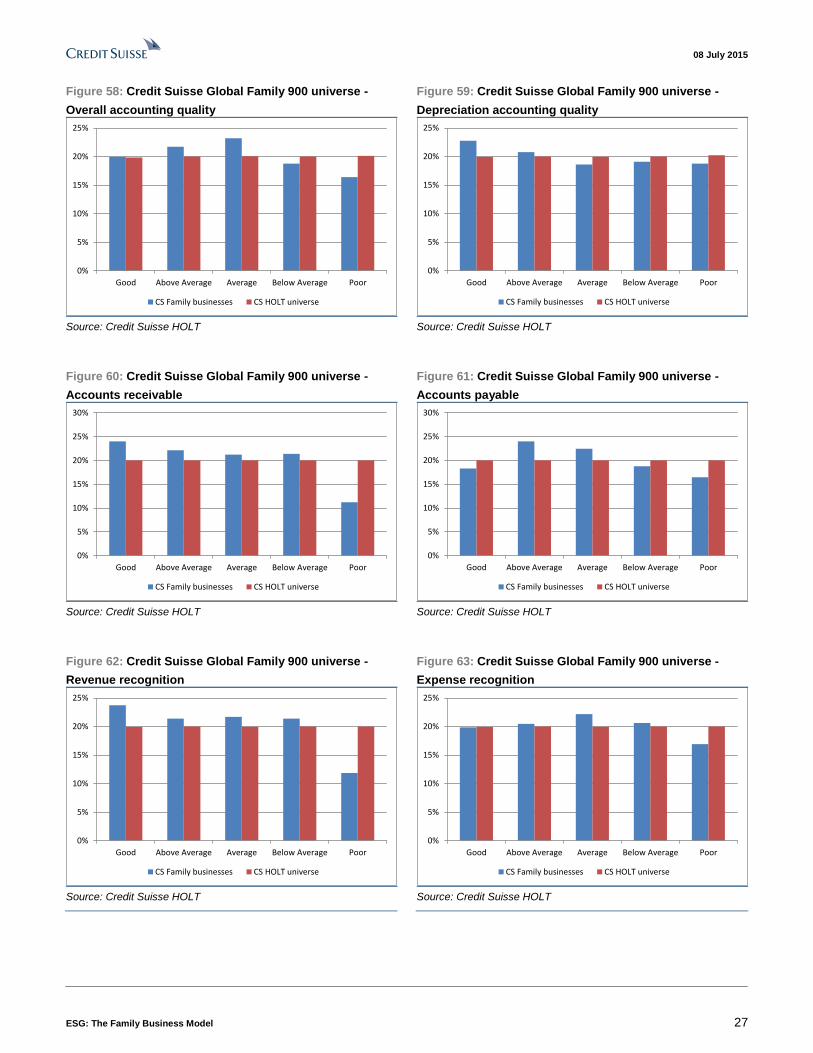
Accounting quality is in fact superior
In addition to MSCI ESG rankings, we are able to look at proprietary indicators using
Credit Suisse HOLT as an alternative proxy for corporate governance and assess the real
risks of family owners' interests vs outside shareholders. Using Credit Suisse HOLT's
accounting analysis, we have found no evidence of potential agency costs or actual
discrepancies in accounting practice that are to the detriment of minorities. In fact,
accounting quality (Figure 58) at family-owned businesses is generally superior to the
overall Credit Suisse HOLT universe with 67% of the companies ranking average or above
compared to the 60% within Credit Suisse HOLT (the companies being ranked into
quintiles).
When we consider more detailed accounting metrics, we also see this superior practice at
family-owned companies. Accounts receivable show 67% of these companies rank
average or above along with 64% on accounts payable. This might also suggest better
working capital management. Similarly, we see 65% of family-owned companies ranked
as average or above on revenue recognition and 62% for expense recognition implying
good transparency and reliability of financial statements. From this accounting point of
view, we believe that some of the perceived corporate governance risks may be
overstated and that there is a better alignment of interests by family and minority owners
than may be generally perceived.
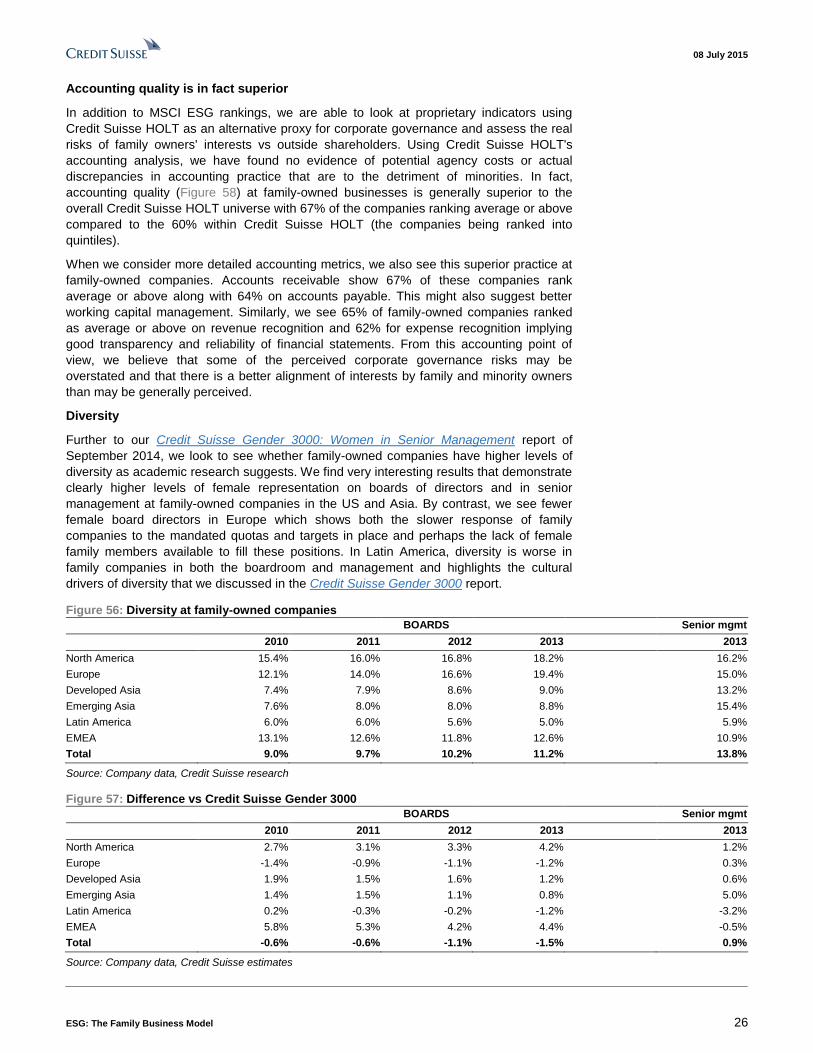
Diversity
Further to our Credit Suisse Gender 3000: Women in Senior Management report of
September 2014, we look to see whether family-owned companies have higher levels of
diversity as academic research suggests. We find very interesting results that demonstrate
clearly higher levels of female representation on boards of directors and in senior
management at family-owned companies in the US and Asia. By contrast, we see fewer
female board directors in Europe which shows both the slower response of family
companies to the mandated quotas and targets in place and perhaps the lack of female
family members available to fill these positions. In Latin America, diversity is worse in
family companies in both the boardroom and management and highlights the cultural
drivers of diversity that we discussed in the Credit Suisse Gender 3000 report.
Figure 56: Diversity at family-owned companies
BOARDS Senior mgmt
2010 2011 2012 2013 2013
North America 15.4% 16.0% 16.8% 18.2% 16.2%
Europe 12.1% 14.0% 16.6% 19.4% 15.0%
Developed Asia 7.4% 7.9% 8.6% 9.0% 13.2%
Emerging Asia 7.6% 8.0% 8.0% 8.8% 15.4%
Latin America 6.0% 6.0% 5.6% 5.0% 5.9%
EMEA 13.1% 12.6% 11.8% 12.6% 10.9%
Total 9.0% 9.7% 10.2% 11.2% 13.8%
Source: Company data, Credit Suisse research
Figure 57: Difference vs Credit Suisse Gender 3000
BOARDS Senior mgmt
2010 2011 2012 2013 2013
North America 2.7% 3.1% 3.3% 4.2% 1.2%
Europe -1.4% -0.9% -1.1% -1.2% 0.3%
Developed Asia 1.9% 1.5% 1.6% 1.2% 0.6%
Emerging Asia 1.4% 1.5% 1.1% 0.8% 5.0%
Latin America 0.2% -0.3% -0.2% -1.2% -3.2%
EMEA 5.8% 5.3% 4.2% 4.4% -0.5%
Total -0.6% -0.6% -1.1% -1.5% 0.9%
Source: Company data, Credit Suisse estimates
08 July 2015
ESG: The Family Business Model 27
Figure 58: Credit Suisse Global Family 900 universe -
Overall accounting quality
Figure 59: Credit Suisse Global Family 900 universe -
Depreciation accounting quality
0%
5%
10%
15%
20%
25%
Good Above Average Average Below Average Poor
CS Family businesses CS HOLT universe
0%
5%
10%
15%
20%
25%
Good Above Average Average Below Average Poor
CS Family businesses CS HOLT universe
Source: Credit Suisse HOLT Source: Credit Suisse HOLT
Figure 60: Credit Suisse Global Family 900 universe -
Accounts receivable
Figure 61: Credit Suisse Global Family 900 universe -
Accounts payable
0%
5%
10%
15%
20%
25%
30%
Good Above Average Average Below Average Poor
CS Family businesses CS HOLT universe
0%
5%
10%
15%
20%
25%
30%
Good Above Average Average Below Average Poor
CS Family businesses CS HOLT universe
Source: Credit Suisse HOLT Source: Credit Suisse HOLT
Figure 62: Credit Suisse Global Family 900 universe -
Revenue recognition
Figure 63: Credit Suisse Global Family 900 universe -
Expense recognition
0%
5%
10%
15%
20%
25%
Good Above Average Average Below Average Poor
CS Family businesses CS HOLT universe
0%
5%
10%
15%
20%
25%
Good Above Average Average Below Average Poor
CS Family businesses CS HOLT universe
Source: Credit Suisse HOLT Source: Credit Suisse HOLT
08 July 2015
ESG: The Family Business Model 28
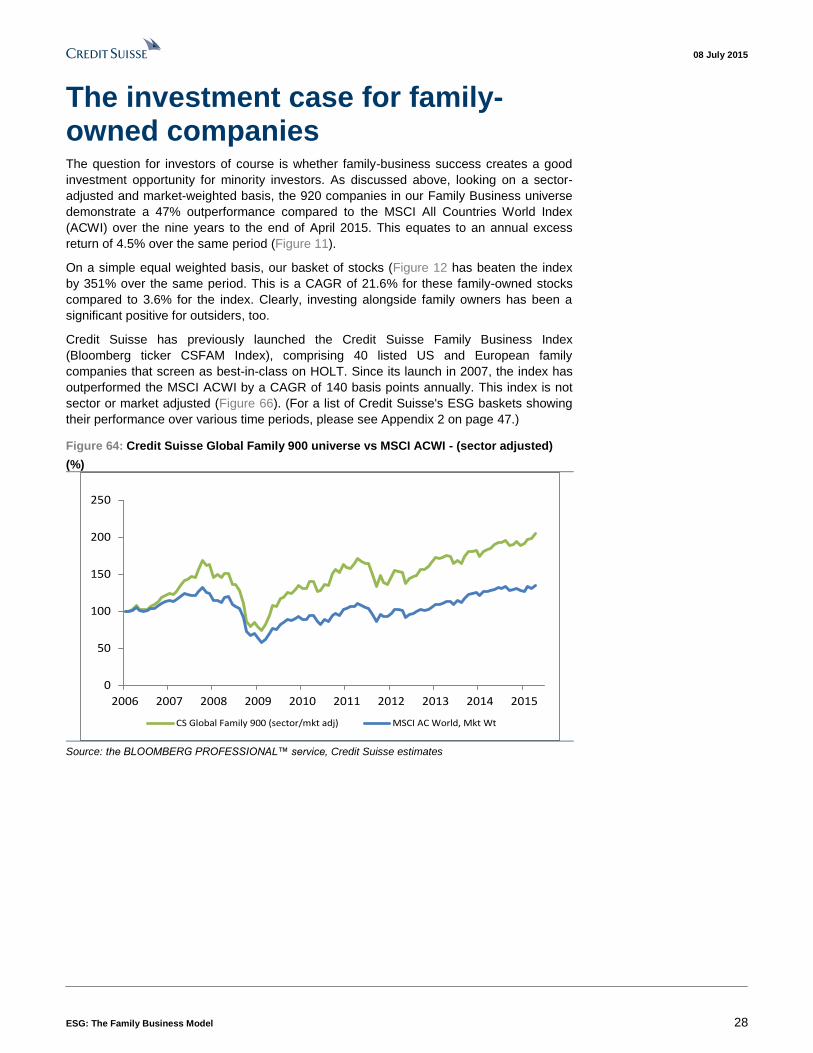
The investment case for family-owned companies The question for investors of course is whether family-business success creates a good
investment opportunity for minority investors. As discussed above, looking on a sector-
adjusted and market-weighted basis, the 920 companies in our Family Business universe
demonstrate a 47% outperformance compared to the MSCI All Countries World Index
(ACWI) over the nine years to the end of April 2015. This equates to an annual excess
return of 4.5% over the same period (Figure 11).
On a simple equal weighted basis, our basket of stocks (Figure 12 has beaten the index
by 351% over the same period. This is a CAGR of 21.6% for these family-owned stocks
compared to 3.6% for the index. Clearly, investing alongside family owners has been a
significant positive for outsiders, too.
Credit Suisse has previously launched the Credit Suisse Family Business Index
(Bloomberg ticker CSFAM Index), comprising 40 listed US and European family
companies that screen as best-in-class on HOLT. Since its launch in 2007, the index has
outperformed the MSCI ACWI by a CAGR of 140 basis points annually. This index is not
sector or market adjusted (Figure 66). (For a list of Credit Suisse's ESG baskets showing
their performance over various time periods, please see Appendix 2 on page 47.)
Figure 64: Credit Suisse Global Family 900 universe vs MSCI ACWI - (sector adjusted)
(%)
0
50
100
150
200
250
2006 2007 2008 2009 2010 2011 2012 2013 2014 2015
CS Global Family 900 (sector/mkt adj) MSCI AC World, Mkt Wt
Source: the BLOOMBERG PROFESSIONAL™ service, Credit Suisse estimates
08 July 2015
ESG: The Family Business Model 29
Figure 65: Credit Suisse Global Family 900 universe vs MSCI ACWI – equal weighted
0
100
200
300
400
500
600
700
2006 2007 2008 2009 2010 2011 2012 2013 2014 2015
CS Global Family 900 universe (equal wt) MSCI AC World
Source: the BLOOMBERG PROFESSIONAL™ service, Credit Suisse research
Figure 66: Credit Suisse Family Index Total Return vs MSCI ACWI
0
20
40
60
80
100
120
140
160
180
2007 2008 2009 2010 2011 2012 2013 2014 2015
CS Family Index MSCI ACWI
Note: Past performance is no guarantee of future returns. (For a list of Credit Suisse's ESG baskets
showing their performance over various time periods, please see Appendix 2 on page 47.)
Source: Credit Suisse HOLT, the BLOOMBERG PROFESSIONAL™ service
Figure 67: Returns and valuations for family-owned companies - 2014
ROE CFROI EV/EBITDA P/B Net debt/Equity Net debt/EBITDA
Global 11.5% 6.4% 10.6 2.1 52.0% 1.8
US 12.0% 9.1% 13.2 3.3 30.7% 1.1
Europe 12.1% 7..5% 9.2 2.0 42.7% 1.3
Asia 10.8% 5.5% 9.7 1.7 44.4% 1.7
Latam 9.3% 6.7% 10.1 2.1 86.6% 2.6
EMEA 17.9% 8.1% 18.6 1.8 82.6% 1.9
Source: Company data, Credit Suisse HOLT, Credit Suisse estimates
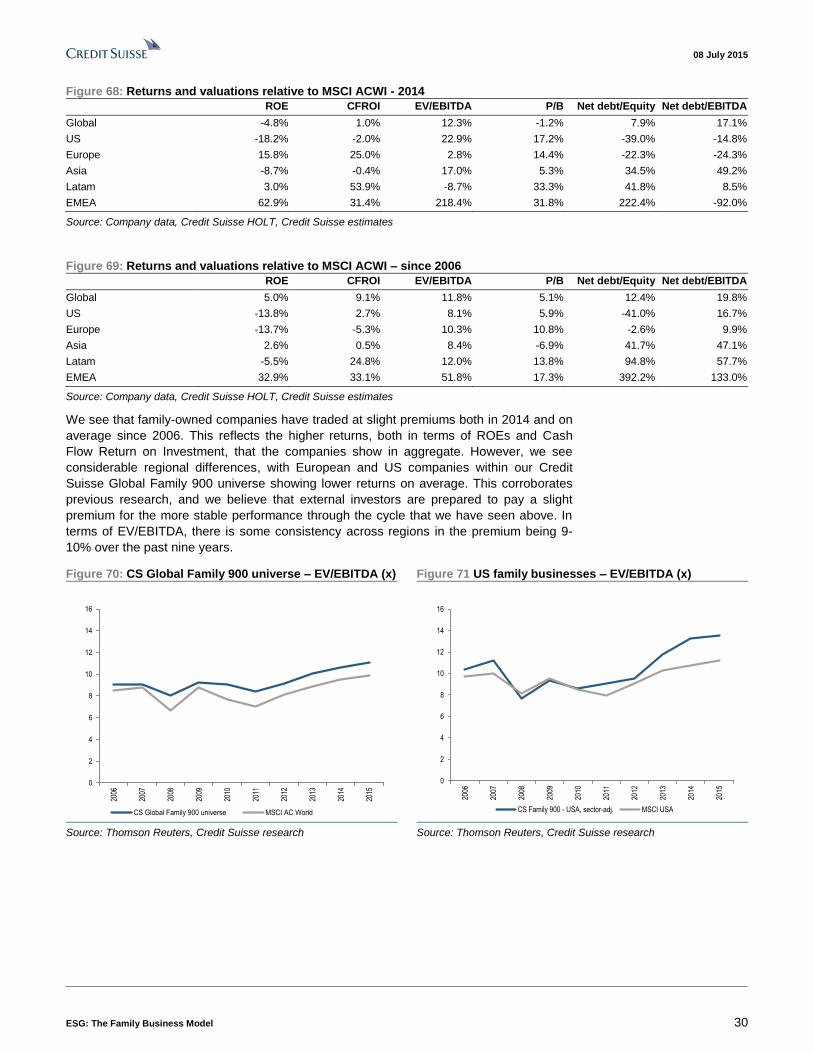
08 July 2015
ESG: The Family Business Model 30
Figure 68: Returns and valuations relative to MSCI ACWI - 2014
ROE CFROI EV/EBITDA P/B Net debt/Equity Net debt/EBITDA
Global -4.8% 1.0% 12.3% -1.2% 7.9% 17.1%
US -18.2% -2.0% 22.9% 17.2% -39.0% -14.8%
Europe 15.8% 25.0% 2.8% 14.4% -22.3% -24.3%
Asia -8.7% -0.4% 17.0% 5.3% 34.5% 49.2%
Latam 3.0% 53.9% -8.7% 33.3% 41.8% 8.5%
EMEA 62.9% 31.4% 218.4% 31.8% 222.4% -92.0%
Source: Company data, Credit Suisse HOLT, Credit Suisse estimates
Figure 69: Returns and valuations relative to MSCI ACWI – since 2006
ROE CFROI EV/EBITDA P/B Net debt/Equity Net debt/EBITDA
Global 5.0% 9.1% 11.8% 5.1% 12.4% 19.8%
US -13.8% 2.7% 8.1% 5.9% -41.0% 16.7%
Europe -13.7% -5.3% 10.3% 10.8% -2.6% 9.9%
Asia 2.6% 0.5% 8.4% -6.9% 41.7% 47.1%
Latam -5.5% 24.8% 12.0% 13.8% 94.8% 57.7%
EMEA 32.9% 33.1% 51.8% 17.3% 392.2% 133.0%
Source: Company data, Credit Suisse HOLT, Credit Suisse estimates
We see that family-owned companies have traded at slight premiums both in 2014 and on
average since 2006. This reflects the higher returns, both in terms of ROEs and Cash
Flow Return on Investment, that the companies show in aggregate. However, we see
considerable regional differences, with European and US companies within our Credit
Suisse Global Family 900 universe showing lower returns on average. This corroborates
previous research, and we believe that external investors are prepared to pay a slight
premium for the more stable performance through the cycle that we have seen above. In
terms of EV/EBITDA, there is some consistency across regions in the premium being 9-
10% over the past nine years.
Figure 70: CS Global Family 900 universe – EV/EBITDA (x) Figure 71 US family businesses – EV/EBITDA (x)
0
2
4
6
8
10
12
14
16
2006
2007
2008
2009
2010
2011
2012
2013
2014
2015
CS Global Family 900 universe MSCI AC World
0
2
4
6
8
10
12
14
16
2006
2007
2008
2009
2010
2011
2012
2013
2014
2015
CS Family 900 - USA, sector-adj. MSCI USA
Source: Thomson Reuters, Credit Suisse research Source: Thomson Reuters, Credit Suisse research
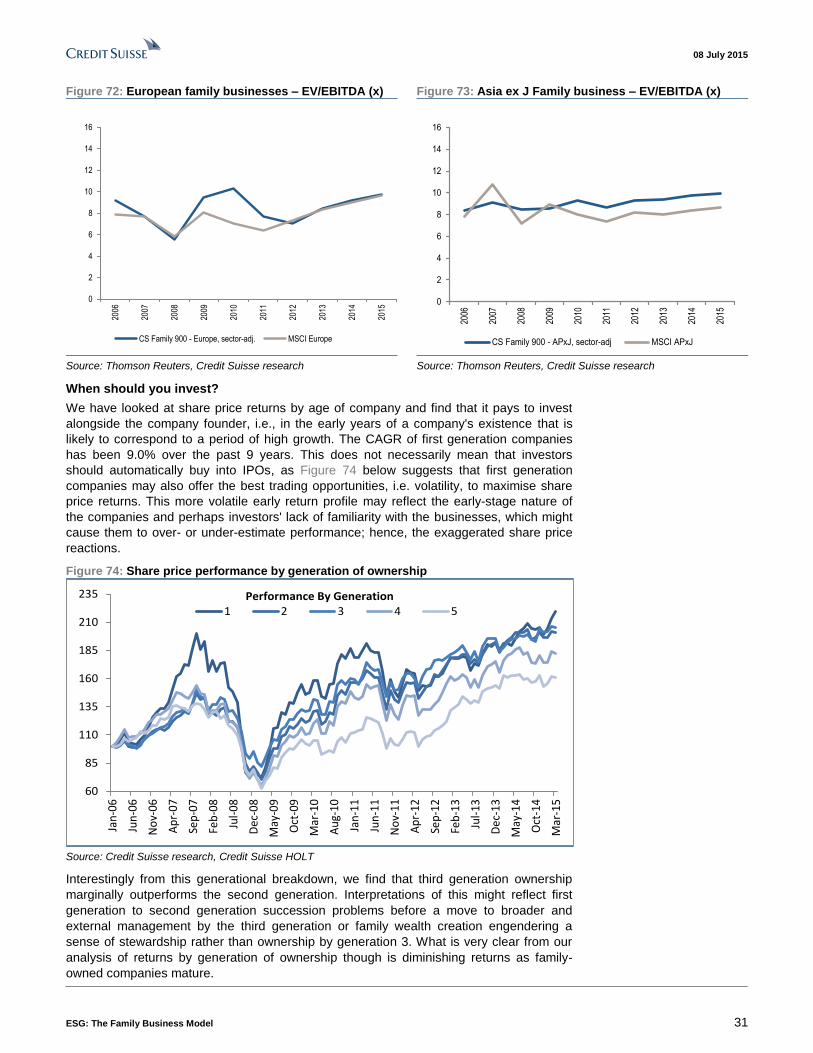
08 July 2015
ESG: The Family Business Model 31
Figure 72: European family businesses – EV/EBITDA (x) Figure 73: Asia ex J Family business – EV/EBITDA (x)
0
2
4
6
8
10
12
14
16
2006
2007
2008
2009
2010
2011
2012
2013
2014
2015
CS Family 900 - Europe, sector-adj. MSCI Europe
0
2
4
6
8
10
12
14
16
2006
2007
2008
2009
2010
2011
2012
2013
2014
2015
CS Family 900 - APxJ, sector-adj MSCI APxJ
Source: Thomson Reuters, Credit Suisse research Source: Thomson Reuters, Credit Suisse research
When should you invest?
We have looked at share price returns by age of company and find that it pays to invest
alongside the company founder, i.e., in the early years of a company's existence that is
likely to correspond to a period of high growth. The CAGR of first generation companies
has been 9.0% over the past 9 years. This does not necessarily mean that investors
should automatically buy into IPOs, as Figure 74 below suggests that first generation
companies may also offer the best trading opportunities, i.e. volatility, to maximise share
price returns. This more volatile early return profile may reflect the early-stage nature of
the companies and perhaps investors' lack of familiarity with the businesses, which might
cause them to over- or under-estimate performance; hence, the exaggerated share price
reactions.
Figure 74: Share price performance by generation of ownership
60
85
110
135
160
185
210
235
Jan-
06
Jun
-06
No
v-06
Ap
r-07
Sep
-07
Feb
-08
Jul-
08
Dec
-08
May
-09
Oct
-09
Mar
-10
Au
g-10
Jan-
11
Jun
-11
No
v-11
Ap
r-12
Sep
-12
Feb
-13
Jul-
13
Dec
-13
May
-14
Oct
-14
Mar
-15
Performance By Generation1 2 3 4 5
Source: Credit Suisse research, Credit Suisse HOLT
Interestingly from this generational breakdown, we find that third generation ownership
marginally outperforms the second generation. Interpretations of this might reflect first
generation to second generation succession problems before a move to broader and
external management by the third generation or family wealth creation engendering a
sense of stewardship rather than ownership by generation 3. What is very clear from our
analysis of returns by generation of ownership though is diminishing returns as family-
owned companies mature.
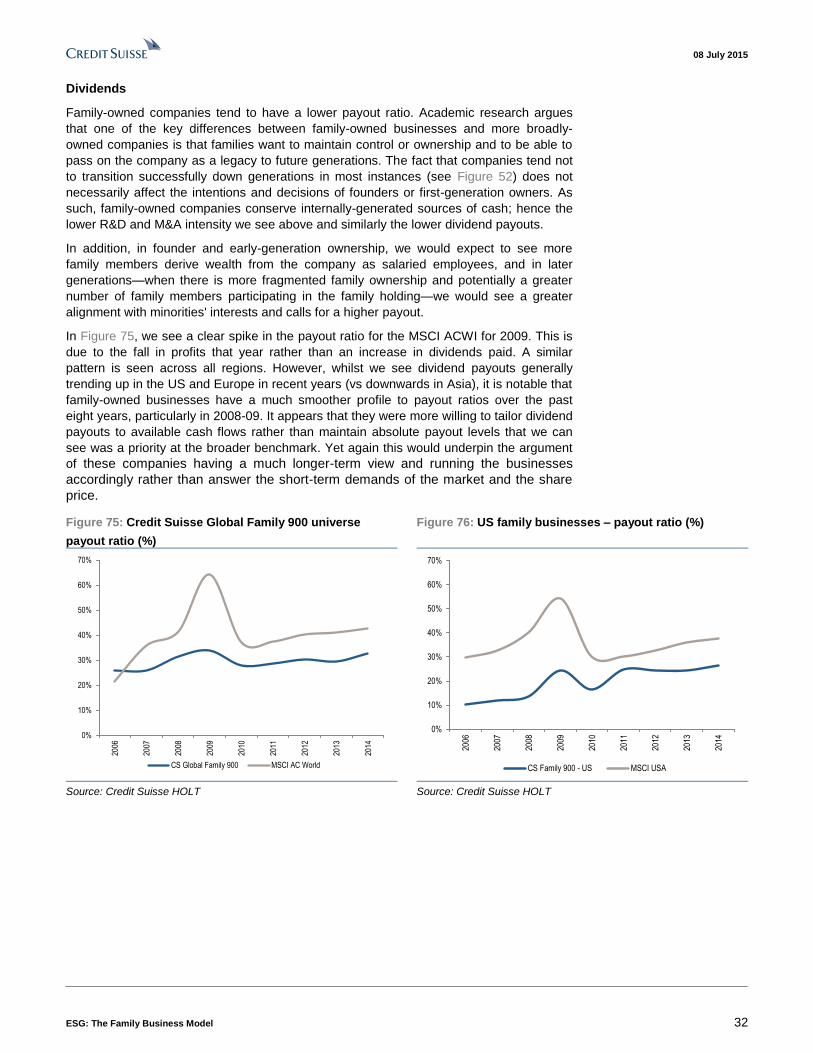
08 July 2015
ESG: The Family Business Model 32
Dividends
Family-owned companies tend to have a lower payout ratio. Academic research argues
that one of the key differences between family-owned businesses and more broadly-
owned companies is that families want to maintain control or ownership and to be able to
pass on the company as a legacy to future generations. The fact that companies tend not
to transition successfully down generations in most instances (see Figure 52) does not
necessarily affect the intentions and decisions of founders or first-generation owners. As
such, family-owned companies conserve internally-generated sources of cash; hence the
lower R&D and M&A intensity we see above and similarly the lower dividend payouts.
In addition, in founder and early-generation ownership, we would expect to see more
family members derive wealth from the company as salaried employees, and in later
generations—when there is more fragmented family ownership and potentially a greater
number of family members participating in the family holding—we would see a greater
alignment with minorities' interests and calls for a higher payout.
In Figure 75, we see a clear spike in the payout ratio for the MSCI ACWI for 2009. This is
due to the fall in profits that year rather than an increase in dividends paid. A similar
pattern is seen across all regions. However, whilst we see dividend payouts generally
trending up in the US and Europe in recent years (vs downwards in Asia), it is notable that
family-owned businesses have a much smoother profile to payout ratios over the past
eight years, particularly in 2008-09. It appears that they were more willing to tailor dividend
payouts to available cash flows rather than maintain absolute payout levels that we can
see was a priority at the broader benchmark. Yet again this would underpin the argument
of these companies having a much longer-term view and running the businesses
accordingly rather than answer the short-term demands of the market and the share
price.
Figure 75: Credit Suisse Global Family 900 universe
payout ratio (%)
Figure 76: US family businesses – payout ratio (%)
0%
10%
20%
30%
40%
50%
60%
70%
2006
2007
2008
2009
2010
2011
2012
2013
2014
CS Global Family 900 MSCI AC World
0%
10%
20%
30%
40%
50%
60%
70%
2006
2007
2008
2009
2010
2011
2012
2013
2014
CS Family 900 - US MSCI USA
Source: Credit Suisse HOLT Source: Credit Suisse HOLT
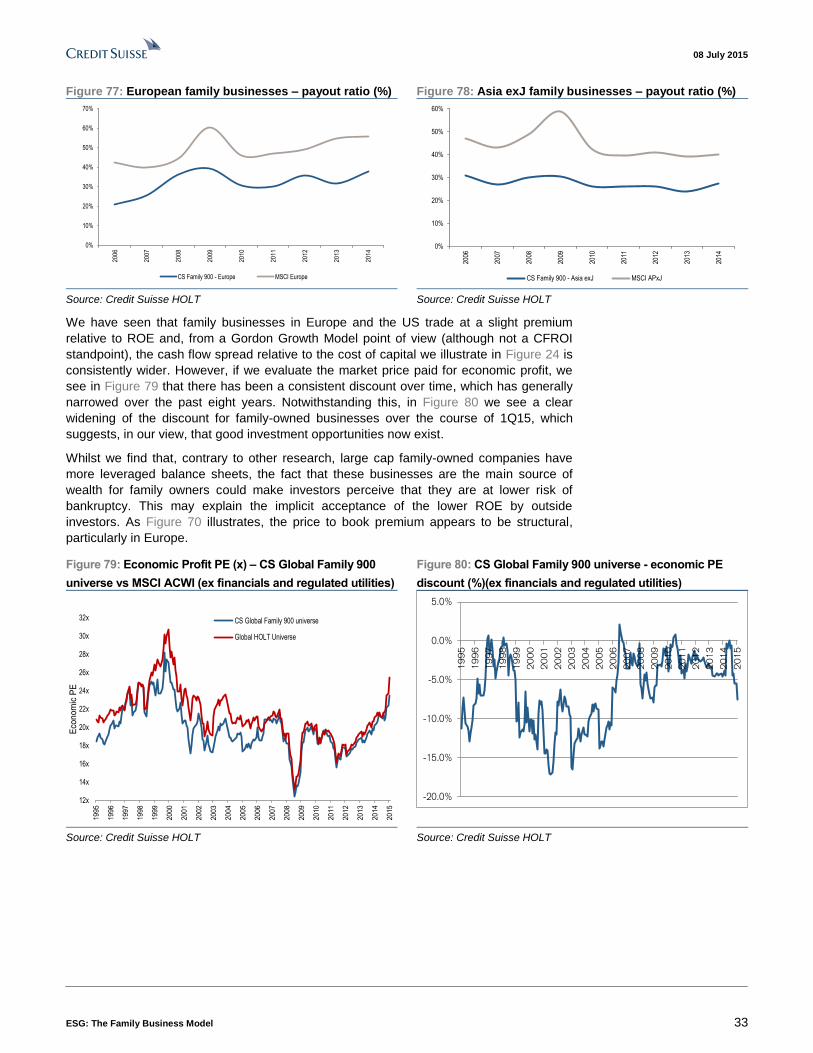
08 July 2015
ESG: The Family Business Model 33
Figure 77: European family businesses – payout ratio (%) Figure 78: Asia exJ family businesses – payout ratio (%)
0%
10%
20%
30%
40%
50%
60%
70%20
06
20
07
20
08
20
09
20
10
20
11
20
12
20
13
20
14
CS Family 900 - Europe MSCI Europe
0%
10%
20%
30%
40%
50%
60%
2006
2007
2008
2009
2010
2011
2012
2013
2014
CS Family 900 - Asia exJ MSCI APxJ
Source: Credit Suisse HOLT Source: Credit Suisse HOLT
We have seen that family businesses in Europe and the US trade at a slight premium
relative to ROE and, from a Gordon Growth Model point of view (although not a CFROI
standpoint), the cash flow spread relative to the cost of capital we illustrate in Figure 24 is
consistently wider. However, if we evaluate the market price paid for economic profit, we
see in Figure 79 that there has been a consistent discount over time, which has generally
narrowed over the past eight years. Notwithstanding this, in Figure 80 we see a clear
widening of the discount for family-owned businesses over the course of 1Q15, which
suggests, in our view, that good investment opportunities now exist.
Whilst we find that, contrary to other research, large cap family-owned companies have
more leveraged balance sheets, the fact that these businesses are the main source of
wealth for family owners could make investors perceive that they are at lower risk of
bankruptcy. This may explain the implicit acceptance of the lower ROE by outside
investors. As Figure 70 illustrates, the price to book premium appears to be structural,
particularly in Europe.
Figure 79: Economic Profit PE (x) – CS Global Family 900
universe vs MSCI ACWI (ex financials and regulated utilities)
Figure 80: CS Global Family 900 universe - economic PE
discount (%)(ex financials and regulated utilities)
12x
14x
16x
18x
20x
22x
24x
26x
28x
30x
32x
19
95
19
96
19
97
19
98
19
99
20
00
20
01
20
02
20
03
20
04
20
05
20
06
20
07
20
08
20
09
20
10
20
11
20
12
20
13
20
14
20
15
Eco
nom
ic P
E
CS Global Family 900 universe
Global HOLT Universe
-20.0%
-15.0%
-10.0%
-5.0%
0.0%
5.0%
19
95
19
96
19
97
19
98
19
99
20
00
20
01
20
02
20
03
20
04
20
05
20
06
20
07
20
08
20
09
20
10
20
11
20
12
20
13
20
14
20
15
Source: Credit Suisse HOLT Source: Credit Suisse HOLT
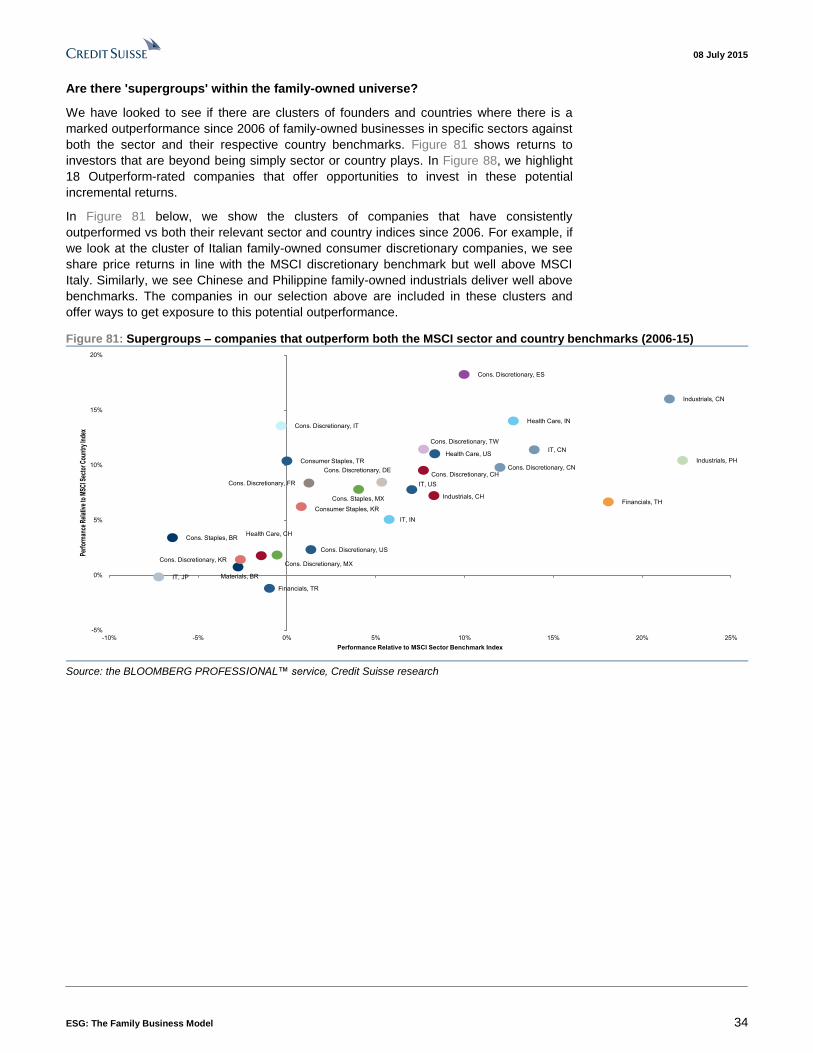
08 July 2015
ESG: The Family Business Model 34
Are there 'supergroups' within the family-owned universe?
We have looked to see if there are clusters of founders and countries where there is a
marked outperformance since 2006 of family-owned businesses in specific sectors against
both the sector and their respective country benchmarks. Figure 81 shows returns to
investors that are beyond being simply sector or country plays. In Figure 88, we highlight
18 Outperform-rated companies that offer opportunities to invest in these potential
incremental returns.
In Figure 81 below, we show the clusters of companies that have consistently
outperformed vs both their relevant sector and country indices since 2006. For example, if
we look at the cluster of Italian family-owned consumer discretionary companies, we see
share price returns in line with the MSCI discretionary benchmark but well above MSCI
Italy. Similarly, we see Chinese and Philippine family-owned industrials deliver well above
benchmarks. The companies in our selection above are included in these clusters and
offer ways to get exposure to this potential outperformance.
Figure 81: Supergroups – companies that outperform both the MSCI sector and country benchmarks (2006-15)
Cons. Staples, BR
Materials, BR
Cons. Discretionary, CN
Industrials, CN
IT, CN
Cons. Discretionary, FR
Cons. Discretionary, DE
Health Care, IN
IT, IN
Cons. Discretionary, IT
IT, JP
Cons. Discretionary, KR
Consumer Staples, KR
Cons. Staples, MX
Industrials, PH
Cons. Discretionary, ES
Cons. Discretionary, TW
Financials, TH
Cons. Discretionary, CH
Health Care, CH
Cons. Discretionary, MX
Industrials, CH
Consumer Staples, TR
Financials, TR
Cons. Discretionary, US
Health Care, US
IT, US
-5%
0%
5%
10%
15%
20%
-10% -5% 0% 5% 10% 15% 20% 25%
Perf
orm
ance
Rel
ativ
e to
MSC
I Sec
tor C
ount
ry In
dex
Performance Relative to MSCI Sector Benchmark Index
Source: the BLOOMBERG PROFESSIONAL™ service, Credit Suisse research
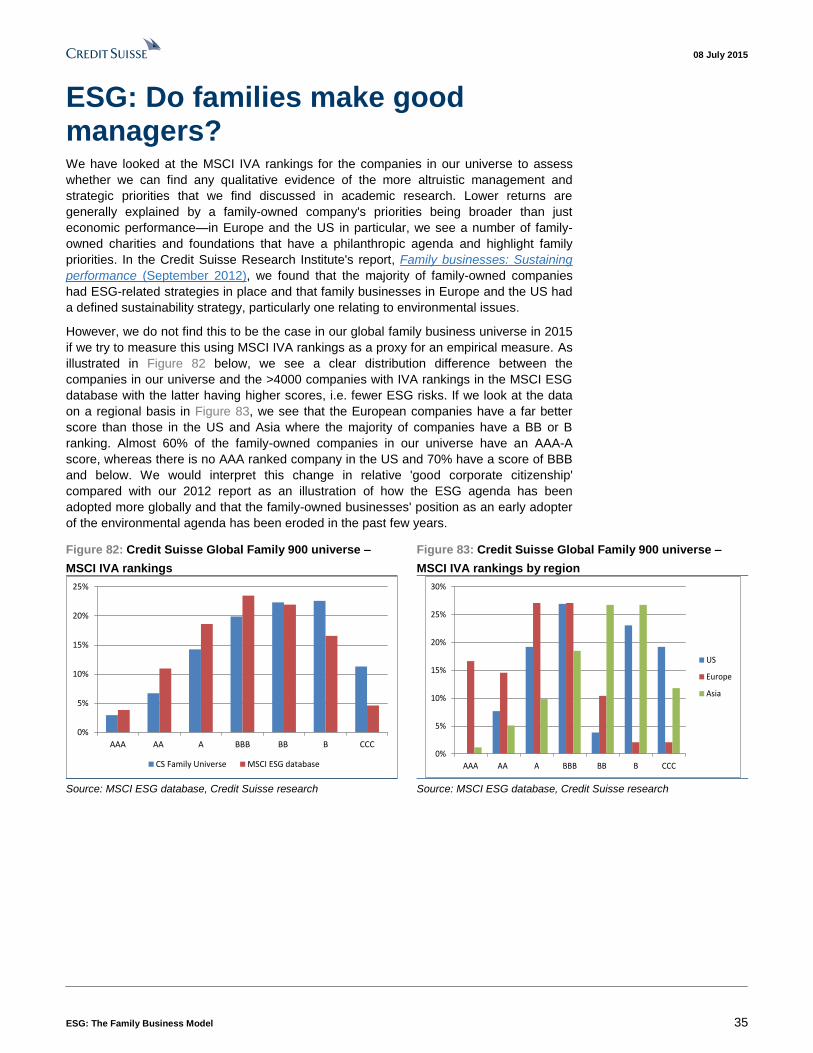
08 July 2015
ESG: The Family Business Model 35
ESG: Do families make good managers? We have looked at the MSCI IVA rankings for the companies in our universe to assess
whether we can find any qualitative evidence of the more altruistic management and
strategic priorities that we find discussed in academic research. Lower returns are
generally explained by a family-owned company's priorities being broader than just
economic performance—in Europe and the US in particular, we see a number of family-
owned charities and foundations that have a philanthropic agenda and highlight family
priorities. In the Credit Suisse Research Institute's report, Family businesses: Sustaining
performance (September 2012), we found that the majority of family-owned companies
had ESG-related strategies in place and that family businesses in Europe and the US had
a defined sustainability strategy, particularly one relating to environmental issues.
However, we do not find this to be the case in our global family business universe in 2015
if we try to measure this using MSCI IVA rankings as a proxy for an empirical measure. As
illustrated in Figure 82 below, we see a clear distribution difference between the
companies in our universe and the >4000 companies with IVA rankings in the MSCI ESG
database with the latter having higher scores, i.e. fewer ESG risks. If we look at the data
on a regional basis in Figure 83, we see that the European companies have a far better
score than those in the US and Asia where the majority of companies have a BB or B
ranking. Almost 60% of the family-owned companies in our universe have an AAA-A
score, whereas there is no AAA ranked company in the US and 70% have a score of BBB
and below. We would interpret this change in relative 'good corporate citizenship'
compared with our 2012 report as an illustration of how the ESG agenda has been
adopted more globally and that the family-owned businesses' position as an early adopter
of the environmental agenda has been eroded in the past few years.
Figure 82: Credit Suisse Global Family 900 universe –
MSCI IVA rankings
Figure 83: Credit Suisse Global Family 900 universe –
MSCI IVA rankings by region
0%
5%
10%
15%
20%
25%
AAA AA A BBB BB B CCC
CS Family Universe MSCI ESG database
0%
5%
10%
15%
20%
25%
30%
AAA AA A BBB BB B CCC
US
Europe
Asia
Source: MSCI ESG database, Credit Suisse research Source: MSCI ESG database, Credit Suisse research
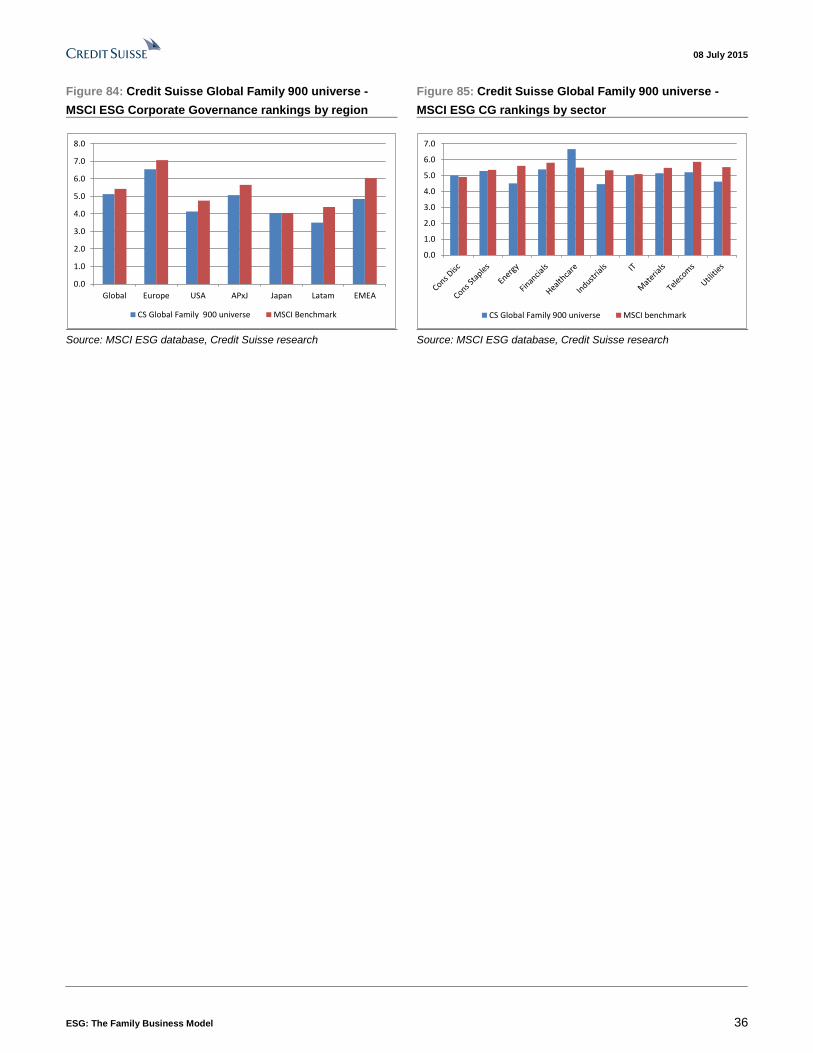
08 July 2015
ESG: The Family Business Model 36
Figure 84: Credit Suisse Global Family 900 universe -
MSCI ESG Corporate Governance rankings by region
Figure 85: Credit Suisse Global Family 900 universe -
MSCI ESG CG rankings by sector
0.0
1.0
2.0
3.0
4.0
5.0
6.0
7.0
8.0
Global Europe USA APxJ Japan Latam EMEA
CS Global Family 900 universe MSCI Benchmark
0.0
1.0
2.0
3.0
4.0
5.0
6.0
7.0
CS Global Family 900 universe MSCI benchmark
Source: MSCI ESG database, Credit Suisse research Source: MSCI ESG database, Credit Suisse research
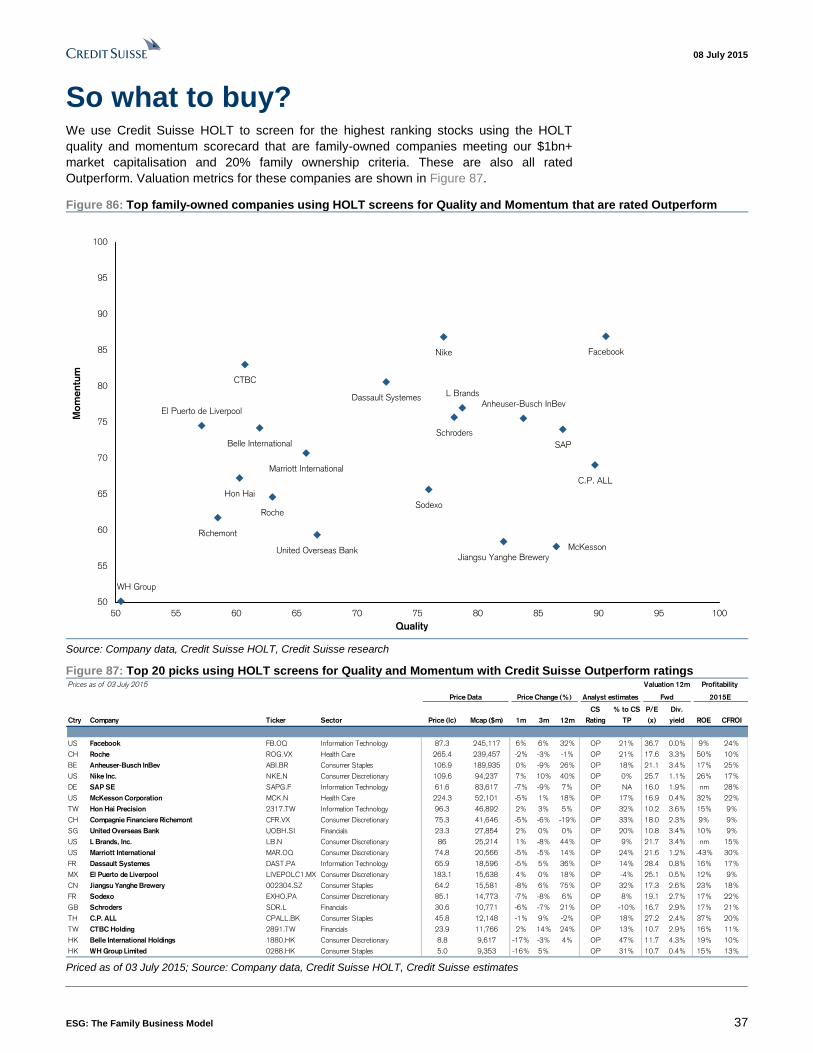
08 July 2015
ESG: The Family Business Model 37
So what to buy? We use Credit Suisse HOLT to screen for the highest ranking stocks using the HOLT
quality and momentum scorecard that are family-owned companies meeting our $1bn+
market capitalisation and 20% family ownership criteria. These are also all rated
Outperform. Valuation metrics for these companies are shown in Figure 87.
Figure 86: Top family-owned companies using HOLT screens for Quality and Momentum that are rated Outperform
Roche
Anheuser-Busch InBev
Nike
SAP
McKesson
Hon Hai
Richemont
United Overseas Bank
L Brands
Marriott International
Dassault Systemes
El Puerto de Liverpool
Jiangsu Yanghe Brewery
Sodexo
Schroders
C.P. ALL
CTBC
Belle International
WH Group
50
55
60
65
70
75
80
85
90
95
100
50 55 60 65 70 75 80 85 90 95 100
Mo
mentu
m
Quality
Source: Company data, Credit Suisse HOLT, Credit Suisse research
Figure 87: Top 20 picks using HOLT screens for Quality and Momentum with Credit Suisse Outperform ratings Prices as of 03 July 2015
Price Data Price Change (%) Analyst estimates
Valuation 12m
Fwd
Profitability
2015E
H
O
Ctry Company Ticker Sector Price (lc) Mcap ($m) 1m 3m 12m
CS
Rating
% to CS
TP
P/E
(x)
Div.
yield ROE CFROI
US Facebook FB.OQ Information Technology 87.3 245,117 6% 6% 32% OP 21% 36.7 0.0% 9% 24%
CH Roche ROG.VX Health Care 265.4 239,457 -2% -3% -1% OP 21% 17.6 3.3% 50% 10%
BE Anheuser-Busch InBev ABI.BR Consumer Staples 106.9 189,935 0% -9% 26% OP 18% 21.1 3.4% 17% 25%
US Nike Inc. NKE.N Consumer Discretionary 109.6 94,237 7% 10% 40% OP 0% 25.7 1.1% 26% 17%
DE SAP SE SAPG.F Information Technology 61.6 83,617 -7% -9% 7% OP NA 16.0 1.9% nm 28%
US McKesson Corporation MCK.N Health Care 224.3 52,101 -5% 1% 18% OP 17% 16.9 0.4% 32% 22%
TW Hon Hai Precision 2317.TW Information Technology 96.3 46,892 2% 3% 5% OP 32% 10.2 3.6% 15% 9%
CH Compagnie Financiere Richemont CFR.VX Consumer Discretionary 75.3 41,646 -5% -6% -19% OP 33% 18.0 2.3% 9% 9%
SG United Overseas Bank UOBH.SI Financials 23.3 27,854 2% 0% 0% OP 20% 10.8 3.4% 10% 9%
US L Brands, Inc. LB.N Consumer Discretionary 86 25,214 1% -8% 44% OP 9% 21.7 3.4% nm 15%
US Marriott International MAR.OQ Consumer Discretionary 74.8 20,566 -5% -5% 14% OP 24% 21.6 1.2% -43% 30%
FR Dassault Systemes DAST.PA Information Technology 65.9 18,596 -5% 5% 36% OP 14% 28.4 0.8% 16% 17%
MX El Puerto de Liverpool LIVEPOLC1.MX Consumer Discretionary 183.1 15,638 4% 0% 18% OP -4% 25.1 0.5% 12% 9%
CN Jiangsu Yanghe Brewery 002304.SZ Consumer Staples 64.2 15,581 -8% 6% 75% OP 32% 17.3 2.6% 23% 18%
FR Sodexo EXHO.PA Consumer Discretionary 85.1 14,773 -7% -8% 6% OP 8% 19.1 2.7% 17% 22%
GB Schroders SDR.L Financials 30.6 10,771 -6% -7% 21% OP -10% 16.7 2.9% 17% 21%
TH C.P. ALL CPALL.BK Consumer Staples 45.8 12,148 -1% 9% -2% OP 18% 27.2 2.4% 37% 20%
TW CTBC Holding 2891.TW Financials 23.9 11,766 2% 14% 24% OP 13% 10.7 2.9% 16% 11%
HK Belle International Holdings 1880.HK Consumer Discretionary 8.8 9,617 -17% -3% 4% OP 47% 11.7 4.3% 19% 10%
HK WH Group Limited 0288.HK Consumer Staples 5.0 9,353 -16% 5% OP 31% 10.7 0.4% 15% 13% Priced as of 03 July 2015; Source: Company data, Credit Suisse HOLT, Credit Suisse estimates
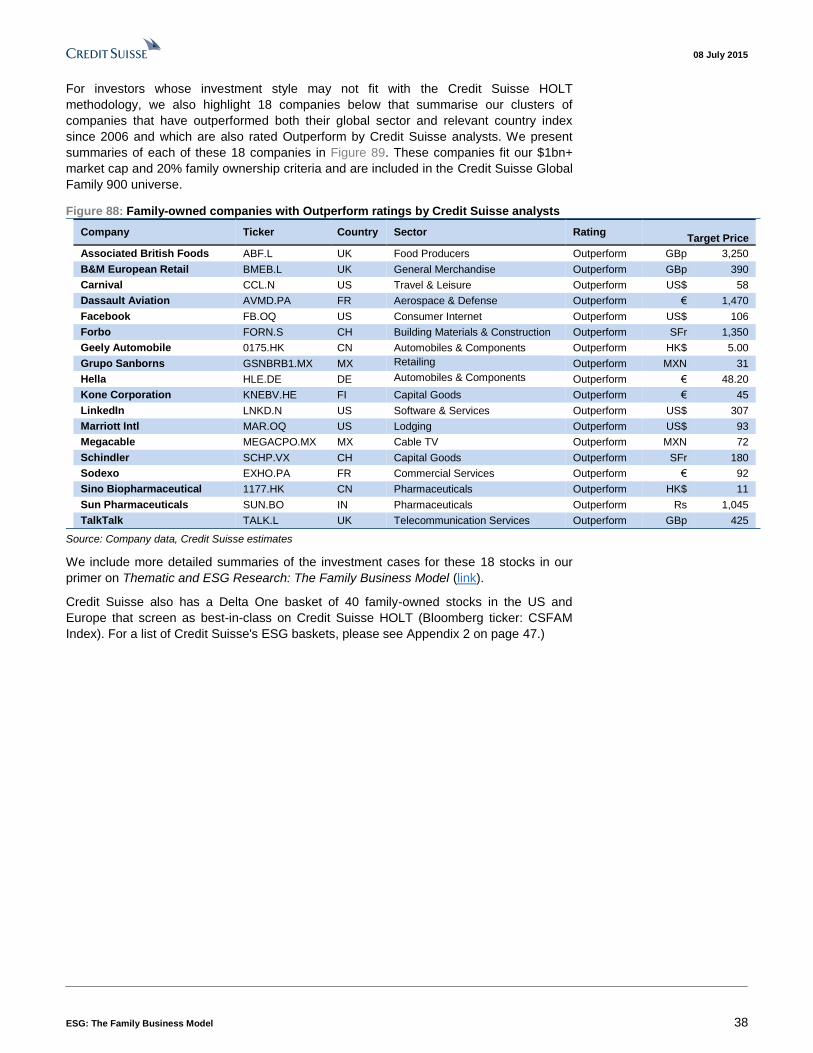
08 July 2015
ESG: The Family Business Model 38
For investors whose investment style may not fit with the Credit Suisse HOLT
methodology, we also highlight 18 companies below that summarise our clusters of
companies that have outperformed both their global sector and relevant country index
since 2006 and which are also rated Outperform by Credit Suisse analysts. We present
summaries of each of these 18 companies in Figure 89. These companies fit our $1bn+
market cap and 20% family ownership criteria and are included in the Credit Suisse Global
Family 900 universe.
Figure 88: Family-owned companies with Outperform ratings by Credit Suisse analysts
Company Ticker Country Sector Rating
Target Price
Associated British Foods ABF.L UK Food Producers Outperform GBp 3,250
B&M European Retail BMEB.L UK General Merchandise Outperform GBp 390
Carnival CCL.N US Travel & Leisure Outperform US$ 58
Dassault Aviation AVMD.PA FR Aerospace & Defense Outperform € 1,470
Facebook FB.OQ US Consumer Internet Outperform US$ 106
Forbo FORN.S CH Building Materials & Construction Outperform SFr 1,350
Geely Automobile 0175.HK CN Automobiles & Components Outperform HK$ 5.00
Grupo Sanborns GSNBRB1.MX MX Retailing Outperform MXN 31
Hella HLE.DE DE Automobiles & Components Outperform € 48.20
Kone Corporation KNEBV.HE FI Capital Goods Outperform € 45
LinkedIn LNKD.N US Software & Services Outperform US$ 307
Marriott Intl MAR.OQ US Lodging Outperform US$ 93
Megacable MEGACPO.MX MX Cable TV Outperform MXN 72
Schindler SCHP.VX CH Capital Goods Outperform SFr 180
Sodexo EXHO.PA FR Commercial Services Outperform € 92
Sino Biopharmaceutical 1177.HK CN Pharmaceuticals Outperform HK$ 11
Sun Pharmaceuticals SUN.BO IN Pharmaceuticals Outperform Rs 1,045
TalkTalk TALK.L UK Telecommunication Services Outperform GBp 425
Source: Company data, Credit Suisse estimates
We include more detailed summaries of the investment cases for these 18 stocks in our
primer on Thematic and ESG Research: The Family Business Model (link).
Credit Suisse also has a Delta One basket of 40 family-owned stocks in the US and
Europe that screen as best-in-class on Credit Suisse HOLT (Bloomberg ticker: CSFAM
Index). For a list of Credit Suisse's ESG baskets, please see Appendix 2 on page 47.)
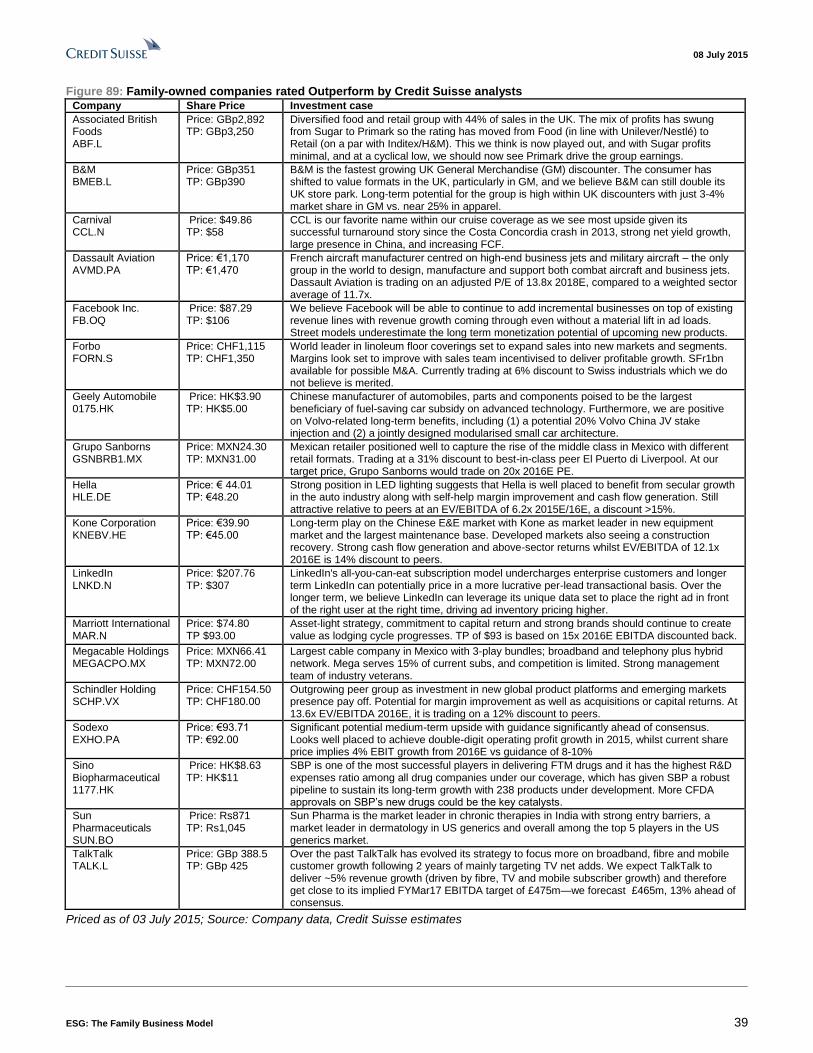
08 July 2015
ESG: The Family Business Model 39
Figure 89: Family-owned companies rated Outperform by Credit Suisse analysts Company Share Price Investment case
Associated British Foods ABF.L
Price: GBp2,892 TP: GBp3,250
Diversified food and retail group with 44% of sales in the UK. The mix of profits has swung from Sugar to Primark so the rating has moved from Food (in line with Unilever/Nestlé) to Retail (on a par with Inditex/H&M). This we think is now played out, and with Sugar profits minimal, and at a cyclical low, we should now see Primark drive the group earnings.
B&M BMEB.L
Price: GBp351 TP: GBp390
B&M is the fastest growing UK General Merchandise (GM) discounter. The consumer has shifted to value formats in the UK, particularly in GM, and we believe B&M can still double its UK store park. Long-term potential for the group is high within UK discounters with just 3-4% market share in GM vs. near 25% in apparel.
Carnival CCL.N
Price: $49.86 TP: $58
CCL is our favorite name within our cruise coverage as we see most upside given its successful turnaround story since the Costa Concordia crash in 2013, strong net yield growth, large presence in China, and increasing FCF.
Dassault Aviation AVMD.PA
Price: €1,170 TP: €1,470
French aircraft manufacturer centred on high-end business jets and military aircraft – the only group in the world to design, manufacture and support both combat aircraft and business jets. Dassault Aviation is trading on an adjusted P/E of 13.8x 2018E, compared to a weighted sector average of 11.7x.
Facebook Inc. FB.OQ
Price: $87.29 TP: $106
We believe Facebook will be able to continue to add incremental businesses on top of existing revenue lines with revenue growth coming through even without a material lift in ad loads. Street models underestimate the long term monetization potential of upcoming new products.
Forbo FORN.S
Price: CHF1,115 TP: CHF1,350
World leader in linoleum floor coverings set to expand sales into new markets and segments. Margins look set to improve with sales team incentivised to deliver profitable growth. SFr1bn available for possible M&A. Currently trading at 6% discount to Swiss industrials which we do not believe is merited.
Geely Automobile 0175.HK
Price: HK$3.90 TP: HK$5.00
Chinese manufacturer of automobiles, parts and components poised to be the largest beneficiary of fuel-saving car subsidy on advanced technology. Furthermore, we are positive on Volvo-related long-term benefits, including (1) a potential 20% Volvo China JV stake injection and (2) a jointly designed modularised small car architecture.
Grupo Sanborns GSNBRB1.MX
Price: MXN24.30 TP: MXN31.00
Mexican retailer positioned well to capture the rise of the middle class in Mexico with different retail formats. Trading at a 31% discount to best-in-class peer El Puerto di Liverpool. At our target price, Grupo Sanborns would trade on 20x 2016E PE.
Hella HLE.DE
Price: € 44.01 TP: €48.20
Strong position in LED lighting suggests that Hella is well placed to benefit from secular growth in the auto industry along with self-help margin improvement and cash flow generation. Still attractive relative to peers at an EV/EBITDA of 6.2x 2015E/16E, a discount >15%.
Kone Corporation KNEBV.HE
Price: €39.90 TP: €45.00
Long-term play on the Chinese E&E market with Kone as market leader in new equipment market and the largest maintenance base. Developed markets also seeing a construction recovery. Strong cash flow generation and above-sector returns whilst EV/EBITDA of 12.1x 2016E is 14% discount to peers.
LinkedIn LNKD.N
Price: $207.76 TP: $307
LinkedIn's all-you-can-eat subscription model undercharges enterprise customers and longer term LinkedIn can potentially price in a more lucrative per-lead transactional basis. Over the longer term, we believe LinkedIn can leverage its unique data set to place the right ad in front of the right user at the right time, driving ad inventory pricing higher.
Marriott International MAR.N
Price: $74.80 TP $93.00
Asset-light strategy, commitment to capital return and strong brands should continue to create value as lodging cycle progresses. TP of $93 is based on 15x 2016E EBITDA discounted back.
Megacable Holdings MEGACPO.MX
Price: MXN66.41 TP: MXN72.00
Largest cable company in Mexico with 3-play bundles; broadband and telephony plus hybrid network. Mega serves 15% of current subs, and competition is limited. Strong management team of industry veterans.
Schindler Holding SCHP.VX
Price: CHF154.50 TP: CHF180.00
Outgrowing peer group as investment in new global product platforms and emerging markets presence pay off. Potential for margin improvement as well as acquisitions or capital returns. At 13.6x EV/EBITDA 2016E, it is trading on a 12% discount to peers.
Sodexo EXHO.PA
Price: €93.71 TP: €92.00
Significant potential medium-term upside with guidance significantly ahead of consensus. Looks well placed to achieve double-digit operating profit growth in 2015, whilst current share price implies 4% EBIT growth from 2016E vs guidance of 8-10%
Sino Biopharmaceutical 1177.HK
Price: HK$8.63 TP: HK$11
SBP is one of the most successful players in delivering FTM drugs and it has the highest R&D expenses ratio among all drug companies under our coverage, which has given SBP a robust pipeline to sustain its long-term growth with 238 products under development. More CFDA approvals on SBP’s new drugs could be the key catalysts.
Sun Pharmaceuticals SUN.BO
Price: Rs871 TP: Rs1,045
Sun Pharma is the market leader in chronic therapies in India with strong entry barriers, a market leader in dermatology in US generics and overall among the top 5 players in the US generics market.
TalkTalk TALK.L
Price: GBp 388.5 TP: GBp 425
Over the past TalkTalk has evolved its strategy to focus more on broadband, fibre and mobile customer growth following 2 years of mainly targeting TV net adds. We expect TalkTalk to deliver ~5% revenue growth (driven by fibre, TV and mobile subscriber growth) and therefore get close to its implied FYMar17 EBITDA target of £475m—we forecast £465m, 13% ahead of consensus.
Priced as of 03 July 2015; Source: Company data, Credit Suisse estimates
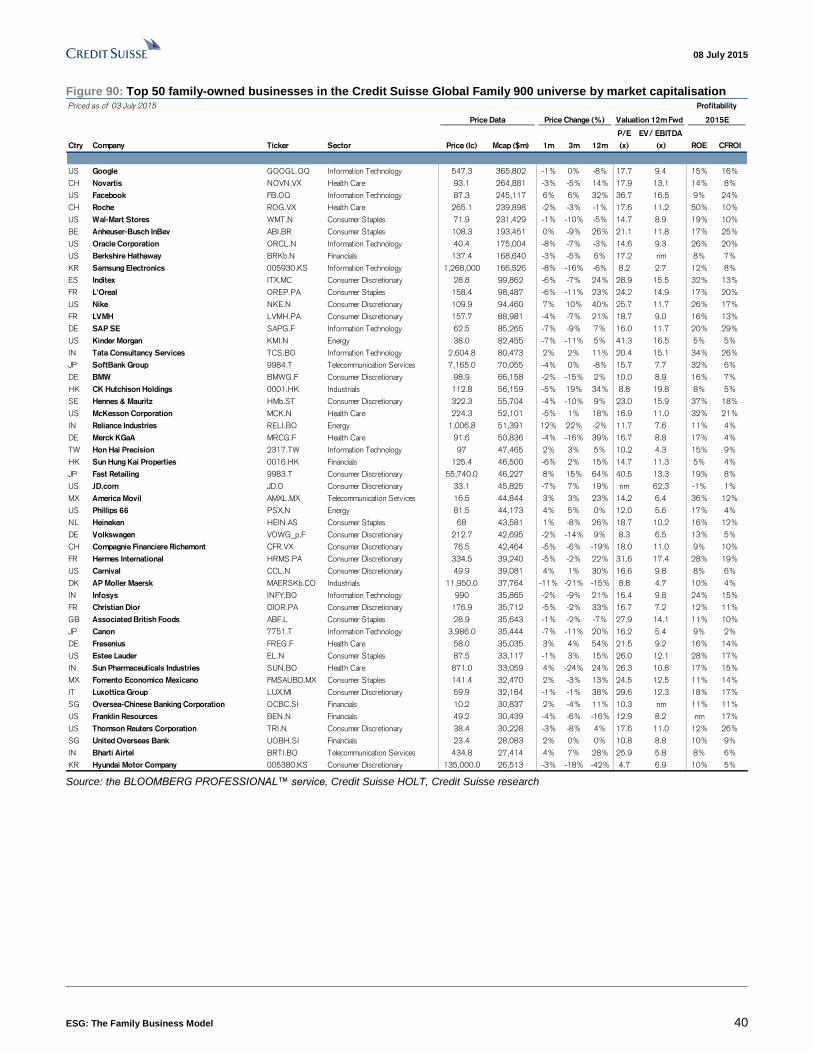
08 July 2015
ESG: The Family Business Model 40
Figure 90: Top 50 family-owned businesses in the Credit Suisse Global Family 900 universe by market capitalisation Priced as of 03 July 2015
Price Data Price Change (%) Valuation 12m Fwd
Profitability
2015E
Ctry Company Ticker Sector Price (lc) Mcap ($m) 1m 3m 12m
P/E
(x)
EV/ EBITDA
(x) ROE CFROI
US Google GOOGL.OQ Information Technology 547.3 365,802 -1% 0% -8% 17.7 9.4 15% 16%
CH Novartis NOVN.VX Health Care 93.1 264,881 -3% -5% 14% 17.9 13.1 14% 8%
US Facebook FB.OQ Information Technology 87.3 245,117 6% 6% 32% 36.7 16.5 9% 24%
CH Roche ROG.VX Health Care 265.1 239,898 -2% -3% -1% 17.6 11.2 50% 10%
US Wal-Mart Stores WMT.N Consumer Staples 71.9 231,429 -1% -10% -5% 14.7 8.9 19% 10%
BE Anheuser-Busch InBev ABI.BR Consumer Staples 108.3 193,451 0% -9% 26% 21.1 11.8 17% 25%
US Oracle Corporation ORCL.N Information Technology 40.4 175,004 -8% -7% -3% 14.6 9.3 26% 20%
US Berkshire Hathaway BRKb.N Financials 137.4 168,640 -3% -5% 6% 17.2 nm 8% 7%
KR Samsung Electronics 005930.KS Information Technology 1,268,000 166,526 -8% -16% -6% 8.2 2.7 12% 8%
ES Inditex ITX.MC Consumer Discretionary 28.8 99,862 -6% -7% 24% 28.9 15.5 32% 13%
FR L'Oreal OREP.PA Consumer Staples 158.4 98,487 -6% -11% 23% 24.2 14.9 17% 20%
US Nike NKE.N Consumer Discretionary 109.9 94,460 7% 10% 40% 25.7 11.7 26% 17%
FR LVMH LVMH.PA Consumer Discretionary 157.7 88,981 -4% -7% 21% 18.7 9.0 16% 13%
DE SAP SE SAPG.F Information Technology 62.5 85,265 -7% -9% 7% 16.0 11.7 20% 29%
US Kinder Morgan KMI.N Energy 38.0 82,455 -7% -11% 5% 41.3 16.5 5% 5%
IN Tata Consultancy Services TCS.BO Information Technology 2,604.8 80,473 2% 2% 11% 20.4 15.1 34% 26%
JP SoftBank Group 9984.T Telecommunication Serv ices 7,165.0 70,055 -4% 0% -8% 15.7 7.7 32% 6%
DE BMW BMWG.F Consumer Discretionary 98.9 66,158 -2% -15% 2% 10.0 8.9 16% 7%
HK CK Hutchison Holdings 0001.HK Industrials 112.8 56,159 -5% 19% 34% 8.8 19.8 8% 5%
SE Hennes & Mauritz HMb.ST Consumer Discretionary 322.3 55,704 -4% -10% 9% 23.0 15.9 37% 18%
US McKesson Corporation MCK.N Health Care 224.3 52,101 -5% 1% 18% 16.9 11.0 32% 21%
IN Reliance Industries RELI.BO Energy 1,006.8 51,391 12% 22% -2% 11.7 7.6 11% 4%
DE Merck KGaA MRCG.F Health Care 91.6 50,836 -4% -16% 39% 16.7 8.8 17% 4%
TW Hon Hai Precision 2317.TW Information Technology 97 47,465 2% 3% 5% 10.2 4.3 15% 9%
HK Sun Hung Kai Properties 0016.HK Financials 125.4 46,500 -6% 2% 15% 14.7 11.3 5% 4%
JP Fast Retailing 9983.T Consumer Discretionary 55,740.0 46,227 8% 15% 64% 40.5 13.3 19% 8%
US JD.com JD.O Consumer Discretionary 33.1 45,825 -7% 7% 19% nm 62.3 -1% 1%
MX America Movil AMXL.MX Telecommunication Serv ices 16.5 44,844 3% 3% 23% 14.2 6.4 36% 12%
US Phillips 66 PSX.N Energy 81.5 44,173 4% 5% 0% 12.0 5.6 17% 4%
NL Heineken HEIN.AS Consumer Staples 68 43,581 1% -8% 26% 18.7 10.2 16% 12%
DE Volkswagen VOWG_p.F Consumer Discretionary 212.7 42,695 -2% -14% 9% 8.3 6.5 13% 5%
CH Compagnie Financiere Richemont CFR.VX Consumer Discretionary 76.5 42,464 -5% -6% -19% 18.0 11.0 9% 10%
FR Hermes International HRMS.PA Consumer Discretionary 334.5 39,240 -5% -2% 22% 31.6 17.4 28% 19%
US Carnival CCL.N Consumer Discretionary 49.9 39,081 4% 1% 30% 16.6 9.8 8% 6%
DK AP Moller Maersk MAERSKb.CO Industrials 11,950.0 37,764 -11% -21% -15% 8.8 4.7 10% 4%
IN Infosys INFY.BO Information Technology 990 35,865 -2% -9% 21% 16.4 9.8 24% 15%
FR Christian Dior DIOR.PA Consumer Discretionary 176.9 35,712 -5% -2% 33% 16.7 7.2 12% 11%
GB Associated British Foods ABF.L Consumer Staples 28.9 35,643 -1% -2% -7% 27.9 14.1 11% 10%
JP Canon 7751.T Information Technology 3,986.0 35,444 -7% -11% 20% 16.2 5.4 9% 2%
DE Fresenius FREG.F Health Care 58.0 35,035 3% 4% 54% 21.5 9.2 16% 14%
US Estee Lauder EL.N Consumer Staples 87.5 33,117 -1% 3% 15% 26.0 12.1 28% 17%
IN Sun Pharmaceuticals Industries SUN.BO Health Care 871.0 33,059 4% -24% 24% 26.3 10.8 17% 15%
MX Fomento Economico Mexicano FMSAUBD.MX Consumer Staples 141.4 32,470 2% -3% 13% 24.5 12.5 11% 14%
IT Luxottica Group LUX.MI Consumer Discretionary 59.9 32,164 -1% -1% 38% 29.6 12.3 18% 17%
SG Oversea-Chinese Banking Corporation OCBC.SI Financials 10.2 30,837 2% -4% 11% 10.3 nm 11% 11%
US Franklin Resources BEN.N Financials 49.2 30,439 -4% -6% -16% 12.9 8.2 nm 17%
US Thomson Reuters Corporation TRI.N Consumer Discretionary 38.4 30,228 -3% -8% 4% 17.6 11.0 12% 26%
SG United Overseas Bank UOBH.SI Financials 23.4 28,083 2% 0% 0% 10.8 8.8 10% 9%
IN Bharti Airtel BRTI.BO Telecommunication Serv ices 434.8 27,414 4% 7% 28% 25.9 5.8 8% 6%
KR Hyundai Motor Company 005380.KS Consumer Discretionary 135,000.0 26,513 -3% -18% -42% 4.7 6.9 10% 5% Source: the BLOOMBERG PROFESSIONAL™ service, Credit Suisse HOLT, Credit Suisse research
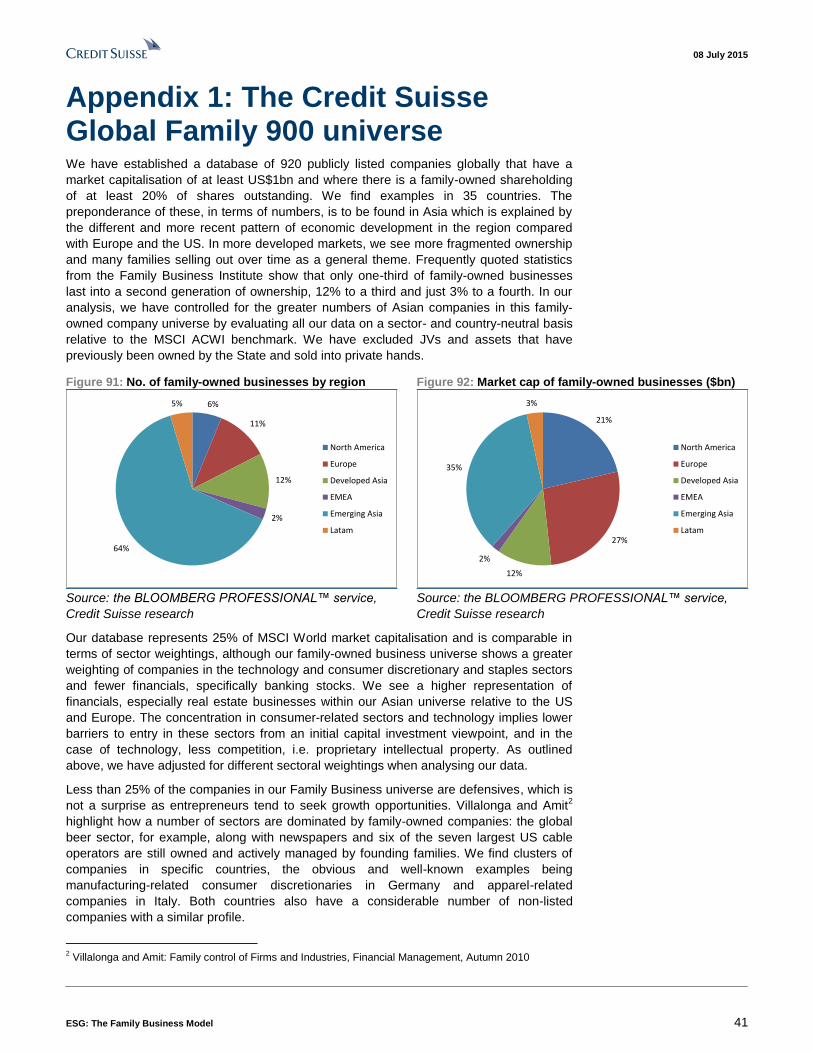
08 July 2015
ESG: The Family Business Model 41
Appendix 1: The Credit Suisse Global Family 900 universe We have established a database of 920 publicly listed companies globally that have a
market capitalisation of at least US$1bn and where there is a family-owned shareholding
of at least 20% of shares outstanding. We find examples in 35 countries. The
preponderance of these, in terms of numbers, is to be found in Asia which is explained by
the different and more recent pattern of economic development in the region compared
with Europe and the US. In more developed markets, we see more fragmented ownership
and many families selling out over time as a general theme. Frequently quoted statistics
from the Family Business Institute show that only one-third of family-owned businesses
last into a second generation of ownership, 12% to a third and just 3% to a fourth. In our
analysis, we have controlled for the greater numbers of Asian companies in this family-
owned company universe by evaluating all our data on a sector- and country-neutral basis
relative to the MSCI ACWI benchmark. We have excluded JVs and assets that have
previously been owned by the State and sold into private hands.
Figure 91: No. of family-owned businesses by region Figure 92: Market cap of family-owned businesses ($bn)
6%
11%
12%
2%
64%
5%
North America
Europe
Developed Asia
EMEA
Emerging Asia
Latam
21%
27%
12%
2%
35%
3%
North America
Europe
Developed Asia
EMEA
Emerging Asia
Latam
Source: the BLOOMBERG PROFESSIONAL™ service,
Credit Suisse research
Source: the BLOOMBERG PROFESSIONAL™ service,
Credit Suisse research
Our database represents 25% of MSCI World market capitalisation and is comparable in
terms of sector weightings, although our family-owned business universe shows a greater
weighting of companies in the technology and consumer discretionary and staples sectors
and fewer financials, specifically banking stocks. We see a higher representation of
financials, especially real estate businesses within our Asian universe relative to the US
and Europe. The concentration in consumer-related sectors and technology implies lower
barriers to entry in these sectors from an initial capital investment viewpoint, and in the
case of technology, less competition, i.e. proprietary intellectual property. As outlined
above, we have adjusted for different sectoral weightings when analysing our data.
Less than 25% of the companies in our Family Business universe are defensives, which is
not a surprise as entrepreneurs tend to seek growth opportunities. Villalonga and Amit2
highlight how a number of sectors are dominated by family-owned companies: the global
beer sector, for example, along with newspapers and six of the seven largest US cable
operators are still owned and actively managed by founding families. We find clusters of
companies in specific countries, the obvious and well-known examples being
manufacturing-related consumer discretionaries in Germany and apparel-related
companies in Italy. Both countries also have a considerable number of non-listed
companies with a similar profile.
2 Villalonga and Amit: Family control of Firms and Industries, Financial Management, Autumn 2010
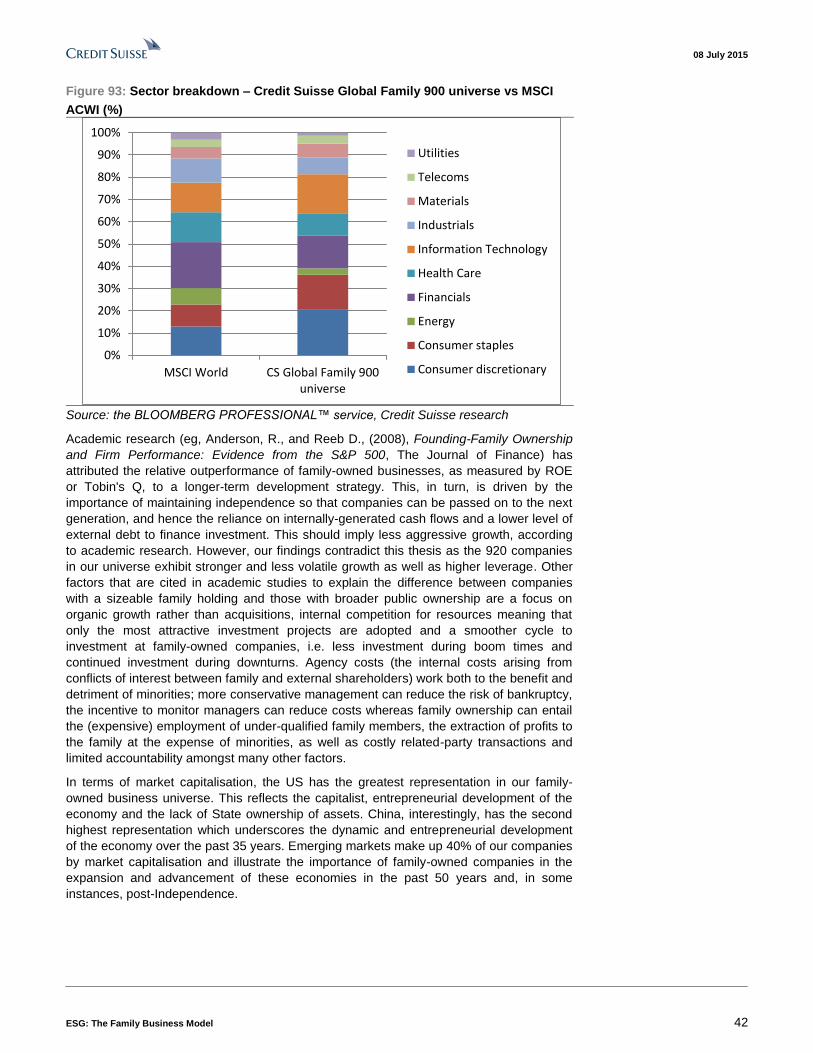
08 July 2015
ESG: The Family Business Model 42
Figure 93: Sector breakdown – Credit Suisse Global Family 900 universe vs MSCI
ACWI (%)
0%
10%
20%
30%
40%
50%
60%
70%
80%
90%
100%
MSCI World CS Global Family 900universe
Utilities
Telecoms
Materials
Industrials
Information Technology
Health Care
Financials
Energy
Consumer staples
Consumer discretionary
Source: the BLOOMBERG PROFESSIONAL™ service, Credit Suisse research
Academic research (eg, Anderson, R., and Reeb D., (2008), Founding-Family Ownership
and Firm Performance: Evidence from the S&P 500, The Journal of Finance) has
attributed the relative outperformance of family-owned businesses, as measured by ROE
or Tobin's Q, to a longer-term development strategy. This, in turn, is driven by the
importance of maintaining independence so that companies can be passed on to the next
generation, and hence the reliance on internally-generated cash flows and a lower level of
external debt to finance investment. This should imply less aggressive growth, according
to academic research. However, our findings contradict this thesis as the 920 companies
in our universe exhibit stronger and less volatile growth as well as higher leverage. Other
factors that are cited in academic studies to explain the difference between companies
with a sizeable family holding and those with broader public ownership are a focus on
organic growth rather than acquisitions, internal competition for resources meaning that
only the most attractive investment projects are adopted and a smoother cycle to
investment at family-owned companies, i.e. less investment during boom times and
continued investment during downturns. Agency costs (the internal costs arising from
conflicts of interest between family and external shareholders) work both to the benefit and
detriment of minorities; more conservative management can reduce the risk of bankruptcy,
the incentive to monitor managers can reduce costs whereas family ownership can entail
the (expensive) employment of under-qualified family members, the extraction of profits to
the family at the expense of minorities, as well as costly related-party transactions and
limited accountability amongst many other factors.
In terms of market capitalisation, the US has the greatest representation in our family-
owned business universe. This reflects the capitalist, entrepreneurial development of the
economy and the lack of State ownership of assets. China, interestingly, has the second
highest representation which underscores the dynamic and entrepreneurial development
of the economy over the past 35 years. Emerging markets make up 40% of our companies
by market capitalisation and illustrate the importance of family-owned companies in the
expansion and advancement of these economies in the past 50 years and, in some
instances, post-Independence.
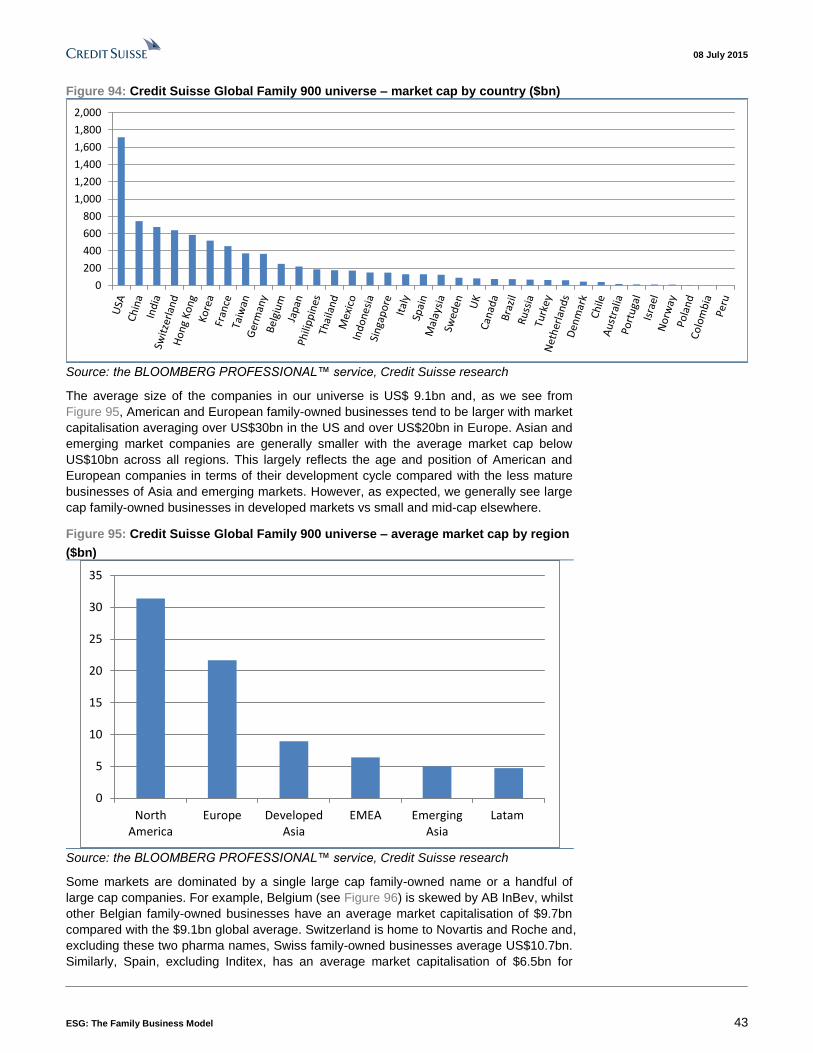
08 July 2015
ESG: The Family Business Model 43
Figure 94: Credit Suisse Global Family 900 universe – market cap by country ($bn)
0
200
400
600
800
1,000
1,200
1,400
1,600
1,800
2,000
Source: the BLOOMBERG PROFESSIONAL™ service, Credit Suisse research
The average size of the companies in our universe is US$ 9.1bn and, as we see from
Figure 95, American and European family-owned businesses tend to be larger with market
capitalisation averaging over US$30bn in the US and over US$20bn in Europe. Asian and
emerging market companies are generally smaller with the average market cap below
US$10bn across all regions. This largely reflects the age and position of American and
European companies in terms of their development cycle compared with the less mature
businesses of Asia and emerging markets. However, as expected, we generally see large
cap family-owned businesses in developed markets vs small and mid-cap elsewhere.
Figure 95: Credit Suisse Global Family 900 universe – average market cap by region
($bn)
0
5
10
15
20
25
30
35
NorthAmerica
Europe DevelopedAsia
EMEA EmergingAsia
Latam
Source: the BLOOMBERG PROFESSIONAL™ service, Credit Suisse research
Some markets are dominated by a single large cap family-owned name or a handful of
large cap companies. For example, Belgium (see Figure 96) is skewed by AB InBev, whilst
other Belgian family-owned businesses have an average market capitalisation of $9.7bn
compared with the $9.1bn global average. Switzerland is home to Novartis and Roche and,
excluding these two pharma names, Swiss family-owned businesses average US$10.7bn.
Similarly, Spain, excluding Inditex, has an average market capitalisation of $6.5bn for
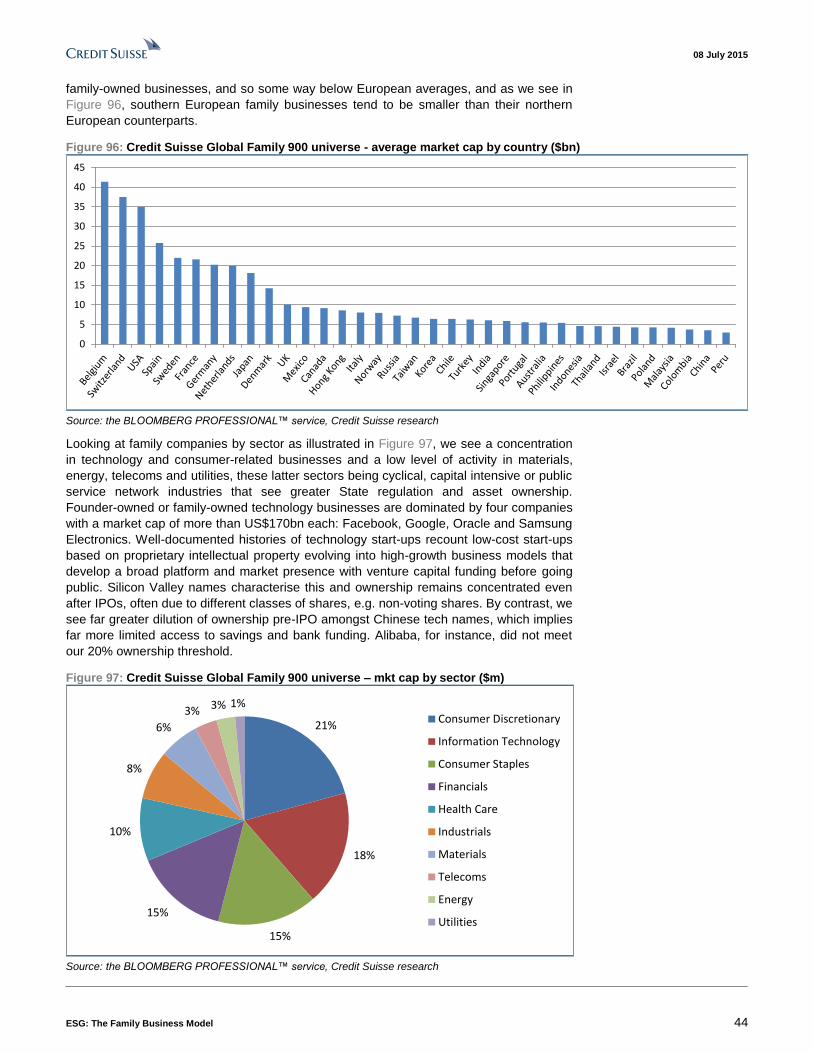
08 July 2015
ESG: The Family Business Model 44
family-owned businesses, and so some way below European averages, and as we see in
Figure 96, southern European family businesses tend to be smaller than their northern
European counterparts.
Figure 96: Credit Suisse Global Family 900 universe - average market cap by country ($bn)
0
5
10
15
20
25
30
35
40
45
Source: the BLOOMBERG PROFESSIONAL™ service, Credit Suisse research
Looking at family companies by sector as illustrated in Figure 97, we see a concentration
in technology and consumer-related businesses and a low level of activity in materials,
energy, telecoms and utilities, these latter sectors being cyclical, capital intensive or public
service network industries that see greater State regulation and asset ownership.
Founder-owned or family-owned technology businesses are dominated by four companies
with a market cap of more than US$170bn each: Facebook, Google, Oracle and Samsung
Electronics. Well-documented histories of technology start-ups recount low-cost start-ups
based on proprietary intellectual property evolving into high-growth business models that
develop a broad platform and market presence with venture capital funding before going
public. Silicon Valley names characterise this and ownership remains concentrated even
after IPOs, often due to different classes of shares, e.g. non-voting shares. By contrast, we
see far greater dilution of ownership pre-IPO amongst Chinese tech names, which implies
far more limited access to savings and bank funding. Alibaba, for instance, did not meet
our 20% ownership threshold.
Figure 97: Credit Suisse Global Family 900 universe – mkt cap by sector ($m)
21%
18%
15%
15%
10%
8%
6%
3% 3% 1%Consumer Discretionary
Information Technology
Consumer Staples
Financials
Health Care
Industrials
Materials
Telecoms
Energy
Utilities
Source: the BLOOMBERG PROFESSIONAL™ service, Credit Suisse research
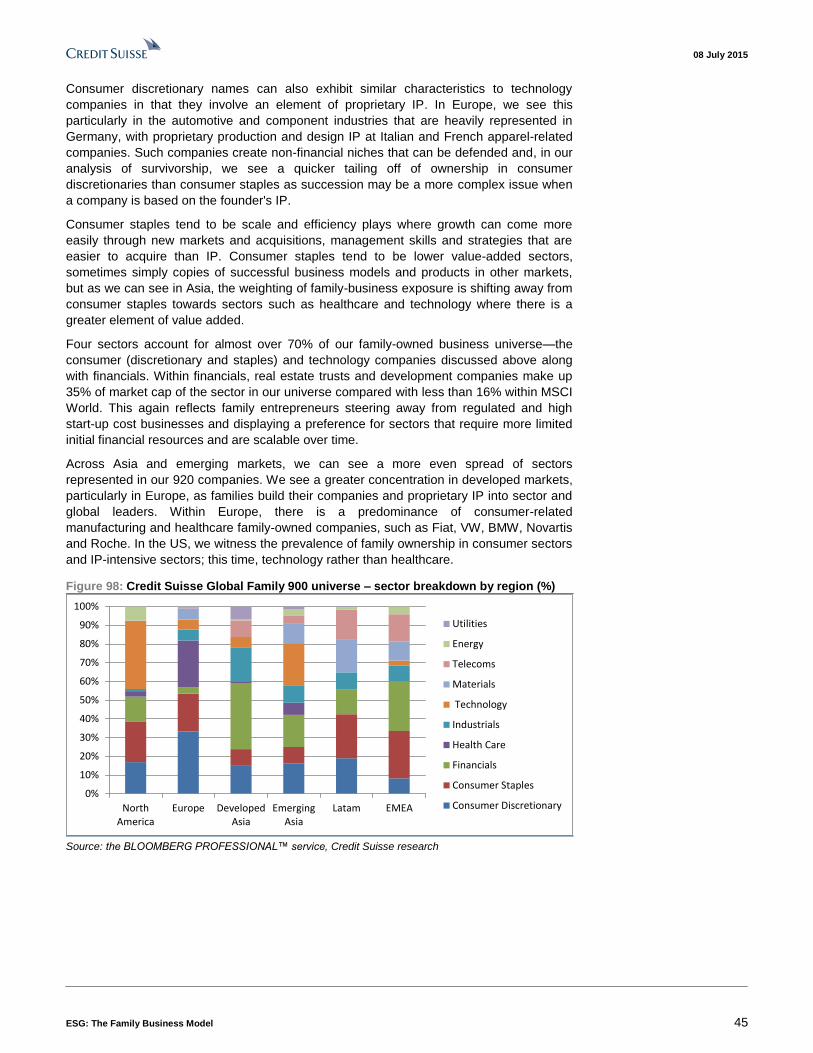
08 July 2015
ESG: The Family Business Model 45
Consumer discretionary names can also exhibit similar characteristics to technology
companies in that they involve an element of proprietary IP. In Europe, we see this
particularly in the automotive and component industries that are heavily represented in
Germany, with proprietary production and design IP at Italian and French apparel-related
companies. Such companies create non-financial niches that can be defended and, in our
analysis of survivorship, we see a quicker tailing off of ownership in consumer
discretionaries than consumer staples as succession may be a more complex issue when
a company is based on the founder's IP.
Consumer staples tend to be scale and efficiency plays where growth can come more
easily through new markets and acquisitions, management skills and strategies that are
easier to acquire than IP. Consumer staples tend to be lower value-added sectors,
sometimes simply copies of successful business models and products in other markets,
but as we can see in Asia, the weighting of family-business exposure is shifting away from
consumer staples towards sectors such as healthcare and technology where there is a
greater element of value added.
Four sectors account for almost over 70% of our family-owned business universe—the
consumer (discretionary and staples) and technology companies discussed above along
with financials. Within financials, real estate trusts and development companies make up
35% of market cap of the sector in our universe compared with less than 16% within MSCI
World. This again reflects family entrepreneurs steering away from regulated and high
start-up cost businesses and displaying a preference for sectors that require more limited
initial financial resources and are scalable over time.
Across Asia and emerging markets, we can see a more even spread of sectors
represented in our 920 companies. We see a greater concentration in developed markets,
particularly in Europe, as families build their companies and proprietary IP into sector and
global leaders. Within Europe, there is a predominance of consumer-related
manufacturing and healthcare family-owned companies, such as Fiat, VW, BMW, Novartis
and Roche. In the US, we witness the prevalence of family ownership in consumer sectors
and IP-intensive sectors; this time, technology rather than healthcare.
Figure 98: Credit Suisse Global Family 900 universe – sector breakdown by region (%)
0%
10%
20%
30%
40%
50%
60%
70%
80%
90%
100%
NorthAmerica
Europe DevelopedAsia
EmergingAsia
Latam EMEA
Utilities
Energy
Telecoms
Materials
Technology
Industrials
Health Care
Financials
Consumer Staples
Consumer Discretionary
Source: the BLOOMBERG PROFESSIONAL™ service, Credit Suisse research
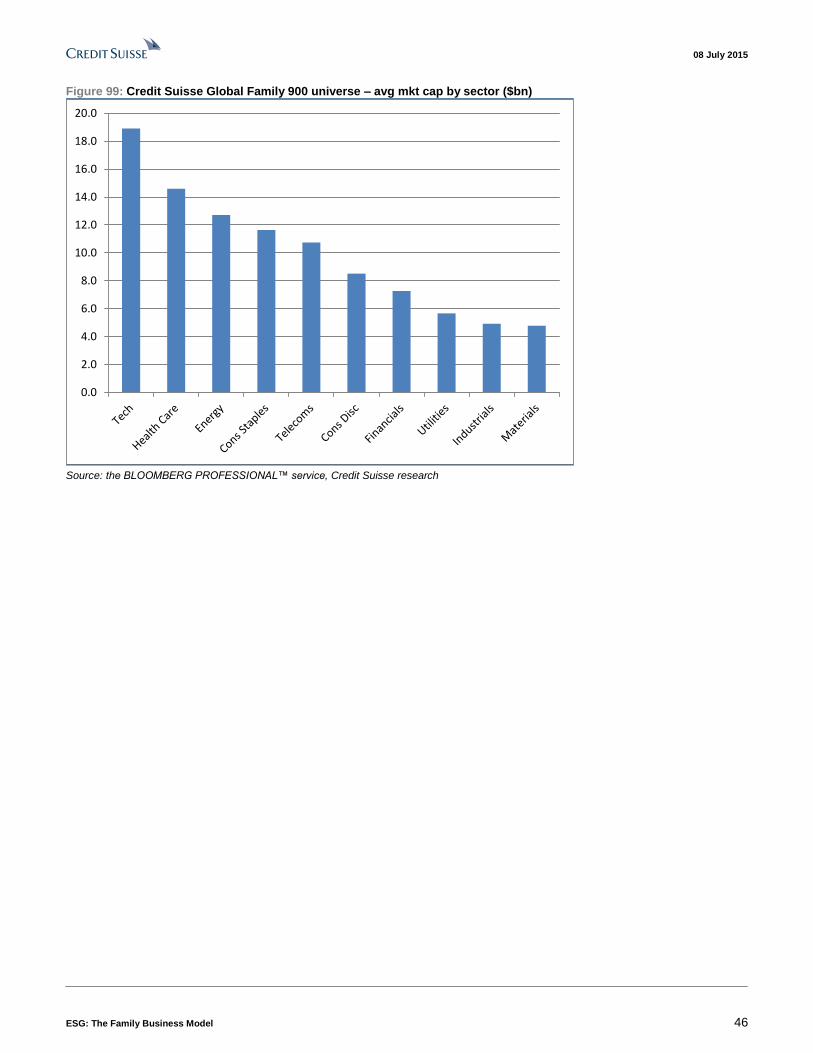
08 July 2015
ESG: The Family Business Model 46
Figure 99: Credit Suisse Global Family 900 universe – avg mkt cap by sector ($bn)
0.0
2.0
4.0
6.0
8.0
10.0
12.0
14.0
16.0
18.0
20.0
Source: the BLOOMBERG PROFESSIONAL™ service, Credit Suisse research
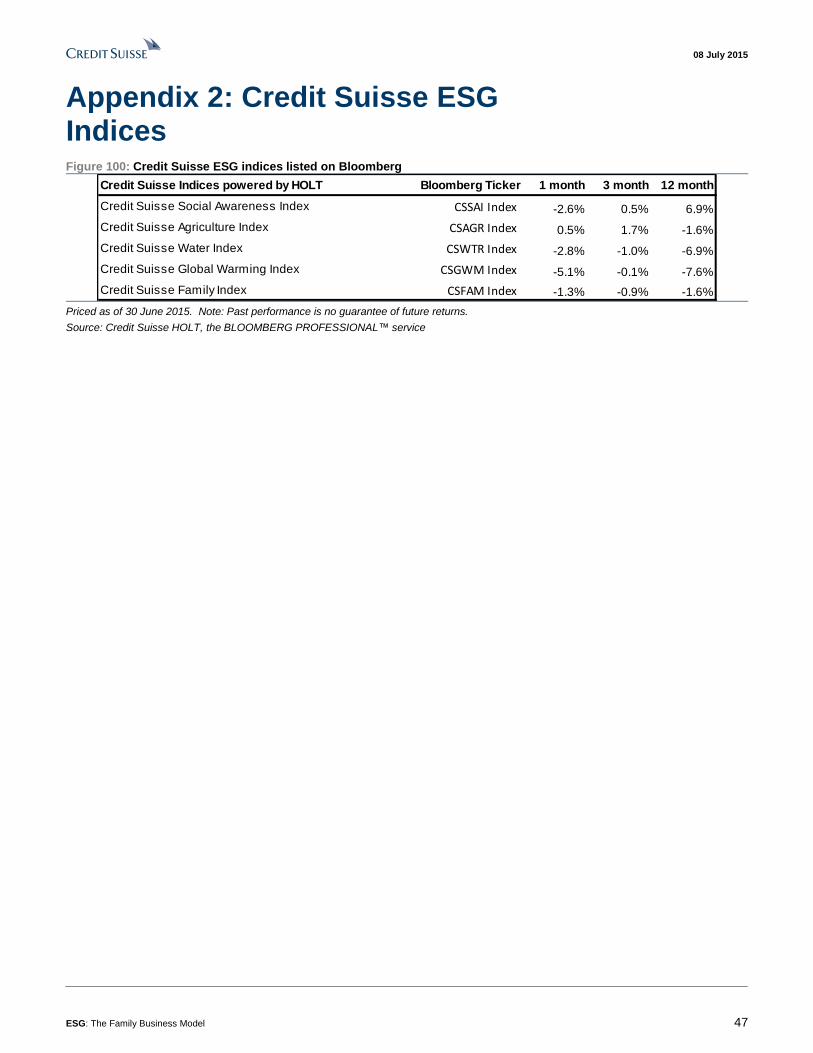
08 July 2015
ESG: The Family Business Model 47
Appendix 2: Credit Suisse ESG Indices Figure 100: Credit Suisse ESG indices listed on Bloomberg
Credit Suisse Indices powered by HOLT Bloomberg Ticker 1 month 3 month 12 month
Credit Suisse Social Awareness Index CSSAI Index -2.6% 0.5% 6.9%
Credit Suisse Agriculture Index CSAGR Index 0.5% 1.7% -1.6%
Credit Suisse Water Index CSWTR Index -2.8% -1.0% -6.9%
Credit Suisse Global Warming Index CSGWM Index -5.1% -0.1% -7.6%
Credit Suisse Family Index CSFAM Index -1.3% -0.9% -1.6% Priced as of 30 June 2015. Note: Past performance is no guarantee of future returns.
Source: Credit Suisse HOLT, the BLOOMBERG PROFESSIONAL™ service
08 July 2015
ESG: The Family Business Model 48
Selected reading Alluche J., Amann B., Jaussaud, J. and Kurashina T., The Impact of Family Control on the
Performance and Financial Characteristics of Family versus Nonfamily Businesses in
Japan: A Matched-Pair Investigation
Anderson, R., and Reeb D., (2008), Founding-Family Ownership and Firm Performance:
Evidence from the S&P 500, The Journal of Finance.
Barontini R., and Caprio L., The Effect of Family Control on Firm Value and Performance.
Evidence from Continental Europe
Boland M., and Pendell D. (2005), Persistence of Profitability in Family-Owned Food
Businesses
Chen K., and Hsu W. (2009), Family Ownership, Board Independence. And R&D
Investment, Family Business Review
Corstjens M., Peyer U., and Van der Heyden L. (2006), Performance of Family Firms:
Evidence from US and European firms and investors INSEAD
Fahlenbrach R. (2003), Founder-CEOs and Stock Market Performance, The Wharton
School
Kotlar, J., Fang, H., De Massis, A. and Frattini, F. (2014), Profitability Goals, Control Goals,
and the R&D Investment Decisions of Family and Nonfamily Firms. Journal of Product
Innovation Management, 31: 1128–1145. doi: 10.1111/jpim.12165
Kowalewski O., Talavera O., and Stetsyuk I. (2010), Influence of Family Involvement in
Management and Ownership on Firm Performance: Evidence from Poland, Family
Business Review
McKinsey & Co: The five attributes of enduring family businesses
Miller D., and Le Breton-Miller I (2006), Family governance and firm performance: Agency,
stewardship and capabilities. Family Business Review, 19 p 73-87,
Munoz-Bullon F., and Sanchez-Bueno M. (2011), The Impact of Family Involvement on the
R&D Intensity of Publicly Traded Firms
OECD: Small Businesses, Job Creation and Growth: Facts, Obstacles and Best Practices,
1997
Tze San Ong & Shih Sze Gan, Do Family-Owned Banks Perform Better? A Study of
Malaysian Banking Industry, Asian Social Science Vol 9 No 7 2013
Villalonga B., and Amit R. (2010), Family Control of Firms and Industries, Financial
Management, Autumn 2010
Villalonga B., and Amit R. (2005), How do family ownership, control and management
affect firm value? Journal of Financial Economics
Yuan Ding, Hua Zhang, Junxi Zhang (2008), The Financial and Operating Performance of
Chinese Family-Owned Listed Firms, Management International Review
08 July 2015
ESG: The Family Business Model 49
Companies Mentioned (Price as of 03-Jul-2015)
AP Moller Maersk (MAERSKb.CO, Dkr11950.0) Alfa Laval (ALFA.ST, Skr148.4) America Movil (AMXL.MX, MXN16.5) Anheuser-Busch InBev (ABI.BR, €108.25) ArcelorMittal (MT.N, $9.6) Associated British Foods (ABF.L, 2892.0p) Astra International (ASII.JK, Rp7,050) B&M European Retail (BMEB.L, 351.0p) BMW (BMWG.DE, €98.9) Belle International Holdings Ltd (1880.HK, HK$9.0) Berkshire Hatha (BRKb.N, $137.39) Bharti Airtel Ltd (BRTI.BO, Rs434.8) C.P. ALL PCL (CPALL.BK, Bt46.0) CK Hutchison Holdings Limited (0001.HK, HK$112.8) CR Sanjiu Pharma (000999.SZ, Rmb26.5) CTBC Holding (2891.TW, NT$24.25) Canon (7751.T, ¥3,986) Carnival (CCL.N, $49.86) Cheung Kong Infrastructure (1038.HK, HK$60.05) Christian Dior S.A. (DIOR.PA, €176.85) Coloplast B (COLOb.CO, Dkr437.6) Compagnie Financiere Richemont SA (CFR.VX, SFr76.5) Costco Wholesale Corporation (COST.OQ, $136.39) Dassault Aviation (AVMD.PA, €1170.0) Dassault Systemes (DAST.PA, €65.99) El Puerto de Liverpool, S.A.B. de C.V. (LIVEPOLC1.MX, MXN183.11) Estee Lauder Companies Inc (EL.N, $87.52) Facebook Inc. (FB.OQ, $87.28) Fast Retailing (9983.T, ¥55,740) Fomento Economico Mexicano SAB de CV (FMSAUBD.MX, MXN141.35) Forbo (FORN.S, SFr1115.0) Formosa Plastics (1301.TW, NT$72.5) Franklin Resources (BEN.N, $49.21) Fresenius (FREG.F, €58.014) G.F. Inbursa (GFINBURO.MX, MXN35.38) GRUPO SANBORNS, S.A.B. DE CV (GSNBRB1.MX, MXN24.3) Geely Automobile Holdings Ltd (0175.HK, HK$3.9) Google, Inc. (GOOGL.OQ, $547.34) HCL Technologies (HCLT.BO, Rs965.6) Heineken (HEIN.AS, €68.09) Hella (HLE.DE, €44.0) Henderson Land Dev (0012.HK, HK$52.7) Hennes & Mauritz (HMb.ST, Skr322.3) Hermes International (HRMS.PA, €334.5) Hon Hai Precision (2317.TW, NT$97.3) Hongkong Land Holdings (HKLD.SI, $8.37) Hyundai Mobis (012330.KS, W205,500) Hyundai Motor Company (005380.KS, W135,000) Inditex (ITX.MC, €28.84) Infosys Limited (INFY.BO, Rs989.95) JD.com, Inc. (JD.OQ, $33.13)
Jardine Matheson (JARD.SI, $55.96) Jiangsu Hengrui Medicine Co. Ltd (600276.SS, Rmb41.65) Jiangsu Yanghe Brewery Joint-stock Co., Ltd (002304.SZ, Rmb60.95) Kinder Morgan, Inc. (KMI.N, $38.03) Kone Corporation (KNEBV.HE, €35.9) L Brands, Inc. (LB.N, $86.36) L'Oreal (OREP.PA, €158.35) LG Chem Ltd. (051910.KS, W280,500) LVMH (LVMH.PA, €157.65) LinkedIn (LNKD.N, $207.76) Luxottica Group (LUX.MI, €59.9) Marriott International (MAR.OQ, $74.8) Maxis Berhad (MXSC.KL, RM6.38) McKesson Corporation (MCK.N, $224.26) Megacable Holdings, S.A.B. De C.V. (MEGACPO.MX, MXN66.41) Merck KGaA (MRCG.DE, €91.6) Nan Ya Plastics (1303.TW, NT$70.6) News Corporation (NWS.AX, A$18.55) Nike Inc. (NKE.N, $109.87) Novartis (NOVN.VX, SFr93.05) Oracle Corporation (ORCL.N, $40.36) Oversea-Chinese Banking Corporation (OCBC.SI, S$10.23) Phillips 66 (PSX.N, $81.45) Reliance Industries (RELI.BO, Rs1006.75) Richemont (CFRJ.J, R100.0) Roche (ROG.VX, SFr265.1) Royal Caribbean Cruises (RCL.N, $78.78) SAP (SAPG.F, €62.5) Samsung Electronics (005930.KS, W1,268,000) Samsung Life Insurance (032830.KS, W107,500) Schindler-Holding AG (SCHP.VX, SFr154.5) Schroders (SDR.L, 3174.0p) Siam Cement (SCC.BK, Bt520.0) Sino Biopharmaceutical Limited (1177.HK, HK$8.63) Sodexo (EXHO.PA, €85.25) SoftBank Group Corp. (9984.T, ¥7,165) Sun Hung Kai (0086.HK, HK$6.75) Sun Hung Kai Properties (0016.HK, HK$125.4) Sun Pharmaceuticals Industries Limited (SUN.BO, Rs871.0) Swatch Group (UHR.VX, SFr370.6) TalkTalk (TALK.L, 381.1p) Tata Consultancy Services (TCS.BO, Rs2604.8) Tata Motors Ltd. (TAMO.BO, Rs433.35) Thomson Reuters Corporation (TRI.N, $38.36) United Overseas Bank (UOBH.SI, S$23.4) Volkswagen (VOWG_p.F, €213.1) WH Group Limited (0288.HK, HK$5.16) Wal-Mart Stores, Inc. (WMT.N, $71.86) Whole Foods Market (WFM.OQ, $39.15) Wilmar International Ltd (WLIL.SI, S$3.3) Wipro Ltd. (WIPR.BO, Rs549.85)
Disclosure Appendix
Important Global Disclosures
Julia Dawson, Richard Kersley, Catherine Tillson and Marcelo Preto each certify, with respect to the companies or securities that the individual analyzes, that (1) the views expressed in this report accurately reflect his or her personal views about all of the subject companies and securities and (2) no part of his or her compensation was, is or will be directly or indirectly related to the specific recommendations or views expressed in this report.
The analyst(s) responsible for preparing this research report received Compensation that is based upon various factors including Credit Suisse's total revenues, a portion of which are generated by Credit Suisse's investment banking activities
As of December 10, 2012 Analysts’ stock rating are defined as follows:
Outperform (O) : The stock’s total return is expected to outperform the relevant benchmark*over the next 12 months.
Neutral (N) : The stock’s total return is expected to be in line with the relevant benchmark* over the next 12 months.
Underperform (U) : The stock’s total return is expected to underperform the relevant benchmark* over the next 12 months.
*Relevant benchmark by region: As of 10th December 2012, Japanese ratings are based on a stock’s total return relative to the analyst's coverage universe which consists of all companies covered by the analyst within the relevant sector, with Outperforms representing the most attractive, Neutrals the less attractive, and Underperforms the least attractive investment opportunities. As of 2nd October 2012, U.S. and Canadian as well as European ra tings are based on a stock’s total return relative to the analyst's coverage universe which consists of all companies covered by the analyst within the relevant sector, with Outperforms representing the most attractive, Neutrals the less attractive, and Underperforms the least attractive investment oppor tunities. For Latin American and non-Japan Asia stocks, ratings are based on a stock’s total return relative to the average total return of the relevant country or regional benchmark; prior to 2nd October 2012 U.S. and Canadian
08 July 2015
ESG: The Family Business Model 50
ratings were based on (1) a stock’s absolute total return potential to its current share price and (2) the relative attractiveness of a stock’s total return potential within an analyst’s coverage universe. For Australian and New Zealand stocks, the expected total return (ETR) calcula tion includes 12-month rolling dividend yield. An Outperform rating is assigned where an ETR is greater than or equal to 7.5%; Underperform where an ETR less than or equal to 5%. A Neutral may be assigned where the ETR is between -5% and 15%. The overlapping rating range allows analysts to assign a rating that puts ETR in the context of associated risks. Prior to 18 May 2015, ETR ranges for Outperform and Underperform ratings did not overlap with Neutral thresholds between 15% and 7.5%, wh ich was in operation from 7 July 2011.
Restricted (R) : In certain circumstances, Credit Suisse policy and/or applicable law and regulations preclude certain types of communications, including an investment recommendation, during the course of Credit Suisse's engagement in an investment banking transaction and in certain other circumstances.
Volatility Indicator [V] : A stock is defined as volatile if the stock price has moved up or down by 20% or more in a month in at least 8 of the past 24 months or the analyst expects significant volatility going forward.
Analysts’ sector weightings are distinct from analysts’ stock ratings and are based on the analyst’s expectations for the fundamentals and/or valuation of the sector* relative to the group’s historic fundamentals and/or valuation:
Overweight : The analyst’s expectation for the sector’s fundamentals and/or valuation is favorable over the next 12 months.
Market Weight : The analyst’s expectation for the sector’s fundamentals and/or valuation is neutral over the next 12 months.
Underweight : The analyst’s expectation for the sector’s fundamentals and/or valuation is cautious over the next 12 months.
*An analyst’s coverage sector consists of all companies covered by the analyst within the relevant sector. An analyst may cover multiple sectors.
Credit Suisse's distribution of stock ratings (and banking clients) is:
Global Ratings Distribution
Rating Versus universe (%) Of which banking clients (%)
Outperform/Buy* 50% (26% banking clients)
Neutral/Hold* 36% (44% banking clients)
Underperform/Sell* 12% (42% banking clients)
Restricted 2%
*For purposes of the NYSE and NASD ratings distribution disclosure requirements, our stock ratings of Outperform, Neutral, an d Underperform most closely correspond to Buy, Hold, and Sell, respectively; however, the meanings are not the same, as our stock ratings are determined on a relative basis. (Please refer to definitions above.) An investor's decision to buy or sell a security should be based on investment objectives, current holdin gs, and other individual factors.
Credit Suisse’s policy is to update research reports as it deems appropriate, based on developments with the subject company, the sector or the market that may have a material impact on the research views or opinions stated herein.
Credit Suisse's policy is only to publish investment research that is impartial, independent, clear, fair and not misleading. For more detail please refer to Credit Suisse's Policies for Managing Conflicts of Interest in connection with Investment Research: http://www.csfb.com/research-and-analytics/disclaimer/managing_conflicts_disclaimer.html
Credit Suisse does not provide any tax advice. Any statement herein regarding any US federal tax is not intended or written to be used, and cannot be used, by any taxpayer for the purposes of avoiding any penalties.
See the Companies Mentioned section for full company names
The subject company (ALFA.ST, FB.OQ, GOOGL.OQ, WMT.N, FORN.S, ABI.BR, ABF.L, 1880.HK, 2891.TW, CCL.N, COLOb.CO, CFR.VX, GSNBRB1.MX, FMSAUBD.MX, BEN.N, HCLT.BO, 2317.TW, JD.OQ, JARD.SI, 051910.KS, LVMH.PA, MAR.OQ, MCK.N, MEGACPO.MX, NOVN.VX, ORCL.N, PSX.N, ROG.VX, SAPG.F, 005930.KS, SDR.L, 9984.T, SUN.BO, TCS.BO, UOBH.SI, WIPR.BO, BMEB.L, NWS.AX, COST.OQ, LIVEPOLC1.MX, BMWG.DE, 0016.HK, RELI.BO, 1038.HK, TAMO.BO, MT.N, TRI.N, GFINBURO.MX, 032830.KS, HRMS.PA, HEIN.AS, BRTI.BO, 005380.KS) currently is, or was during the 12-month period preceding the date of distribution of this report, a client of Credit Suisse.
Credit Suisse provided investment banking services to the subject company (FB.OQ, GOOGL.OQ, WMT.N, ABF.L, FMSAUBD.MX, HCLT.BO, MAR.OQ, NOVN.VX, ORCL.N, PSX.N, SAPG.F, 005930.KS, 9984.T, UOBH.SI, BMEB.L, BMWG.DE, TAMO.BO, MT.N, GFINBURO.MX, 032830.KS, HEIN.AS, 005380.KS) within the past 12 months.
Credit Suisse provided non-investment banking services to the subject company (2891.TW, ROG.VX, SDR.L, 005380.KS) within the past 12 months
Credit Suisse has managed or co-managed a public offering of securities for the subject company (WMT.N, FMSAUBD.MX, NOVN.VX, PSX.N, 9984.T, UOBH.SI, BMWG.DE, TAMO.BO, MT.N, 032830.KS, 005380.KS) within the past 12 months.
Credit Suisse has received investment banking related compensation from the subject company (FB.OQ, GOOGL.OQ, WMT.N, ABF.L, FMSAUBD.MX, HCLT.BO, MAR.OQ, NOVN.VX, ORCL.N, PSX.N, SAPG.F, 005930.KS, 9984.T, UOBH.SI, BMEB.L, BMWG.DE, TAMO.BO, MT.N, GFINBURO.MX, 032830.KS, HEIN.AS, 005380.KS) within the past 12 months
Credit Suisse expects to receive or intends to seek investment banking related compensation from the subject company (ALFA.ST, LNKD.N, FB.OQ, GOOGL.OQ, WMT.N, EXHO.PA, FORN.S, ABI.BR, ABF.L, 1880.HK, 2891.TW, CCL.N, COLOb.CO, DAST.PA, AVMD.PA, GSNBRB1.MX, 9983.T, FMSAUBD.MX, 1301.TW, BEN.N, HCLT.BO, 2317.TW, JD.OQ, JARD.SI, 051910.KS, LVMH.PA, MAR.OQ, MCK.N, MEGACPO.MX, NOVN.VX, ORCL.N, PSX.N, RCL.N, SAPG.F, 005930.KS, 9984.T, SUN.BO, TCS.BO, UOBH.SI, WIPR.BO, BMEB.L, NWS.AX, COST.OQ, 0175.HK,
08 July 2015
ESG: The Family Business Model 51
MRCG.DE, BMWG.DE, 0016.HK, RELI.BO, 0288.HK, 1038.HK, TAMO.BO, MT.N, TRI.N, GFINBURO.MX, 032830.KS, 1303.TW, HEIN.AS, DIOR.PA, BRTI.BO, 005380.KS) within the next 3 months.
Credit Suisse has received compensation for products and services other than investment banking services from the subject company (2891.TW, ROG.VX, SDR.L, 005380.KS) within the past 12 months
As of the date of this report, Credit Suisse makes a market in the following subject companies (LNKD.N, FB.OQ, GOOGL.OQ, WMT.N, CCL.N, BEN.N, KMI.N, LB.N, MAR.OQ, MCK.N, NKE.N, ORCL.N, PSX.N, COST.OQ, WFM.OQ, MT.N).
Credit Suisse may have interest in (MXSC.KL)
Please visit https://credit-suisse.com/in/researchdisclosure for additional disclosures mandated vide Securities And Exchange Board of India (Research Analysts) Regulations, 2014
Credit Suisse may have interest in (HCLT.BO, SUN.BO, TCS.BO, WIPR.BO, RELI.BO, TAMO.BO, INFY.BO, BRTI.BO)
As of the end of the preceding month, Credit Suisse beneficially own 1% or more of a class of common equity securities of (FORN.S, CFR.VX, NOVN.VX, SAPG.F).
Credit Suisse has a material conflict of interest with the subject company (FB.OQ) . Credit Suisse has been named as a defendant in various putative shareholder class-action lawsuits relating to Facebook, Inc.’s May 2012 initial public offering. Credit Suisse’s practice is not to comment in research reports on pending litigations to which it is a party. Nothing in this report should be construed as an opinion on the merits or potential outcome of the lawsuits.
Credit Suisse has a material conflict of interest with the subject company (005930.KS) . Credit Suisse is acting as exclusive financial advisor to Samsung Electronics and Samsung Fine Chemicals in relation to the proposed sale of their ownership stakes in the semiconductor wafer joint ventures with SunEdison, SMP Ltd and MEMC Korea Company Ltd, to SunEdison.
Credit Suisse has a material conflict of interest with the subject company (9984.T) . .
Credit Suisse has a material conflict of interest with the subject company (WLIL.SI) . Credit Suisse is acting as financial advisor to Goodman Fielder in relation to the receipt of the announced proposal from Wilmar International Limited and First Pacific Company Limited.
As of the date of this report, an analyst involved in the preparation of this report has the following material conflict of interest with the subject company (ORCL.N). As of the date of this report, an analyst involved in the preparation of this report, Sitikantha Panigrahi, has following material conflicts of interest with the subject company. The analyst or a member of the analyst's household has a long position in call options of Oracle Corporation (ORCL.N).
For other important disclosures concerning companies featured in this report, including price charts, please visit the website at https://rave.credit-suisse.com/disclosures or call +1 (877) 291-2683.
Important Regional Disclosures
Singapore recipients should contact Credit Suisse AG, Singapore Branch for any matters arising from this research report.
The analyst(s) involved in the preparation of this report have not visited the material operations of the subject company (ALFA.ST, LNKD.N, FB.OQ, GOOGL.OQ, WMT.N, EXHO.PA, FORN.S, ABI.BR, ABF.L, ASII.JK, 1880.HK, 000999.SZ, 2891.TW, CCL.N, COLOb.CO, CFR.VX, DAST.PA, AVMD.PA, GSNBRB1.MX, 9983.T, FMSAUBD.MX, 1301.TW, BEN.N, HCLT.BO, HLE.DE, 0012.HK, HMb.ST, 2317.TW, HKLD.SI, ITX.MC, JD.OQ, JARD.SI, KMI.N, KNEBV.HE, LB.N, OREP.PA, 051910.KS, LVMH.PA, MAR.OQ, MXSC.KL, MCK.N, MEGACPO.MX, NKE.N, NOVN.VX, ORCL.N, ORCL.N, PSX.N, ROG.VX, RCL.N, SAPG.F, 005930.KS, SCHP.VX, SDR.L, 1177.HK, 9984.T, SUN.BO, UHR.VX, TCS.BO, UOBH.SI, WLIL.SI, WIPR.BO, BMEB.L, TALK.L, NWS.AX, 600276.SS, 002304.SZ, COST.OQ, WFM.OQ, LIVEPOLC1.MX, 0175.HK, 0001.HK, MRCG.DE, BMWG.DE, 0016.HK, RELI.BO, 0288.HK, 1038.HK, CPALL.BK, TAMO.BO, SCC.BK, MT.N, TRI.N, GFINBURO.MX, 012330.KS, 032830.KS, 1303.TW, HRMS.PA, MAERSKb.CO, OCBC.SI, HEIN.AS, INFY.BO, DIOR.PA, BRTI.BO, 005380.KS) within the past 12 months
Restrictions on certain Canadian securities are indicated by the following abbreviations: NVS--Non-Voting shares; RVS--Restricted Voting Shares; SVS--Subordinate Voting Shares.
Individuals receiving this report from a Canadian investment dealer that is not affiliated with Credit Suisse should be advised that this report may not contain regulatory disclosures the non-affiliated Canadian investment dealer would be required to make if this were its own report.
For Credit Suisse Securities (Canada), Inc.'s policies and procedures regarding the dissemination of equity research, please visit https://www.credit-suisse.com/sites/disclaimers-ib/en/canada-research-policy.html.
Credit Suisse Securities (Europe) Limited (Credit Suisse) acts as broker to (ABF.L, TALK.L).
The following disclosed European company/ies have estimates that comply with IFRS: (ALFA.ST, EXHO.PA, ABI.BR, ABF.L, DAST.PA, HMb.ST, ITX.MC, OREP.PA, SAPG.F, SDR.L, TALK.L, 0001.HK, BMWG.DE, MT.N, HEIN.AS).
Credit Suisse has acted as lead manager or syndicate member in a public offering of securities for the subject company (FB.OQ, GOOGL.OQ, WMT.N, GSNBRB1.MX, MAR.OQ, MXSC.KL, NOVN.VX, PSX.N, SAPG.F, SCHP.VX, 9984.T, UOBH.SI, BMWG.DE, TAMO.BO, MT.N, GFINBURO.MX, 032830.KS, HEIN.AS, 005380.KS) within the past 3 years.
As of the end of the preceding month, Credit Suisse beneficially owned the following percentages of the voting rights of the subject companies: 1.0% or more of SCHP.VX, 1.0% or more of UHR.VX
08 July 2015
ESG: The Family Business Model 52
As of the date of this report, Credit Suisse acts as a market maker or liquidity provider in the equities securities that are the subject of this report.
Principal is not guaranteed in the case of equities because equity prices are variable.
Commission is the commission rate or the amount agreed with a customer when setting up an account or at any time after that.
For Thai listed companies mentioned in this report, the independent 2014 Corporate Governance Report survey results published by the Thai Institute of Directors Association are being disclosed pursuant to the policy of the Office of the Securities and Exchange Commission: C.P. ALL PCL () , Siam Cement (Very Good)
To the extent this is a report authored in whole or in part by a non-U.S. analyst and is made available in the U.S., the following are important disclosures regarding any non-U.S. analyst contributors: The non-U.S. research analysts listed below (if any) are not registered/qualified as research analysts with FINRA. The non-U.S. research analysts listed below may not be associated persons of CSSU and therefore may not be subject to the NASD Rule 2711 and NYSE Rule 472 restrictions on communications with a subject company, public appearances and trading securities held by a research analyst account.
Credit Suisse Securities (Europe) Limited....................................................... Julia Dawson ; Richard Kersley ; Catherine Tillson ; Marcelo Preto
Important MSCI Disclosures
The MSCI sourced information is the exclusive property of Morgan Stanley Capital International Inc. (MSCI). Without prior written permission of MSCI, this information and any other MSCI intellectual property may not be reproduced, re-disseminated or used to create and financial products, including any indices. This information is provided on an "as is" basis. The user assumes the entire risk of any use made of this information. MSCI, its affiliates and any third party involved in, or related to, computing or compiling the information hereby expressly disclaim all warranties of originality, accuracy, completeness, merchantability or fitness for a particular purpose with respect to any of this information. Without limiting any of the foregoing, in no event shall MSCI, any of its affiliates or any third party involved in, or related to, computing or compiling the information have any liability for any damages of any kind. MSCI, Morgan Stanley Capital International and the MSCI indexes are services marks of MSCI and its affiliates.
The Global Industry Classification Standard (GICS) was developed by and is the exclusive property of Morgan Stanley Capital International Inc. and Standard & Poor’s. GICS is a service mark of MSCI and S&P and has been licensed for use by Credit Suisse.
Important Credit Suisse HOLT Disclosures
With respect to the analysis in this report based on the Credit Suisse HOLT methodology, Credit Suisse certifies that (1) the views expressed in this report accurately reflect the Credit Suisse HOLT methodology and (2) no part of the Firm’s compensation was, is, or will be directly related to the specific views disclosed in this report.
The Credit Suisse HOLT methodology does not assign ratings to a security. It is an analytical tool that involves use of a set of proprietary quantitative algorithms and warranted value calculations, collectively called the Credit Suisse HOLT valuation model, that are consistently applied to all the companies included in its database. Third-party data (including consensus earnings estimates) are systematically translated into a number of default algorithms available in the Credit Suisse HOLT valuation model. The source financial statement, pricing, and earnings data provided by outside data vendors are subject to quality control and may also be adjusted to more closely measure the underlying economics of firm performance. The adjustments provide consistency when analyzing a single company across time, or analyzing multiple companies across industries or national borders. The default scenario that is produced by the Credit Suisse HOLT valuation model establishes the baseline valuation for a security, and a user then may adjust the default variables to produce alternative scenarios, any of which could occur.
Additional information about the Credit Suisse HOLT methodology is available on request.
The Credit Suisse HOLT methodology does not assign a price target to a security. The default scenario that is produced by the Credit Suisse HOLT valuation model establishes a warranted price for a security, and as the third-party data are updated, the warranted price may also change. The default variable may also be adjusted to produce alternative warranted prices, any of which could occur.
CFROI®, HOLT, HOLTfolio, ValueSearch, AggreGator, Signal Flag and “Powered by HOLT” are trademarks or service marks or registered trademarks or registered service marks of Credit Suisse or its affiliates in the United States and other countries. HOLT is a corporate performance and valuation advisory service of Credit Suisse.
For Credit Suisse disclosure information on other companies mentioned in this report, please visit the website at https://rave.credit-suisse.com/disclosures or call +1 (877) 291-2683.
08 July 2015
ESG: The Family Business Model 53
References in this report to Credit Suisse include all of the subsidiaries and affiliates of Credit Suisse operating under its investment banking division. For more information on our structure, please use the following link: https://www.credit-suisse.com/who_we_are/en/ This report may contain material that is not directed to, or intended for distribution to or use by, any person or entity who is a citizen or resident of or located in any locality, state, country or other jurisdiction where such distribution, publication, availability or use would be contrary to law or regulation or which would subject Credit Suisse AG or its affiliates ("CS") to any registration or licensing requirement within such jurisdiction. All material presented in this report, unless specifically indicated otherwise, is under copyright to CS. None of the material, nor its content, nor any copy of it, may be altered in any way, transmitted to, copied or distributed to any other party, without the prior express written permission of CS. All trademarks, service marks and logos used in this report are trademarks or service marks or registered trademarks or service marks of CS or its affiliates. The information, tools and material presented in this report are provided to you for information purposes only and are not to be used or considered as an offer or the solicitation of an offer to sell or to buy or subscribe for securities or other financial instruments. CS may not have taken any steps to ensure that the securities referred to in this report are suitable for any particular investor. CS will not treat recipients of this report as its customers by virtue of their receiving this report. The investments and services contained or referred to in this report may not be suitable for you and it is recommended that you consult an independent investment advisor if you are in doubt about such investments or investment services. Nothing in this report constitutes investment, legal, accounting or tax advice, or a representation that any investment or strategy is suitable or appropriate to your individual circumstances, or otherwise constitutes a personal recommendation to you. CS does not advise on the tax consequences of investments and you are advised to contact an independent tax adviser. Please note in particular that the bases and levels of taxation may change. Information and opinions presented in this report have been obtained or derived from sources believed by CS to be reliable, but CS makes no representation as to their accuracy or completeness. CS accepts no liability for loss arising from the use of the material presented in this report, except that this exclusion of liability does not apply to the extent that such liability arises under specific statutes or regulations applicable to CS. This report is not to be relied upon in substitution for the exercise of independent judgment. CS may have issued, and may in the future issue, other communications that are inconsistent with, and reach different conclusions from, the information presented in this report. Those communications reflect the different assumptions, views and analytical methods of the analysts who prepared them and CS is under no obligation to ensure that such other communications are brought to the attention of any recipient of this report. Some investments referred to in this report will be offered solely by a single entity and in the case of some investments solely by CS, or an associate of CS or CS may be the only market maker in such investments. Past performance should not be taken as an indication or guarantee of future performance, and no representation or warranty, express or implied, is made regarding future performance. Information, opinions and estimates contained in this report reflect a judgment at its original date of publication by CS and are subject to change without notice. The price, value of and income from any of the securities or financial instruments mentioned in this report can fall as well as rise. The value of securities and financial instruments is subject to exchange rate fluctuation that may have a positive or adverse effect on the price or income of such securities or financial instruments. Investors in securities such as ADR's, the values of which are influenced by currency volatility, effectively assume this risk. Structured securities are complex instruments, typically involve a high degree of risk and are intended for sale only to sophisticated investors who are capable of understanding and assuming the risks involved. The market value of any structured security may be affected by changes in economic, financial and political factors (including, but not limited to, spot and forward interest and exchange rates), time to maturity, market conditions and volatility, and the credit quality of any issuer or reference issuer. Any investor interested in purchasing a structured product should conduct their own investigation and analysis of the product and consult with their own professional advisers as to the risks involved in making such a purchase. Some investments discussed in this report may have a high level of volatility. High volatility investments may experience sudden and large falls in their value causing losses when that investment is realised. Those losses may equal your original investment. Indeed, in the case of some investments the potential losses may exceed the amount of initial investment and, in such circumstances, you may be required to pay more money to support those losses. Income yields from investments may fluctuate and, in consequence, initial capital paid to make the investment may be used as part of that income yield. Some investments may not be readily realisable and it may be difficult to sell or realise those investments, similarly it may prove difficult for you to obtain reliable information about the value, or risks, to which such an investment is exposed. This report may provide the addresses of, or contain hyperlinks to, websites. Except to the extent to which the report refers to website material of CS, CS has not reviewed any such site and takes no responsibility for the content contained therein. Such address or hyperlink (including addresses or hyperlinks to CS's own website material) is provided solely for your convenience and information and the content of any such website does not in any way form part of this document. Accessing such website or following such link through this report or CS's website shall be at your own risk. This report is issued and distributed in Europe (except Switzerland) by Credit Suisse Securities (Europe) Limited, One Cabot Square, London E14 4QJ, England, which is authorised by the Prudential Regulation Authority and regulated by the Financial Conduct Authority and the Prudential Regulation Authority. This report is being distributed in Germany by Credit Suisse Securities (Europe) Limited Niederlassung Frankfurt am Main regulated by the Bundesanstalt fuer Finanzdienstleistungsaufsicht ("BaFin"). This report is being distributed in the United States and Canada by Credit Suisse Securities (USA) LLC; in Switzerland by Credit Suisse AG; in Brazil by Banco de Investimentos Credit Suisse (Brasil) S.A or its affiliates; in Mexico by Banco Credit Suisse (México), S.A. (transactions related to the securities mentioned in this report will only be effected in compliance with applicable regulation); in Japan by Credit Suisse Securities (Japan) Limited, Financial Instruments Firm, Director-General of Kanto Local Finance Bureau (Kinsho) No. 66, a member of Japan Securities Dealers Association, The Financial Futures Association of Japan, Japan Investment Advisers Association, Type II Financial Instruments Firms Association; elsewhere in Asia/ Pacific by whichever of the following is the appropriately authorised entity in the relevant jurisdiction: Credit Suisse (Hong Kong) Limited, Credit Suisse Equities (Australia) Limited, Credit Suisse Securities (Thailand) Limited, regulated by the Office of the Securities and Exchange Commission, Thailand, having registered address at 990 Abdulrahim Place, 27th Floor, Unit 2701, Rama IV Road, Silom, Bangrak, Bangkok 10500, Thailand, Tel. +66 2614 6000, Credit Suisse Securities (Malaysia) Sdn Bhd, Credit Suisse AG, Singapore Branch, Credit Suisse Securities (India) Private Limited (CIN no. U67120MH1996PTC104392) regulated by the Securities and Exchange Board of India (registration Nos. INB230970637; INF230970637; INB010970631; INF010970631), having registered address at 9th Floor, Ceejay House, Dr.A.B. Road, Worli, Mumbai - 18, India, T- +91-22 6777 3777, Credit Suisse Securities (Europe) Limited, Seoul Branch, Credit Suisse AG, Taipei Securities Branch, PT Credit Suisse Securities Indonesia, Credit Suisse Securities (Philippines ) Inc., and elsewhere in the world by the relevant authorised affiliate of the above. Research on Taiwanese securities produced by Credit Suisse AG, Taipei Securities Branch has been prepared by a registered Senior Business Person. Research provided to residents of Malaysia is authorised by the Head of Research for Credit Suisse Securities (Malaysia) Sdn Bhd, to whom they should direct any queries on +603 2723 2020. This report has been prepared and issued for distribution in Singapore to institutional investors, accredited investors and expert investors (each as defined under the Financial Advisers Regulations) only, and is also distributed by Credit Suisse AG, Singapore branch to overseas investors (as defined under the Financial Advisers Regulations). By virtue of your status as an institutional investor, accredited investor, expert investor or overseas investor, Credit Suisse AG, Singapore branch is exempted from complying with certain compliance requirements under the Financial Advisers Act, Chapter 110 of Singapore (the "FAA"), the Financial Advisers Regulations and the relevant Notices and Guidelines issued thereunder, in respect of any financial advisory service which Credit Suisse AG, Singapore branch may provide to you. This information is being distributed by Credit Suisse AG, Dubai Branch, duly licensed and regulated by the Dubai Financial Services Authority (DFSA), and is directed at Professional Clients or Market Counterparties only, as defined by the DFSA. The financial products or financial services to which the information relates will only be made available to a client who meets the regulatory criteria to be a Professional Client or Market Counterparty only, as defined by the DFSA, and is not intended for any other person. This research may not conform to Canadian disclosure requirements. In jurisdictions where CS is not already registered or licensed to trade in securities, transactions will only be effected in accordance with applicable securities legislation, which will vary from jurisdiction to jurisdiction and may require that the trade be made in accordance with applicable exemptions from registration or licensing requirements. Non-U.S. customers wishing to effect a transaction should contact a CS entity in their local jurisdiction unless governing law permits otherwise. U.S. customers wishing to effect a transaction should do so only by contacting a representative at Credit Suisse Securities (USA) LLC in the U.S. Please note that this research was originally prepared and issued by CS for distribution to their market professional and institutional investor customers. Recipients who are not market professional or institutional investor customers of CS should seek the advice of their independent financial advisor prior to taking any investment decision based on this report or for any necessary explanation of its contents. This research may relate to investments or services of a person outside of the UK or to other matters which are not authorised by the Prudential Regulation Authority and regulated by the Financial Conduct Authority and the Prudential Regulation Authority or in respect of which the protections of the Prudential Regulation Authority and Financial Conduct Authority for private customers and/or the UK compensation scheme may not be available, and further details as to where this may be the case are available upon request in respect of this report. CS may provide various services to US municipal entities or obligated persons ("municipalities"), including suggesting individual transactions or trades and entering into such transactions. Any services CS provides to municipalities are not viewed as "advice" within the meaning of Section 975 of the Dodd-Frank Wall Street Reform and Consumer Protection Act. CS is providing any such services and related information solely on an arm's length basis and not as an advisor or fiduciary to the municipality. In connection with the provision of the any such services, there is no agreement, direct or indirect, between any municipality (including the officials, management, employees or agents thereof) and CS for CS to provide advice to the municipality. Municipalities should consult with their financial, accounting and legal advisors regarding any such services provided by CS. In addition, CS is not acting for direct or indirect compensation to solicit the municipality on behalf of an unaffiliated broker, dealer, municipal securities dealer, municipal advisor, or investment adviser for the purpose of obtaining or retaining an engagement by the municipality for or in connection with Municipal Financial Products, the issuance of municipal securities, or of an investment adviser to provide investment advisory services to or on behalf of the municipality. If this report is being distributed by a financial institution other than Credit Suisse AG, or its affiliates, that financial institution is solely responsible for distribution. Clients of that institution should contact that institution to effect a transaction in the securities mentioned in this report or require further information. This report does not constitute investment advice by Credit Suisse to the clients of the distributing financial institution, and neither Credit Suisse AG, its affiliates, and their respective officers, directors and employees accept any liability whatsoever for any direct or consequential loss arising from their use of this report or its content. Principal is not guaranteed. Commission is the commission rate or the amount agreed with a customer when setting up an account or at any time after that.
Copyright © 2015 CREDIT SUISSE AG and/or its affiliates. All rights reserved.
Investment principal on bonds can be eroded depending on sale price or market price. In addition, there are bonds on which investment principal can be eroded due to changes in redemption amounts. Care is required when investing in such instruments. When you purchase non-listed Japanese fixed income securities (Japanese government bonds, Japanese municipal bonds, Japanese government guaranteed bonds, Japanese corporate bonds) from CS as a seller, you will be requested to pay the purchase price only.
XX6597EU.doc