esd.342 basic network metrics and operations lecture 6 · basic network metrics and operations ......
TRANSCRIPT

Basic Network Metrics and Operations
• Meshness ratio • Degree correlation
– Joint degree distribution – K-nearest neighbors – Pearson degree correlation
• Rich club metric • Degree-preserving rewiring • Generating a graph that has a specified degree sequence• Finding Pearson degree correlation • Finding communities
2/16/2011 Basic Network Metrics © Daniel E Whitney 1997-2010 1/45

Meshness Ratio
• Exploits Euler’s formula for planar graphs • Is applied to non-planar graphs as well, not used
enough for a basis for comparison to have built up yet
• Meshness = number of closed faces = m-n+2 • Max meshness = 2n-4 • Ratio = (m-n+2)/(2n-4) • This varies between zero and 1 • “Meshy” networks seem to have mr ~ 0.3 but
these are usually almost planar, such as metro systems
2/16/2011 Basic Network Metrics © Daniel E Whitney 1997-2010 2/45

Meshness Ratio of Metro Systems
Meshness Ratio of 21 Metro Systems
y = 4.0214x + 1.8735 R2 = 0.9508
1.8
2
2.2
2.4
2.6
2.8
3
3.2
3.4
3.6
3.8
4
0 0.1 0.2 0.3 0.4 0.5
Meshness Ratio
<k> Linear (<k>)
London Beijing
Nagoya Mexico City
Madrid
< k >= 4 M + 2
2/16/2011 Basic Network Metrics © Daniel E Whitney 1997-2010 3/45

Meshness of Random Networks
2/16/2011 Basic Network Metrics © Daniel E Whitney 1997-2010 4/45

CAIDA Paper on Internet Structure
• Nice review and comparison of many metrics • Follows up early 2000s papers purporting to find the
structure of the internet • Shows that there are three ways to do this, each
approximate, using different methods, each with a bias • Shows that each way gives different results, providing
caution about artifacts inherent in data collection • Joint Degree Distribution (JDD) seems to be the best
metric
2/16/2011 Basic Network Metrics © Daniel E Whitney 1997-2010 5/45
Degree Correlation r
• This is a subset of “homophily” meaning the extent to which nodes are alike
• Degree correlation is measured using the Pearson correlation function
• Also called “assortativity” and “disassortativity” in social network analysis
• r is positive if nodes of similar degree are linked assortative (not the same as big to big)
• r is negative if nodes of dissimilar degree are linked disassortative (not the same as big to small)
• Bigger magnitude of r indicates higher tendency for the specified linkage
2/16/2011 Basic Network Metrics © Daniel E Whitney 1997-2010 6/45

1
2
3 4
5
# x y 1 2 3 1 2 2 2 3 1 2 3 2 2 3 2 3 1 3 4 2 3 4 2 3
r = x − x( ) y − y( )∑
x − x( )2 ∑ y − y( )2∑
Calculating r
5 2 25 2 2
x = 2.2 y = 2.2 r = -0.676752968 using Pearson function in Excel
Note: if all nodes have the same k then r = 0/0
2/16/2011 Basic Network Metrics © Daniel E Whitney 1997-2010 7/45

Calculating x-bar sum of column values x =
number of column values node x y each node of degree k creates k rows with k in each row
1 2 31 2 2 number of rows = sum of entries in kvec(A) = sum(ki )2 3 1 2 3 2 2 3 2 3 1 3 4 2 3 4 2 3 5 2 2 5 2 2
average 2.2 pearson -0.676753
x = 2.2
y = 2.2
kvec(A) = 2 3 1 2 2 sum(kvec(A)) = 10
sum of the k row entries for each k = k * k = k 2
sum of all such row entries = sum(ki 2) = 22
2 2∑ki n 1 ∑
n
ki < k 2 >x = i = i=1 = = 2.2n∑ki 1 ∑ki < k >
i n i=1
< k >2
x ≥ =< k > so x is a measure of the variation in k < k >
2/16/2011 Basic Network Metrics © Daniel E Whitney 1997-2010 8/45

Matlab for Pearson (symmetric)∑(x − x)(y − y)
r = ∑(x − x)2 ∑ (y − y)2
Look at numerator, ignore xbar for the moment
' '∑(xiy j )= xiδij y j = x Ax
δij = 1 if i links to j δij = 0 if i does not link to j
Essentially the calculation is a quadratic form. Pearsondir does the calculation for asymmetric networks
2/16/2011 Basic Network Metrics © Daniel E Whitney 1997-2010 9/45

Matlab Implementation
function prs = pearson(A)%calculates pearson degree correlation of A[rows,colms]=size(A);won=ones(rows,1);k=won'*A;ksum=won'*k';ksqsum=k*k';xbar=ksqsum/ksum;num=(k-won'*xbar)*A*(k'-xbar*won);kkk=(k'-xbar*won).*(k'.^.5);denom=kkk'*kkk;prs=num/denom;
2/16/2011 Basic Network Metrics © Daniel E Whitney 1997-2010 10/45

K-nearest neighbors and Joint Degree Distribution
• These seek similar info to Pearson but are more general than Pearson, which condenses all the info into a single number
• knn plots the average degree of neighbors of nodes that have degree k – Rising knn indicates positive degree correlation – Falling knn indicates negative degree correlation
• JDD1 plots cross-correlation of degree of each node with every other neighboring node – Shape of plot indicates sense of degree correlation
2/16/2011 Basic Network Metrics © Daniel E Whitney 1997-2010 11/45

Network for V-8 Engine
2/16/2011 Basic Network Metrics © Daniel E Whitney 1997-2010 12/45

Degree Distribution for V8 Engine
2/16/2011 Basic Network Metrics © Daniel E Whitney 1997-2010 13/45

K Nearest Neighbors for V8
Missing marks indicate that there are no nodes with that degree
2/16/2011 Basic Network Metrics © Daniel E Whitney 1997-2010 14/45

Joint Degree Distribution for V8
2/16/2011 Basic Network Metrics © Daniel E Whitney 1997-2010 15/45

Degree Sequence of Random Network: <k> = 6
2/16/2011 Basic Network Metrics © Daniel E Whitney 1997-2010 16/45

Basic Network Metrics © Daniel E Whitney 1997-2010
Knn for Random = z + 1
2/16/2011 17/45
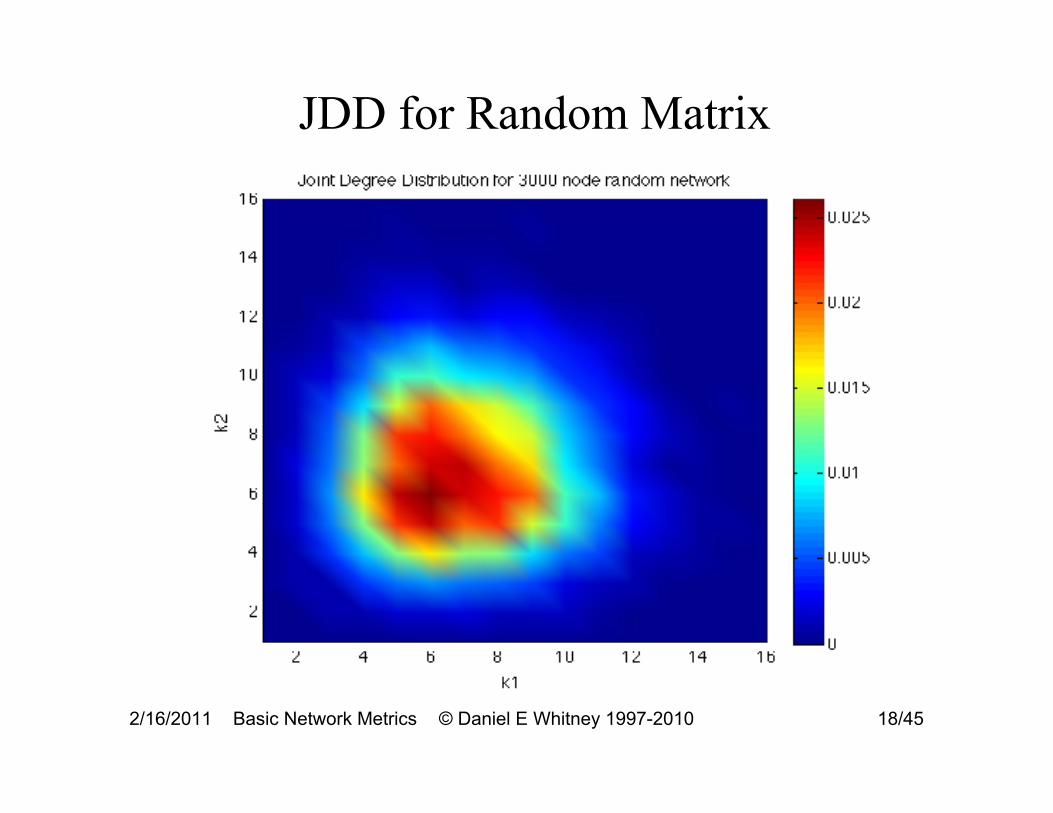
JDD for Random Matrix
2/16/2011 Basic Network Metrics © Daniel E Whitney 1997-2010 18/45

Rewiring
• A way to deliberately transform a graph • Several ways this is done
– Unhooking one end of an edge and hooking it in somewhere else
– Adding a new edge – Pairwise rewiring that preserves the original
degree sequence • This can disconnect the graph unless you take care
to reject rewirings that do so
2/16/2011 Basic Network Metrics © Daniel E Whitney 1997-2010 19/45

Rewiring - 2
Preserving degree
Unhook-rehook links
Add links
2/16/2011 Basic Network Metrics © Daniel E Whitney 1997-2010 20/45

Degree-preserving Pair-wise Rewiring
• Picks two pairs of nodes at random and swaps their links so that each node retains its nodal degree
• Usually used to randomize a network – Rewire at random, a lot
• Can also be used to change a network’s degree correlation or clustering coefficient – Rewire but accept only those results that drive r or c in
the desired direction – Each network has a max and min r that are different
from ±1 (papers by Whitney and Alderson, and Li and Alderson)
• Note that this process does not necessarily preserve connectedness, so if this is important, check beforeaccepting each rewiring
2/16/2011 Basic Network Metrics © Daniel E Whitney 1997-2010 21/45

Degree-preserving Rewiring Routines
• Maslov-Sneppen routines (the original) • rgrow, rshrink, cgrow seek to modify the network via
directed rewiring to have a different degree correlation or clustering coefficient while preserving the degree sequence and connectedness – cgrow is really slow! Use Volz’ routine
• rgrowd (does not bother to check for connectedness) • rgrowdgoal (grows r to a desired value called goal, ignores
connectedness) • You can easily write your own to do what you want 2/16/2011 Basic Network Metrics © Daniel E Whitney 1997-2010 22/45

Rewired V8 Engine
Maslov-Sneppen randomizing Volz clust reduction
2/16/2011 Basic Network Metrics © Daniel E Whitney 1997-2010 23/45
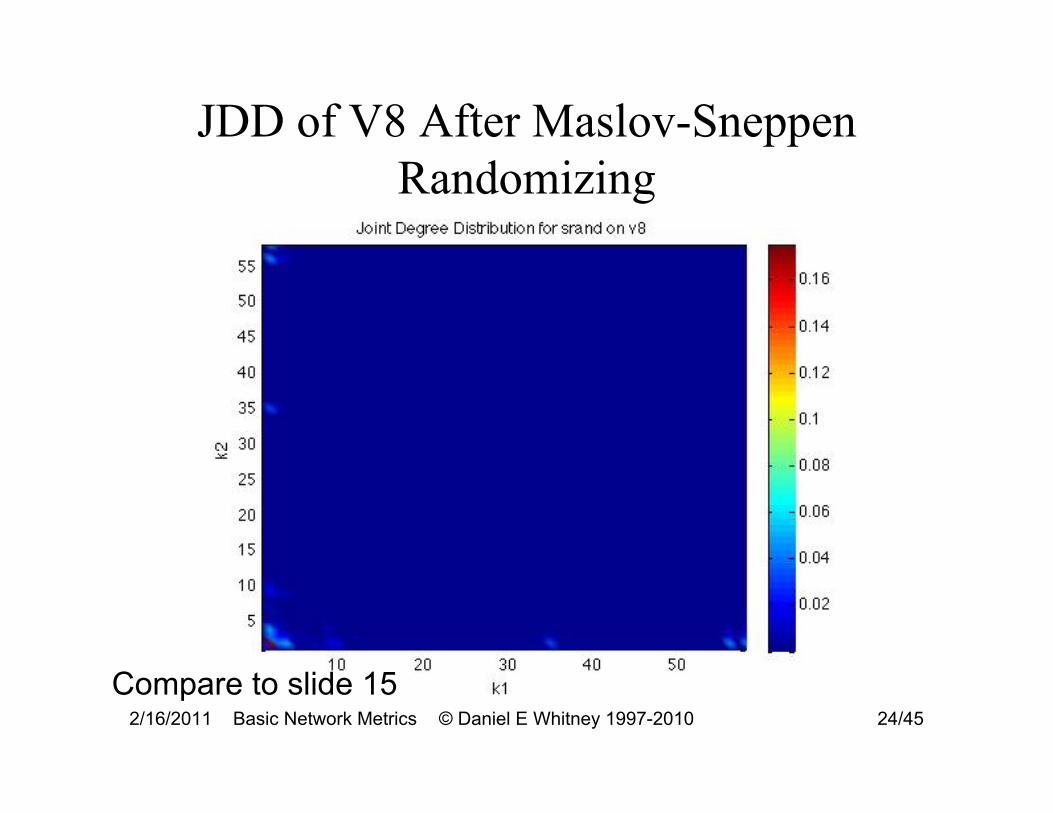
JDD of V8 After Maslov-Sneppen Randomizing
Compare to slide 15 2/16/2011 Basic Network Metrics © Daniel E Whitney 1997-2010 24/45

Finding Communities
• Big topic in social network analysis • Many algorithms exist, based on different principles,
several in UCINET • Recent one based on network flow by Newman and
Girvan: M. E. J. Newman and M. Girvan, Phys. Rev. E 69, 026113 (2004).
• Uses the idea of edge betweenness • Implementation by ESD PhD student Mo-Han Hsieh
seems to be more accurate than the implementation in UCINET
2/16/2011 Basic Network Metrics © Daniel E Whitney 1997-2010 25/45

Recursive Removal of Highest Betweenness Edge Generates Communities
1 2 3
4 5
2/16/2011 Basic Network Metrics © Daniel E Whitney 1997-2010 26/45

NewmanGirvan.m% This program conducts Newman-Girvan algorithm. Written by Mo-Han Hsieh.% The input is, A, the adjacency matrix, represented by its edgelist in the file TEST.txt.% 'Directed' controls whether or not A is directed a network.% For directed network: Directed=1; for non-directed network: Directed=0% TarGroupNum is the # of desired communities.% If TarGroupNum>0, the program will stop at the desired # of communities.% Output: QRecord2, dendrogramRecord, and MarkCut% QRecord2: [mainNum, singletonNum, Q], where mainNum is the # of% components that have at least two nodes as members, SingletonNum is the #% of singletons, and Q is the Q defined by Newman-Girvan.% dendrogramRecord: First row is mainNum, second row is singletonNum, and% the third row is Q, and the rest rows is the partition of nodes (the same% format as specified in UCINET).
A1=load('TEST.txt');outputFileName1='Q_resultTEST';outputFileName2='dendrogramTEST';outputFileName3='CutSequenceTEST';
m=max(max(A1(:,1:2)));% This code builds the adjacency matrix from the edgelist in TEST.txt% You can change the code to read A directly and omit reading TEST.txtA=zeros(m,m);for i=1:size(A1,1)
A(A1(i,1),A1(i,2))=1;end
Directed=1;TarGroupNum=0;
2/16/2011 Basic Network Metrics © Daniel E Whitney 1997-2010 27/45

Input file TEST.txt
1>> type TEST.txt
1 2
4
21 3 61 41 52 12 3 5 33 13 24 14 65 15 66 46 5
2/16/2011 Basic Network Metrics © Daniel E Whitney 1997-2010 28/45

Example Using TEST.txtContents of output file dendorgamTEST
0.0000000e+00 1.0000000e+00 2.0000000e+00 Q is based on density of6.0000000e+00 3.0000000e+00 0.0000000e+00
-1.8367347e-01 4.0816327e-02 2.0408163e-01 Links inside groups compared1.0000000e+00 1.0000000e+00 1.0000000e+002.0000000e+00 1.0000000e+00 1.0000000e+00 To links between groups3.0000000e+00 1.0000000e+00 1.0000000e+004.0000000e+00 2.0000000e+00 2.0000000e+005.0000000e+00 3.0000000e+00 2.0000000e+006.0000000e+00 4.0000000e+00 2.0000000e+00
There are three candidate partitions of the network, each listed in a column. Reading the first two rows together, one column at a time, we see that the first partition has no main component (zero in row 1) and instead consists of 6 isolated nodes (6 in row 2). The second has one main component and three isolates, while the third has two main components and no isolates. The third row gives Q for each of these, and this is maximum for the third column. The remaining rows contain the community numbers for the 6 respective nodes, in a format suitable for use in UCINET if you want to use Netdraw to draw the network and color the communities. In column 1 we see that each node is in its own community, numbered 1 - 6. In the second column we see that nodes 1 - 3 are in community 1 while 4 - 6 are isolates in communities 2 - 4 respectively. In column 3 we see that nodes 1 - 3 are in community 1 while nodes 4 - 6 are in community 2.
1 1 1
4
2
4
2
4
26 6 6
3 5 35 3 5
Q = -0.18367 Q = 0.04081 Q = 0.20408
2/16/2011 Basic Network Metrics © Daniel E Whitney 1997-2010 29/45

Rich Club Metric• Measures the extent to which the high degree nodes link to
each other • A subset of Pearson degree correlation since it focuses on
the high degree nodes • Large RCM indicates that high degree nodes link to each
other • Small RCM indicates that they do not • Base case is a random network with the same degree
sequence - ignoring this leads to erroneous conclusions except if the most random equivalent is correlated
• Networks with high RCM can still have r < 0 • Ref: paper by Colizza, et al
“Detecting rich-club ordering in complex Networks,” V. COLIZZA, A. FLAMMINI, M. A. SERRANO AND A. VESPIGNANI* Nature Physics 15 January 2006; doi:10.1038/nphys209
2/16/2011 Basic Network Metrics © Daniel E Whitney 1997-2010 30/45

Generating a Graph with a Specified Degree Sequence
• Not any string of numbers qualifies as a degree sequence of a network that is simple and connected – Simple: no self-loops, no multiple links between nodes
• Erdos-Gallai theorem tests if a degree sequence is “graphic” (routine isgraphic.m)
• Generating the graph is fraught and often ends up incomplete or disconnected, or else it has some self-loops and multiple edges between nodes
2/16/2011 Basic Network Metrics © Daniel E Whitney 1997-2010 31/45
2/16/2011 Basic Network Metrics © Daniel E Whitney 1997-2010 32/45
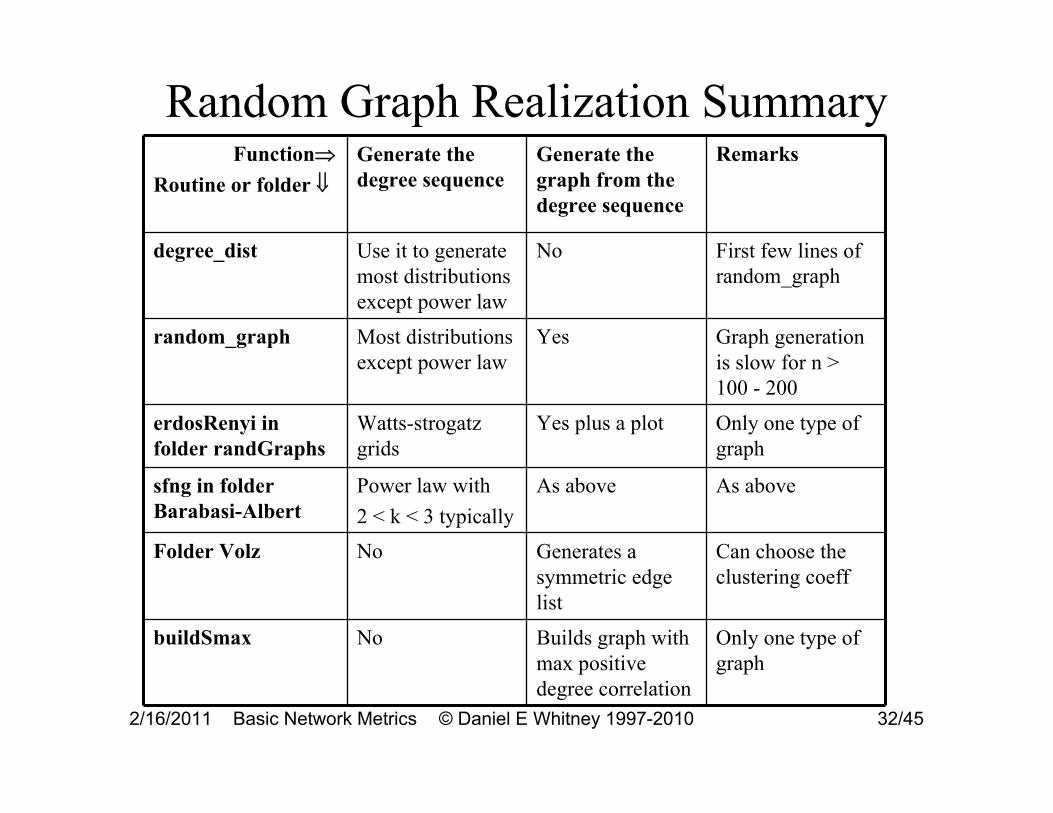
Random Graph Realization SummaryFunction⇒
Routine or folder ⇓
Generate the degree sequence
Generate the graph from the degree sequence
Remarks
degree_dist Use it to generate most distributions except power law
No First few lines of random_graph
random_graph Most distributions except power law
Yes Graph generation is slow for n > 100 - 200
erdosRenyi in folder randGraphs
Watts-strogatz grids
Yes plus a plot Only one type of graph
sfng in folder Barabasi-Albert
Power law with 2 < k < 3 typically
As above As above
Folder Volz No Generates a symmetric edge list
Can choose the clustering coeff
buildSmax No Builds graph with max positive degree correlation
Only one type of graph

Random (Poisson) Networks
• randmatrix(n, p); • Since p=z/n, you can write randmatrix(n, z/n); • This generates the adjacency matrix for a random
network of n nodes having probability p of a link between any pair of nodes chosen at random
• The degree distribution is poisson with average=z, clustering coefficient ~ p and r ~ 0
• Original theory due to Erdös and Renyi so these are often called ER random graphs
2/16/2011 Basic Network Metrics © Daniel E Whitney 1997-2010 33/45

random_graph.m % Random graph construction routine with various models % Gergana Bounova, October 31, 2005
function [adj] = random_graph(N,p,E,distribution,fun,degrees)
% INPUTS: % N - number of nodes % p - probability, 0<=p<=1 % E - fixed number of edges % distribution - probability distribution: use the % "connecting-stubs model" % generation model % choices are uniform, normal, binomial, exponential,geometric % set parameters by modifying the code % fun - customized pdf function, used only if distribution = % 'custom' % degrees - particular degree sequence, used only if distribution = % 'sequence'
% OUTPUTS: adj - adjacency matrix of generated graph (symmetric) % Only the first argument is needed, but if any number of arguments is % provided, all up to that number must be provided, even though % only N and the kind of distribution would be used. Others, like E, % will be ignored
2/16/2011 Basic Network Metrics © Daniel E Whitney 1997-2010 34/45
Courtesy of Gergana Bounova. Used with permission.

degree_dist.m
function [Nseq] = degree_dist(N,p,distribution) % Random graph degree sequence construction routine with various models % Gergana Bounova, October 31, 2005, modified by Whitney 1-8-08 % INPUTS: % N - number of nodes % p - probability, 0<=p<=1 % distribution - probability distribution name, used below % choices are ‘uniform’, ‘binomial’, ‘normal’, ‘exponential’ % change parameters in the code below to get mean, variance, etc
% OUTPUTS: NSeq - degree sequence drawn from the specified distribution
2/16/2011 Basic Network Metrics © Daniel E Whitney 1997-2010 35/45
Courtesy of Gergana Bounova. Used with permission.

Example Calls to random_graph
random_graph(10)random_graph(10,0.1,20)random_graph(10,0,0,'normal')random_graph(10,0,0,'custom',@mypdf)degs = [3 1 1 1];random_graph(10,0,0,'custom',@mypdf,degs)
2/16/2011 Basic Network Metrics © Daniel E Whitney 1997-2010 36/45

Volz’ Algorithm
• Originally intended to generate a graph with specified degree sequence and specified clustering
• Getting the right clustering is difficult • Volz’ method is fast and can be used to generate a graph
with any degree sequence and zero clustering • It is in Java and must be executed from the operating
system • But the Matlab command window is an operating system
shell if you use “!” to start the command
2/16/2011 Basic Network Metrics © Daniel E Whitney 1997-2010 37/45

Script for Volz Routine % network_generator_script% script to generate random networks with given degree sequence% Java executable RandomClusteringNetwork.jar must be in your matlab% directoryN=100 p=0.1 PHYSICAL REVIEW E 70, 056115 (2004)
E=10 distribution='normal' Random networks with tunable degree distribution and clustering
fun=1 Erik Volz
degrees=1 Cornell University, Ithaca, New York 14853, USA
stop=1 (Received 4 June 2004; published 17 November 2004)
Nseq = degree_dist(N,p,E,distribution,fun,degrees,stop);Nseqabs=abs(Nseq); %protect against negative valuesNseqint=int16(Nseqabs); %Volz routine requires integers
dlmwrite('degdist.txt',Nseqint,'\t') %Volz routine requires tab delimited input!java -jar RandomClusteringNetwork.jar degdist.txt 100 .001 output.txt % n = 100, desired clust =% if you use 0.0 for desired clust the program will crash! outputedges=dlmread('output.txt'); %Volz routine generates a symmetric edge listoutputadj=adjbuilde(outputedges);kvoutputadj=kvec(outputadj);khatoutputadj=khat(outputadj)sigmaoutputadj=stdev(kvoutputadj)
2/16/2011 Basic Network Metrics © Daniel E Whitney 1997-2010 38/45

erdosRenyi.m
• Actually this routine makes a Watts-Strogatz random graph, not a Poisson (ER) random graph
• It starts from a ring mesh where k = Kreg at each node (only even values of k should be used)
• With probability p it unhooks one end of a link and puts it down on another node
• This is not the same p as in randmatrix • This kind of rewiring preserves the networks’ z
but does not preserve the degree sequence
2/16/2011 Basic Network Metrics © Daniel E Whitney 1997-2010 39/45
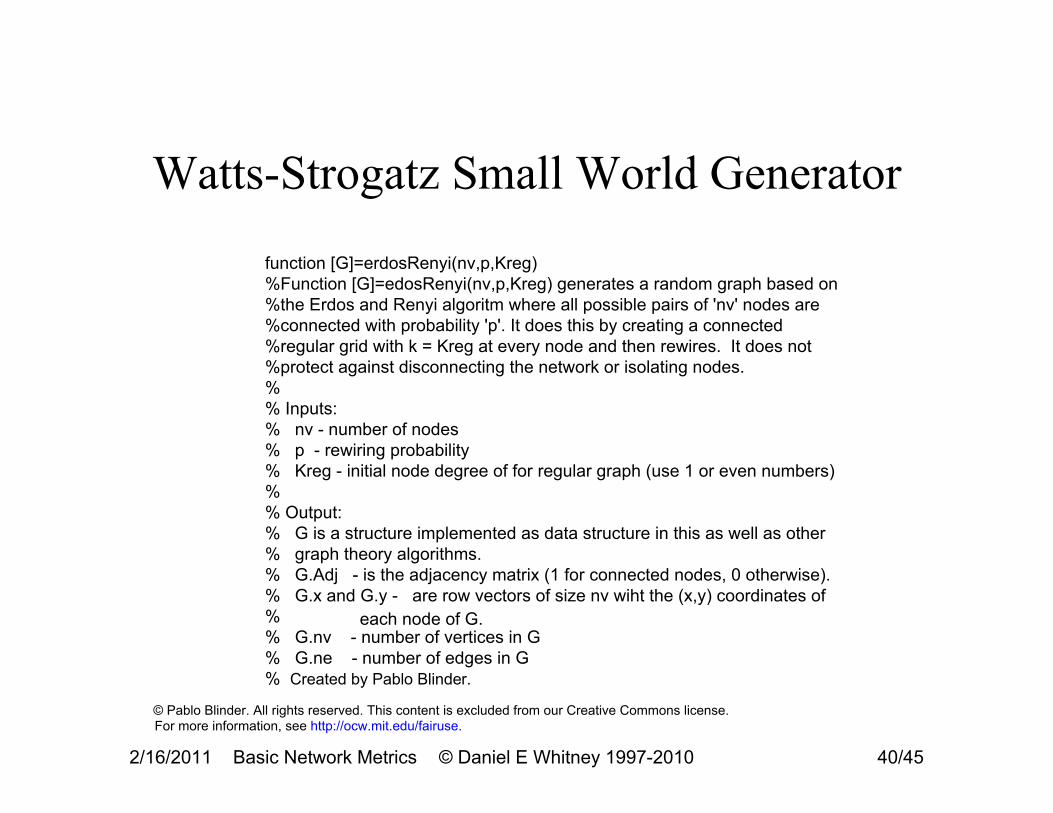
Watts-Strogatz Small World Generator
function [G]=erdosRenyi(nv,p,Kreg) %Function [G]=edosRenyi(nv,p,Kreg) generates a random graph based on %the Erdos and Renyi algoritm where all possible pairs of 'nv' nodes are %connected with probability 'p'. It does this by creating a connected %regular grid with k = Kreg at every node and then rewires. It does not %protect against disconnecting the network or isolating nodes. % % Inputs: % nv - number of nodes % p - rewiring probability % Kreg - initial node degree of for regular graph (use 1 or even numbers) % % Output: % G is a structure implemented as data structure in this as well as other % graph theory algorithms. % G.Adj - is the adjacency matrix (1 for connected nodes, 0 otherwise). % G.x and G.y - are row vectors of size nv wiht the (x,y) coordinates of % each node of G. % G.nv - number of vertices in G % G.ne - number of edges in G % Created by Pablo Blinder.
2/16/2011 Basic Network Metrics © Daniel E Whitney 1997-2010 40/45
© Pablo Blinder. All rights reserved. This content is excluded from our Creative Commons license.For more information, see http://ocw.mit.edu/fairuse.

Watts-Strogatz Examples Using erdosRenyi Code, n = 200, Kreg = 4
p = 0 p = 0.05
p = 0.15 p = 0.352/16/2011 Basic Network Metrics © Daniel E Whitney 1997-2010 41/45

Watts-Strogatz Model
< >= n =
n 2z 2 < k >
when p ~ 0 C =
3(z /2 −1) 2(z −1)
(1− p)3
2/16/2011 Basic Network Metrics © Daniel E Whitney 1997-2010 42/45
Collective Dynamics of 'Small-World' Networks
Regular Small-world Random
Image by MIT OpenCourseWare.
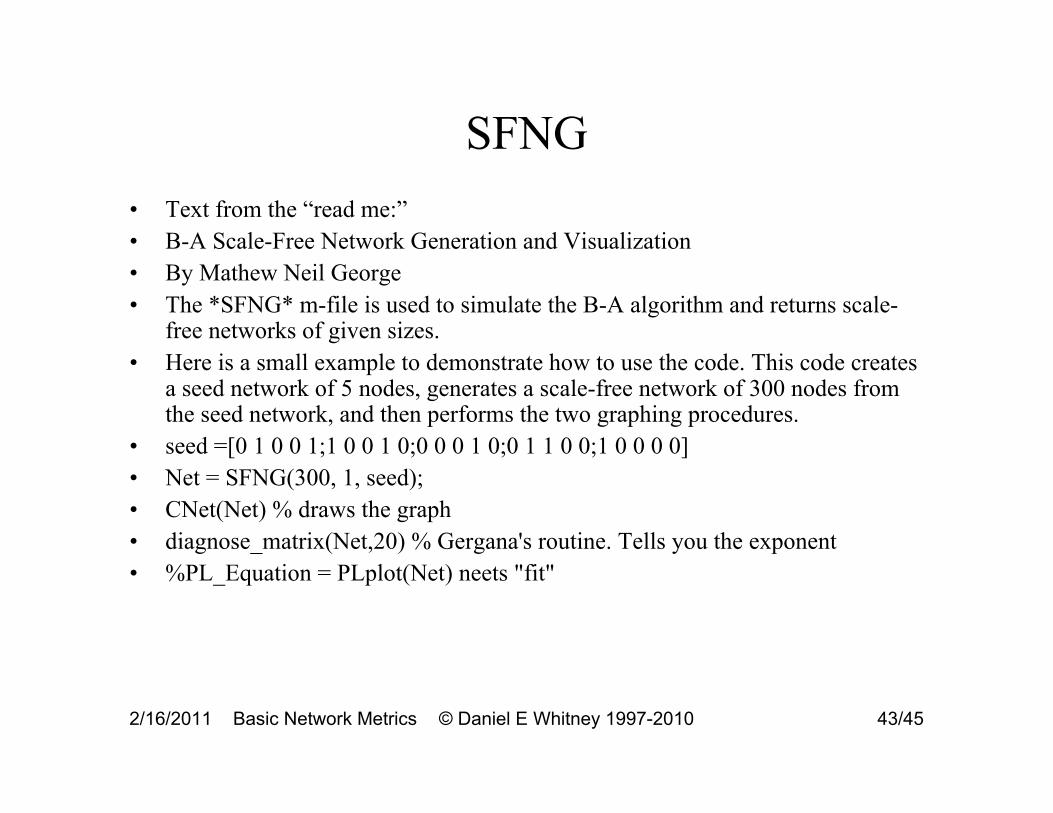
SFNG
• Text from the “read me:” • B-A Scale-Free Network Generation and Visualization • By Mathew Neil George • The *SFNG* m-file is used to simulate the B-A algorithm and returns scale-
free networks of given sizes. • Here is a small example to demonstrate how to use the code. This code creates
a seed network of 5 nodes, generates a scale-free network of 300 nodes from the seed network, and then performs the two graphing procedures.
• seed =[0 1 0 0 1;1 0 0 1 0;0 0 0 1 0;0 1 1 0 0;1 0 0 0 0] • Net = SFNG(300, 1, seed); • CNet(Net) % draws the graph • diagnose_matrix(Net,20) % Gergana's routine. Tells you the exponent • %PL_Equation = PLplot(Net) neets "fit"
2/16/2011 Basic Network Metrics © Daniel E Whitney 1997-2010 43/45
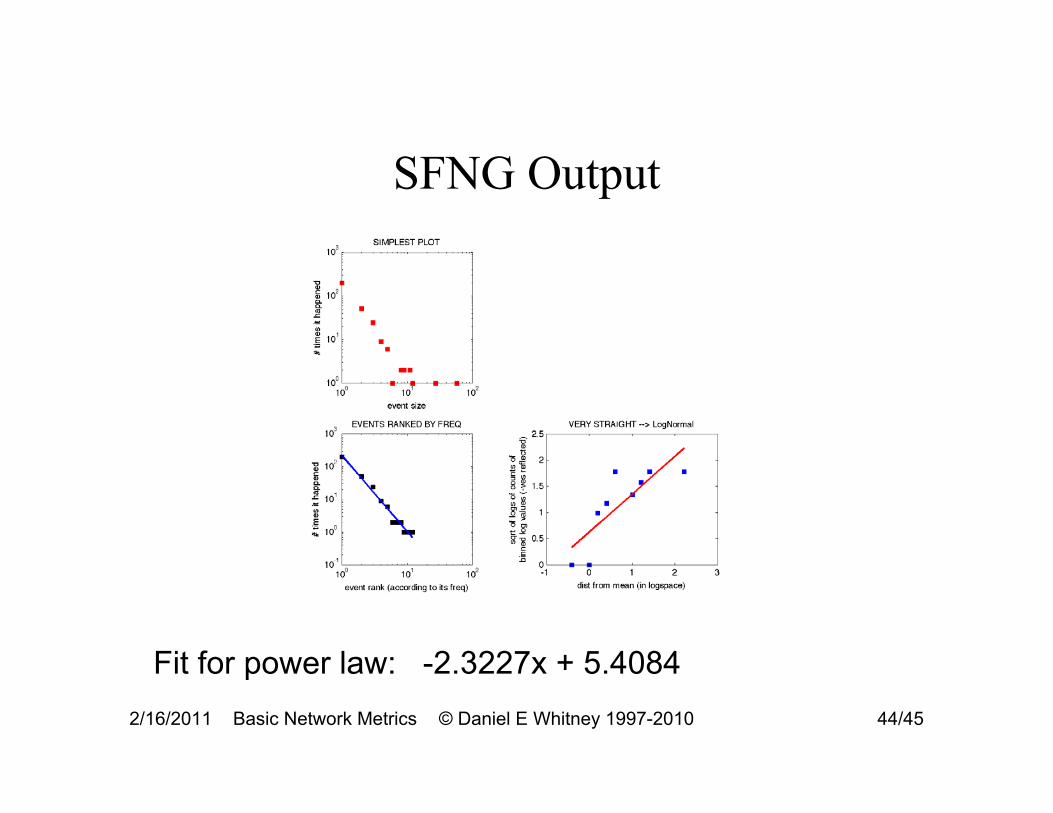
SFNG Output
Fit for power law: -2.3227x + 5.4084 2/16/2011 Basic Network Metrics © Daniel E Whitney 1997-2010 44/45

MIT OpenCourseWarehttp://ocw.mit.edu
ESD.342 Network Representations of Complex Engineering Systems Spring 2010
For information about citing these materials or our Terms of Use, visit: http://ocw.mit.edu/terms.