escience: techniques and technologies for 21st century
TRANSCRIPT
eScience: Techniques and Technologies for 21st Century Discovery
Ed Lazowska
Bill & Melinda Gates Chair inComputer Science & Engineering
University of Washington
WICHE Commission Meeting
May 2009
http://lazowska.cs.washington.edu/wiche.pdf
This morning
The nature of eScience The advances that enable it Scalable computing for everyone Networking in the West, and the broadband stimulus Computer science & engineering: Changing the world The changing nature of our economy, and of
educational requirements

eScience: Sensor-driven (data-driven) science and engineering
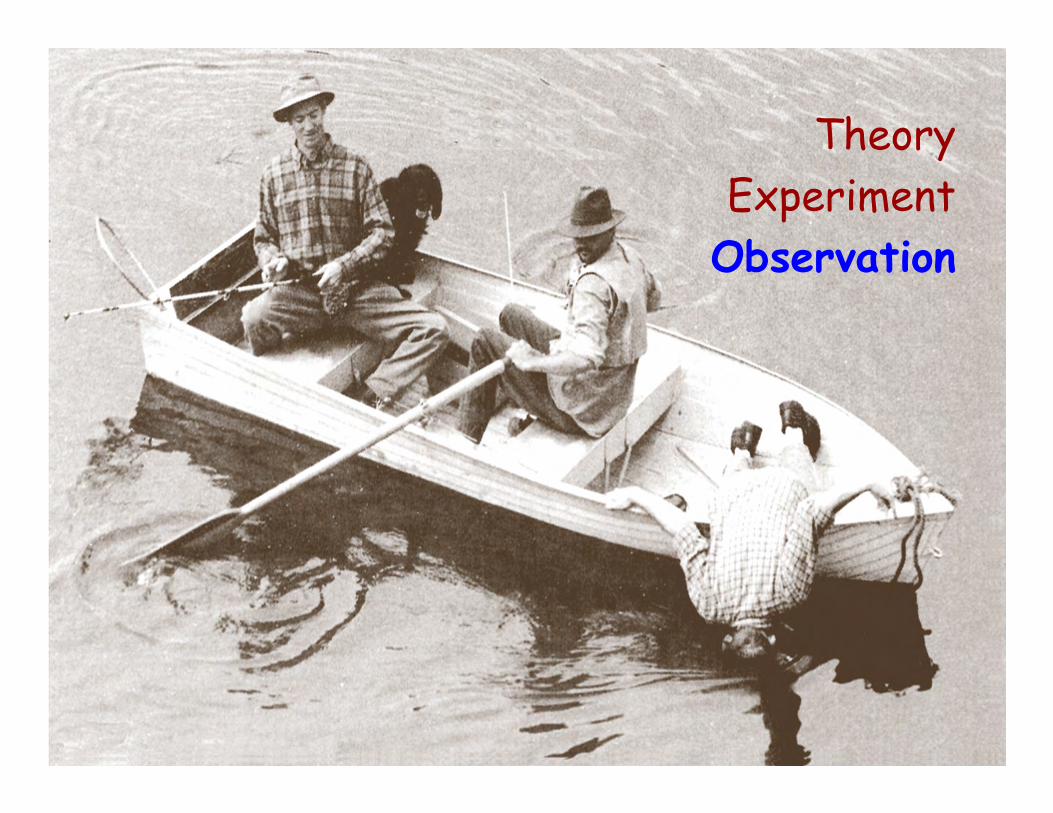
Transforming science (again!)

TheoryExperiment
Observation

TheoryExperiment
Observation
TheoryExperimentObservation

TheoryExperiment
ObservationComputational
Science

Protein interactions in striated muscles
Tom Daniel lab

QCD to study interactions of
nuclei
David Kaplan lab
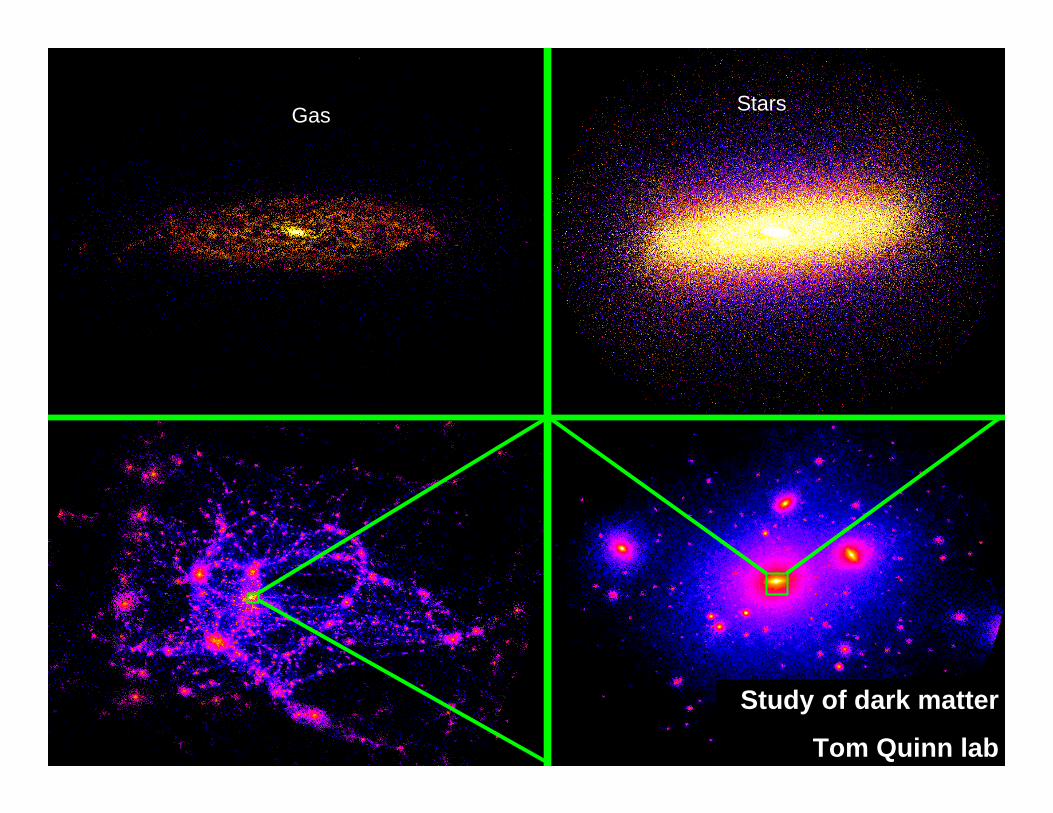
Gas Stars
Dark MatterStudy of dark matter
Tom Quinn lab

Protein structure prediction
David Baker lab
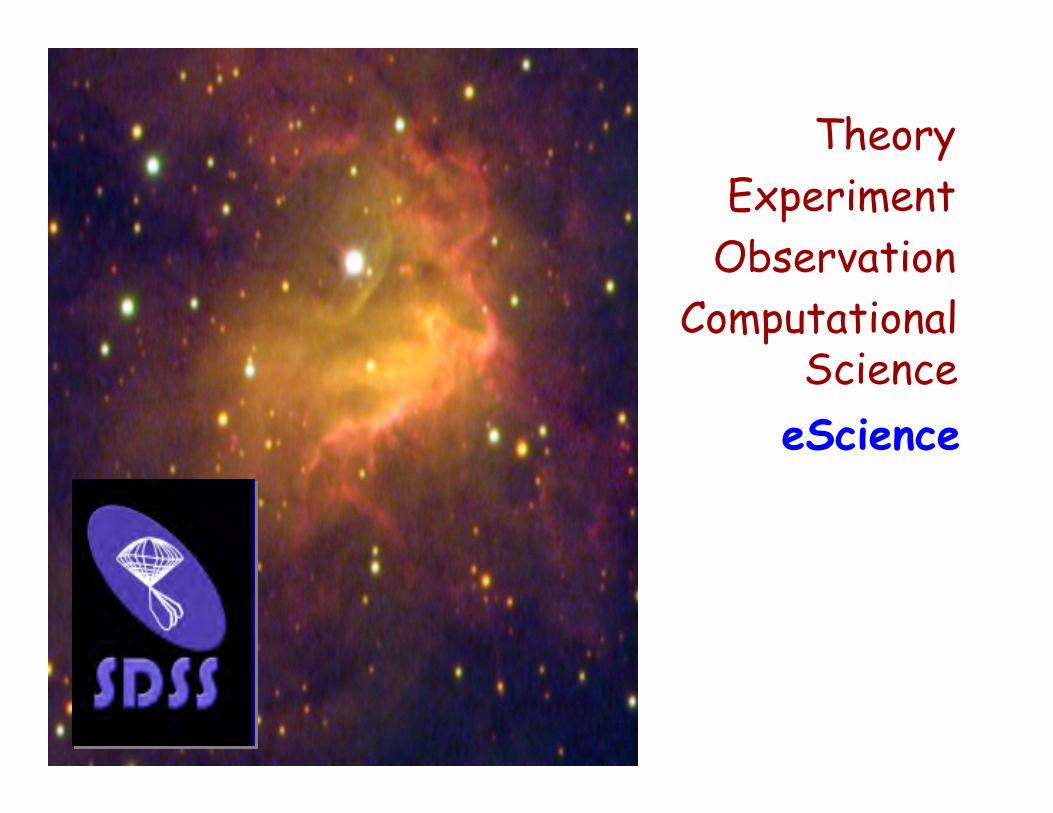
TheoryExperiment
ObservationComputational
ScienceeScience

eScience is driven by data
Massive volumes of data from sensors and networks of sensors
Apache Point telescope, SDSS
15TB of data (15,000,000,000,000 bytes)

Large Synoptic Survey Telescope (LSST)
30TB/day,60PB in its 10-year
lifetime
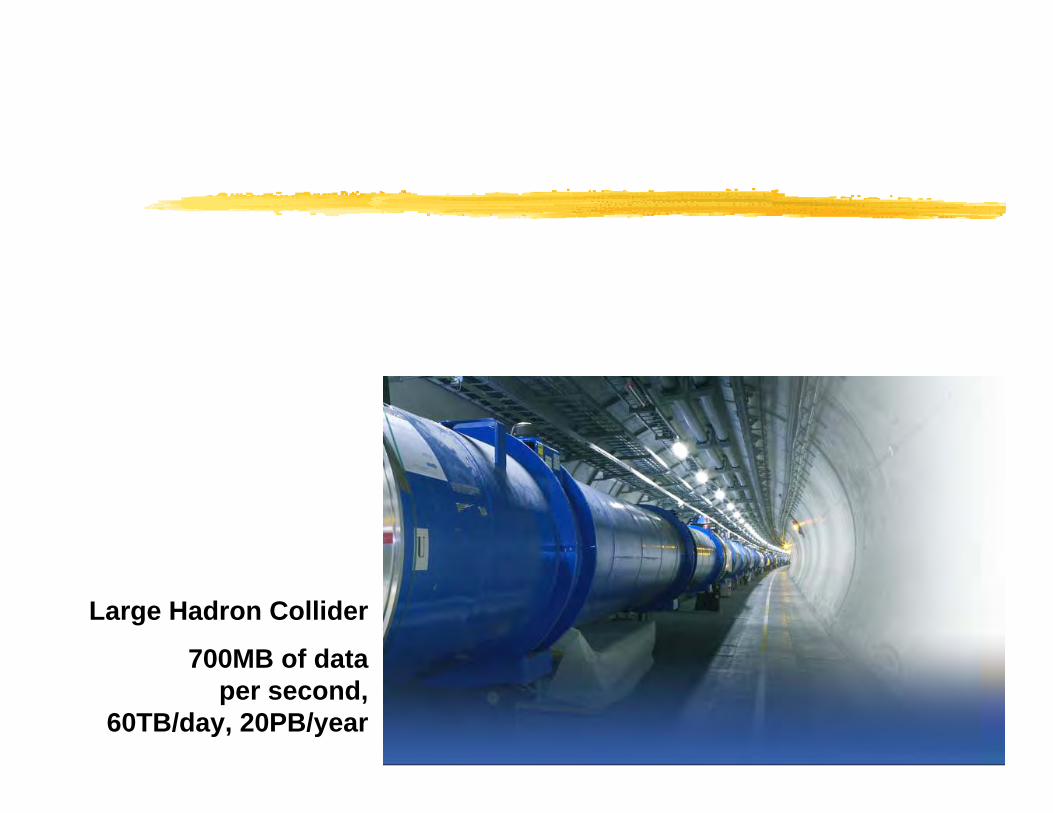
Large Hadron Collider
700MB of dataper second,
60TB/day, 20PB/year

Illumina Genome Analyzer
~1TB/day

Regional Scale Nodes of the NSF Ocean Observatories
Initiative
2000 km of fiber optic cable on the seafloor, connecting
thousands of chemical, physical, and biological
sensors

The Web
20+ billion web pages x 20KB = 400+TB
One computer can read 30-35 MB/sec
from disk => 4 months just to read the web

Point-of-sale terminals

eScience is about the analysis of data
The automated or semi-automated extraction of knowledge from massive volumes of data There’s simply too much of it to look at
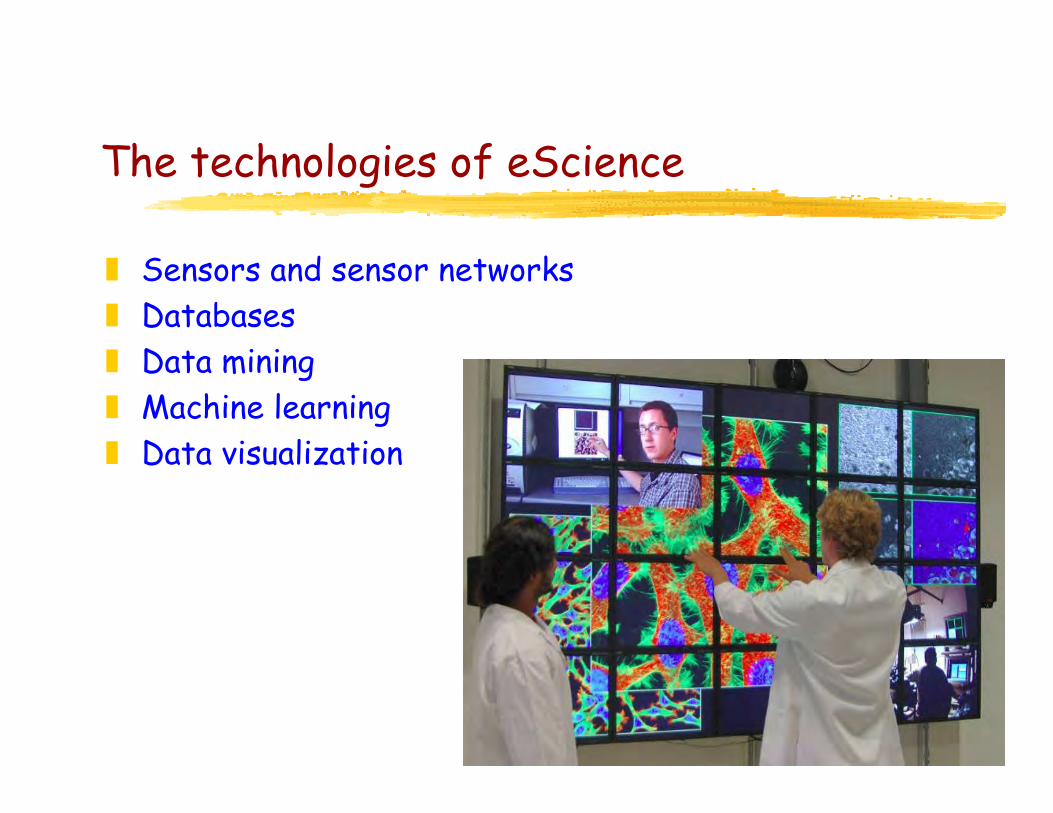
The technologies of eScience
Sensors and sensor networks Databases Data mining Machine learning Data visualization

eScience will be pervasive
Computational science was a niche As an institution (e.g., a university), you didn’t need to excel
in order to be competitive eScience capabilities must be broadly available in any
organization If not, the organization will simply cease to be competitive

Top faculty across all disciplines understand the coming data tsunami

Questions for you …
How does your institution track the IT needs –present and future – of its leading researchers?
To what extent are you meeting these needs, and in what critical areas are you falling short?
How well does your technology staff understand the institution’s research and disciplinary directions and their IT implications?
What potential resources, other than those currently in place, can be used to provide broad-based IT support for eScience and eScholarship?

More on the enablement of eScience
Ten quintillion: 10*1018
The number of grains of rice harvested in 2004

Ten quintillion: 10*1018
The number of grains of rice harvested in 2004
The number of transistors fabricated in 2004

The transistor William Shockley, Walter
Brattain and John Bardeen, Bell Labs, 1947
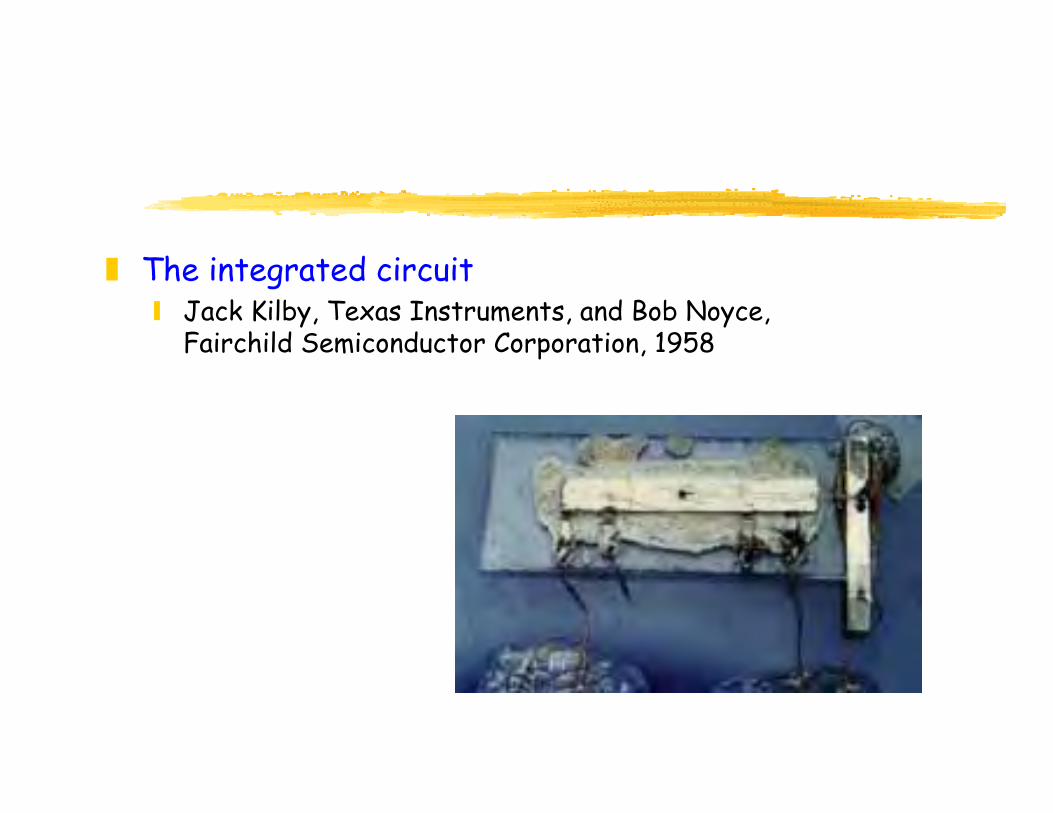
The integrated circuit Jack Kilby, Texas Instruments, and Bob Noyce,
Fairchild Semiconductor Corporation, 1958

Moore’s Law Gordon Moore, 1965


Processing power, historically 1980: 1 MHz Apple II+, $2,000
1980 also 1 MIPS VAX-11/780, $120,000 2006: 2.4 GHz Pentium D, $800
A factor of 6000
Processing power, recently Additional transistors => more cores of
the same speed, rather than higher speed 2008: Intel Core 2 Quad-Core 2.4 GHz,
$800 (4x the capability, same price) 2009: Intel Core 2 Quad-Core 2.5 GHz,
$183 (same capability, 1/4 the price)

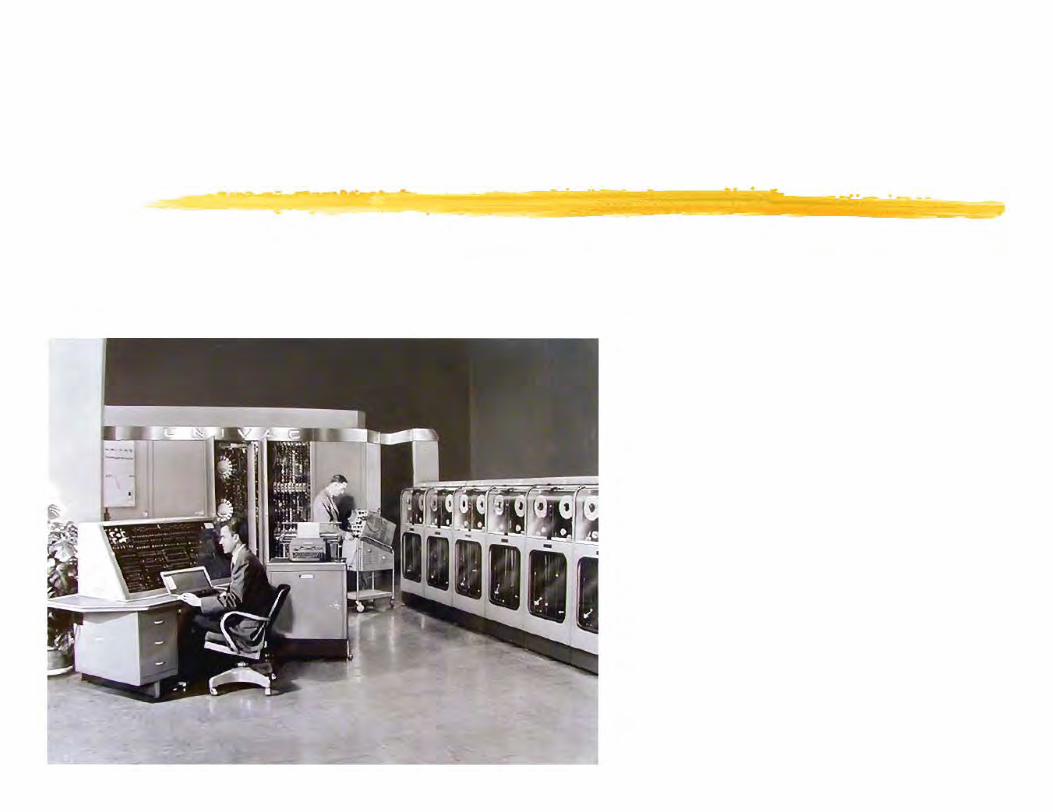
Primary memory – same story, same reason (but no multicore fiasco) 1972: 1MB, $1,000,000 1982: 1MB, $60,000 2005: $400/GB (1MB, $0.40)
4GB vs. 2GB (@400MHz) = $800
($400/GB)

2007: $145/GB (1MB, $0.15)
4GB vs. 2GB (@667MHz) = $290
($145/GB)

2008: $49/GB (1MB, $0.05)
4GB vs. 3GB (@800MHz) = $49
($49/GB)
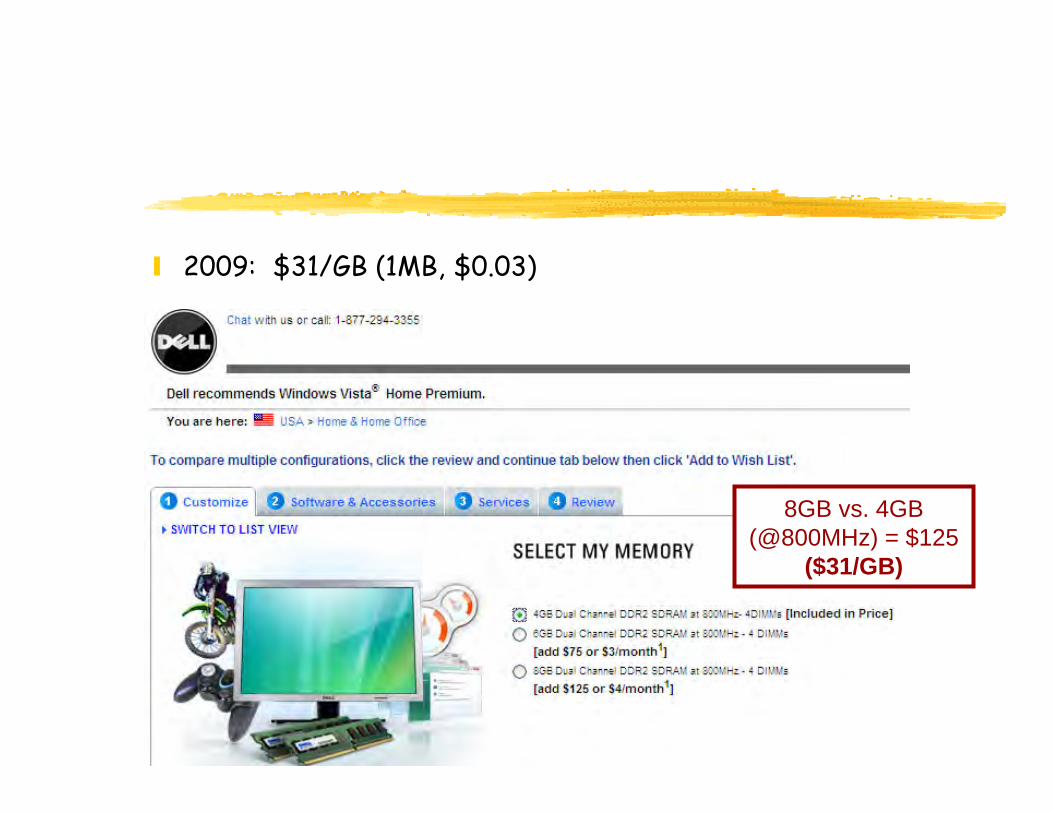
2009: $31/GB (1MB, $0.03)
8GB vs. 4GB (@800MHz) = $125
($31/GB)

Moore’s Law drives sensors as well as processing and memory LSST will have a 3.2 Gigapixel camera

Disk capacity, 1975-1989 doubled every 3+ years 25% improvement each year factor of 10 every decade Still exponential, but far less rapid than processor
performance Disk capacity since 1990
doubling every 12 months 100% improvement each year factor of 1000 every decade 10x as fast as processor performance

Only a few years ago, we purchased disks by the megabyte (and it hurt!)
Current cost of 1 GB (a billion bytes) from Dell 2005: $1.00 2006: $0.50 2008: $0.25
Purchase increment 2005: 40GB 2006: 80GB 2008: 250GB

Optical bandwidth today Doubling every 9 months 150% improvement each year Factor of 10,000 every decade 10x as fast as disk capacity 100x as fast as processor performance
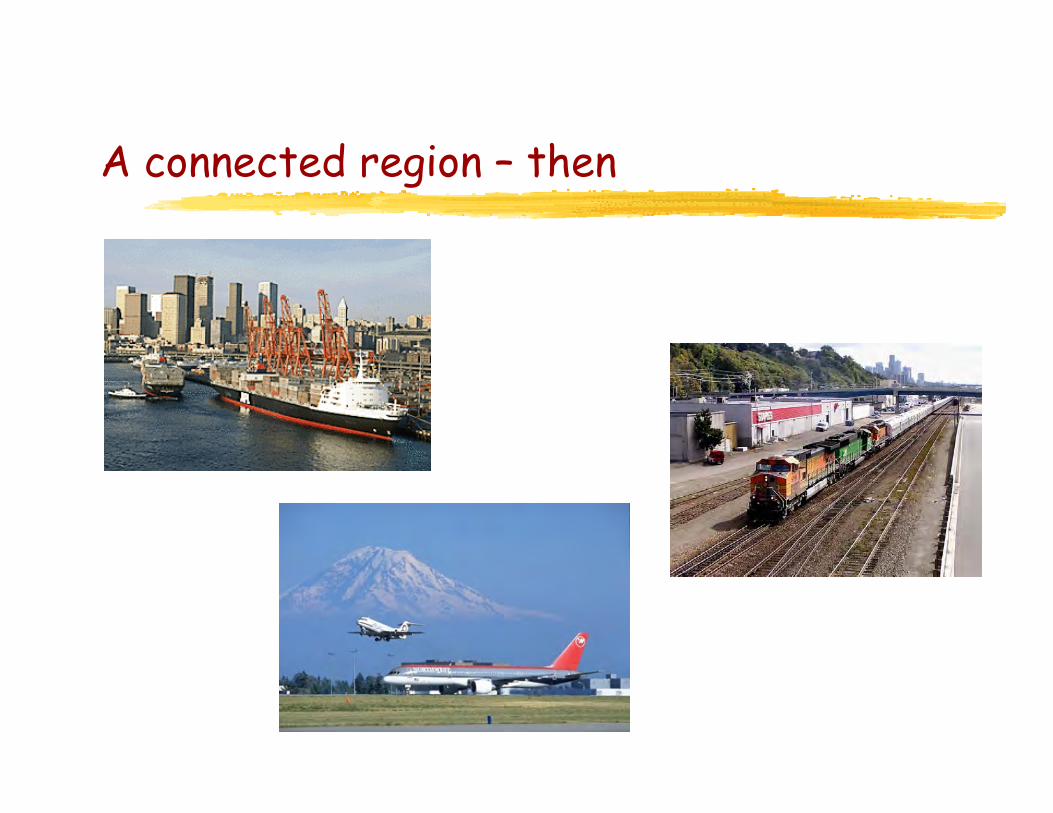
A connected region – then

A connected region – now

But eScience is equally enabled by software for scalability and for discovery
It’s likely that Google has several million machines But let’s be conservative – 1,000,000 machines A rack holds 176 CPUs (88 1U dual-processor boards), so
that’s about 6,000 racks A rack requires about 50 square feet (given datacenter
cooling capabilities), so that’s about 300,000 square feet of machine room space (more than 6 football fields of real estate – although of course Google divides its machines among dozens of datacenters all over the world)
A rack requires about 10kw to power, and about the same to cool, so that’s about 120,000 kw of power, or nearly 100,000,000 kwh per month ($10 million at $0.10/kwh) Equivalent to about 20% of Seattle City Light’s generating
capacity

Many hundreds of machines are involved in a single Google search request (remember, the web is 400+TB) There are multiple clusters (of thousands of computers each)
all over the world DNS routes your search to a nearby cluster

A cluster consists of Google Web Servers, Index Servers, Doc Servers, and various other servers (ads, spell checking, etc.)
These are cheap standalone computers, rack-mounted, connected by commodity networking gear

Within the cluster, load-balancing routes your search to a lightly-loaded Google Web Server (GWS), which will coordinate the search and response
The index is partitioned into “shards.” Each shard indexes a subset of the docs (web pages). Each shard is replicated, and can be searched by multiple computers – “index servers”
The GWS routes your search to one index server associated with each shard, through another load-balancer
When the dust has settled, the result is an ID for every doc satisfying your search, rank-ordered by relevance
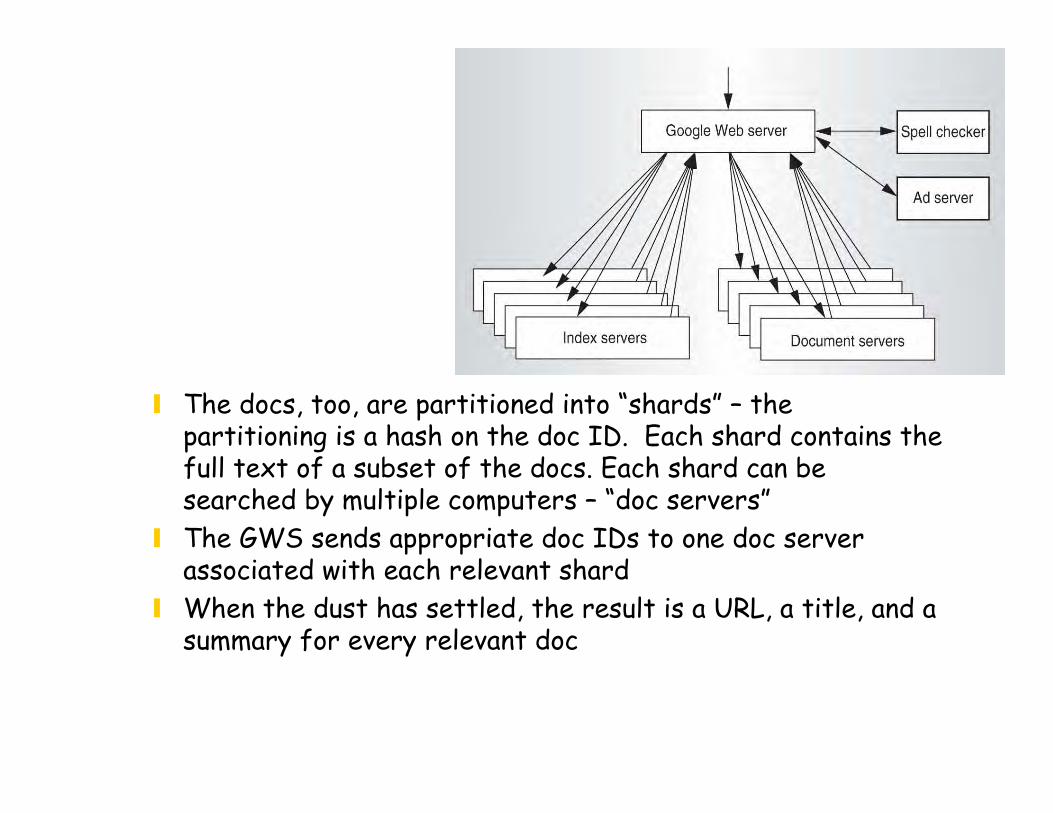
The docs, too, are partitioned into “shards” – the partitioning is a hash on the doc ID. Each shard contains the full text of a subset of the docs. Each shard can be searched by multiple computers – “doc servers”
The GWS sends appropriate doc IDs to one doc server associated with each relevant shard
When the dust has settled, the result is a URL, a title, and a summary for every relevant doc

Meanwhile, the ad server has done its thing, the spell checker has done its thing, etc.
The GWS builds an HTTP response to your search and ships it off
Many hundreds of computers have enabled you to search 400+TB of web in ~100 ms.

Enormous volumes of data Extreme parallelism The cheapest imaginable components
Failures occur all the time You couldn’t afford to prevent this in hardware
Software makes it Fault-Tolerant Highly Available Recoverable Consistent Scalable Predictable Secure

How on earth would you enable mere mortals write hairy applications such as this?
Recognize that many Google applications have the same structure Apply a “map” operation to each logical record in order to
compute a set of intermediate key/value pairs Apply a “reduce” operation to all the values that share the
same key in order to combine the derived data appropriately Example: Count the number of occurrences of each
word in a large collection of documents Map: Emit <word, 1> each time you encounter a word Reduce: Sum the values for each word

Build a runtime library that handles all the details, accepting a couple of customization functions from the user – a Map function and a Reduce function
That’s what MapReduce is Supported by the Google File System and the Chubby lock
manager Augmented by the BigTable not-quite-a-database system
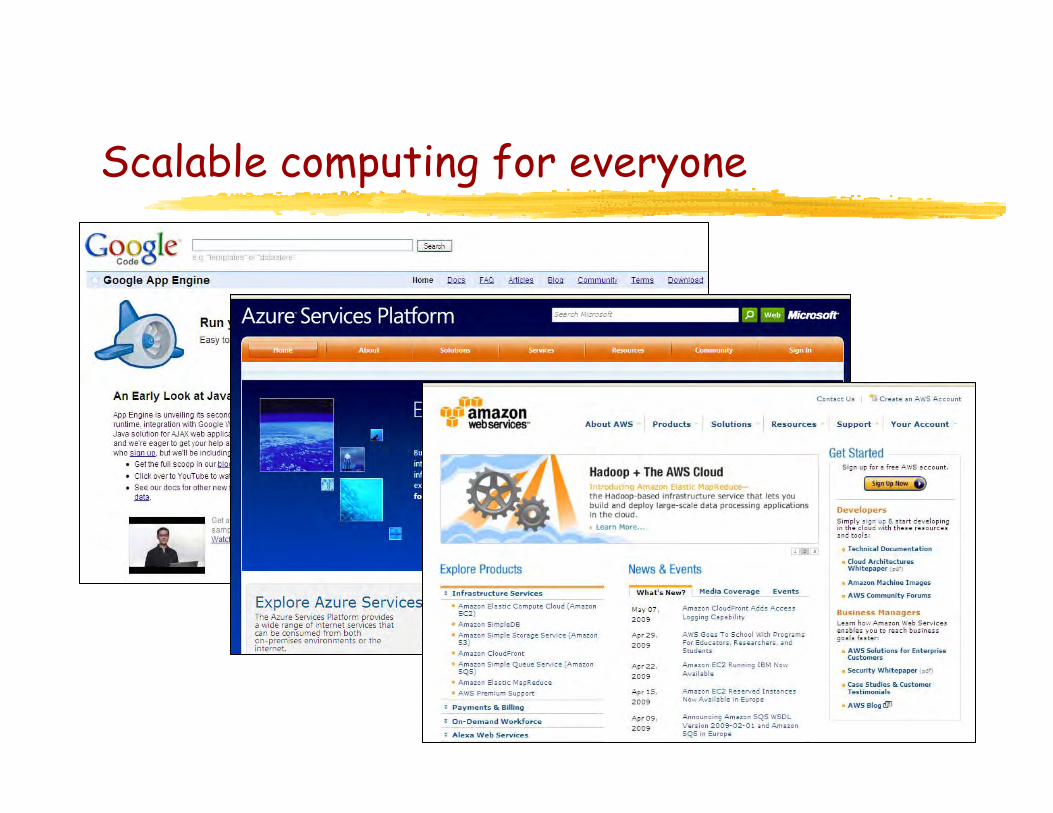
Scalable computing for everyone

Amazon Elastic Compute Cloud (EC2)
$0.80 per hour for 8 cores of 3 GHz 64-bit Intel or AMD 7 GB memory 1.69 TB scratch storage
Need it 24x7 for a year? $4800
$0.10 per hour for 1 core of 1.2 GHz 32-bit Intel or AMD (1/20th the above) 1.7 GB memory 160 GB scratch storage
Need it 24x7 for a year? $590
This includes Purchase + replacement Housing Power Operation Reliability Security Instantaneous expansion and contraction

Slide courtesy of Werner Vogels
1000 processors for 1 hour costs the same as 1 processor for 1000 hours
Revolutionary!
Your application doesn’t run decently on this environment? Start figuring out how to change that!

Still running your own email servers?

Slide courtesy of Werner Vogels

Networking in the West

ARPANET, 1980

DARPA Gigabit Testbeds, mid-1990’s
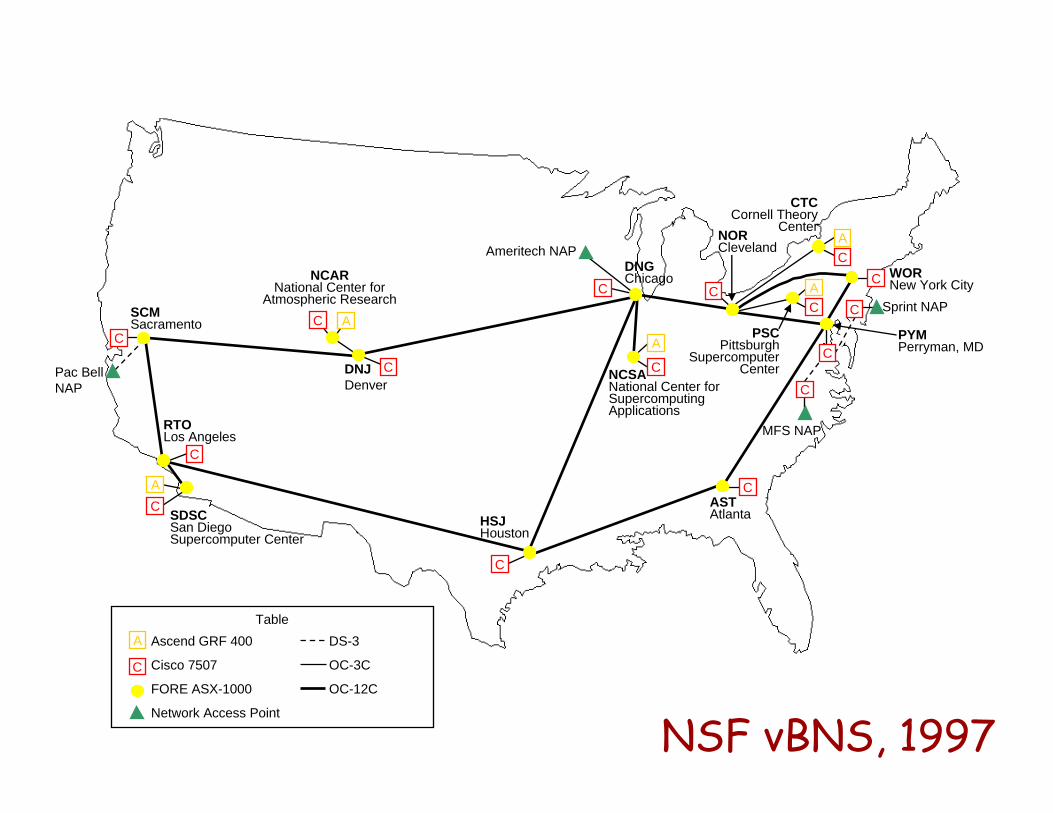
Pac BellNAP
SCMSacramento
NCARNational Center for
Atmospheric Research
SDSCSan DiegoSupercomputer Center
HSJHouston
DNJDenver
Ameritech NAPDNGChicago
NCSANational Center forSupercomputingApplications
NORCleveland
CTCCornell Theory
Center
PYMPerryman, MD
Sprint NAP
MFS NAP
PSCPittsburgh
SupercomputerCenter
C A
C
AC
C
RTOLos Angeles
C
AC
C
ASTAtlanta
C
C C AC
C
AC
C
C
C
WORNew York City
Ascend GRF 400
Cisco 7507
FORE ASX-1000
Network Access Point
TableA
C
DS-3
OC-3C
OC-12C
NSF vBNS, 1997

UCAID Abilene network, 1998


ARPANET, 1983
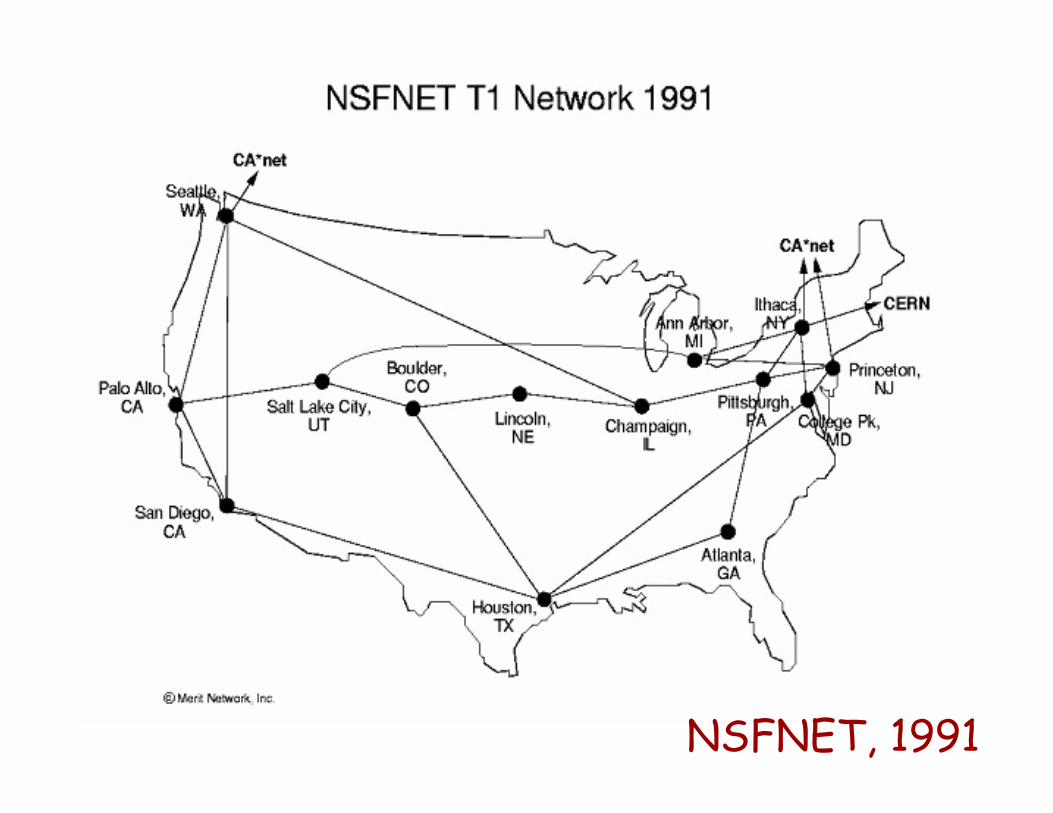
NSFNET, 1991

DARPA / NGI Testbed, late 1990’s

NSF vBNS, 1998

Internet2, 1999

SunnyvaleDenver
Seattle
LASan Diego
ChicagoPitts
Wash DC
Raleigh
Jacksonville
Atlanta
KC
Portland
Clev
Boise
Ogden
NLR MetaPOPNLR Regen or OADM
NLR Route
NLR NLR –– Optical Infrastructure Optical Infrastructure -- Phase 1Phase 1
National LambdaRail, 2004
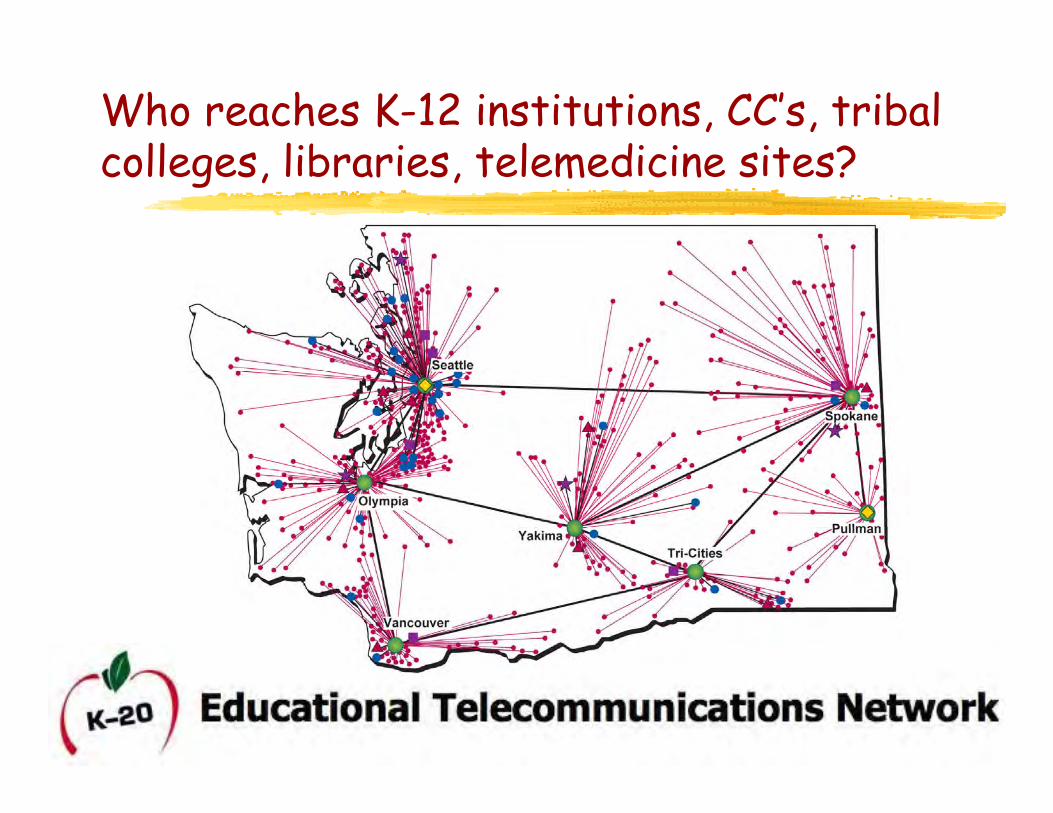
Who reaches K-12 institutions, CC’s, tribal colleges, libraries, telemedicine sites?
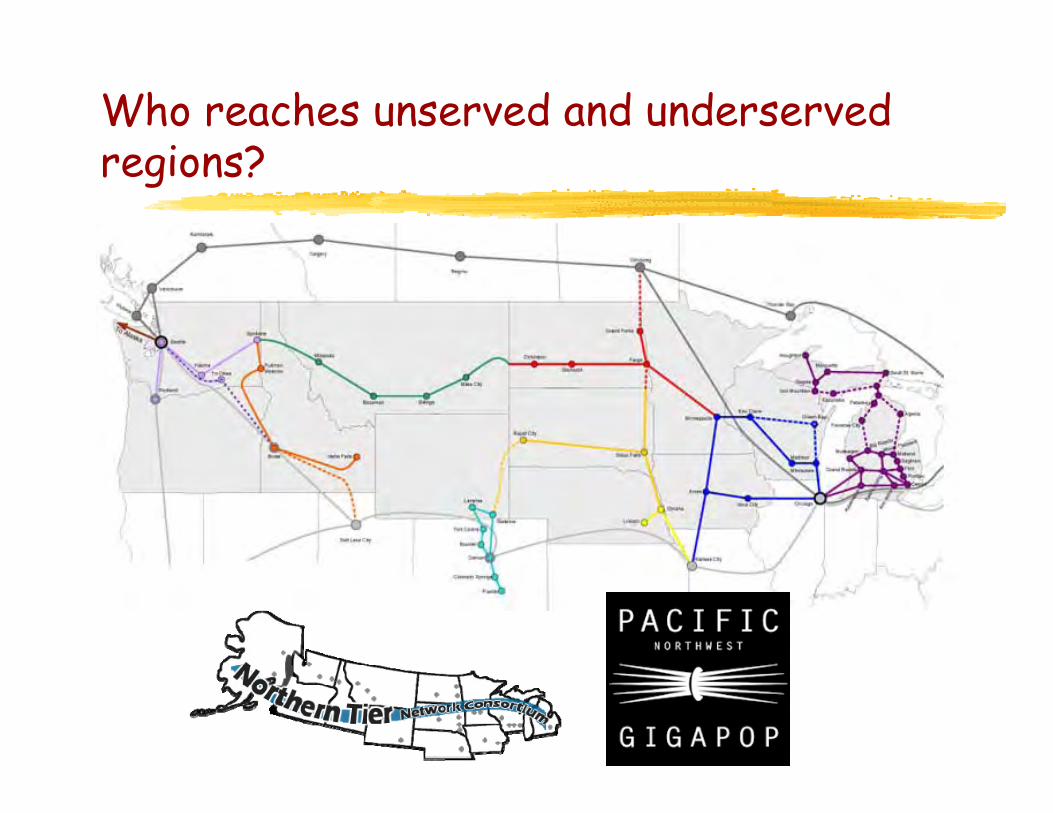
Who reaches unserved and underserved regions?

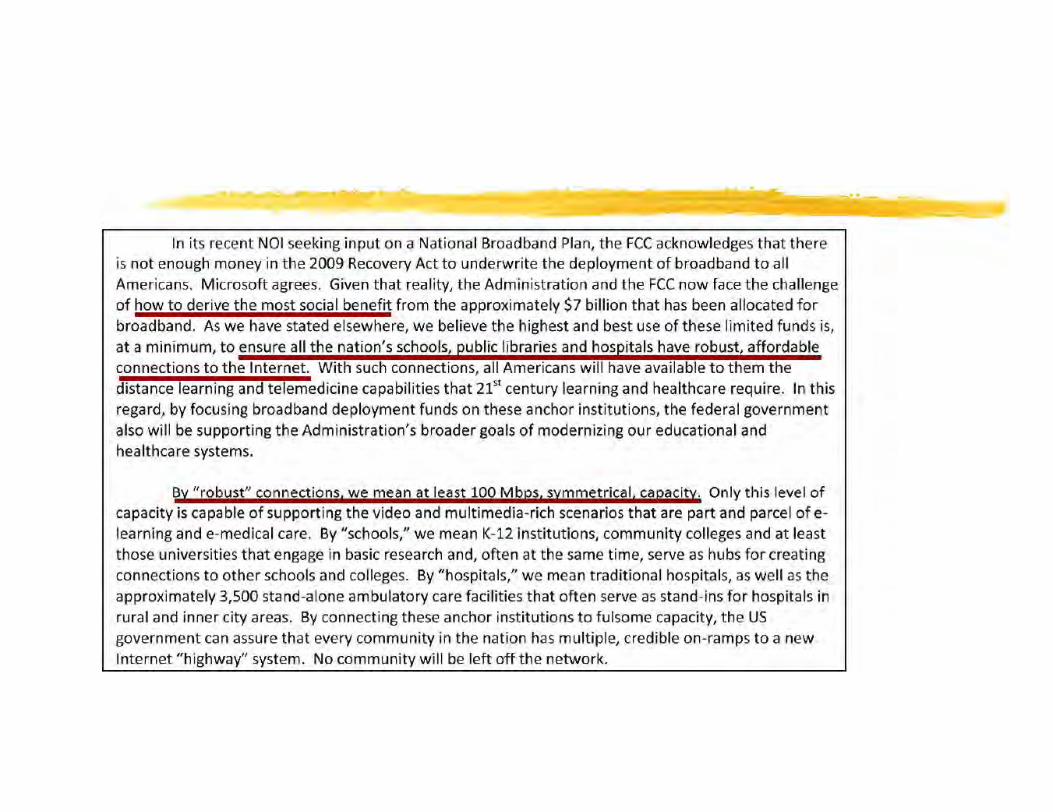
The broadband stimulus
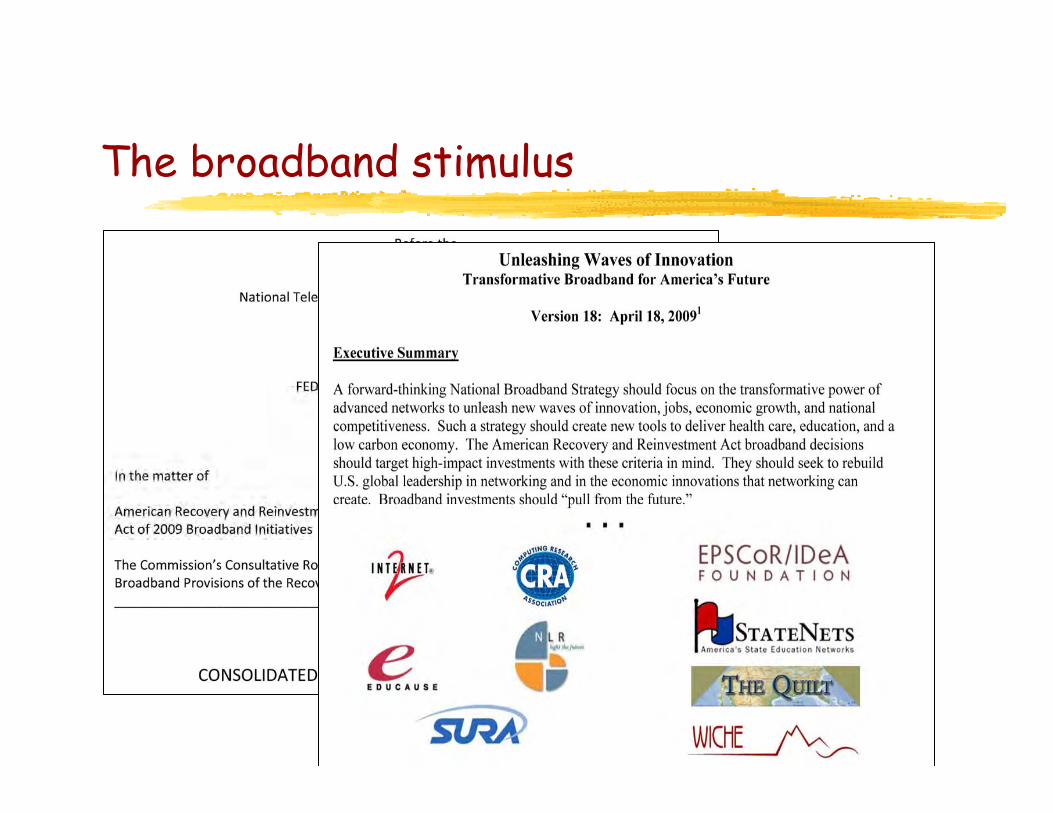
The broadband stimulus


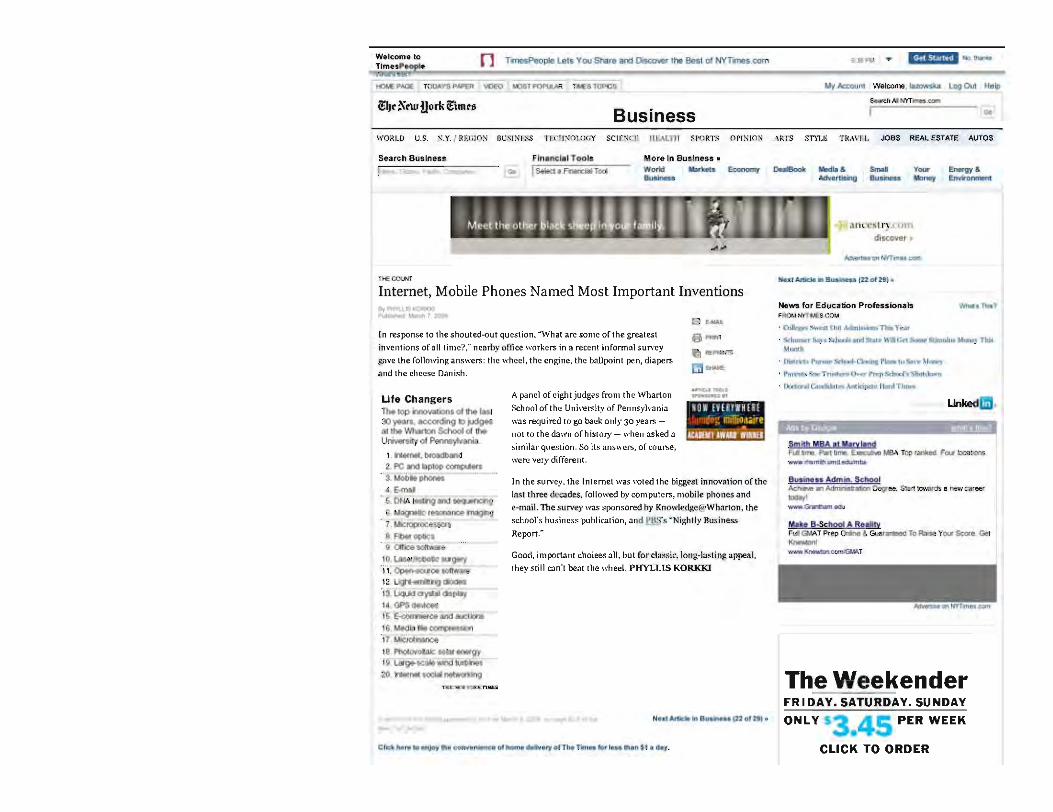
Advances in computing change the way we live, work, learn, and communicate
Advances in computing drive advances in nearly all other fields
Advances in computing power our economy Not just through the growth of the IT industry – through
productivity growth across the entire economy
Computer science & engineering:Changing the world


A day without the Internet and all that it enables A day without diagnostic medical imaging A day during which automobiles lacked electronic ignition,
antilock brakes, and electronic stability control A day without digital media – without wireless telephones,
high-definition televisions, MP3 audio, DVD video, computer animation, and videogames
A day during which aircraft could not fly, travelers had to navigate without benefit of GPS, weather forecasters had no models, banks and merchants could not transfer funds electronically, factory automation ceased to function, and the US military lacked technological supremacy
Imagine spending a day without information technology

Research has built the foundation

The future is full of opportunity
Creating the future of networking
Driving advances in all fields of science and engineering
Revolutionizing transportation Personalized education The Smart Grid Predictive, preventive,
personalized medicine Quantum computing Empowerment of the
developing world Personalized health monitoring
=> quality of life Neurobotics Synthetic biology

Why do students choose the field?
Power to change the world
People enter the field for a wide variety of aspirational reasons
http://www.cs.washington.edu/WhyCSE/

Pathways in computer science
People pursue diverse careers following their education in computer science
http://www.cs.washington.edu/WhyCSE/

A day in the life
Working in the software industry is creative, interactive, empowering
http://www.cs.washington.edu/WhyCSE/

Science & Engineering Job Growth, 2006-16(BLS Occupational Employment Projections)

Average annual projected growth rates for all 22 major occupational groups in Washington State, 2006 to 2016
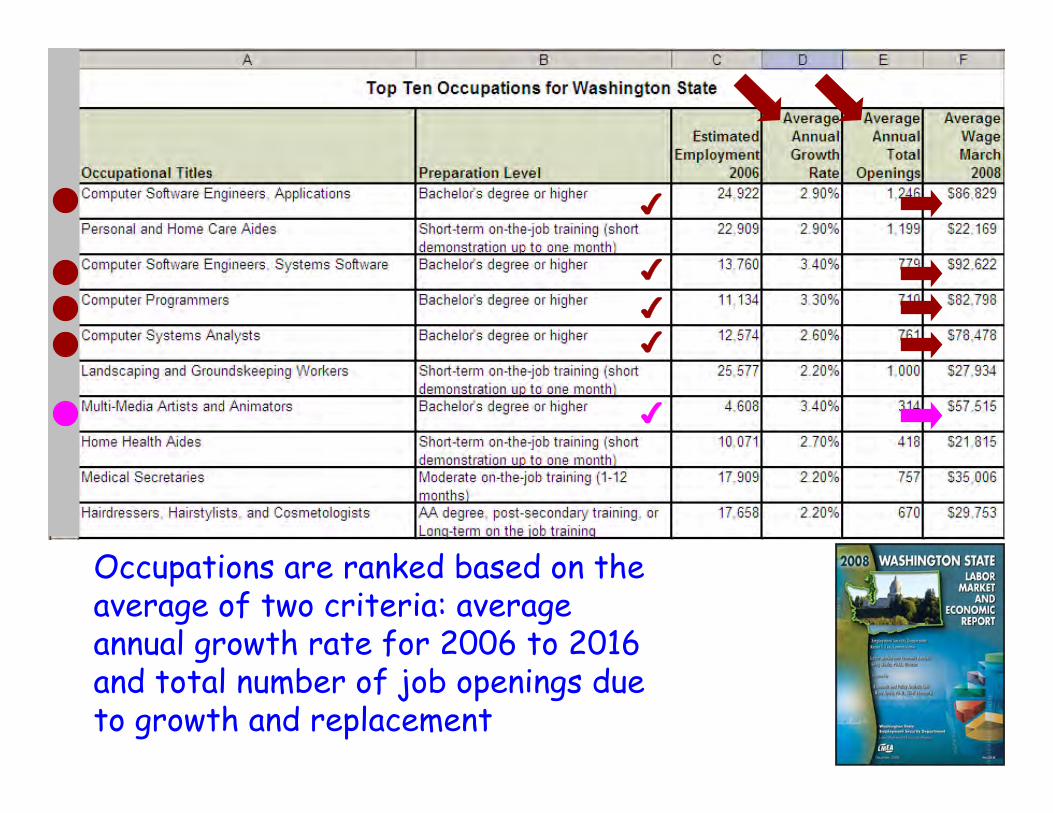
Occupations are ranked based on the average of two criteria: average annual growth rate for 2006 to 2016 and total number of job openings due to growth and replacement

Science & Engineering Job Growth, 2006-16 (BLS Occupational Employment Projections)
23
98
13
9
4
University of Washington academic departments

The transformation of our economy, and of educational requirements
Once upon a time, the “content” of the goods we produced was largely physical

Then we transitioned to goods whose “content” was a balance of physical and intellectual

In today’s knowledge-based economy, the “content”of goods is almost entirely intellectual rather than physical

What kind of education is required to produce a good whose content is almost entirely intellectual?
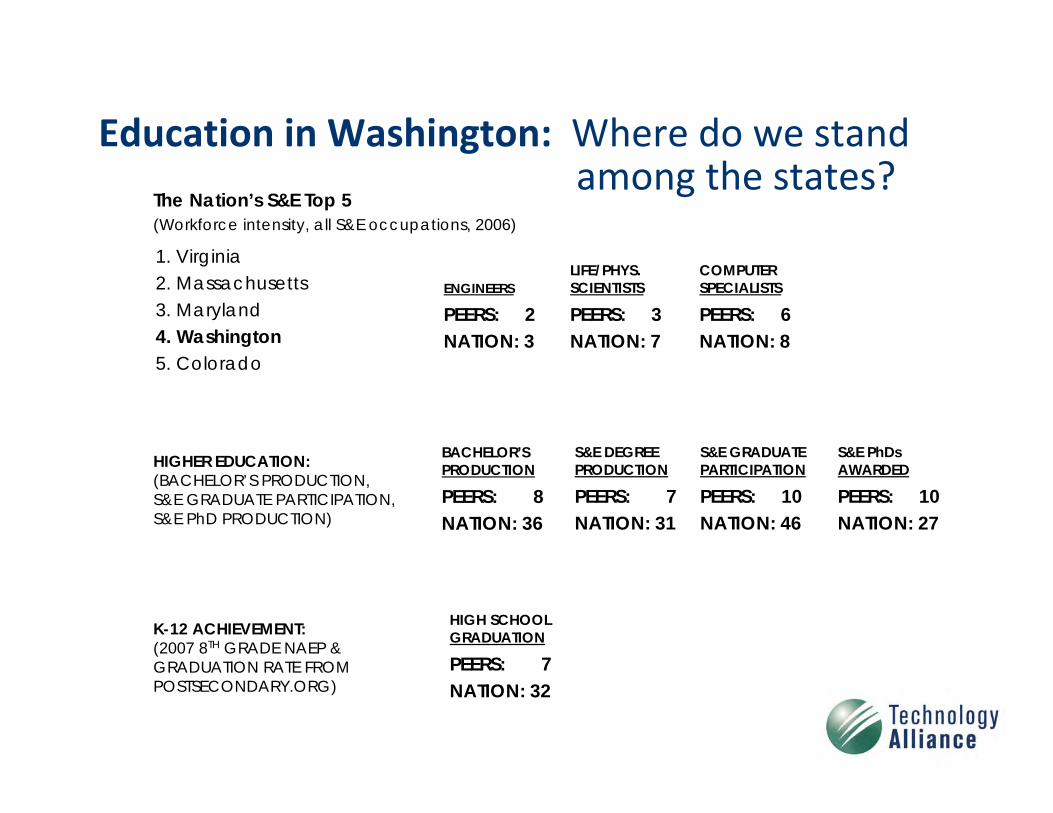
HIGH SCHOOLGRADUATION
PEERS: 7NATION: 32
BACHELOR’SPRODUCTION
PEERS: 8NATION: 36
S&E DEGREEPRODUCTION
PEERS: 7NATION: 31
K-12 ACHIEVEMENT:(2007 8TH GRADE NAEP &GRADUATION RATE FROMPOSTSECONDARY.ORG)
HIGHER EDUCATION:(BACHELOR’S PRODUCTION,S&E GRADUATE PARTICIPATION,S&E PhD PRODUCTION)
S&E GRADUATEPARTICIPATION
PEERS: 10NATION: 46
S&E PhDsAWARDED
PEERS: 10NATION: 27
LIFE/PHYS.SCIENTISTS
PEERS: 3NATION: 7
ENGINEERS
PEERS: 2NATION: 3
COMPUTERSPECIALISTS
PEERS: 6NATION: 8
The Nation’s S&E Top 5(Workforce intensity, all S&E occupations, 2006)
1. Virginia2. Massachusetts3. Maryland4. Washington5. Colorado
Education in Washington: Where do we standamong the states?

Washington State is gambling with its future!
How about you?

This morning
The nature of eScience The advances that enable it Scalable computing for everyone Networking in the West “There’s only so much you can do with asphalt” “What happens in Vegas, stays in Vegas” – don’t
gamble with the future of your region and of the kids who grow up there
http://lazowska.cs.washington.edu/wiche.pdf