escalation rates for escalable components in imported coal...
TRANSCRIPT

EXPLANATION
FOR ESCALATION RATES FOR ESCALABLE COMPONENTS IN IMPORTED COAL AND CAPTIVE COAL MINE BASED
THERMAL POWER PROJECTS
CONSULTANT’S REPORT (REVISED)
CENTRAL ELECTRICITY REGULATORY COMMISSION
NEW DELHI
OCTOBER 2006
Disclaimer
This document is has been prepared specifically by Ernst & Young ("EY") for the Central Electricity Regulatory Commission (CERC) for the development of indices by the CERC for imported coal and captive coal mine based thermal power projects. The report has been developed for the specific purposes stated in the report based on facts and data available at the time of development of the report, and is intended only as recommendation to the CERC. The report is being provided for public dissemination for the sole purpose of understanding of the findings and recommendations contained herein, and hence may not be used for any other purpose. In no event will EY be liable for any loss or damage whatsoever that may be suffered by any third party arising out of or in connection with the same. The report relies on information obtained from third party sources, and EY makes no representations or warranties regarding the accuracy or suitability of the same.

Table of Contents
1 Introduction .........................................................................................1 1.1 Background...................................................................................................1 1.2 Structure of the Report ...............................................................................2 1.3 Revisions to the Report ..............................................................................2
2 Development of Indices .......................................................................3 2.1 Introduction..................................................................................................3 2.2 Assumptions .................................................................................................4 2.3 Selection criteria for escalators ..................................................................5
3 Proposed Escalation Indices................................................................6 3.1 Escalation Indices for Imported coal .......................................................6 3.2 Escalation Indices For Transportation Charges For Imported Coal
(Ocean Freight) ......................................................................................... 13 3.3 Escalation Indices for Inland Handling for Imported Coal ............... 16 3.4 Escalation Indices for Captive coal mining .......................................... 18
4 Application of Indices ........................................................................22 4.1 Application For Bid evaluation............................................................... 22 4.2 Application For Payment Purposes ....................................................... 28 4.3 Methodology for Updation of the indices............................................. 38 4.4 Need to Align Bid Documents With Payment Methodology ............ 38
Appendix A: Market background and analysis ..........................................39 Coal markets ........................................................................................................ 39 Freight................................................................................................................... 45
Appendix B: Australian Open Cut Mining PPI Data Series for Bid Evaluation ..........................................................................................46
Appendix C: WPI and CPI Data Series for Bid Evaluation .......................47 Appendix D: Component indices of Disaggregated WPI Series for Bid
Evaluation ..........................................................................................48 Appendix E: WPI and CPI Data Series for Payment .................................50 Appendix F: Captive Coal Mining Data Series for Payment...................... 51

Index of Tables and Figures
Figure 1: Indian Imports of Thermal Coal CYs 2001-2005.................................... 41 Figure 2: World Coal Exports, 2004........................................................................... 42 Figure 3: World Thermal Coal Export Projections to 2030 ................................... 43 Figure 4: Newcastle Contract and Spot Prices 1996-2005 (US$/t FOB,
6,700kcal/kg) ........................................................................................................ 44
Table 1 Indicative landed costs of Indian thermal coal imports ...............................4 Table 2: Proven World Coal Reserves at end 2005.................................................. 39

Introduction 1
1 Introduction
The Government of India has released the Guidelines for Competitive Bidding u/s 63 of the Electricity Act, 2003. The evaluation of competitive bids to develop power projects, as well as future payments to the selected developers, relies on transparent indices that are to be determined in advance. This report considers the indices that relate to coal costs.
This aim of this report is to:
Identify the potential options for determining the appropriate fuel cost escalation indices for specification in power procurement projects, including:
• Projects based on imported coal; as well as
• Projects using coal from captive mines;
To make preliminary recommendations on the appropriate coal cost escalation indices; and
To seek feedback on these recommendations.
1.1 BACKGROUND
1.1.1 Electricity Act 2003
Section 61 and 62 of the Electricity Act, 2003 provide for tariff regulation and determination of tariff of generation, transmission, wheeling and retail sale of electricity by the Appropriate Commission. Section 63 of the Act, states that –
“Notwithstanding anything contained in Section 62, the Appropriate Commission shall adopt the tariff if such tariff has been determined through transparent process of bidding in accordance with the guidelines issued by the Central Government”.
1.1.2 Guidelines for Tariff based Competitive Bidding
In line with Section 63, the Ministry of Power issued the “Guidelines for Determination of Tariff by Bidding Process for Procurement of Power by Distribution Licensees” (“the Guidelines”) on 19th January, 2005.
As per Clause 4.11 (ii) the energy charge for captive coal mine based projects would an escalable component linked to inflation (relevant to mining operations).
Under Clause 4.11 (iii), the energy charge for imported coal / fuel based thermal power projects would have the following three escalable sub-components:
1. Imported Fuel (Coal) component in USD / unit
2. Transportation of fuel (Coal – Ocean Freight) component in USD / unit
3. Inland fuel (Coal) Handling component in INR / unit
Introduction 2
1.2 STRUCTURE OF THE REPORT
This report is structured as follows:
Section 1.3 discusses the context and criteria for selecting cost escalation indices suitable for escalating the fuel charge and the transportation charge to the landing port in India for imported fuel;
Section 2 outlines background information relevant to the choice of the escalation indices and the criteria that are used to assess the available options;
Section 3 sets out the proposed indices and the reasons for their selection; and
Section 4 outlines the application of indices to tariff related payments and bid evaluation.
Appendixes to the report provide additional background information as follows:
Appendix A provides additional background information on:
• world coal markets and potential sources of thermal coal for power generation projects in India; and
• the cost of ocean freight and its two principal components, vessel time charter rates and the cost of bunkers; and;
Data related to the various indices used for development of the indices for the current purposes is provided in Appendix B to D
1.3 REVISIONS TO THE REPORT
The original report was posted on the CERC website (www.cercind.org) on 29th September, 2006 and comments and feedback were invited till 15th October, 2006. In addition a bidder’s meet was called at the Ministry of Power on 18th October, 2006 for the same purpose. The changes made in this revised report in response to the comments / feedback and the meeting are as follows:
The payment index for imported coal has been changed substantially. The new index is a hybrid of API 4 South Africa (50%), BJI (25%) and GlobalCOAL Newcastle (25%);
Owing to the short history of both API 4 and GlobalCOAL Newcastle, only BJI will be used for the purposes of bid evaluation for imported coal;
The captive coal mining index has been revised with minor changes with respect to underlying weightages and replacement of the “Machinery and Machine Tool” component with “Heavy Machinery and Parts” component.
This report has been further updated and appended in parts in November 2006 for greater clarity on certain issues involved. All future references shall be made to this updated report issued in November 2006.
Development of Indices 3
2 Development of Indices
2.1 INTRODUCTION
This report addresses the escalators involved in the two principal sources of coal for competitively bid out power stations, viz, (i) domestic coal mined by the power companies from captive coal mines, and (ii) coal imported through the sea route.
Coal mined by the power companies from the captive mines have certain cost trends that cannot be directly discerned from available indices for this purpose. While the disaggregated WPI indices include an index for coal mining, this is understood to largely rely on the data furnished by the Coal India Limited and its subsidiaries that control about 93% of coal supplied in the country. This includes both coking and non-coking coal, and also surface as well as underground mining. In addition it is expected that the mining costs of a private sector coal company could vary widely with the operations of the public sector undertakings. Hence it could be necessary to construct a separate index for captive coal mining operations for projects bid out u/s 63 of the Electricity Act, 2003.
Global coal trade has increased substantially over the years. World hard coal trade was estimated at 775 Mt (Million tonnes) in 2005, up 4.2% on the previous year of which around 550 Mt was steaming coal. Till date India has been a relatively small player in the global markets with imports of 17.5 Mt of thermal coal in 2005, up from 15 Mt in 2004 and 10 Mt in 20031. With the coal imports proposed for the Ultra Mega Power Projects (UMPP), as well as for other projects based on imported coal, this could change significantly. With each UMPP requiring about 12-14 million tonnes of coal, India would become a major player in the world coal markets in the coming decade.
There are two principal cost elements to be considered in deriving indices that reflect the landed cost of imported thermal coal at deepwater Indian ports: the free-on-board (FOB) cost of purchasing the coal at the port of export, and the cost of ocean freight transport to India.
Thermal coal prices have risen substantially in recent years for both contract and spot sales. For example, reference Australia-Japan contract prices rose spectacularly for Japanese Financial Years (JFY, beginning 1 April) 2004 and 2005, by 42% and 29% respectively. Negotiations that dragged on beyond the end of June this year saw only a slight (5%) reduction for JFY2006.
Ocean freight costs for large bulk cargoes have two main sub-components: the cost of chartering a vessel and crew, and the fuel costs for the voyage. As with coal purchase costs, both these components have increased sharply in recent years, the first due to surging global demand for dry bulk carriers and relative
1 Source: International Energy Agency (IEA)
Development of Indices 4
scarcity of suitable vessels available for charter, and the second as a result of escalating global oil prices.
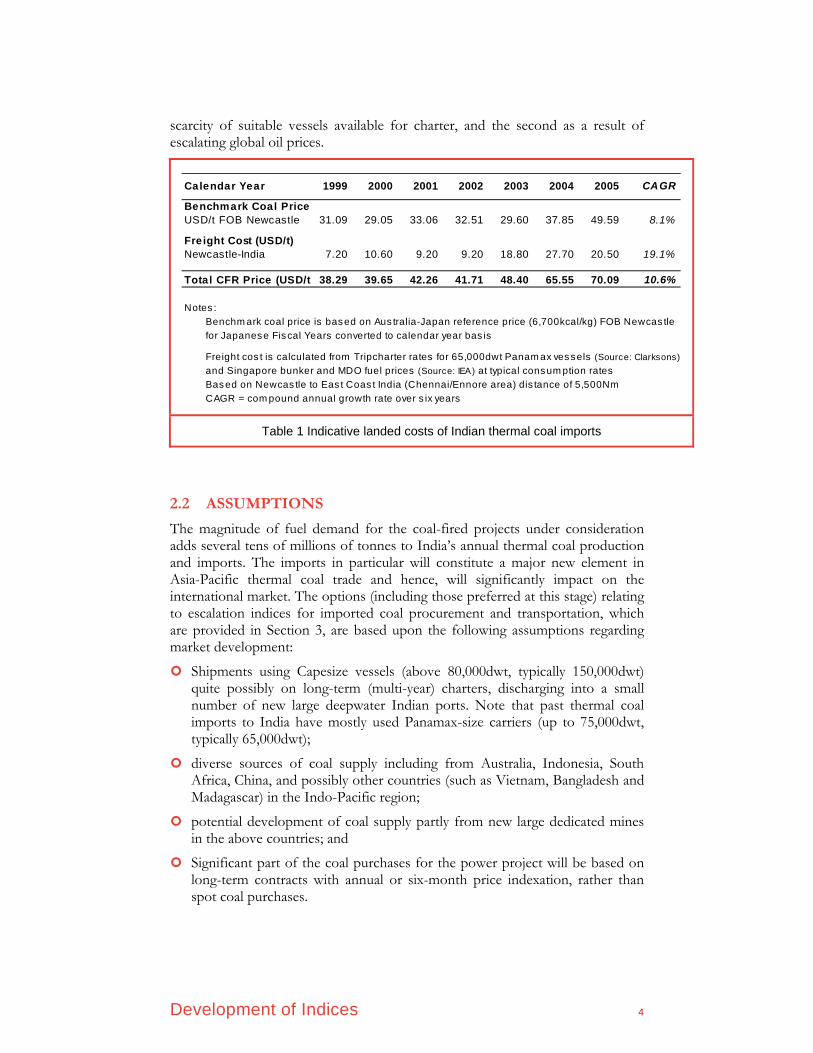
Calendar Year 1999 2000 2001 2002 2003 2004 2005 CAGR
Benchmark Coal PriceUSD/t FOB Newcastle 31.09 29.05 33.06 32.51 29.60 37.85 49.59 8.1%
Freight Cost (USD/t)Newcastle-India 7.20 10.60 9.20 9.20 18.80 27.70 20.50 19.1%
Total CFR Price (USD/t 38.29 39.65 42.26 41.71 48.40 65.55 70.09 10.6%
Notes :Benchm ark coal price is based on Aus tralia-Japan reference price (6,700kcal/kg) FOB Newcas tlefor Japanese Fiscal Years converted to calendar year bas is
Freight cos t is calculated from Tripcharter rates for 65,000dwt Panam ax vessels (Source: Clarksons)and Singapore bunker and MDO fuel prices (Source: IEA) at typical consum ption ratesBased on Newcas tle to Eas t Coas t India (Chennai/Ennore area) dis tance of 5,500NmCAGR = com pound annual growth rate over s ix years
Table 1 Indicative landed costs of Indian thermal coal imports
2.2 ASSUMPTIONS
The magnitude of fuel demand for the coal-fired projects under consideration adds several tens of millions of tonnes to India’s annual thermal coal production and imports. The imports in particular will constitute a major new element in Asia-Pacific thermal coal trade and hence, will significantly impact on the international market. The options (including those preferred at this stage) relating to escalation indices for imported coal procurement and transportation, which are provided in Section 3, are based upon the following assumptions regarding market development:
Shipments using Capesize vessels (above 80,000dwt, typically 150,000dwt) quite possibly on long-term (multi-year) charters, discharging into a small number of new large deepwater Indian ports. Note that past thermal coal imports to India have mostly used Panamax-size carriers (up to 75,000dwt, typically 65,000dwt);
diverse sources of coal supply including from Australia, Indonesia, South Africa, China, and possibly other countries (such as Vietnam, Bangladesh and Madagascar) in the Indo-Pacific region;
potential development of coal supply partly from new large dedicated mines in the above countries; and
Significant part of the coal purchases for the power project will be based on long-term contracts with annual or six-month price indexation, rather than spot coal purchases.

Development of Indices 5
2.3 SELECTION CRITERIA FOR ESCALATORS
Several characteristics define a price series as suitable for use as an escalator in the calculation of the fuel component of power tariffs:
widely recognized as a reputable industry standard;
relevant to the likely arrangements for supplying large quantities of coal over a long period:
• considering the expected origins of the coal to be supplied;
• considering the relevant destination market (which in the case of imported coal would be Asian markets);
• preferably under long term contractual arrangements; and
• using very large vessels (for imported coal);
an established index with data history (covering at least one business cycle at the minimum, and preferably 30 years or as close to it as possible);
independently compiled and not amenable to manipulation;
likely to continue to be both relevant and published in the mid- to long-term;
reflecting likely price/cost movements for the whole of the relevant trade; and
A good basis for use for transacting in futures markets.
It needs to be noted that the Guidelines issued by the Government of India u/s 63 of the Electricity Act, 2003 states that for the purpose of bid evaluation, median escalation rate of the relevant fuel index in the international market for the last 30 years for coal and 15 years for gas / LNG shall be used for escalating the energy charges quoted by the bidder. In case such data is not available for the specified number of years, than the maximum number of available years are to be considered.
It needs to be noted that coal purchase costs, shipping charters, as well as bunker fuel have all witnessed severe volatility in the past few years, and this has been mirrored by their respective indices. Hence there could be legitimate concerns on the suitability of such indices for bid evaluation. This is however mitigated to a great extent by the fact that the escalation factors apply uniformly for all bidders (and would be known to all bidders before the submission of the bids).
However, the “reasonableness” of the escalation rates used for bid evaluation still needs to be ensured to avoid any distortion in the bid values on account of abnormalities in certain years as compared to the general trend.
Proposed Escalation Indices 6
3 Proposed Escalation Indices
This section describes the indices available for escalating each element of the fuel cost, namely:
FOB imported coal (Section 3.1);
Imported coal transportation charges to the port in India (Section 3.2);
Inland transportation charges associated with moving the imported coal from the port to the power station (Section 3.3); and
The captive coal costs (Section 3.4).
In each section, the relevant indices are listed and assessed, then a preliminary recommendation made regarding the preferred index.
3.1 ESCALATION INDICES FOR IMPORTED COAL
3.1.1 Key Issues
The escalation index for imported coal could be compiled from:
a single index or a basket of indices which are combined with appropriate weightings (hybrid);
indices published by a single or multiple sources;
indices representative of long term contract prices or spot prices or a combination; or
A coal cost measure such as a relevant Producer Price Index in Australia instead of (or in addition to) international coal price measures.
3.1.2 Candidate Indices
JPU Reference Price Index
The JPU reference price index provides the ruling contract prices of New South Wales thermal coal sold under long term contracts to Japanese power utilities. It is compiled using the settled prices for standard reference brand up until Japanese Fiscal Year 2001 (ending 31 March 2002) when the reference price system was discontinued. It is now calculated annually by Barlow Jonker as an estimated weighted average of the prices negotiated individually for each coal brand.
The key advantage of this index is that it reflects the long term contracts. However, since the reference price has been discontinued since 2002, the relevance and representativeness of the index is progressively diminishing.
Proposed Escalation Indices 7
ACR Asian Index
This index has been produced by Barlow Jonker since 1978. Expressed in US$ per tonne, it is determined in arrears as the weighted average export price for all thermal coal exported from Australia, primarily to consumers in Japan, Korea, Hong Kong and Taiwan. The overall traded volume captured in this index in 2005 was 95 million tonnes out of approximately 110 million tonnes of thermal coal exported by Australia in the same period.
Being based on customs data published by the Australian Bureau of Statistics, the index covers a mix of contract and spot business. It may therefore be held to represent the likely situation more closely than an index based on contract or spot business alone.
The volume of coal traded is relatively large, making it attractive for its selection as a candidate index. There is also a sufficiently long history of the index (although it still falls short of the 30 years specified by Standard Bidding Guidelines as do most other indices.
The key disadvantages are that the index represents all trades, and the proportion of long term contract and spot trades in the index could vary substantially between periods. A second concern would be on the non-availability of financial hedges around these and other ACR indices. Also, the coal quality could vary between periods depending on the trades involved. However, since all Australian supplies are of washed coal, this may not be a serious concern in the selection of the index for bid evaluation and payments.
ACR New South Wales Asia Index
This index has been produced by Barlow Jonker since 1979. Expressed in US$ per tonne, it is determined in arrears as the weighted average export price for all thermal coal exported from New South Wales, primarily to consumers in Japan, Korea and Taiwan. The total traded volume captured by this index in 2005 was 61 million tonnes.
As with the ACR Asia Index it is based on customs data published by the Australian Bureau of Statistics, and represents a mix of contract and spot business, and has largely the same advantages and disadvantages as the ACR Asian Index. However the ACR Asian Index encompasses the trade measured by the ACR New South Wales index hence the ACR Asian Index would be a preferred choice.
Barlow Jonker Index (Spot)
This index has been produced by Barlow Jonker since 1986. The BJI has a strong reputation and a reasonably long history of operation, and reflects the spot sales out of Newcastle. The index is standardised for quality. The information for the index is based on Expert panel review, and also globalCOAL and coalinQ records (discussed subsequently). The overall volume of trade reflected in the
Proposed Escalation Indices 8
BJI was 36 million tonnes in 2005 out of a total of around 110 million tonnes of steam coal exported out of Australia in the same year.
The key concerns on the BJI stem from the high volatility since it exclusively captures spot sales and does not reflect the kind of long-term market arrangements appropriate to an enterprise that must ensure continuity of supply. Hence, the BJI can at best form a part of a hybrid index comprising other representative indices as well.
globalCOAL NEWC (Spot)
The globalCOAL NEWC index began in July 2002 and is an authoritative measure of spot thermal coal prices out of Newcastle, standardized for quality. The standard contract is for Spot FOB Newcastle 6700kcal/kg GAD. The index is a weekly publication based on a formula based on e-commerce transactions, bids and offers. globalCOAL has major buyer and suppliers of coal as it sponsors. The index is independent and robust and is also the basis of futures swap trading. The globalCOAL e-commerce website facilitates trading in thermal coal futures based on the globalCOAL spot market. The overall quantum of trade captured by the index in 2005 was 36 million tonnes. However, the index has a drawback that it has a fairly limited history, and hence may not be well suited for use for bid evaluation.
The data series for the Australian coal indices has been analysed by CERC. However as the data paid for and is sourced on a single user subscription, it can not be made available for public dissemination.
Indices Measuring Spot Export Prices from South Africa
South African coal exports all go through Richards Bay, and are overwhelmingly of thermal coal to Europe. Relatively small tonnages are shipped to destinations in the Indo-Pacific region. This is likely to remain the case unless there is a substantial reduction in European demand or significant new investments in mines to cater to the growing Indian market.
South African Steam Coal (SASC) Index
The South African Steam Coal (SASC) Index published by Barlow Jonker is a monthly index of the price of spot thermal coal exported from Richards Bay Coal Terminal for customers in the European market. The index is related to a base 100.00 at January 1986 when the price was US$30 per tonne FOB. The coal quality which relates to this index is for coal of CV 6000kcal/kg NAR, ash 15% maximum and Sulphur 0.8% maximum. It captured 57 Mt of coal shipped to Europe during 2005. The index was launched on 1 April 1986 and offers the longest time series data for South African coal exports.

Proposed Escalation Indices 9
Richard’s Bay API 4 Index
Richards’s Bay API 4 Index is a weekly price index started in 2001 based on the standard contract of Spot FOB Richard’s Bay, at 6000 kcal / kg GAD to the European market. The Richard’s Bay API 4 Index is published weekly in the Argus/McCloskey Coal Price Index Report for South African coal exports from Richards Bay. It is determined as the simple arithmetic mean of three independent assessments of the spot FOB price of a standard quality thermal coal by Argus Coal Daily International, McCloskey’s Coal Report and South African Coal Report. The Richards Bay API 4 Index captured around 57 million tonnes of coal exported to Europe in 2005. This index is the most robust and independent for the purposes of financial futures / swaps and is used as a basis for thermal coal futures trading conducted by Intercontinental Exchange (ICE). However, the index has a drawback that it has a fairly limited history, and hence may not be well suited for use for bid evaluation.
The data series for the South African Steam Coal (SASC) Index and Richard’s Bay API 4 has been analysed by CERC. However as the data paid for and is sourced on a single user subscription, it can not be made available for public dissemination.
Producer Price Index (PPI) for Coal Mining Inputs in Australia
Adoption of the producer price index for a supply source like Australia becomes relevant under the following circumstances;
a large proportion of the supplies is expected from the source country whose PPI indices are proposed to be utilised; and
The underlying operations or contracts are expected to reflect the changes in the PPI.
Review on the first count reveals that Australia has the potential to emerge as the predominant source of coal supplies for Indian power projects based on imported coal. This is on account of a several factors, including a high Proven Reserves to Production ratio (213 years for Australia as compared to 37 years for Indonesia – refer Appendix A for more details), a stable fiscal regime, and the logistics issues involved – particularly in relation to shipping.
On the second count, it is expected that in view of the long term nature and large volume of requirements, backward investments by power producers into coal mining operations would be a natural choice, in which case indexation to input costs in a certain measure would be of advantage to the power producer. This would mitigate the risks of the coal mining operations due to coverage of input cost escalations through the PPI, and would in turn help in financing the mining projects.
For the Indian consumer, adoption of the PPI of a source country is likely to provide a certain degree of price stability through reduced exposure to spot market prices of coal. However, the suitability of the PPI for inclusion would
Proposed Escalation Indices 10
depend heavily upon the willingness of the coal suppliers to link supply prices to the PPI.
The PPI data published by the Australia Bureau of Statistics (ABS) is a reliable source of information in this regard. In addition to the composite PPI statistics, the ABS also publishes the PPI data for input costs for open cut and underground mining. If utilised, the data would however need to be normalised for relative changes in the USD and AUD currencies.
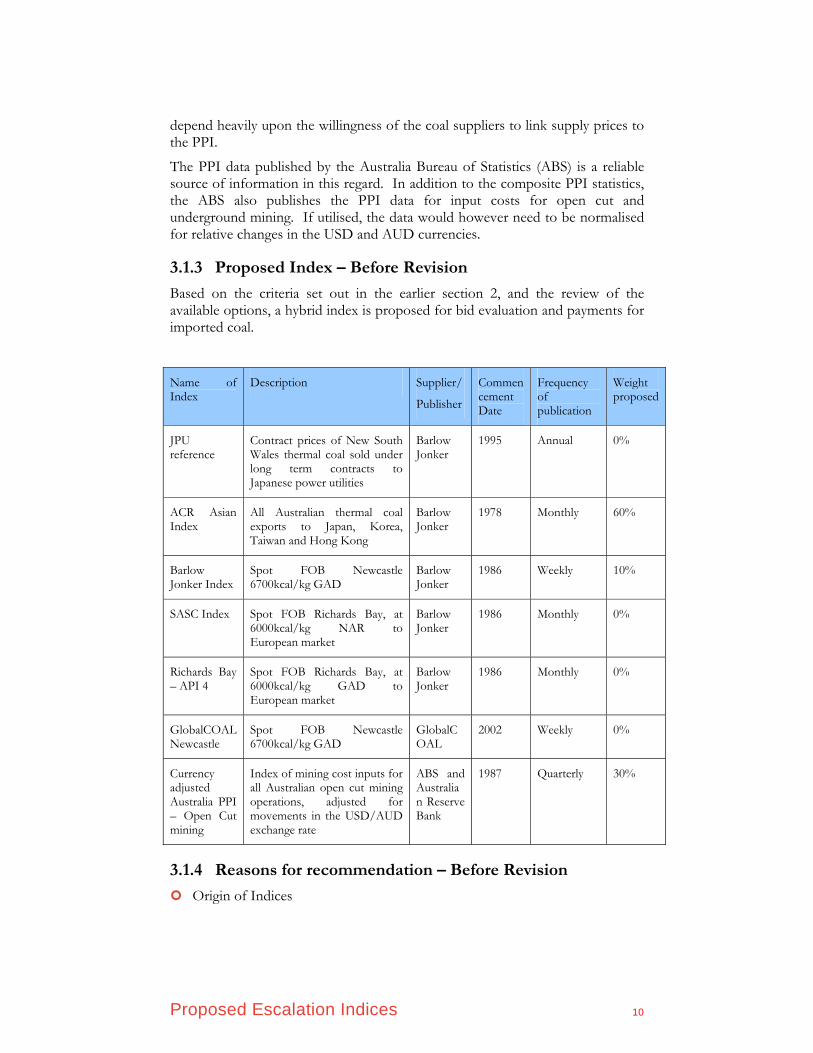
3.1.3 Proposed Index – Before Revision
Based on the criteria set out in the earlier section 2, and the review of the available options, a hybrid index is proposed for bid evaluation and payments for imported coal.
Name of Index
Description Supplier/
Publisher
Commencement Date
Frequency of publication
Weight proposed
JPU reference
Contract prices of New South Wales thermal coal sold under long term contracts to Japanese power utilities
Barlow Jonker
1995 Annual 0%
ACR Asian Index
All Australian thermal coal exports to Japan, Korea, Taiwan and Hong Kong
Barlow Jonker
1978 Monthly 60%
Barlow Jonker Index
Spot FOB Newcastle 6700kcal/kg GAD
Barlow Jonker
1986 Weekly 10%
SASC Index Spot FOB Richards Bay, at 6000kcal/kg NAR to European market
Barlow Jonker
1986 Monthly 0%
Richards Bay – API 4
Spot FOB Richards Bay, at 6000kcal/kg GAD to European market
Barlow Jonker
1986 Monthly 0%
GlobalCOAL Newcastle
Spot FOB Newcastle 6700kcal/kg GAD
GlobalCOAL
2002 Weekly 0%
Currency adjusted Australia PPI – Open Cut mining
Index of mining cost inputs for all Australian open cut mining operations, adjusted for movements in the USD/AUD exchange rate
ABS and Australian Reserve Bank
1987 Quarterly 30%
3.1.4 Reasons for recommendation – Before Revision
Origin of Indices

Proposed Escalation Indices 11
• Australia is likely to be the primary source of much of the coal supplies to India for the volumes involved;
• Even for Indonesian coal supplies, the current practice is to adopt Australian coal indices for contracts. Indonesian indices currently available are unreliable and have very short history;
• South African coal exports are largely to the European markets. The small proportion of exports to Asia (7-8%) use Australian indices as reference. Published indices for South Africa are based exclusively on sales of coal to Europe.
Choice of indices
• The JPU index is the sole index reflecting long term contracts. However the discontinuation of the JPU reference system and progressively diminishing importance make it an inappropriate choice;
• Among coal indices a combination of ACR Asian Index (60%), and BJI (10%) are proposed to ensure that current relative trade volumes at this stage are largely reflected in the weightages. A combination of indices also ensures that in event one of them is discontinued, the others are still available for computing the reference prices;
• The Australian PPI is proposed for inclusion for the reasons discussed in the section describing the index. A 30% weightage is proposed at this stage. A higher weightage could result in large divergence from the market prices of coal over a period of time. Significantly lower weightage than the levels proposed could reduce the benefits of adoption of the index; and
• All indices proposed have a 20 year history at the minimum.
3.1.5 Proposed Index – After Revision
Based on the feedback / comments obtained from stakeholders / other market participants, and a review of the available options, the revised hybrid index as proposed for payments for imported coal is as follows.
Name of Index
Description Supplier/
Publisher
Commencement Date
Frequency of publication
Weight proposed
Barlow Jonker Index
Spot FOB Newcastle 6700kcal/kg GAD
Barlow Jonker
1986 Weekly 25%
Richards Bay – API 4
Spot FOB Richards Bay, at 6000kcal/kg GAD to European market
Barlow Jonker
1986 Monthly 50%

Proposed Escalation Indices 12
Name of Index
Description Supplier/
Publisher
Commencement Date
Frequency of publication
Weight proposed
GlobalCOAL Newcastle
Spot FOB Newcastle 6700kcal/kg GAD
GlobalCOAL
2002 Weekly 25%
As both API 4 and GlobalCOAL Newcastle have a very short history, they do not lend suitable for past historical trends. Thus for the purposes of bid evaluation, only Barlow Jonker Index is proposed to be used. The other components will be incorporated only when they have a sufficiently long history.
3.1.6 Reasons for Revision
Origin of Indices
• Though Australian indices might be the most representative with respect to coal import to India at present and may be also in the future, it was suggested that the presence of only one source country in the proposed index would give wrong signals to the market and may lead to monopoly like behaviour by Australian suppliers. In the absence of reliable Indonesian indices, an equal weightage to South Africa has been proposed to encourage source diversity.
Choice of indices
• The revised choice of indices has been done accepting the views of stakeholders that the underlying index components should be tradable. Thus the illiquid ACR Asia was dropped even though it was the most representative in terms of the volume of coal trade captured. Similarly API 4 for South Africa has been selected as it is one of the most liquid and traded index.
• The Australian Mining PPI index was dropped based on the feedback that no suppliers are willing to base seaborne trade on this index and the practice was limited to domestic coal contracts in Australia. In addition it was felt that backward integration though a natural strategy was not a feasible option in the current market scenario.
• The revised choice of indices is based on stakeholder’s inputs to allow for generators to enter into back to back fuel supply arrangements. Thus the choice of indices has been revised taking into account acceptability of the proposed index by global coal suppliers in fuel supply arrangements.
• Use of spot indices only to allow for tradability has been done considering the inputs from developers that given tradable indices as escalation benchmarks, they will be able to negotiate a higher proportion of the coal contract under the non-escalable portion.
Proposed Escalation Indices 13
3.2 ESCALATION INDICES FOR TRANSPORTATION CHARGES FOR IMPORTED COAL (OCEAN FREIGHT)
3.2.1 Key Issues
Transportation charges for importing coal primarily has two major components, ship chartering costs and fuel costs for operation of the ships. The key issues are as follows:
the need for inclusion of ocean freight (chartering costs) in the escalable component; and
The appropriate choice of bunker fuel and mechanism for ensuring that volatility of bunker fuel in the recent past does not vitiate the bid evaluation processes.
3.2.2 Ocean freight
3.2.3 Candidate Indices
Among the indices available for Ocean Freight, the Baltic Indices are considered as industry standard. There are several component indices that are available in the family of Baltic Indices including:
The Baltic Dry Index (BDI): Probably the most widely-used general index of the bulk ocean freight market. It is constructed from the Baltic Capesize, Panamax and Supramax indices with equal weightings. The BDI has changed over time and evolved from a predecessor, the Baltic Freight Index (BFI).
The Baltic Capesize Index: Since it is expected that Capesize ships will dominate the trade in question, the inclusion of data relating to smaller ship classes makes the BDI less reflective of movements in the likely cost of ocean transport. Thus the Baltic Capesize Index would provide a much more representative index. It consists of the time charter rates for a basket of ten trade routes – three coal, three iron ore, and four grain routes – covering Atlantic, Pacific, and Atlantic-Pacific zones;
Index constructed from component indices of The Baltic Capesize Index: Two of the component indices of the BCI relate to coal. These could be selected and a new coal Capesize index created. These indices relate to coal shipped to Atlantic coal trade and are not necessarily indicative of Asia-Pacific region markets.
It needs to be noted that the Baltic Indices largely reflect the spot market transactions and not the long term contracts for ship charters. In recent years the market has witnessed tremendous volatility in charter costs, as evident from the following graphic on the Baltic Capesize Index (BCI), which probably serves as the best reference for the present purposes, since much of the cargo is expected to be brought in through large capsize vessels.
Proposed Escalation Indices 14
In practice, it is expected that the successful bidders will negotiate long term time charters (which could be up to 15 years or even more) with ship owners, and not rely on the spot market for the vessels. The volumes involved are large and recurring in nature, and there is a definite need to insulate the power projects from the vagaries of the shipping market in terms of both availability of ships and the chartering costs.
In line with these views and expectations it would be appropriate to exclude the time charter costs while defining the indices for the costs involved.
3.2.4 Bunker fuel
3.2.5 Candidate Indices
Singapore 380 CST Bunker Fuel Price
Singapore is a major fuelling point for shipping in the Asian region, and fuel prices in Singapore are seen as leading indicators. The Singapore 380 CST Bunker Fuel prices indicate the FOB prices of 380cSt bunker fuel (also referred to as IFO 380) ex Singapore wharf.
Cockett Bunker Price Index
This is a daily price index produced by bunker and marine oils supplier Cockett Marine Oil. It is calculated from volume and grade weighted price data from 40 ports around the world. It is published in Lloyd’s List and republished by others such as Bloomberg. The index dates back to 1986.
As compared to the Singapore index, this index carries the disadvantage of being weighted by volumes traded in other regions of the world, which may not be properly reflective of the situation in Asia, and in particular, thermal coal trade to India.
Index from Price Assessment at Other Ports
Prices at other ports such as Tokyo, Hong Kong, Shanghai, and myriad lesser terminals in the region could be considered. However, Singapore is a major international bunkering centre and its price series are quoted when others are not.
3.2.6 Recommendation
Name of Index: The Singapore 380 cSt bunker fuel price.
Description: FOB prices of 380cSt bunker fuel (also referred to as IFO 380) ex Singapore wharf.
Compiler: Clarkson Research

Proposed Escalation Indices 15
Supplier/Publisher: Clarksons’ Shipping Intelligence Network (SIN) can be used as a “one-stop shop” for the BCI and the bunker fuel price, as the subscription will provide access to a long history of both data series, downloadable in MS Excel format.
Other reputable publishers of the same price series could be considered, e.g. Platts (www.platts.com) or Bunkerworld (www.bunkerworld.com).
Clarkson Research Services provides statistical research and analysis for Clarkson shipping brokers as well as offering research to the wider market commercially. Clarksons has a bunker fuel broking arm with a long history. Since 2002, Clarksons has conducted bunker broking through www.Oceanconnect.com – a leading exchange for marine fuels, in which Clarksons has a 4% investment. Other equity owners include major oil companies, shipping companies and trading houses. Clarksons has a long history of prices available, dating back for more than 16 years and there is no reason to believe that this will not continue.
The data series for the Singapore 380 cst bunker price has been analysed by CERC. However as the data paid for and is sourced on a single user subscription, it can not be made available for public dissemination.
3.2.7 Reasons for recommendation
Fuel prices form a significant component of total ocean freight costs.
The main considerations are consumption of bunker fuel (commonly referred to as “bunkers”) used by a ship’s main engines, and marine diesel oil (MDO) used to run generators on a vessel while in port.
Most vessels have unified fuel systems, which allow for use of bunker fuel at sea to power auxiliary engines, while others use diesel also for this duty.
Typically, a Capesize vessel uses 55 tonnes/day – 58tpd for newer ships that achieve higher average speeds.
Fuel consumed for auxiliary engines forms a relatively minor portion (2%) of the total fuel used on a voyage.
Bunker fuel cost is therefore the most significant component of fuel costs, which are the responsibility of the ship charterer.
Various grades and specifications of bunker fuel are available, but shipping brokers and consultants usually refer to the cheaper and heavier 380cSt grade when describing, illustrating, or tracking bunker fuel prices.
Clarkson Research is a reputable supplier of shipping data.
Singapore is a major fuelling point for shipping in the Asian region, and fuel prices in Singapore are seen as leading indicators.
The option exists for switching to other data suppliers, while maintaining consistency in the series, as it is a general quoted reference price.

Proposed Escalation Indices 16
3.3 ESCALATION INDICES FOR INLAND HANDLING FOR IMPORTED COAL
3.3.1 Key Issues
The key issues in identifying a representative index for inland transportation are:
Choice of appropriate index or indices in the absence of a specific configuration of the Inland transportation system and its mode – port, conveyor, railways and road;
Weightage to be attributed to component indices.
3.3.2 Candidate indices
The candidate indices are as follows:
Wholesale Price Index (WPI)
The Wholesale Price Index (WPI) is the most widely used price index in India. It is the only general index capturing price movements in a comprehensive way. It is an indicator of movement in prices of commodities in all trade and transactions. It is also the price index in India which is available on a weekly basis with the shortest possible time lag, i.e., only two weeks. It is due to these attributes that it is widely used in business and industry circles and in Government, and is generally taken as an indicator of the rate of inflation in the economy.
W.P.I though composed on many components, is most commonly used in its aggregated form referred to as Aggregated WPI. It has advantages of being freely, readily available, being the most reliable (as it an aggregate) and most simple to be used.
Disaggregated W.P.I series:
An alternative to using the aggregate WPI is to use the disaggregated components of the WPI. Select individual components can be selected assigned suitable weightages to closely refer the underlying cost elements. Some of the disaggregated components which would be relevant to inland transportation costs include railways, trucks, heavy equipment, diesel etc.
However in absence of information relating to the specific mode of transportation such as conveyor, road, railways (electric or diesel) etc, it is difficult to identify suitable components and assign proper weights. Thus using disaggregated components of the WPI series is not recommended.
Proposed Escalation Indices 17
Consumer Price Index:
Labour Bureau, since its inception, has, inter-alia, been entrusted with the responsibility of compilation and maintenance of the Consumer Price Index Numbers for Industrial Workers (CPI-IW). The CPI-IW purport to measure the temporal change in the retail prices of fixed basket of goods and services being consumed by the target group i.e. an average working class family and thus, is an important indicator of the retail price situation in the country.
This index would closely mirror the labour costs. Depending on the level of automation / mechanisation, labour cost would be a significant proportion of total inland handling costs.
3.3.3 Proposed Index
The following index is proposed for inland transportation of imported coal.
Name/Nature of Index: Hybrid of Aggregated WPI and CPI
Description: Using 60% Weighted Price Index (WPI) and 40% Consumer Price Index (CPI) for Industrial Workers
Compiler: Government of India
Supplier/Publisher: www.eaindustry.nic.in for WPI
http://labourbureau.nic.in for CPI
3.3.4 Reasons for recommendation
A hybrid index incorporating W.P.I and C.P.I is recommended due to the following reasons:
There would be considerable variation between projects on the distance of inland transportation, mechanism adopted (wagons, conveyors), prime movers, energy source, etc. This makes a hybrid index (comprising disaggregated indices from WPI and other elements difficult to compose;
Inland transportation would involve provided of goods and services for transport of fuel within the country;
The WPI would capture the increase in the cost of goods such as equipment and machinery, fuel, electricity, etc;
There is a high correlation between the disaggregated WPI index for transportation and the overall WPI;
CPI would serve as a surrogate measure to capture the increase in the cost of services by measuring the cost increases for industrial labour.
The relative weights attributed to WPI and CPI is the same as those adopted by the CERC for escalation of capacity payments to power generating stations. This has been done after comparison of the component cost profiles of power station operations and inland handling;
Proposed Escalation Indices 18
3.4 ESCALATION INDICES FOR CAPTIVE COAL MINING
3.4.1 Issues
The key costs involved in captive coal mining operations are that of machinery, diesel, tyres, explosives, and labour. These relate not only to the core mining operations, but also that for material handling beyond the mine, crushing and sizing, and transportation to the power plant. For several of these aspects disaggregated WPI series are available. The key issues for consideration are as follows:
Use of Aggregate WPI indices Vs Use of Individual Components
Basis of weights of individual components or indices
3.4.2 Candidate indices
The candidate indices are as follows:
Wholesale Price Index (WPI):
For thermal coal in India, all most all mining is open cast mining. The underlying cost elements and their normative weightings in an open cast mining activity are known with fair accuracy. Thus the use of an aggregated Whole Sale Prices price index is not suitable as it would tend to dilute the importance of the underlying cost elements. Also WPI alone would not capture the labour price increases which are a significant proportion of mining costs.
Disaggregated W.P.I series for Coal:
The relevant indices for this purpose are as below:
Coal Mining Series of WPI - The source of data of this index is likely to be based on (yet to be confirmed) inputs from Coal India. The option is rejected on grounds of reliability and timeliness of data as well as the applicability of public sector monopoly operations with respect to captive coal mining.
Non Coking Coal Series of WPI– Since the prices are set in an administered controlled environment, the price index does not reflect the underlying inflationary pressure on the costs.
Indices for Major Cost Elements in Mining – Tyres, Matches and Explosives, Diesel, Machinery and Machine Tools.
Data for these components of WPI are provided in Appendix D
Consumer Price Index:
Labour cost is an important element in coal mining. However a CPI index alone will not capture the other major non labour cost elements.

Proposed Escalation Indices 19
Hybrid of the Aggregated WPI and the CPI:
A hybrid index was considered, but was rejected on the following grounds.
Coal mining operations are specific in nature where the use of component costs is reasonably known. An index using the aggregated WPI and CPI does not reflect the specific nature of use adequately
Trends in indices for the key elements like Tyres, HSD and Explosives show wide variance with the aggregate WPI, and thus it is necessary to include them separately.
Review of international practices for fuel supply contracts indicates the use of hybrid indices of the nature recommended herein.
3.4.3 Proposed Index –Before Revision
Name/Nature of Index: A hybrid of WPI and CPI, including the component indices of the WPI.
Description: The hybrid index proposed, including the various components and the weights for the same is as follows.
S. No
Heads / Components of Index
Proposed Weight
1 Disaggregated WPI series for tyres
15%
2 Disaggregated WPI series for Machinery & Machine Tools
20%
3 Disaggregated WPI series for HSD Oil
25%
4 Disaggregated WPI series for Matches, Explosives & Other Chemicals
10%
5 WPI series for all commodities
10%
6 CPI 20%
Compiler: Government of India
Supplier/Publisher: www.eaindustry.nic.in for WPI
http://labourbureau.nic.in for CPI

Proposed Escalation Indices 20
3.4.4 Reasons for recommendation – Before Revision
The reasons for recommendation of a hybrid index are as follows:
It is expected that a majority of the coal blocks used for captive mining for the power projects would be open cast mines
While the cost profiles in an open cast mine could vary substantially based on the strip ratio, the seam thickness, nature of mining operations, etc. the component costs are largely around factors like Tyres, Machinery & Machine Tools, HSD, Explosives etc. These are compiled separately in the WPI as component indices and are widely used/available
The approximate ratio of use of these heads in coal mining operations have been reflected in the hybrid index proposed
In addition to the disaggregated WPI indices for the key components, the overall WPI and the CPI have also been reflected to reflect the use of other goods and services in mining of coal, as well as for reflecting the labour component
3.4.5 Proposed Index –After Revision
Name/Nature of Index: A hybrid of WPI and CPI, including the component indices of the WPI.
Description: The hybrid index proposed, including the various components and the weights for the same is as follows.
S. No
Heads / Components of Index
Proposed Weight
1 Disaggregated WPI series for tyres
10%
2 Disaggregated WPI series for Heavy Machinery & Parts
25%
3 Disaggregated WPI series for HSD Oil
25%
4 Disaggregated WPI series for Matches, Explosives & Other Chemicals
10%
5 WPI series for all commodities
10%
6 CPI 20%
Compiler: Government of India

Proposed Escalation Indices 21
Supplier/Publisher: www.eaindustry.nic.in for WPI
http://labourbureau.nic.in for CPI
3.4.6 Reasons for Revision
The reasons for the revisions in the proposed hybrid index are as follows:
“Machinery and Machine Tools” component of WPI has been replaced with “Heavy Machinery and Parts” as is better captures the inputs in a coal mining activity.
The weightage of Tyres has been reduced to 10% while that of Heavy Machinery and Parts has been proposed at 25%. This has been based on the feedback on cost components received from stakeholders / market participants in the power sector.
Application of Indices 22
4 Application of Indices
4.1 APPLICATION FOR BID EVALUATION
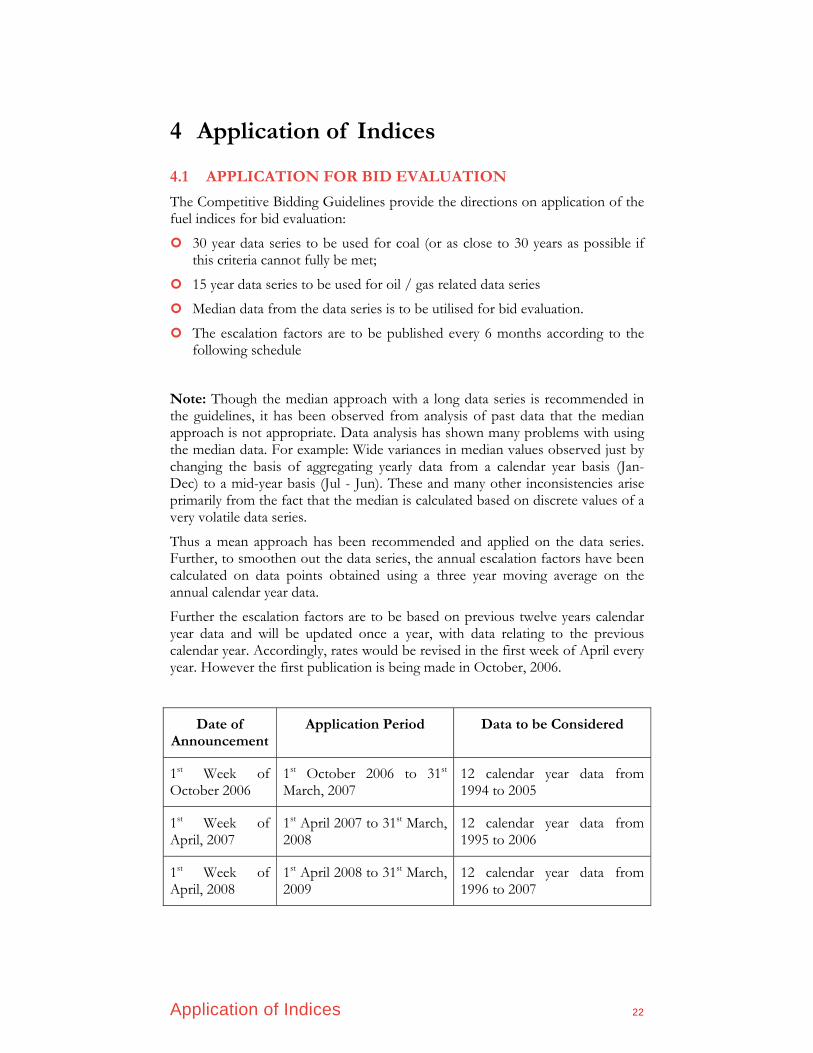
The Competitive Bidding Guidelines provide the directions on application of the fuel indices for bid evaluation:
30 year data series to be used for coal (or as close to 30 years as possible if this criteria cannot fully be met;
15 year data series to be used for oil / gas related data series
Median data from the data series is to be utilised for bid evaluation.
The escalation factors are to be published every 6 months according to the following schedule
Note: Though the median approach with a long data series is recommended in the guidelines, it has been observed from analysis of past data that the median approach is not appropriate. Data analysis has shown many problems with using the median data. For example: Wide variances in median values observed just by changing the basis of aggregating yearly data from a calendar year basis (Jan- Dec) to a mid-year basis (Jul - Jun). These and many other inconsistencies arise primarily from the fact that the median is calculated based on discrete values of a very volatile data series.
Thus a mean approach has been recommended and applied on the data series. Further, to smoothen out the data series, the annual escalation factors have been calculated on data points obtained using a three year moving average on the annual calendar year data.
Further the escalation factors are to be based on previous twelve years calendar year data and will be updated once a year, with data relating to the previous calendar year. Accordingly, rates would be revised in the first week of April every year. However the first publication is being made in October, 2006.
Date of Announcement
Application Period Data to be Considered
1st Week of October 2006
1st October 2006 to 31st March, 2007
12 calendar year data from 1994 to 2005
1st Week of April, 2007
1st April 2007 to 31st March, 2008
12 calendar year data from 1995 to 2006
1st Week of April, 2008
1st April 2008 to 31st March, 2009
12 calendar year data from 1996 to 2007

Application of Indices 23
For each of the underlying indices / index components, 12 annual average data points corresponding to calendar years 1994 to 2005 (both inclusive) has been considered, giving 10 data points relating to the three year moving average, on which 9 yearly escalation factors have been calculated. The mean of the 9 escalation factors is the proposed escalation value to be used for bid evaluation for that index / index component.
Based on the above criteria, and the indices proposed for application, the resultant escalation indices for the various elements are as follows.
4.1.1 Bid Evaluation Escalation Rate for Imported Coal – Before Revision
The hybrid index proposed is as follows
C = 0.6 * C1 + 0.1 * C2 + 0.3*C3, where
C1 = Mean Escalation of ACR Asia Index Series
C2 = Mean Escalation of BJI
C3 = Mean Escalation of currency inflation adjusted Open Cut Mining PPI of Australia
The mean values of each index, and their contribution to the composition of the overall index is as below,
Component Index
Data Series Mean Escalation Rate
Weight Contribution to index
C1 12 years (Jan 1994 to Dec 2005)
0.80% 0.6 0.48%
C2 12 years (Jan 1994 to Dec 2005)
3.46% 0.1 0.35%
C3 12 years (Jan 1994 to Dec 2005)
2.34% 0.3 0.70%
Proposed Bid Evaluation Escalation Rate 1.53%

Application of Indices 24
Appendix B provides the Open Cut Mining PPI index escalation data as used for evaluation. Data related to other components can not be made public.
4.1.2 Bid Evaluation Escalation Rate for Imported Coal – After Revision
Out of the three component indices proposed for the revised hybrid index for imported coal namely API 4, GlobalCOAL Newcastle and BJI only the latter has a sufficiently long history to discern a historical trend.
Thus the index proposed for bid evaluation is as follows:
C = Mean Escalation of BJI
The value of the index for bid evaluation, using the methodology specified is as below,
Component Index
Data Series Mean Escalation Rate
Weight Contribution to index
C 12 years (Jan 1994 to Dec 2005)
3.46% 1.00 3.46%
Proposed Bid Evaluation Escalation Rate 3.46%
The other two components may be incorporated in due course of time in the hybrid index for the purposes of bid evaluation once a sufficiently long data series is available.
4.1.3 Bid Evaluation Escalation Rate for Transportation Costs for Imported Coal (Ocean Freight)
The index proposed is the Singapore 380 CST Bunker Fuel Index published by Clarkson.
D = Mean Escalation of Singapore CST Bunker Fuel Index
The value of the index for bid evaluation, using the methodology specified is as below,

Application of Indices 25
Component Index
Data Series Mean Escalation Rate
Weight Contribution to index
D 12 years (Jan 1994 to Dec 2005)
9.08% 1.0 9.08%
Proposed Bid Evaluation Escalation Rate 9.08%
Appendix C provides the data series and calculation of escalation factors for WPI and CPI series as applied for bid evaluation.
4.1.4 Bid Evaluation Escalation Rate for Inland Handling of Imported Coal
The index proposed is a hybrid index comprising of the Wholesale Price Index (WPI) and the Consumer Price Index (CPI). The value of the index for bid evaluation, using the methodology specified is as below.
The hybrid index proposed is as follows
E = 0.6 * E1 + 0.4 * E2, where
E1 = Mean Escalation of Aggregated WPI series
E2 = Mean Escalation of CPI-IW series
The mean values of each index, and their contribution to the composition of the overall index is as below,
Component Index
Data Series Mean Escalation Rate
Weight Contribution to index
E1 12 years (Jan 1994 to Dec 2005)
4.96% 0.6 2.98%
E2 12 years (Jan 1994 to Dec 2005)
5.98% 0.4 2.39%
Proposed Bid Evaluation Escalation Rate 5.37%*
Application of Indices 26
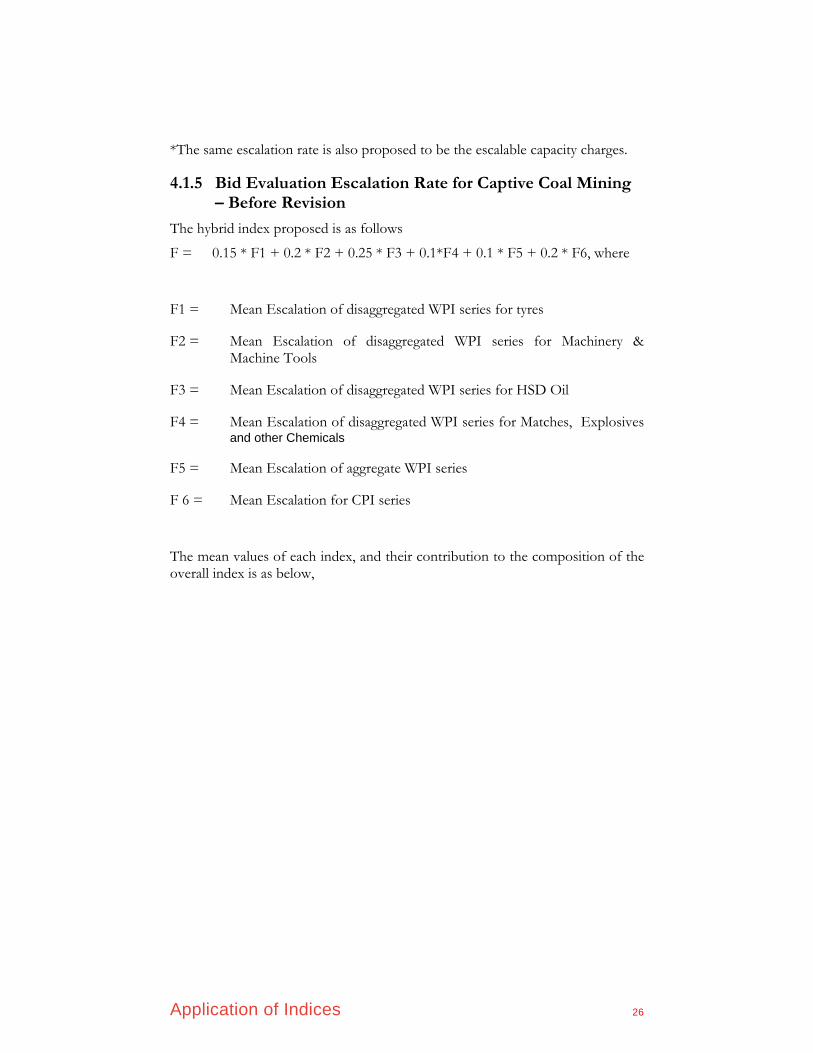
*The same escalation rate is also proposed to be the escalable capacity charges.
4.1.5 Bid Evaluation Escalation Rate for Captive Coal Mining – Before Revision
The hybrid index proposed is as follows
F = 0.15 * F1 + 0.2 * F2 + 0.25 * F3 + 0.1*F4 + 0.1 * F5 + 0.2 * F6, where
F1 = Mean Escalation of disaggregated WPI series for tyres
F2 = Mean Escalation of disaggregated WPI series for Machinery & Machine Tools
F3 = Mean Escalation of disaggregated WPI series for HSD Oil
F4 = Mean Escalation of disaggregated WPI series for Matches, Explosives and other Chemicals
F5 = Mean Escalation of aggregate WPI series
F 6 = Mean Escalation for CPI series
The mean values of each index, and their contribution to the composition of the overall index is as below,
Application of Indices 27
Component Index
Length Data Series (yrs)
Mean Escalation Rate
Weight Contribution to index
F1 12 years (Jan 1994 to Dec 2005)
0.21% 0.15 0.03%
F2 12 years (Jan 1994 to Dec 2005)
2.58% 0.2 0.52%
F3 12 years (Jan 1994 to Dec 2005)
13.65% 0.25 3.41%
F4 12 years (Jan 1994 to Dec 2005)
2.59% 0.10 0.26%
F5 12 years (Jan 1994 to Dec 2005)
4.96% 0.10 0.50%
F6 12 years (Jan 1994 to Dec 2005
5.98% 0.20 1.20%
Proposed Bid Evaluation Escalation Rate 5.91%
4.1.6 Bid Evaluation Escalation Rate for Captive Coal Mining – After Revision
The hybrid index proposed is as follows
F = 0.10 * F1 + 0.25 * F2 + 0.25 * F3 + 0.1*F4 + 0.1 * F5 + 0.2 * F6, where
F1 = Mean Escalation of disaggregated WPI series for tyres
F2 = Mean Escalation of disaggregated WPI series for Heavy Machinery & Parts
F3 = Mean Escalation of disaggregated WPI series for HSD Oil
F4 = Mean Escalation of disaggregated WPI series for Matches, Explosives and other Chemicals

Application of Indices 28
F5 = Mean Escalation of aggregate WPI series
F 6 = Mean Escalation for CPI series
The mean values of each index, and their contribution to the composition of the overall index is as below,
Component Index
Length Data Series (yrs)
Mean Escalation Rate
Weight Contribution to index
F1 12 years (Jan 1994 to Dec 2005)
0.21% 0.10 0.02%
F2 12 years (Jan 1994 to Dec 2005)
4.92% 0.25 1.23%
F3 12 years (Jan 1994 to Dec 2005)
13.65% 0.25 3.41%
F4 12 years (Jan 1994 to Dec 2005)
2.59% 0.10 0.26%
F5 12 years (Jan 1994 to Dec 2005)
4.96% 0.10 0.50%
F6 12 years (Jan 1994 to Dec 2005
5.98% 0.20 1.20%
Proposed Bid Evaluation Escalation Rate 6.61%
4.2 APPLICATION FOR PAYMENT PURPOSES
4.2.1 Guiding Principles
We propose the following principles for the purpose of payments.
Application of Indices 29
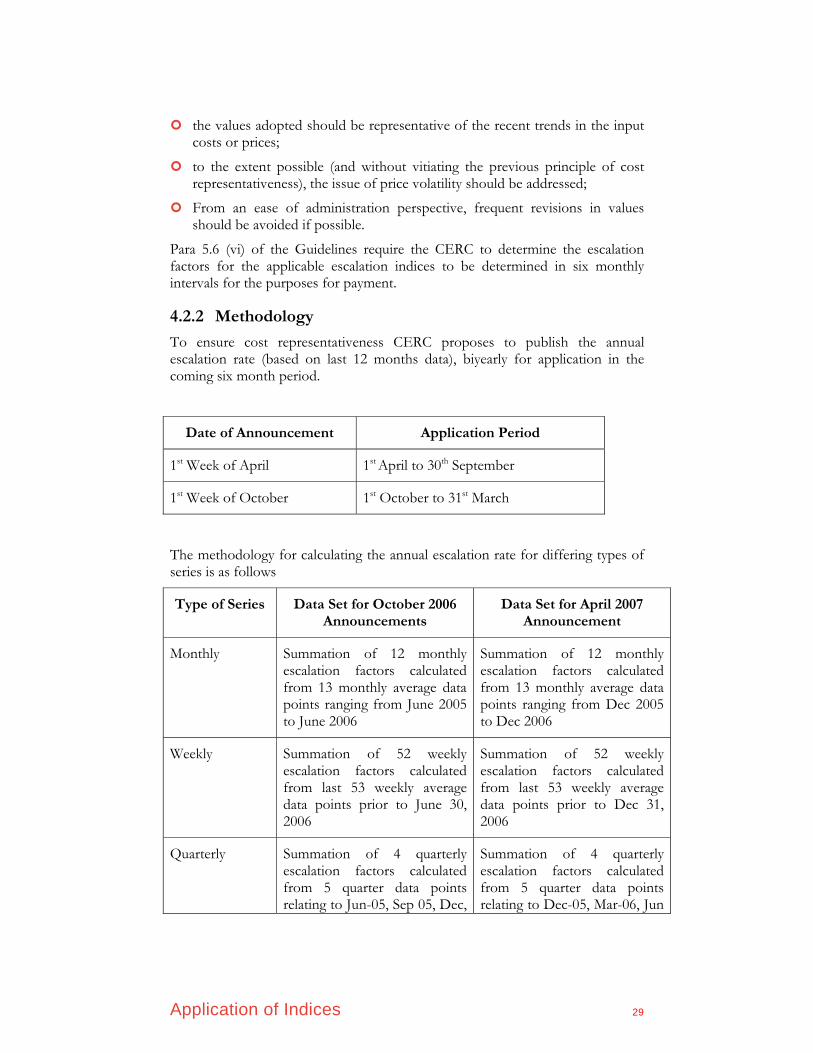
the values adopted should be representative of the recent trends in the input costs or prices;
to the extent possible (and without vitiating the previous principle of cost representativeness), the issue of price volatility should be addressed;
From an ease of administration perspective, frequent revisions in values should be avoided if possible.
Para 5.6 (vi) of the Guidelines require the CERC to determine the escalation factors for the applicable escalation indices to be determined in six monthly intervals for the purposes for payment.
4.2.2 Methodology
To ensure cost representativeness CERC proposes to publish the annual escalation rate (based on last 12 months data), biyearly for application in the coming six month period.
Date of Announcement Application Period
1st Week of April 1st April to 30th September
1st Week of October 1st October to 31st March
The methodology for calculating the annual escalation rate for differing types of series is as follows
Type of Series Data Set for October 2006 Announcements
Data Set for April 2007 Announcement
Monthly Summation of 12 monthly escalation factors calculated from 13 monthly average data points ranging from June 2005 to June 2006
Summation of 12 monthly escalation factors calculated from 13 monthly average data points ranging from Dec 2005 to Dec 2006
Weekly Summation of 52 weekly escalation factors calculated from last 53 weekly average data points prior to June 30, 2006
Summation of 52 weekly escalation factors calculated from last 53 weekly average data points prior to Dec 31, 2006
Quarterly Summation of 4 quarterly escalation factors calculated from 5 quarter data points relating to Jun-05, Sep 05, Dec,
Summation of 4 quarterly escalation factors calculated from 5 quarter data points relating to Dec-05, Mar-06, Jun

Application of Indices 30
05, Mar-06 and Jun-06 -06, Sep-06 and Dec - 06
The annual escalation rate as announced would be converted to a monthly rate by dividing by 12. It will then applied on a simple basis (not compounding) for the following sixth month period.
Example:
October Announcement (Financial Year 2006-07)
Annual Inflation rate: 12%
Monthly Rate = 12% / 12 = 1%
Base Value for the financial year = 100
Starting Base Value for the six month period of the year = 100
Escalated Value for Month N (N=1 to 6) =
Starting Base Value + N*(Base Value for the Financial year *Monthly Rate)
= 100+N*(100*1%)
If the escalation is to be applied from the month of December, then the escalated values for the December, January, February and March will be 101, 102, 103 and 104, respectively. From April onwards a new financial year starts and therefore, the base value for the new financial year shall be 104.
April Announcement (Financial Year 2007-08)
Yearly rate: 15%
Monthly Rate = 15% / 12 = 1.25%
Base Value for the financial year = 104
Starting Base Value for the six month period of the year = 104
Escalated Value for Month N (N=1 to 6) =
Starting Base Value + N*(Base Value for the Financial year *Monthly Rate)
= 104+N*(104*1.25%)
Thus the escalated values for the following six months, April to September, will be 105.30, 106.60, 107.90, 109.20, 110.50 and 111.80 respectively.
October Announcement (Financial Year 2007-08)
Yearly rate: 9%
Monthly Rate = 9% / 12 = 0.75%
Base Value for the financial year = 104
Starting Base Value for the six month period of the year = 111.80
Escalated Value for Month N (N=1 to 6) =
Starting Base Value + N*(Base Value for the Financial year *Monthly Rate)

Application of Indices 31
= 111.80+N*(104*0.75%)
Thus the escalated values for the following six months, October to March, will be 112.58, 113.36, 114.14, 114.92, 115.7 and 116.48 respectively.
4.2.3 Payment Escalation Rate for Imported Coal – Before Revision
The escalation rate proposed is as follows
C = 0.6 * C1 + 0.1 * C2 + 0.3*C3, where
C1 = Sum of 12 Monthly Escalation rates of ACR Asia Index Series
C2 = Sum of 52 Weekly Escalation rates of BJI
C3 = Sum of 4 Quarterly Escalation rates of currency inflation adjusted Open Cut Mining PPI of Australia
The annual escalation rate of each component and their contribution to the overall rate is as below,
Component Index
Data Series Annual Escalation Rate
Weight Contribution to index
C1 Monthly average data points ranging from June 2005 to June 2006
-1.96% 0.6 -1.18%
C2 Monthly average data points ranging from June 2005 to June 2006
1.47% 0.1 0.15%
C3 Monthly average data points ranging from June
8.90% 0.3 2.67%
Application of Indices 32
2005 to June 2006
Proposed Payment Escalation Rate 1.64%
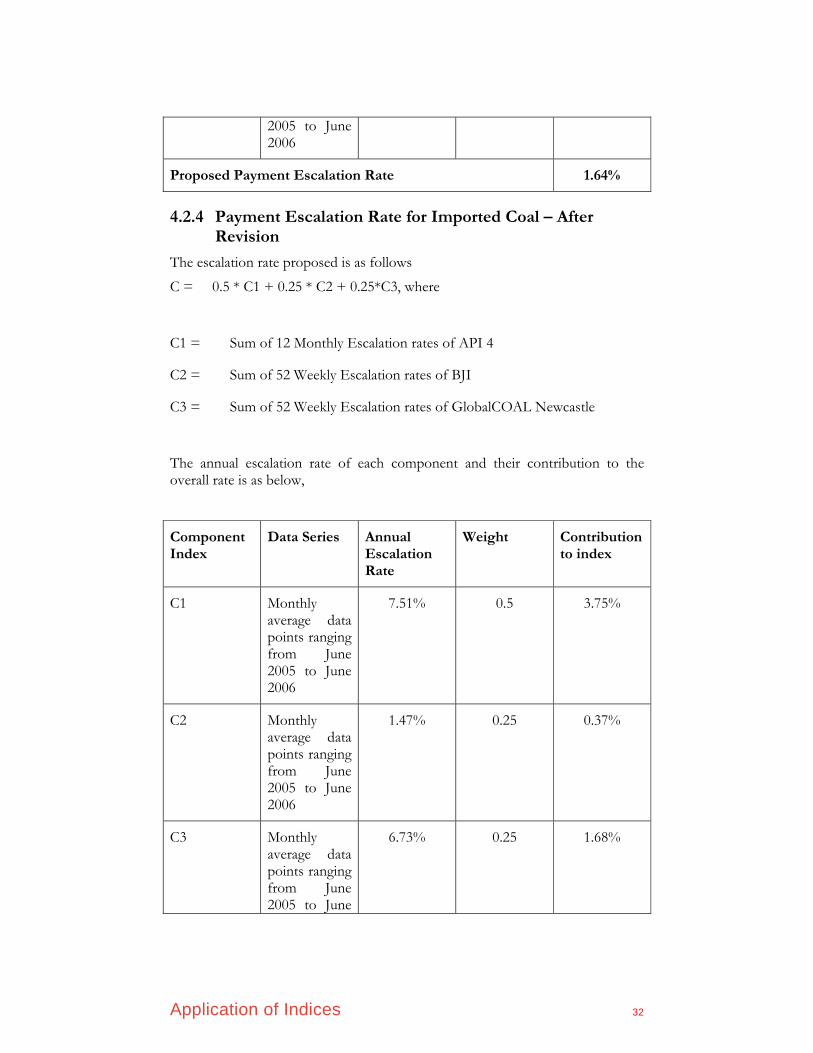
4.2.4 Payment Escalation Rate for Imported Coal – After Revision
The escalation rate proposed is as follows
C = 0.5 * C1 + 0.25 * C2 + 0.25*C3, where
C1 = Sum of 12 Monthly Escalation rates of API 4
C2 = Sum of 52 Weekly Escalation rates of BJI
C3 = Sum of 52 Weekly Escalation rates of GlobalCOAL Newcastle
The annual escalation rate of each component and their contribution to the overall rate is as below,
Component Index
Data Series Annual Escalation Rate
Weight Contribution to index
C1 Monthly average data points ranging from June 2005 to June 2006
7.51% 0.5 3.75%
C2 Monthly average data points ranging from June 2005 to June 2006
1.47% 0.25 0.37%
C3 Monthly average data points ranging from June 2005 to June
6.73% 0.25 1.68%

Application of Indices 33
2006
Proposed Payment Escalation Rate 5.80%
4.2.5 Payment Escalation Rate for Transportation Costs for Imported Coal (Ocean Freight)
The payment rate proposed is based on the Singapore 380 CST Bunker Fuel Index published by Clarkson.
D = Sum of 12 Monthly Escalation rates of Singapore CST Bunker Fuel Index
The value of the rate for payment is as below,
Component Index
Data Series Annual Escalation Rate
Weight Contribution to index
D Monthly average data points ranging from June 2005 to June 2006
26.43% 1.0 26.43%
Proposed Payment Escalation Rate 26.43%
4.2.6 Payment Escalation Rate for Inland Handling for Imported Coal
The escalation rate proposed is as follows
E = 0.6 * E1 + 0.4 * E2, where
E1 = Sum of 12 Monthly Escalation Rates of Aggregated WPI series
E2 = Sum of 12 Monthly Escalation Rates of CPI-IW series
The annual escalation rate of each component and their contribution to the overall rate is as below,

Application of Indices 34
Component Index
Data Series Annual Escalation Rate
Weight Contribution to index
E1 Monthly average data points ranging from June 2005 to June 2006
5.03% 0.6 3.02%
E2 Monthly average data points ranging from June 2005 to June 2006
7.43% 0.4 2.97%
Proposed Payment Escalation Rate 5.99%
Data on rates that are to be applicable currently is provided as Annexure E.
4.2.7 Payment Escalation Rate for Captive Coal Mining – Before Revision
The hybrid rate proposed is as follows
F = 0.15 * F1 + 0.2 * F2 + 0.25 * F3 + 0.1*F4 + 0.1 * F5 + 0.2 * F6, where
F1 = Sum of 12 Monthly Escalation rates of disaggregated WPI series for tyres
F2 = Sum of 12 Monthly Escalation rates of disaggregated WPI series for Machinery & Machine Tools
F3 = Sum of 12 Monthly Escalation rates of disaggregated WPI series for HSD Oil
F4 = Sum of 12 Monthly Escalation rates of disaggregated WPI series for Matches, Explosives and other Chemicals
F5 = Sum of 12 Monthly Escalation rates of Aggregate WPI series
F 6 = Sum of 12 Monthly Escalation rates of CPI series for Industrial Worker

Application of Indices 35
The annual escalation rate of each component and their contribution to the overall rate is as below,
Component Index
Length Data Series (yrs)
Annual Escalation Rate
Weight Contribution to index
F1 Monthly average data points ranging from June 2005 to June 2006
4.50% 0.15 0.68%
F2 Monthly average data points ranging from June 2005 to June 2006
3.70% 0.2 0.78%
F3 Monthly average data points ranging from June 2005 to June 2006
17.90% 0.25 4.48%
F4 Monthly average data points ranging from June 2005 to June 2006
3.39% 0.10 0.34%
F5 Monthly average data points ranging from June 2005 to June 2006
5.03% 0.10 0.50%
F6 Monthly average data points ranging from June
7.43% 0.20 1.49%

Application of Indices 36
2005 to June 2006
Proposed Payment Escalation Rate 8.22%
4.2.8 Payment Escalation Rate for Captive Coal Mining – After Revision
The hybrid rate proposed is as follows
F = 0.11 * F1 + 0.25 * F2 + 0.25 * F3 + 0.1*F4 + 0.1 * F5 + 0.2 * F6, where
F1 = Sum of 12 Monthly Escalation rates of disaggregated WPI series for tyres
F2 = Sum of 12 Monthly Escalation rates of disaggregated WPI series for Heavy Machinery & Parts
F3 = Sum of 12 Monthly Escalation rates of disaggregated WPI series for HSD Oil
F4 = Sum of 12 Monthly Escalation rates of disaggregated WPI series for Matches, Explosives and other Chemicals
F5 = Sum of 12 Monthly Escalation rates of Aggregate WPI series
F 6 = Sum of 12 Monthly Escalation rates of CPI series for Industrial Worker
The annual escalation rate of each component and their contribution to the overall rate is as below,
Component Index
Length Data Series (yrs)
Annual Escalation Rate
Weight Contribution to index
F1 Monthly average data points ranging from June 2005 to June 2006
4.50% 0.10 0.45%
F2 Monthly average data points ranging from June
-0.30% 0.25 -0.08%

Application of Indices 37
2005 to June 2006
F3 Monthly average data points ranging from June 2005 to June 2006
17.90% 0.25 4.48%
F4 Monthly average data points ranging from June 2005 to June 2006
3.39% 0.10 0.34%
F5 Monthly average data points ranging from June 2005 to June 2006
5.03% 0.10 0.50%
F6 Monthly average data points ranging from June 2005 to June 2006
7.43% 0.20 1.49%
Proposed Payment Escalation Rate 7.18%
Data on rates that are to be applicable currently is provided as Annexure F.

Application of Indices 38
4.3 METHODOLOGY FOR UPDATION OF THE INDICES
As far as possible, the composition of the indices and the inter-se weightage of the component indices in a hybrid index should not be altered unless it becomes very essential to do so. This stability is vital for providing certainty of payments to the investors in the power projects.
There could however be certain situations where the revision of the indices could become necessary. Such situations could include:
Obsolescence of a component index – This could happen when an index is discontinued, or becomes unrepresentative due to low volumes of trade covered. While the indices selected are expected to have sufficient stability and reliability (they have a long history, and are published by Government Agencies or reputed institutions), in such unlikely event it could become necessary to modify the composition of the index;
Major shifts in trade – For example, South African coal indices are not proposed to be included due to the lack of volumes in Asian supplies, and the absence of an index for Asian supplies. However, should there be a shift wherein South African coal becomes a predominant source of supply to India, changes to the methodology could become necessary;
Significant shifts in cost components – Such shifts, if any, in the component costs over time could call for a change of inter-se weightages in a hybrid index (e.g., for captive coal mining).
As mentioned at the outset, changes should be avoided as far as possible. However, should a change become essential for cost representativeness or market efficiency, it would be advisable to limit the changes to inter-se weights among the indices. If, for example, a component index for coal imports is discontinued, the weightages attributed to that component index in the prevailing formula should be redistributed among the other component indices. Only when it becomes unviable to undertake such redistribution, should the composition of an index be changed.
For all changes in index composition or weightages, the CERC would invite views from interested parties, including the public, before making the changes.
4.4 NEED TO ALIGN BID DOCUMENTS WITH PAYMENT METHODOLOGY
In order to bring clarity and consistency for the purposes of payment it is recommended that the payment methodology described under section 4.2 and 4.3 of this report, after finalisation should be suitably incorporated in the bid documents.
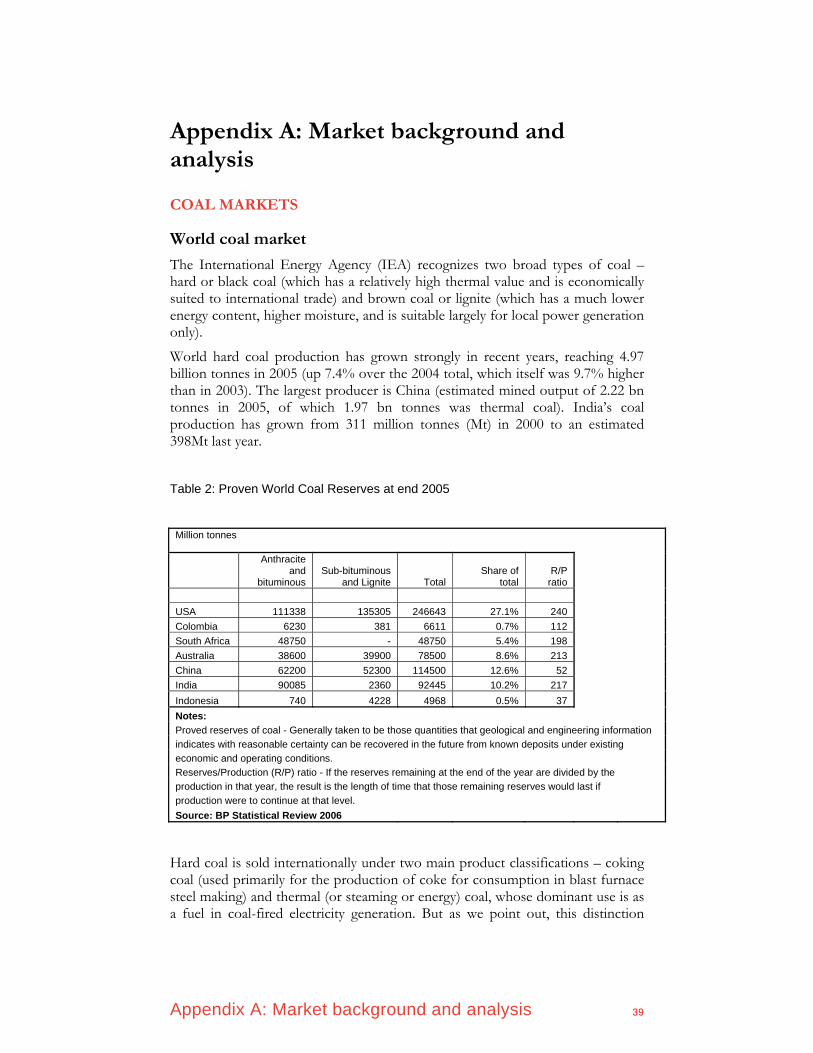
Appendix A: Market background and analysis 39
Appendix A: Market background and analysis
COAL MARKETS
World coal market
The International Energy Agency (IEA) recognizes two broad types of coal – hard or black coal (which has a relatively high thermal value and is economically suited to international trade) and brown coal or lignite (which has a much lower energy content, higher moisture, and is suitable largely for local power generation only).
World hard coal production has grown strongly in recent years, reaching 4.97 billion tonnes in 2005 (up 7.4% over the 2004 total, which itself was 9.7% higher than in 2003). The largest producer is China (estimated mined output of 2.22 bn tonnes in 2005, of which 1.97 bn tonnes was thermal coal). India’s coal production has grown from 311 million tonnes (Mt) in 2000 to an estimated 398Mt last year.
Table 2: Proven World Coal Reserves at end 2005
Million tonnes
Anthracite and
bituminous Sub-bituminous
and Lignite Total Share of
total R/P
ratio USA 111338 135305 246643 27.1% 240 Colombia 6230 381 6611 0.7% 112 South Africa 48750 - 48750 5.4% 198 Australia 38600 39900 78500 8.6% 213 China 62200 52300 114500 12.6% 52 India 90085 2360 92445 10.2% 217 Indonesia 740 4228 4968 0.5% 37 Notes: Proved reserves of coal - Generally taken to be those quantities that geological and engineering information indicates with reasonable certainty can be recovered in the future from known deposits under existing economic and operating conditions. Reserves/Production (R/P) ratio - If the reserves remaining at the end of the year are divided by the production in that year, the result is the length of time that those remaining reserves would last if production were to continue at that level. Source: BP Statistical Review 2006
Hard coal is sold internationally under two main product classifications – coking coal (used primarily for the production of coke for consumption in blast furnace steel making) and thermal (or steaming or energy) coal, whose dominant use is as a fuel in coal-fired electricity generation. But as we point out, this distinction

Appendix A: Market background and analysis 40
becomes blurred in reported trade statistics, and the term metallurgical coal is also used, embracing coking coal and some thermal grades that may also be used in iron making.
World hard coal trade was estimated at 775Mt in 2005, up 4.2% on the previous year. Of this total, around 550Mt was steaming coal. Seaborne coal trade has been growing at over 5% per year for the last two decades (702Mt in 2005). Global trade has become more regionalized in recent years: last year the Asia Pacific market accounted for 405Mt of which 284Mt was thermal coal.
Traditionally, coking coals command price premiums over thermal coals that reflect higher carbon contents. The largest exporters of thermal coal are Australia, Indonesia, China and South Africa, and unit prices for these exports have risen strongly in recent years
Sources of thermal coal for Indian power projects
India has proved recoverable reserves of over 90 billion tonnes of hard coal. Its estimated annual consumption has risen from 375Mt in 2003 to 435Mt last year (of which 388Mt was thermal coal). The economic attractiveness of India’s coal imports is largely controlled by international coal prices and ocean freight costs as well as the efficiency gains from using lower-ash imported coal. According to the IEA, India imported 17.5Mt of thermal coal last year, up from 10Mt in 2003 and 15Mt in 2004.
For many years, Australia has been India’s most important source of imported coal, but in 2005 was overtaken by Indonesia. Most of the Australia/India trade is, however, in coking coal, and Australia is only a middle ranking supplier of coal for non-coking (predominantly thermal) uses in India. Although Australia is the world’s largest exporter of thermal coal, its exports are largely devoted to its traditional markets in Japan and South Korea, which has allowed Indonesia’s rapidly growing thermal coal export industry to capture most of the emerging Indian market.

Appendix A: Market background and analysis 41
Figure 1: Indian Imports of Thermal Coal CYs 2001-2005
0
2
4
6
8
10
12
14
16
Indonesia South Africa China Australia Other
Source Country
Mill
ion
Tonn
es2001
2002
2003
2004
2005
Source: Tex Report
The following figure shows statistics on international coal trade sourced from the US Energy Administration (EIA) in its “International Energy Outlook 2006”.2
Australian exports dominated the international coal trade in 2004, both overall and in the metallurgical category. But Indonesia, China, and South Africa were posing serious threats to Australia’s former dominance in thermal coal.
2 It should be noted that international coal trade statistics are notoriously bedevilled by classification
issues. There is no clear-cut quality parameter defining coals suited to coke-making, and so customs statistics commonly rely on shippers’ declarations of the ultimate purpose of each cargo, which may be biased by tariff considerations. For example, imports of non-coking coal into India are subject to 5% duty, whereas low (<12%) ash coking coal is duty-free and high ash coking coal is penalised by duty at 15%. In addition, some authorities prefer for their primary classification to distinguish all coal used for metallurgical purposes, rather than simply that devoted to coke making. “Metallurgical coal” generally also includes inferior quality coal used for pulverised coal injection, which under other jurisdictions may be counted as “thermal” uses. The terms “thermal” and “steam” or “steaming” are loosely used interchangeably, although the broader term includes uses of coal in non-steamraising activities such as calcining (dominated by cement-making).

Appendix A: Market background and analysis 42
Figure 2: World Coal Exports, 2004
Indonesian thermal coal exports grew by an average of 23 percent per year between 1988 and 2005, based on the development of extensive high quality deposits on the island of Kalimantan, close to a coastline highly amenable to deepwater ship-loading. Major international investors such as Rio Tinto and BHP Billiton were initially attracted by a Contract-of-Work system that offered good political certainty and predefined rates of tax and royalty.
More recently, the investment climate has changed, with international owners being obliged to sell down their holdings to local interests, and tax and royalty rates increasing. In October 2005, for example, the Indonesian government quite suddenly added a five percent export tax on coal to the set of income taxes, royalties and value added taxes that were already considerably higher than those faced by competitors in China, South Africa and Australia.
As a consequence of such changes and general deterioration in assessments of Indonesian political risk, exploration expenditure has been in decline since 1998, so that it appears likely that the Indonesian industry will not keep pace in the long run with global demand for internationally traded thermal coal.
Figure below shows the EIA’s forecasts of sources of global thermal coal in 2015 and 2030, compared with the 2004 figures.
0 50 100 150 200 250
Million Tonnes
Australia
Indonesia
China
South Africa
South America
Former Soviet Union
United States
Poland
Vietnam
Canada
Others ThermalMetallurgical
Source EIA

Appendix A: Market background and analysis 43
Some massive infrastructure expansions will be required to permit Australia’s exports to grow by almost 50%, but the EIA forecasts at least illustrate the possibility that Australia will become a more significant exporter to India.
In addition, Vietnam is likely to become a large exporter and should have good prospects of capturing a share of Indian business.
The EIA groups Indonesian exports with “others”, which are undefined but could include such potential exporters as Bangladesh and Madagascar. Figure 3: World Thermal Coal Export Projections to 2030
0 50 100 150 200
Million Tonnes
Australia
Indonesia/Others
China
South Africa
South America
Former Soviet Union
United States
Poland
Vietnam
Canada 203020152004
Source EIA
The large increase foreseen in South American exports would be from Atlantic basin ports and likely to find its way to North American and West European markets, from which it could displace some South African coal. If this led South Africa to increase its exports to the Asia-Pacific region, India would be its nearest potential major market.
From the foregoing remarks, it is evident that present coal import patterns give little guide to a future in which any one of India’s proposed coastal Ultra Mega Power Projects would require about as much thermal coal annually (16-18Mtpa) as the whole country imported in 2005.
Contract and spot trades
An important indicator of the price of thermal coal is the annual review of benchmark prices for tonnage contracted between Australian shippers and Japanese power utilities. Contract prices are fixed for each Japanese Fiscal Year

Appendix A: Market background and analysis 44
ending 31 March. The Japanese power utilities consumed 82 million tonnes of coal in calendar year 2005, and over 98% of this was imported, constituting around 85% of Japan’s total thermal coal imports. Australia supplied 62% of Japan’s 2005 thermal coal imports; this establishes the importance of the trade underlying this important reference price. Figure 4: Newcastle Contract and Spot Prices 1996-2005 (US$/t FOB, 6,700kcal/kg)
Source: Coal and Allied Industries Review of 2005 Results
Many other regular consumers purchase at least part of their coal needs under multi-year contracts. Nevertheless, most of the international trade in thermal coal takes place on a spot cargo basis. A comparison for the port of Newcastle reveals that over the past twenty years, the spot price has been below the Japanese contract price 80% of the time, and the spot price has averaged 89% of the contract price.
This very fact has had the effect of moving buyers away from an over-reliance on contract tonnage, and to find other ways to ensure reliability of supply and protection from price surges, such as occurred in 2004.
Market review
From a peak in the September quarter of 1995, Newcastle thermal coal spot prices fell by about 45% to bottom in the March quarter of 2000. World economic growth was already moderate before it was dragged down by the financial crisis that erupted in Asia in mid-1997, and exports from Indonesia and China were growing rapidly. Each year, the weakening spot market forced sellers to give ground in contract price negotiations.

Appendix A: Market background and analysis 45
The situation turned around in 2000 when spot prices began to rise, stimulated by improving demand as the effects of the Asian crisis receded, and by an expectation that Chinese exports would slow. The 20% lift in contract prices for the 2001 Japanese Fiscal Year was the first increase since 1995. This recovery proved to be a false dawn for coal producers, however, and prices had already begun to tumble in the face of accelerated Chinese exports before the 9/11 event had its effect on trader confidence.
Newcastle thermal coal export prices doubled in the 18 months following the September quarter of 2002. After years of rapid expansion, China’s thermal coal exports fell from 71.6Mt in 2001 to 63.6Mt in 2002. Australian exports surged by 11.8Mt to make up the shortfall, but this increased activity began to expose the limitations of Australia’s port loading capacity, which in 2003 and 2004 became a real bottleneck, creating supply shortages and sustaining high prices.
FREIGHT
Ocean freight rates have shown extreme volatility in recent years, reaching record levels. At the heart of the unprecedented rise in charter rates has been surging demand for bulk materials in China. This not only led to a simple requirement for tonnage, but also resulted in a dramatic increase in what is referred to in shipping markets as “ton-miles” – the combination of tonnage being shipped and the voyage distances, as China’s sources of materials such as iron ore proliferated and became more distant. At the same time, China’s increasing domestic consumption of coke and coking coal meant a further increase in ton-miles as the international buyers looked for replacement suppliers. Both loading and discharge port capacities were exceeded, tying up shipping capacity as vessels waited in long queues at both ends of voyages. Economic growth elsewhere, including in India, has further stretched global bulk shipping capability. For example, India’s thermal coal imports have doubled since 2000.
Meanwhile, shipbuilding capacity has been stretched as shipping operators attempt to catch up on years of low investment, which has coincided with the need to upgrade oil and bulk fleets with double-skinned vessels to meet new environmental and safety requirements.
Moreover, in concert with the rising pressure on shipping, oil prices surged to new levels, the reasons for which are well known, but again with the booming Chinese economy playing a fundamental role.
These factors create a level of complexity to any analysis of global shipping and the associated costs. The actual cost per tonne of shipped product is heavily impacted by voyage distance, charter rates, fuel rates, and time in port, not to mention whether back-haul cargos or more complex triangular shipping routes can be devised. Charter rates, in turn, reflect the supply-demand balance for each class of ship. For instance, oversupply in the Panamax (usually less than 75,000dwt) market is possible, while there is an undersupply in the Capesize (over 80,000dwt – usually around 150,000dwt) market, making Panamaxes a cheaper option, despite the inherent economies of scale of the larger vessels.

Appendix B: Australian Open Cut Mining PPI Data Series for Bid Evaluation
46
Appendix B: Australian Open Cut Mining PPI Data Series for Bid Evaluation
Australian Mining PPI Index (USD Adjusted)
Year Value 3 yr Avg Escalation
1994 81.4 1995 83.2 1996 90.4 85.0 1997 85.3 86.3 1.54%1998 71.4 82.4 -4.56%1999 74.4 77.0 -6.48%2000 73.7 73.1 -5.06%2001 66.5 71.5 -2.23%2002 71.6 70.6 -1.27%2003 87.0 75.1 6.33%2004 102.2 87.0 15.84%2005 115.8 101.7 16.93% Mean 2.34%

Appendix C: WPI and CPI Data Series for Bid Evaluation
47
Appendix C: WPI and CPI Data Series for Bid Evaluation
Wholesale Price Index (Base 93-94)
Year Value 3 yr Avg Escalation
1994 111.2 1995 120.2 1996 125.6 119.0 1997 131.3 125.7 5.63%1998 138.9 131.9 4.96%1999 143.8 138.0 4.60%2000 152.8 145.2 5.19%2001 160.7 152.4 5.01%2002 164.7 159.4 4.57%2003 173.4 166.3 4.31%2004 184.9 174.3 4.85%2005 193.7 184.0 5.54% Mean 4.96%
Consumer Price Index for Industrial Worker (Base 01-02)
Year Value3 yr Avg Escalation
1994 60 1995 66 1996 72 66.1 1997 77 71.8 8.70%1998 87 79.0 9.90%1999 92 85.4 8.22%2000 95 91.4 7.01%2001 99 95.2 4.14%2002 103 99.1 4.03%2003 107 103.0 3.96%2004 111 107.1 3.95%2005 116 111.3 3.95% Mean 5.98%
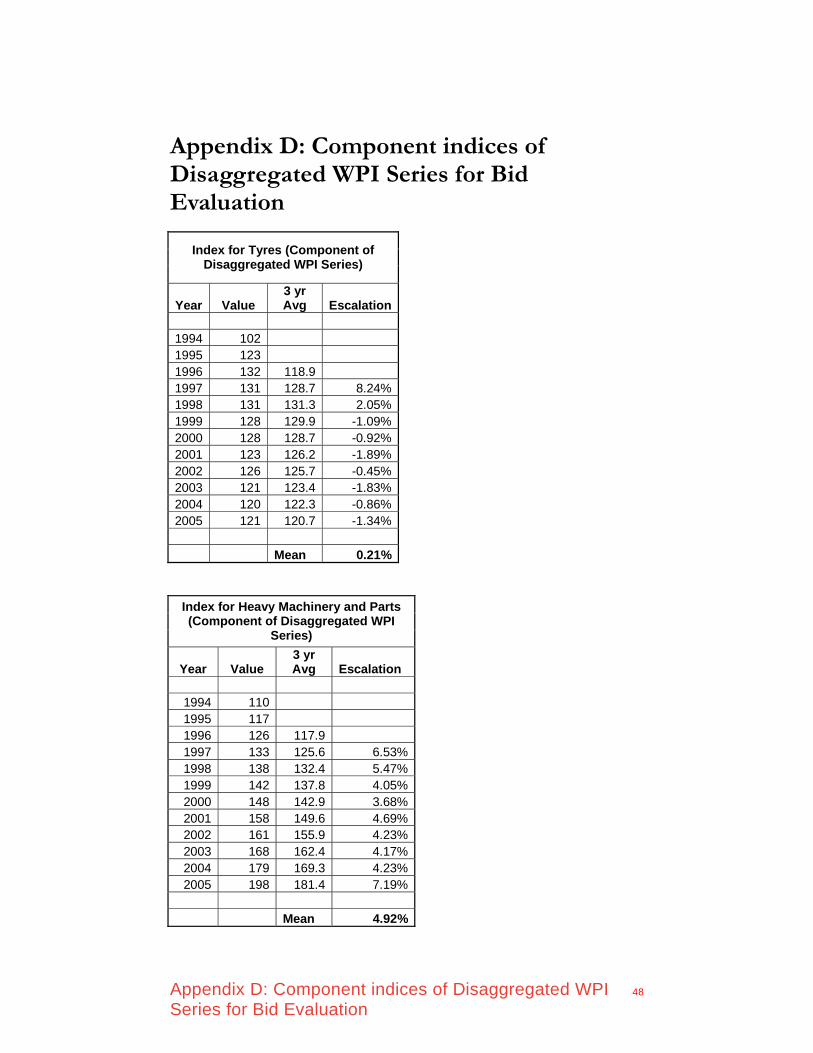
Appendix D: Component indices of Disaggregated WPI Series for Bid Evaluation
48
Appendix D: Component indices of Disaggregated WPI Series for Bid Evaluation
Index for Tyres (Component of Disaggregated WPI Series)
Year Value 3 yr Avg Escalation
1994 102 1995 123 1996 132 118.9 1997 131 128.7 8.24%1998 131 131.3 2.05%1999 128 129.9 -1.09%2000 128 128.7 -0.92%2001 123 126.2 -1.89%2002 126 125.7 -0.45%2003 121 123.4 -1.83%2004 120 122.3 -0.86%2005 121 120.7 -1.34% Mean 0.21%
Index for Heavy Machinery and Parts (Component of Disaggregated WPI
Series)
Year Value 3 yr Avg Escalation
1994 110 1995 117 1996 126 117.9 1997 133 125.6 6.53%1998 138 132.4 5.47%1999 142 137.8 4.05%2000 148 142.9 3.68%2001 158 149.6 4.69%2002 161 155.9 4.23%2003 168 162.4 4.17%2004 179 169.3 4.23%2005 198 181.4 7.19%
Mean 4.92%

Appendix D: Component indices of Disaggregated WPI Series for Bid Evaluation
49
Index for HSD Oil (Component of Disaggregated WPI Series)
Year Value 3 yr Avg Escalation
1994 109 1995 109 1996 117 111.5 1997 137 120.8 8.31%1998 154 135.7 12.37%1999 160 149.9 10.49%2000 218 177.1 18.10%2001 252 209.8 18.49%2002 262 243.9 16.24%2003 295 269.4 10.46%2004 344 300.0 11.36%2005 415 351.0 17.01% Mean 13.65%
Index for Matches, Explosives & Other Chemicals (Component of
Disaggregated WPI Series)
Year Value 3 yr Avg Escalation
1994 99 1995 101 1996 108 102.5 1997 116 108.2 5.53%1998 123 115.6 6.90%1999 123 120.7 4.38%2000 123 123.0 1.88%2001 127 124.2 0.98%2002 128 125.9 1.40%2003 129 128.0 1.69%2004 129 128.9 0.65%2005 128 128.8 -0.08% Mean 2.59%

Appendix E: WPI and CPI Data Series for Payment 50
Appendix E: WPI and CPI Data Series for Payment
INFLATION RATE TO BE APPLIED TO INDEXED CAPACITY CHARGE
COMPONENT (FOR PAYMENT) Period WPI Inflation
based on WPI
CPI Inflation based on
CPI June, 05 193.20 114.25 July, 05 194.60 0.72 116.20 1.71 August, 05 195.30 0.36 116.63 0.37 September, 05 197.20 0.97 117.06 0.37 October, 05 197.80 0.30 118.36 1.11 November, 05 198.20 0.20 119.44 0.91 December, 05 197.20 -0.50 118.79 -0.54 January, 06 196.30 -0.46 119.00 0.18 February, 06 196.40 0.05 119.00 0.00 March, 06 196.80 0.20 119.00 0.00 April, 06 199.00 1.12 120.00 0.84 May, 06 201.30 1.16 121.00 0.83 June, 06 203.10 0.89 123.00 1.65 1 Year Inflation 197.77 5.03 7.43 Inflation for Thermal Projects (0.60 x InflWPI + 0.40 x InflCPI) 5.99

`
Appendix F: Captive Coal Mining Data Series for Payment
Appendix F: Captive Coal Mining Data Series for Payment Period Index for Tyres
(Component of Disaggregated WPI
Series)
Index for Matches, Explosives & Other
Chemicals (Component of Disaggregated WPI
Series)
Index for Heavy Machinery and
Parts (Component of Disaggregated
WPI Series)
Index for HSD Oil (Component of Disaggregated
WPI Series)
Wholesale Price Index (Base 93-94)
Consumer Price Index for Industrial Worker (Base 01-
02)
Index Value
Escalation %
Index Value Escalation %
Index Value
Escalation %
Index Value
Escalation %
Index Value
Escalation %
Index Value
Escalation %
Jun-05 122.10 128.30 201.1 397.50 193.20 114.25 Jul-05 122.10 0.00% 128.20 -0.08% 201.1 0.00% 421.10 5.94% 194.60 0.72% 116.20 1.71% Aug-05 122.90 0.66% 128.00 -0.16% 201.3 0.10% 420.40 -0.17% 195.30 0.36% 116.63 0.37% Sep-05 123.20 0.24% 128.00 0.00% 202.8 0.75% 443.00 5.38% 197.20 0.97% 117.06 0.37% Oct-05 123.20 0.00% 128.00 0.00% 201.0 -0.89% 450.50 1.69% 197.80 0.30% 118.36 1.11% Nov-05 123.70 0.41% 128.10 0.08% 196.1 -2.44% 450.50 0.00% 198.20 0.20% 119.44 0.91% Dec-05 123.80 0.08% 129.00 0.70% 196.5 0.20% 450.50 0.00% 197.20 -0.50% 118.79 -0.54% Jan-06 123.80 0.00% 131.10 1.63% 197.1 0.31% 450.50 0.00% 196.30 -0.46% 119.00 0.18% Feb-06 121.40 -1.94% 130.90 -0.15% 197.1 0.00% 450.50 0.00% 196.40 0.05% 119.00 0.00% Mar-06 120.60 -0.66% 130.80 -0.08% 197.1 0.00% 450.50 0.00% 196.80 0.20% 119.00 0.00% Apr-06 124.00 2.82% 131.00 0.15% 198.2 0.56% 450.50 0.00% 199.00 1.12% 120.00 0.84% May-06 124.80 0.65% 132.50 1.15% 197.5 -0.35% 450.50 0.00% 201.30 1.16% 121.00 0.83% Jun-06 127.60 2.24% 132.70 0.15% 200.4 1.47% 473.30 5.06% 203.10 0.89% 123.00 1.65%
4.50% 3.39% -0.30% 17.90% 5.03% 7.43% Weights 10% 10% 25% 25% 10% 20%
Index Escalation : 7.18%