error in geometric morphometric data collection: combining
TRANSCRIPT
R E S E A R CH AR T I C L E
Error in geometric morphometric data collection:Combining data from multiple sources
Chris Robinson1 | Claire E. Terhune2
1Department of Biological Sciences, Bronx
Community College (CUNY), Bronx,
New York 10453
2Department of Anthropology, University of
Arkansas, Fayetteville, Arkansas
Correspondence
Chris Robinson, Department of Biological
Sciences, Bronx Community College
(CUNY), 2155 University Avenue, Bronx,
NY 10453, USA.
Email: [email protected]
Abstract
Objectives: This study compares two- and three-dimensional morphometric data to determine the
extent to which intra- and interobserver and intermethod error influence the outcomes of statisti-
cal analyses.
Materials and Methods: Data were collected five times for each method and observer on 14
anthropoid crania using calipers, a MicroScribe, and 3D models created from NextEngine and
microCT scans. ANOVA models were used to examine variance in the linear data at the level of
genus, species, specimen, observer, method, and trial. Three-dimensional data were analyzed using
geometric morphometric methods; principal components analysis was employed to examine how
trials of all specimens were distributed in morphospace and Procrustes distances among trials
were calculated and used to generate UPGMA trees to explore whether all trials of the same indi-
vidual grouped together regardless of observer or method.
Results: Most variance in the linear data was at the genus level, with greater variance at the
observer than method levels. In the 3D data, interobserver and intermethod error were similar to
intraspecific distances among Callicebus cupreus individuals, with interobserver error being higher
than intermethod error. Generally, taxa separate well in morphospace, with different trials of the
same specimen typically grouping together. However, trials of individuals in the same species over-
lapped substantially with one another.
Conclusion: Researchers should be cautious when compiling data from multiple methods and/or
observers, especially if analyses are focused on intraspecific variation or closely related species, as
in these cases, patterns among individuals may be obscured by interobserver and intermethod
error. Conducting interobserver and intermethod reliability assessments prior to the collection of
data is recommended.
K E YWORD S
3D scanning, data archiving and sharing, geometric morphometrics, measurement error, Micro-
Scribe digitizer
1 | INTRODUCTION
There is an ever-increasing number of instruments available for collect-
ing linear and three-dimensional (3D) data. These instruments include
calipers (and other “traditional” instruments), 3D digitizers such as the
MicroScribe and Polhemus Patriot, digital cameras to take pictures for
3D photogrammetry, laser or structured light scanners that create high-
density point cloud datasets of the surfaces of objects (e.g., NextEngine
3D laser scanner, HDI blue LED scanners, Arctec 3D structured light
scanners, etc.), and X-ray computed tomography (CT) systems that cre-
ate stacks of X-ray images that can be used to generate 3D volumetric
models of hard- and soft-tissue structures. The availability of these
tools over the past two decades has resulted in the collection of a
large number of morphometric datasets that are increasingly being
shared and published online via websites such as morphosoure.org,
digimorph.org, paleo-org.com, primo.nycep.org, and phenome10k.org
Am J Phys Anthropol. 2017;1–14. wileyonlinelibrary.com/journal/ajpa VC 2017Wiley Periodicals, Inc. | 1
Received: 9 September 2016 | Revised: 3 May 2017 | Accepted: 17 May 2017
DOI: 10.1002/ajpa.23257

(e.g., Adams, Olah, McCurry, and Potze, 2015; Copes, Lucas, Thosten-
son, Hoekstra, and Boyer, 2016). As a result, many studies now include
data pooled from multiple observers and/or data collection methods.
Pooling data in this way provides multiple benefits to both institutions
and researchers (e.g., decreased handling of museum specimens, more
wide-spread access to rare or fragile specimens, and increased sample
sizes and, thus, statistical power). However, combining data from multi-
ple observers and/or data collection methods also introduces the possi-
bility of increased measurement error resulting from difficulties in
consistently identifying the positions of landmarks. In 3D geometric
morphometric studies in particular, this error could be derived from any
number of sources, including random observer error in placing land-
marks by one or more of the observers (i.e., digitizing error), different
interpretations among observers of the positions of anatomical land-
marks, potentially due to landmark definitions that are too imprecise
for geometric morphometric studies (von Cramon-Taubadel, Frazier, &
Lahr, 2007), which introduces systematic error into the dataset, and/or
variation in the precision of the different instruments used to collect
the data. This may lead to a reduction in the “biologically relevant signal
to noise ratio” (Fruciano, 2016) due to increasing the Type II error rate,
which ultimately functions to reduce statistical power (Arnqvist & Mar-
tensson, 1998). While the primary focus of the study presented here is
on measurement error due to variation in the repeated placement of
3D landmarks, this same issue is inherent in traditional 2D morphomet-
rics in attempting to determine where to position instruments (e.g., the
tips of calipers) when measuring specimens, as has been noted in many
previous studies (e.g., Hanihara et al., 1999; Kouchi and Koizumi, 1985;
Shaner, Bamforth, Peterson, and Beattie, 1998; Utermohle, Zegura, and
Heathcote, 1983).
Many researchers routinely assess intra- and interobserver error
when conducting either traditional or geometric morphometric studies
by themselves or with colleagues, often in pilot studies on a subset of
their sample. However, results of such error analyses are typically
either not presented or presented only cursorily. Furthermore, in stud-
ies where data are obtained from online or published sources, error
analyses such as these are usually not possible. To address this issue, a
number of researchers have examined the levels of interobserver and
intermethod error that are introduced when combining datasets that
include data collected in three dimensions for morphometric analysis
(e.g., Badawi-Fayad and Cabanis, 2007; Barbeito-Andr�es, Anzelmo,
Ventrice, and Sardi, 2012; Campomanes-�Alvarez et al., 2015; Dujardin,
Kaba, and Henry, 2010; Fourie, Damstra, Gerrits, and Ren, 2011;
Gonzalez, Bernal, and Perez, 2009; Hassett and Lewis-Bale, 2016; Katz
and Friess 2014; Mu~noz-Mu~noz and Perpi~n�an, 2010; Mu~noz-Mu~noz
et al., 2016; Shearer et al., 2014; Sholts, Flores, Walker, and Wärm-
länder, 2011; Singleton, 2002; Slizewski, Friess, and Semal, 2010;
Tocheri et al., 2011; Williams and Richtsmeier, 2003). However, all of
these studies of error have focused on a limited number of methods
and/or specimens.
Critically, most of the studies examining the accuracy of morpho-
metric data collection that include data collected in 3D have not explic-
itly compared whether the results obtained from analyses of the same
specimens are statistically similar when those data are collected by dif-
ferent observers using a variety of methods. Specifically, it remains
unclear whether the same phenetic relationships among individuals
and species in a given sample would be recovered when different
observers measure the same specimens using different methods to
obtain 3D landmark data. In other words, how reliably can we come to
the same statistical conclusion when different observers and/or meth-
ods are employed? Such a study would enable researchers to gauge
whether it is appropriate to combine 3D datasets collected by different
observers and/or data collection methods (i.e., MicroScribe, surface
scan, or CT scan data), when conducting morphometric analyses. Might
levels of interobserver (and/or intermethod) measurement error be suf-
ficiently large as to make it difficult to distinguish among individuals
within a species (especially those exhibiting limited morphological vari-
ation) and/or between closely related species (e.g., Dujardin et al.,
2010)?
To address this question, this study compares two- and three-
dimensional morphometric data collected on the same 14 anthropoid
cranial specimens by 2 observers using 4 methods to determine the
extent to which intra- and interobserver and intermethod error influ-
ence the outcomes of statistical analyses. Specifically, we assess
whether these levels of error are statistically significantly different than
variation among individuals of the same species, or individuals in differ-
ent taxa (e.g., species, genera, or families). In addition, we investigate
whether analyses of datasets compiled by different observers and/or
using different methods recover the same phenetic relationships
among individuals within and between species. Finally, we conduct a
preliminary and exploratory comparison of the extent of intraobserver
error introduced by different methods of collecting data and of levels
of identification precision in digitizing these particular cranial land-
marks. It is important to note that the goal of this research is not an
assessment of the biological relationships among the focal specimens,
but an investigation of the impact of measurement error on the poten-
tial to accurately assess relationships among individuals.
2 | MATERIALS AND METHODS
2.1 | Sample and data collection
We analyzed 14 adult cranial specimens from 11 species ranging in
size from Callicebus (male body mass5 1.02 kg) to Gorilla (male body
mass5�170 kg) (Table 1) (masses taken from Smith and Jungers,
1997). For each cranium, two experienced observers (CAR and CET)
collected both 2D and 3D data five times (i.e., “trials”) using each
method. Four data collection methods were employed: (1) 15 linear
measurements (Table 2) were collected using Mitutoyo digital calipers;
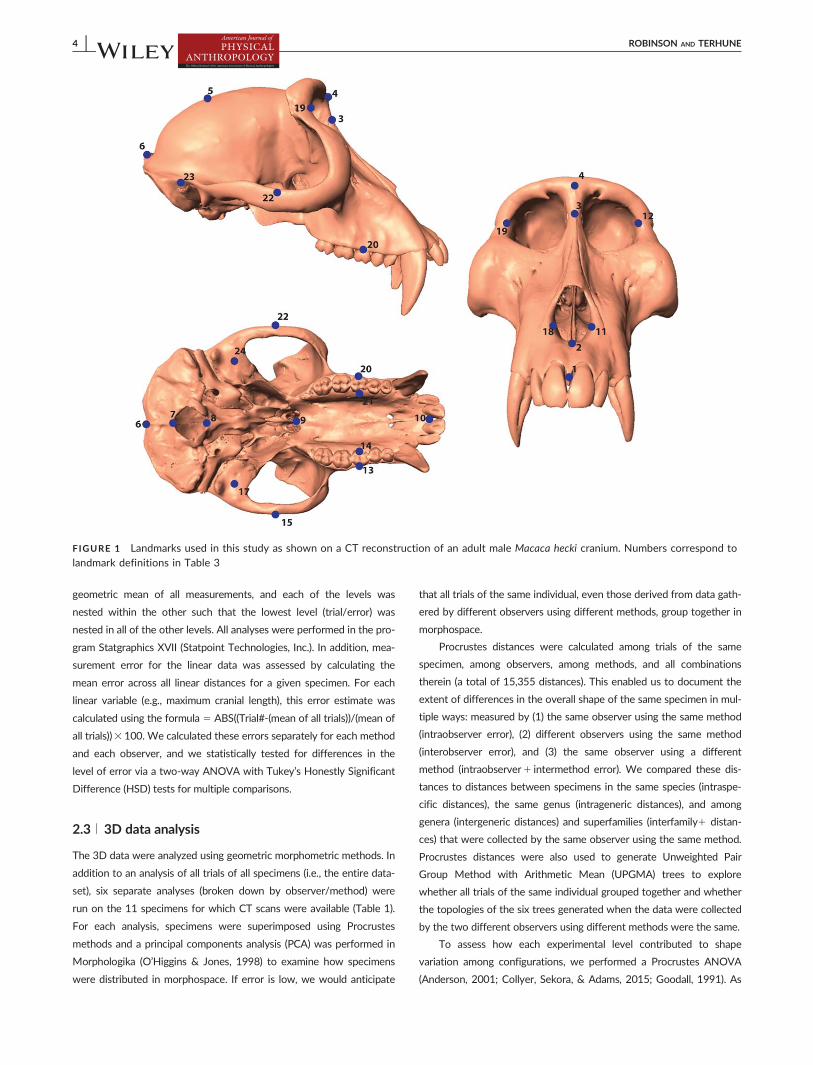
and 24 3D landmarks (Figure 1) were collected (2) directly on the speci-
men using a MicroScribe-3DX (MS) digitizer, on (3) scans obtained
using a NextEngine (NE) laser scanner, and on (4) surface models cre-
ated from microCT scans generated using a GE Phoenix v|tome|x s 240
high-resolution scanner (CT) in Landmark Editor 3.0.0.6 (Wiley et al.,
2005). For the NextEngine, each specimen was scanned from at least
three different orientations with nine scans per orientation. For each
2 | ROBINSON AND TERHUNE

orientation, ScanStudio version 2.0.2 software (NextEngine, Inc.) was
used to process the images, removing extraneous material (e.g., mold-
ing clay), and to fuse the nine images together. The scans of each spec-
imen taken from different orientations were then further digitally
cleaned, aligned, and merged in Geomagic Studio 2014 software (3D
Systems, Inc.). For the microCT data, scans were taken from at least
two different orientations to ensure digital capture of the entire speci-
men. The different orientations were merged using Phoenix datos|x CT
software (General Electric) and VGStudio 2.2 (Volume Graphics) to cre-
ate .tiff stacks of the entire specimen. The .tiff stacks of microCT data
were loaded into Avizo 8.0 (FEI Software) and the “thresholding” tool
was employed to remove extraneous material from the scans. During
this process, the full 3D surface of the specimen along with slices in
the xy, xz, and yz axes are viewed and the density threshold manually
adjusted until only bone is selected in all of the views. The “generate
surface” module in Avizo was then used to merge the .tiff stack slices
and create a 3D surface model (.ply). While some have noted that dif-
ferent thresholding settings can substantially influence the 3D mor-
phology of the trabecular bone in the resulting models (Fajardo, Ryan,
& Kappelman, 2002), it is unlikely that this will have a significant impact
on the morphology of the external surface bone, although this may be
worth investigating in a future study. The file size was reduced to
approximately 5 million “faces” for each scan using the “simplification
editor” tool in Avizo so that the files could be opened in Landmark Edi-
tor. The MicroScribe has a measured accuracy of approximately
0.23 mm (Immersion Corp.), the NextEngine 0.13 mm (NextEngine,
Inc.), and the microCT resolution varied between �0.049 and
0.142 mm depending on scan parameters (which varied slightly among
specimens, as is often the case for data downloaded from online repo-
sitories). For comparison with the caliper data, 3D data were converted
to linear measurements by calculating interlandmark distances (Table
2). The 3D data were also used in separate geometric morphometric
analyses (outlined below).
2.2 | Linear distance data analysis
A series of random effects (Model II) hierarchical (i.e., nested) analysis
of variance (ANOVA) tests were run on the linear data to explore the
extent of variance explained by genus, species, specimen, observer,
method, and trial. This analysis was conducted separately for each of
the linear variables scaled to size by dividing each measurement by the
TABLE 1 Specimens utilized in this study
Taxon Specimen number(s) (sex)
Aotus azarae AMNH 36508 (F)
Callicebus cupreus AMNH 72141 (F), 72143 (M),75987 (M), 75988 (F)
Allenopithecus nigroviridis AMNH 86856 (M)
Cercopithecus albogularis AMNH 27717a (U)
Cercopithecus mitis AMNH 52355a (M)
Macaca hecki AMNH 152890 (M)
Macaca sylvanus AMNH 202391 (M)
Papio hamadryas anubis AMNH 82185 (M)
Gorilla gorilla AMNH 99–9686 (M)
Nomascus leucogenys AMNH 87251 (M)
Pan troglodytes AMNH 167344a (M)
aNo CT scan available.M5male; F5 female; U5 sex unknown.
TABLE 2 Linear measurements employed in this analysis
Measurement Abbreviation Definition
Maximum cranial length MaxCranLg Glabella to opisthocranion
Maximum cranial height MaxCranHt Basion to bregma
Maxillary breadth MaxBr Right ectomolare at M1 to left ectomolare at M1
Nasal breadth NasalBr Left alare to right alare
Nasal height NasalHt Nasion to nasospinale
Palate breadth PalateBr Right endomolare at M1 to left endmolare at M1
Palate length PalateLg Orale to staphylion
Facial length FacialLg Basion to prosthion
Biarticular breadth BiArtBr Right articular eminence midpoint to left articular eminence midpoint
Biporionic breadth BiPorBr Right porion to left porion
Bizygomatic breadth BiZygBr Maximum distance between the left and right zygomatic arches
Mandible length (on cranium) L MandLgL Midpoint of the articular eminence to prosthion, left side
Mandible length (on cranium) R MandLgR Midpoint of the articular eminence to prosthion, right side
Biorbital breadth BiOrbBr Right ectoconchion to left ectoconchion
Foramen magnum length FMLg Basion to opisthion
ROBINSON AND TERHUNE | 3
geometric mean of all measurements, and each of the levels was
nested within the other such that the lowest level (trial/error) was
nested in all of the other levels. All analyses were performed in the pro-
gram Statgraphics XVII (Statpoint Technologies, Inc.). In addition, mea-
surement error for the linear data was assessed by calculating the
mean error across all linear distances for a given specimen. For each
linear variable (e.g., maximum cranial length), this error estimate was
calculated using the formula 5 ABS((Trial#-(mean of all trials))/(mean of
all trials))3100. We calculated these errors separately for each method
and each observer, and we statistically tested for differences in the
level of error via a two-way ANOVA with Tukey’s Honestly Significant
Difference (HSD) tests for multiple comparisons.
2.3 | 3D data analysis
The 3D data were analyzed using geometric morphometric methods. In
addition to an analysis of all trials of all specimens (i.e., the entire data-
set), six separate analyses (broken down by observer/method) were
run on the 11 specimens for which CT scans were available (Table 1).
For each analysis, specimens were superimposed using Procrustes
methods and a principal components analysis (PCA) was performed in
Morphologika (O’Higgins & Jones, 1998) to examine how specimens
were distributed in morphospace. If error is low, we would anticipate
that all trials of the same individual, even those derived from data gath-
ered by different observers using different methods, group together in
morphospace.
Procrustes distances were calculated among trials of the same
specimen, among observers, among methods, and all combinations
therein (a total of 15,355 distances). This enabled us to document the
extent of differences in the overall shape of the same specimen in mul-
tiple ways: measured by (1) the same observer using the same method
(intraobserver error), (2) different observers using the same method
(interobserver error), and (3) the same observer using a different
method (intraobserver1 intermethod error). We compared these dis-
tances to distances between specimens in the same species (intraspe-
cific distances), the same genus (intrageneric distances), and among
genera (intergeneric distances) and superfamilies (interfamily1 distan-
ces) that were collected by the same observer using the same method.
Procrustes distances were also used to generate Unweighted Pair
Group Method with Arithmetic Mean (UPGMA) trees to explore
whether all trials of the same individual grouped together and whether
the topologies of the six trees generated when the data were collected
by the two different observers using different methods were the same.
To assess how each experimental level contributed to shape
variation among configurations, we performed a Procrustes ANOVA
(Anderson, 2001; Collyer, Sekora, & Adams, 2015; Goodall, 1991). As
FIGURE 1 Landmarks used in this study as shown on a CT reconstruction of an adult male Macaca hecki cranium. Numbers correspond tolandmark definitions in Table 3
4 | ROBINSON AND TERHUNE
with the 2D ANOVA, all levels were nested within one another such
that the lowest level (trial/error) was nested in all of the other levels. All
factors were considered to be random effects. Per Collyer et al. (2015),
we utilized a residual randomization permutation procedure with 9,999
iterations to assess the significance of the model. This analysis was per-
formed in the program R (R Development Core Team, 2008) using the
package “Geomorph” (Adams & Otarola-Castillo, 2013).
To assess whether the amount of measurement error for each
specimen is influenced by size (i.e., is it more difficult to precisely repli-
cate the placement of landmarks on smaller or larger specimens?), we
regressed Procrustes distances against centroid size. For example,
given two trials of the same specimen (collected by a single observer
using the same method), we calculated the Procrustes distance bet-
ween those trials and regressed this distance on the mean centroid size
of those two trials. We did this for all possible combinations of the five
trials conducted for each specimen by each observer using each
method. This gave us a measure of the relationship between
intraobserver error and overall size of the specimen. Mean centroid
size was log transformed for analysis, and regression analyses were
conducted in Microsoft Office Excel 2007.
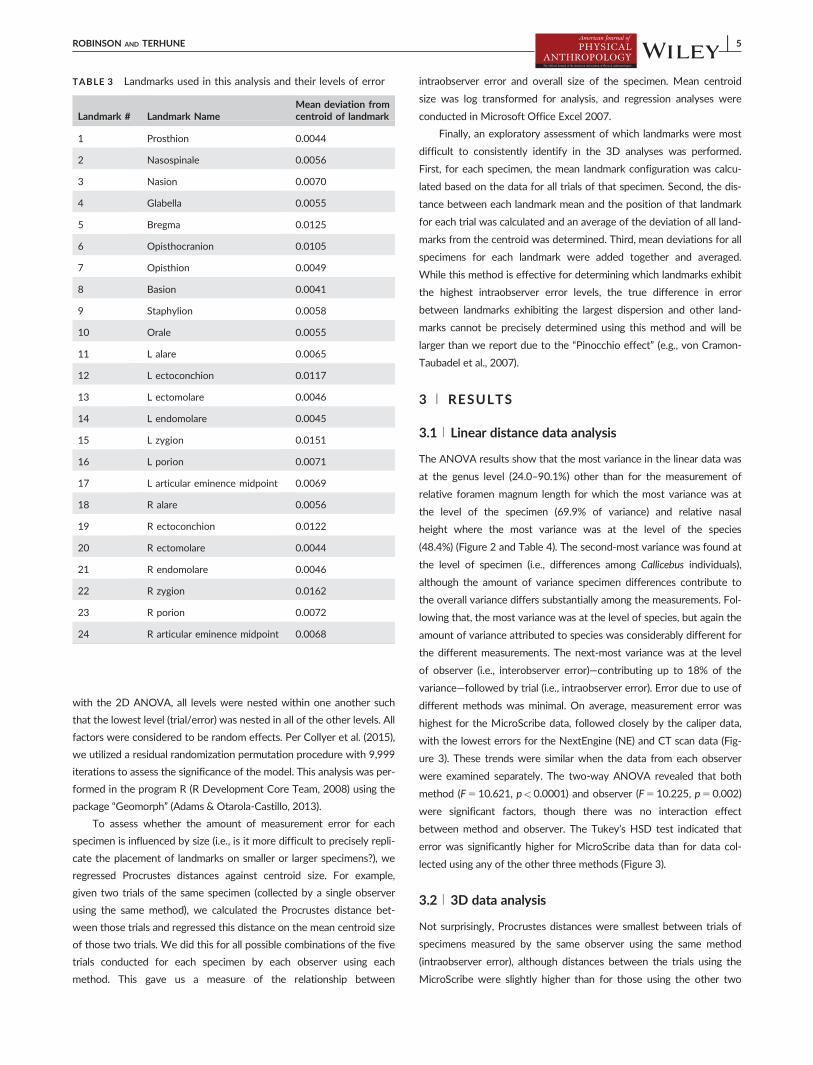
Finally, an exploratory assessment of which landmarks were most
difficult to consistently identify in the 3D analyses was performed.
First, for each specimen, the mean landmark configuration was calcu-
lated based on the data for all trials of that specimen. Second, the dis-
tance between each landmark mean and the position of that landmark
for each trial was calculated and an average of the deviation of all land-
marks from the centroid was determined. Third, mean deviations for all
specimens for each landmark were added together and averaged.
While this method is effective for determining which landmarks exhibit
the highest intraobserver error levels, the true difference in error
between landmarks exhibiting the largest dispersion and other land-
marks cannot be precisely determined using this method and will be
larger than we report due to the “Pinocchio effect” (e.g., von Cramon-
Taubadel et al., 2007).
3 | RESULTS
3.1 | Linear distance data analysis
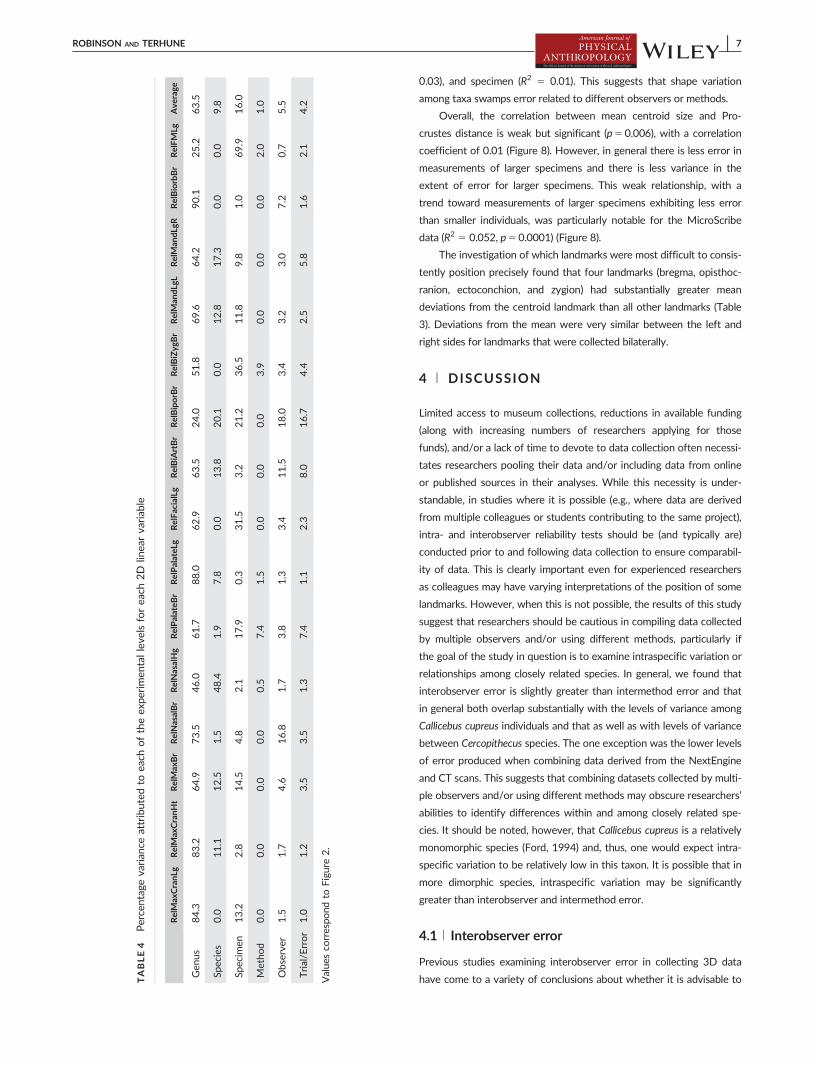
The ANOVA results show that the most variance in the linear data was
at the genus level (24.0–90.1%) other than for the measurement of
relative foramen magnum length for which the most variance was at
the level of the specimen (69.9% of variance) and relative nasal
height where the most variance was at the level of the species
(48.4%) (Figure 2 and Table 4). The second-most variance was found at
the level of specimen (i.e., differences among Callicebus individuals),
although the amount of variance specimen differences contribute to
the overall variance differs substantially among the measurements. Fol-
lowing that, the most variance was at the level of species, but again the
amount of variance attributed to species was considerably different for
the different measurements. The next-most variance was at the level
of observer (i.e., interobserver error)—contributing up to 18% of the
variance—followed by trial (i.e., intraobserver error). Error due to use of
different methods was minimal. On average, measurement error was
highest for the MicroScribe data, followed closely by the caliper data,
with the lowest errors for the NextEngine (NE) and CT scan data (Fig-
ure 3). These trends were similar when the data from each observer
were examined separately. The two-way ANOVA revealed that both
method (F510.621, p<0.0001) and observer (F510.225, p50.002)
were significant factors, though there was no interaction effect
between method and observer. The Tukey’s HSD test indicated that
error was significantly higher for MicroScribe data than for data col-
lected using any of the other three methods (Figure 3).
3.2 | 3D data analysis
Not surprisingly, Procrustes distances were smallest between trials of
specimens measured by the same observer using the same method
(intraobserver error), although distances between the trials using the
MicroScribe were slightly higher than for those using the other two
TABLE 3 Landmarks used in this analysis and their levels of error
Landmark # Landmark NameMean deviation fromcentroid of landmark
1 Prosthion 0.0044
2 Nasospinale 0.0056
3 Nasion 0.0070
4 Glabella 0.0055
5 Bregma 0.0125
6 Opisthocranion 0.0105
7 Opisthion 0.0049
8 Basion 0.0041
9 Staphylion 0.0058
10 Orale 0.0055
11 L alare 0.0065
12 L ectoconchion 0.0117
13 L ectomolare 0.0046
14 L endomolare 0.0045
15 L zygion 0.0151
16 L porion 0.0071
17 L articular eminence midpoint 0.0069
18 R alare 0.0056
19 R ectoconchion 0.0122
20 R ectomolare 0.0044
21 R endomolare 0.0046
22 R zygion 0.0162
23 R porion 0.0072
24 R articular eminence midpoint 0.0068
ROBINSON AND TERHUNE | 5

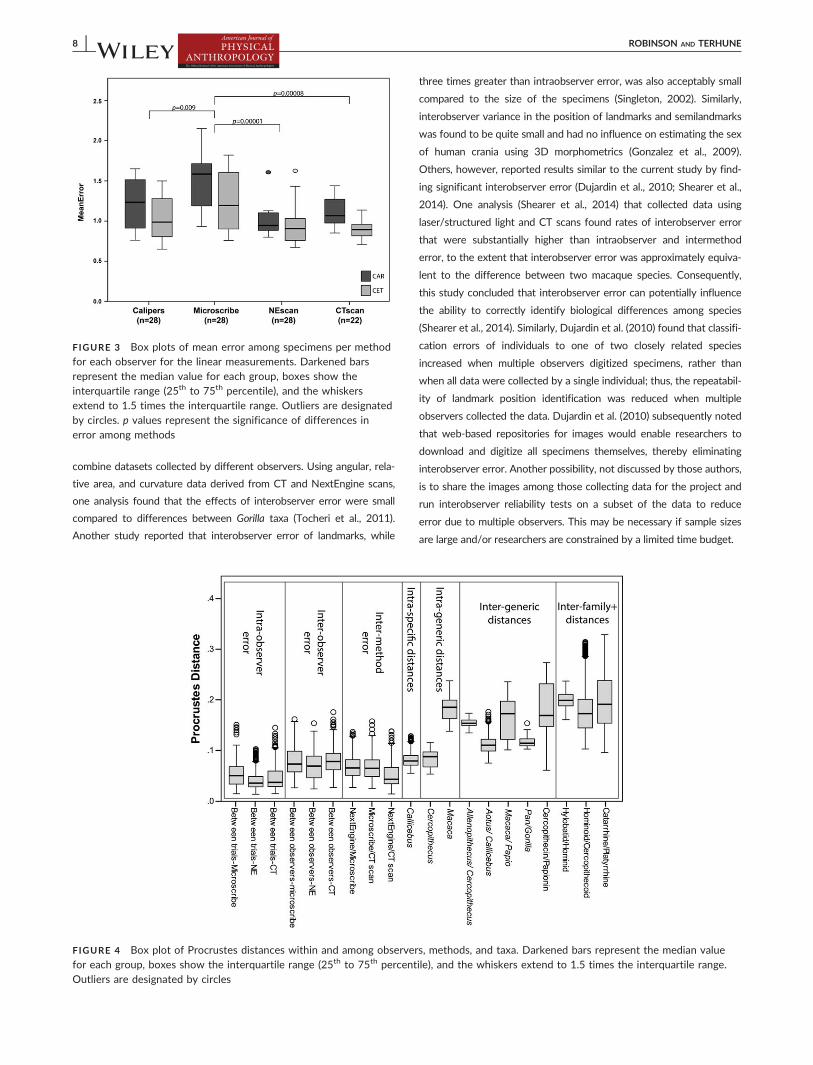
methods (Figure 4). Interobserver and intermethod (i.e., comparisons of
different methods of data collection by the same observer) error are
similar to, but slightly smaller than, intraspecific distances among Calli-
cebus cupreus individuals, which are only slightly less than intrageneric
distances between the two Cercopithecus species. Interobserver error
was higher on average than intermethod error. However, distances
between data collected using a MicroScribe and data collected with
the NextEngine or CT scan were considerably higher than distances
between data collected with the NextEngine and CT scan. This may be
due to the greater similarity between the methods of data collection
on the CT and NextEngine scans (i.e., in both cases, landmarks are
placed on 3D models using the program Landmark Editor).
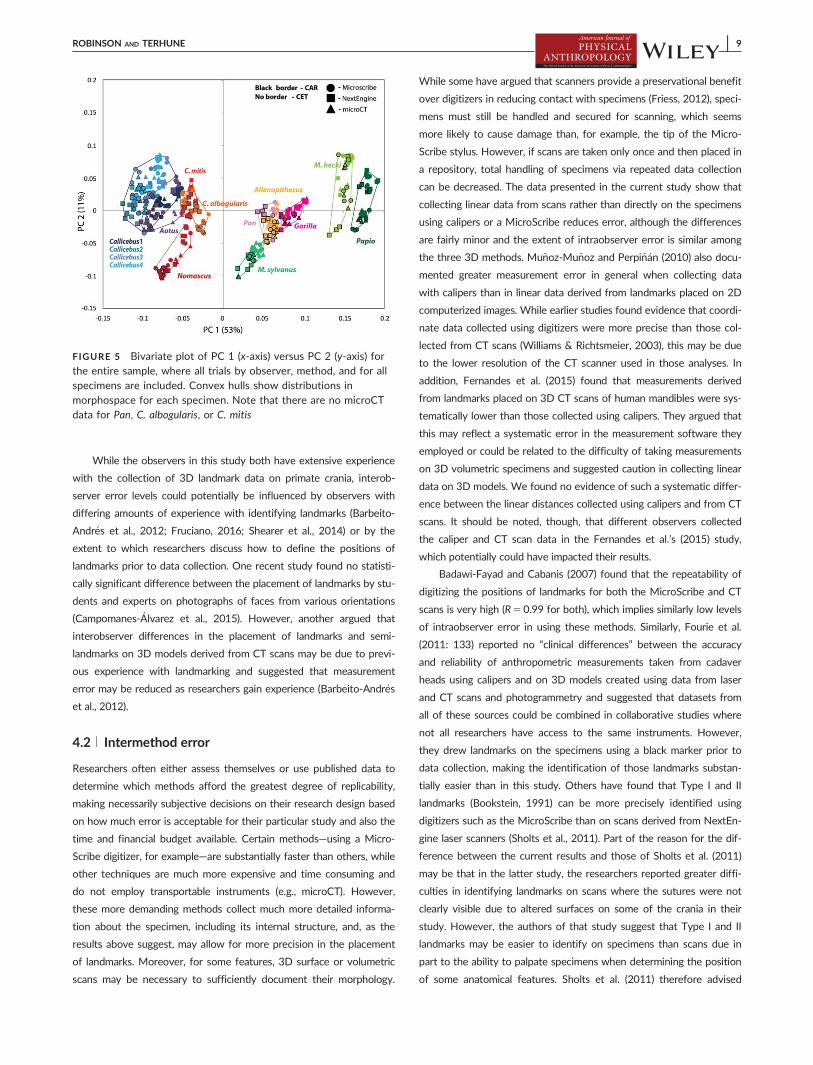
In the PCA of the entire dataset (Figure 5), taxa were generally
well-separated from one another and different trials of the same speci-
men typically grouped together on the plot of PCs 1 and 2 (which
account for approximately 65% of the overall variance). In many cases,
trials of one specimen by the same observer, using the same method,
clustered most closely together. For some specimens (e.g., Macaca syl-
vanus and Nomascus), most trials by one observer grouped together,
while for other specimens (e.g., Cercopithecus albogularis), most trials
using the same method grouped together. Notably, the four Callicebus
specimens overlap substantially such that different trials of these indi-
viduals do not consistently group with one another. There is also over-
lap between the trials of the two Cercopithecus taxa and between
Allenopithecus and Pan, though the distributions for the latter two taxa
were clearly separated on PC 3 (not shown).
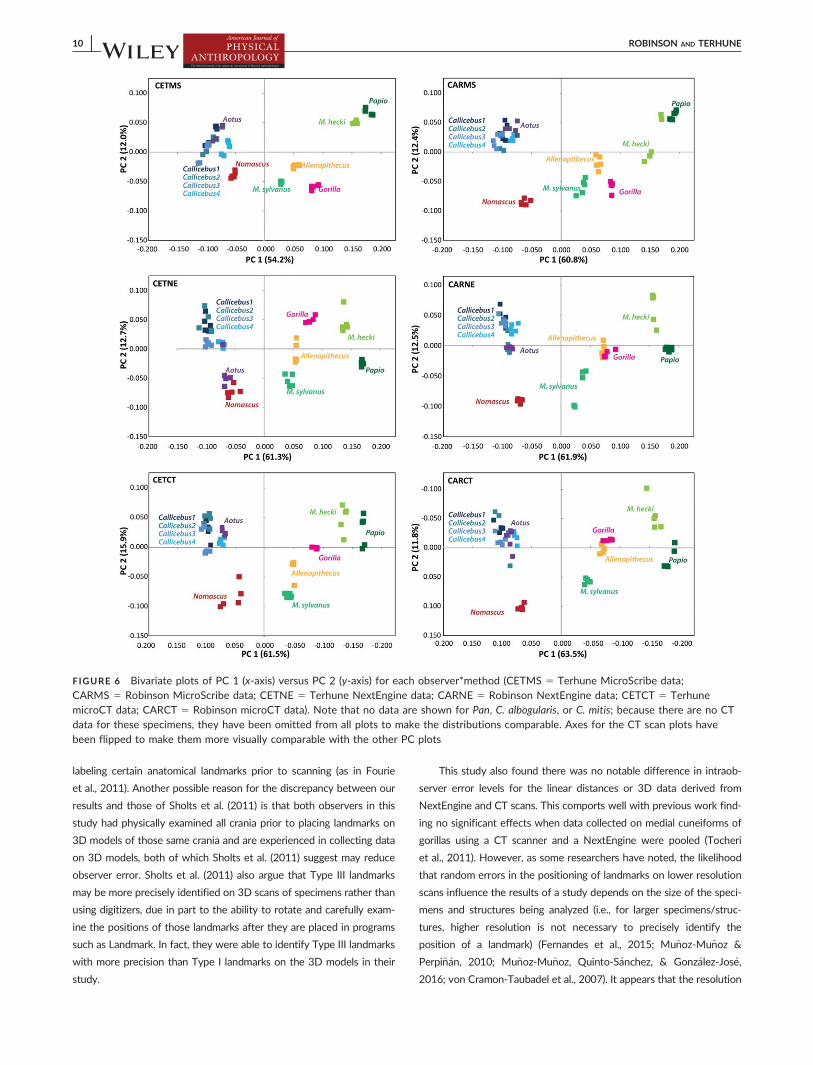
When PCAs were performed separately by observer and method
(Figure 6), specimen distributions on PC1 and 2 (which account for
over 65% of the variance in all six analyses) are broadly similar across
all plots, particularly on PC 1. On PC 2, the positions of the platyrrhine
specimens and Nomascus are fairly consistent on the six PCAs (with
the exception of Aotus grouping with Nomascus in the CETNE plot),
while there is more variation in the loadings of other catarrhine species.
In general, the three PCAs derived from data collected by each
observer using different methods are more similar to one another than
to those derived from data collected by the other observer using the
same method, although the two MicroScribe PCAs exhibit similarities
(particularly in the relative positions of the catarrhine taxa on the posi-
tive end of PC 1).
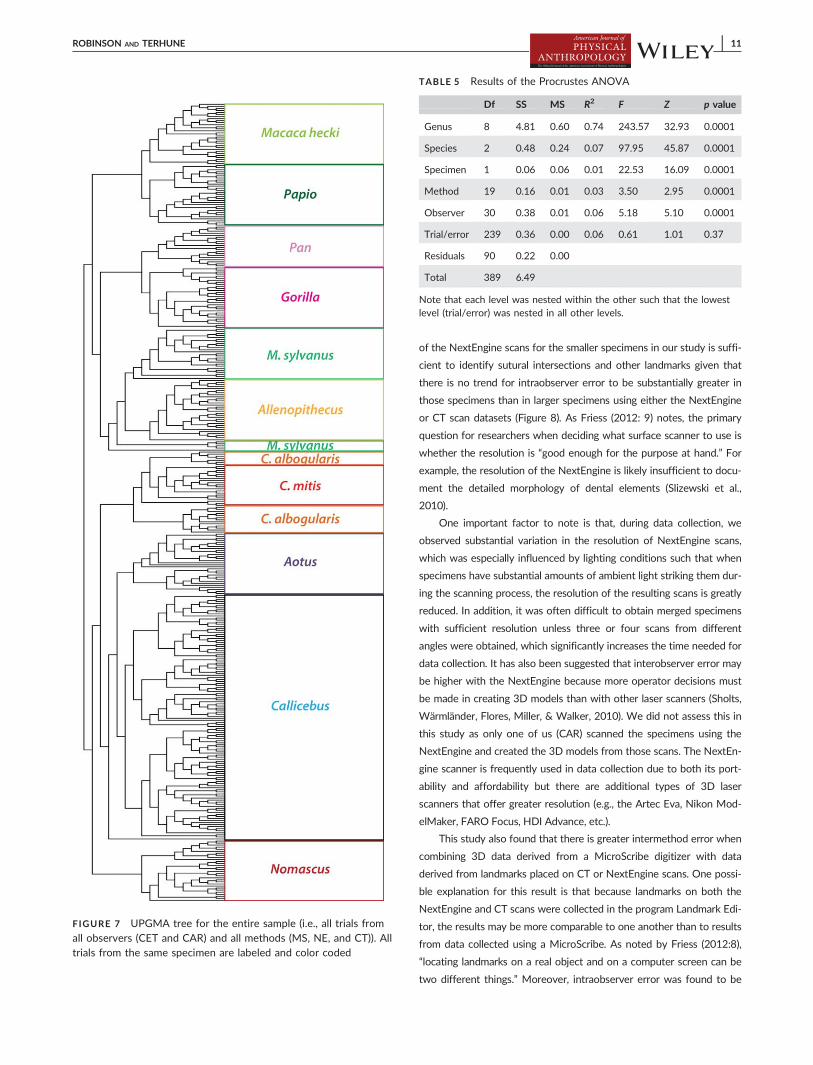
Trials of each specimen generally grouped together in the UPGMA
tree of the entire dataset (Figure 7 and Supporting Information, Figures
1–4). The most notable exception to this is with the Callicebus speci-
mens for which there were no consistent groupings. In addition, seven
trials of Cercopithecus albogularis group together with the Cercopithecus
mitis trials and five trials of Macaca sylvanus form an outgroup for the
Allenopithecus and M. sylvanus grouping. The topologies of the six
UPGMA trees (Supporting Information, Figures 5 and 6) based on data
collected by different observers/methods are similar to one another,
with the exception of the Callicebus specimens, with different combina-
tions of specimens (and, in a few cases, trials) grouping most closely
together in the six trees. In addition, three Macaca trials do not group
with the other trials collected on that specimen in the CARMS and
CARCT trees (Supporting Information, Figure 5).
Results of the Procrustes ANOVA (Table 5) echo those of the
ANOVA models of the linear distance data. All factors were significant
(p50.0001) contributors to shape variation in the model except for
trial/error. The factor with the highest R2 value was genus (0.7422),
followed by species (R2 5 0.07), observer (R2 5 0.06), method (R2 5
FIGURE 2 Bar chart showing the percentage variance attributed to each of the experimental levels in the hierarchical (nested) ANOVAmodel for each linear measurement and the average for all measurements
6 | ROBINSON AND TERHUNE
0.03), and specimen (R2 5 0.01). This suggests that shape variation
among taxa swamps error related to different observers or methods.
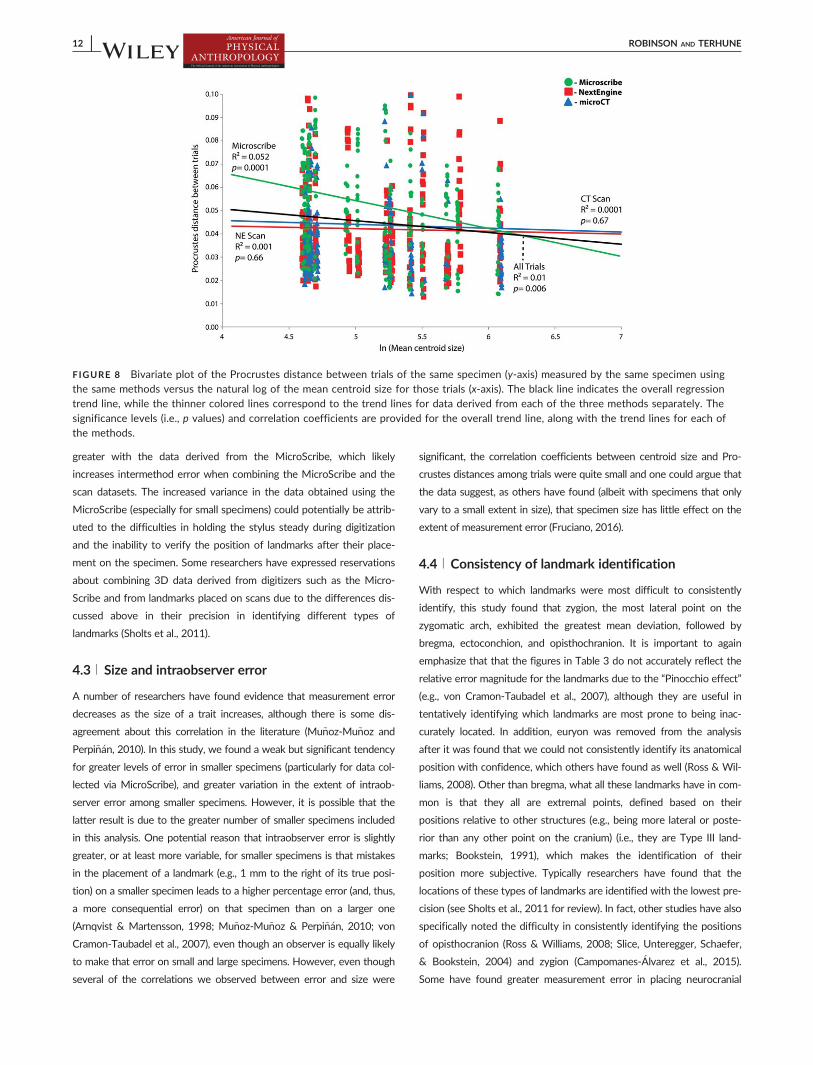
Overall, the correlation between mean centroid size and Pro-
crustes distance is weak but significant (p50.006), with a correlation
coefficient of 0.01 (Figure 8). However, in general there is less error in
measurements of larger specimens and there is less variance in the
extent of error for larger specimens. This weak relationship, with a
trend toward measurements of larger specimens exhibiting less error
than smaller individuals, was particularly notable for the MicroScribe
data (R2 5 0.052, p50.0001) (Figure 8).
The investigation of which landmarks were most difficult to consis-
tently position precisely found that four landmarks (bregma, opisthoc-
ranion, ectoconchion, and zygion) had substantially greater mean
deviations from the centroid landmark than all other landmarks (Table
3). Deviations from the mean were very similar between the left and
right sides for landmarks that were collected bilaterally.
4 | DISCUSSION
Limited access to museum collections, reductions in available funding
(along with increasing numbers of researchers applying for those
funds), and/or a lack of time to devote to data collection often necessi-
tates researchers pooling their data and/or including data from online
or published sources in their analyses. While this necessity is under-
standable, in studies where it is possible (e.g., where data are derived
from multiple colleagues or students contributing to the same project),
intra- and interobserver reliability tests should be (and typically are)
conducted prior to and following data collection to ensure comparabil-
ity of data. This is clearly important even for experienced researchers
as colleagues may have varying interpretations of the position of some
landmarks. However, when this is not possible, the results of this study
suggest that researchers should be cautious in compiling data collected
by multiple observers and/or using different methods, particularly if
the goal of the study in question is to examine intraspecific variation or
relationships among closely related species. In general, we found that
interobserver error is slightly greater than intermethod error and that
in general both overlap substantially with the levels of variance among
Callicebus cupreus individuals and that as well as with levels of variance
between Cercopithecus species. The one exception was the lower levels
of error produced when combining data derived from the NextEngine
and CT scans. This suggests that combining datasets collected by multi-
ple observers and/or using different methods may obscure researchers’
abilities to identify differences within and among closely related spe-
cies. It should be noted, however, that Callicebus cupreus is a relatively
monomorphic species (Ford, 1994) and, thus, one would expect intra-
specific variation to be relatively low in this taxon. It is possible that in
more dimorphic species, intraspecific variation may be significantly
greater than interobserver and intermethod error.
4.1 | Interobserver error
Previous studies examining interobserver error in collecting 3D data
have come to a variety of conclusions about whether it is advisable toTABLE4
Percentagevarian
ceattributed
toea
choftheex
perimen
talleve
lsforea
ch2D
linea
rvariab
le
RelMax
CranL
gRelMax
CranH
tRelMax
Br
RelNasalBr
RelNasalHg
RelPalateB
rRelPalateL
gRelFa
cialLg
RelBiArtBr
RelBiporB
rRelBiZyg
Br
RelMan
dLgL
RelMan
dLg
RRelBiorbBr
RelFMLg
Ave
rage
Gen
us84.3
83.2
64.9
73.5
46.0
61.7
88.0
62.9
63.5
24.0
51.8
69.6
64.2
90.1
25.2
63.5
Species
0.0
11.1
12.5
1.5
48.4
1.9
7.8
0.0
13.8
20.1
0.0
12.8
17.3
0.0
0.0
9.8
Specim
en13.2
2.8
14.5
4.8
2.1
17.9
0.3
31.5
3.2
21.2
36.5
11.8
9.8
1.0
69.9
16.0
Metho
d0.0
0.0
0.0
0.0
0.5
7.4
1.5
0.0
0.0
0.0
3.9
0.0
0.0
0.0
2.0
1.0
Observe
r1.5
1.7
4.6
16.8
1.7
3.8
1.3
3.4
11.5
18.0
3.4
3.2
3.0
7.2
0.7
5.5
Trial/E
rror
1.0
1.2
3.5
3.5
1.3
7.4
1.1
2.3
8.0
16.7
4.4
2.5
5.8
1.6
2.1
4.2
Value
sco
rrespo
ndto
Figure2.
ROBINSON AND TERHUNE | 7
combine datasets collected by different observers. Using angular, rela-
tive area, and curvature data derived from CT and NextEngine scans,
one analysis found that the effects of interobserver error were small
compared to differences between Gorilla taxa (Tocheri et al., 2011).
Another study reported that interobserver error of landmarks, while
three times greater than intraobserver error, was also acceptably small
compared to the size of the specimens (Singleton, 2002). Similarly,
interobserver variance in the position of landmarks and semilandmarks
was found to be quite small and had no influence on estimating the sex
of human crania using 3D morphometrics (Gonzalez et al., 2009).
Others, however, reported results similar to the current study by find-
ing significant interobserver error (Dujardin et al., 2010; Shearer et al.,
2014). One analysis (Shearer et al., 2014) that collected data using
laser/structured light and CT scans found rates of interobserver error
that were substantially higher than intraobserver and intermethod
error, to the extent that interobserver error was approximately equiva-
lent to the difference between two macaque species. Consequently,
this study concluded that interobserver error can potentially influence
the ability to correctly identify biological differences among species
(Shearer et al., 2014). Similarly, Dujardin et al. (2010) found that classifi-
cation errors of individuals to one of two closely related species
increased when multiple observers digitized specimens, rather than
when all data were collected by a single individual; thus, the repeatabil-
ity of landmark position identification was reduced when multiple
observers collected the data. Dujardin et al. (2010) subsequently noted
that web-based repositories for images would enable researchers to
download and digitize all specimens themselves, thereby eliminating
interobserver error. Another possibility, not discussed by those authors,
is to share the images among those collecting data for the project and
run interobserver reliability tests on a subset of the data to reduce
error due to multiple observers. This may be necessary if sample sizes
are large and/or researchers are constrained by a limited time budget.
FIGURE 4 Box plot of Procrustes distances within and among observers, methods, and taxa. Darkened bars represent the median valuefor each group, boxes show the interquartile range (25th to 75th percentile), and the whiskers extend to 1.5 times the interquartile range.Outliers are designated by circles
FIGURE 3 Box plots of mean error among specimens per methodfor each observer for the linear measurements. Darkened barsrepresent the median value for each group, boxes show theinterquartile range (25th to 75th percentile), and the whiskersextend to 1.5 times the interquartile range. Outliers are designatedby circles. p values represent the significance of differences inerror among methods
8 | ROBINSON AND TERHUNE
While the observers in this study both have extensive experience
with the collection of 3D landmark data on primate crania, interob-
server error levels could potentially be influenced by observers with
differing amounts of experience with identifying landmarks (Barbeito-
Andr�es et al., 2012; Fruciano, 2016; Shearer et al., 2014) or by the
extent to which researchers discuss how to define the positions of
landmarks prior to data collection. One recent study found no statisti-
cally significant difference between the placement of landmarks by stu-
dents and experts on photographs of faces from various orientations
(Campomanes-�Alvarez et al., 2015). However, another argued that
interobserver differences in the placement of landmarks and semi-
landmarks on 3D models derived from CT scans may be due to previ-
ous experience with landmarking and suggested that measurement
error may be reduced as researchers gain experience (Barbeito-Andr�es
et al., 2012).
4.2 | Intermethod error
Researchers often either assess themselves or use published data to
determine which methods afford the greatest degree of replicability,
making necessarily subjective decisions on their research design based
on how much error is acceptable for their particular study and also the
time and financial budget available. Certain methods—using a Micro-
Scribe digitizer, for example—are substantially faster than others, while
other techniques are much more expensive and time consuming and
do not employ transportable instruments (e.g., microCT). However,
these more demanding methods collect much more detailed informa-
tion about the specimen, including its internal structure, and, as the
results above suggest, may allow for more precision in the placement
of landmarks. Moreover, for some features, 3D surface or volumetric
scans may be necessary to sufficiently document their morphology.
While some have argued that scanners provide a preservational benefit
over digitizers in reducing contact with specimens (Friess, 2012), speci-
mens must still be handled and secured for scanning, which seems
more likely to cause damage than, for example, the tip of the Micro-
Scribe stylus. However, if scans are taken only once and then placed in
a repository, total handling of specimens via repeated data collection
can be decreased. The data presented in the current study show that
collecting linear data from scans rather than directly on the specimens
using calipers or a MicroScribe reduces error, although the differences
are fairly minor and the extent of intraobserver error is similar among
the three 3D methods. Mu~noz-Mu~noz and Perpi~n�an (2010) also docu-
mented greater measurement error in general when collecting data
with calipers than in linear data derived from landmarks placed on 2D
computerized images. While earlier studies found evidence that coordi-
nate data collected using digitizers were more precise than those col-
lected from CT scans (Williams & Richtsmeier, 2003), this may be due
to the lower resolution of the CT scanner used in those analyses. In
addition, Fernandes et al. (2015) found that measurements derived
from landmarks placed on 3D CT scans of human mandibles were sys-
tematically lower than those collected using calipers. They argued that
this may reflect a systematic error in the measurement software they
employed or could be related to the difficulty of taking measurements
on 3D volumetric specimens and suggested caution in collecting linear
data on 3D models. We found no evidence of such a systematic differ-
ence between the linear distances collected using calipers and from CT
scans. It should be noted, though, that different observers collected
the caliper and CT scan data in the Fernandes et al.’s (2015) study,
which potentially could have impacted their results.
Badawi-Fayad and Cabanis (2007) found that the repeatability of
digitizing the positions of landmarks for both the MicroScribe and CT
scans is very high (R50.99 for both), which implies similarly low levels
of intraobserver error in using these methods. Similarly, Fourie et al.
(2011: 133) reported no “clinical differences” between the accuracy
and reliability of anthropometric measurements taken from cadaver
heads using calipers and on 3D models created using data from laser
and CT scans and photogrammetry and suggested that datasets from
all of these sources could be combined in collaborative studies where
not all researchers have access to the same instruments. However,
they drew landmarks on the specimens using a black marker prior to
data collection, making the identification of those landmarks substan-
tially easier than in this study. Others have found that Type I and II
landmarks (Bookstein, 1991) can be more precisely identified using
digitizers such as the MicroScribe than on scans derived from NextEn-
gine laser scanners (Sholts et al., 2011). Part of the reason for the dif-
ference between the current results and those of Sholts et al. (2011)
may be that in the latter study, the researchers reported greater diffi-
culties in identifying landmarks on scans where the sutures were not
clearly visible due to altered surfaces on some of the crania in their
study. However, the authors of that study suggest that Type I and II
landmarks may be easier to identify on specimens than scans due in
part to the ability to palpate specimens when determining the position
of some anatomical features. Sholts et al. (2011) therefore advised
FIGURE 5 Bivariate plot of PC 1 (x-axis) versus PC 2 (y-axis) forthe entire sample, where all trials by observer, method, and for allspecimens are included. Convex hulls show distributions inmorphospace for each specimen. Note that there are no microCTdata for Pan, C. albogularis, or C. mitis
ROBINSON AND TERHUNE | 9
labeling certain anatomical landmarks prior to scanning (as in Fourie
et al., 2011). Another possible reason for the discrepancy between our
results and those of Sholts et al. (2011) is that both observers in this
study had physically examined all crania prior to placing landmarks on
3D models of those same crania and are experienced in collecting data
on 3D models, both of which Sholts et al. (2011) suggest may reduce
observer error. Sholts et al. (2011) also argue that Type III landmarks
may be more precisely identified on 3D scans of specimens rather than
using digitizers, due in part to the ability to rotate and carefully exam-
ine the positions of those landmarks after they are placed in programs
such as Landmark. In fact, they were able to identify Type III landmarks
with more precision than Type I landmarks on the 3D models in their
study.
This study also found there was no notable difference in intraob-
server error levels for the linear distances or 3D data derived from
NextEngine and CT scans. This comports well with previous work find-
ing no significant effects when data collected on medial cuneiforms of
gorillas using a CT scanner and a NextEngine were pooled (Tocheri
et al., 2011). However, as some researchers have noted, the likelihood
that random errors in the positioning of landmarks on lower resolution
scans influence the results of a study depends on the size of the speci-
mens and structures being analyzed (i.e., for larger specimens/struc-
tures, higher resolution is not necessary to precisely identify the
position of a landmark) (Fernandes et al., 2015; Mu~noz-Mu~noz &
Perpi~n�an, 2010; Mu~noz-Mu~noz, Quinto-S�anchez, & Gonz�alez-Jos�e,
2016; von Cramon-Taubadel et al., 2007). It appears that the resolution
FIGURE 6 Bivariate plots of PC 1 (x-axis) versus PC 2 (y-axis) for each observer*method (CETMS 5 Terhune MicroScribe data;CARMS 5 Robinson MicroScribe data; CETNE 5 Terhune NextEngine data; CARNE 5 Robinson NextEngine data; CETCT 5 TerhunemicroCT data; CARCT 5 Robinson microCT data). Note that no data are shown for Pan, C. albogularis, or C. mitis; because there are no CTdata for these specimens, they have been omitted from all plots to make the distributions comparable. Axes for the CT scan plots have
been flipped to make them more visually comparable with the other PC plots
10 | ROBINSON AND TERHUNE
of the NextEngine scans for the smaller specimens in our study is suffi-
cient to identify sutural intersections and other landmarks given that
there is no trend for intraobserver error to be substantially greater in
those specimens than in larger specimens using either the NextEngine
or CT scan datasets (Figure 8). As Friess (2012: 9) notes, the primary
question for researchers when deciding what surface scanner to use is
whether the resolution is “good enough for the purpose at hand.” For
example, the resolution of the NextEngine is likely insufficient to docu-
ment the detailed morphology of dental elements (Slizewski et al.,
2010).
One important factor to note is that, during data collection, we
observed substantial variation in the resolution of NextEngine scans,
which was especially influenced by lighting conditions such that when
specimens have substantial amounts of ambient light striking them dur-
ing the scanning process, the resolution of the resulting scans is greatly
reduced. In addition, it was often difficult to obtain merged specimens
with sufficient resolution unless three or four scans from different
angles were obtained, which significantly increases the time needed for
data collection. It has also been suggested that interobserver error may
be higher with the NextEngine because more operator decisions must
be made in creating 3D models than with other laser scanners (Sholts,
Wärmländer, Flores, Miller, & Walker, 2010). We did not assess this in
this study as only one of us (CAR) scanned the specimens using the
NextEngine and created the 3D models from those scans. The NextEn-
gine scanner is frequently used in data collection due to both its port-
ability and affordability but there are additional types of 3D laser
scanners that offer greater resolution (e.g., the Artec Eva, Nikon Mod-
elMaker, FARO Focus, HDI Advance, etc.).
This study also found that there is greater intermethod error when
combining 3D data derived from a MicroScribe digitizer with data
derived from landmarks placed on CT or NextEngine scans. One possi-
ble explanation for this result is that because landmarks on both the
NextEngine and CT scans were collected in the program Landmark Edi-
tor, the results may be more comparable to one another than to results
from data collected using a MicroScribe. As noted by Friess (2012:8),
“locating landmarks on a real object and on a computer screen can be
two different things.” Moreover, intraobserver error was found to be
FIGURE 7 UPGMA tree for the entire sample (i.e., all trials fromall observers (CET and CAR) and all methods (MS, NE, and CT)). Alltrials from the same specimen are labeled and color coded
TABLE 5 Results of the Procrustes ANOVA
Df SS MS R2 F Z p value
Genus 8 4.81 0.60 0.74 243.57 32.93 0.0001
Species 2 0.48 0.24 0.07 97.95 45.87 0.0001
Specimen 1 0.06 0.06 0.01 22.53 16.09 0.0001
Method 19 0.16 0.01 0.03 3.50 2.95 0.0001
Observer 30 0.38 0.01 0.06 5.18 5.10 0.0001
Trial/error 239 0.36 0.00 0.06 0.61 1.01 0.37
Residuals 90 0.22 0.00
Total 389 6.49
Note that each level was nested within the other such that the lowestlevel (trial/error) was nested in all other levels.
ROBINSON AND TERHUNE | 11
greater with the data derived from the MicroScribe, which likely
increases intermethod error when combining the MicroScribe and the
scan datasets. The increased variance in the data obtained using the
MicroScribe (especially for small specimens) could potentially be attrib-
uted to the difficulties in holding the stylus steady during digitization
and the inability to verify the position of landmarks after their place-
ment on the specimen. Some researchers have expressed reservations
about combining 3D data derived from digitizers such as the Micro-
Scribe and from landmarks placed on scans due to the differences dis-
cussed above in their precision in identifying different types of
landmarks (Sholts et al., 2011).
4.3 | Size and intraobserver error
A number of researchers have found evidence that measurement error
decreases as the size of a trait increases, although there is some dis-
agreement about this correlation in the literature (Mu~noz-Mu~noz and
Perpi~n�an, 2010). In this study, we found a weak but significant tendency
for greater levels of error in smaller specimens (particularly for data col-
lected via MicroScribe), and greater variation in the extent of intraob-
server error among smaller specimens. However, it is possible that the
latter result is due to the greater number of smaller specimens included
in this analysis. One potential reason that intraobserver error is slightly
greater, or at least more variable, for smaller specimens is that mistakes
in the placement of a landmark (e.g., 1 mm to the right of its true posi-
tion) on a smaller specimen leads to a higher percentage error (and, thus,
a more consequential error) on that specimen than on a larger one
(Arnqvist & Martensson, 1998; Mu~noz-Mu~noz & Perpi~n�an, 2010; von
Cramon-Taubadel et al., 2007), even though an observer is equally likely
to make that error on small and large specimens. However, even though
several of the correlations we observed between error and size were
significant, the correlation coefficients between centroid size and Pro-
crustes distances among trials were quite small and one could argue that
the data suggest, as others have found (albeit with specimens that only
vary to a small extent in size), that specimen size has little effect on the
extent of measurement error (Fruciano, 2016).
4.4 | Consistency of landmark identification
With respect to which landmarks were most difficult to consistently
identify, this study found that zygion, the most lateral point on the
zygomatic arch, exhibited the greatest mean deviation, followed by
bregma, ectoconchion, and opisthochranion. It is important to again
emphasize that that the figures in Table 3 do not accurately reflect the
relative error magnitude for the landmarks due to the “Pinocchio effect”
(e.g., von Cramon-Taubadel et al., 2007), although they are useful in
tentatively identifying which landmarks are most prone to being inac-
curately located. In addition, euryon was removed from the analysis
after it was found that we could not consistently identify its anatomical
position with confidence, which others have found as well (Ross & Wil-
liams, 2008). Other than bregma, what all these landmarks have in com-
mon is that they all are extremal points, defined based on their
positions relative to other structures (e.g., being more lateral or poste-
rior than any other point on the cranium) (i.e., they are Type III land-
marks; Bookstein, 1991), which makes the identification of their
position more subjective. Typically researchers have found that the
locations of these types of landmarks are identified with the lowest pre-
cision (see Sholts et al., 2011 for review). In fact, other studies have also
specifically noted the difficulty in consistently identifying the positions
of opisthocranion (Ross & Williams, 2008; Slice, Unteregger, Schaefer,
& Bookstein, 2004) and zygion (Campomanes-�Alvarez et al., 2015).
Some have found greater measurement error in placing neurocranial
FIGURE 8 Bivariate plot of the Procrustes distance between trials of the same specimen (y-axis) measured by the same specimen usingthe same methods versus the natural log of the mean centroid size for those trials (x-axis). The black line indicates the overall regressiontrend line, while the thinner colored lines correspond to the trend lines for data derived from each of the three methods separately. The
significance levels (i.e., p values) and correlation coefficients are provided for the overall trend line, along with the trend lines for each ofthe methods.
12 | ROBINSON AND TERHUNE

landmarks on 3D models of CT scans than those on the facial skeleton,
and attributed that finding to the higher number of Type III landmarks
on the neurocranium (Barbeito-Andr�es et al., 2012). In the case of
bregma (a Type I landmark), particularly for the scans (and especially on
the NextEngine scans), it was often difficult to identify where the sagit-
tal and coronal sutures intersected, which, others have argued, would
make bregma a Type II landmark (Sholts et al., 2011). In an analysis
using a MicroScribe, intra- and interobserver error for identifying
bregma was very low (von Cramon-Taubadel et al., 2007), suggesting
that it may be easier to consistently digitize on the actual specimen.
5 | CONCLUSIONS
Our results suggest that researchers should be cautious when compil-
ing data from multiple methods and/or observers, especially if their
analyses are focused on intraspecific variation or differences among
closely related species, as in these cases patterns among individuals
may be obscured by interobserver and intermethod error. As others
have noted, the extent to which researchers need to be concerned
about measurement error is inversely proportional to the extent of
interindividual differences in the sample, with it being a particular prob-
lem in studies of shape variation within species (Arnqvist & Martens-
son, 1998), especially in species that exhibit limited intraspecific
variation. Conducting interobserver and intermethod reliability assess-
ments prior to the collection of data is recommended, and compiling
data from published sources should be avoided if possible for studies
of closely related individuals. Unfortunately, researchers at many insti-
tutions and/or in many parts of the world do not have access to the
funding and infrastructure resources necessary to conduct interob-
server reliability assessments and, consequently, often must rely on
published datasets or data collected by colleagues. This problem may
be somewhat alleviated in the future with the greater availability of 3D
scans in online repositories (e.g., morphosource.org, digimorph.org) and
researchers should be encouraged to contribute their data to these
sources to help reduce the inequalities of access to data. These reposi-
tories serve a dual purpose of providing more researchers access to
data from museum collections and preserving those valuable collec-
tions from wear and breakage due to repeated handling. However, until
such time as sample sizes increase in these online collections and they
become more widely available, researchers will need to work together
in combining datasets. In doing so, we urge them to think carefully
about their research design and whether the error introduced in using
multiple methods and/or data from multiple observers could influence
the results of their study.
In addition, it appears that there is some preliminary evidence that
repeatability and precision are greatest using landmarks placed on
microCT and NextEngine scans and least using the Microscribe, fol-
lowed by calipers. However, the differences among methods are not
substantial and researchers should weigh cost, time, and accuracy in
deciding which method to use for their study. Similarly, this study pro-
vides preliminary evidence, in support of the results published by other
researchers, that the repeatability of some Type III landmarks is lower
than that of Type I and II landmarks, but some structures cannot be
characterized using only Type I and II landmarks; thus, the inclusion of
Type III landmarks and/or semilandmarks in some studies will be neces-
sary if they can be identified with reasonable consistency.
ACKNOWLEDGMENTS
The authors would like to thank the New York Consortium in Evolu-
tionary Primatology and Eric Delson for access to the NextEngine
scanners housed at the American Museum of Natural History and for
their permission to use the CT scans in the PRIMO database (primo.
nycep.org). The authors would also like to thank Lauren Halenar for
her help in facilitating access to and for discussions about the scans in
the PRIMO repository and the methods used in this study. In addition,
the authors thank Eileen Westwig at the American Museum of Natural
History for access to the primate skeletal collections under her care.
Travel support for CET was provided by the University of Arkansas.
This is NYCEP Morphometrics contribution number 102. The authors
thank two anonymous reviewers and an associate editor who kindly
provided feedback on an earlier version of this manuscript.
REFERENCES
Adams, D. C., & Otarola-Castillo, E. (2013). Geomorph: An R package for
the collection and analysis of geometric morphometric shape data.
Methods in Ecology and Evolution, 4, 393–399.
Adams, J. W., Olah, A., McCurry, M. R., & Potze, S. (2015). Surface
model and tomographic archive of fossil primate and other mammal
holotype and paratype specimens of the Ditsong National Museum
of Natural History, Pretoria, South Africa. PLoS One, 10, e0139800.
Anderson, M. J. (2001). A new method for non-parametric multivariate
analysis of variance. Austral Ecology, 26, 32–46.
Arnqvist, G., & Martensson, T. (1998). Measurement error in geometric
morphometrics: Empirical strategies to assess and reduce its impact
on measures of shape. Acta Zoologica Academiae Scientiarum Hungari-
cae, 44, 73–96.
Badawi-Fayad, J., & Cabanis, E. A. (2007). Three-dimensional Procrustes
analysis of modern human craniofacial form. The Anatomical Record,
290, 268–276.
Barbeito-Andr�es, J., Anzelmo, M., Ventrice, F., & Sardi, M. L. (2012).
Measurement error of 3D cranial landmarks of an ontogenetic sam-
ple using computed tomography. Journal of Oral Biology and Craniofa-
cial Research, 2, 77–82.
Bookstein, F. L. (1991). Morphometric tools for landmark data. Cambridge:
Cambridge University Press.
Campomanes-�Alvarez, B. R., Ib�a~nez, O., Navarro, F., Alem�an, I., Cord�on,
O., & Damas, S. (2015). Dispersion assessment in the location of
facial landmarks on photographs. International Journal of Legal Medi-
cine, 129, 227–236.
Collyer, M. L., Sekora, D. J., & Adams, D. C. (2015). A method for analy-
sis of phenotypic change for phenotypes described by high-
dimensional data. Heredity, 115, 357–365.
Copes, L. E., Lucas, L. M., Thostenson, J. O., Hoekstra, H. E., & Boyer, D.
M. (2016). A collection of non-human primate computed tomography
scans housed in MorphoSource, a repository for 3D data. Scientific
Data, 3, 160001.
Dujardin, J. P. A., Kaba, D., & Henry, A. B. (2010). The exchangeability of
shape. BMC Research Notes, 3, 266.
ROBINSON AND TERHUNE | 13

Fajardo, R. J., Ryan, T. M., & Kappelman, J. (2002). Assessing the accu-
racy of high-resolution X-Ray computed tomography of primate tra-
becular bone by comparisons with histological sections. American
Journal of Physical Anthropology, 118, 1–10.
Fernandes, T. M. F., Adamczyk, J., Poleti, M. L., Henriques, J. F. C., Fried-
land, B., & Garib, D. G. (2015). Comparison between 3D volumetric
rendering and multiplanar slices on the reliability of linear measure-
ments on CBCT images: An in vitro study. Journal of Applied Oral Sci-
ence, 23, 56–63.
Ford, S. M. (1994). Evolution of sexual dimorphism in body weight in pla-
tyrrhines. American Journal of Primatology, 34, 221–244.
Fourie, Z., Damstra, J., Gerrits, P. O., & Ren, Y. (2011). Evaluation of anthro-
pometric accuracy and reliability using different three-dimensional scan-
ning systems. Forensic Science International, 207, 127–134.
Friess, M. (2012). Scratching the surface? The use of surface scanning in
physical and paleoanthropology. Journal of Anthropological Sciences,
90, 1–25.
Fruciano, C. (2016). Measurement error in geometric morphometrics.
Development Genes and Evolution, 1–20.
Gonzalez, P. N., Bernal, V., & Perez, S. I. (2009). Analysis of sexual dimor-
phism of craniofacial traits using geometric morphometric techniques.
International Journal of Osteoarchaeology, 21, 82–91.
Goodall, C. R. (1991). Procrustes methods in the statistical analysis of
shape. Journal of the Royal Statistical Society Series B, 53, 285–339.
Hanihara, T., Dodo, Y., Kondo, O., Nara, T., Doi, N., & Sensui, N. (1999).
Infra- and interobserver errors in facial flatness measurements.
Anthropological Science, 107, 25–39.
Hassett, B. R., & Lewis-Bale, T. (2016). Comparison of 3D landmark and
3D dense cloud approaches to hominin mandible morphometrics
using structure-from-motion. Archaeometry, https://doi.org/10.1111/
arcm.12229.
Katz, D., & Friess, M. (2014). Technical note: 3D from standard digital
photography of human crania—a preliminary assessment. American
Journal of Physical Anthropology, 154, 152–158.
Kouchi, M., & Koizumi, K. (1985). An analysis of errors in craniometry.
Journal of the Anthropological Society of Nippon, 93, 409–424.
Mu~noz-Mu~noz, F., & Perpi~n�an, D. (2010). Measurement error in morpho-
metric studies: Comparison between manual and computerized meth-
ods. Annales Zoologici Fennici, 47, 46–56.
Mu~noz-Mu~noz, F., Quinto-S�anchez, M., & Gonz�alez-Jos�e, R. (2016). Pho-
togrammetry: A useful tool for three-dimensional morphometric anal-
ysis of small mammals. Journal of Zoological Systematics and
Evolutionary Research, doi:10.1111/jzs.12137.
O’Higgins, P., & Jones, N. (1998). Morphologika a program for the analy-
sis of 3-dimensional shape variation using landmarks.
R Development Core Team. (2008). R: A language and environment for
statistical computing. Vienna: R Foundation for Statistical Computing.
Ross, A. H., & Williams, S. (2008). Testing repeatability and error of coor-
dinate landmark data acquired from crania. Journal of Forensic Scien-
ces, 53, 782–785.
Shaner, D. J., Bamforth, J. S., Peterson, A. E., & Beattie, O. B. (1998).
Technical note: Different techniques, different results-a comparison
of photogrammetric and caliper derived measurements. American
Journal of Physical Anthropology, 106, 547–552.
Shearer, B. M., Tallman, M., Cooke, S. B., Halenar, L. B., Reber, S. L.,
Plummer, J., & Delson, E. (2014). Evaluating causes of error in
landmark-based data collection using scanners. American Journal of
Physical Anthropology, Supplement, 56, 237–238.
Sholts, S. B., Wärmländer, S. K., Flores, L. M., Miller, K. W., & Walker, P.
L. (2010). Variation in the measurement of cranial volume and sur-
face area using 3D laser scanning technology. Journal of Forensic Sci-
ences, 55, 871–876.
Sholts, S. B., Flores, L., Walker, P. L., & Wärmländer, S. K. T. S. (2011).
Comparison of coordinate measurement precision of different land-
mark types on human crania using a 3D laser scanner and a 3D digi-
tiser: Implications for applications of digital morphometrics.
International Journal of Osteoarchaeology, 21, 535–543.
Singleton, M. (2002). Patterns of cranial shape variation in the Papionini
(Primates: Cercopithecinae). Journal of Human Evolution, 42,
547–578.
Slice, D. E., Unteregger, C., Schaefer, E., & Bookstein, F. L. (2004). Mod-
eling the precision of landmark location data. American Journal of
Physical Anthropology, Supplement, 36, 183.
Slizewski, A., Friess, M., & Semal, P. (2010). Surface scanning of anthro-
pological specimens: Nominal-actual comparison with low cost laser
scanner and high end fringe light projection surface scanning sys-
tems. Quartär, 57, 179–187.
Smith, R. J., & Jungers, W. L. (1997). Body mass in comparative primatol-
ogy. Journal of Human Evolution, 32, 523–559.
Tocheri, M. W., Solhan, C. R., Orr, C. M., Femiani, J., Frohlich, B., Groves,
C. P., . . . Jungers, W. L. (2011). Ecological divergence and medial
cuneiform morphology in gorillas. Journal of Human Evolution, 60,
171–184.
Utermohle, C. J., Zegura, S. L., & Heathcote, G. M. (1983). Multiple
observers, humidity, and choice of precision statistics: Factors influ-
encing craniometric data quality. American Journal of Physical Anthro-
pology, 61, 85–95.
von Cramon-Taubadel, N., Frazier, B. C., & Lahr, M. M. (2007). The prob-
lem of assessing landmark error in geometric morphometrics: Theory,
methods, and modifications. American Journal of Physical Anthropol-
ogy, 134, 24–35.
Wiley, D. F., Amenta, N., Alcantara, D. A., Ghosh, D., Kil, Y. J., Delson, E., . . .
Hamann, B. (2005). Evolutionary morphing. Proceedings of the IEEE Visu-
alization 2005 (VIS’05), 431–438.
Williams, F. L. E., & Richtsmeier, J. T. (2003). Comparison of mandibular
landmarks from computed tomography and 3D digitizer data. Clinical
Anatomy, 16, 494–500.
SUPPORTING INFORMATION
Additional Supporting Information may be found in the online ver-
sion of this article.
How to cite this article: Robinson C, Terhune CE. Error in geo-
metric morphometric data collection: Combining data from mul-
tiple sources. Am J Phys Anthropol. 2017;00:1–15. https://doi.
org/10.1002/ajpa.23257
14 | ROBINSON AND TERHUNE