error and error mitigation in low-coverage genome assemblies
TRANSCRIPT
Error and Error Mitigation in Low-Coverage GenomeAssembliesMelissa J. Hubisz1, Michael F. Lin2, Manolis Kellis2,3, Adam Siepel1,4*
1 Department of Biological Statistics and Computational Biology, Cornell University, Ithaca, New York, United States of America, 2 Broad Institute of Massachusetts
Institute of Technology and Harvard University, Cambridge, Massachusetts, United States of America, 3 Computer Science and Artificial Intelligence Laboratory,
Massachusetts Institute of Technology, Cambridge, Massachusetts, United States of America, 4 Cornell Center for Comparative and Population Genomics, Cornell
University, Ithaca, New York, United States of America
Abstract
The recent release of twenty-two new genome sequences has dramatically increased the data available for mammaliancomparative genomics, but twenty of these new sequences are currently limited to ,26 coverage. Here we examine theextent of sequencing error in these 26 assemblies, and its potential impact in downstream analyses. By comparing 26assemblies with high-quality sequences from the ENCODE regions, we estimate the rate of sequencing error to be 1–4 errorsper kilobase. While this error rate is fairly modest, sequencing error can still have surprising effects. For example, anapparent lineage-specific insertion in a coding region is more likely to reflect sequencing error than a true biological event,and the length distribution of coding indels is strongly distorted by error. We find that most errors are contributed by asmall fraction of bases with low quality scores, in particular, by the ends of reads in regions of single-read coverage in theassembly. We explore several approaches for automatic sequencing error mitigation (SEM), making use of the localizednature of sequencing error, the fact that it is well predicted by quality scores, and information about errors that comes fromcomparisons across species. Our automatic methods for error mitigation cannot replace the need for additional sequencing,but they do allow substantial fractions of errors to be masked or eliminated at the cost of modest amounts of over-correction, and they can reduce the impact of error in downstream phylogenomic analyses. Our error-mitigated alignmentsare available for download.
Citation: Hubisz MJ, Lin MF, Kellis M, Siepel A (2011) Error and Error Mitigation in Low-Coverage Genome Assemblies. PLoS ONE 6(2): e17034. doi:10.1371/journal.pone.0017034
Editor: Thomas Mailund, Aarhus University, Denmark
Received November 19, 2010; Accepted January 10, 2011; Published February 14, 2011
Copyright: � 2011 Hubisz et al. This is an open-access article distributed under the terms of the Creative Commons Attribution License, which permitsunrestricted use, distribution, and reproduction in any medium, provided the original author and source are credited.
Funding: This work was supported by NSF Faculty Early Career Development grants DBI-0644111 (AS) and DBI-0644282 (MK, MFL), NIH grant U54 HG004555-01(MK, MFL), and a David and Lucile Packard Fellowship for Science and Engineering (AS, MJH). No additional external funding was received for this study. Thefunders had no role in study design, data collection and analysis, decision to publish, or preparation of the manuscript.
Competing Interests: The authors have declared that no competing interests exist.
* E-mail: [email protected]
Introduction
The field of comparative mammalian genomics has been given
an enormous boost by the recent release of genome assemblies for
22 previously unsequenced species of eutherian (placental)
mammals (26 Mammals Consortium, in prep.). These new
assemblies increase the number of sequenced eutherian species
by nearly fourfold, and provide an opportunity for many new
functional and evolutionary insights in mammalian genomics.
Nevertheless, twenty of these twenty-two genome sequences are
currently available only as low- coverage (,26) assemblies
(Table 1), produced using traditional, capillary sequencing
methods. Most of these twenty will eventually be sequenced to
higher coverage (see http://www.genome.gov/10002154), but
even with advances in next-generation sequencing, the task of
‘‘topping them up’’ remains daunting and will require years to
complete. In the meantime, the data available for mammalian
comparative genomics will be heavily dominated by low-coverage
sequence.
While these low-coverage assemblies are valuable for many
purposes, reduced sequencing redundancy has some inevitable
costs. For example, low-coverage assemblies have decreased levels
of contiguity, which can severely limit their usefulness in
identifying rearrangements, duplications, and repetitive elements
[1]. In addition, low-coverage assemblies necessarily have elevated
levels of sequencing error—that is, miscalled bases and erroneous
insertions and deletions, which might otherwise be corrected
through redundant sequencing of the same genomic region. This
issue of sequencing error in 26genomes is our focus in this article.
To our knowledge, this issue has not been studied in detail, despite
its potential importance in many applications in comparative
genomics, including phylogenetic modeling, the detection of
positive selection, and comparative gene finding. Several potential
limitations of low-coverage assemblies were examined by Margu-
lies et al. [2], but their study focused on assembly and alignment
error, and its influence on the detection power for conserved
elements in mammalian genomes.
Considered more broadly, sequencing error is, of course, not a
new concern. Early sequencing studies tended to consider the issue
of error informally and qualitatively [3], but by the late 1980s and
early 1990s, the need for a more rigorous, quantitative treatment
became apparent. At this time, efforts were undertaken to measure
the overall error rates in the growing sequence databases [4], to
detect errors automatically in protein-coding sequences [5], and to
incorporate explicit models of sequencing error into algorithms for
alignment and assembly [6,7]. By the late 1990s, phred quality
PLoS ONE | www.plosone.org 1 February 2011 | Volume 6 | Issue 2 | e17034
scores [8] (see also [9]) had become established as a standard,
highly accurate method for quantifying the probability of error at
each nucleotide in a sequence. A trend toward high-coverage
sequencing led to reduced concern with sequencing error in the
early 2000s, and error was essentially ignored in most of the
comparative genomic studies of mammals carried out during this
period [10–12]. More recently, however, error has re-emerged as
an important concern in sequence analysis, in part because errors
occur at elevated rates in the reads produced by many next-
generation sequencing technologies. Error is an important
consideration in applications in population genetics, in which
care is required to distinguish errors from polymorphisms [13–16],
in mapping short read sequences to reference genomes [17], in de
novo assembly from short reads [18], and in improving genome
finishing [19]. In addition, sequencing error has been shown to
have important effects in comparative genomics, particularly in
genomic scans for positive selection [20,21]. One recent study has
shown that indel error occurs at appreciable rates in the draft-
quality orangutan and chimpanzee genomes assemblies [22].
In this article, we estimate the rates at which substitution,
insertion, and deletion errors occur in the current 26 assemblies,
by comparing them with high-coverage sequences from the
ENCODE project [23]. We show that these assemblies exhibit
modest but non-negligible levels of sequencing error, which, if
ignored, can produce biases in downstream phylogenomic
analyses. We show that the error present in these assemblies is
strongly concentrated in regions of single-read coverage, partic-
ularly at the ends of reads. Next, we explore the possibility of
applying automatic methods for sequencing error mitigation (SEM),
including masking of bases likely to be miscalled and ‘‘correction’’
of indels likely to be spurious. We show that even quite simple
strategies are capable of eliminating fairly large fractions of
sequencing errors at the cost of a modest amount of ‘‘over-
correction’’. At least for some downstream analyses, the benefits of
eliminating true errors appear to outweigh the costs of obscuring a
fraction of true genomic mutations. Our error-mitigated align-
ments of 32 vertebrate genomes are available from http://
compgen. bscb.cornell.edu/pro jects/32way-masked/, and our
software for SEM is available by request.
Results
Assessment of sequencing errorWe measured sequencing error in the newly available low-
coverage (,26) genome by comparing them with corresponding
‘‘comparative-grade’’ sequences from the ENCODE project
[23,24] (Table 1). The bacterial artificial chromosome (BAC)-
based ENCODE sequences exhibit high quality, with a sequencing
error rate of ,1 in 10,000 bases [25], and high coverage, with
representation from 31 mammalian species (see http://www.nisc.
nih.gov/projects/encode/) and 44 genomic regions spanning
,30 Mbp (,1%) of the human genome. We restricted our
comparison to the fourteen 26 species that have been sequenced
in the ENCODE regions, additionally including the ,76 guinea
pig for comparison (Table 1 and Table S1). To our knowledge,
there is no comparable ‘‘gold standard’’ available for the
remaining six 26 species.
For each of the fifteen species of interest, we aligned the entire
26 assembly against the ENCODE sequences for that species,
then applied a series of filters to ensure that corresponding regions
were aligned with high confidence (see Materials and Methods).
These alignments could then be examined for mismatching bases
and alignment gaps, with mismatches indicating potential
miscalled bases, gaps in the ENCODE sequences indicating
potential insertion errors, and gaps in the 26assemblies indicating
potential deletion errors. After filtering, the pairwise alignments for
the 26 species contained 2.1–20.1 Mbp of aligned sequence per
species, depending in large part on the ENCODE sequencing
coverage (Table S2). In most cases, half or more of the bases in the
available ENCODE sequences were in alignment with the 26assemblies (fractions ranged from 38–84%), indicating good
coverage in the 26 assemblies and a reasonably sensitive
alignment procedure, despite the use of conservative filters. These
Table 1. Species and genome assemblies considered in thisstudy.
Speciesa Assemblyb Coveragec ENCODEd
human hg18 complete –
chimp panTro2 6.06 –
rhesus rheMac2 5.16 –
tarsier tarSyr1 2.06 –
mouse lemur micMur1 1.96 43
bushbaby otoGar1 1.96 44
tree shrew tupBel1 1.96 4
mouse mm9 completee –
rat rn4 completee –
kangaroo rat dipOrd1 2.06 –
guinea pig cavPor3 6.86 41
squirrel speTri1 1.96 44
rabbit oryCun1 2.06 43
pika ochPri2 1.96 –
alpaca vicPac1 2.06 –
dolphin turTru1 2.06 –
cow bosTau4 7.16 –
horse equCab2 6.86 –
cat felCat3 1.96 43
dog canFam2 7.66 –
microbat myoLuc1 1.86 41
megabat pteVam1 2.66 5
hedgehog eriEur1 1.96 39
shrew sorAra1 1.96 41
elephant loxAfr2 1.96 44
rock hyrax proCap1 2.26 6
tenrec echTel1 1.96 42
armadillo dasNov2 2.06 44
sloth choHof1 2.06 –
opossum monDom4 6.86 –
chicken galGal3 6.66 –
tetraodon tetNig1 7.96 –
aAbbreviated common names used by the 26Mammals Consortium are listedhere. In some cases, different names have been used in the ENCODE project(see Table S1).
bUCSC designation.cReported average coverage.dNumber of ENCODE regions for which high-quality sequence is available, or
‘‘–’’ if ENCODE sequence is unavailable.eThe mouse and rat assemblies are considered ‘‘essentially complete’’ but someimprovements are still underway (see http://www.ncbi.nlm.nih.gov/genome/assembly/grc/mouse/ and http://www.hgsc.bcm.tmc.edu/project-species-m-Rat.hgsc?pageLocation=Rat).
doi:10.1371/journal.pone.0017034.t001
Error in Low-Coverage Genome Assemblies
PLoS ONE | www.plosone.org 2 February 2011 | Volume 6 | Issue 2 | e17034

fractions are probably influenced by various factors, including the
degree of contiguity of both the ENCODE and 26 genomes
(which will affect alignability), the repetitive content of the
genomes, and differences in the DNA sources for the two
sequencing projects (see below).
Error rates. The mismatch rates for aligned 26 and
ENCODE bases ranged from 2.6 (elephant) to 25.1 (hedgehog)
mismatches per kb (Table 2), while the indel rates showed somewhat
less variation, with insertion rates from 0.22 (megabat) to 0.86
(hedgehog) per kb and deletion rates from 0.24 (tenrec) to 0.77
(microbat) per kb. Both mismatch and indel rates generally
decreased with increasing quality scores (Figure 1), as expected,
but the limiting rates—at the highest quality scores—differed
considerably among species. This is because the observed
differences not only reflect sequencing errors, which are expected
to occur at similar rates across species, but they also reflect true
genomic differences between the individuals sequenced for the 26and ENCODE projects, which will depend on the diversity of the
sampled populations, the relatedness of the sampled individuals,
and other factors. Indeed, the largest mismatch rates at high quality
scores were observed with the hedgehog, for which separate (but
closely related) species were sequenced in the ENCODE (middle-
African hedgehog) and 26 (European hedgehog) projects. The
second largest mismatch rates were observed with the microbat, for
which some evidence of elevated levels of intraspecific genetic
variation has been reported [26], while the smallest mismatch rates
occurred with the African savannah elephant, which has been
reported to have low average genetic diversity [27].
To disentangle the contributions of polymorphism and sequenc-
ing error, we used the observed difference rates at the highest quality
bases (quality score $45) as rough estimates of polymorphism rates,
under the assumption that error is negligible compared with
polymorphism at these bases. We then subtracted these estimates
from the overall observed rates to obtain approximate polymor-
phism-corrected error rates. As a side-benefit, this approach should
at least partly correct for ENCODE sequencing errors and 26/
ENCODE alignment errors, as long as these occur at similar rates in
high quality and low quality regions of the 26 assemblies. This
method predicts nucleotide diversity levels ranging from ,1–
761023 for most species (with somewhat larger values of 1.2 and
2.461022 for microbat and hedgehog, respectively; Table 2), in
reasonable agreement with an average diversity of p<561023 for
nuclear DNA in mammals [28]. After this adjustment, the estimated
base-call error rates are much more concordant across species, at
0.72–3.43 per kb, and the indel error rates are slightly more
concordant, at 0.16–0.46 per kb (insertions) and 0.21–0.70 per kb
(deletions). The 26 species with slightly higher coverage, such as
megabat (2.66) and rock hyrax (2.26), have the lowest error rates,
as expected. In addition, both types of error rates are in substantially
better agreement with the nominal quality scores (Figure 1). The
polymorphism-corrected error rates are used throughout the
remainder of this paper, unless otherwise noted.
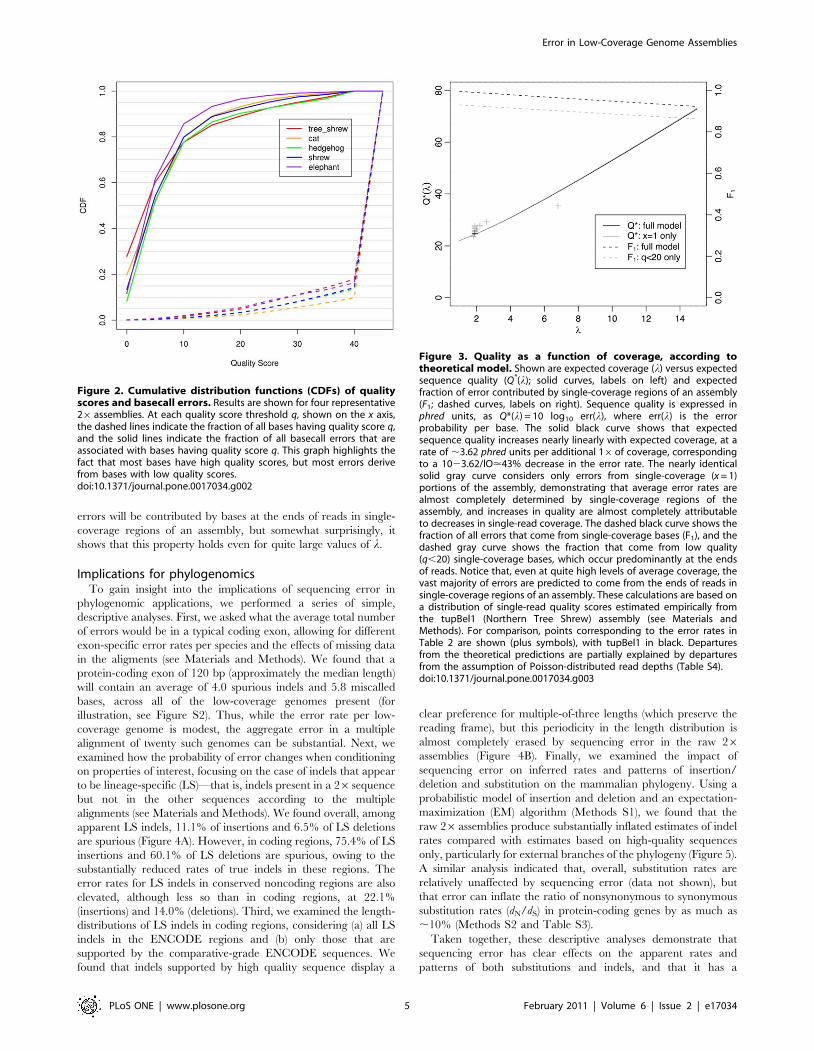
Even with only ,26 average genomic coverage, these
assemblies predominantly consist of high-quality bases. Roughly
82% of bases, across all of the assemblies, have quality scores $45
(the highest category considered in our analysis; see Materials and
Methods), and only ,4% have scores ,20 (Figure 2). Neverthe-
less, these low-quality bases are sufficiently error-prone that they
make a highly disproportionate contribution to the overall error
rates. Indeed, once polymorphisms are corrected for, 88.4% of
basecall errors occur in bases with quality scores ,20. The
situation with indels is similar, with 75.2% of erroneous insertions
and 73.9% of erroneous deletions being accounted for by the small
fraction of bases having scores ,20.
Table 2. Error rates per kilobase, raw and corrected.
Species Cov.a Basecalls Insertions Deletions
Rawb Poly.c Corr.d Rawb Poly.c Corr.d Rawb Poly.c Corr.d
armadillo 2.06 3.06 1.48 1.58 0.40 0.03 0.37 0.33 0.03 0.30
tenrec 1.96 3.19 1.08 2.11 0.47 0.02 0.45 0.24 0.02 0.22
hedgehog 1.96 25.10 23.71 1.39 0.86 0.43 0.43 0.76 0.44 0.32
cat 1.96 3.72 2.53 1.19 0.33 0.06 0.27 0.28 0.07 0.21
elephant 1.96 2.61 0.91 1.70 0.41 0.02 0.39 0.42 0.02 0.40
mouse lemur 1.96 3.00 1.92 1.08 0.26 0.03 0.23 0.46 0.05 0.41
microbat 1.86 15.04 11.61 3.43 0.57 0.16 0.41 0.77 0.30 0.47
rabbit 2.06 5.63 4.08 1.55 0.44 0.06 0.38 0.30 0.09 0.21
bushbaby 1.96 4.94 2.59 2.35 0.43 0.04 0.39 0.75 0.05 0.70
rock hyrax 2.26 3.72 2.68 1.04 0.25 0.04 0.21 0.42 0.06 0.36
megabat 2.66 3.73 3.01 0.72 0.22 0.06 0.16 0.37 0.08 0.29
shrew 1.96 8.04 6.62 1.42 0.35 0.13 0.22 0.39 0.15 0.24
squirrel 1.96 5.64 3.16 2.48 0.51 0.05 0.46 0.63 0.08 0.55
tree shrew 1.96 4.43 2.01 2.42 0.37 0.04 0.33 0.56 0.06 0.50
guinea pige 6.86 0.35 0.14 0.21 0.04 0.00 0.04 0.04 0.00 0.04
aReported average coverage of 26 assembly.bBased on observed differences between aligned 26 and ENCODE sequences. Note that, because estimates are based on .2Mb of aligned sequence in all cases and.10Mb in most cases (Table S2), the contribution of sampling error to the estimates shown here is negligible (standard errors are typically <0.01 per kb).
cEstimate of polymorphism rate (based on highest quality bases).dCorrected error rate, equal to raw difference rate minus estimated polymorphism rate.eThe guinea pig is shown for comparison. The genome assembly reflects 276 coverage. The low estimated polymorphism rate may result from the use of the sameinbred line in the 26 and ENCODE projects (unconfirmed).
doi:10.1371/journal.pone.0017034.t002
Error in Low-Coverage Genome Assemblies
PLoS ONE | www.plosone.org 3 February 2011 | Volume 6 | Issue 2 | e17034

Model for coverage and errorWe devised a simple theoretical model to explore the
relationship between sequencing error and read coverage as a
function of the average coverage. The model assumes Poisson-
distributed read depths, independence of quality scores across
reads, and quality scores that accurately predict error rates, and it
relies on an empirically determined distribution of quality scores
from single reads (see Materials and Methods). Because it uses
quality scores as a proxy for true error rates, the model does not
distinguish between basecall and indel errors, but aggregates them
together. This model indicates that the overall sequence quality,
expressed in phred units as 210 log10 p(error), should increase nearly
linearly with the expected coverage over the range of interest, such
that the error rate will be approximately halved by each additional
16 of sequencing (Figure 3). Moreover, it predicts that this
increase in quality will be almost completely driven by decreases in
single coverage regions in the assembly, which contribute the vast
majority of the error. Indeed, the model predicts that 98.9% of
errors will come from single coverage regions in a 26 assembly.
This fraction remains high as the average coverage (l) grows
larger, with values of 96.8% for l = 6, 94.8% for l = 10, and
92.2% for l = 15. Furthermore, nearly all of the errors in these
single-coverage regions can be attributed to a relatively small
fraction of bases with low quality scores. For example, the 13.7%
of single-read bases with q,20 are expected to contribute 93.5%
of the error in single coverage regions, or 92.5% of all errors at
l = 2. These low-quality bases occur preferentially at the ends of
reads, with 90% occurring either 50 bp from the 59 end or 300 bp
from the 39 end of a read (Figure S1). Thus, consistent with
intuition, the model predicts that the vast majority of sequencing
Figure 1. Quality scores vs. error rates in selected 26 genomes. Error rates were estimated from alignments with high-quality ENCODEsequences. Separate plots are shown for basecall (top) and indel (bottom) errors, before (left) and after (right) correcting for polymorphisms (see text).The quality score of an insertion is taken to be the minimum score of the inserted bases and the 10 nearest neighboring bases (5 on each side), whilethe score of a deletion is the minimum score of just the 10 neighboring bases. The dashed line shows the rates implied by nominal quality scores (i.e.,error rates of 102q/10 for each score q). Note that these predicted rates include both base-call and indel errors [8], so they are expected to be slightlylarger than the true rates for the individual error types. The excess of errors at large quality scores could result from an underestimation ofpolymorphism (perhaps because the high quality regions used to estimate polymorphism are depleted for segregating sites), or from anoverestimation of quality scores (perhaps because the assembler assumes independence of reads in estimating aggregate scores). The numbers ofevents were sufficiently large that sampling errors were small relative to the dependency on quality scores.doi:10.1371/journal.pone.0017034.g001
Error in Low-Coverage Genome Assemblies
PLoS ONE | www.plosone.org 4 February 2011 | Volume 6 | Issue 2 | e17034
errors will be contributed by bases at the ends of reads in single-
coverage regions of an assembly, but somewhat surprisingly, it
shows that this property holds even for quite large values of l.
Implications for phylogenomicsTo gain insight into the implications of sequencing error in
phylogenomic applications, we performed a series of simple,
descriptive analyses. First, we asked what the average total number
of errors would be in a typical coding exon, allowing for different
exon-specific error rates per species and the effects of missing data
in the aligments (see Materials and Methods). We found that a
protein-coding exon of 120 bp (approximately the median length)
will contain an average of 4.0 spurious indels and 5.8 miscalled
bases, across all of the low-coverage genomes present (for
illustration, see Figure S2). Thus, while the error rate per low-
coverage genome is modest, the aggregate error in a multiple
alignment of twenty such genomes can be substantial. Next, we
examined how the probability of error changes when conditioning
on properties of interest, focusing on the case of indels that appear
to be lineage-specific (LS)—that is, indels present in a 26sequence
but not in the other sequences according to the multiple
alignments (see Materials and Methods). We found overall, among
apparent LS indels, 11.1% of insertions and 6.5% of LS deletions
are spurious (Figure 4A). However, in coding regions, 75.4% of LS
insertions and 60.1% of LS deletions are spurious, owing to the
substantially reduced rates of true indels in these regions. The
error rates for LS indels in conserved noncoding regions are also
elevated, although less so than in coding regions, at 22.1%
(insertions) and 14.0% (deletions). Third, we examined the length-
distributions of LS indels in coding regions, considering (a) all LS
indels in the ENCODE regions and (b) only those that are
supported by the comparative-grade ENCODE sequences. We
found that indels supported by high quality sequence display a
clear preference for multiple-of-three lengths (which preserve the
reading frame), but this periodicity in the length distribution is
almost completely erased by sequencing error in the raw 26assemblies (Figure 4B). Finally, we examined the impact of
sequencing error on inferred rates and patterns of insertion/
deletion and substitution on the mammalian phylogeny. Using a
probabilistic model of insertion and deletion and an expectation-
maximization (EM) algorithm (Methods S1), we found that the
raw 26assemblies produce substantially inflated estimates of indel
rates compared with estimates based on high-quality sequences
only, particularly for external branches of the phylogeny (Figure 5).
A similar analysis indicated that, overall, substitution rates are
relatively unaffected by sequencing error (data not shown), but
that error can inflate the ratio of nonsynonymous to synonymous
substitution rates (dN/dS) in protein-coding genes by as much as
,10% (Methods S2 and Table S3).
Taken together, these descriptive analyses demonstrate that
sequencing error has clear effects on the apparent rates and
patterns of both substitutions and indels, and that it has a
Figure 3. Quality as a function of coverage, according totheoretical model. Shown are expected coverage (l) versus expectedsequence quality (Q*(l); solid curves, labels on left) and expectedfraction of error contributed by single-coverage regions of an assembly(F1; dashed curves, labels on right). Sequence quality is expressed inphred units, as Q*(l) = 10 log10 err(l), where err(l) is the errorprobability per base. The solid black curve shows that expectedsequence quality increases nearly linearly with expected coverage, at arate of ,3.62 phred units per additional 16of coverage, correspondingto a 1023.62/lO<43% decrease in the error rate. The nearly identicalsolid gray curve considers only errors from single-coverage (x = 1)portions of the assembly, demonstrating that average error rates arealmost completely determined by single-coverage regions of theassembly, and increases in quality are almost completely attributableto decreases in single-read coverage. The dashed black curve shows thefraction of all errors that come from single-coverage bases (F1), and thedashed gray curve shows the fraction that come from low quality(q,20) single-coverage bases, which occur predominantly at the endsof reads. Notice that, even at quite high levels of average coverage, thevast majority of errors are predicted to come from the ends of reads insingle-coverage regions of an assembly. These calculations are based ona distribution of single-read quality scores estimated empirically fromthe tupBel1 (Northern Tree Shrew) assembly (see Materials andMethods). For comparison, points corresponding to the error rates inTable 2 are shown (plus symbols), with tupBel1 in black. Departuresfrom the theoretical predictions are partially explained by departuresfrom the assumption of Poisson-distributed read depths (Table S4).doi:10.1371/journal.pone.0017034.g003
Figure 2. Cumulative distribution functions (CDFs) of qualityscores and basecall errors. Results are shown for four representative26 assemblies. At each quality score threshold q, shown on the x axis,the dashed lines indicate the fraction of all bases having quality score q,and the solid lines indicate the fraction of all basecall errors that areassociated with bases having quality score q. This graph highlights thefact that most bases have high quality scores, but most errors derivefrom bases with low quality scores.doi:10.1371/journal.pone.0017034.g002
Error in Low-Coverage Genome Assemblies
PLoS ONE | www.plosone.org 5 February 2011 | Volume 6 | Issue 2 | e17034

particularly pronounced effect for indels. Sequencing error may
have important consequences not only on estimates of absolute
rates of mutations, but on phylogenomic analyses that depend on
the relative rates of events, as in the identification of novel
functional elements and in predictions of positive selection [20,21].
Sequencing error mitigationThe highly localized nature of sequencing error, with a large
majority of errors coming from a small minority of bases, raises the
possibility of using automatic methods to mitigate the effects of
error in downstream analyses, a procedure we refer to generically
as sequencing error mitigation (SEM). In this section, we explore several
alternative strategies for SEM.
Base-call error. Our general approach to base-call error is to
mask erroneous bases by converting them to ‘‘N’’s. We do not
attempt to revise the base-calls at positions predicted to be
miscalled because only weak information about their true identity
is available. Our baseline strategy is simply to apply a threshold to
the nominal quality score for each base (as reported for the
genome assembly), masking any base with a score below the
designated threshold. By considering no sources of data other than
the sequence itself, this strategy has the advantage of being easy to
interpret and avoiding complex biases in downstream analyses.
We measure the false positive rates (FPRs) and true positive
rates (TPRs) of base-masking decisions as a function of the quality
score threshold, where the FPR is defined as the fraction of
correctly called bases that are unnecessarily masked, and the TPR
is defined as the fraction of miscalled bases that are masked. We
also measure the positive predictive value (PPV), or the fraction of
masked bases that actually were miscalled, and hence, were
correctly masked. These quantities are measured with respect to
the ENCODE data in regions covered by high-confidence
ENCODE/26 alignments, then corrected for polymorphisms
(Materials and Methods).
We find that this simple masking strategy allows large fractions
of miscalled bases to be masked with relatively low FPRs. For
example, at a quality threshold of 10, roughly 80% of miscalled
bases can be eliminated at a FPR of ,1%, with slight differences
Figure 4. Error rates and length distributions for lineage-specific indels. (A) Fractions of apparent lineage-specific indels that are spurious,as estimated from ENCODE/26alignments. Shown are median values over all 26species after the polymorphism correction, for all sites and for onlythose sites within coding (CDS) or conserved noncoding (CNS) regions. Notice that insertions are substantially more likely than deletions to bespurious, because true deletions occur at higher rates than true insertions [29], while insertion and deletion error rates are comparable. LQ categoriesare the subset of indels with low quality (,25). (B) Distribution of indel lengths in coding regions for mouse lemur as compared to human, using dogas an outgroup. The red line (all) represents all indels inferred from the 26assemblies, while the blue lines (supported) represents a subset of indelsthat could be validated by comparison with the ENCODE mouse lemur sequence. The green line (corrected) shows the distribution for the 26assembly after automatic sequencing error mitigation (SEM) was applied using a quality score threshold of ,25. Notice that the pronounced period-of-three pattern in the supported indels is nearly lost in the unprocessed data due to sequencing error, but is mostly recovered by the SEMprocedure. The effect is similar for the other 26 assemblies.doi:10.1371/journal.pone.0017034.g004
Figure 5. Estimated percent error in indel rates. Results areshown for the raw and error-mitigated (SEM) data sets. Indel rates wereinferred using a probabilistic indel model and an expectationmaximization algorithm (Methods S1), and percent error was estimatedby comparing the rates for each data set with ones based on thehighest quality sites only (q$45). The median across the brancheswithin each group is shown, with error bars indicating upper and lowerquartiles. Results are shown for three groups of branches from the 32-species phylogeny: external branches corresponding to 26 species(red), all other external branches (blue), and internal branches (green).The indel rates fir the external 26branches are overestimated by nearly8% with the raw data, but that the SEM procedure eliminates most ofthis effect. There is also a substantial amount of overestimationassociated with non-26external branches stemming from lower-qualitydraft assemblies, such as the chimpanzee, and the SEM procedureeffectively reduces this error as well.doi:10.1371/journal.pone.0017034.g005
Error in Low-Coverage Genome Assemblies
PLoS ONE | www.plosone.org 6 February 2011 | Volume 6 | Issue 2 | e17034

between genome assemblies (Figure 6). By choosing a threshold of
20, a TPR of ,90% and a FPR of 5% can be achieved. However,
because error rates are fairly low even for low quality scores,
absolute FPRs of 1–5% may still result in large amounts of ‘‘over-
masking’’. Indeed, at a threshold of 10, with a TPR of ,80%, the
PPV is ,10%, meaning that 9 correct bases must be unnecessarily
masked for every miscalled base that is appropriately masked. At a
threshold of 20 (TPR 90%) the PPV is only ,4%.
We attempted to improve these results by using a regression-
based method to predict whether or not to mask each base.
Specifically, we trained a logistic regression classifier on a subset of
the ENCODE data, making use of several relevant covariates,
including the aligned bases from other species, the local G+C
content and the quality scores of neighboring bases (see Materials
and Methods), and then tested the method on a separate portion of
the ENCODE data. To summarize the information from aligned
bases, we included as one of the covariates a log-odds score based
on a phylogenetic error model, which indicates how much more
likely an observed base is under a model of sequencing error vs. a
model that allows for true nucleotide substitutions only. This
method did significantly improve performance (Figure 7). For
example, in the case of bushbaby, at a TPR of 50% the regression-
based method roughly doubled the PPV, from ,20% to ,40%.
However, the improvement was more pronounced at midrange
TPRs than at higher TPRs, which are of greater practical interest.
For example, at a TPR of 80% in bushbaby the PPV is increased
only from ,10% to ,15%. The degree of improvement also
varied considerably among species, depending on the availability
of cross-species alignments, branch lengths in the phylogenetic
tree, and other factors. Because such dependencies may lead to
difficult-to-interpret biases in downstream analyses, and because
the regression-based method is computationally expensive, we
selected the simpler, quality-score thresholding method as our
default base-masking strategy.
Indel error. We address indel error using an imputation
strategy rather than a masking strategy. Our general approach is
to identify indels likely to be spurious, based on the multiple
alignments and quality scores, then to ‘‘correct’’ these indels by
filling in false deletions with ‘‘N’’s, or excising false insertions.
Specifically, we identify indels that can only be parsimoniously
explained by lineage-specific insertion or deletion events, using an
exact dynamic-programming algorithm (see Materials and
Figure 6. Receiver operating characteristic (ROC) curves for sequencing error mitigation. On the left, false positive rates (fractions of non-errors incorrectly masked or imputed) are plotted versus true positive rates (fractions of errors correctly masked or imputed) as the quality thresholdis varied (see text). On the right is a similar plot with 1 minus the positive predictive value (indicating the fraction of masking or imputation decisionsincorrectly undertaken) in place of the false positive rate. Results are shown for five representative 26 assemblies, with separate plots for basecall(top), insertion (middle), and deletion (bottom) errors. The results shown here reflect simple thresholding of quality scores (see also Figure 7).doi:10.1371/journal.pone.0017034.g006
Error in Low-Coverage Genome Assemblies
PLoS ONE | www.plosone.org 7 February 2011 | Volume 6 | Issue 2 | e17034

Methods). If these apparent lineage-specific indels are supported
only by low-quality sequence, we conclude that they are more
likely to result from sequencing errors than from true evolutionary
events, and we revert the sequence to the inferred ancestral indel
state. Only lineage-specific indels are corrected, because indels
that are shared between species would require multiple coinciding
errors to explain, and therefore are much less likely to be
erroneous.
As with our basecall error mitigation strategy, we evaluated the
TPR, FPR, and PPV of this approach as the threshold for low-
quality sequence was varied. In this case, the TPR is the fraction of
spurious indels that were properly ‘‘corrected’’, the FPR is the
fraction of true indels that were unnecessarily edited, and the PPV
is the fraction of corrections that improve the quality of the
assembly. These measures consider only ‘‘eligible’’ indels—that is,
ones predicted to be lineage-specific by the parsimony algorithm—
and therefore can range from 0 to 1. We experimented with
various measures for identifying ‘‘low-quality’’ sequence (see
Materials and Methods), but settled on the relatively simple
measure of the minimum quality score observed within a 5 base
pair distance of the indel.
In terms of absolute TPRs and FPRs, the indel algorithm
appears to perform slightly worse than the base masking algorithm
Figure 6. For example, to obtain a TPR of 80%, a FPR of ,6%
must be tolerated for either insertions or deletions. However, this
difference is misleading because false positives are counted in quite
different ways in the two cases—for basecalls, they are counted as
fractions of all correct bases (i.e., the vast majority of bases), while
for indels they are fractions of correct lineage-specific indels (a
much smaller collection). Indeed, when measured in terms of PPV,
error mitigation is substantially better for indels than for basecalls,
with values of roughly 30–80% at a TPR of 80%. (Notably, there
is considerable variation across species, because the algorithm
depends on the position of each species in the phylogeny.) For a
typical genome, say tree shrew, it is possible to correct 80% of
eligible indels by altering only slightly more than twice as many
cases as should be altered (i.e., with a PPV of 50%). The favorable
PPV for indels results from the fact that true indel rates are quite
low (roughly 20-fold lower than substitution rates; [29]), yet indel
error rates are comparable to those for basecalls, typically differing
only by a factor of 4–5 (Table 2). Similarly, the PPVs for insertions
are somewhat better than those for deletions, because the true
deletion rate is larger than the true insertion rate [29].
A limitation of this approach is that many indel errors are not
eligible for correction. For example, spurious indels in a human-
specific Alu insertion will not be able to be corrected, because
alignments to orthologous sequences in other mammalian species
will not be available. Other spurious indels will not be inferred as
lineage specific, due to alignment errors or failures of the
parsimony algorithm. We find that the fraction of spurious indels
that are eligible for correction ranges from about 1/3 to more than
half, depending on the species in question (Figure S3). Of the
ineligible indels, most are in the alignments but are not inferred to
be lineage-specific, although in some species, such as hedgehog,
the situation is reversed—possibly because of long branches in the
phylogeny or large numbers of transposons. The aspect of the
approach may improve substantially as more species are
sequenced and alignment algorithms improve.
Consequences in phylogenomics. To shed light on the
impact of SEM in downstream analyses, we examined four
representative applications. For this analysis, we used simple
quality score thresholds of ,20 for base-masking and ,25 for
indel imputation (corresponding to TPRs of ,88% and ,96% in
the experiments above).
We first considered the length distribution of indels, which was
shown above to be strongly influenced by indel error (Figure 4B).
We found that SEM significantly improved the inferred length
distribution, bringing it nearly in line with the distribution
estimated from the high-quality ENCODE data. In particular,
SEM eliminated a large number of non-multiple-of-three-length
indels, including many of length one, and caused the pronounced
period-of-three signal, which was nearly lost in the raw 26data, to
re-appear. Second, we re-estimated indel rates on the branches of
the phylogenetic tree for these species, as described above, after
applying SEM to the alignments. We found that SEM substantially
reduces the inflation in indel rates that arises from sequencing
error (Figure 5). In our third analysis, we examined the impact of
SEM on estimates of dN/dS ratios, which, as discussed above, can
be inflated by error. Again, SEM was effective in eliminating most
of the upward bias in dN/dS estimates (Table S3). Finally, we
examined the impact of SEM in comparative functional element
detection, using a recently developed comparative exon-finding
method called CONGO [30]. After retraining the method with
the SEM-processed alignments, CONGO’s exon-level specificity
with respect to genes from the RefSeq, ENSEMBL, UCSC, and
GENCODE gene sets increased modestly yet significantly, from
89.9% to 90.5% (p = 1.261029, x2 test), while the sensitivity
increased slightly, from 74.3% to 74.4% (see Methods S3 and
Table S4 for full details). While these increases were modest in
absolute value, the increase in specificity held consistency across all
chromosomes in the human genome, except for the Y chromo-
some (Table S5).
Discussion
Since the advent of large-scale DNA sequencing, sequencing
error has periodically emerged as a research topic of primary
interest in genomics [4,7,8]. In this article, we have examined the
issue of sequencing error with respect to twenty newly available
Figure 7. ROC-like plot for logistic regression-based SEM.Results are shown for one species, the bushbaby (see Figure S6 forothers). See Figure 6 for comparison. The solid curve represents simplethresholding on quality score and the dashed line represents the use oflogistic regression with both quality scores and phylogenetic log-oddsscores as covariates (see Materials and Methods).doi:10.1371/journal.pone.0017034.g007
Error in Low-Coverage Genome Assemblies
PLoS ONE | www.plosone.org 8 February 2011 | Volume 6 | Issue 2 | e17034

low-coverage (26) mammalian genome assemblies. This data set
will ultimately be supplanted by draft genomes, and is therefore of
transient interest. Nevertheless, it is likely to dominate the field of
mammalian comparative genomics for the next few years. Our
focus in this article has been to characterize the sequencing error
in these data, to examine its implications for phylogenomic
analysis, and to explore simple strategies for mitigating the effect of
error in certain applications of interest.
While these 26genome assemblies are generally of high quality,
they do display significant amounts of error. Base-call errors occur
at rates of ,1–3 per kb, and indels at ,0.5–1.0 per kb. The
overall error rate in these sequences, at an average of 2.5 errors
per kb, is comparable to the average rate at which nucleotide
differences occur between individuals of a typical mammalian
species (p). Importantly, these errors are highly localized, with
,4% of bases contributing roughly 90% of base-call errors and
75% of indel errors. Sequencing error appears to come primarily
from the ends of reads in single-coverage regions of the assembly.
The impact of this error in downstream analyses depends on the
relative rates of error and real events of interest. Some
mutations—such as lineage-specific insertions in protein-coding
sequences—are sufficiently rare that apparent mutations in the 26alignments are considerably more likely to be spurious than real.
Accordingly, certain patterns of interest in comparative geno-
mics—such as the length distributions of short indels in coding
regions—can be strongly skewed by sequencing error. At the same
time, sequencing error does not severely impact all analyses of
interest. It had only a minor effect on inferred substitution rates,
and its effects on dN/dS estimates and on a state-of-the-art
comparative exon-finding method were more pronounced but still
limited.
Automatic methods for sequencing error mitigation (SEM) can
reduce the effects of error to a degree. Indel imputation, in
particular, is effective at reducing the number of spurious lineage-
specific indels, and can substantially reduce the distortion of indel
length distributions and numbers of lineage-specific indels imposed
by error. As a result, SEM could, in principle, produce significant
improvements in downstream phylogenomic analyses, especially
ones dependent on indel rates and patterns. In our experiments, it
did significantly improve performance in comparative exon
prediction. Performance improvements of ,1% in exon-predic-
tion, while not dramatic, are difficult to achieve without major
modeling or algorithmic innovations, and it is notable that they
were achieved in this case simply by preprocessing the input to the
algorithm. At the same time, this example demonstrates that
sophisticated machine-learning methods can effectively compen-
sate for the effects of sequencing error in functional element
prediction, and may only benefit slightly from a separate SEM
step. SEM may be of greater value in straightforward estimation of
mutation rates or with simpler methods for functional element
prediction.
Several general issues arise in deciding on an appropriate SEM
strategy. We settled on quite simple methods, based on thresh-
olding of quality scores, for efficiency and ease of interpretation.
However, our experiments with regression-based methods sug-
gested that the use of additional covariates can significantly
improve performance. It may be possible to improve performance
further by making use of a richer set of features in a more
sophisticated classification framework, including, say, the primary
traces for sequencing reads and the full multiple alignment of reads
used by the assembler [19]. A second question we faced was
whether to mask bases that are predicted to be erroneous or to
impute specific values for them. In general, masking is preferable
in that, when making unnecessary ‘‘corrections’’, it simply discards
data rather than introducing new errors. For indels, however, we
found masking impractical and instead settled on an imputation
strategy. The disadvantage of this approach is that it can produce
biases of its own, for example, by reducing the apparent indel rates
on terminal branches of the phylogeny. A third question is whether
to make use of alignments with other species in SEM. Alignments
are clearly informative about error but their use has certain
drawbacks: they cannot be used uniformly across the assembly
(because some regions do not align), they are not equally
informative about all species (because of differences in phyloge-
netic position), and their usefulness depends on the accuracy of the
alignment methods. We have used alignments for indel imputa-
tion, where they are particularly informative, but not for base
masking. However, alternative approaches may be preferable for
certain applications.
Our theoretical model suggests that regions of single read
coverage in the assembly are dominant in determining overall
error rates. Interestingly, this property is predicted to hold even at
quite high coverage—for example, more than 90% of errors are
predicted to derive from regions of single read coverage at 156coverage (Figure 3). There are two major ways in which
simplifying assumptions of the model could impact our calcula-
tions. First, the model may underestimate the error rates at bases
covered by multiple reads, by assuming independence across reads
in computing aggregate quality scores. Our empirical data suggests
some underestimation of error rates does occur at large quality
scores (q$30) (Figure 1). However, because smaller quality scores
(q,20) are dominant in determining error rates, we expect this
underestimation to have only a minor effect on our conclusions.
Second, departures from the assumption of Poisson-distributed
read depth may lead to an excess of single-read regions at high
average coverage (see Figure S4). This would reduce the rate of
increase in expected sequence quality (Q*) as average coverage (l)
increases, making Q* sublinear in l (see, for example, the point in
Figure 3 at 6.86 coverage, representing guinea pig). However, it
should increase the fraction of errors coming from regions of single
read coverage at large l, making them more like those for small l.
Thus, we expect the conclusion that regions of single read
coverage are dominant even at large l to be robust to our
modeling assumptions. This property should be borne in mind
when interpreting claims that the vast majority of bases in a
genome assembly have high quality—for example, that 98% of
bases have quality scores of at least 40 [12,31]. While this ‘‘mostly
very high quality’’ property is undoubtedly useful in some respects,
it may still be compatible with fairly high overall error rates,
because few bases with high error rates can make a strongly
disproportional contribution to the overall average. Mathemati-
cally, this can be understood by noting that the expected sequence
quality Q* is determined not by the arithmetic mean of the
basewise quality scores, but by a generalized f-mean with
f (q)~10{q=10, which gives large weight to small values of q.
While most of the genome sequences considered here will
eventually be replaced by higher coverage assemblies, other
projects parallel this one in certain respects. For example, low-
coverage sequencing is underway for several fungi and unicellular
eukaryotes and for three East African cichlid fishes (http://www.
genome.gov/10002154). Metagenomic projects also tend to
produce low-coverage data for each organism of interest, because
of the diversity of source material, and some large-scale within-
species sequencing projects—including the 1000 Genomes Proj-
ect—have used relatively low-coverage sequencing strategies (say,
46) for SNP discovery. In addition, as shown by our theoretical
analysis, consideration of sequencing error can continue to be
important even with high-coverage assemblies, particularly for
Error in Low-Coverage Genome Assemblies
PLoS ONE | www.plosone.org 9 February 2011 | Volume 6 | Issue 2 | e17034

applications in comparative or population genomics. For these
reasons, there is a need to integrate better models of sequencing
error into a wide variety of sequence analysis methods, including
alignment, assembly, gene finding, and phylogenetic modeling.
Notably, improved standards at the assembly level would help to
enable the development of error-aware sequence analysis tools.
Ideally, assembly quality scores would be produced in a uniform
manner, read-depth information would be available for each
assembled base, and full read tiling paths would be obtainable for
assembled genomes.
Materials and Methods
26AssembliesThe twenty-two new genome assemblies (Table 1) were
assembled using a combination of the ARACHNE assembler
[32,33] and a novel ‘‘assisted’’ assembly method that used
alignments with the human, mouse, and dog genome assemblies
to improve long-range contiguity. They were then aligned with
each other and with existing finished or draft-quality genome
assemblies using the multiz program [34] and related tools from
the UC Santa Cruz alignment pipeline [35]. The final multiple
alignments, represented in Multiple Alignment Format (MAF),
consisted of 29 eutherian mammals plus three non-eutherian
outgroup species (opossum, chicken, and tetraodon), for a total of
32 species. For convenience in analyzing sequence alignments and
quality scores together, the MAF files were augmented to include
basewise quality scores, in a reduced representation. Specifically,
each raw quality score q was mapped to an integer q0 [ f0,:::,9gusing the formula q0~min(floor(q=5),9) (see http://genome.ucsc.
edu/FAQ/FAQformat). Thus, the raw quality scores were
captured with a resolution of 5 phred units, except that all scores
$45 were considered equal. (Notably, the ARACHNE assembler
sets a maximum quality score of 50.) This reduced representation
was used in our subsequent analyses.
Alignment with ENCODE sequencesBLASTZ [36] was used to align each scaffold of the 26
genomes to the corresponding high-quality ENCODE sequence
for that species, for every species for which ENCODE sequence
was available. This was followed by a step of chaining and netting
to produce a single-coverage alignment for each 26 assembly.
After a close inspection of these alignments, we realigned the
sequences using LASTZ (http://www.bx.psu.edu/miller_lab) to
reduce alignment error. These alignments were then passed
through a final set of chaining, netting, synteny, and reciprocal
best filters.
Polymorphism correctionLet desq be the rate at which differences suggesting events of type
e occurred in the 26/ENCODE alignments for species s in regions
having 26 quality score q. Let desQ represent the rates for the
highest quality regions (q$45). Polymorphism-adjusted error rates
were estimated, in a quality score-specific manner (for q,45), as
resq = desq2desQ. When assessing the performance of sequencing
error mitigation, a fraction desQ/desq of differences were assumed to
be polymorphisms for each q, s, and e. These fractions were used to
compute the expected number of masked sites that were
polymorphic, which was added to the count of false positives
and subtracted from the count of true positives. Similarly it was
used to compute the expected number of unmasked sites that were
polymorphic, which was added to the count of true negatives and
subtracted from the count of false negatives.
Theoretical modelOur theoretical model for the relationship between read depth
and sequencing error assumes (1) that the read depth at each base
is Poisson-distributed with mean l equal to the average coverage
[37]; (2) that true error rates are well predicted by nominal quality
scores (see Figure 2); (3) that quality scores are independent across
aligned reads at each position in the assembly, so that the joint
distribution of quality scores at a position i with read depth x,
p(qi,1,qi,2,:::,qi,x), is equal to a product of marginal distributions,
p1(qi,1)p2(qi,2):::px(qi,x), where p1 (q) is the probability of observing
a quality score q in an individual read; and (4) that a quality score
for an assembled base can be accurately expressed as a sum of the
quality scores in the individual reads (as assumed by ARACHNE).
Under these assumptions, several quantities of interest can be
computed easily for a given distribution p1 (q), which can be
estimated empirically using data from the public trace archives (see
below). For example, the overall distribution of quality scores for
an assembly with average coverage l is given by
p(qjl)~X?x~1
lxe{l
x!(1{e{l)px(q)&
Xxmax
x~1
lxe{l
x!(1{e{l)px(q) ð1Þ
where px is an x-wise convolution of p1, which can be computed by
a simple recursive calculation, and xmax is large relative to l (say,
the O.999 quantile of the Poisson distribution with mean l). The
expected overall error rate in the assembly, expressed in phred
units, is:
Q�(l)~{10log10
Xq
p(qjl)10{q=10
!ð2Þ
Further details are given in Methods S4.
To determine p1, we examined the empirical distributions of
single-read quality scores for fourteen 26assemblies (as well as one
76 assembly), using random samples of reads from the NCBI
Trace Archives http://www.ncbi.nlm.nih.gov/Traces/. For the
most part, these distributions were similar across species (Figure
S5), and we selected one that was fairly typical of the group for our
analysis (tupBel1). In estimating p1, we excluded reads and
trimmed portions of reads that were not incorporated into the
tupBel1 assembly.
Exonic error ratesTo estimate the error rates per exon, we identified 2,668
nonoverlapping coding (CDS) exons within the ENCODE regions
from the UCSC Genes set, and counted differences between the
aligned 26 and ENCODE sequences within these exons. These
counts were corrected for polymorphisms in a quality score-
specific manner, as above, but using CDS-specific estimates of
polymorphism rates. The counts were multiplied by 20/14 to
adjust for the fact that ENCODE sequences were available for
only fourteen of twenty species, and, finally, converted to rates per
120 bp exon. Notably, this calculation reflected the reduction in
error due to incomplete coverage of the 26assemblies (we did not
compensate for this reduction).
Base maskingIn the simplest case, each base xi was masked (changed to an
‘‘N’’) if, and only if, the corresponding quality score qi,T, where T
is a threshold (typically, T = 20). In the case of logistic regression, xi
was masked if, and only if, (1ze{BT yi ){1vT 0, where B is a
vector of regression coefficients, yi is a vector of local covariates,
Error in Low-Coverage Genome Assemblies
PLoS ONE | www.plosone.org 10 February 2011 | Volume 6 | Issue 2 | e17034

including the local G+C content, the quality scores of flanking
bases, and a phylogenetic log-odds score (see below), but found a
combination of the local quality score qi and the log-odds score to
perform best. The regression coefficients B were estimated from
half of the ENCODE data, and accuracy was assessed on the
remaining half. Parameter estimation was accomplished with the
glm function in R.
The log-odds score for base xs from species s in alignment
column X is defined as S(X ,s)~log P(X jerroneous xs){log P(X jno error): The quantity P(X jno error) is computed by
applying Felsenstein’s algorithm [38] to X, using a phylogenetic
model estimated from fourfold degenerate sites (26 Mammals
Consortium, in prep.). To compute P(X jerroneous xs), we
introduce a species-specific error transition matrix M (s)~fm(s)i,j g,
such that m(s)i,j is the probability that the true base i is erroneously
represented as a j in the 26 sequence for species s (thus, m(s)i,i ~0
for all i,s). We then calculate:
P(X jerroneous xs)~X
i[fA,C,G,Tgm
(s)i,xs
P(fX : xs?igjno error) ð3Þ
where fX : xs?ig denotes a version of X in which xs is replaced
with base i. This calculation assumes that the probability of
multiple errors in a single column X is negligible. The matrix M(s)
is estimated empirically from the 26/ENCODE alignments, using
separate data for training and testing. To accommodate variation
in substitution rates, we introduce a branch-length scaling factor
and optimize it (separately) for both the error and error-free
models, using methods recently described elsewhere [39]. As a
result, an apparent substitution at a conserved site is considered
more likely to be an error than a similar substitution at a less
conserved site.
Indel imputationTo identify lineage-specific (LS) indels, we applied a Sankoff-like
parsimony algorithm [40] to a reduced representation of each indel
region (IR) in the multiple alignments. An IR is a maximal sequence
of alignment columns having at least one gap character each and
flanked by gapless columns. To simplify these regions and focus on
short indel events, we considered only gaps of #10 bp, allowing
for gaps between MAF blocks provided that they connected
contiguous bases in a sequence. We represented the IRs as
matrices of 0s (gaps) and 1s (bases). Because all indel events were
given equal cost regardless of length, the starting matrix could be
compressed by replacing each sequence of identical columns with
a single representative [41]. Associated with a matrix of width n
were 2n possible indel states. To find parsimonious labelings of
ancestral nodes by indel states, we defined a 2n62n matrix,
W = {wi,j }, of state-transition costs, such that wi,j equaled the
minimum number of indel events for a transition from state i to
state j. Using W as a cost matrix for each branch, we applied the
max-product algorithm [42] to the phylogeny and enumerated all
states at each node that were consistent with parsimonious
labelings. Cases in which a leaf was represented by a 0 but its
parent was only allowed a 1 by parsimony were inferred to be LS
deletions. Similarly, cases in which a leaf was represented by a 1
but its parent was only allowed a 0 by parsimony were inferred to
be LS insertions. LS events were inferred column-by-column, so it
was possible that only part of an IR would be considered lineage-
specific. This was important because, with large number of species,
multiple overlapping LS events are not unusual, and in many cases
they can be unambiguously disentangled (the are effectively
independent). For reasons of computational efficiency, IRs with
n.10 (0.36% of all IRs) were ignored. As discussed in the text,
once an LS indel was identified in a sequence s, it was ‘‘corrected’’
(reverted to the ancestral state) if, and only if, it corresponded to
low-quality bases in s. As a measure of indel quality, we used the
minimum quality score in the five flanking bases on either side of
the indel and in any inserted bases. We experimented with several
alternative measures of quality but none performed better than
this simple measure. We emphasize that we did not attempt to
revise the alignment in this procedure; this would have required a
much more complex and computationally expensive algorithm.
Details concerning indel rates, dN/dS ratios, and the CONGO
exon predictions are provided in Methods S1, S2, S3.
Supporting Information
Figure S1 Distribution of low-quality bases along aread. Empirical cumulative distribution functions showing
fractions of bases with phred scores ,20 that occur at various
distances from the 59 (solid line) and 39 (dashed line) ends of each
read. Low quality bases are strongly concentrated within 50 bases
of the 59 and 300 bases of the 39 end of each read. Distributions
are based on 9,905 randomly chosen tree shrew reads, which were
chosen conditional on inclusion in the final assembly. The position
on the x-axis is read position after the trimming performed a pre-
processing step by the assembler.
(TIF)
Figure S2 UCSC Genome Browser screen shot showingpotential spurious indels in multiple alignment. Screen
shot from the UCSC Genome Browser [6], showing the multiz-
based genome-wide alignments—including the twenty low-cover-
age genome assemblies—for a coding exon of the caveolin I (CAV I)
gene. Five apparent lineage-specific frame-shifting deletions in the
mouse lemur sequence are shown. Comparative-grade sequence for
mouse lemur from ENCODE region ENm001 indicates that these
deletions reflect errors in the 26 assembly, rather than genuine
deletion events in the evolution of the mouse lemur. This possibility
is further supported by low phred scores in the 26assembly (values
of 3–23 flanking the deletions, and a mean score of 14 in the region),
evidently reflecting single read coverage. Spurious indels of this kind
can have numerous damaging consequences in phylogenomic
analyses, for example, by distorting inferred indel rates, by causing
comparative gene finders to fail, or by producing false signatures of
accelerated lineage-specific evolution. While it is somewhat unusual
to observe a tight cluster of five indels in one sequence, as in this
case, spurious indels in coding regions are generally common in the
26alignments (see text).
(TIF)
Figure S3 Fraction of indels in the 26/ENCODEalignments which can be mapped to the 44-way align-ment. The black slices represent the fraction of these indels in
which no corresponding indel appears in the 44-way alignment,
and may be explained by polymorphism. The blue slices appear as
lineage-specific indels in the 44-way alignment, and are candidates
for error mitigation when the quality score is sufficiently low. The
red slices appear as non-lineage-specific indels and cannot be
addressed by our method. These may be explained by alignment
error or old polymorphism segregating in several species.
(TIF)
Figure S4 Empirical cumulative distribution functions(CDFs) for read depths in various assemblies. The
distributions expected under comparable theoretical (Poisson)
Error in Low-Coverage Genome Assemblies
PLoS ONE | www.plosone.org 11 February 2011 | Volume 6 | Issue 2 | e17034
model are shown for comparison. Read depth was estimated from
the assembly.reads file produced by the ARACHNE assembler.
This file contains information about approximate placement of
each read in the assembly. Because these placements are not exact,
the depths should also be considered approximate.
(TIF)
Figure S5 Empirical cumulative distribution functions(CDFs) for single-read quality scores in various assem-blies. This figure is based on a random sample of ,10,000 reads
per assembly, and only represents the portion of each read which
is used in the assembly. Tree shrew (shown in bold) was chosen as
a representative species whose distribution was used in our model
for coverage and error.
(TIF)
Figure S6 Performance of base masking algorithmswhich use linear-regression framework, for four spe-cies. The dark black lines show the baseline results using only
quality scores. In red are the results where regression is performed
on the quality scores and a phylogenetic odds ratio comparing a
model with error to a model without error. In purple, blue, and
green, respectively, are results which use both quality score and
GC percentage in a 10 bp window, the minimum quality score in
a 10 bp window, and the mean quality score in a 10 bp window.
The only factor which seems to have a positive effect on the
prediction is the phylogenetic odds ratio.
(TIF)
Table S1 Species nomenclature.(PDF)
Table S2 Summary of alignments of 26 genomes andcorresponding ENCODE sequences.(PDF)
Table S3 Estimates of dN/dS for chr22 genes and fourprimates.
(PDF)
Table S4 CONGO performance with and without SEM.
(PDF)
Table S5 CONGO performance by chromosome.
(PDF)
Methods S1 Estimation of indel rates.
(PDF)
Methods S2 Estimation of dN/dS.
(PDF)
Methods S3 CONGO exon-finding analysis.
(PDF)
Methods S4 Theoretical model.
(PDF)
Acknowledgments
We thank Tomas Vinar, David Haussler, Mike Zody, Sam Gross, and
Kerstin Lindblad-Toh for helpful discussions.
Author Contributions
Conceived and designed the experiments: MJH MFL MK AS. Performed
the experiments: MJH MFL AS. Analyzed the data: MJH MFL AS.
Contributed reagents/materials/analysis tools: MJH MFL. Wrote the
paper: MJH AS.
References
1. Green P (2007) 26genomes—does depth matter? Genome Res 17: 1547–1549.
2. Margulies EH, Vinson JP, Program NCS, Miller W, Jaffe DB, et al. (2005) An
initial strategy for the systematic identification of functional elements in thehuman genome by low-redundancy comparative sequencing. Proc Natl Acad Sci
USA 102: 4795–4800.
3. Sanger F, Nicklen S, Coulson AR (1977) DNA sequencing with chain-terminating inhibitors. Proc Natl Acad Sci USA 74: 5463–5467.
4. Krawetz SA (1989) Sequence errors described in GenBank: a means to
determine the accuracy of DNA sequence interpretation. Nucleic Acids Res 17:3951–3957.
5. Posfai J, Roberts RJ (1992) Finding errors in DNA sequences. Proc Natl Acad
Sci USA 89: 4698–4702.
6. States DJ, Botstein D (1991) Molecular sequence accuracy and the analysis ofprotein coding regions. Proc Natl Acad Sci USA 88: 5518–5522.
7. Churchill GA, Waterman MS (1992) The accuracy of DNA sequences:
estimating sequence quality. Genomics 14: 89–98.8. Ewing B, Green P (1998) Base-calling of automated sequencer traces using
phred. II. Error probabilities. Genome Res 8: 186–194.
9. Lawrence CB, Solovyev VV (1994) Assignment of position-specific errorprobability to primary DNA sequence data. Nucleic Acids Res 22: 1272–1280.
10. Mouse Genome Sequencing Consortium (2002) Initial sequencing and
comparative analysis of the mouse genome. Nature 420: 520–562.
11. Rat Genome Sequencing Project Consortium (2004) Genome sequence of theBrown Norway Rat yields insights into mammalian evolution. Nature 428:
493–521.
12. Lindblad-Toh K, Wade CM, Mikkelsen TS, Karlsson EK, Jaffe DB, et al. (2005)Genome sequence, comparative analysis and haplotype structure of the domestic
dog. Nature 438: 803–819.
13. Marth GT, Korf I, Yandell MD, Yeh RT, Gu Z, et al. (1999) A generalapproach to single-nucleotide polymorphism discovery. Nat Genet 23: 452–456.
14. Irizarry K, Kustanovich V, Li C, Brown N, Nelson S, et al. (2000) Genome-wide
analysis of single- nucleotide polymorphisms in human expressed sequences. NatGenet 26: 233–236.
15. Li M, Nordborg M, Li LM (2004) Adjust quality scores from alignment and
improve sequencing accuracy. Nucleic Acids Res 32: 5183–5191.
16. Johnson PL, Slatkin M (2008) Accounting for bias from sequencing error in
population genetic estimates. Mol Biol Evol 25: 199–206.
17. Li H, Ruan J, Durbin R (2008) Mapping short DNA sequencing reads and
calling variants using mapping quality scores. Genome Res 18: 1851–1858.
18. Chaisson MJ, Brinza D, Pevzner PA (2009) De novo fragment assembly with
short mate-paired reads: Does the read length matter? Genome Res 19:
336–346.
19. Gajer P, Schatz M, Salzberg SL (2004) Automated correction of genome
sequence errors. Nucleic Acids Res 32: 562–569.
20. Mallick S, Gnerre S, Muller P, Reich D (2009) The difficulty of avoiding false
positives in genome scans for natural selection. Genome Res 19: 922–933.
21. Schneider A, Souvorov A, Sabath N, Landan G, Gonnet G, et al. (2009)
Estimates of positive Darwinian selection are inflated by errors in sequencing,
annotation, and alignment. Genome Biol Evol 1: 114–118.
22. Meader S, Hillier LW, Locke D, Ponting CP, Lunter G (2010) Genome
assembly quality: assessment and improvement using the neutral indel model.
Genome Res 20: 675–684.
23. ENCODE Project Consortium (2007) Identification and analysis of functional
elements in 1% of the human genome by the ENCODE pilot project. Nature
447: 799–816.
24. Margulies EH, Cooper GM, Asimenos G, Thomas DJ, Dewey CN, et al. (2007)
Analyses of deep mammalian sequence alignments and constraint predictions for
1% of the human genome. Genome Res 17: 760–774.
25. Blakesley RW, Hansen NF, Mullikin JC, Thomas PJ, McDowell JC, et al. (2004)
An intermediate grade of finished genomic sequence suitable for comparative
analyses. Genome Res 14: 2235–2244.
26. Zinck J, Duffield D, Ormsbee P (2004) Primers for identification and
polymorphism assessment of Vespertilionid bats in the Pacific Northwest.
Molecular Ecology Notes 4: 239–242.
27. Nyakaana S, Arctander P, Siegismund HR (2002) Population structure of the
African savannah ele– phant inferred from mitochondrial control region
sequences and nuclear microsatellite loci. Heredity 89: 90–98.
28. Bazin E, Glemin S, Galtier N (2006) Population size does not influence
mitochondrial genetic diversity in animals. Science 312: 570–572.
Error in Low-Coverage Genome Assemblies
PLoS ONE | www.plosone.org 12 February 2011 | Volume 6 | Issue 2 | e17034
29. Cooper GM, Brudno M, Stone EA, Dubchak I, Batzoglou S, et al. (2004)
Characterization of evolutionary rates and constraints in three mammalian
genomes. Genome Res 14: 539–548.
30. Lin MF, Carlson JW, Crosby MA, Matthews BB, Yu C, et al. (2007) Revisiting
the protein-coding gene catalog of Drosophila melanogaster using 12 fly
genomes. Genome Res 17: 1823–1836.
31. Chimpanzee Sequencing and Analysis Consortium (2005) Initial sequence of the
chimpanzee genome and comparison with the human genome. Nature 437:
69–87.
32. Batzoglou S, Jaffe DB, Stanley K, Butler J, Gnerre S, et al. (2002) ARACHNE: a
whole-genome shotgun assembler. Genome Res 12: 177–189.
33. Jaffe DB, Butler J, Gnerre S, Mauceli E, Lindblad-Toh K, et al. (2003) Whole-
genome sequence assembly for mammalian genomes: Arachne 2. Genome Res 13:
91–96.
34. Blanchette M, Kent WJ, Riemer C, Elnitski L, Smit AFA, et al. (2004) Aligning
multiple genomic sequences with the threaded blockset aligner. Genome Res 14:
708–715.
35. Kent WJ, Baertsch R, Hinrichs A, Miller W, Haussler D (2003) Evolution’s
cauldron: duplication, deletion, and rearrangement in the mouse and humangenomes. Proc Natl Acad Sci USA 100: 11484–11489.
36. Schwartz S, Kent WJ, Smit A, Zhang Z, Baertsch R, et al. (2003) Human-mouse
alignments with BLASTZ. Genome Res 13: 103–107.37. Lander ES, Waterman MS (1988) Genomic mapping by fingerprinting random
clones: a mathematical analysis. Genomics 2: 231–239.38. Felsenstein J (1981) Evolutionary trees from DNA sequences: a maximum
likelihood approach. J Mol Evol 17: 368–376.
39. Pollard KS, Hubisz MJ, Rosenbloom KR, Siepel A (2010) Detection ofnonneutral substitution rates on mammalian phylogenies. Genome Res 20:
110–121.40. Sankoff D (1975) Minimal mutation trees of sequences. SIAM J Appl Math 28:
35–42.41. Blanchette M, Green ED, Miller W, Haussler D (2004) Reconstructing large
regions of an ancestral mammalian genome in silico. Genome Res 14:
2412–2423.42. Bishop C (2006) Pattern recognition and machine learning. New York: Springer.
Error in Low-Coverage Genome Assemblies
PLoS ONE | www.plosone.org 13 February 2011 | Volume 6 | Issue 2 | e17034