erp1961 appendixes 2
TRANSCRIPT

Appendix B
SOME RECENT ECONOMIC DEVELOPMENTS
I. Employment and EarningsII. Agriculture
III. United States Foreign Trade and Payments
79
Digitized for FRASER http://fraser.stlouisfed.org/ Federal Reserve Bank of St. Louis

Digitized for FRASER http://fraser.stlouisfed.org/ Federal Reserve Bank of St. Louis

I. Employment and EarningsDemand for labor was generally high during the first half of I960, and
in the second quarter of the year total civilian employment expanded to arecord, seasonally adjusted figure of 66.9 million. For the year as a whole,employment averaged 66.4 million, nearly 800,000 above 1959. Growth ofthe labor force was about as large as the increase of employment, and unem-ployment, accordingly, averaged 5.6 percent of the civilian labor forcefor the year, approximately the same as in 1959 (Table B-l). (For com-parability with earlier years, the 1960 data used here do not include thenew States of Alaska and Hawaii.)
TABLE B-l.—Growth of the labor force, by employment status, 1959-W
[Millions of persons 14 years of age and over]
Employment status
Total labor force
Armed forcesCivilian labor force
Employment
AgriculturalNonagricultural _ .
Unemployment _
Unemployment as percent of civilian laborforce . .-
1959
71.9
2.569.4
65.6
5.859.7
3.8
5.5
1960
72.8
2.570.3
66.4
5.760.7
3.9
5.6
1960
Firstquarter
Secondquarter
Thirdquarter
Fourthquarter
Seasonally adjusted
72.0
2.569.5
65.9
5.560.2
3.6
5.2
73.0
2.570.5
66.9
5.761.3
3.6
5.1
73.0
2.570.5
66.7
5.960.9
4.0
5.7
73.2
2.570.7
66.2
5.760.4
4.6
6.5
NOTE.—For comparability with earlier periods, data for 1960 have been adjusted to exclude Alaska andHawaii.
Detail will not necessarily add to totals because of rounding; in addition, seasonally adjusted totals maydiffer from sum of components because totals and components have been seasonally adjusted separately.
Source: Department of Labor.
After the middle of 1960, however, employment tended to decline. Inthe third quarter the average was 66.7 million, and in the fourth quarterit was 66.2 million; the December figure, after allowance for seasonal influ-ences, was 66.0 million. Unemployment, seasonally adjusted, increasedfrom 3.6 million, or 5.1 percent of the civilian labor force, in the secondquarter to 4.6 million, or 6.5 percent of the labor force, in the fourth. Hoursworked in manufacturing industries declined through the year, and the work-week averaged 39.7 hours, compared with 40.3 hours in 1959.
81
Digitized for FRASER http://fraser.stlouisfed.org/ Federal Reserve Bank of St. Louis

Hourly earnings of production workers in manufacturing industries in-creased slightly during the year, averaging $2.32 in December, against $2.27in December 1959. Average weekly earnings, reflecting the reduced work-week and lower employment in the more highly paid metalworking indus-tries, tended to decline slightly in the course of the year, and real weeklyearnings, adjusted for the change of consumer prices, also were lower.Basic wage rates, however, rose by somewhat more than 3 percent per year,as wage increases were put into effect for about 7 million employees, nearly90 percent of those covered by major collective bargaining agreements.
GROWTH OF THE LABOR FORCE
The labor force expanded markedly during the first half of 1960, paral-leling the increase of civilian employment. As Table B-2 indicates, growth
TABLE B-2.—Growth of the labor force, by sex and age, 1950-60
[Thousands of persons 14 years of age and over]
Sex and age
Total labor force _ _ . _
Male
14-19 years20-24 years. _ _ , _ . _25-34 years ,. ,.35-64 years65 years and over
Female
14-19 years . . - - _ . .20-24 years25-34 years . -35-64 years ._ _65 years and over
Net change
1950-55annualaverage
829
397
-13-75
8438615
432
1-45
3240439
1955-60annualaverage
785
253
8645
-116286-48
532
8222
-3043425
1958 to1959
662
279
91138
-128234
-57
383
80-26
-10541914
1959 to1960
874
236
9088
-98191
-36
638
1468613
32470
NOTE.—For comparability with earlier years, data for 1960 have been adjusted to exclude Alaska andHawaii.
Detail will not necessarily add to totals because of rounding.Source: Department of Labor.
was larger than in 1959, and moderately above the average for the pastten years.
Over the past decade, important structural changes have taken place inthe age and sex distribution of the working population, and even moresignificant changes are to be expected in the next ten years. The propor-tion of women in the labor force has been increasing continuously, and theaverage age of the working population has been rising. Of the total laborforce growth of 8.1 million in the decade of the 1950's, 4.8 million werewomen, most of whom were 35 years of age or older. A large part of thischange occurred during the great expansion of employment from 1954to 1956, when nearly 2 million women entered the labor force, but increas-ing participation in the labor force by women has characterized the entire
82
Digitized for FRASER http://fraser.stlouisfed.org/ Federal Reserve Bank of St. Louis
decade. In I960, nearly three-fourths of the increase of the Nation's workforce consisted of women.
Important shifts have also occurred in recent years in the age structureof the labor force. The number of workers 20 to 24 years of age hasdeclined, while the number of those 25 to 34 years of age has remainedpractically unchanged. This was due to the low level of births during the1930's. Workers 35 to 44 years old increased by 2.4 million, or 17 percent,from 1950 to 1960, while the number of those 45 and older expanded by5.3 million, or at a rate nearly twice that for the labor force as a whole.The proportion of workers under 35 years of age is now 40 percent, com-pared with 44 percent in 1950, and the number 45 or older is now 38percent, compared with 34 percent in 1950. However, the number ofteenage workers started to rise in 1955 as the more numerous generation ofthe 1940's began to reach working age. In 1960 about 240,000 teenagerswere added to the labor force, compared with 170,000 in the preceding year.
Under favorable economic conditions, the rising tide of young peopleand high labor force participation among older women may expand thelabor force by more than 13 million over the course of the next decade.This would represent the greatest numerical expansion in the history of ourcountry. Although a larger proportion of young people are expected tobe in school, the number of members of the working population under 25may increase by 6 million. There may be an especially great inflow ofteenagers into the labor force in the middle of the decade as the largenumbers born in 1946 and 1947 become 18, the usual age of high schoolgraduation. The number of older workers will also rise sharply. Thoseover 45 may increase by 5*/2 million despite further declines of labor forceparticipation by men over 65. The highly productive group 35 to 44 yearsof age, on the other hand, may decline slightly, and a relatively smallincrease of the number 25 to 34 is expected.
Thus, workers under 25 years of age and those 45 years and over willprobably account for almost 90 percent of the total growth of the laborforce between 1960 and 1970. With nearly half of the total increase inthe younger group, they will comprise 23 percent of the total labor forcein 1970, compared with 19 percent in 1960. At the same time the propor-tion that will be 25 to 44 years old will decline from 43 percent to less than39 percent in 1970. These impending changes constitute both an impres-sive challenge and a great opportunity for the maximum development andutilization of our human resources.
CHANGES OF EMPLOYMENT
The total number of employees on nonagricultural payrolls expandedrapidly after the end of the long steel strike in November 1959, andcontinued to grow at a more moderate rate during the first six months ofI960, reaching a record level of 53.1 million, seasonally adjusted, by the
83
Digitized for FRASER http://fraser.stlouisfed.org/ Federal Reserve Bank of St. Louis

middle of the year. Early in the year, however, divergent trends beganto appear in various industries.
Employment in durable goods manufacturing turned downward inMarch, as work forces were reduced in the transportation equipment andprimary metals industries. As the year progressed, work force reductionsoccurred in other durable goods sectors. Considered as a group, durablegoods manufacturing industries registered employment declines, after Feb-ruary, in nearly every month of 1960. In the manufacture of nondurablegoods, employment increased until June; but after midyear, declines ap-peared also in this sector. In the latter months of the year, reductions ofwork forces continued in most of the 21 major manufacturing industries. Inthe group of nonmanufacting industries, employment continued to expanduntil September, but moderate declines appeared during the final months ofthe year.
In December, total payroll employment, seasonally adjusted, in nonagri-cultural industries amounted to 52.2 million, which was 920,000 below thecrest at midyear and about 500,000 below the December 1959 figure. Thedecline of employment has been concentrated in manufacturing industries,while there have been some offsets in other industries, especially those pro-ducing services rather than goods (Table B-3).
Events in the labor market of 1960 are better understood in the light ofthe longer-term changes whicli have been taking place in the industrial andoccupational structure of employment in the United States. Since the pas-sage of the Employment Act of 1946, the growth of nonagricultural jobshas increased total employment tyy inore than 11 million. Agricultural em-ployment, on the other hand, hals continued to decline, dropping from 8.3million, or 15 percent of the total, in 1946 to 5.7 million, or 8^ percent oftotal employment, in 1960. This shrinking of employment on farms extendsa long-run trend that began generations ago when the United States economywas almost exclusively agricultural. The decline has continued as morepower and machinery have been introduced into agriculture in partial re-placement of farm labor, and as the national trend toward specializationin enterprise has lifted more procurement and marketing functions out ofagriculture.
Nearly all of the growth of employment since World War II is accountedfor by the gain in service type activities and industries, including education,distribution, finance, and business and personal services. Employment inState and local governments has increased very sharply, with 55 percentof the expansion occurring in the school systems of the country. Trade,finance, and other services have also afforded expanding job opportunities.An interesting parallel to this trend is found within manufacturing indus-try, where the numbers of salaried or "nonproduction" employees engaged inservice functions have increased in every major industry, while employmentof production workers has fluctuated widely and shown a tendency to decline.These areas of expanding employment have continued to grow, or at leasthave remained relatively steady, even during periods of recession. Producing
Digitized for FRASER http://fraser.stlouisfed.org/ Federal Reserve Bank of St. Louis

TABLE B-3.—Changes in nonagi'{cultural employment, by major industry groups,October 1959-December 1960
[Thousands of persons, seasonally adjusted data]
Major industry groupOctober 1959to February
1960February 1960to June 1960
June 1960 toDecember
1960 i
Total nonagricultural employment _
Manufacturing
Durable goods .-.
Transportation equipmentPrimary metal industriesMachinery (except electrical)Fabricated metal productsElectrical machineryInstruments and related productsOrdnance and accessoriesStone, clay, and glass productsLumber and wood products (except furniture) .Furniture and fixturesMiscellaneous manufacturing industries
Nondurable goods
Rubber productsFood and kindred productsTobacco manufacturesProducts of petroleum and coalLeather and leather productsPaper and allied productsPrinting, publishing, and allied industriesTextile mill productsChemicals and allied productsApparel and other finished textile products
Nonmanufa'cturing
TransportationPublic utilitiesFinance, insurance, and real estate .Contract constructionMiningService and miscellaneousWholesale and retail tradeGovernment
FederalState and local
970
545
538
2945213487353
-7-1
-15
-35134
-110
-13
425
37-411194867
149
-15113
168
-168
-113-73-25-7-3
0029
1626
-10
-3556
1926
237
-136799
2985
105
2976
-916
-452
13-129-82-54-19-12
1-38-67-33-32
-246
-12-23-4
-10-12-15
6-58-19-99
-218
-101-345
-166-40
36-158
169
10159
1 Based on preliminary data for December.NOTE.—These data represent employees in nonagricultural establishments. The figures for total non-
agricultural employment will therefore differ from those shown in Tables B-5 and C-17. For explana-tion of differences, see footnote 1, Table C-22.
Figures exclude data for Alaska and Hawaii.Source: Department of Labor.
services, they have been relatively immune to the employment impact ofthe wide inventory fluctuations which have characterized postwar businesscycles. Consequently, the growing proportion of workers in service typesof employment has strengthened the resistance of the economy to cumulativebusiness downturns (Table B-4).
Analogous trends are clearly evident in the changing occupational struc-ture of the employed labor force. "White-collar" occupations have grownin importance as manual occupations have relatively declined. The grow-ing occupational groups have also been those in which employment hasbeen relatively steady over the business cycle (Table B-5). It is perhapseven more important that developments of recent years have resulted in ageneral upgrading of the level of skill in the labor force. There has been
576899 O—61- 85
Digitized for FRASER http://fraser.stlouisfed.org/ Federal Reserve Bank of St. Louis

TABLE B-4.—Industrial structure of nonagi-{cultural employment, 1929, 1947, and 1957-60
[Thousands of persons]
Industry
Total nonagricultural employment
Stable and growing . _ _
Trade _ _ .Government _ ._
FederalState and local _
Service and miscellaneous _ .Salaried employees in manufacturingFinance, insurance, and real estate
Fluctuating or declining . _ ._ . ..
Production emplovees in manufacturing _ _.Contract constructionTransportation and public utilitiesMining
Stable and growing as percent of total
1929
31 041
16, 114
6,4013,066
5342,532
3,1272,0891,431
14, 927
8,4451,4973,9071,078
51.9
1947
43 462
23,620
9,1965,474
1,8923,582
4,7832,4951,672
19,842
12, 7951,9824,122
943
54.3
1957
52 162
31,483
11,3027,626
2,2175,409
6,3363,8712 348
20,679
12, 9102,8084 151
809
60.4
1958
50 543
31, 613
11, 1417,893
2,1915,702
6,3953,8102,374
18,930
11,6582,6483,903
721
62.5
1959
51 975
32,392
11,3858,126
2 1985,928
6,5253,9312 425
19,582
12,2372,7673,902
676
62.3
I9601
52, 895
33,294
11,6458,455
2,2366,219
6,6374,0722,485
19,603
12,2662,7703,901
666
62.6
1 Preliminary.
NOTE.—These data represent employees in nonagricultural establishments. The figures for total non-agricultural employment will therefore differ from those shown in Tables B-5 and C-17, which relate tononagricultural employment of the civilian labor force. For explanation of differences, see footnote 1,Table C-22.
Data exclude Alaska and Hawaii.
Source: Department of Labor.
TABLE B-5.—Civilian nonagricultural employment, by major occupational groups, 1930, 1947,and 1957-60
[Thousands of persons 14 years of age and over]
Occupational group
Total nonagricultural
Stable and growing
Clerical workers _ _ _ _ _ _ _Service workers, including private household _Professional, technical, and kindred workers. _Managers, officials, and proprietors, except
farm _Sales workers _ _ _ _
Fluctuating or declining
Operatives and kindred workersCraftsmen and foremenLaborers
Stable and growing as percent of total
19301
38,365
19,092
4,3364,7723,311
3,6143,059
19, 272
7,6916,2465,335
49.8
19472
49, 724
26, 169
7,2005,9863,794
5,7953,394
23,554
12, 2747,7543,526
52.6
19572
58, 957
34,083
9,1527,6326,468
6,7034,128
24, 874
12,5308,6643,680
57.8
1958
58, 375
34,865
9,1377,8096,961
6,7854,173
23, 510
11, 4418,4693,600
59.7
1959
59,999
35,838
9,3268,0407,143
6,9354,394
24, 162
11, 8588,5613,743
59.7
1960
61, 010
36,906
9,7348,3067,437
7,0474,382
24, 104
11, 9388,5113,655
60.5
1 Data for 1930 pertain to the "economically active civilian population" 10 years of age and over and aresimilar, but not strictly comparable, to other annual data in this table.
2 Figures shown for 1947 and 1957 are averages of data for January, April, July, and October since dataprior to 1958 are available only for these months. These averages, therefore, will differ slightly from theannual averages shown in Table C-17.
N OTE.—These data represent nonagricultural employment of the civilian labor force. The figures for totalnonagricultural employment will therefore differ from those shown in Tables B-4 and C-22. For ex-planation of differences, see footnote 1, Table C-22.
For comparability with earlier years, data for 1960 have been adjusted to exclude Alaska and Hawaii.Detail will not necessarily add to totals because of rounding.
Sources: Department of Commerce and Department of Labor.
86
Digitized for FRASER http://fraser.stlouisfed.org/ Federal Reserve Bank of St. Louis
a trend away from jobs requiring heavy, arduous, Unskilled labor and towardthose which require broad education and training. For professional andtechnical workers, for example, employment opportunities have increaseddramatically. Heavy expenditures in industry as well as in educationalinstitutions for research and development, and rising demands for scientists,engineers, teachers, and technicians have strengthened this trend. Employ-ment of unskilled or semiskilled manual workers, on the other hand, hasexpanded very little, or has actually declined, and has fluctuated with thebusiness cycle. High and rising levels of education and training requiredfor employment in the occupations where ample job opportunities are mostlikely to be found emphasize the great importance of good secondary andhigher educations for the large numbers of young people who are enteringthe labor force. These occupational and industrial trends make moredifficult the problem of unemployment for unskilled and semiskilledworkers in fluctuating or declining industries.
UNEMPLOYMENT
For the year 1960 as a whole, unemployment amounted to 3.9 millionpersons or 5.6 percent of the civilian labor force, about the same as in1959. This was lower than in the recession year of 1958, when unem-ployment reached a postwar peak of nearly 7 percent of the labor force,but higher than in the period 1955 to 1957, when it averaged a little over4 percent.
In the course of the year 1960, unemployment changed markedly. Withthe recovery of employment after the long steel strike, unemploymentdeclined from about 4 million in the closing months of 1959 to 3.5 millionin the early part of 1960, or from about 6 to 5 percent of the civilian laborforce, seasonally adjusted. When in the second half of the year employmentdeclined, unemployment increased, reaching an average of 4 million inthe third and of 4.6 million in the final quarter. In December 1960, unem-ployment amounted to 4.9 million, or 6.8 percent of the labor force,compared with 3.8 million, or 5.5 percent of the labor force, in December1959. The increase during the second half of the year mainly affectedadult men and women, reflecting job cutbacks in manufacturing andrelated industries.
The number of persons who normally work full time but for economicreasons are working only part time is a measure of one form of under-employment. In 1960 such part-time workers averaged 1.2 million, com-pared with 1 million in 1959 and 1.6 million in 1958. The rise of part-timeemployment in 1960 occurred mainly among factory workers, and wasespecially marked during the late months of the year. A second groupof underemployed, those who work part time primarily because of inabilityto find full-time work, averaged 1.3 million in 1960, the same as in 1959,but about 375,000 higher than the average in 1956-57. Most of thesewere women and teenagers in the trade and service industries.
87
Digitized for FRASER http://fraser.stlouisfed.org/ Federal Reserve Bank of St. Louis

Characteristics of the Unemployed
The movement into and out of the unemployed group, or the turnoveramong persons without jobs, was comparatively large in 1960. Almost halfof those unemployed in any month were no longer seeking work in the fol-lowing month either because they had found jobs or had left the labormarket. Consistent with this substantial turnover, persons seeking work forless than 5 weeks accounted for nearly half of total unemployment during1960. This proportion was higher than in 1958 or 1959, but lower than inthe years before the 1957-58 recession. Long-term unemployment, definedas persons seeking work for 15 weeks or more, averaged about 1 million in1960. While this average was about the same as in 1959, it was nearly500,000 lower than in the recession year of 1958, yet almost twice as highas in 1956-57. Long-term unemployment was reduced during the firsthalf of 1960, but afterward increased. In December, the number of long-term unemployed amounted to 1.0 million, compared with 800,000 inDecember 1959. Extended periods of unemployment are most commonlyfound among the following groups: older persons; blue-collar workersgenerally; non-white workers; and workers laid off in industries manu-facturing durable goods.
For most of the age-sex groups of the labor force, rates of unemploymentin 1960 did not differ much from those in 1959, considering the year as awhole. Unemployment was, as usual, highest among teenage workerswho are likely to change jobs more frequently than older persons. Therate of unemployment among married men living with their families, whoaccount for about one-third of all unemployed persons, averaged 3.7 per-cent in 1960, about the same as in 1959; however, this rate was in-creasing during the second half of the year. For non-white men, the rateof unemployment averaged 11 percent, and it was as usual more than twicethe rate for white male workers. Non-white workers are concentrated inunskilled and semiskilled occupations where unemployment rates are gen-erally high. Unemployment in various occupations and industries alsoaveraged about the same in 1960 as in 1959. Significant increases oc-curred, however, during the third and fourth quarters of 1960 in durablegoods manufacturing and among the occupation groups important in thisindustry, such as metal craftsmen, semiskilled factory operatives, andfactory laborers.
In the past decade there has been little change in the ranking of occupa-tions by rates of unemployment. Highest rates prevail among laborers,followed by operatives and service workers. White-collar workers, in 1960as in the past, were least affected by unemployment.
Trends in Major Labor Markets
Less vigorous demand for labor became apparent after the spring of1960 in most of the Nation's 147 major labor market areas, which accountfor about 70 percent of all nonagricultural wage and salary employment
88
Digitized for FRASER http://fraser.stlouisfed.org/ Federal Reserve Bank of St. Louis
in the country. In January I960, labor market surveys conducted by Stateemployment security agencies for the Department of Labor found demandand supply of labor in reasonable balance in 118 of the major areas; in93 of them, unemployment ranged between 3 and 6 percent of the locallabor force, while in 25 areas unemployment was below 3 percent. Theremaining areas had substantial labor surpluses, that is, unemploymentrates of 6 percent or higher, for other than seasonal or temporary reasons.Through the year, the number of major labor markets having an unem-ployment rate of less than 6 percent gradually diminished to 99 in November1960, 11 of which had a rate of less than 3 percent. At the same time,the number of areas having substantial labor surpluses increased to 48,compared with 29 a year earlier.
These changes in labor markets in 1960 mainly reflect lower employmentin durable goods industries. Many places with substantial labor surpluseshave, however, had persistent problems of unemployment for many years,although they are not, primarily, centers of durable goods production. InNovember 1960, 19 major labor markets in the United States were classifiedas areas having "substantial and persistent labor surpluses," that is, unem-ployment rates of 6 percent or higher for other than temporary reasons andjobless rates substantially above the national average for extended periodsof time. All but 4 of these had had substantial labor surpluses in Septem-ber 1957, before the effects of the 1957-58 recession. In only 6 of the 19major areas were employment losses in durable goods manufacturing thecause of persistent problems of local unemployment. In the remainingareas, which are all located in the northeastern part of the country, long-term declines of the mining, textile and apparel manufacturing, and railroadequipment maintenance industries have caused chronic unemployment.At mid-1960, before the downturn of total employment, about 11 percent ofthe unemployment in major labor markets was accounted for by areas withchronic and persistent labor surpluses, although they have only 7 percent ofthe labor force. At that time, the average rate of unemployment in theseareas was estimated at 7.9 percent, compared with 4.7 percent for the othermajor areas.
Despite higher unemployment during the latter months of 1960, con-tinuing shortages of professional, technical, clerical, and skilled workerswere still noted in most labor market areas. In many places, availableworkers were not considered by employers to be qualified for existing jobopenings with respect to the required training, experience, and skill. At thesame time the semiskilled, the unskilled, and persons without work experi-ence were reported in surplus supply in nearly all sections of the country.
Trends of Insured Unemployment
Insured unemployment, the number of persons out of work and eligibleto receive unemployment benefits, declined slightly (seasonally adjusted)in the early months of 1960. Beginning in June, however, their number
89
Digitized for FRASER http://fraser.stlouisfed.org/ Federal Reserve Bank of St. Louis
began to increase, and in the later months of the year it was sharply higher.In December, the number of persons eligible for benefits averaged 2.8million, compared with 2 million in December 1959. Most of the increaseover the year resulted from job cutbacks in industries manufacturing dur-able goods. Payments of unemployment insurance benefits increased rap-idly, and in December 1960 amounted to about $350 million, comparedwith $251 million in December 1959. These insurance payments, togetherwith other government transfer payments, and augmented by the privatesupplements negotiated in collective bargaining in the steel and otherindustries, were a substantial support to labor income in 1960.
HOURS OF WORK AND EARNINGS
With moderately declining use of labor in many important industries, andmore frequent adoption of reduced weekly work schedules, the averageworkweek of production workers in manufacturing industries tended down-ward in 1960 and reached 38.5 hours (seasonally adjusted) in December,compared with 40.2 hours in December 1959. Reduced workweeks andless overtime, together with lower employment in the more highly paidmetalworking industries, meant that the general average of hourly earningsin manufacturing industries increased little in 1960, despite a continuedrise of basic wage rates. Average hourly earnings were $2.32 in Decem-ber, compared with $2.27 in December 1959. Average weekly earnings,reflecting the reduced workweek, receded slightly in the course of the year,and were $90.02 in December, compared with $92.16 in December 1959.When adjusted for the rise of consumer prices, weekly earnings in manufac-turing showed a slightly larger decline; however, the annual average forreal weekly earnings was practically unchanged from 1959. In nonmanu-facturing industries, weekly earnings rose in 1960 by an average of about3 percent. Salaries of civilian employees of the Federal Government wereincreased by legislative action. For employees of the postal service theincreases averaged 8.4 percent; for other employees the average increasewas 7.5 percent. By this action, total wage and salary payments wereincreased by about $750 million annually.
Lower employment and earnings in several industries stemmed the in-crease of labor income in the latter months of 1960. After rising by $10billion from December through June, labor income was steady at an annualrate of $286.2 billion through the third quarter of the year. During thefourth quarter, it declined to $282.1 billion in December.
DEVELOPMENTS IN COLLECTIVE BARGAINING
Basic wage rates advanced in 1960 by somewhat more than 3 percent,about the same average rate of increase as in 1959. Wage increases, in-cluding cost of living adjustments and deferred increases negotiated inearlier years, were put into effect for about 7 million employees, nearly 90percent of those covered by major labor agreements (Table B-6).
90
Digitized for FRASER http://fraser.stlouisfed.org/ Federal Reserve Bank of St. Louis
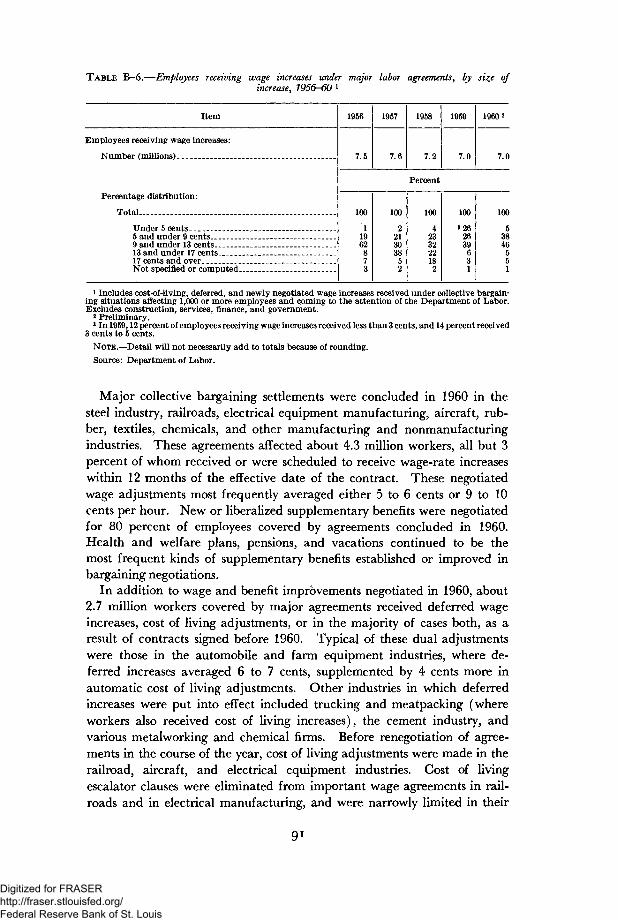
TABLE B—6.—Employees receiving wage increases under major labor agreements, by size ofincrease, 1956-60 1
Item
Employees receiving wage increases:
Number (millions)
Percentage distribution:
Total
Under 5 cents5 and under 9 cents _ _ .9 and under 13 cents13 and under 17 cents17 cents and over _ . _Not specified or computed
1956
7.5
100
11962g73
1957
7.6
100
221303852
1958
7.2
Percent
100
4233222182
1959
7.0
100
3262639631
19602
7.0
100
53846551
1 Includes cost-of-living, deferred, and newly negotiated wage increases received under collective bargain-ing situations affecting 1,000 or more employees and coming to the attention of the Department of Labor.Excludes construction, services, finance, and government.
2 Preliminary.3 In 1959,12 percent of employees receiving wage increases received less than 3 cents, and 14 percent received
3 cents to 5 cents.
NOTE.—Detail will not necessarily add to totals because of rounding.
Source: Department of Labor.
Major collective bargaining settlements were concluded in 1960 in thesteel industry, railroads, electrical equipment manufacturing, aircraft, rub-ber, textiles, chemicals, and other manufacturing and nonmanufacturingindustries. These agreements affected about 4.3 million workers, all but 3percent of whom received or were scheduled to receive wage-rate increaseswithin 12 months of the effective date of the contract. These negotiatedwage adjustments most frequently averaged either 5 to 6 cents or 9 to 10cents per hour. New or liberalized supplementary benefits were negotiatedfor 80 percent of employees covered by agreements concluded in 1960.Health and welfare plans, pensions, and vacations continued to be themost frequent kinds of supplementary benefits established or improved inbargaining negotiations.
In addition to wage and benefit improvements negotiated in 1960, about2.7 million workers covered by major agreements received deferred wageincreases, cost of living adjustments, or in the majority of cases both, as aresult of contracts signed before 1960. Typical of these dual adjustmentswere those in the automobile and farm equipment industries, where de-ferred increases averaged 6 to 7 cents, supplemented by 4 cents more inautomatic cost of living adjustments. Other industries in which deferredincreases were put into effect included trucking and meatpacking (whereworkers also received cost of living increases), the cement industry, andvarious metalworking and chemical firms. Before renegotiation of agree-ments in the course of the year, cost of living adjustments were made in therailroad, aircraft, and electrical equipment industries. Cost of livingescalator clauses were eliminated from important wage agreements in rail-roads and in electrical manufacturing, and were narrowly limited in their
91
Digitized for FRASER http://fraser.stlouisfed.org/ Federal Reserve Bank of St. Louis

operation in the steel and related industries. During the year, the numberof workers covered by labor agreements containing such clauses was reducedfrom 4 million to less than 2.8 million.
In the construction trades, about 85 percent of union wage scales wereincreased in 1960, a slightly smaller proportion than during the precedingthree years. The average increase for all scales was about 14 cents perhour, compared with 16 cents in 1959 and 15 cents in 1958 and in 1957.
Labor disputes were infrequent and generally of short duration in 1960.Both the number of employees involved in work stoppages and the numberof man-days of idleness were very low, judged by the record of the yearssince World War II. There was evidence of increasing recognition ofthe need for constructive study and resolution of the serious economic issuesbeing raised in negotiations by rapid technological change and by com-petitive pressures. In the railroad industry, the long-standing and complexdispute over changes in working rules was referred, by agreement of theparties, to a Presidential commission for study, recommendations, andmediatory assistance in the resolution of the issues. The commission'sstudy and recommendations, which will not be binding upon the parties,are to be completed by December 1, 1961. Study groups and committeeswere also established in the steel and construction industries and by nationallabor and business groups.
Digitized for FRASER http://fraser.stlouisfed.org/ Federal Reserve Bank of St. Louis
II. AgricultureAgriculture in the United States consists of two parts that are becoming
more and more distinct: (1) commercial farm enterprises and (2) non-commercial holdings, many of which are little more than farm living units.Each is composed of numerous types. Commercial farms vary in area underoperation from small vegetable farms to very large western cattle ranches;noncommercial units comprise backyard cow-and-garden farms., farms ofretired and semiretired people, part-time farms, and others.
The distinctions between the two broad parts are real and meaningfulfor any attempt at weighing the economic and social problems of agriculture.Commercial and noncommercial agriculture differ in economic status, in thenature of their problems, and in the trends they exhibit. Commercial larmsoutnumber the noncommercial holdings in a ratio of almost two to one;the two groups together total roughly 3.7 million units, most of them familyoperated.
Commercial agriculture produces more than nine-tenths of all farmoutput, earns the major part of all net farm income, and holds most ofagriculture's proprietary assets. Aggregate statistical measures, which sel-dom distinguish between commercial and noncommercial agriculture, musttherefore be interpreted as pertaining chiefly to the commercial portion.Because of the differences in the economic performance of the two typesof farms and their changing relative numbers, a conversion of aggregatetotals into averages per farm tends to be misleading.
Since commercial agriculture contributes so much of all market suppliesof farm products and absorbs even more of the capital resources used, itsproblems are essentially those of commodity markets. National concernwith adjustment problems of underdeveloped and underemployed humanresources in agriculture is associated with low income farms—those innoncommercial agriculture and the smallest-sized fringe of commercialagriculture.
PRODUCTION AND INCOME IN 1960
The commercial part of agriculture accounted for the rapid expansionin farm output during the last few years and for the record high productionin 1960—a record attained despite the reduction of the planted acreage,brought about chiefly by the Conservation Reserve Program, to the smallestarea since 1916. While the index of livestock production dropped 1 point,to 129 (1947-49=100), the index of crop production rose to a new high
93
Digitized for FRASER http://fraser.stlouisfed.org/ Federal Reserve Bank of St. Louis
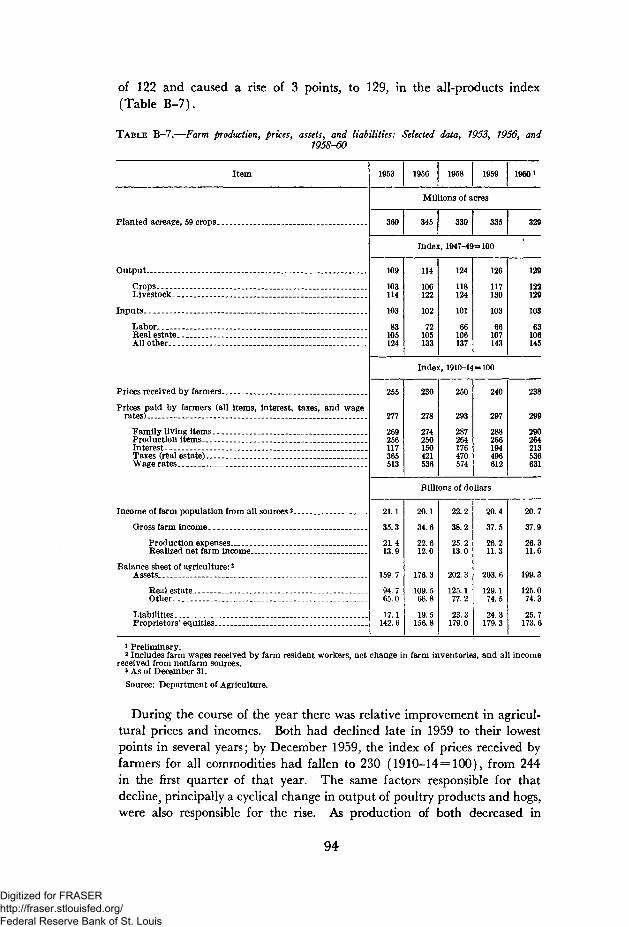
of 122 and caused a rise of 3 points, to 129, in the all-products index(Table B-7).
TABLE B-7.—Farm production, prices, assets, and liabilities: Selected data, 1953, 1956, and1958-60
Item
Planted acreage, 59 crops . _ _ .
Output
Crops _ _ _ .Livestock
Inputs
Labor.. _ _Real estateAllother
Prices received by farmers.
Prices paid by farmers (all items, interest, taxes, and wagerates) _ _
Family living itemsProduction items ._ ...Interest _Taxes (real estate)Wage rates . _ _ .
Income of farm population from all sources 2
Gross farm income
Production expenses _ _ .Realized net farm income
Balance sheet of agriculture: 3
Assets
Real estateOther-. . _ .
LiabilitiesProprietors' equities. _ _ _ _ ._ _
1953 1956 1958 1959 19601
Millions of acres
360 345 330 335 329
Index, 1947-49=100
109
103114
103
83105124
114
106122
102
72105133
124
118124
101
66106137
126
117130
103
66107143
129
122129
103
63106145
Index, 1910-14=100
255
277
269256117365513
230
278
274250150421536
250
293
287264176470574
240
297
288266194496612
238
299
290264213536631
Billions of dollars
21.1
35.3
21.413.9
159.7
94.765.0
17.1142.6
20.1
34.6
22.612.0
176.3
109.566.8
19.5156.8
22.2
38.2
25.213.0
202.3
125.177.2
23.3179.0
20.4
37.5
26.211.3
203.6
129.174.5
24.3179.3
20.7
37.9
26.311.6
199.3
125.074.3
25.7173.6
1 Preliminary.2 Includes farm wages received by farm resident workers, net change in farm inventories, and all incomereceived from nonfarm sources.
3 As of December 31.Source: Department of Agriculture.
During the course of the year there was relative improvement in agricul-tural prices and incomes. Both had declined late in 1959 to their lowestpoints in several years; by December 1959, the index of prices received byfarmers for all commodities had fallen to 230 (1910-14=100), from 244in the first quarter of that year. The same factors responsible for thatdecline^ principally a cyclical change in output of poultry products and hogs,were also responsible for the rise. As production of both decreased in
94
Digitized for FRASER http://fraser.stlouisfed.org/ Federal Reserve Bank of St. Louis

early 1960 their prices improved, lending strength to the average of all-product prices; by April the price index had risen to 242. Small declinesafter April were followed by a new recovery, and the index in Decemberwas again 242.
Price advances underpinned a rise in gross income in agriculture toan appreciably higher level in the second quarter of 1960 than in thesecond half of 1959 and first quarter of 1960. The increased income ofthe second quarter was sustained later by the harvest of large crops of price-supported grains. The movement of wheat into Commodity Credit Cor-poration loans in the fall of 1960 was greater than a year earlier, and theloan advances were an addition to gross income. For the entire year,gross farm income exceeded the $37.5 billion of 1959 by $0.4 billion,according to preliminary data.
Production expenses in 1960 were about the same as in 1959. Theirnear-stability ended a steady and marked 4-year rise, and was due largelyto lower prices for feed and feeder livestock. Prices of most commoditiesbought from nonfarm sources were as high as in 1959, or slightly higher, andinterest, taxes, and wage rates increased substantially.
As gross income was up and expenses of production were almost un-changed, realized net income of farm operators from farming increased alittle—from $11.3 billion in 1959 to $11.6 billion (preliminary) in 1960.Income received from nonfarm sources, which has increased to about athird of the total income of the farm population, was up slightly in 1960,to a new record of $6.9 billion. Total net income received by the farmpopulation from all sources, which also includes the $1.8 billion of farmwages received by workers who live on farms and the net change in valueof farm inventories, rose to $20.7 billion, from $20.4 billion in 1959.
The previous uptrend in values of farm land came to a halt during 1960.As a consequence, total assets in agriculture were reduced by 2 percent duringthe year, to $199 billion on December 31, 1960. Several of the factors thathad sustained the previous uptrend in land values had run their course, asvalues reached or exceeded a historical ratio to current income. Moreover,rising taxes on the increased capital value, and higher interest charges onnew mortgages, contributed to the downturn in values. Farm debts con-tinued to rise slowly during 1960; yet at $25.7 billion on December 31, theywere only 13 percent of assets.
Current indebtedness in agriculture appears especially small in relationto the very sizable rise in the value of assets that has taken place during thelast 20-25 years. Since 1940, for instance, assets in agriculture have in-creased three times, or by $146 billion. While these values include farmassets held by nonfarm landlords, the larger part of the rise has accrued tooperators of commercial farms. Capital gains have been one of the majorelements of financial strength of commercial agriculture during the lastquarter century.
95
Digitized for FRASER http://fraser.stlouisfed.org/ Federal Reserve Bank of St. Louis

NET INCOME OF SELECTED COMMERCIAL FARM TYPES
Although reported data on total farm income unfortunately do not dis-tinguish between commercial and noncommercial agriculture, statisticalseries have been developed by the Department of Agriculture to describetrends in organization and income on typical commercial family-operatedfarms of 32 selected types. Preliminary data presented in Table B-8 for
TABLE B-8. — Net farm income of selected types of commercial family-operated farmsy 1953,1956, and 1958-60
[Dollars per farm]
Type of farm
Wheat farms, Southern PlainsCattle ranches, Inter mountain Region.. _ _ _ _Hog-dairy farms, Corn Belt - .Wheat-small grain-livestock farms, Northern PlainsDairy farms, Central Northeast - -Tobacco-cotton farms, Coastal Plains, North CarolinaPeanut-cotton farms, Southern Coastal PlainsCotton farms,' Black Prairie, Texas
1953
5,4235,3246,0673,7583,1753,2402,6603,530
1956
3,7685,7285,1766,9703,8243,6742,743
899
1958
13, 28313, 1247,4536,4454,3373,3943,4673,035
1959
9,03312, 3276,0032,8764,3642,7182,4372,483
1960 1
11, 4399,0445,3384,6844,2083,2902,8372,110
i Preliminary.
NOTE.—Figures in this table were computed by applying reported prices to data on the organization oftypical farms.
Source: Department of Agriculture.
eight of these types illustrate the wide variation between different types offarming—both in size of income and in fluctuations in income from yearto year. In I960,, for instance, net farm income for half of the eight typeswas higher than in 1959; for the other half, it was lower. Bumper cropsof wheat in 1960 which sold at or near support prices boosted the incomeof wheat farms. A moderate cyclical decline in the price of cattle reducedthe income of cattle ranches from the very favorable level of the precedingtwo years. Recovery in prices of hogs during 1960 did not fully restorethe previous year's income to hog-dairy farms of the Corn Belt. Dairy farmsof the Northeast apparently experienced a small decline in income. Thestability of dairy incomes in the Northeast, in comparison with the sharpvariability for some other types of farm income, is brought out by the data inTable B-8.
It should be noted that net farm income as reported in Table B-8 includesreturns on both capital and family labor. Large differences between farmtypes in the amount of capital invested, as well as in the amount of familylabor utilized, account for a part of the differences in the amount of netincome.
INCREASING IMPORTANCE OF COMMERCIAL FARMS
The proportion of all farms that are operating on a commercial scale,and the share of such farms in the national output of farm products, areincreasing. Also, commercial farms are employing an increasing percen-tage of all persons engaged in agriculture. Hence commercial farming
Digitized for FRASER http://fraser.stlouisfed.org/ Federal Reserve Bank of St. Louis
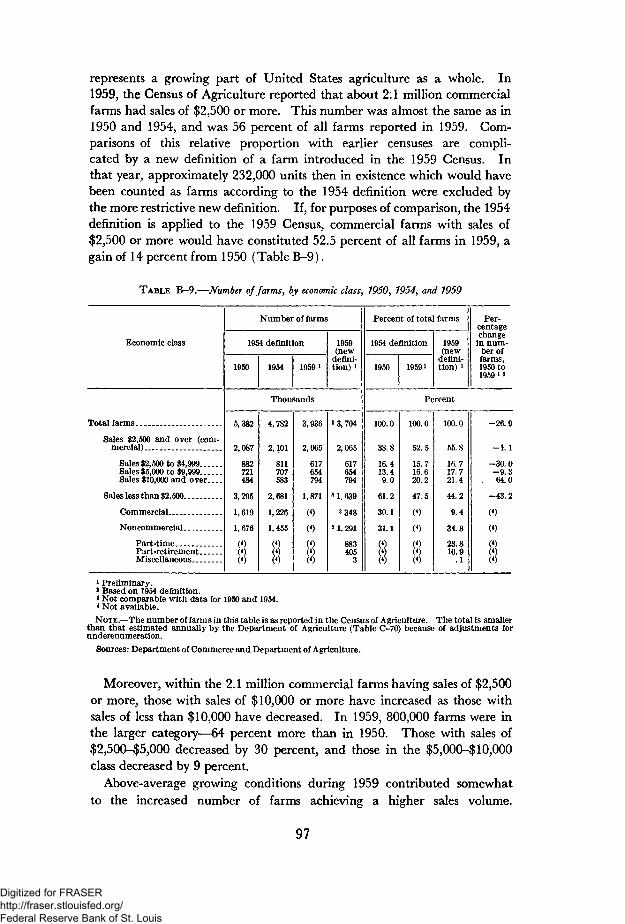
represents a growing part of United States agriculture as a whole. In1959, the Census of Agriculture reported that about 2:1 million commercialfarms had sales of $2.,500 or more. This number was almost the same as in1950 and 1954, and was 56 percent of all farms reported in 1959. Com-parisons of this relative proportion with earlier censuses are compli-cated by a new definition of a farm introduced in the 1959 Census. Inthat year, approximately 232,000 units then in existence which would havebeen counted as farms according to the 1954 definition were excluded bythe more restrictive new definition. If, for purposes of comparison, the 1954definition is applied to the 1959 Census, commercial farms with sales of$2,500 or more would have constituted 52.5 percent of all farms in 1959, again of 14 percent from 1950 (Table B-9).
TABLE B-9.—Number of farms, by economic class, 1950, 1954, and 1959
Economic class
Total farms
Sales $2,500 and over (com-mercial) _
Sales $2,500 to $4,999Sales $5,000 to $9,999Sales $10,000 and over
Sales less than $2,500 .._
Commercial _
Noncommercial
Part-timePart-retirementMiscellaneous
Number of farms
1954 definition
1950 1954 19591
1959(new
defini-tion) i
Thousands
5,382
2,087
882721484
3,295
1,619
1,676
(4)(*)(4)
4,782
2,101
811707583
2,681
1,226
1,455
(*)(«)(4)
3,936
2,065
617654794
1,871
(4)
(4)
(4)(•)(4)
3 3, 704
2,065
617654794
» 1, 6393 348
31.291
883405
3
Percent of total farms
1954 definition
1950 19591
1959(new
defini-tion) i
Per-centagechange
in num-ber offarms,1950 to1959 i 2
Percent
100.0
38.8
16.413.49.0
61.2
30.1
31.1
(4)(4)(4)
100.0
52.5
15.716.620.2
47.5
(4)
(4)
(4)(4)(4)
100.0
55.8
16.717.721.4
44.2
9.4
34.8
23.810.9
.1
-26.9
-1.1
-30.0-9.364.0
-43.2
(4)
(«)
(4)
8i Preliminary.* Based on 1954 definition.* Not comparable with data for 1950 and 1954.* Not available.NOTE.—The number of farms in this table is as reported in the Census of Agriculture. The total is smaller
than that estimated annually by the Department of Agriculture (Table C-70) because of adjustments forunderenumeration.
Sources: Department of Commerce and Department of Agriculture.
Moreover, within the 2.1 million commercial farms having sales of $2,500or more, those with sales of $10,000 or more have increased as those withsales of less than $10,000 have decreased. In 1959, 800,000 farms were inthe larger category—64 percent more than in 1950. Those with sales of$2,500-$5,000 decreased by 30 percent, and those in the $5,000-$ 10,000class decreased by 9 percent.
Above-average growing conditions during 1959 contributed somewhatto the increased number of farms achieving a higher sales volume.
97
Digitized for FRASER http://fraser.stlouisfed.org/ Federal Reserve Bank of St. Louis

Although expenses of production have been rising gradually, so that grosssales are not an exact measure of relative net income, it nevertheless seemslikely that more and more commercial farms have succeeded in increasingtheir business to a volume that improves the chances of returning a satisfac-tory net income to the farm family. The 10-year increase of almost two-thirds in the number of farms having sales of $10,000 or more is evidencethat this is true.
All these data apply to commercial farms selling farm products valuedat $2,500 or more during the Census year. They omit those farms sellingless than $2,500 of products that are technically classed as commercial owingto lack of any other sizable income. This classification of farms was chosenboth because farms selling less than $2,500 of products are clearly inade-quate as sources of farm income, and in order to facilitate statistical com-parisons between Censuses.
DECREASE IN NUMBER OF SMALL FARMS
According to the Census of 1959, there were 1,639,000 farms in theUnited States which sold less than $2,500 worth of farm products. Thisnumber included 348,000 so-called "midget" commercial farms—those forwhich the small volume of sales of farm products nevertheless was theprimary source of family income. It also included 883,000 part-time and405,000 part-retirement farms. The total of 1,639,000 was 44 percent ofall farms, as enumerated according to the new definition.
All the farms omitted in the 1959 Census because of a more restrictivedefinition were small farms—those with less than $2,500 of sales. Whenthese omissions are added, in order to make comparisons with data of earlierCensuses, the number of small farms becomes 1.9 million, a substantialreduction from the 2.7 million of 1954 and 3.3 million of 1950 (Table B-9).
These reductions in numbers of small farms doubtless reflect someamelioration of the problem of low-income farms. Progress has been madein either enlarging the production resources on small farms, or in sup-plementing the farm income from sources off the farm. Yet also evidentin recent trends is a gradual disappearance of units that have qualified asfarms only by virtue of sideline "backyard" farming, a time-consumingoccupation yielding minimum returns to labor.
On the other hand, the Conservation Reserve has probably shifted a num-ber of farms of sizable acreage into the small-farms category, because of thesmall value of products now sold from their idled acreage.
DECLINE IN TOTAL NUMBER OF FARMS
The total number of all farms reported in the 1959 Census, accordingto preliminary data, was 3.7 million. By use of the same definition as in1954, the number in 1959 would have been reported as 3.9 million, com-pared with 4.8 million in 1954 and 5.4 million in 1950 (Table B-9).
98
Digitized for FRASER http://fraser.stlouisfed.org/ Federal Reserve Bank of St. Louis
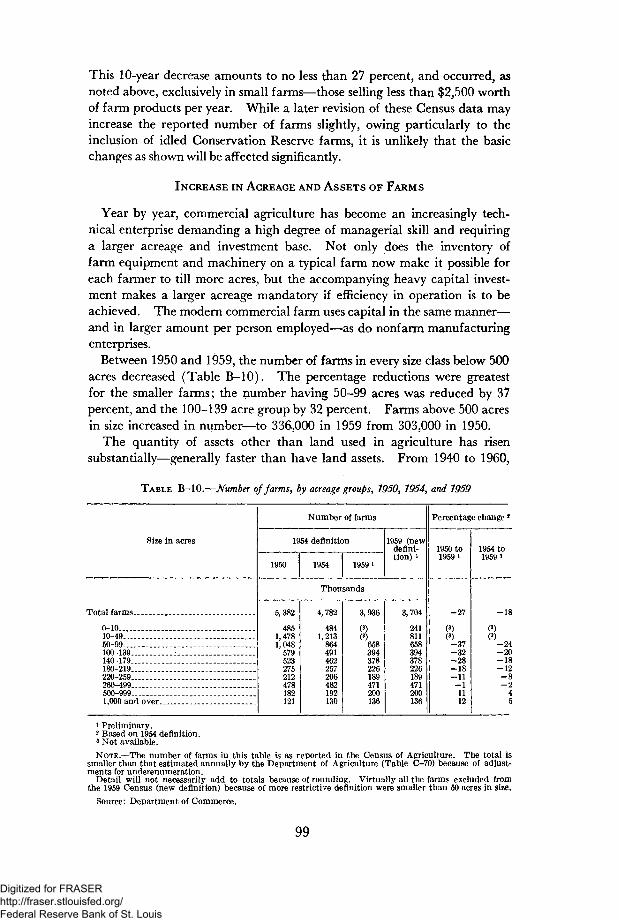
This 10-year decrease amounts to no less than 27 percent, and occurred, asnoted above, exclusively in small farms—those selling less than $2,500 worthof farm products per year. While a later revision of these Census data mayincrease the reported number of farms slightly, owing particularly to theinclusion of idled Conservation Reserve farms, it is unlikely that the basicchanges as shown will be affected significantly.
INCREASE IN ACREAGE AND ASSETS OF FARMS
Year by year, commercial agriculture has become an increasingly tech-nical enterprise demanding a high degree of managerial skill and requiringa larger acreage and investment base. Not only does the inventory offarm equipment and machinery on a typical farm now make it possible foreach farmer to till more acres, but the accompanying heavy capital invest-ment makes a larger acreage mandatory if efficiency in operation is to beachieved. The modern commercial farm uses capital in the same manner—and in larger amount per person employed—as do nonfarm manufacturingenterprises.
Between 1950 and 1959, the number of farms in every size class below 500acres decreased (Table B-10). The percentage reductions were greatestfor the smaller farms; the number having 50-99 acres was reduced by 37percent, and the 100-139 acre group by 32 percent. Farms above 500 acresin size increased in number—to 336,000 in 1959 from 303,000 in 1950.
The quantity of assets other than land used in agriculture has risensubstantially—generally faster than have land assets. From 1940 to 1960,
TABLE B-10.—Number of farms, by acreage groups, 1950, 1954, and 1959
Size in acres
Total farms _
0-1010-49 .50-99 _ _ _100-139140-179180-219220-259 . . .260-499500-9991,000 and over
Number of farms
1954 definition
1950 1954 1959 i
1959 (newdefini-tion) i
Thousands
5,382
4851,4781,048
579523275212478182121
4,782
4841,213
864491462257206482192130
3,936
(3)(3)
658394378226189471200136
3,704
241811658394378226189471200136
Percentage change 2
1950 to19591
-27
(3)(3)-37-32-28-18-11-11112
1954 to19591
-18
<»)(3)
-24-20-18-12-8-2
45
1 Preliminary.2 Based on 1954 definition.3 Not available.
NOTE.—The number of farms in this table is as reported in the Census of Agriculture. The total issmaller than that estimated annually by the Department of Agriculture (Table C-70) because of adjust-ments for undeienumeration.
Detail will not necessarily add to totals because of rounding. Virtually all the farms excluded fromthe 1959 Census (new definition) because of more restrictive definition were smaller than 50 acres in size.
Source: Department of Commerce.
99
Digitized for FRASER http://fraser.stlouisfed.org/ Federal Reserve Bank of St. Louis

when improvements on land raised the physical real estate assets in agricul-ture by 22 percent, the amount of machinery employed increased by 151percent. Although livestock inventories increased by only 19 percent, allother assets combined—primarily crop inventories and demand depositsin banks—increased by 46 percent. Total production assets in agricultureincreased by 30 percent during the 20-year period. These are estimatedquantities, valued at constant (1947-49) prices (Table B-l 1).
TABLE B-l 1.—Production assets used in agriculture, 1940, 1950, and 1960
Kind of asset
Total production assets _
Farm real estate -LivestockMachinery and motor vehiclesOther i
Per farm 2
Per farm worker
1940 1950 1960
Billions of dollars,1947-49 prices
83.3
58.212.94.18.1
95.9
63.413.18.6
10.8
108.6
71.115.410.311.8
Dollars, 1947-49 prices
13, 1187,347
16,9799,625
23,92114, 707
Percentage change
1940 to1960
30
2219
15146
82100
1950 to1960
13
1218209
4153
1 Includes crop inventories held for livestock feed and the portion of demand deposits owned by farmersestimated as being held to meet farm production costs.
2 Based on number of farms as reported by the Department of Agriculture, according to 1954 Censusdefinition. (See footnote 1, Table C-70.)
Source: Department of Agriculture.
As the number of farms has decreased, real production assets per farmhave increased considerably. Valued in constant dollars, assets per farmadvanced 82 percent between 1940 and 1960. Assets per farm workerincreased even more: their average doubled during the 20 years, to $14,700in I960, valued in 1947-49 dollars. Valued in 1960 dollars, farm assets perfarm worker in 1960 averaged $21,300, considerably more than the averageinvestment of $15,900 per employee in manufacturing in the same year.Data on average assets per farm pertain to all farms, commercial and non-commercial, as reported by the Department of Agriculture according to thepre-1960 Census definition (see Table C-70); they doubtless overstate therate of increase, but underreport the present average size, of assets held oncommercial farms alone.
FARMER COOPERATIVES IN COMMERCIAL AGRICULTURE
Today's agriculture in all its complexity, particularly its commercialpart, rests on three kinds of supporting services. One is technical andeducational; it begins with public elementary and secondary education,including vocational training, and ends with the broad programs of
100
Digitized for FRASER http://fraser.stlouisfed.org/ Federal Reserve Bank of St. Louis

research and education carried out by the Land Grant Colleges, Agricul-tural Experiment Stations, and the Federal-State Extension Service. Thesecond is the assistance provided by Government in fields ranging fromaid in soil conservation to regulation of markets for farm products, and tocertain assistance in maintaining prices and incomes of farmers.
The third supporting service, one also essential to agriculture of the1950's and 1960's, is self-provided by agriculture—the joining of individualproducers in many types of cooperative associations. Farmer cooperatives,designed in manifold ways for a multitude of purposes, are in many respectsa bridge between the technological and management demands of moderncommercial agriculture and its decentralized, small-unit, family-farm organ-izational structure. As a form of business enterprise, the cooperative asso-ciations perform for agriculture what is done by corporate organizationin industry and commerce.
Farmers make wide use of cooperatives in obtaining essential servicesranging from marketing of farm products to purchasing of farm supplies,and including organized mortgage and production credit, electric power,telephone service, medical service, insurance, irrigation, and dairy herdimprovement. In 1957-58 farmers held over 3.8 million memberships in6,102 marketing cooperatives, and 3.5 million in 3,381 farm supply associa-tions. The 13 banks for cooperatives, in which farmers are developing sub-stantial ownership equities, served cooperatives with farmer membershipstotaling more than 3.6 million. Memberships and participants in ruralelectric cooperatives number over 4.4 million (Table B-12).
TABLE B—12.—Farmers' cooperative associations and their membership, by type l
Type
Marketing, supply, and service ,
MarketingPurchasing . _ _ _ _ _ ._Miscellaneous service
Federal land bank associations . . . _ _Production credit associationsBanks for cooperatives _ _ .Rural credit unionsRural electric cooperatives _ _ _ _Rural Electrification Administration telephone cooperatives _.Rural health cooperatives.- _ _Farmers' mutual fire insurance companiesMutual irrigation companies _ _ _Dairy herd improvement associations _ _ _ _ _ _Dairy cattle artificial breeding associations
Number ofassociations
9,716
6 1023,381
233
83149413
550908210
191,6259,3741,509
47
Number ofmembers orparticipants(thousands) 2
7,485
3,8783,543
64
374508
3,650150
4,42040566
3,00013841
636
i Data apply to dates ranging from 1957 to 1960, except that mutual irrigation company data are for 1950.3 Estimated.Source: Department of Agriculture.
Provisions of Federal law have long granted farmer cooperatives certainexemptions from the Federal corporate income tax. Under legislation en-acted in 1951, the exemptions were narrowed and tightened. To qualify, a
576899 O—61- 101
Digitized for FRASER http://fraser.stlouisfed.org/ Federal Reserve Bank of St. Louis

cooperative must be farmer owned and controlled, must do virtually all ofits business with farmers and a major part with members, and must meetseveral other criteria. About 60 percent of all cooperatives currently electto take advantage of the right to exemption.
In 1957-58, the 9,700 marketing, farm supply, and service cooperativesdid an aggregate business volume of $10.7 billion, exclusive of intercoopera-tive sales (Table B-13). The average volume of a little over $1 million
TABLE B-13.—Net business volume of farmer cooperative associations engaged in marketing,farm supply, and related services, 7957-58
Item
Total business _ . _ _ _
Products marketed for patrons
Dairy products _ .Grain, soybeans, soybean meal and oillivestock and poultryFruits and vegetables __ _ _ ._ __Cotton and cotton productsAll other products
Supplies purchased for patrons
FeedFertilizerSeedPetroleum products . . _ _Building materials.. . __All other
Receipts for services
Farmer cooperativeassociations 1
Number
9,716
6,855
1,7712,692
(2)759613
(2)
7,339
4,5234,2223,8202,7841,498
(2)
5, 465
Net business(millions of
dollars)
10, 693
8,261
2,9131,6781,644
787413826
2,185
80828396
55276
370
247
1 Preliminary data as developed by Farmer Cooperative Service.2 Not available.NOTE.—Detail does not add to totals because individual cooperatives may perform multiple services.
Source: Department of Agriculture.
per cooperative, however, masks the diversity in size and scope of individualassociations; whereas some are small and localized, others are large nation-wide federations. It is estimated that for each of more than 80 percent ofall cooperatives the. annual business volume is less than $1 million. Yet foreach of about 100 cooperatives the annual business exceeds $20 million.A number of the larger cooperatives have resulted from mergers andconsolidations. Many regional or national federations of cooperatives alsohave been established.
Recently, farmers have turned to cooperative action as a means of fore-stalling loss of management control of their farming through vertical integra-tion. Vertical integration has increased in some sectors of agriculture, sucha? the production of commercial broilers.
102
Digitized for FRASER http://fraser.stlouisfed.org/ Federal Reserve Bank of St. Louis

Farmers have also found cooperatives helpful in connection with theadoption of marketing agreements under agricultural price support legisla-tion and the operations authorized by them.
As of January 1, I960, farmers had slightly over $4 billion invested inmarketing, farm supply, telephone, irrigation, insurance, and rural electriccooperatives, cooperative production credit associations, and the Federalland bank system.
ADJUSTMENT OF FARM PRODUCTION THROUGH THE CONSERVATIONRESERVE PROGRAM
Programs of the Federal Government to support prices of farm productsare of significance chiefly to commercial farmers. Small farmers benefit fromthem only in proportion to the volume of produce they have to sell, whichinvariably is small.
Price-support programs have been accompanied by an accumulation ofhuge stocks of wheat and corn and smaller quantities of cotton, small feedgrains, tobacco, and other commodities by the Federal Government, despiteaggressive efforts to make food available in distribution programs at homeand in both distribution and sales programs abroad. In an effort to relievethe condition resulting from surpluses and the accumulation of stocks, SoilBank programs were introduced beginning in 1956. About 12.2 millionacres of cropland were placed in the Acreage Reserve of that year. Partici-pation increased to 21 million in 1957, then declined to 17 million in 1958,the final year of the program (Table B-14).
The Acreage Reserve applied only tp crops subject to acreage allotments,and only those farmers who complied with allotments were eligible to par-ticipate. The Conservation Reserve was originally a supplement to theAcreage Reserve, and later supplanted it. The Conservation Reserve isnot confined to allotment crops; all cropland is eligible. In recent yearsemphasis has been placed on obtaining participation by entire farms. Theleased land must be protected by adequate conservation practices, for whichcost-sharing payments are made available under specified conditions.Participation increased to 28.7 million acres on 306,000 farms in 1960.The average rental per acre was $11.85. Obligations for payments forboth rental and cost-sharing practices were $368 million in 1960.
Since the Congress did not authorize any further increase, the Conserva-tion Reserve in 1961 will be confined to land already under contract. Be-cause only about 100,000 acres of contracts are due to expire, 28.6 millionacres will remain under Reserve. In the absence of new authority, theReserve acreage would decline slowly until 1963, and more rapidly thereafter(Table B-15).
103
Digitized for FRASER http://fraser.stlouisfed.org/ Federal Reserve Bank of St. Louis

In 1960 a total of 17 million acres of land that would otherwise havegrown wheat, corn, and small feed grains were removed from productionby the Conservation Reserve contracts. This amounted to only 9 percentof the combined acreage of the three crops. Since the quality of land
TABLE B—14.—Acreage Reserve and Conservation Reserve Programs, 1956-60
Item
Number of contracts
Cropland acreage in the reserve
Whole farmsPart fanrs _
Cropland acreage idled: 2
WheatCornSmall feed grainsRiceCotton.TobaccoAll other crops 4
Obligated payments ._ ..
RentalCost-sharing in conservation
practices s
Acreage ReserveProgram
1956 1957 1958
548 914 1,049
Conservation Reserve Program
1956
Thou
—1957 1958 1959 196T.
sands
80 126 246 306
Millions of acres
12.2
12.2
5.75.3
(')1.1
(')
21.4
21.4
12.85.2
.23.0.1
17.2
17.2
5.36.7
.24.9.1
1.4
M0)
0)C1)0)0)0)0)C1)
6.4
5.31.1
.5
.93.5
(')
(')'1.7
9.9
7.52.4
.81.55.0
(').2
(3)2.8
22.4
14.87.6
2.33.57.9
(3).5
(^8.7
28.7
20.48.3
3.24.69.4
(3)
c > ' 711.4
Millions of dollars
260
260
614
614
696
696
23
12
11
100
57
43
118
87
31
360
259
101
368
339
29
1 Not available.* Acreage of crop allotments idled under Acreage Reserve: estimated acreage under Conservation Reserve.
Total acreage for Conservation Reserve exceeds Reserve acreage due to double-cropping and other multipleuses.
3 Less than 50,000 acres.4 Includes acreage that had intermittently been idle, fallow, or a failure.8 Payments obligated for any year will be distributed during several years.Source: Department of Agriculture.
TABLE B—15.—Conservation Reserve Program acreage under contracts Jor future years, 1961-4)9
Year
19611962 - . . .19631964
1965196619671968 - -'969
Acreage(millionsof acres)
28.626.425.217.6
14.013.411.510.13 6
NOTE. —Data are for contracts in force December 31,1960.
Source: Department of Agriculture.
104
Digitized for FRASER http://fraser.stlouisfed.org/ Federal Reserve Bank of St. Louis
under Conservation Reserve lease was somewhat below average, the actualadjustment achieved in output was less than 9 percent.
CHANGES IN LOW-INCOME FARMS
On the 1.6 million small farms reported in the 1959 Census (Table B-9),the income earned from farming alone is low by any standard. Personsliving on those farms can be divided into three groups: (1) those of work-ing age who receive an income from nonfarm sources that is satisfactory,either of itself or when combined with the net income earned on the farm;(2) those past working age whose income status depends in large measureon retirement income available to them, derived from social security,private retirement plans, or private investments; and (3) those of workingage who depend principally for their income on the operation of units withvery small economic resources.
This third group faces more serious economic problems than do theother two, and from the standpoint of the national economy it representsa pool of human resources that is partially wasted. This group is a prin-cipal focus of the Rural Development Program. Since 1955 that programhas coordinated and directed the efforts of various departments and agenciesof the Federal Government, in cooperation with State and local organiza-tions, toward rural betterment. In addition to five departments of theFederal Government, the Small Business Administration has been par-ticularly active in assisting development of low-income areas.
The primary objective of the Rural Development Program is to build uplocal economic resources of low-income areas and to provide job oppor-tunities for rural people. In some low-income areas where local resourcesare inadequate or have not been developed sufficiently to alleviate seriousunderemployment or unemployment, regional decreases in population aretaking place. The 1960 Census of Population shows that within the na-tional pattern of geographic shifts in distribution of the population, resultingprimarily from internal migration, a number of localities previously desig-nated as low income have increased their population in the last decade,some at more than the national average rate, others at less than the nationalrate. Usually these increases reflected new opportunities that developedfor local employment. In other low-income localities the resident popu-lation remained constant or declined.
The Atlantic Coast and Piedmont regions were the main ones with above-average population gains. There, vigorous industrial development or ex-panded military installations contributed to growing local employment.Regions in which the population decreased were primarily those of theupper Appalachian and the South Central areas extending from easternOklahoma and Texas to Mississippi.
The decade of the 1950's lowered, in general, the population density inthe rural low-income areas relative to the rest of the country. As indicatedby Table B-16, the total population of the Nation increased by 18.4 per-
105
Digitized for FRASER http://fraser.stlouisfed.org/ Federal Reserve Bank of St. Louis

TABLE B—16.— Total population and population in low-income farming areas, 1950 and 1960
Area classification
Total population. _ _
Low-income farming areas 3
By income:
Moderately low-incomeSubstantially low -income - .Seriously low-income
By location:
Appalachian Mountain and borderareas
Southern Piedmont and CoastalPlains
Southeastern Hilly areasMississippi DeltaSandv Coastal Plains *Ozark-Ouachita Mountains and border.Northern Lake StatesNorthwestern New MexicoCascade and Rocky Mountain areas. _
Population 1
Total
1950 1960
Nonmetropol itan
1950 1960
Millions of persons
150.7
34.8
12.38.4
14.2
12.1
9.63.42.32.21.91.8.3
1.0
178.5
36.6
13.19.2
14.4
12.1
11.13.42.42.11.92.0.5
1.2
66.2
29.8
10.77.1
11.9
9.7
8.13.22.22.21.71.4.3
1.0
72.6
30.7
11.37.6
11.8
9.5
9.03.12.22.11.61.6.5
1.2
Percentage change1950 to 1960 2
Total
18.4
5.2
6.110.21.3
-.5
15.2-.63.7
-6.3-2.1
9.958.116.7
Non-metro-politan
9.7
3.2
5.67.3
-1.3
-1.9
11.8-3.0
1.8-6.3-5.0
8.458.116.7
1 As of April 1.2 Based on actual number of persons.3 For description of areas, see Development of Agriculture's Human Resources—A Report on Problems
of Low-Income Farmers, House Document No. 149, 84th Congress, 1st Session.4 Plains of Arkansas, Louisiana, Oklahoma, and Texas.
NOTE.—Detail will not necessarily add to totals because of rounding.
Sources: Department of Commerce and Department of Agriculture.
cent from 1950 to I960, while the increase in the low-income farming areaswas only 5.2 percent. In the areas with serious social and economic prob-lems, the increase was a mere 1.3 percent. The nonmetropolitan popu-lation of the Nation as a whole increased by 9.7 percent, but in all low-income farm areas it increased only 3.2 percent. In the serious problemareas, the nonmetropolitan population actually decreased by 1.3 percent.Data in Table B-16 are broad totals developed for areas as described ina special report prepared for the 84th Congress, published in 1955.
Of the low-income areas for which data are presented in Table B-16,only one, that surrounding the fast-growing city of Albuquerque, had atotal population growth during the 1950's that exceeded the national averagerate.
While notable improvement made it possible for a number of areas toretain their local population during the 1950-60 period of high level per-formance of the economy, there is still a problem of underemployment inmany areas, i.e., an excessive potential supply of labor and a need for moreopportunities for employment, particularly off the farm.
106
Digitized for FRASER http://fraser.stlouisfed.org/ Federal Reserve Bank of St. Louis

HI. United States Foreign Trade and Payments
In I960, the United States merchandise trade position improved sub-stantially. This improvement, however, was largely offset by increasedoutflows of short-term capital, mainly in response to more attractive interestrates abroad. The over-all balance of payments thus showed a sizabledeficit for the third consecutive year. As the capital outflow acceleratedduring the year, the over-all deficit in the balance of payments increasedfrom a seasonally adjusted annual rate of $2.6 billion in the last quarterof 1959 to a rate of $4.1 billion in the third quarter of 1960 (Table B-17).
In the closing months of the year, the deficit—omitting one large trans-fer of private capital for direct investment abroad—appears, on the basisof incomplete data, to have diminished somewhat. The surplus on goodsand services rose further. The outflows of liquid capital, which were
TABLE B-17.—United States balance of payments, 1959-60
[Billions of dollars, seasonally adjusted annual rates]
Payment or receipt
United States payments 2
Merchandise importsServices and military expendituresRemittances and pensions ._ - _ _ ..Government grants and related capital
outflowsUnited States private and other Govern-
ment capital out flows
United States receipts 2~-
Merchandise exportsServices and military transactions -Repayments on U.S. Government loans. .Foreign long-term investments in United
State*'
Errors and omissions, net receipts or pay-ments ( — )
Total (balanced by decline in United Statesgold holdings and increase in recorded liquidliabilities)
19o9
Firstquarter
28.1
14.48.1.7
2.5
2.4
23.9
15 37.11.2
.3
. f i
-3.6
Secondquarter
30.1
15.78.1.8
2.4
•3.1
24.1
15.87.0.6
.8
1.4
•-4.6
Thirdquarter
30.1
15.88.3.8
2.5
2.6
25.8
17.37.3.6
.6
-4.5
Fourthquarter
30.2
15.48.4.8
2.5
3.2
26.2
16.57.51.7
.5
1.4
-2.6
1960
Firstquarter
29.8
15.28,6.8
2.5
2.8
27.3
18.47.5.7
-.1.
-2.6
Secondquarter
30.7
15.48.7.9
3.0
2.7
28.4
19.57.7.6
.6
-.6
-2.8
Thirdquarter1
31.5
14.98.7
fi
2.5
4.6
28.5
20.07.8.7
(4)
-1.1
-4.1
1 Preliminary.1 Preliminary.2 Transfers of military aid are excluded both from exports and from grants.3 Excludes $1,375 million for increase in United States subscription to the Intern4 Less than $50 trillion.
NOTE.— Detail will not necessarily add to totals because of rounding.
Source: Department of Commerce.
ational Monetary Fund.
107
Digitized for FRASER http://fraser.stlouisfed.org/ Federal Reserve Bank of St. Louis
still large in October, the time of the speculative flurry on the Londongold market, seem to have fallen off following the reductions in short-termrates in several European countries and the announcement of variousmeasures to reduce the payments deficit which confirmed United Statesdetermination to defend the dollar.
The increase in the over-all deficit in the balance of payments in thesecond half of the year was accompanied by a rise in foreign acquisi-tions of gold from the United States. The drop in the United States goldstock during 1960 amounted to $1.7 billion, against $2.3 billion in 1958and $1.1 billion in 1959. The 1960 reduction was moderated, as was thatof 1959, by the sale of $300 million of gold to the United States by theInternational Monetary Fund, designed to enlarge the income earningassets of the Fund. Despite its decrease during the year, the United Statesgold stock of $17% billion at the end of 1960 was almost one-half of thetotal held by all countries of the free world.
IMPROVEMENT IN CURRENT ACCOUNT SURPLUS
The surplus of United States transactions on goods and services improvedsteadily throughout 1960. By the third quarter it reached a seasonallyadjusted annual rate of over $4 billion, a shift of more than $5 billionfrom the sizable deficit recorded in the second quarter of 1959. Theimprovement occurred chiefly in the merchandise trade account; thecombined movement in service transactions remained small. Among theservice receipts, income on investments increased for the second consecutiveyear, following a small decrease in 1958. On the payments side, militaryexpenditures abroad, which had already fallen somewhat in 1959, declinedslightly, although they still were at an annual rate of about $3 billion.Payments on transportation and travel, however, continued to rise rapidly.
The merchandise trade surplus rose to a seasonally adjusted annual rateof more than $5 billion by the third quarter of 1960. Except during the1956-57 period of the Suez crisis, the surplus had not been so large sincethe early postwar years, when Marshall Plan aid swelled exports. For 1960as a whole, it probably exceeded $4.5 billion, far above the $0.9 billionof 1959.
Exports made the largest contribution to the improvement in the tradesurplus. From an annual rate of $15.3 billion in the first quarter of 1959they rose to an annual rate of $20.0 billion in the third quarter of 1960,and continued at a high rate in the fourth quarter. A higher export levelhad been achieved only in the Suez-crisis months of early 1957, when fuelexports were at a record annual rate, about $1.5 billion above that for 1960.The near record rate of exports in the second half of 1960, moreover, wasachieved despite weakness in two of our major export markets, Canadaand Latin America.
The year's upsurge in exports covered a broad range of commodities, butthe sharpest increases, on the whole, were recorded by a variety of crude
108
Digitized for FRASER http://fraser.stlouisfed.org/ Federal Reserve Bank of St. Louis

and semimanufactured materials (Table B-18). Coal was an exception,as import restrictions on coal continued to prevail in several countries ofWestern Europe. The advance in total exports was the result of a com-bination of circumstances: the boom in business activity in most industrialcountries outside of North America; the removal of many foreign importrestrictions on United States goods; an increase in sales of surplus farmproducts for foreign currencies; and, finally, some improvement in ourcompetitive position in world markets.
TABLE B-18.—United States merchandise exports, 1956-60
[Millions of dollars]
Commodity
Total exports, excluding "special category"
FoodstuffsGrains a n d preparations _ _ _ _ _ _ _ _ . _ _ _ . _ . _ _
Coal a n d related products _ _ _ _ _ _ _ _ _ _Petroleum and products
Cotton, unmanufacturedOilseeds and crude \7egetable oils
Rubber and manufacturesWood, paper, and products
Textile semi- and finished manufactures
Iron and steel-making raw materialsIron and steel-mill products _ _ _ _ - _ _Xonferrous metals
AluminumCopper and copper-base alloys _ . ___ _ _ _ _
MachineryIndustrial machinery _ _ - _ _ _ _ . _ _Tractors, parts, and accessories
Automobiles, parts, and accessories _ -Passenger cars and chassis, new
Aircraft and engines
Chemicals
All other, including reexports.. __
1956
16, 901
2,4231,342
746652
729305
276446
630
362762407
47276
3,5802,152
390
1,359334
184
1,239
2,802
1957
18, 868
2,3251,370
846872
1,059374
300482
667
432993440
46304
4,0052.502
380
1,309301
267
1,379
3,118
1958
15, 823
2,2231,297
534462
661270
278450
600
138' 563
34147
230
3,6822,269
311
1,087260
217
1,343
2,975
January-October
1959 1960
Annual rates
15, 502
2,3861,418
397406
342377
319499
611
184390280
67137
3,6612,198
366
1,146221
133
1,460
2,911
18, 550
2,5861,618
371434
906428
382612
694
306632691175376
4.0362,465
394
1,207215
570
1, 672
3,023
NOTE.—Detail will not necessarily add to totals because of rounding.
Source: Department of Commerce.
In addition, increases from 1959 to 1960 in exports of four major cate-gories of commodities reflected special circumstances that had depressedexports in 1959. Exports of raw cotton in 1960 were substantially largerthan in 1959, when foreign purchasers awaited an increase in the UnitedStates Government export subsidy and a consequent lowering of price.However, the heavy volume of cotton exports in 1960 also reflected theboom abroad. Similarly, aircraft shipments, which had dropped in 1959as deliveries of piston aircraft fell and production of jet aircraft was not
109
Digitized for FRASER http://fraser.stlouisfed.org/ Federal Reserve Bank of St. Louis

fully under way, mounted rapidly in 1960 as a result of an unusual backlogof orders for jet aircraft. In 1959, domestic stockpiling in anticipation ofstrikes in the steel and copper industries, and small output during the strikes,reduced supplies of those products available for export that year; in I960,shipments were at a more normal level. The increase in steel and copperexports in 1960 also reflected the high economic activity in Western Europeand Japan, although these exports fell off somewhat after the third quarter,with the easing in demand pressures in some of these countries. In addition,the rise in copper exports in 1960 was in part a byproduct of the uncertaintiessurrounding supplies from African and Latin American sources.
The impact which the business upswing abroad had on United Statesexports in 1960 can be gauged by the geographical distribution of theyear's export gains: three areas of the world experiencing the most pro-nounced industrial boom—Western Europe, Japan, and Australia—whichtook somewhat more than one-third of our exports in 1959 were responsiblefor over four-fifths of the rise in exports in the first 10 months of the year.On the other hand, exports to two of our other major markets—Canadaand Latin America—which in 1959 absorbed almost one-half of our exports,
TABLE B-19.—United States merchandise imports, 1956-60
[Millions of dollars]
Commodity
Tntal imports for r/vn sumption
Food:Meat productsCoffee - - . ---SugarOther food - - _ .. . . ...
Crude rubber 2 - - - -.. -Wool, unmanufactured _Sawmill productsNewsprint - -Petroleum and productsIron and steel-mill products 'Nonferrous ores and metals. -
Copper
Textile semi- and finished manufacturesMachinery - -
ElectricalIndustrial 4
Automobiles, except trucks, new. . - - , _ . _ . ._Chemicals and related products
All other
1956
12, 516
1461,439
4371,182
398243306688
1,286212
1,439502
648355100139
127274
3,337
1957
12, 951
1841,376
4591,274
349211243657
1,548212
1,347384
635424144152
302276
3,453
1958
1 12, 786
3371,172
5231,427
248165264614
1,636230
1,024249
637472167130
489282
3,301
January-October
1959 1960
Annual rates
14, 753
4061,091
5421,400
373233346648
1,517517
1,082254
827636228169
725344
4,066
14, 782
3371,015
5241,424
334208322678
1,501539
1,165407
955707258215
554359
4,159
1 Excludes $34 million which Is included in commodity data.2 Includes latex.* Excludes pig iron and scrap.4 Excludes office appliances and printing machinery.NOTE.—Detail will not necessarily add to totals because of rounding.Source: Department of Commerce.
110
Digitized for FRASER http://fraser.stlouisfed.org/ Federal Reserve Bank of St. Louis
declined slightly. Sales to Canada had expanded quite rapidly in 1958-59,but began to fall early in I960, reflecting the dip in economic activity there.The small decline in total sales to Latin America in I960, compared with1959, was due to sharp drops in shipments to Cuba and Venezuela, causedby the political and foreign exchange crises in those two countries. Exportsto most of the 18 other Latin American countries rose in 1960.
Changes on the import side of the trade accounts were less marked thanthose ori the export side. Merchandise imports edged down from late1959 and in the third quarter of 1960 were at an annual rate (seasonallyadjusted) of just below $15 billion, nearly $1 billion less than a year earlier.All major economic categories accounted for this decrease. In the closingmonths of the year, total merchandise imports declined further. The year'sslight change in the import total was the result of generally small changes,upward and downward, in the various import categories (Table B-19).Special nonrecurring factors worked in both directions. Imports of meatdeclined as domestic supplies of beef increased from the rather low levelsobtaining in 1958 and 1959. On the other hand, the steel and copperstrikes led to a temporary rise in imports of these commodities in the firstpart of the year. Changes in other import categories reflected the easingof domestic demand (declines in imports of some materials), the weaknessof primary commodity prices (e.g., coffee and wool), and the shifting com-petitive position of manufactures (e.g., increases in imports of textile manu-factures and the decline in automobile imports), which is discussed below.
SHARP INCREASE IN CAPITAL OUTFLOWS
The divergence between cyclical developments in most foreign industrialcountries and in the United States, which contributed to the improvementin the United States trade position in 1960, also contributed to the sizablecapital outflows that increased both the deficit in the over-all balance ofpayments and the drain on the United States gold stock. Some of thismovement of capital reflected the attractiveness in 1960 of stock marketinvestments in a number of Western European countries, compared withthe United States. The greater part of it, however, appears to haveresulted from the enlarged margin by which interest rates abroad, particu-larly in the short-term area, exceeded those in this country, and some ofit was probably caused by increased international political and economictensions.
The combined total of net outflows of Government loans and grants, ofpensions and remittances, and of United States private long-term invest-ment, on the other hand, changed little between the first three quarters of1959 and of 1960. While the net outflow of Government loans and grantsincreased somewhat—because of smaller repayments (including repaymentsahead of schedule) on United States Government loans, the $80 millionsubscription to the new Inter-American Development Bank, and largeracquisitions of foreign currencies as payment for United States Govern-
I I I
Digitized for FRASER http://fraser.stlouisfed.org/ Federal Reserve Bank of St. Louis

ment sales of surplus agricultural commodities—the net recorded outflowof private long-term United States capital declined slightly.
The outflow of liquid capital funds gathered force slowly in 1960; inthe third quarter, however, it reached sizable proportions as interest ratesdeclined and monetary conditions eased further in the United States, whileinterest rate increases and monetary tightening abroad continued. Large-scale movements of liquid funds between international money centers inresponse to interest-rate changes have taken place in other recent years;but owing to a combination of circumstances resulting mainly from theeconomic recovery of industrial countries outside North America, this latestmovement was much greater. The revived strength of Europe's majorcurrencies, capped with the establishment of convertibility at the close of1958, made it possible for private European holders in 1959 greatly toincrease their short-term dollar assets. Monetary tightening in Europe andeasing in the United States in 1960 then led to the repatriation of sizableamounts of these funds. At the same time, fear of a possible weakness ofEurope's currencies and of an inability to repatriate funds because of foreignrestrictions disappeared as a deterrent to United States corporations andother investors interested in taking advantage of higher interest rates abroad.Moreover, United States corporations, having become accustomed to invest-ing temporarily surplus funds in United States Treasury bills and other mar-ketable instruments, rather than just in bank deposits, had less hesitationthan previously in purchasing higher-yielding foreign Treasury bills.
The resulting outflow of United States private capital in the second andthird quarters of 1960 was considerably larger than in the first half of1958, when interest-rate differentials also favored investment abroad butwhen the general climate was less favorable to such capital movements.However, in the recent period, the capital that moved was primarily of ashort-term type. In 1958 there had been a relatively large outflow offunds resulting from the flotation in the United States of new bond issuesof foreign and international borrowers. In 1960, this type of outflow wasmuch smaller. Both the International Bank for Reconstruction and De-velopment and various Canadian corporations, provinces, and municipali-ties, which in 1958 borrowed heavily in the United States, had less need toobtain funds in this country. More important perhaps, long-term UnitedStates interest rates did not decline in 1960 to the levels reached in early1958. In addition, purchases of outstanding foreign bonds by United Statesinvestors in 1960 were probably motivated not only by considerations of yieldbut also by the expectation of capital gains, since long-term interest ratesabroad were thought to be headed down again.
Another difference between 1960 and the earlier period—also relatedto reductions of fears about leading foreign currencies—appears to havebeen the relative importance attained by so-called uncovered movements offunds. Investors interested in taking advantage of higher short-term yieldsabroad can cover themselves, at the time they make the investment, from
112
Digitized for FRASER http://fraser.stlouisfed.org/ Federal Reserve Bank of St. Louis
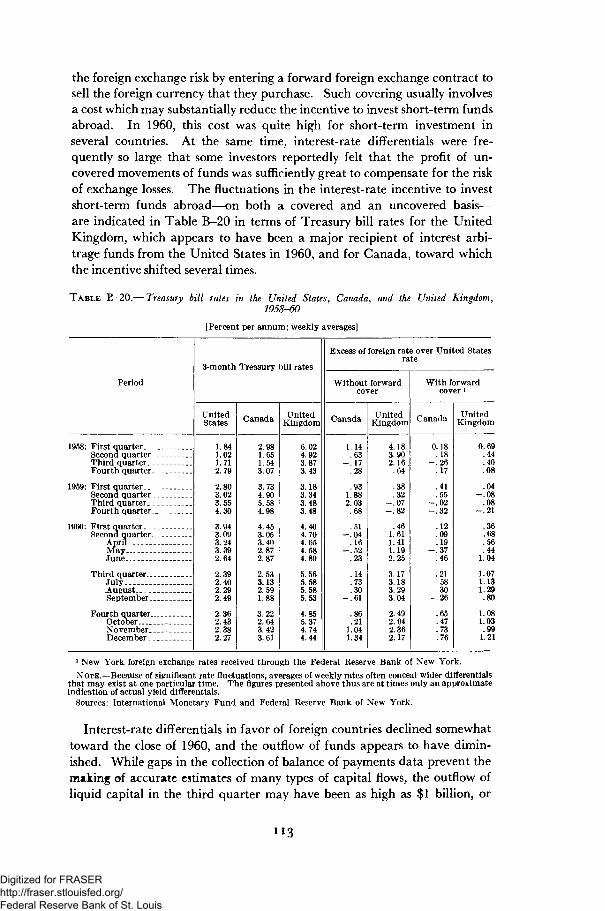
the foreign exchange risk by entering a forward foreign exchange contract tosell the foreign currency that they purchase. Such covering usually involvesa cost which may substantially reduce the incentive to invest short-term fundsabroad. In I960, this cost was quite high for short-term investment inseveral countries. At the same time, interest-rate differentials were fre-quently so large that some investors reportedly felt that the profit of un-covered movements of funds was sufficiently great to compensate for the riskof exchange losses. The fluctuations in the interest-rate incentive to investshort-term funds abroad—on both a covered and an uncovered basis—are indicated in Table B-20 in terms of Treasury bill rates for the UnitedKingdom, which appears to have been a major recipient of interest arbi-trage funds from the United States in I960, and for Canada, toward whichthe incentive shifted several times.
TABLE E-20.— Treasury bill rates in the United States, Canada, and the United Kingdom,1958-60
[Percent per annum; weekly averages]
Period
1958: First quarterSecond quarterThird quarterFourth quarter.
1959: First quarter .Second quarterThird quarter _ _Fourth quarter _ _
1960: First quarterSecond quarter. .._
AprilMavJune _
Third quarterJulyAugust- -_ _.September
Fourth quarterOctoberNovemberDecember.
3-month Treasury bill rates
UnitedStates
1.841.021.712.79
2.803.023.554.30
3.943.093.243.392.64
2.392.402.292.49
2.362.432.382.27
Canada
2.981.651.543.07
3.734.905.584.98
4.453.053.402.872.87
2.533.132.591.88
3.222.643.423.61
UnitedKingdom
6.024.923.873.43
3.183.343.483.48
4.404.704.654.584.89
5.565.585.585.53
4.855.374.744.44
Excess of foreign rate over United Statesrate
Without forwardcover
Canada
1.14.63
-.17.28
.931.882.03.68
.51-.04
.16-.52
.23
.14
.73
.30-.61
.86
.211.041.34
UnitedKingdom
4.183.902.16..64
.38
.32-.07-.82
.461.611.411.192.25
3.173.183.293.04
2.492.942.362.17
With forwardcover !
Canada
0.18.18
-.26.17
.41
.55-.02-.32
.12
.09
.19-.37
.46
.21
.58
.30-.26
.65
.47
.73
.76
UnitedKingdom
0.69.44.40.08
.04-.08
.08-.21
.36
.68
.56
.441.04
1.071.131.29.80
1.081.03.99
1.21
1 New York foreign exchange rates received through the Federal Reserve Bank of New York.
NOTE.—Because of significant rate fluctuations, averages of weekly rates often conceal wider differentialsthat may exist at one particular time. The figures presented above thus are at times only an approximateindication of actual yield differentials.
Sources: International Monetary Fund and Federal Reserve Bank of New York.
Interest-rate differentials in favor of foreign countries declined somewhattoward the close of I960, and the outflow of funds appears to have dimin-ished. While gaps in the collection of balance of payments data prevent themaking of accurate estimates of many types of capital flows, the outflow ofliquid capital in the third quarter may have been as high as $1 billion, or
Digitized for FRASER http://fraser.stlouisfed.org/ Federal Reserve Bank of St. Louis

only slightly less than the over-all payments deficit in that quarter. Someof this outflow probably was recorded in the payments category of directinvestments in Europe, the amount of which almost doubled between thesecond and third quarters of 1960. There are indications that this reflectedin part increased short-term investments abroad by foreign affiliates ofdomestic corporations. A sizable part of the liquid capital outflow wasnot recorded as such because of deficiencies in the available data, but itappears in the balance of payments as "unrecorded transactions." In thethird quarter of 1960, there was an outflow of almost $300 million in thesetransactions, compared with an average quarterly inflow of $150 millionduring the preceding five years. A large part of these unrecorded move-ments probably occurred in response to interest-rate differentials, and mayinclude unrecorded shifts due to leads -and lags in commercial payments.
It is noteworthy that, under the definition of the United States over-allbalance of payments deficit, increases in our liquid liabilities to both privateand official foreign holders enlarge the deficit, but increases in our liquidclaims on foreigners do not reduce it; that is, outflows of short-term UnitedStates funds increase the payments deficit, even though they are matchedby an increase in United States liquid assets. Since these assets are privatelyowned and are not necessarily available to meet the country's internationalobligations, they are not considered the equivalent of gold. Our liquidliabilities, on the other hand, are potentially, at least, alternatives to goldas a form in which foreign countries can keep their international assets;therefore, in measuring the United States deficit, their changes are includedwith changes in the United States gold stock.
It should also be pointed out that the recent large outflow under unre-corded transactions exaggerated the apparent size of the over-all paymentsdeficit to the extent that the funds in question were foreign-owned short-termfunds. If these funds had been recorded at the point in the past when theymoved into the United States, they would have increased the recordeddeficit at that time, instead of enlarging recorded receipts; their subsequentrepatriation would have been registered merely as a shift in foreign owner-ship, mainly from private to official hands. This is, of course, what occurredin the case of recorded repatriation of short-term foreign funds. This re-patriation did not affect the size of the total deficit, but added to officialdollar balances and thereby enlarged the demand for United States gold.
UNITED STATES PAYMENTS IN LONGER PERSPECTIVE
Beginning in 1950, the United States balance of payments has been indeficit every year except 1957. In each of the last three years, moreover,the deficit was more than twice the average of the preceding seven deficityears. Initially, the deficit was related to United States efforts to speed therecovery of the war-shattered economies of the free world, and to helpthese countries rebuild their reserves. In the last few years, however, thecontinuation of a deficit on such a large scale could no longer be explainedon those grounds.
114
Digitized for FRASER http://fraser.stlouisfed.org/ Federal Reserve Bank of St. Louis
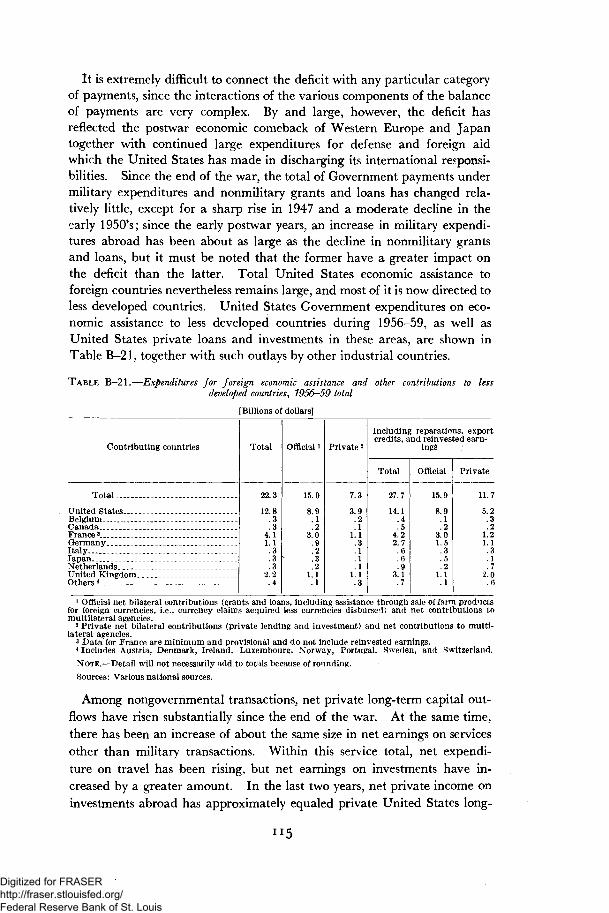
It is extremely difficult to connect the deficit with any particular categoryof payments, since the interactions of the various components of the balanceof payments are very complex. By and large, however, the deficit hasreflected the postwar economic comeback of Western Europe and Japantogether with continued large expenditures for defense and foreign aidwhich the United States has made in discharging its international responsi-bilities. Since the end of the war, the total of Government payments undermilitary expenditures and nonmilitary grants and loans has changed rela-tively little, except for a sharp rise in 1947 and a moderate decline in theearly 1950's; since the early postwar years, an increase in military expendi-tures abroad has been about as large as the decline in nonmilitary grantsand loans, but it must be noted that the former have a greater impact onthe deficit than the latter. Total United States economic assistance toforeign countries nevertheless remains large, and most of it is now directed toless developed countries. United States Government expenditures on eco-nomic assistance to less developed countries during 1956-59, as well asUnited States private loans and investments in these areas, are shown inTable B-21, together with such outlays by other industrial countries.
TABLE B-21.—Expenditures for foreign economic assistance and other contributions to lessdeveloped countries, 1956—59 total
[Billions of dollars]
Contributing countries
Total
United StatesBelgiumCanada-France3
GermanyItalyJapan. -NetherlandsUnited KingdomOthers 4
Total
22.3
12.8.3.3
4.11.1.3.3.3
2.2.4
Official i
15.0
8.9.1.2
3.0.9.2.3.2
1.1.1
Private 2
7.3
3.9.2.1
1.1.3.1.1.1
1.1.3
Including reparations, exportcredits, and reinvested earn-
ings
Total
27.7
14.1.4.5
4.22.7.6.6.9
3.1.7
Official
15.9
8.9.1.2
3.01.5.3.5.2
1.1.1
Private
11.7
5.2.3.2
1.21.1.3.1. 7
2.0.6
1 Official net bilateral contributions (grants and loans, including assistance through sale of farm productsfor foreign currencies, i.e., currency claims acquired less currencies disbursed) and net contributions tomultilateral agencies.
2 Private net bilateral contributions (private lending and investment) and net contributions to multi-lateral agencies.
3 Data for France are minimum and provisional and do not include reinvested earnings.4 Includes Austria, Denmark, Ireland, Luxembourg. Norway, Portugal, Sweden, and Switzerland.NOTE.—Detail will not necessarily add to totals because of rounding.Sources: Various national sources.
Among nongovernmental transactions, net private long-term capital out-flows have risen substantially since the end of the war. At the same time,there has been an increase of about the same size in net earnings on servicesother than military transactions. Within this service total, net expendi-ture on travel has been rising, but net earnings on investments have in-creased by a greater amount. In the last two years, net private income oninvestments abroad has approximately equaled private United States long-
Digitized for FRASER http://fraser.stlouisfed.org/ Federal Reserve Bank of St. Louis

term investment abroad. The merchandise trade surplus has changed quitesharply from year to year during the postwar period, and the fluctuationsin the over-all payments balance have roughly paralleled these swings, ex-cept in 1956 and in the last two years when capital movements alsofluctuated sharply.
Although the increase in aggregate merchandise exports since the earlypostwar years has been uneven, the amount of the increase has been sub-stantial, The total of almost $19.5 billion estimated for 1960 compareswith an annual average of $13.3 billion in the first four postwar years whenexports were boosted by heavy relief and aid shipments. In the wholeperiod since the war, the advance in exports has been slower than the growthof GNP, but since the early 1950's exports have risen at about the same rateas GNP. In 1960, merchandise exports were equal to 3.9 percent of GNP,the same proportion as in 1950-52, but somewhat below the proportion of1956 and 1957.
Agricultural exports have increased somewhat less rapidly than aggre-gate exports since the war, but in 1960, when they were at an estimated $1billion above the 1946-49 average, they still accounted for almost one-fourthof the export total. Shipments aided by Government subsidy or Govern-ment financing, including sales for foreign currencies, continue to be asignificant part of total agricultural exports. In the fiscal year 1960, agri-cultural exports within the Public Law 480 and Mutual Security programs,under which the United States donates or exchanges farm products or sellsthem for local currencies which find only restricted use, amounted to $1.3billion, or 29 percent of total agricultural exports. Sales for dollars thatwere aided by export payments or similar programs, including Governmentloans, were another 29 percent of the total. It must not be forgotten,however, that United States agricultural exports still face stringent restrictions abroad.
Since the first postwar years, exports of finished manufactures haveexpanded by about the same rate as total exports, and those of industrialmaterials at a somewhat faster rate. In 1960, finished manufactures (ex-cluding Mutual Security program shipments) accounted for about 55 per-cent of United States nonmilitary exports, and industrial materials for about30 percent. Capital equipment and industrial supplies and materials,products that arc very sensitive to business fluctuations abroad, accountedfor more than 70 percent of total exports.
As was to be expected, the share of the United States in world exportsof manufactures has declined from the very high level in the first postwaryears. Since the economic recovery of Western Europe and Japan was amajor goal of United States postwar foreign economic and mutual securitypolicies, it was inevitable that, with the success of these policies, the coun-tries whose exports had suffered most by the war and its aftermath wouldimprove their position in world markets. Nevertheless, despite the per-sistence of some restrictions against our products, our share of worldexports of manufactures remains above prewar (Table B-22).
116
Digitized for FRASER http://fraser.stlouisfed.org/ Federal Reserve Bank of St. Louis
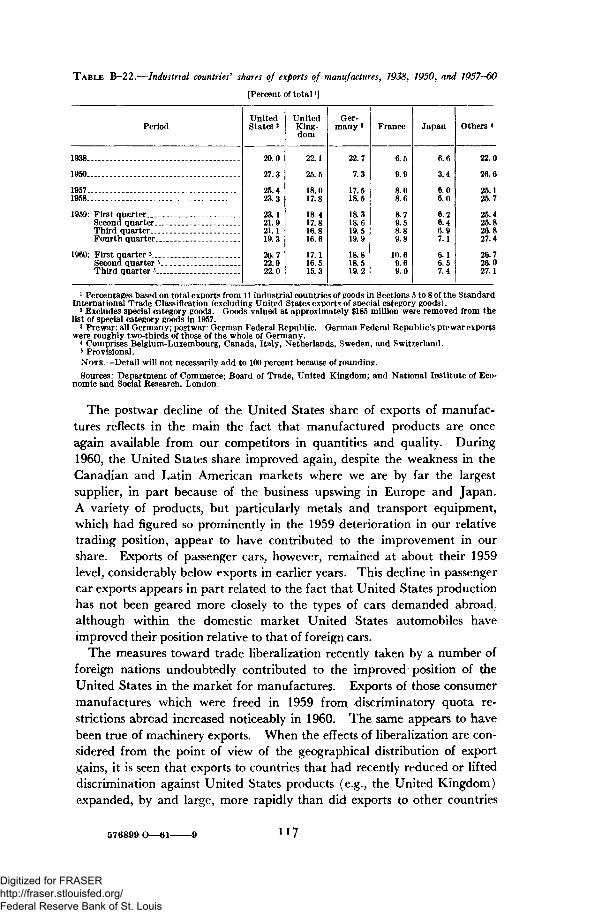
TABLE B-22.—Industrial countries'1 shares of exports of manufactures, 1938, 1950, and 1957-60
[Percent of total l]
Period
1938
1950
19571958
1959: First quarterSecond quarterThird quarterFourth quarter
1960: First quarter sSecond quarter 5Third quarter «
UnitedStates »
20.0
27.3
25 423.3
23 121.921.119.3
20.722.922.0
UnitedKing-dom
22.1
25 5
18 017.8
18 417.816.816 6
17.116.515.3
Ger-many8
22.7
7.3
17.518.5
18 318.619.519.9
18.818.519.2
France
6.5
9.9
8 08.6
8.79.58.89.8
10.69.69.0
Japan
6.6
3.4
6.06.0
6.26.46.97.1
6.16.57.4
Others «
22.0
26.6
25.125.7
25.425.826.827.4
26.726.027.1
1 Percentages based on total exports from 11 industrial countries of goods in Sections 5 to 8 of the StandardInternational Trade Classification (excluding United States exports of soecial category goods).
2 Excludes special category goods. Goods valued at approximately $185 million were removed from thelist of special category goods in 1957.
3 Prewar: all Germany; postwar: German Federal Republic. German Federal Republic's prewar exportswere roughly two-thirds of those of the whole of Germany.
* Comprises Belgium-Luxembourg, Canada, Italy, Netherlands, Sweden, and Switzerland.5 Provisional.NOTE.—Detail will not necessarily add to 100 percent because of rounding.
Sources: Department of Commerce; Board of Trade, United Kingdom; and National Institute of Eco-nomic and Social Research, London.
The postwar decline of the United States share of exports of manufac-tures reflects in the main the fact that manufactured products are onceagain available from our competitors in quantities and quality. DuringI960, the United States share improved again, despite the weakness in theCanadian and Latin American markets where we are by far the largestsupplier, in part because of the business upswing in Europe and Japan.A variety of products, but particularly metals and transport equipment,which had figured so prominently in the 1959 deterioration in our relativetrading position, appear to have contributed to the improvement in ourshare. Exports of passenger cars, however, remained at about their 1959level, considerably below exports in earlier years. This decline in passengercar exports appears in part related to the fact that United States productionhas not been geared more closely to the types of cars demanded abroad,although within the domestic market United States automobiles haveimproved their position relative to that of foreign cars.
The measures toward trade liberalization recently taken by a number offoreign nations undoubtedly contributed to the improved position of theUnited States in the market for manufactures. Exports of those consumermanufactures which were freed in 1959 from discriminatory quota re-strictions abroad increased noticeably in 1960. The same appears to havebeen true of machinery exports. When the effects of liberalization are con-sidered from the point of view of the geographical distribution of exportgains, it is seen that exports to countries that had recently reduced or lifteddiscrimination against United States products (e.g., the United Kingdom)expanded, by and large, more rapidly than did exports to other countries
576899 O—61- 117
Digitized for FRASER http://fraser.stlouisfed.org/ Federal Reserve Bank of St. Louis

which also experienced high economic activity but had liberalized dollarimports much earlier (e.g., the Netherlands).
Now that much progress has been made in dismantling quota restric-tions, with the principal exception of agricultural products, attention hasfocused on tariff barriers; in this regard United States manufacturesstill face relatively difficult obstacles in many countries abroad. For ex-ample, in 1960 the import duties on passenger cars in France were 29 per-cent, in Germany 13 percent, in Italy 32-41 percent, and in the UnitedKingdom 30 percent, compared with the tariff of only 8.5 percent in theUnited States.
The recent performance of United States exports to Western Europedeserves special attention. Between the first three-quarters of 1959 andthe first three-quarters of 1960, our shipments to that area increased bymore than 50 percent, against an increase of only 20 percent in the area'stotal imports. The 1960 upturn in United States exports to WesternEurope was more broadly based than the previous rise to a peak in early1957, at the time of the Suez crisis, as the commodity composition of salesto Europe indicates. Five commodities—raw cotton, steel scrap, iron andsteel-mill products, copper, and aircraft—exports of which have fluctuatedvery sharply in recent years, had accounted for more than 70 percent of therise between the first half of 1956 and of 1957 in exports to Europe (otherthan fuels, which were exceptionally large in 1957 and fell steeply there-after). In the 1959-60 movement, in contrast, these five commodities ac-counted for less than half of the increase (Table B-23). Other exports,excluding fuel, to Europe rose by 33 percent in the latter period, but by only7 percent in the earlier one.
Merchandise imports have increased at a higher rate than exports sincethe first postwar years. However, in relation to GNP, imports in 1960 re-
TABLE B-23.—United States merchandise exports to Western Europe, 1956-60
Commodity group
Total merchandise exports J
Excluding coal and petroleum . _Excluding coal, petroleum, and
selected commodities.-
Coal and petroleum
Selected commodities
Raw cottonSteel scrapIron and steel-mill productsCopper _Aircraft
January-June
1956 1957 1958 1959 1960
Millions of dollars
2,471
2,230
1,847
241
383
9969959129
3,270
2,704
1,980
566
724
3788484
11563
2,336
2,106
1,651
230
455
23537566958
2,110
1,957
1,774
153
183
734
356011
3,167
3,036
2,355
131
681
2643193
111182
Percentage change
1956 to1957
32
21
7
135
89
28222
-1226
117
1957 to1959
-35
-28
-10
-73
-75
-81-95-58-48'-83
1959 to1960
50
55
33
-14
272
26267516685
1,555
1 Excludes military aid and military sales.
NOTE.—Detail will not necessarily add to totals because of rounding.
Source: Department of Commerce.
118
Digitized for FRASER http://fraser.stlouisfed.org/ Federal Reserve Bank of St. Louis

mained below their prewar level (Table B-24). Since 1952, the ratio oftotal merchandise imports to GNP has held very close to 3 percent; in 1959,when the import ratio was 3.2 percent, total imports reflected very largeimports of automobiles and strike-induced imports of steel. Imports of SUP-
TABLE B—24.—Measures of demand for United States imports, selected years, 1929-60
[Percent]
Measure of demand
Imports of goods and services 2 as percent of grossnational product
Merchandise imports as percent of gross nationalproduct
Imports of foods and beverages as percent of personalexpenditures on food
Imports of nonfood consumer goods as percent ofdisposable income
Imports of industrial supplies and materials for pro-duction of nondurable goods 8 as percent of nondur-able goods output
Imports of industrial supplies and materials for pro-duction of durable goods as percent of durablegoods output
1929
5.6
4 3
4 8
.6
3.5
4.7
1937
4.6
3 5
3 8
4
1.9
4.9
1949
3.5
2 7
.2
1.0
3.0
1951
4.2
3 4
.3
1.8
3.6
1955
3.6
2 9
.4
1.0
3.2
1958
4.0
2 9
.5
.8
3.0
1959
4.2
3.2
4 3
.7
1.0
3.5
19601
4.1
3/0
4 0
.8
1.0
3.1
1 January-September.2 Excludes military expenditures.3 Excludes petroleum, newsprint, and paper base stocks.
Source: Department of Commerce.
plies and materials have shown a decline in relation to domestic output,compared with prewar years. Imports of finished manufactures, on theother hand, have increased in relation to domestic output and expenditureand to total imports; like the postwar reduction of the United States sharein exports, this was, in part, a natural outcome of the economic recoveryabroad and was facilitated by the lowering of United States tariffs underthe reciprocal trade agreement legislation, even though on some productsUnited States tariffs remain high, compared with foreign tariffs.
Imports of some foreign products—especially textile manufactures, rub-ber and leather goods, and various small electrical appliances—have con-tinued to increase particularly rapidly. But in international trade, as indomestic trade, comparative advantage continually shifts from one productand producer to others. For many products, there are increasing signsthat United States producers are successfully enlarging their efforts tohold domestic demand. The recent sharp drop in automobile imports(after mid-1960 these were running at one-half of the rate in comparablemonths of 1959), following the introduction of "compact" cars by UnitedStates manufacturers, is the most striking example.
In the domestic market, however, just as in the export field, United Statesindustries must continue their efforts to keep their products competi-tive. As was pointed out in Chapter 1, the Administration has intensifiedits measures to support the efforts of private business to enlarge our salesabroad. The Administration has likewise undertaken vigorous measureson other fronts to help speed the achievement of a reasonable equilibriumin the United States balance of payments. This enterprise is a responsibilityshared by both the public and the private sector of the economy.
Digitized for FRASER http://fraser.stlouisfed.org/ Federal Reserve Bank of St. Louis

Digitized for FRASER http://fraser.stlouisfed.org/ Federal Reserve Bank of St. Louis