erp usage in practice - diva portal536800/fulltext01.pdf · erp usage in practice: understanding...
TRANSCRIPT
ERP Usage in Practice: Understanding End-Users ‘Acceptance of ERP Systems in Chinese large companies
by applying UTAUT model
Bachelor’s thesis within Informatics
Author: Bo Chen, Zili Zeng
Tutor: Marius Mihailescu
Jönköping June 2012

Bachelor’s thesis within Informatics
Title: ERP Usage in Practice
Author: Bo Chen, Zili Zeng
Tutor: Marius Mihailescu
Date: June, 2012
Subject terms: ERP system, users’ acceptance, UTAUT model
Abstract
Introduction: The Enterprise Resource Planning system is an emerging technology that belongs to the scientific discipline of information systems. In simple words the ERP system integrates an organization’s resources and also involves business processes and organiza-tional changes. With the ubiquitous growth of IS investment, ERP systems implementation grows strongly. More and more companies introduced ERP systems. However many ERP implementation success stays at technical perspective. Users’ acceptance of ERP system is the key to the ERP implementation.
Purpose: The purpose of this study is to investigate and research factors that have affected the end-users’ acceptance of the ERP system during post-implementation phase of the ERP implantation lifecycle.
Method: In order to understand the ERP system acceptance in practices, this study will collect data from two Chinese companies. Employees from two Chinese companies will be selected as target group for user acceptance research. With the analysis of collected data, user acceptance of the ERP system in those two Chinese companies will be studied. Inter-views and questionnaire are used in this study. This study will interview with ERP export and generate the factors that could have possible affected users’ acceptance. Hypotheses will be deduced by those factors. Based on the primary data of questionnaires regression analysis is used to test those hypotheses to identify those factors.
Results: Research results show the factors that influence end-user acceptance of the ERP system. The factors are: Business process adoption, ERP system performance, ERP com-munication, ERP functionality, Computer nervousness, Technological innovation, Social impact and support, ERP support. Organizations need to pay attention to those important factors in order to improve the ERP system acceptance among end-users.

Acknowledgements
We would like to give a big thanks to the two Chinese companies: ZHONGBAI holdings group and FiberHome Technologies Group. Especially thanks to our tutor Marius Mihailescu, giving us a lot of guidance and suggestions. Also thanks to our friends, teachers and families to support us.
Bo Chen, Zili Zeng
Jönköping, June 2012

i
Table of Contents
1 Introduction .......................................................................... 1
1.1 Background ................................................................................... 1
1.2 Problem ......................................................................................... 2
1.3 Purpose ......................................................................................... 2
1.4 Research question ........................................................................ 3
2 Method ................................................................................ 11
2.1 Research philosophy ................................................................... 11
2.2 Research objective ...................................................................... 11
2.3 Inductive and deductive ............................................................... 11
2.4 Choice of method ........................................................................ 12
2.4.1 Qualitative research .......................................................... 12
2.4.2 Quantitative research ........................................................ 12
2.5 Data collection ............................................................................. 13
2.5.1 Primary data collection ..................................................... 13
2.5.2 Secondary data................................................................. 15
2.6 Data analysis ............................................................................... 15
2.6.1 Qualitative data analysis ................................................... 16
2.6.2 Quantitative data analysis ................................................. 16
2.7 Time horizon ............................................................................... 17
2.8 The credibility of data .................................................................. 17
2.8.1 Reliability .......................................................................... 17
2.8.2 Validity .............................................................................. 18
3 Frame of reference ............................................................... 4
3.1 ERP system .................................................................................. 4
3.2 ERP implementation life cycle ....................................................... 5
3.2.1 Operation and Post-implementation phase ......................... 5
3.3 End-users’ acceptance of ERP system ......................................... 6
3.3.1 Theory of Reasoned Action (TRA) ...................................... 6
3.3.2 Technology Acceptance Model (TAM) ................................ 6
3.3.3 Technology Acceptance Model 2 (TAM2) ........................... 7
3.3.4 Model of participation, involvement and system use ........... 8
3.3.5 Summary ............................................................................ 8
3.4 Unified Theory of Acceptance and Use of Technology (UTAUT) .................................................................................................. 8
3.5 Factors that influence ERP acceptance ...................................... 10
4 Empirical Findings and Analysis ....................................... 11
4.1 Qualitative analysis ..................................................................... 21
4.1.1 Analytical disposition ........................................................ 21
4.1.2 Analytical discussion ......................................................... 21
4.1.3 Factor identification and hypotheses development ........... 22
4.2 Quantitative analysis ................................................................... 24
4.2.1 Reliability analysis ............................................................ 25
4.2.2 Descriptive analysis .......................................................... 25
4.2.3 Correlation analysis .......................................................... 27
4.2.4 Regression analysis and hypotheses testing .................... 28
ii
5 Conclusions ........................................................................ 34
6 Discussion .......................................................................... 36
6.1 Discussion of the result ............................................................... 36
6.2 Discussion of the method ............................................................ 36
6.3 Implications for research ............................................................. 37
6.4 Implications for practice ............................................................... 37
6.5 Research limitation and future research ...................................... 38
List of references ..................................................................... 39
Appendix .................................................................................. 43
Appendix 1 Time plan ............................................................................ 43
Appendix 2 Table of identified factors .................................................... 44
Appendix 3 Regression statistic for variables ........................................ 46
Appendix 4 Questionnaire...................................................................... 49
List of table Table 3.1 Minimum result of the CVR ……………………………………………...19 Table 3.2 Multitrait-multimethod matrix for construct validity testing …………...20 Table 4.1 Reliability Analysis ………………………………………………………..25 Table 4.2 Spearman’s correlation analysis of the UTAUT model …………….…27 Table 4.3 Result of multiple regression analysis result …………………………..31 Table 4.4 Bivariate linear regression analysis result………………………………33
List of figure Figure 2.1 ERP system development …………………..…………………………...4 Figure 2.2 ERP implementation life cycle…………………………………………....5
Figure 2.3 The framework of theory of reasoned action ………..……………….6
Figure 2.4 Technology Acceptance Model …………………………….…………..7 Figure 2.5 Technology acceptance model 2……………………………..................7 Figure 2.6 UTAUT……………………………………………………..….……………9 Figure 4.1 Factors divided into different categories according to UTAUT mod-el………………………………………………………………………………………...23 Figure 4.2 Histogram for different occupation……………………………………...26 Figure 4.3 Pie chart statistic for gender …………………....................................26 Figure 4.4 Bar chart statistic for age ……………………………………………….26 Figure 4.5 Line chart for duration of using ERP system…………………............27 Figure 5.1 Proposed research model for user acceptance ………………………34

1
1 Introduction
This chapter gives general information to the study. It introduces the border context about the ERP system and users’ acceptance to the reader. The problem analysis will discuss more about users’ acceptance of the ERP system. The chapter ends up with research questions.
1.1 Background
An information system (IS) is a system of communication between people and is involved in the gathering, processing, distribution and use of information and widely used in many aspects (Davies, 2002).
The Enterprise Resource Planning (ERP) system is an emerging technology that belongs to the scientific discipline of information systems. ERP definition was first bought out by Gartner Group an American consultant company in 1990 (Wylie, 1990). ERP systems are the specific kind of enterprise systems to integrate data across and be comprehensive in supporting all the major functions of the organization. ERP systems are also defined as IS which integrate relative organization tools and data by means of a data base (Motiwalla & Thompson, 2009). In simple words the ERP system integrates an organization’s resources and also involves business processes and organizational changes.
ERP systems are pre-packaged software which must be customized as well as changed in order to implement them into the organizations’ business processes. Moreover, the ERP system is a complex system which impacts large numbers of end-users in the organizations. A proper implementation plan is necessary as well as change management plan (Motiwalla & Thompson, 2009). With the ubiquitous growth of IS investment, ERP systems imple-mentation grows strongly. More and more companies introduce ERP systems. They per-ceive that ERP systems can provide a high level of competitiveness via the acquiring of a strong market position (Robey, Ross & Boudreau, 2002). The authors are interested in fac-tors which could influence users’ acceptance of the ERP system.
Like most information systems, ERP systems follow three-step lifecycles: selection, im-plementation, operations and post-implementations. In terms of the end-users’ acceptance of ERP adoption, we found that the domain literature is mainly focused on either evaluat-ing the appropriateness of the ERP system software, vendors selection, consultants, or identifying critical successful factors (CSFs) affecting ERP selection and implementation (Yu, 2005). Those critical successful factors have been identified in ERP system implemen-tation phases including: top management support, communication, training, cooperation, technological complexity. These factors listed up basically based on the technology ac-ceptance model (TAM). Moreover some studies mainly focus on how end-users’ cognitive considerations of the characteristics of ERP system affect their attitude and voluntary men-tal acceptance of the system. Regarding other studies, most are focused on the selection and implementation phases. However, the trend of ERP development is keeping growing. More companies introduce the ERP system into their organizations. The problem will be acute over time.
In terms of our study, we are investigating the factors of end-users’ acceptance of ERP sys-tem adoption in operation and post-implementation phases. The research motivation be-hind our study is quite simple. First, many resources and literatures we are searched before demonstrate that ERP clearly can improve the competitiveness by the correct and accepted system adoption. However, it could also have a negative effect of ineffectiveness to organi-zations. Second, recent studies (TAM and factors) have concluded that there are some fac-
2
tors that influence the users’ acceptance of ERP system adoption. Related to these studies, some of the CSF and the external factors affect the users’ attitude and behaviors which could influence the ERP system adoption’s effectiveness. Consequently, ERP systems might be implemented successfully from a technical perspective, but success depends on ERP users' attitudes toward and actual use of the system (Boudreau, 2002; Kwahk & Lee, 2008). Despite the CSF and external factors, authors want to build on a comprehensive view of ERP adoption in this study. By all means we want to provide a better understand-ing of users’ attitude and behaviors.
1.2 Problem
According to Shang and Seddon’s study (2002), an ERP system successfully implemented, has positive effects on users’ efficiency and the organization production as well as positive business changes. With the increasing demand of the ERP system, it becomes more and more popular in large and middle sized organizations. Increasing the IS effectiveness be-comes more crucial to organizations. However, lack of user acceptance which has been a hinder to the success of new ERP systems’ adoption.
ERP system implementation can be summarized into three phases: selection, implementa-tion, operation. Operation phase can be also divided into stabilization and routine phases. In the operation phase the system will experience a very important process. Much of the ERP system success resides on this stage (Motiwalla & Thompson, 2009). ERP systems experience a post-implementation period in the stabilization stage. The system perfor-mance could not have long-term effects on an organization (Gattiker & Goodhue, 2005). Moreover, ERP systems could be implemented effectively for a technical perspective, but factors affecting success depends on end-users' behaviors and actual use of the system (Kwahk & Lee, 2008). The extent to which users accept and utilize the ERP system fre-quently and extensively plays a crucial role in system adoption. It becomes more important for the organizations to examine those factors which affect users’ acceptance with the aim of improving ERP systems’ efficiency and effectiveness.
Many successfully implemented ERP systems stay at the technical implementation stage. User acceptance is key to the full success of new ERP systems’ adoption. In the ERP sys-tem implementation lifecycle there are three steps to ERP system. Post implementation is the most crucial phase. The authors found that few of them have investigated the end-users’ acceptance in post-implementation phase. Therefore, factors of users’ acceptance identifi-cation and how to improve post-implementation phase are needed for further study. By drawing on established theories and empirical findings in IS adoption this study will exam-ine factors influencing end-users’ attitudes and acceptance of ERP system.
1.3 Purpose
The purpose of this study is to investigate and research factors that have affected the end-users’ acceptance of ERP system during post-implementation phase of the ERP implanta-tion lifecycle.
After the factors have been identified, the study will then analyze the end-users’ acceptance of the ERP system by applying the Unified Theory of Acceptance and Use of Technology model (UTAUT). Meanwhile, different identified factors will be tested according to their relationship with the UTAUT model. With the analysis of relationships, user acceptance of ERP system will be studied.

3
1.4 Research question
1. What are the factors that affect the End-Users' Acceptance of Enterprise Resource Planning Systems during the post-implementation phase?
2. How can the End-Users’ Acceptance of the Enterprise Resource Planning system be improved?
4
2 Frame of reference
This chapter gives the readers a deep understanding of the concepts. In the chapter the authors explained and elaborate the important concepts. Theories and literatures were reviewed. It ends up with factors in ERP system acceptance.
2.1 ERP system
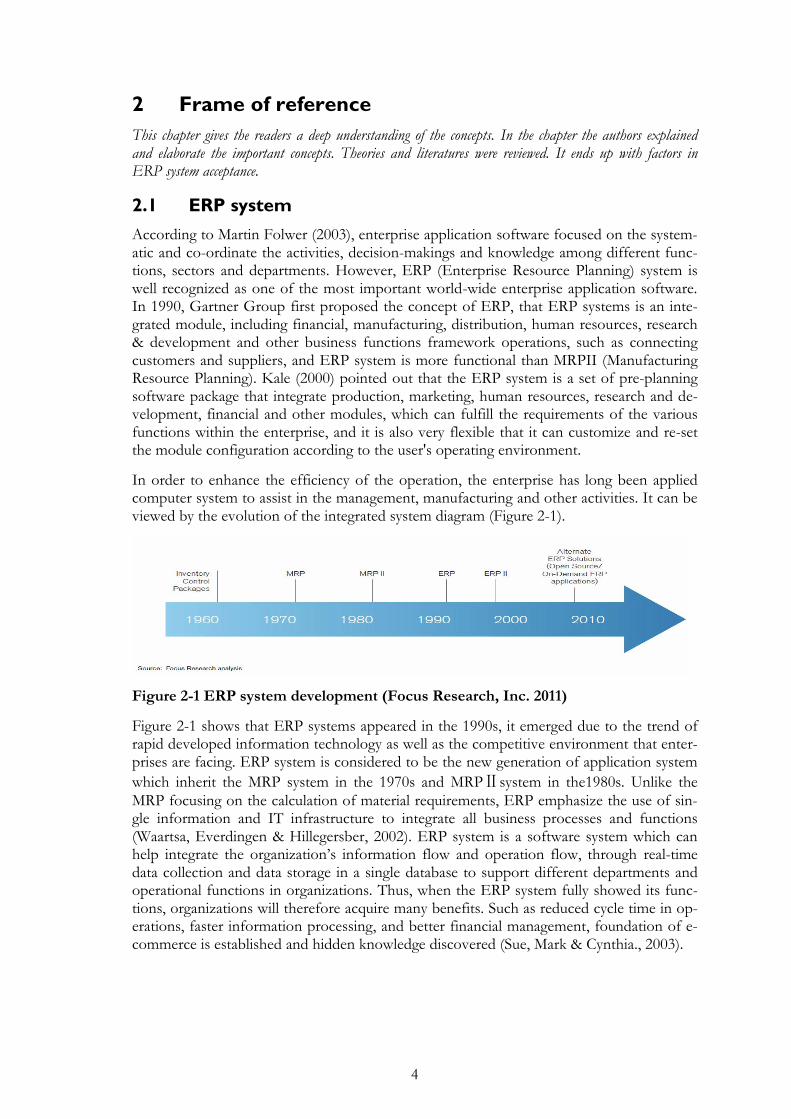
According to Martin Folwer (2003), enterprise application software focused on the system-atic and co-ordinate the activities, decision-makings and knowledge among different func-tions, sectors and departments. However, ERP (Enterprise Resource Planning) system is well recognized as one of the most important world-wide enterprise application software. In 1990, Gartner Group first proposed the concept of ERP, that ERP systems is an inte-grated module, including financial, manufacturing, distribution, human resources, research & development and other business functions framework operations, such as connecting customers and suppliers, and ERP system is more functional than MRPII (Manufacturing Resource Planning). Kale (2000) pointed out that the ERP system is a set of pre-planning software package that integrate production, marketing, human resources, research and de-velopment, financial and other modules, which can fulfill the requirements of the various functions within the enterprise, and it is also very flexible that it can customize and re-set the module configuration according to the user's operating environment.
In order to enhance the efficiency of the operation, the enterprise has long been applied computer system to assist in the management, manufacturing and other activities. It can be viewed by the evolution of the integrated system diagram (Figure 2-1).
Figure 2-1 ERP system development (Focus Research, Inc. 2011)
Figure 2-1 shows that ERP systems appeared in the 1990s, it emerged due to the trend of rapid developed information technology as well as the competitive environment that enter-prises are facing. ERP system is considered to be the new generation of application system
which inherit the MRP system in the 1970s and MRPⅡsystem in the1980s. Unlike the
MRP focusing on the calculation of material requirements, ERP emphasize the use of sin-gle information and IT infrastructure to integrate all business processes and functions (Waartsa, Everdingen & Hillegersber, 2002). ERP system is a software system which can help integrate the organization’s information flow and operation flow, through real-time data collection and data storage in a single database to support different departments and operational functions in organizations. Thus, when the ERP system fully showed its func-tions, organizations will therefore acquire many benefits. Such as reduced cycle time in op-erations, faster information processing, and better financial management, foundation of e-commerce is established and hidden knowledge discovered (Sue, Mark & Cynthia., 2003).

5
2.2 ERP implementation life cycle
For a lot of organizations, in terms of the implementation scale, people involvement and financial investment, ERP systems are the largest systems they have worked with. In gen-eral, ERP system implementations are very time consuming, complicated and resource in-tensive. For the reason that ERP system has big size as well as impact on the organization, ERP system will raise this complexity (Motlwalla & Thompson, 2009). Motiwalla (2009) al-so points out that ERP implementation cannot be finished within one-time; however it in-volves a continuous cycle of product release and support. As it is shown in figure 2-2, there are three typical phases of ERP implementation lifecycle: pre-implementation (pre-selection), implementation and post-implementation phase. Nonetheless, lots of ERP im-plementations have turned into disastrous endeavors during or after Going-live stage, the majority success of ERP implementation therefore exists in post-implementation phase (Motiwalla & Thompson, 2009).
Figure 2-2 ERP implementation life cycle (Monk, Ellen, & Wagner Brett, 2009)
Figure 2-2 shows the implementation life cycle of ERP system, in the pre-implementation phase, companies select the ERP vendors and evaluate the package they purchased, after-wards, project planning is necessary for specific ERP software implementing in the compa-ny. For the implementation phase, companies will mainly perform 6 activities in the middle of the figure, including training, re-engineering, and gap analysis and so on. Eventually, the company comes to post-implementation phase, as a going live step, it is very critical for the success of ERP implementation.
2.2.1 Operation and Post-implementation phase
ERP post-implementation phase is the period beginning with the “go live” in the lifecycle of an ERP system (Markus & Tanis, 2000). In the initial stage, known as “Stabilization”, er-rors will be fixed, end-users will be retrained and system performance will be balanced. The initial post-implementation stage will last for about five to ten months until it accomplish “normal operations”. After the system improvement, the business processes and the ERP system will settle in line with experiences obtained (Ross & Vitale, 2000; Shanks, 2000). Af-ter the stabilization stage, from a technical view, the ERP implementation might be suc-cessful, but success depends on ERP end-users’ attitudes toward the system and actual use of the system (Boudreau, 2002; Kwahk & Lee, 2008). Only when employees are pleased with their direct system interaction can the full potential of the system be exploited (DeLo-

6
ne & McLean 1992; Bhattacherjee 2001; Au, Ngai et al. 2008). Similarly, organizations gain advantage from ERP system only to the extent that users accept and utilize them regularly and comprehensively. In order to improve efficiency and effectiveness of ERP systems in the post-implementation phase, factors that impact user satisfaction need to be researched by organizations.
2.3 End-users’ acceptance of ERP system
Although organizations have spent huge investment on ERP, implementation failures and less-than-satisfactory productivity improvements still exist (Davenport, 1998). One of the frequently quoted reasons for ERP failures is end-users’ unwillingness or reluctant to adopt or use newly implemented ERP system (Barker & Frolick, 2003). Therefore, in this part, different theories applied in user acceptance study in ERP system will be reviewed.
2.3.1 Theory of Reasoned Action (TRA)
The theory of TRA was first proposed by Fishbein and Ajzen in 1975, the theory mainly aims at explaining and predicting human behavior. According to TRA, the appearance of a person’s specific behavior is determined by the behavioral intention (BI), meanwhile, be-havior intention is affected by both attitude and subjective norm (SN) (Fishbein & Ajzen, 1975). The framework of TRA is shown in figure 2-3.
Figure 2-3 The framework of theory of reasoned action (Fishbein & Ajzen, 1975)
Regarding the ERP acceptance study, Kanungo and Bagchi (2000) have applied the Theory of reasoned action (TRA) in a study concerning about user participation and involvement in ERP system context, their research aims to identify variables that needs to explain in ERP context for their system use, and explain their system use in ERP context, so they know how the variables influence each other in system use. And Kanungo and Bagchi’s (2000) study has concluded that the model of theory of reasoned action can be used for studying the usage of ERP in India industry context, and their research findings also proved that the model does explain user behavior compare to other model. Indeed, we think their research is valuable for ERP system acceptance study, but we think the model is too simple to related to other variables they mentioned in the research if they aims to ex-plain the user behavior, especially when there are a lot of variables that influence the sys-tem use of ERP directly or indirectly, a more elaborated model is needed.
2.3.2 Technology Acceptance Model (TAM)
In order to explore the acceptance issue of information technology more deeply, Davis (1989) has proposed the Technology Acceptance Model (TAM), which was based on TRA model and has absorbed rational internal dimensions from expectancy theory and self-efficacy theory. Different from TRA model, TAM model doesn’t have the following three

7
constructs in TRA: subjective norm, normative belief and motivation to comply. Theoreti-cally, TAM believes that the primary determinants of information technologies adoption in organizations are perceived usefulness and ease of use (Davis, 1989). Figure 2-4 shows the technology acceptance model.
Figure 2-4 Technology Acceptance Model (Davis et.al., 1989)
Several studies (Adamson & shine, 2003; Brown et al., 2002; Rawstorne, Jayasuriya & Ca-puti, 1998) have applied TAM (Technology acceptance model) to explain or analyze the end-users’ acceptance in an ERP system environment, the main reason of utilizing TAM is that it provides a foundation to find out the impact of external variables on internal values, attitudes, and intent. However, Legris’s (2003) study also pointed out the drawback of TAM, 1). The main experiment objective is student. 2). the majority of the researches have applied the software which is Microsoft office software or system development software. 3). the methods applied in those researches are basically by self-reporting. 4). The TAM model doesn’t have clear elaboration for the variables that exist outside the model. Based on those drawbacks, a more elaborated model and more practical model is needed for ERP system acceptance study.
2.3.3 Technology Acceptance Model 2 (TAM2)
Based on Davis (1993) and other researchers’ research conclusion, Venkatesh & Davis (2000) have improved the TAM, and increase the explanatory capability of TAM. They brought in the concept “social influence process” and “cognitive instrumental process” in-to the model, and regard them as perceived usefulness’ determinate variable; therefore the original layout has been changed in which perceived usefulness is only determined by ex-ternal variable and perceived ease of use. And Venkatesh & Davis (2000) named the new model TAM2, figure 2-5 shows the technology acceptance model 2.
Figure 2-5 Technology acceptance model 2 (Venkatesh & Davis 2000)

8
Ramdani, Kawalek & Lorenzo.,(2009) have carried out a study to predict the SMEs’(Small Medium Enterprise) adoption of enterprise system, as their purpose is to develop a new model to predict the adoption of enterprise system in SMEs, and TAM2 has been applied as their research model to examine the adoption of IS innovations in SMEs. And the study has concluded that SMEs are influenced by technological and organizational factors rather than contextual factors when they trying to adopt enterprise systems. According to their study, although TAM2 is easy to be applied in research in practice, but the information it collected is very limited.
2.3.4 Model of participation, involvement and system use
Organizations often need to carry out relevant organizational changes, which can lead to negative effect on structures, processes and cultures (Holland & Light, 1999). Such changes usually reduce the motivations and interesting feelings among the end-users towards the new tool. For that reason, the success or failure of ERP system implementation depends directly on the end-users’ behavioral intention to use. Among different existing studies that have investigated end-users’ behavioral intention on ERP system, one study has applied the model of participation, involvement and system use which proposed by Hartwick and Bar-ki (1994), aims to assess end-users’ involvement and participation of ERP system, the study concludes it is essential to change conventionally formalized relations between the user par-ticipation and users’ attitude in the ERP environment. We agree with this conclusion, but we thought the validity of the usage behavior construct and behavior intention need to be more convincible.
2.3.5 Summary
In recent years, a number of cases showed that ERP system implementation have gone through considerable difficulties (Krasner, 2000; Wah, 2000; Xue et al., 2005). Within all those barriers, technical problems and people obstacles have been mentioned as the main obstruction (Botta-Genoulaz and Millet, 2006). Regardless of TRA model, TAM model, TAM2 (Venkatesh & Davis, 2000) and the “model of participation, involvement and sys-tem use” that have mentioned above, and TAM3 (Venkatesh & Bala, 2008) have also been applied in the previous study of ERP system acceptance. All studies showed that a more elaborated and developed model is necessary for acceptance study. Besides, a number of researchers also state that in order to explain and understand end-user’s perception in a more sophisticated organizations and more complex IT environment, a more consolidated and improved model is required (Legris et al., 2003; Brown, Massey & Weiss, 2002). Ven-katesh et al. (2003) had developed the Unified Theory of Acceptance and Use of Technol-ogy (UTAUT) model after reviewing different previous studies on TAM and related, the new model has combined previous TAM and related models, more adaptive in analyzing the IS and related technology in a complex IT environment.
2.4 Unified Theory of Acceptance and Use of Technology
(UTAUT)
Studies that have been conducted among users toward their technology acceptance behav-ior, many based on the model of information system, psychology and sociology, research-ers often encounter with the model selection problem and model construction problem, which made them add new construct or combine to a new model to perform related re-search, however it has the disadvantage of poor explanatory inherently. Therefore, Ven-

9
katesh et al. (2003) developed a unified theory of acceptance and use of technology (UTAUT), in order to help future research in the field of information technology ac-ceptance behavior, based on this integrated model, researchers are able to find out more factors that influence user behavior, and this model has further improved the explanatory capability and understanding of user as well.
Venkatesh et al, (2003) reviewed the past related research and found that the proven mod-els in the past have different features, and those models were also confirmed in various fields, so they integrated eight models in the past literature (Venkatesh, 2000; Hendrickson, Massey & Cronan 1993; Adams, Nelson & Todd 1992; Subramanian 1994 ;): technology acceptance model (TAM), Model of PC utilization (MPCU), theory of reasoned action (TRA), social cognitive theory (SCT), Motivation model (MM), theory of planned behavior (TPB), a combined theory of planned behavior/technology acceptance model (C-TAM-TPB), diffusion of innovations theory (IDT), figure 2-6 shows the model of UTAUT.
Figure 2-6 UTAUT (Venkatesh et al., 2003)
The new framework integrated the previous eight models and related concepts into four main dimensions for UTAUT: performance expectancy, effort expectancy, social influence, facilitating conditions; as well as four control variables: gender, age, experience, voluntari-ness of use. The main dimensions and control variables of UTAUT model shown as fol-lows: (Venkatesh et al., 2003)
1. Performance Expectancy It is defined as the extent to which a person feels that using the system will be helpful for work, including five sub-dimensions: perceived usefulness (TAM/TAM2), job-fit (MPCU), extrinsic motivation (MM), relative advantage (IDT) and outcome expectation (SCT).
2. Effort Expectancy It is defined as the extent of the ease of use when a person uses the system, including three sub-dimensions: perceived ease of use (TAM/TAM2), ease of use (IDT) and complexity (MPCU).

10
3. Social Influence It is defined as the extent to which an individual feels the influence by the people around, including three sub-dimensions: social factors (MPCU), subjective norm (TRA, TAM2, TPB) and image (IDT).
4. Facilitating Conditions It is defined as the extent to which an individual feels the support on the system use by the organization in related technology, equipment perspective, including three sub-dimensions: compatibility (IDT), facilitating conditions (MPCU) and perceived behavioral control (TPB).
5. Age, gender, experience, voluntariness of use Besides the four main dimensions above, there are also four variables that affect the behav-ior intention indirectly. Venkatesh et al. (2003) believes that the UTAUT model can be regarded as useful tools for managers, when managers trying to bring in new technology, UTAUT can be used to measure it during that period, and the model can predict and explain the behavior of users on information technology acceptance. In fact, ERP system is an application of infor-mation technology, this study will use the UTAUT model to explore the behavior of users on ERP acceptance, and together investigate the impact of the variables on the behavior of users’ ERP acceptance. The empirical results show that the explanatory capability of this new structure on the use of behavior has reached 70%, more efficient than any of those models in the past (Venkatesh et al., 2003).
2.5 Factors that influence ERP acceptance
Researchers have different opinions on the factors that affect the ERP system acceptance. It is said that a better understanding of these factors would enable more effective organiza-tional interventions that lead to increased acceptance and use of systems (Venkatesh & Da-vis, 2000). So we have also reviewed a number of existing literatures that explains factor of influencing on ERP acceptance.
Agarwal and Prasad (1999) and Rogers (2003) proposed a factor called Technological inno-vativeness; it describes the extent to which a person is willing to try a new information technology (Agarwal & Prasad, 1999). There is another factor that proposed in 2001, named User manual helpfulness, it explains the extent to which a person believes that lack-ing of user manuals is the reason that lead to the failure of ERP performance (Kelley, 2001). In 2004, a new factor called “adapt to the business processes” appeared, it illustrates that to adapt the business processes from an end-user’s perspective depends on the extent to which the end-users’ or organizations’ requirement are fulfilled by the ERP system (Nah, Tan & Teh, 2004). Recently, Bobek and Sternad (2010) have proposed “ERP training” as a factor that affect users ERP acceptance, it indicates whether the amount of formal and in-formal training a user think he or she has received is enough. Additionally, “system data quality” has also been quoted as an influencing factor by Gattiker and Goodhue (2005), as it emphasis that it is important to achieve accurate data in order to improve the task effi-ciency (Gattiker & Goodhue, 2005). Regarding the support provided by ERP system, Bou-dreau (2002) has concluded a factor based on ERP support, which shows the amount of ERP support that perceived by users is critical to users’ successful ERP usage (Boudreau, 2002).

11
3 Method
In this chapter we will discuss research objective, research approach, choice of method, time horizon, data col-lection and how we manage our empirical data. The chapter will end up with data credibility.
3.1 Research philosophy
Research philosophy means the development of knowledge and the nature of that knowledge. The adopted research philosophy contains how you view the world. Positivism is adopted in this research. It relates to the philosophical stance utilizing nature scientist. Adapting to positivism to generate a research strategy the authors are collecting data and using the existing theory to develop hypotheses. It will be tested and confirmed (Saunders,
Lewis & Thornhill, 2007).
In terms of the research philosophy there is no approach ‘better’ than others. It can be viewed like they are better in different aspects. The research questions can be viewed as the starting point of the research. What factors affect users’ acceptance of ERP system is our starting point. It determines our approach, strategy, and research philosophy. Relating to the existing study and the authors generate those factors and test those factors. With the considerations of all above positivist’s view is appropriate for this study.
3.2 Research objective
Saunders et al. (2007) has classified research purpose into three types: exploratory study, descriptive study and explanatory study. In view of the fact that our research aims to find out factors that influence of user acceptance in the ERP system, the authors decided to start with an exploratory research, find out “what is happening; to ask questions; to assess phenomena in a new light and to seek new insight” (Robson, 2002). Because the authors want to know what is happening when users utilize ERP system in their company, what they think, how they feel. At first the authors conducted a literature review, exploring dif-ferent factors from the existing literatures. Then we carry out two interviews with IT con-sultants who had been working with ERP system for many years, to determine more fac-tors that influence users’ acceptance.
As this study aim to understand the user acceptance based on the UTAUT model, so the relationship between those factors and the UTAUT model need to be explained. Thus, an explanatory research is required in the second place, as an explanatory study aims to study a situation or a problem to clarify the relationships between variables. (Saunders et al., 2007). Therefore, the data is needed to explain the relationship between factors and UTAUT model, and a survey will be performed among ERP end-users in two companies to collect those data. The questionnaire in the survey will be based on the material we had from the interview and literature review. Following the analysis of the survey data, the relationship between factors and the UTAUT model will also be explained. Thus, the knowledge in the ERP acceptance field will be enriched and the overall research objective is fulfilled.
3.3 Inductive and deductive
In the book of Saunders et al., (2007), the authors mentioned often two broad methods of reasoning as inductive and deductive approaches. Deduction mainly begins with the general and ends with the specific, while induction approach refers to move from specific to gen-eral. In inductive research, factors will be developed based on the results from the analysis of the data that has been obtained. In other words, inductive approach could move from a particular situation to create general theories or ideas. (Collis & Hussey, 2003)

12
Referring this present study of examines what factors affect end-users’ acceptance in ERP implementation. This research involves two steps which are finding factors and proving factors. In induction approach data are collected via interviews. As the results of the data analysis, the authors conclude those factors could be affecting user acceptance of ERP sys-tem. However at this point we could only say that these kinds of factors could possible af-fect user acceptance. In order to be more specific what factors are actually affect user ac-ceptance, further study is needed. In deduction approach we deduce the hypotheses. It is based on the factors we generated in induction approach. Furthermore to test these hy-potheses the authors can utilize the characteristics in deductive research, the collection of quantitative data. The other characteristic of deductive approach is generalization. It can be used to select samples of sufficient numerical size, in order to be able to generalize statisti-cally about regularities in human social behavior (Saunders et al., 2007). To explore the role played by attitude toward change, this study establishes a construct of attitude toward change within a research model consisting of its consequences (i.e., perceived usefulness and perceived ease of use) and other factors that could relate to this model.
3.4 Choice of method
In order to answer our research questions, we carry out our research in both quantitative and qualitative way to look into the factors that influence the end-users’ acceptance on ERP system during post-implementation phase. So we choose a mixed method to conduct our research. Saunders et al. (2007) have defined that in a mixed method, collection tech-niques and analysis procedures of quantitative and qualitative data will be used either at the same time (parallel) or one after another (sequential) but does not combine them. The method also implies that qualitative data can only be analyzed qualitatively and quantitative data will be analyzed quantitatively (Saunders et al. 2007). And the reason to choose mixed method research is that we need to collect qualitative data to develop our hypothesis that is based on literatures and interview, also we need to collect quantitative data for hypothesis testing in practice.
3.4.1 Qualitative research
Particularly, interview and literature review has been chosen for exploring and researching different factors that influence the end-users’ acceptance of ERP system in this study. Ac-cording to Walker, Coole & McAllister, (2008), a qualitative research aims to find out and explicate the nature of phenomenon and gain holistic, comprehensive and affluent data. This study starts with literature review in order to conclude the factors of influence in the past researches. Afterwards, to get a deeper understanding on the factors that impact ERP acceptance, interviews will be carried out in companies with their IT consultants, issues re-garding user acceptance of ERP system in companies will be discuss with those consultants. As Robson (2002) has mentioned, an exploratory study needs to find out what is happen-ing; to ask questions; to assess phenomena. So after the qualitative data is obtained from both interviews and literature reviews, those data will be coded and the concluded code will be further combined and refined into factors. After the factors have been identified, hy-pothesis will be developed based on those factors. And in this way, qualitative data are be-ing used for an exploratory study.
3.4.2 Quantitative research
On the other hand, quantitative research has been chosen for testing the hypotheses and achieving a big picture on ERP use in practice in our study. The process of testing the hy-potheses is the way to explain the relationship between the factors and the UTAUT model.

13
As Saunders et al. (2007) mentioned that to establish causal relationship between variables will be the way to conduct explanatory study. Therefore, in our study, we need to carry out quantitative research to obtain the data to explain the relations between factors and UTAUT model, an Internet survey will be performed among employees from particular companies, the answer from the survey will be regarded as quantitative data, quantitative data will be analyzed through statistical software in order to test the hypotheses that devel-oped before, and in this way, the relationships between factors and the UTAUT model will be explained, and hypotheses that have been accepted will lead to their corresponding fac-tors being accepted. Hence, this study will conclude the accurate factors that influence the end-users’ acceptance of ERP system in reality based on those quantitative data. Subse-quently, through comparison of different statistic of each concluded factors, factor that has larger influence on acceptance will be known, which will provide directions for further im-provements for ERP users’ acceptance in organizations.
3.5 Data collection
When it comes to the data collection, there are three different data sources should be con-sidered. Two of them are widely used in many researches. In this study the author decided to use only primary data collection and secondary collection. Primary data refers to data collected specifically for the research project being undertaken. Secondary data refers to da-ta used for a research project that were originally collected for some other purpose. With a combination of these two data sources, the researchers were able to generate a complemen-tary and valid investigation. Tertiary data refers to international data compiled from inter-national sources which are not used in this study (Saunders et al., 2007).
3.5.1 Primary data collection
As the stated above of the data collection, there are several options to collect primary data which include interviews, questionnaires and observations. In terms of the observation, it is often used for investigating human behaviors which is relevant to the users’ behaviors. However it is very time consuming (Saunders et al., 2007). Interviews and questionnaires are most common strategies to collect primary data. In this thesis, we will use interviews and questionnaires to collect our primary data.
3.5.1.1 Interview
Interviews could be explained as a purposeful discussion between two or more people (Kahn & Cannll, 1957). It can help you to gather valid and reliable data which are relevant to your research objectives and questions. Another aspect should be considered is the level of formality of interview. Interview could be conducted into three different ways: struc-tured, semi-structured and unstructured interviews. An unstructured interview is developed as an informal conversation between the interviewer and the respondent to explore a gen-eral area in the subject of interest in depth. Semi-structured interviews are based on a list of themes and questions but these can vary from interview to interview. The structured inter-view is used with an emphasis of identical set of questions is existing (Saunders et al., 2007).
In order to conduct a comprehensive questionnaire, the authors decided to combine with the valid and reliable data obtained from interview. We choose semi-structured interviews as our primary data collection strategy. It can give more freedom for respondent to ask questions. Additionally the semi-structured interview is suitable for a qualitative analysis as it can provide more flexibility for both interviewers and respondents. Audio-record can keep the data more accurately and avoid data losing.
14
The two interviews are conducted with two Chinese’s companies which are FiberHome Technologies Group and ZHONGBAI holdings group. These both of the two companies have implemented ERP system for several years which is appropriate to our research. Spe-cially both of them have strong IT department to support their ERP system. The inter-views are conducted with each company’s ERP experts who worked companies for years. It is helpful for us to build a comprehensive view of their ERP system acceptance. Before interview, a resource of searching the company background is needed. It could help the in-terviewers develop interview questions and generate new insights. All the interview ques-tions are open-ended questions based on the research questions and relevant research con-texts. We interviewed two Chinese’s companies which are FiberHome Technologies Group and ZHONGBAI holdings group. The interview duration was approximately 60 minutes. A tape recorder was used under the interviewees’ permission. The language used in ques-tions and conversation will be in Chinese. After the interview we translated all the conver-sation into English. There are some problems in language transactions. Due to the different cultures and language, some expressions and words cannot be translated perfectly. In order to avoid this problem, both of the authors translated the entire interview content individu-ally. Additionally revise the interview content by comparing. And this process has been done for several times to avoid transaction bias.
With the advantages the interview provides, we could obtain the more detailed information about ERP system acceptance as an ERP expert’s perspective. It could give us a better un-derstanding of ERP system acceptance and maybe generate more insights in our research field.
3.5.1.2 Questionnaire
The main purpose of this study is to seek factors that influence the user’s acceptance of ERP system. By using previously literatures reviews and the data we obtained from inter-views, we conclude all the factors. With all the factors we generate, the questionnaires pro-vide us the quantitative data from users’ of ERP system. The data will help us to examine hypotheses we conduct from factors. In other words the questionnaire helps us to explore the factors influence the user’s acceptance of ERP system. Internet-mediated questionnaire is mainly used in our survey. It is also known as self-administered and usually complete by respondents. As the respondent’s perspective, it is easy respond and more convenience to fill with. As the researcher’s perspective, data could be easily collected and analyzed (Saun-ders et al., 2007).
In terms of the question in questionnaires, it can be divided in two parts: general questions and professional questions. There are 6 general questions involving gender, age, positions and so on. Our goal is to seek factors could influence end-users’ acceptance in ERP system. Therefore we have large numbers of factors to explore. With the help of Unified theory of acceptance and use of technology (UTAUT) model we combined those factors into four groups. 1. Performance expectancy. 2. Effort expectancy. 3. Social influence. 4. Facilitating conditions. With the help of those combined factors professional questions were devel-oped. Professional questions were measured on a seven-point Likert scale, ranging from “strongly disagree” to “strongly agree”, taken from relevant prior research and adapted to ERP usage. The numbers of professional questions are 35. All the questions were formu-lated in a clear and straightforward way to make the task easier for participants. After the pilot test, the questionnaires will be distributed to the employees and managers in organiza-tions. Data will be analysis with SPSS software. Statistical tests will be run to ensure that re-sults are a factors relate to end-users’ acceptance in ERP system implementation. Only the

15
fully filled questionnaires were included, and hence were considered as being valid for anal-ysis.
3.5.1.3 Sample
It is interested to investigate the factors influence users’ acceptance of ERP system to gen-eralize the large organizations and companies across China. However it is impracticable for us to survey the entire population. Due to the current situation, the interviews and ques-tionnaires has already conducted in two large companies in China. The one of them called FiberHome Technologies Group which is an outstanding product and solution provider in the field of information and telecommunication. The other one called ZHONGBAI hold-ings group which is a commercial company in middle and west part of China. The compa-nies we connected with are quite famous and represented companies which have used ERP systems for several years. Both of them have strong IT department to support their ERP system running. By interviewing with ERP system exports of the companies provides us a broader view of the ERP system acceptance.
Since the research is conducted in two companies the population is all the ERP users in these two companies. The two companies have approximately 100 ERP users. Based on the companies’ information, the ZHONGBAI holdings group involves 60 ERP users and FiberHome Technologies Group has 40 ERP users. After discussion the total target popu-lation is 100. We distributed our survey to those users by email and others online chatting tools. In our cases, the expected situation is all the questionnaires will be distributed to all the users of ERP system. They are still keeping responded to our survey. Based on the re-spond we received, there are 81 valid responds. ZHONGBAI holdings group has 48 re-sponses and FiberHome Technologies Group has 33 responses. The resources limitation and time limitation should be concerned with. After the consideration these reasons, the authors decided to use convenience sampling as our sampling technique. It belongs to non-probability samplings. The result we gained could not generalize as the ERP system ac-ceptance in large companies in China area. However the data could be supportive relate to this field. The convenience technique is considered easiest, cheapest and least time con-suming which is meeting our research need (Saunders et al., 2007).
3.5.2 Secondary data
As we explained before, secondary data can provide a useful source from which to answer, or partially to answer our research questions (Saunders et al, 2007). In order to build a comprehensive review of ERP systems adoption we searched and reviewed materials such as literatures, journals and articles. We use JULIA and Google scholars to search for re-sources. DIVA is also an effective tool for secondary data searching. Authors found some relevance studies about the ERP system acceptance and secondary data could be used for frame of reference. A great contribution of secondary data is to help us to find out which factors already existed in other studies. Key word searching is also used is our secondary data collection. It include these key words: ERP system, ERP system adoption, ERP sys-tem user acceptance, ERP system implementation, ERP system failure, factors of users fac-tors, ERP system usage, users attitude and behavior of ERP system. All the data we collect are putted into frame of reference.
3.6 Data analysis
This section describes the different data analysis techniques that will be applied in the em-pirical finding and data analysis part later on. Separately, qualitative data analysis will apply a “bottom-up” approach proposed by Mills (2006), and interpret the finding step by step;

16
while quantitative data analysis will apply descriptive analysis, reliability analysis, correlation analysis and regression analysis for different purpose of interpreting the data or testing the reliability.
3.6.1 Qualitative data analysis
Based on the data we have collected above, we will carry out data analysis for both inter-view and survey. Regarding the analysis of the interview, which is in a form of qualitative data analysis, Creswell (2005) has mentioned that the qualitative data analysis is an induc-tive process, in which the data is examined from a "bottom-up" approach. Therefore, we will conduct our qualitative analysis through 5 steps which is proposed by Mills (2006):
Step 1: transcribe the interview
Step 2: preliminary exploratory analysis
Step 3: referring to research questions
Step 4: inter-rater reliability
Step 5: interpret findings
The reason why we choose this analysis approach is because we have two interviews, and we want to analyze them completely and accurately corresponding to our research ques-tions. To begin with, the interview will first be transcribed on paper in a form of “Q & A”, while Q stands for the questions proposed by us and A stands for the answers responded by the expert. Then for the exploratory analysis, we will review the transcript for the inter-view several times and try to identify a theme or notions during analysis. Subsequently, in order to refer the interview content to our research questions, we will further review the transcript and identify the themes that can answer our research questions, and the conclud-ed themes have to be refined to provide better answer to our research questions. To ensure the reliability of the themes that concluded our group as two people will review the inter-view data and refine the theme like above individually, both results will be discussed, and we will finalize a serious of themes in the end (a theme summarizes different small subjects appeared in the interview). When all of the data from the interview have been coded into different themes (themes like ERP communication, ERP training, ERP project manage-ment etc.), we will sort and integrate different themes into multiple categories, and then name those categories and note related comments, and in this way we reach our empirical findings.
3.6.2 Quantitative data analysis
When it comes to the analysis of the survey, we need to use quantitative data analysis tech-niques. This study uses SPSS 19.0 (statistical product and service solutions, computer soft-ware that provide statistic function and solution for service.) as the analysis tool. And SPSS is used for the purpose of Reliability analysis, descriptive analysis, correlation analysis and regression analysis. Related analysis method will be conducted as follow:
1. Reliability analysis
This study will use Cronbach’s Alpha to test the reliability, as it uses item analysis to under-stand the identity of the questions on survey. Reliability refers to the extent of the con-sistency in result from the repeatability of measurements; high reliability means high con-sistency, so checking the reliability between different variables is in the same way of check-

17
ing the survey’s internal consistency. And Cronbach’s Alpha<0.35 means low reliability, 0.35<Cronbach’s Alpha<0.7 means acceptable, if Cronbach’s Alpha>0.7, it shows high re-liability.
2. Descriptive analysis
Descriptive statistics will also be applied by means of calculating percentage, ratio or fre-quency, analyze the characteristics of basic demographic information based on statistics.
3. Correlation analysis
This study will use Spearman correlation analysis to test the extent to which different di-mensions in the model are related to each other. So the relationship between different di-mensions in the model will be tested.
4. Regression analysis
As we want to test hypothesis based on the factor we found, we need to use regression analysis to prove the relationship between dependent variable and independent variable, and in this study we will use multiple regression analysis, as we have designed several ques-tions towards one factor which means we have more than one independent variable to predict a single dependent variable, so here regression analysis will be applied to test differ-ent hypotheses.
3.7 Time horizon
It is very important to be concerned that the research is a “snapshot” or a “diary”. It in-volves two kinds of study cross-sectional studies and longitudinal studies. Cross-sectional is study a particular phenomenon at a particular time (Saunders et al., 2007). As the longitudi-nal is a long term study change and development. Relate to our study it is more appropriate to observe the long term perspective of ERP system acceptance change and development. However due to the time and resources limitation the authors choose to adopt cross-sectional study.
3.8 The credibility of data
This chapter will provide a reliability analysis of the result of this research that will be achieved later, 4 threats to reliability proposed by Robson (2002) will be discussed. Second-ly, the validity of this study has also been discussed, mainly focus on content validity and construct validity of this study.
3.8.1 Reliability
According to Saunders et al., (2007), reliability means the degree to which the data analysis procedures and data collection techniques will yield consistent results. And Robson (2002) also proposed four threats to reliability, thus below, we will analysis the reliability of our re-search according to those 4 threats:
a) Subject or participant error – it implies that participants may have different answers due to different times or occasions (Robson, 2002). In our study, we have this problem when we conducted the interview, as we interviewed with an ERP expert who has ob-jective perspectives and rational opinions on the subject of ERP acceptance, which will not be easily changed due to different time periods. However, for the survey we per-formed, we need to choose a “neutral” time to send the survey to avoid the participant
18
error (Robson, 2002). And our survey was sent to the users in particular company that has ERP system in the middle of a week (on Wednesday), so that employee’s answer will not largely affected by the specific time.
b) Subject or participant error – a threat indicates that some candidates may answer the question in the way their boss wanted them to say (Robson, 2002). Referring to our study, for interview as well as survey, this issue is not largely concerned, as our research aims to find problems when using the ERP system and the result would be helpful for those organizations who accept our survey or interview, so the candidates will be straightforward and honest to state the fact when answering the questions.
c) Observer error – observers in one research may have different ways to ask questions which may generate different answers (Robson, 2002). In our study, we discussed the interview questions with each other before we formalize a structured interview plan which both of us agrees with, so that the interview data could be more reliable.
d) Observer bias – reminds that there are different ways of interpreting the replies (Rob-son, 2002). However, as we have mentioned in the data analysis part, we will analysis and coding the empirical data individually as a group of two people, and finalize a seri-ous of themes that we all agree with, so in our research we are trying to eliminate this kind of threat to reliability of answers we obtained.
On the other hand, as this study will use UTAUT model to analysis the end-users’ ac-ceptance, therefore the construct of the UTAUT model need to be test based on the col-lected quantitative data from two companies, so that it is confirmed that the model is suit-able for those two companies’ user acceptance study. Cronbach’s Alpha will be applied to test the reliability of each variable inside the UTAUT model in order to know the reliability between them. The result will be shown in the quantitative analysis part.
3.8.2 Validity
Tis study need to answer two questions for validity: 1) does the scale this study used stands for all aspects of those two companies that have been investigated, 2) also does the scale this study used correlates with scientific construct that it aims to scale? Therefore, the con-tent validity and construct validity need to be discussed.
a). Content validity - as mentioned by Haynes, Richard & Kubany (1995), content validity is the extent to which facets of an assessment mechanism are related to, and stand for, the targeted construct for a particular assessment objective, in another word, it clarifies to what degree does the assessment mechanism represents all facets of the targeted construct. Therefore, in this study, the content validity will be to what degree the survey represents all facets of the end-user acceptance of ERP system. And the method this study use for meas-uring the content validity is the content validity ratio (CRV) which proposed by Lawshe (1975), as he had divided into 2 steps: 1) organize a judging panel that include several sub-ject matter experts raters (SMEs), and the judging panel will responds for answering the question to what extent the knowledge or skill measured by this item is essential to the per-formance of the construct? (Lawshe, 1975) 2) calculate the content validity ratio (CVR), Lawshe (1975) had developed a formula to calculate the CVR, CVR=( n_e- N/2)(N/2), in this formula, n_e stands for number of experts in judging panel who think the item is es-sential, whereas N stands for the total number of experts in judging panel. The range of the result of the formula will yields from -1 to 1, positive values implies that more than half of the experts in judging panel agreed the item is essential. According to Lawshe (1975), if more than half of the experts in the panel think that the item is essential, the item at least
19
have some content validity. And table 3-1 below shows the minimum result of the CVR to ensure the content validity.
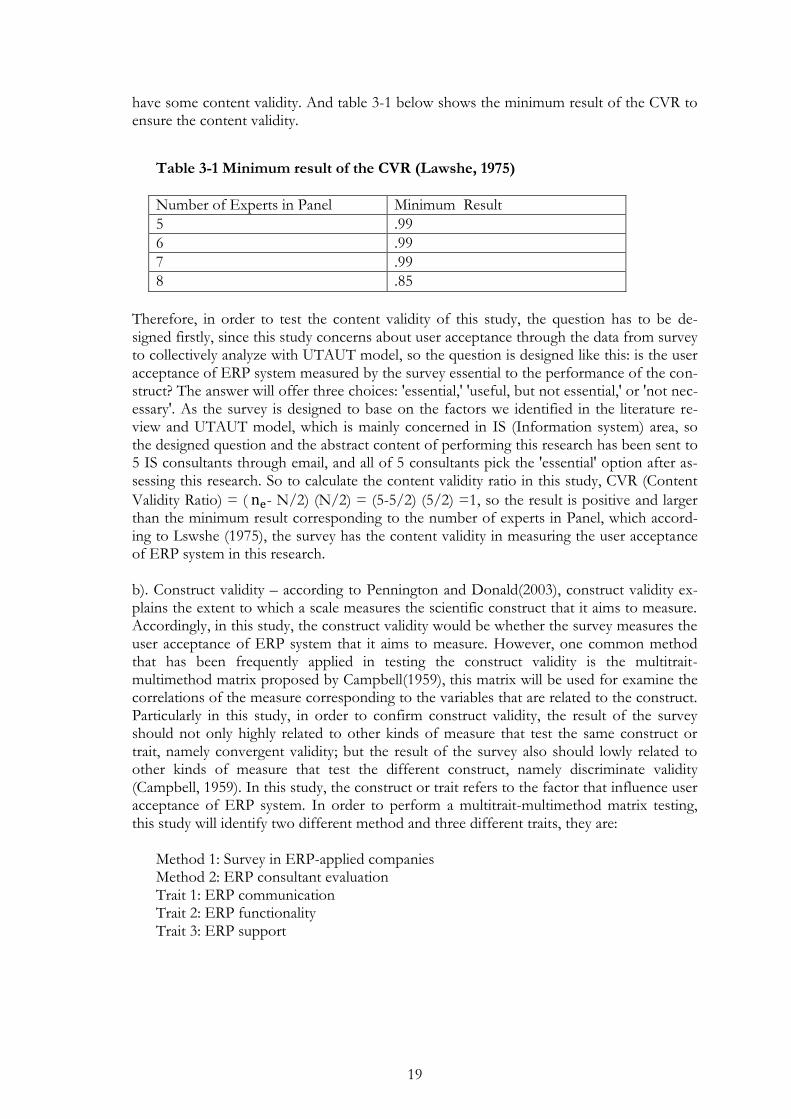
Table 3-1 Minimum result of the CVR (Lawshe, 1975)
Number of Experts in Panel Minimum Result
5 .99
6 .99
7 .99
8 .85
Therefore, in order to test the content validity of this study, the question has to be de-signed firstly, since this study concerns about user acceptance through the data from survey to collectively analyze with UTAUT model, so the question is designed like this: is the user acceptance of ERP system measured by the survey essential to the performance of the con-struct? The answer will offer three choices: 'essential,' 'useful, but not essential,' or 'not nec-essary'. As the survey is designed to base on the factors we identified in the literature re-view and UTAUT model, which is mainly concerned in IS (Information system) area, so the designed question and the abstract content of performing this research has been sent to 5 IS consultants through email, and all of 5 consultants pick the 'essential' option after as-sessing this research. So to calculate the content validity ratio in this study, CVR (Content
Validity Ratio) = ( - N/2) (N/2) = (5-5/2) (5/2) =1, so the result is positive and larger than the minimum result corresponding to the number of experts in Panel, which accord-ing to Lswshe (1975), the survey has the content validity in measuring the user acceptance of ERP system in this research. b). Construct validity – according to Pennington and Donald(2003), construct validity ex-plains the extent to which a scale measures the scientific construct that it aims to measure. Accordingly, in this study, the construct validity would be whether the survey measures the user acceptance of ERP system that it aims to measure. However, one common method that has been frequently applied in testing the construct validity is the multitrait-multimethod matrix proposed by Campbell(1959), this matrix will be used for examine the correlations of the measure corresponding to the variables that are related to the construct. Particularly in this study, in order to confirm construct validity, the result of the survey should not only highly related to other kinds of measure that test the same construct or trait, namely convergent validity; but the result of the survey also should lowly related to other kinds of measure that test the different construct, namely discriminate validity (Campbell, 1959). In this study, the construct or trait refers to the factor that influence user acceptance of ERP system. In order to perform a multitrait-multimethod matrix testing, this study will identify two different method and three different traits, they are:
Method 1: Survey in ERP-applied companies Method 2: ERP consultant evaluation Trait 1: ERP communication Trait 2: ERP functionality Trait 3: ERP support

20
And Table 3-2 shows the analysis of correlation of applying different method in differ-ent trait in the multitrait-multimethod matrix.
Table 3-2 Multitrait-multimethod matrix for construct validity testing
Method 1 Method 2
Method1 trait A1 B1 C1 A2 B2 C2
A1 (1)
B1 .444 (1)
C1 .369 .320 (1)
Method2 A2 [.613] .483 .488 (1)
B2 .399 [.732] .507 .585 (1)
C2 .409 .210 [.628] .457 .395 (1) ( ) includes the number which shows reliability [ ] includes the number which indicates convergent validity The rest indicates discriminate validity
The analysis of the table above divided into four steps: 1. Same method measuring same trait (reliability): {1,1,1,1,1,1} 2. Same method measuring different traits (discriminate validity):
{444, .369, .399, .409, .395, .457, .585 } 3. Different methods measuring same trait (convergent validity): {.613, .732, .628} 4. Different methods measuring different traits (discriminate validity):
{.409, .210, .399, .483, .488, .507}
To conclude, the convergent validity is high, which implies the results of the survey are highly related to other kinds of measure in testing the same construct or trait. Also the reli-ability is relatively high, while the discriminate validity is comparatively low, which means the result of the survey lowly related to other kinds of measure in testing different con-struct. Hence, this study fulfills the requirement of the construct validity when performing the survey to investigate the user acceptance of ERP system.
3.8.2.1 Generalizability
It refers as external validity. To be more specific it means your research findings can be equally applicable to other researches. In terms of our study, the two companies are not choosing randomly. Moreover the numbers of organizations we investigate also could not be generalized. With those reasons the results and research findings could not produce a theory that generalizes all the large companies’ ERP system users’ acceptance. However the high respondent of our research the result could represent all ERP users in the two com-panies. Besides if others companies have the similar situation with these two companies such as: the same population of ERP users, same information system structure, and the same computer facilities. This study could be applicable for them (Saunders et al., 2007). In conclusion, according the high rated response this study could provide generalizability to these chosen two companies.

21
4 Empirical Findings and Analysis
All the empirical findings from the interviews and questionnaires are presented and related to the theoretical framework.
4.1 Qualitative analysis
This chapter concludes how the quality data will be analysis. It contains analytical disposi-tion, analytical discussion and factor identification and hypotheses development.
4.1.1 Analytical disposition
The main purpose of this qualitative study is to support the design of questionnaires. Semi-structure interviews were conducted in two Chinese companies. Standing for two compa-nies’ perspectives on ERP system, the ERP experts have different opinions about the ERP acceptance. With the help of UTAUT model the authors developed interview questions and organized three categories: ERP basic information, ERP usage problems, ERP system acceptance. All the empirical findings in interviews were put it into those three sections. To make this analysis as structured as possible and to help the reader follow the argumentation. The analysis is based upon the empirical findings and relate to our theoretical framework.
4.1.2 Analytical discussion
In this part the finding from interviews has been generate into three aspects: ERP basic in-formation, ERP usage problems and ERP system acceptance.
4.1.2.1 ERP basic information
As the data the authors collected from the interview the two companies implement their ERP system in different situations. FiberHome Technologies Group implemented SAP system in 2002. ZHONGBAI holdings group used EFUT ERP system in 2005. According to Martin Folwer (2003), enterprise application software focuses on the systematic and co-ordination of the activities, decision-makings and knowledge among different functions, sectors and departments. In different situations companies implement different ERP mod-ule as well. However the major modules which have been implemented are the same. The authors summarized those modules in 5 categories: sales and distribution, materiel master data, production planning, business intelligence warehouse, and finance. Those five mod-ules take care of the companies’ daily business. In FiberHome Technologies Group each module has a business consultant to manage and the whole system is responsible to two or three ERP expert. As the ZHONGBAI holdings group their whole ERP system is out-sourced to EFUT Company. Moreover each department of the ERP system does not have any communications. Moreover both two companies do not provide ERP system training for the ERP users. The training problem belongs to these facilitating conditions. The feed-back of the ERP users is they think the ERP training is useful to help them to improve the ERP acceptance (Venkatesh et al. 2003).
4.1.2.2 ERP usage problems
Refers to the literature reviews many organizations have spent huge investment on ERP, implementation failures and less-than-satisfactory productivity improvements still exist (Davenport, 1998). Both two companies have implemented ERP system for several years and they experienced some usage problems. In recent years, a number of cases show that ERP system implementation have gone through considerable difficulties (Krasner, 2000;

22
Wah, 2000; Xue et al., 2005). Within all those barriers and technical problems, people have been mentioned as the main obstruction (Botta-Genoulaz & Millet, 2006).
The authors combined those problems which relate to the users’ acceptance in ERP system. 1. ERP system operation is not flexible enough, some rules of the system do not perfectly suit the daily business processes. This conflict belongs to the effort expectancy. It may cause conflicts during the daily business processes and may affect the users’ behaviors and attitude. 2. Due to the companies having already implemented the ERP systems several years ago, the system update is inevitable. In 2010 December ZHONGBAI holdings group a series problem caused by system updates; such as frequently error reports, information la-tency, information unloadable. Since a new system patch has been installed the new chang-es need to be distributed to all the ERP system users in order to avoid these kinds of prob-lems. It belongs to facilitating conditions and could also affect the user acceptance of ERP system (Venkatesh et al, 2003).
4.1.2.3 ERP system acceptance
In this context the ERP system acceptance means ERP exports’ opinions about the ERP system acceptance in two companies. As the previous literature reviews the acceptance can be viewed as user’s behaviors and attitudes (Venkatesh & Davis, 2000). The main purpose of the interview is to find out the factors which could affect users’ acceptance of the ERP system. In another word, the factors are affecting the users’ behaviors and the attitudes.
During the interviews some questions were mentioned about their view of the companies’ ERP system acceptance. The data is examined from a "bottom-up" approach. Therefore, we will conduct our qualitative analysis through 5 steps which is proposed by Mills (2006). The inter-rater reliability is used to get the reliability qualitative data. The main factors could be generated by using this method. 1. The user interface is friendly to the user. It be-longs to effort expectancy in UTAUT model. 2. The effectiveness of problem solving in ERP system. It belongs to performance expectancy in UTAUT model. 3. Specific the daily operations of ERP system. Those factors above were all mentioned in two interviews, and we should apply them in our questionnaires.
4.1.3 Factor identification and hypotheses development
According to the literature review and results from the interviews, we have identified those factors that may affect the end-user acceptance of ERP system during post-implementation phase (see in Appendix 2), they are:
Business process adoption (BPA)
ERP performance (ERPP)
ERP communication (ERPC)
Quality of data (QD)
ERP functionality (ERPF)
Computer nervousness (CN)
Technological innovation (TI)
Social impact and support (SIS)
ERP user manual (UM)
ERP training (ERPT)
ERP support (ERPS)
23
Besides these factors, there are six variables involved in UTAUT model. They are perfor-mance expectancy (PE), effort expectancy (EE), social influence (SI), facilitating conditions (FC), behavior intension (BI), and user behavior (UB).
To connectively analyze with the main dimensions and control variables of UTAUT model that we mentioned before in frame of reference, the authors have divided those factors into different categories based on the UTAUT model, figure 4-1 shows the factors we found that exist externally to the model.
With applying UTAUT model we incorporate four dimensions: performance expectancy, effort expectancy, social influence and facilitating conditions. Performance expectancy in-cludes: business process adoption, ERP performance, ERP communication. Effort expec-tancy includes: data quality, ERP functionality, computer nervousness and technological innovation. Social impact and support belongs to social influence. Facilitating conductions contains ERP user manuals, ERP training and ERP support.
Figure4-1 Factors divided into different categories according to UTAUT model
Based on the “new” model above, the authors developed these hypotheses, the first set of hypotheses are based on Performance Expectancy in the UTAUT model, according to Venkatesh et al. (2003), performance expectancy represents the extent of particular infor-mation technology that user think will increase their work performance. In this study, in-formation technology stands for ERP, and ERP system efficiently integrate business pro-cess. Thus performance expectancy here means the extent to which user feels that ERP system will increase their work efficiency. Therefore, the authors have categorized three different factors that may have positive effects on ERP performance expectancy:
H1a. Business process adoption positively affects ERP performance expectancy
H1b. ERP system performance positively affects ERP performance expectancy
H1c. ERP communication positively affects ERP performance expectancy
24
The second set of hypotheses is developed according to Effort Expectancy in the UTAUT model. Venkatesh et al. (2003) stated that effort expectancy stands for the extent to which the user think the system is easy to use. Several studies (Davis, 1993, Moon and Kim, 2001, Venkatesh et al, 2003) have found that if the information technology does not cost too much time and strength to learn it will give user positive thoughts on this kind of technol-ogy. So we categorized several factors that may positively affect ERP ease of use, and de-velop hypotheses about them.
H2a. Quality of data positively affects ERP effort expectancy
H2b. ERP functionality positively affects ERP effort expectancy
H2c. Computer nervousness negatively affects ERP effort expectancy
H2d. Technological innovation positively affects ERP effort expectancy
Venkatesh et al, (2003) also states that there are social influences in UTAUT model; it rep-resents the extent to which the system user is affected by the people around him. Related studies show that when one user feels that people they relate to think they should use a specific system, they are more willing to use that system (Agarwal and Prasad, 1997; Kana-hanna, Staub & Chevany, 1999; Venkatesh et al., 2003). Thus we development a hypothesis about social influence related to a factor we have concluded.
H3. Social impact and support positively affects ERP social influence
Facilitating conditions, according to Venkatesh et al. (2003), correspond to the extent that user feels the support from their organization in both technical and equipment perspectives. In other references it deals with technical support and other facilitating behavior that will support user when using ERP system. Therefore, we conclude three factors: ERP user manual, ERP training, ERP support to this dimension in UTAUT model. Moreover hy-potheses will be developed as follows:
H4a. ERP user manual positively affects ERP facilitating conditions
H4b. ERP training positively affects ERP facilitating conditions
H4c. ERP support positively affects ERP facilitating conditions
The last set of hypotheses were developed inside the original UTAUT model, based on the acceptance of ERP system use, different control variables affect different user intention or user behavior.
H5a. ERP performance expectancy affects behavioral intention
H5b. ERP effort expectancy affects behavioral intention
H5c. ERP social influence affects behavioral intention
H5d. ERP facilitating conditions affects user behavioral
H5e. Behavioral intention affects user behavioral
4.2 Quantitative analysis
Regarding the quantitative data collection, this study plans to survey 100 people in two companies. When the online survey closed, there were 81 respondents in total. The two

25
companies have approximately 100 ERP users. Based on the companies’ information, the ZHONGBAI holdings group involves 60 ERP users and FiberHome Technologies Group has 40 ERP users. After the discussion the total target population is 100. ZHONGBAI holdings group has 48 responses and FiberHome Technologies Group has 33 responses. Thus, this section the authors will perform the reliability analysis, statistical analysis, corre-lation analysis and regression analysis based on those 81 responses data that have been col-lected so far, and eventually conclude the factors that influence user’s acceptance of ERP system in those two companies.
4.2.1 Reliability analysis
As this research will use UTAUT model to analyze the end-users’ acceptance, therefore the reliability analysis need to be conducted to test construct on of the UTAUT model based on the collected quantitative data from two companies, and by assessing the degree of in-ternal consistency among the indicators inside the UTAUT model. This study can confirm whether the UTAUT model is suitable for those two companies’ user acceptance study. Consequently, Cronbach’s Alpha has been used to test the reliability of those indicators in order to know the reliability between them; the results are shown in Table 4-1. As Cronbach’s Alpha<0.35 means low reliability, 0.35<Cronbach’s Alpha<0.7 means accepta-ble, if Cronbach’s Alpha>0.7, it shows high reliability.
Table 4-1 Reliability Analysis (n=81)
Indicators in UTAUT construct Cronbach’s Alpha Number of Items
Performance Expectancy .908 8
Effort Expectancy .867 11
Social Influence .798 2
Facilitating Conditions .901 8
Behavior Intention .758 3
User Behavior .360 2
As shown in table 4-1, most of indicators in the UTAUT construct show good reliability as the Cronbach’s Alpha statistic for each of them is higher than 0.7, although one of the indicator--User Behavior’s statistic is lower than 0.7, but it is still between 0.35 and 0.7, which means it is still acceptable. Therefore there exists high internal consistency among different indicators in the UTAUT model, and construct of the UTAUT model is suitable for testing the user acceptance of ERP system in those two companies.
4.2.2 Descriptive analysis
In order to gain a richer understanding of the end-users’ acceptance of ERP system in those two Chinese companies, descriptive analysis is applied for the demographic infor-mation collected in the survey. Here this study will conduct a frequency statistics for the general information in the survey. As it is shown in figure 4-2, from the occupation per-spective, we can find out that most of the ERP end-users are employees in the company, plenty of the users are from the managerial level, few of the department leaders use ERP system.
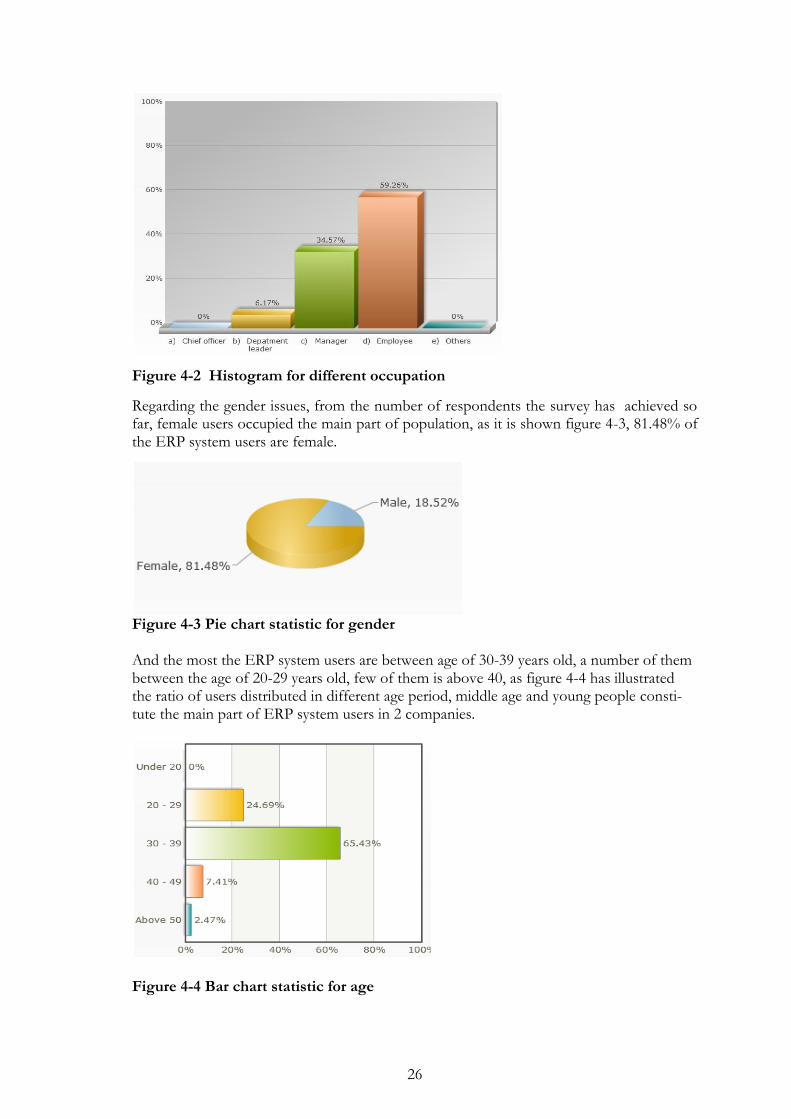
26
Figure 4-2 Histogram for different occupation
Regarding the gender issues, from the number of respondents the survey has achieved so far, female users occupied the main part of population, as it is shown figure 4-3, 81.48% of the ERP system users are female.
Figure 4-3 Pie chart statistic for gender And the most the ERP system users are between age of 30-39 years old, a number of them between the age of 20-29 years old, few of them is above 40, as figure 4-4 has illustrated the ratio of users distributed in different age period, middle age and young people consti-tute the main part of ERP system users in 2 companies.
Figure 4-4 Bar chart statistic for age

27
Besides, the study also made a frequency statistic about the duration of using ERP system among users, figure 4-5 presents a line chart for different durations of using the system.
Figure 4-5 Line chart for duration of using ERP system
In the figure, 61.7% among all users have been use the system for more than 3 years, 24.6% of them have used them for 1 to 3 years, rest of the users are new to their enterprise system, as they have only working with the system for a few months.
4.2.3 Correlation analysis
Besides the reliability analysis of the construct on the UTAUT model, this study also in-tends to discover whether there is a linear association between different indicators inside the model base on the 81 samples. Therefore, correlation coefficient needs to be calculated, and Spearman correlation analysis has been applied to test the extent to which different dimensions inside the model associate with each other.
Table 4-2 Spearman’s correlation analysis of the UTAUT model (n=81)
Performance Expectancy
Effort Ex-pectancy
Social Influence
Facilitating Conditions
Behavior Intentions
User Behavior
Performance Expectancy CC=1.00
Effort Ex-pectancy
CC=.753
Sig.=.000 CC=1.00
Social Influ-ence
CC=.441
Sig.=.000
CC=.513
Sig.=.000 CC=1.00
Facilitating Conditions
CC=.516
Sig.=.000
CC=.443
Sig.=.000
CC=.645
Sig.=.000 CC=1.00
Behavior In-tentions
CC=.214
Sig. =.055
CC=.286
Sig.=.010
CC=.180
Sig.=.107
CC=.154
Sig.=.170 CC=1.00
User Behav-ior
CC=.362
Sig.=.001
CC=.344
Sig.=.002
CC=.188
Sig.=.093
CC=.134
Sig.=.233
CC=.797
Sig.=.000 CC=1.00
28
Table 4-2 summarizes the results of Spearman correlation testing. According to Dowdy and Dowdy & Wearden (1983), in the result of Spearman correlation analysis, the P value namely the sig. between two variables should be no more than 0.005, otherwise, there is no correlation between two variables. After the P value has been confirmed, the relationship between two metric variables is preset, and regarding of the correlation coefficient (CC), positive value shows positive direction of the relationship, and the strength of the relation-ship is also determined by the size of the correlation coefficient. (Dowdy & Wearden 1983)
To summarize from the table 4-2:
1. Four dimensions in the UTAUT model: performance expectancy, effort expectancy, social influence, facilitating conditions are all correlated to each other in the environ-ment of 2 companies that has been investigated, as their p value is smaller than 0.05 and they have positive correlation coefficient.
2. Among those four dimensions mentioned above, the correlation coefficient between performance expectancy (PE) and effort expectancy (EE) is the highest, which means the relationship between those two variables is strong. On the other hand, performance expectancy (PE) and social influence (SI) are least correlated when comparing their cor-relation coefficient with others, which explains the weak relationship between those two variables.
3. Unfortunately, none of the four dimensions above correlate to behavior intention (BI), as their p value is all larger than 0.05. Also, there is no associate relation between facili-tating conditions(FC) and user behavior(UB), as p value for the relation is also bigger than 0.05.
So the correlation analysis has reach the conclusion that part of the UTAUT model are cor-related with each other based on the data analysis from 2 companies.
4.2.4 Regression analysis and hypotheses testing
According to Sykes (2000) regression analysis is a statistical tool for the investigation of re-lationships between variables. It is also a predictive analysis technique in which one or more variables are used to predict the level of another by use of the straight-line formula which includes two ways regression. The first is bivariate regression involves one predictor. The other one is multiple regressions involves two or more predictors. The model we cre-ated includes 11 first-order factors and four second-order factors (Appendix 3). For testing of factors existing outside of the UTAUT model, multiple regression analysis will be used. Moreover same method applied for test the relation between behavior intention and three independent dimensions in the UTAUT model. Regarding to the test of the relation be-tween user behavior and behavior intension, bivariate linear regression analysis will be used, same method will be used to test the relationship between facilitating conditions and use behavior as well.
4.2.4.1 Multiple regression analysis
Multiple regression as we mentioned before involves two or more predictors. To be more specific it is a technique that enables the external factors to enter the analysis individually so that the effect of each can be assessed (Connolly, 1991). The difference between multi-ple regression is uses more than one independent variables to predict a single dependent variable. In the table I there are 11 external factors connected with UTAUT model. Multi-ple regression is appropriate to deal with this situation.

29
By using multiple regression analysis to test 11 first-order factors, a diagram has been made to collect all the data which are important to the regression analysis (Appendix 3). There are 4 kinds of data. B is short for B coefficients. It tells you what is the increment in a de-pendent value for a change in a given independent value. Beta stands for standardized beta coefficient. It means that betas indicate the relative importance of alternative predictor var-iables. They are used to compare different B coefficients and see which has the greater im-pact on dependent value Y. In the ANOVA table, the data we focus on is "Sig." column. If the number (or numbers) found in this column is less than the critical value set by the ex-perimenter, then the effect is said to be significant. Since this value is usually set at .05, any value less than this will result in significant effects, while any value greater than this value will result in non-significant effects. The other data authors should focus on is the adjusted R square. It explains the percentages of the variability in dependent value Y. However we have a small data set, so the adjusted R square is more appropriate.
H1a. Business process adoption positively affects ERP performance expectancy
As the survey is designed, there are three independent variables corresponding to the de-pendent variable (business process adoption), they are position business process fit, posi-tion business process fit and fulfill business requirement. The B coefficients for each varia-ble are 0.131, 0.296 and 0.358. It means all variables are positive to the dependent variable (Performance Expectancy). By comparing the value of standardized beta coefficient the three variables’ impact sequence is fulfilling business requirement has greater impact than position business process fit. Business process fit is the weakest impact on dependent vari-able (Performance Expectancy). The business process adoption explains 29.4% variability in performance expectancy. The Sig. value is smaller than 0.05, so the model could signifi-cantly predict performance expectancy. Based on all the data we gained, the H1a is accept-ed.
H1b. ERP system performance positively affects ERP performance expectancy
As the survey is designed, there are two independent variables corresponding to the de-pendent variable (Performance Expectancy), they are position ERP performance data search and ERP performance data retrieve. The B coefficients for each variable are 0.207 and 0.445. It means all variables are positive to dependent variable (Performance Expec-tancy). By comparing the value of standardized beta coefficient, the two variables’ impact sequence is ERP performance data retrieve has greater impact than ERP performance data search. The ERP performance explains 43.4% variability in performance expectancy. The Sig. value is smaller than 0.05, so the model could significantly predicts performance expec-tancy. Based on all the data we gained (Appendix 3), the H1b is accepted.
H1c. ERP communication positively affects ERP performance expectancy
As the survey is designed, there are three independent variables corresponding to the de-pendent variable (Performance Expectancy), they are ERP project statues inform, position change inform and department change inform. The B coefficients for each variable are 0.175, 0.442 and 0.201. It means all variables are positive to dependent variable (Perfor-mance Expectancy). By comparing the value of standardized beta coefficient the three vari-ables’ impact sequence, position change informing has greater impact than department change informing. ERP project statuses informing is the weakest impact on dependent var-iable (Performance Expectancy). The ERP communication explains 30.4% variability in performance expectancy. The Sig. value is smaller than 0.05, so the model could signifi-

30
cantly predicts performance expectancy. Based on all the data we gained (Appendix 3), the H1c is accepted.
H2a. Quality of data positively affects ERP effort expectancy
As the survey is designed, there are four independent variables corresponding to the de-pendent variable (Effort Expectancy), they are ERP to provide accurate information, data fulfilling job, adequate data and ERP report to generate needs. The B coefficients for each variable are -0.225, 0.634, 0.378 and -0.141 (Appendix 3). It means all variables are positive to dependent variable (Effort Expectancy). ERP provide accurate information and ERP report generate needs are minus numbers which means the quality of data positively affects ERP effort expectancy is rejected. The H2a is rejected.
H2b. ERP functionality positively affects ERP effort expectancy
As the survey is designed, there are three independent variables corresponding to the de-pendent variable (Effort Expectancy), they are ERP functionality stable, ERP rapid re-sponse and ERP easy to use. The B coefficients for each variable are 0.113, 0.092 and 0.545. It means all variables are positive to dependent variables (Effort Expectancy). By compar-ing the value of standardized beta coefficient the three variables’ impact sequence result is ERP easy to use has greater impact than ERP functionality stable. ERP rapid response is the weakest impact on dependent variable (Effort Expectancy). ERP functionality explains 47.9% variability in effort expectancy. The Sig. value is smaller than 0.05, so the model could significantly predicts effort expectancy. Based on all the data we gained (Appendix 3), the H2b is accepted.
H2c. Computer nervousness negatively affects ERP effort expectancy
As the survey is designed, there are two independent variables corresponding to the de-pendent variable (Effort Expectancy), they are computer nervous and computer comfort. The B coefficients for each variable are 0.051 and 0.262. It means all variables are positive to dependent variable (Effort Expectancy). By comparing the value of standardized beta coefficient the two variables’ impact sequence result is computer comfort has greater im-pact than computer nervous. Computer nervousness explains 8.7% variability in effort ex-pectancy. The Sig. value is smaller than 0.05, so the model could significantly predicts ef-fort expectancy. Based on all the data we gained (Appendix 3), the H2c is accepted.
H2d. Technological innovation positively affects ERP effort expectancy
As the survey is designed, there are two independent variables corresponding to the de-pendent variable (Effort Expectancy), they are striving different ways in new IT and first to use new IT. The B coefficients for each variable are 0.351 and 0.030. It means all variables are positive to dependent variable (Effort Expectancy). By comparing the value of stand-ardized beta coefficient the two variables’ impact sequence result is striving different ways in new IT has greater impact than first to use new IT. Technological innovation explains 7.7% variability in effort expectancy. The Sig. value is smaller than 0.05, so the model could significantly predict effort expectancy. Based on all the data we gained (Appendix 3), the H2d is accepted.
H3. Social impact and support positively affects ERP social influence
As the survey is designed, there are two independent variables corresponding to the de-pendent variable (Social Influence), they are manager influence and working companions influence. The B coefficients for each variable are 0.311 and 0.643. It means all variables
31
are positive to dependent variable (Social Influence). By comparing the value of standard-ized beta coefficient, the two variables’ impact sequence, is working companions influence has greater impact than manager influence. Social impact and support explains 80.9% vari-ability in social influence. The Sig. value is smaller than 0.05, so the model could signifi-cantly predict social influence. Based on all the data we gained (Appendix 3), the H3 is ac-cepted.
H4a. ERP user manual positively affects ERP facilitating conditions
As the survey is designed, there are three independent variables corresponding to the de-pendent variable (Facilitating Conditions), they are user manuals context, user manuals cur-rent and user manuals complete. The B coefficients for each variable are 0.320, -0.197 and 0.154 (Appendix 3). The B coefficient of user manuals current is minus number. It means ERP user manual positively affects ERP facilitating conditions is rejected. The H4a is re-jected.
H4b. ERP training positively affects ERP facilitating conditions
As the survey is designed, there are three independent variables corresponding to the de-pendent variable (Facilitating Conditions), they are user training guide, user training useful and user training materials. The B coefficients for each variable are -0.02, 0.281 and -0.034 (Appendix 3). User training guide and user training materials are minus number. It means ERP training positively affects ERP facilitating conditions. H4b is rejected.
H4c. ERP support positively affects ERP facilitating conditions
As the survey is designed, there are two independent variables corresponding to the de-pendent variable (Facilitating Conditions), they are IT staff support and IT department support. The B coefficients for each variable are 0.137 and 0.392. It means all variables are positive to dependent variable (Facilitating Conditions). By comparing the value of stand-ardized beta coefficient the two variables’ impact sequence in IT department support has greater impact than IT staff support. ERP support and support explains 35.1% variability in facilitating conditions. The Sig. value is smaller than 0.05, so the model could significant-ly predicts facilitating conditions. Based on all the data we gained (Appendix 3), the H4c is accepted.
Table 4-3 Result of multiple regression analysis result
Hypothesis Result
H1a Business process adoption positively affects ERP performance ex-pectancy
Accepted
H1b ERP system performance positively affects ERP performance ex-pectancy
Accepted
H1c ERP communication positively affects ERP performance expectan-cy
Accepted
H2a Quality of data positively affects ERP effort expectancy Rejected
H2b ERP functionality positively affects ERP effort expectancy Accepted
H2c Computer nervousness negatively affects ERP effort expectancy Accepted

32
H2d Technological innovation positively affects ERP effort expectancy Accepted
H3 Social impact and support positively affects ERP social influence Accepted
H4a ERP user manual positively affects ERP facilitating conditions Rejected
H4b ERP training positively affects ERP facilitating conditions Rejected
H4c ERP support positively affects ERP facilitating conditions Accepted
This table above shows the result of multiple regression analysis result. H2a, H4a and H4b are rejected. And other hypotheses are accepted.
4.2.4.2 Bivariate linear regression analysis
In order to test the rest four hypotheses, the four dimensions in UTAUT model (PE, EE, FC and SI) relation to behavioral intension and use behavior will be analysis by using biva-riate linear regression analysis. The basic procedure could be determined into two aspects: used in regression analysis and guarantees that the “best” straight-line slope and intercept will be calculated (Wiley, 2003).
H5a. ERP performance expectancy affects behavioral intention
Based on the survey, the independent variable is performance expectancy which corre-sponded to the dependent variable (Behavior Intension). The B coefficient for perfor-mance expectancy is 0.222. The ERP performance expectancy is positive to behavioral in-tention. It explains 7.6% variability in dependent variable (Behavior Intension). The value of standardized beta coefficient is 0.295. The Sig. value is smaller than 0.05, so the model could significantly predict behavior intension. Based on all the data we gained (Appendix 3), the H5a is accepted.
H5b. ERP effort expectancy affects behavioral intention
Based on the survey, the independent variable is effort expectancy which corresponds to the dependent variable (Behavior Intension). The B coefficient for effort expectancy is 0.333. The ERP effort expectancy is positive to behavioral intention. It explains 13.5% var-iability in dependent variable (Behavior Intension). The value of standardized beta coeffi-cient is 0.382. The Sig. value is smaller than 0.05, so the model could significantly predict behavior intension. Based on all the data we gained (Appendix 3), the H5b is accepted.
H5c. ERP social influence affects behavioral intention
Based on the survey, the independent variable is social influence which corresponding to the dependent variable (Behavior Intension). The B coefficient for social influence is 0.238. The ERP social influence is positive to behavioral intention. It explains 3.8% variability in dependent variable (Behavior Intension). The value of standardized beta coefficient is 0.224. The Sig. value is smaller than 0.05, so the model could significantly predicts behavior intension. Based on all the data we gained (Appendix 3), the H5c is accepted.
H5d. ERP facilitating conditions affects user behavioral
Based on the survey, the independent variable is facilitating conditions which correspond to the dependent variable (User Behavioral). The B coefficient for facilitating conditions is 0.254. The ERP facilitating conditions is positive to user behavioral. It explains 4.1% varia-

33
bility in dependent variable (User Behavioral). The value of standardized beta coefficient is 0.230. The Sig. value is smaller than 0.05, so the model could significantly predict user be-havioral. Based on all the data we gained (Appendix 3), the H5d is accepted.
H5e. Behavioral intention affects user behavioral
Based on the survey, the independent variable is behavioral intention which corresponds to the dependent variable (User Behavioral). The B coefficient for behavioral intention is 0.831. The Behavioral intention is positive to user behavioral. It explains 76.3% variability in dependent variable (User Behavioral). The value of standardized beta coefficient is 0.875. The Sig. value is smaller than 0.05, so the model could significantly predicts user behavioral. Based on all the data we gained (Appendix 3), the H5e is accepted.
Table 4-4 Bivariate linear regression analysis result
Hypothesis Result
H5a ERP performance expectancy affects behavioral intention Accepted
H5b ERP effort expectancy affects behavioral intention Accepted
H5c ERP social influence affects behavioral intention Accepted
H5d ERP facilitating conditions affects user behavioral Accepted
H5e Behavioral intention affects user behavioral Accepted
The table below shows the bivariate linear regression analysis result. All the hypotheses for the bivariate linear regression analysis are accepted.
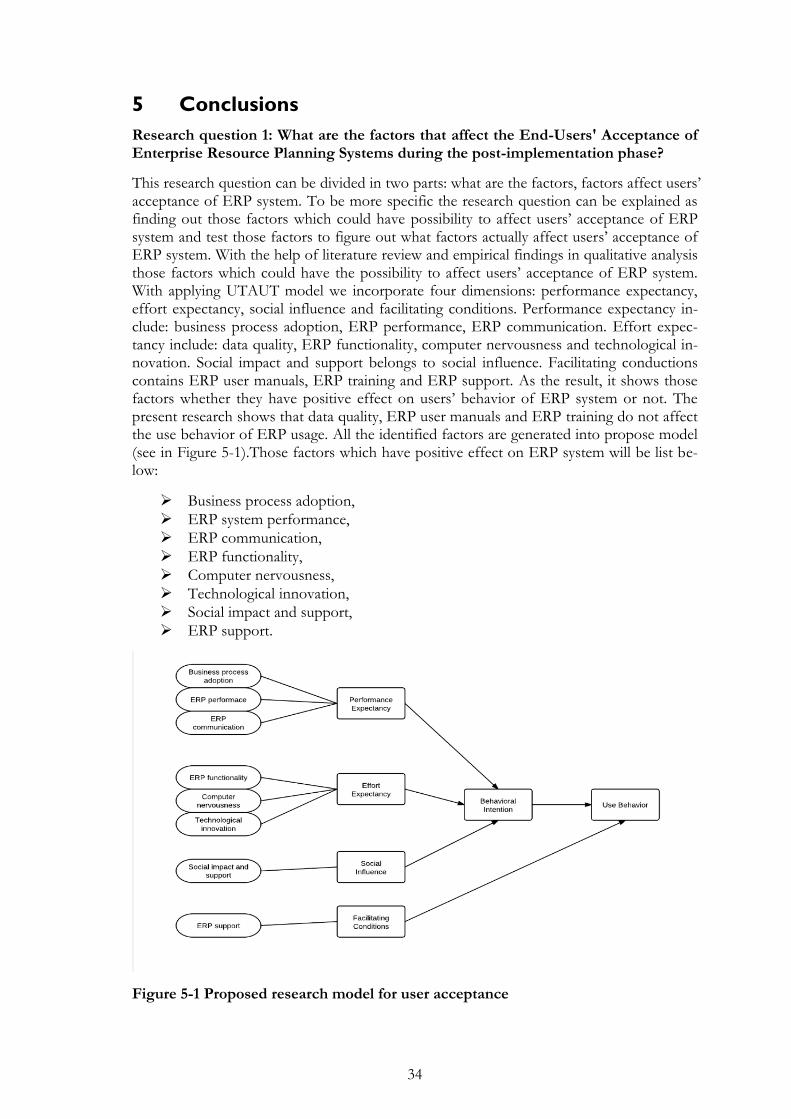
34
5 Conclusions
Research question 1: What are the factors that affect the End-Users' Acceptance of Enterprise Resource Planning Systems during the post-implementation phase?
This research question can be divided in two parts: what are the factors, factors affect users’ acceptance of ERP system. To be more specific the research question can be explained as finding out those factors which could have possibility to affect users’ acceptance of ERP system and test those factors to figure out what factors actually affect users’ acceptance of ERP system. With the help of literature review and empirical findings in qualitative analysis those factors which could have the possibility to affect users’ acceptance of ERP system. With applying UTAUT model we incorporate four dimensions: performance expectancy, effort expectancy, social influence and facilitating conditions. Performance expectancy in-clude: business process adoption, ERP performance, ERP communication. Effort expec-tancy include: data quality, ERP functionality, computer nervousness and technological in-novation. Social impact and support belongs to social influence. Facilitating conductions contains ERP user manuals, ERP training and ERP support. As the result, it shows those factors whether they have positive effect on users’ behavior of ERP system or not. The present research shows that data quality, ERP user manuals and ERP training do not affect the use behavior of ERP usage. All the identified factors are generated into propose model (see in Figure 5-1).Those factors which have positive effect on ERP system will be list be-low:
Business process adoption,
ERP system performance,
ERP communication,
ERP functionality,
Computer nervousness,
Technological innovation,
Social impact and support,
ERP support.
Figure 5-1 Proposed research model for user acceptance
35
Research question 2: How can the End-Users’ Acceptance of the Enterprise Re-source Planning system be improved?
However, after reaching those factors, this study also wants to explore the way to improve the user acceptance of ERP system. In order to do this, the concluded factors need to be ranked, and highly ranked factors need to pay attention in the company. By comparing the Beta value in the regression analysis in appendix 3, this study has conclude 3 factors that have larger influence on user acceptance of ERP system compare to other factors. They are: ERP functionality, Social impact and support, ERP support.
The result first implies that the users think the better system functionality would make us-ers more willing to use the ERP system in those two companies, based on the question-naire items, to improve the system functionality, the system should be flexible and easy to use, furthermore, the system should generate a rapid respond if there is a change in busi-ness process.
Besides ERP system functionality, ERP support is also an important indicator that the user will consider when they are using the ERP system. According to the interview with the ERP consultant in two companies, both of their systems will encounter system errors or bugs daily, and some of the problems can’t be solved in time, as one company only have 2 staff responds for the backup or system support. Therefore, both two companies need to pay attention to their ERP system support, perhaps an ERP system support department is needed to help the users to solve their problems in time.
Eventually, social impact and support also plays an important role to positively affect user acceptance of ERP system, managers or department leaders should encourage employees to learn to use the ERP system, and support employees’ decision when they want to learn to use ERP system. For some employees, the system may new to them, and hard to get fa-miliar in operating in practice. The decision made by higher-level or supports provided by superior will both influence the employees’ behavioral intention to use the system.
36
6 Discussion
This section will discuss the result of the study, the method of the study as well as the implication for the re-search and practice.
6.1 Discussion of the result
As the purpose of this study is to explore factors that influence end-user acceptance of ERP system, 11 factors that have been identified based on literature review and interview were shown in “factor identification and hypotheses development” part. Also in this part, 16 hypotheses have been developed based on 11 factors and UTAUT model, as the hy-potheses are concerning about the relationship between factors and UTAUT model, so the multiple regression analysis has been applied for hypotheses testing. Based on what shows in appendix 3, 13 hypotheses have accepted and 8 of those hypotheses were concerning about the factors, which means 8 factors have been tested that positively affecting the user acceptance of ERP system.
Based on the results shown in the conclusion part, when two companies apply ERP system among their employees, the adoption between business process and ERP system is an issue to pay attention to, as the adoption process can positively affect the usefulness of ERP sys-tem (H1a, H1b). The performance and communication of the ERP system can be im-proved for higher ERP performance expectancy (H1c). Besides, better functionality of the ERP system will positively influence ease of use of ERP system (H2b) whereas higher computer nervousness will be barrier for ease of use in ERP system (H2c). Furthermore, if employees are willing to try new technology, it will be easier for them to use the ERP sys-tem (H2d). Additionally, opinions or decisions from the superior have a positive effect on ERP system use (H3). Lastly, better ERP system support and IT assistance will lead to bet-ter ERP facilitating condition which offers a better environment for users to utilize the sys-tem (H4c).
Regarding the improvements suggestion for ERP system acceptance, Beta values in Ap-pendix 3 have been compared, the higher Beta value stands for greater impact in this rela-tionship, and among all 11 factors, 3 factors have been ranked as the “top 3” in Beta value, they are: ERP functionality, Social impact and support, ERP support. Those 3 factors should be pay attention to if enterprises want to improve the user acceptance of ERP sys-tem.
6.2 Discussion of the method
This study has applied both qualitative method and quantitative method to fulfill the pur-pose of research factors that influence user acceptance. From inductive way to deductive way, through literature review and interview, qualitative data were collected and analyzed for hypothesis development; through survey, quantitative data were collect to test the hy-potheses.
To review existing researches that aim to study user acceptance of ERP system, most of them utilizing TAM in their studies (Shih and Huang, 2009; Sun et al., 2009; Lee et al., 2010), but most of them utilized the familiar way of research, from inductive to deductive, almost all studies have hypotheses development and hypothesis testing.
Regarding the hypothesis testing, other studies have utilized the different method to test their hypotheses comparing with this study, Ching et al., (2008) has conduct a research to study the factors that influencing ERP performance from user perspective, in their study,

37
they use the correlation analysis and statistic data for hypotheses testing. And in our study, we use correlation analysis and statistic data for testing the construct of the UTAUT model and describe the general information of the samples. For the hypothesis testing in our study, we think regression analysis in SPSS can explain the relationship between the factors and the UTAUT model, but among all the hypotheses, there are also some of them repre-sent the relationship between variables inside the model, which we think a more model-oriented analysis tool is more suitable for those relationship analysis. So instead of SPSS, AMOS may be better software to analysis the relationships inside the UTAUT model, as AMOS is mainly applying for Structural Equation Modeling (SEM). Besides the way of hy-pothesis testing regarding the relationship inside the model, we think rest of the methods we applied in our research is suitable and reasonable.
6.3 Implications for research
The research indicates that multiple external factors can impact user behaviors about ERP system usage. Regarding this study an important contribution is identification of the external factors for the improvement of users’ acceptance of ERP system. Especially By comparing the results (see in Appendix 3) the ERP system functionality, social impact and support and ERP system support are significantly impacted on user behavior of ERP system. Another important contribution is this study proposes a new model based on the UTAUT model. This proposed model has a certain reference value in related studies. The most important implication is the identified external factors through UTAUT model appear to improve the ERP system usage.
6.4 Implications for practice
The most important implication of this study is when the organizations want to increase ERP user satisfaction those identified factors need to be considered. Concerned with those identified factors affect users’ acceptance of ERP system, the suggestion of the company are listed in follow sections.
1. Business process adoption,
This section refers to ERP system adoptions with users’ business requirements. Based on the research results it is positive affect the user acceptance. Regarding to the statistically result the satisfaction of department and personal requirement are well adapted. To be more specific, the satisfaction of personal requirement is not as high as other aspects. As the results the companies should focus more on personal business requirement. By changing the business process and make it more fixable for ERP system running.
2. ERP system performance,
Based on the research results it is positive affect the user acceptance. Regarding to the statistically result the satisfaction of ERP system performance is fine. However the data searching and data retrieve performance should be increased.
3. ERP communication,
Concerned with the companies’ situation, these two companies did not provide ERP communication between departments. In statistically results the ERP users think the ERP communication is important in daily working process. The suggestion is use the email system to exchange is ERP usage feedback.
38
4. ERP functionality,
There is only one problem in this section. The statistical results indicate that the system change respones is not satiated enough. This could be solve by optimizing business process or ERP system upgrading.
5. ERP training
According to the companies’ situation, both of them did not provide ERP training before the system implementing. Regarding to the statistically result the ERP training is also negative impact to the users’ acceptance. To be more specific, however, the statistically result about the ERP training usefulness is positive. It indicates that the ERP training is useful to the users’ perspective. As the consequence when the companies want to change or update ERP system, ERP training needs to be concerned with.
6.5 Research limitation and future research
Due to time and resources this research has limitations. In some aspects these limitation indicates the opportunities for further research. This research is limited to study in two Chinese companies. Relate to other studies social environments, languages, nations, cultures, politics are also need to be concerned when it comes to the study of users’ acceptance of ERP system. In-depth analysis of factors is also needed. The authors believe further research is needed and conclude in several aspects.
Increase the variables in UTAUT model.
The further research can introduce other factors in order to build more comprehensive study such as regions, cultures and nations. Moreover variables need be considered by size (large, medium, and small), market (local, international, joint venture, etc.) or other potentially difference. Those aspects list above will lead to another change.
Expand the research object.
In order to generlize this study, the survey should be conducted in many organizations. Those organizations need be consistent, for example all the organizations are large international companies and all of them are retail companies. As the consequences this study is more useful for other researchers and practitioners.

39
List of references
Adams, D. A; Nelson, R. R.; Todd, P. A. (1992), Perceived usefulness, ease of use, and usage of infor-mation technology: A replication, MIS Quarterly, 16, 227–247
Adamson, I., & Shine, J. (2003). Extending the new technology acceptance model to measure the end user information systems satisfaction in a mandatory environment: A BANK'S TREASURY. Technology analysis & Strategic Management, 15 (4). 441-455.
Agarwal, R. and Prasad, J. (1999), are individual differences germane to the acceptance of new infor-mation technologies, Decision Sciences, 30, 361-91
Agarwal, R. and Prasad, J. (1997), The role of Innovation Characteristics and Perceived Voluntariness in the Acceptance of Information Technologies, Decision Science, 28(3), 557-582.
Au, N., E. W. T. Ngai, et al. (2008). Extending the Understanding of End User Information Systems Satisfaction Formation: An Equitable Needs Fulfillment Model Approach. MIS Quarterly 32 (1): 43-66
Baker, T., & Frolick,M.N (2003). ERP implementation failure: A case study. Information Systems Manage-ment, 20(4), 43-49
Bagozzi, R.P. (2007), the legacy of the technology acceptance model and a proposal for a paradigm shift, Journal of the Association for Information Systems 8(4), 244–254.
Bhattacherjee, A. (2001). Understanding information systems continuance: an expectation-confirmation model. MIS Quarterly 25(3), 351-370.
Brown, S., Massey, A., Montoya-Weiss, M., & Burkman, J. (2002). Do I really have to? User acceptance of mandated technology. European Jr. of IS. 1. 283-295
Boudreau, M.C. (2002). Learning to use ERP technology: a causal model, Retrieved 2012-05-02, from http://csdl2.computer.org/comp/proceedings/hicss/2003/1874/08/187480235b.pdf
Bobek, S. and Sternad, S. (Eds.). (2010), Management of ERP solutions, in Vaish, A., Recent Advances in Management and Information Security, Shree Publishers and Distributors, New Delhi, 31-47.
Botta-Genoulaz, V. & Millet, P.A. (2006). “An Investigation into the Use of ERP Systems in the Service Sector, International Journal of Production Economics. 99. 202-221.
Campbell, D. T. (1959). Convergent and discriminant validation by the multitrait-multimethod matrix. Psychological Bulletin. 81–105.
Ching-Chien, Yang; Ping-Ho, Ting; Chun-Chung Wei (2006), Journal of American Academy of Business, Cambridge; 8(2).161
Collis, J. & Hussey, R. (2003). Business Research: A practical guide for undergraduate and postgraduate students. Basingstoke: Palgrave Macmillan.
Creswell, J. (2005). Educational research: Planning, conducting, and evaluating quantitative and qualita-tive research.
Davenport, T.H. (1998). Putting the enterprise into the enterprise system. Harvard Business Review, 76(4), 121-131.
Davis, F.D., (1993). User acceptance of information technology: system characteristics, user perceptions, and behavior impacts. International Journal of Man Machine Studies, 38(3), 475-487.
Davis, F.D., (1989). Perceived usefulness,perceived ease of use,and user acceptance of information technology[J]. MIS Quarterly. (13). 319-340
DeLone, W. H. and E. R. McLean (1992). Information Systems Success: The Quest for the Dependent Variable. Information Systems Research, 3(1), 60-95.

40
Dowdy, S. and Wearden, S. (Eds.). (1983). Statistics for Research, Wiley. ISBN 0-471-08602-9 pp. 230
Fishbein, M. & Ajzen, I. (Eds). (1975). Belief, attitude, intention, and behavior: An introduction to theory and re-search. MA: Addison-Wesley.
Gattiker, T.F. and Goodhue, D.L. (2005), what happens after ERP implementation: understanding the impact of interdependence and differentiation on plant-level outcomes, MIS Quarterly, 29 (3). 559-585.
Ghauri, P. N., & Grönhaug, N. (Eds.). (2005). Research Methods in Business Studies: A Practical Guide. Lon-don: Pearson
Gattiker, T.F., CFPIM (2002), Anatomy of an ERP implementation gone away, Production & Inventory Management Journal, 43. 96-105.
Hartiwick, J., & Barki, H. (1994). Explaining the role of user participation in information system use. Management Science, 40(4), 440-464
Hendrickson, A. R.; Massey, P. D.; Cronan, T. P. (1993), On the test-retest reliability of perceived use-fulness and perceived ease of use scales, MIS Quarterly, 17: 227–230
Holland, C. P., & LighT, B. (1999). A critical success factors model for ERP implementation, IEEE Software. 16(3). 30-36
Huser, V.; Narus, S. P.; Rocha, R. A. (2010). Evaluation of a flowchart-based EHR query system: A case study of Retro Guide. Journal of Biomedical Informatics, 43(1): 41–50.
Kanahanna, E., Staub, D. W., & Chevany, N. L.(1999). Information technology adoption across time: A cross-sectional comparison of pre-adoption and post adoption beliefs, MIS Quarterly, 23 (2), 193-213
Kahn, R. L., & Cannell, C. F. (1957). The Dynamics of Interviewing: Theory, Technique and Cases. New York: Wiley.
Kale,V. (Eds.). (2000), Implementing SAP R/3: The Guide for Business and Technology Manager. SAMS Publish-ing, Indianapolis.
Kelley, H. (2001), Attritional analysis of computer self-efficacy, doctoral dissertation, Richard Ivey School of Business, University of Western Ontario, London.
Krasner, H. (2000). Ensuring e-business success by learning from ERP failures. IT Professional, 2 (1), 22-27.
Kwahk, K.Y., Lee, J.N. (2008). The role of readiness for change in ERP implementation: theoretical ba-ses and empirical validation, Information & Management, Vol. 45 (7), 474-81.
Lawshe, C.H. (1975), A quantitative approach to content validity, Personnel Psychology, 28, .563-575.
Lee, D.H., Lee, S.M., Olson, D.L., Chung, S.H. (2010). The effect of organizational support on ERP implementation, Industrial Management & Data Systems. 110 (1/2). 269-283.
Legris,P., Ingham,J.,&Collerette,P.(2003). Why do people use information technology? A critical review of the technology acceptance model. Information& Management, 40(3), 191-204
Markus, M. L. and C. Tanis. (Eds.). (2000). the enterprise systems experience-from adoption to success. Framing the Domains of IT Management: Projecting the Future through the Past. R. W. Zmud, Pinnaflex Education Resources, Inc.: 173-207.
Martin Fowler. (Eds.). (2002). Patterns of Enterprise Application Architecture. Addison Wesley
Morris,C. (Eds.). (2003), Quantitative Approaches in Business Studies, Harlow, Financial Times Prentice Hall.
Motlwalla Luvai F., and Jeff Thompson, (Eds.). (2009). Enterprise Systems for Management, Upper Saddle River, NJ 07458.
41
Moon, J.W., Kim, Y.G., (2001). Extending the TAM for a world-wide-web context. Information and Man-agement, 38(4), 217-230
Mills, G. E. (Eds.). (2006) Action Research: A Guide for the Teacher Researcher, Pearson Education
Nah, F.F., Tan, X. and Teh, S.H. (2004). An empirical investigation on end-users’ acceptance of enter-prise systems, Information Resources Management Journal, 17 (3), 32-53
Pennington, Donald. (Eds.). (2003). Essential Personality. Arnold, p.37.ISBN 0340761180.
Rawstone, P., Jayasuriya, R., & Caputi, P. (1998). An integrative model of information systems use in mandatory environment. Paper presented at the International Conference on Information Systems, Helsinki, Finland.
Rashid, M., Hossain, L., & Patrick, J. D. (Eds.). (2002). the evolution of ERP systems: A historical perspective." Enterprise resource planning solutions and management. Hershey: IRM Press.
Ramdani, B., Kawalek, P., Lorenzo, O., (2009) “Predicting SMEs’ adoption of enterprise system”, Jour-nal of Enterprise Information Management 22(1/2), 10-24.
Robey, D., Ross, J., and Boudreau. (2002). M. Learning to Implement Enterprise Systems: an Explorato-ry Study of the Dialectics of Change, Journal of Management Information Systems, 19(1), 17-46.
Robson, C. (Eds.). (2002). Real World Research, Oxford, Blackwell.
Rogers, E.M. (2003). Diffusion of innovations (7th ed.). New York: The free press.
Ross, J. W. and M. R. Vitale (2000). The ERP Revolution: Surviving vs. Thriving. Information Systems Frontiers 2(2): 233-241.
Shang, S., & Seddon, P.B. (2000). A comprehensive framework for classifying the benefits of ERP sys-tems. Paper presented at the Americas Conference on Information System, Long Beach, CA.
Shih, Y.Y. and Huang, S.S. (2009), “The actual usage of ERP systems: an extended technology ac-ceptance perspective”, Journal of Research and Practice in Information Technology, 41(3). 263-76.
Saunders, M., Lewis, P. and Thornhill A. (2007) Research Methods for Business Students, Formulating the Research Design 5, 139-40.
Seber George A.F and Lee Alan J. (Eds.). (2003). Linear Regression Analysis. John Wiley & Sons, Inc., Ho-bokem, New Jersey.
Subramanian, G. H. (1994), "A replication of perceived usefulness and perceived ease of use measure-ment", Decision Sciences. 25(5/6). 863–873
Sue, A.H., Mark L.L.H., Cynthia, A. L.H., (2003). Pre-implementation attitudes and organizational read-iness for implement ERP. European Journal of Operational Research, 258-273
Sun, Y., Bhattacherjee, A., Ma, Q. (2009), Extending technology usage to work settings: the role of per-ceived work compatibility in ERP implementation, Information & Management, 46.351-6.
Shanks, G. (2000). A model of ERP project implementation. Journal of Information Technology (Routledge, Ltd.), 15(4), 289-303.
Venkatesh, V. and Bala, H.(2008). Adoption and Impacts of Interorganizational Business Process Standards: The Role of Partnering Synergy, Information Systems Research.
Venkatesh, V., & Davis, F.D (2000). A theoretical extension of the Technology Acceptance Model: Four longitudinal field studies. Management Science, 46(2), 186-204
Venkatesh, V.; Morris, M. G.; Davis, G. B.; Davis, F. D. (2003), User acceptance of information tech-nology: Toward a unified view, MIS Quarterly 27(3), 425–478
Wah, L. (2000). Give ERP a chance. Management Review, 89(3), 20-24.

42
Waartsa, E., Everdingen, Y.M., and Hillegersber, J. (2002). The dynamics of factors affecting the adop-tion of innovations. The Journal of Product Innovation Management, 19,412-423
Wylie. L. (1990). A Vision of Next Generation MRP II, Scenario S-300-339, Gartner Group
Willis, T.H., Willis-Brown, A.H. (2002), Extending the value of ERP, Industrial Management & Data Sys-tems. 102(1). 35-38
Walker, R., Cooke, M. & McAllister, M. (2008). A Neophyte’s journey through qualitative analysis using Mors’s cognitive processes of analysis. International Journal of Qualitative Methods, 7(1), 81-93.
Xue, Y. J., Liang, H. G., Boultion, W. R & Snyder, C.A. (2004). ERP implementation failures in China: Case studies with implications for ERP vendors. Production Economics. 97. 279-295.
Yu, C.S. (2005), "Causes influencing the effectiveness of the post-implementation ERP system", Industri-al Management & Data Systems, Vol. 105 No.1/2, pp.115-32.
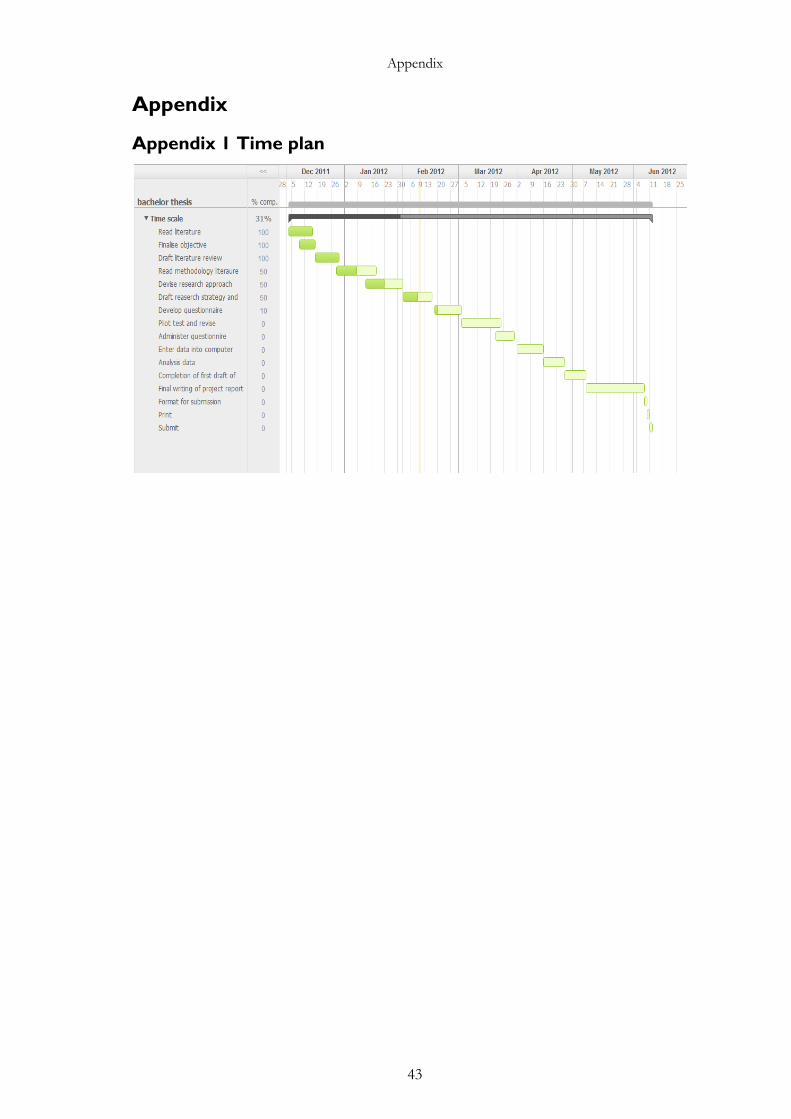
Appendix
43
Appendix
Appendix 1 Time plan

Appendix
44
Appendix 2 Table of identified factors
Factors Authors Description Lifecycle phase
ERP training Bobek and Sternad (2010), Bradley and Lee (2007)
ERP training is the extent to which that user think they have received sufficient formal training after the implementation of ERP
Post-implementation
Quality of data Venkatesh (2000), Insiti (2007), Gat-tiker and Goodhue (2005)
Data should be ac-curate and relevant, and it can benefit task efficiency in the ERP system context
Post-implementation
Readiness for change
Shivers-Blackwell and Charles (2006)
Readiness for change on behavior intention during ERP implementa-tion
implementation
ERP performance Venkatesh (2003), Kositanurit et al. (2006), Boudreau (2002), Liu and Ma (2006)
ERP performance is the extent to which a person believes that a system is consistent and all the related task are well performed
Post-implementation
ERP functionality Interview
Kositanurit et al. (2006)
System functions are flexible and sta-ble, can response to rapid changes
Post-implementation
System quality Uzoka et al. (2008) To select ERP sys-tem by applying TAM using: system quality, support quality and infor-mation quality
Selection
ERP user manual Interview Understandable manual and updated manual is needed for ERP users
Post-implementation

Appendix
45
ERP communica-tion
Amoako-Gyampah and Salam (2004), Bobek and Sternad
(2010),Musaji (2002)
Lack of communi-cation when there are changes in dif-ferent department regarding the ERP system
Post-implementation
Computer nervous-ness
Thompson et al. (2006), Calisir et al. (2009), Daviset al. (1989)
The experience of using computer will influence the ac-ceptance of infor-mation system
Post-implementation
Social impact and support
Calisir et al. (2009), Venkatesh et al. (2003), Bradford (2008)
Including social fac-tors and subjective norms
Post-implementation
Training satisfaction Bradley and Lee (2007)
Training satisfaction is related to per-ceived ease of use, perceived useful-ness
Implementation
Technological in-novation
Thompson et al. (2006), Rogers (2003)
Stands for to what extant a person is willing to try new Information Tech-nology
Post-implementation
Business process adoption
Bradley and Lee (2007), Bobek and Sternad (2010), Nah et al. (2004),
The system can ful-fill user’s working needs as well as his or her organization needs, well adopted between business process and users opinions
Post-implementation
ERP support Lee et al. (2010) ERP support is the extent to which an individual receives enough support from IT department
Post-implementation
Table of factors identified by authors and interviewees

Appendix
46
Appendix 3 Regression statistic for variables
Construct (hypothesis)
Code
B
Bata
Adjusted R
Square
Sig.
Performance Expectancy PE
(H1a)
The ERP system adapts well with my positions’ business requirement
BPA1 .131 .093 .294 .000
The ERP system adapts well with my departments’ business requirement
BPA2 .296 .225
All part of the ERP system is acceptable in fulfilling my requirement
BPA3 .358 .345
(H1b)
ERP system makes it faster to search data ERPP1 .207 .218 .434 .000
ERP system makes it faster to retrieve data ERPP2 .445 .475
(H1c)
I have always been informed about the status of the ERP project in my company
ERPC1 .175 .145 .330 .000
I am aware of the changes that will happen in my position brought by the ERP project
ERPC2 .442 .335
I am aware of the changes that will happen in my department brought by the ERP project
ERPC3 .201 .155
Effort Expectancy EE
(H2a)
I can receive accurate information provides by ERP system
QD1 -.255 -.267 .447 .000
The data and information provides by ERP system fulfill my requirement in my job
QD2 .634 .646
I receive adequate data with complete features QD3 .378 .403
The reports generated by the ERP system precisely meet my needs.
QD4 -.141 -.154
(H2b)
I think the ERP system in our company is function-ally well and stable.
ERPF1 .113 .126 .479 .000

Appendix
47
ERP system in my company can generate a rapid response if there is a change in business process.
ERPF2 .092 .096
I think ERP system is easy to use and its functions are flexible.
ERPF3 .545 .569
(H2c)
I am nervous when I working with computer CN1 .051 .064 .087 .011
I feel comfortable to work with computer CN2 .262 .323
(H2d)
If I hear about a new appeared IT, I will strive to try it in different ways
TI1 .351 .293 .077 .017
Among my working companions, I am always the first to try out new IT
TI2 .030 .028
Social Influence SI
H3
I have support from my manager on the use of ERP system for my job
SIS1 .311 .331 .809 .000
People who are important to me think that I should use ERP system
SIS2 .643 .647
Facilitating Conditionals FC
(H4a)
The context and index of the user manuals are use-ful
UM1 .320 .385 .108 .008
The user manuals are current (up to date) UM2 -.197 -.237
The user manuals are complete UM3 .154 .203
(H4b)
An ERP training program is available with predict-able results that follow the training guides and show examples.
ERPT1 -.002 -.002 .097 .013
User training is helpful to use ERP system. ERPT2 .281 .394
ERP training has good training materials. ERPT3 -.034 -.046
(H4c)
IT staff will help when I met system problems
ERPS1 .137 .175 .351 .000
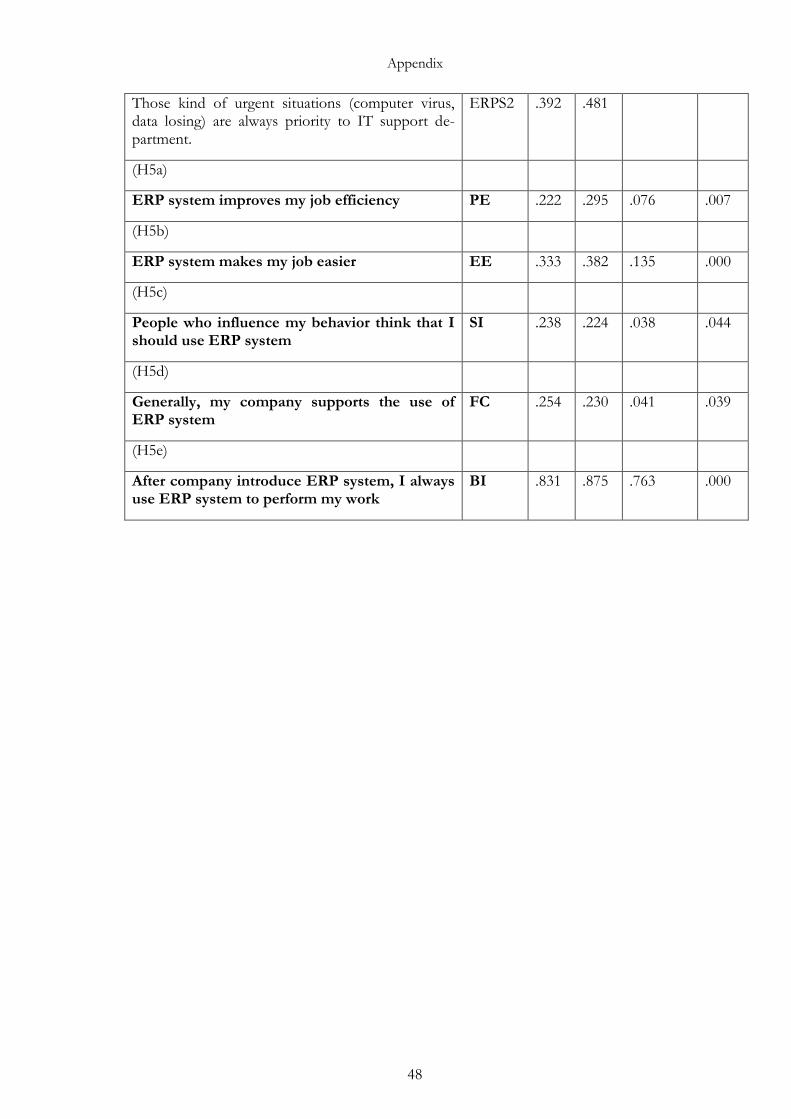
Appendix
48
Those kind of urgent situations (computer virus, data losing) are always priority to IT support de-partment.
ERPS2 .392 .481
(H5a)
ERP system improves my job efficiency PE .222 .295 .076 .007
(H5b)
ERP system makes my job easier EE .333 .382 .135 .000
(H5c)
People who influence my behavior think that I should use ERP system
SI .238 .224 .038 .044
(H5d)
Generally, my company supports the use of ERP system
FC .254 .230 .041 .039
(H5e)
After company introduce ERP system, I always use ERP system to perform my work
BI .831 .875 .763 .000
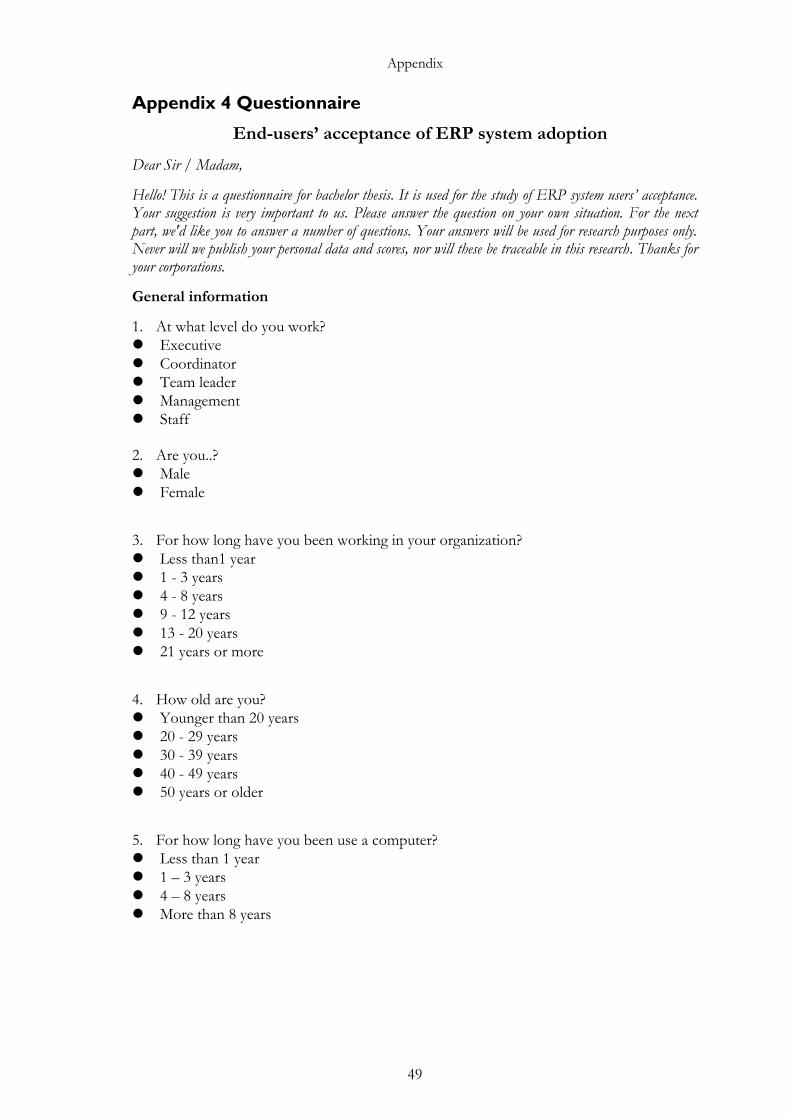
Appendix
49
Appendix 4 Questionnaire
End-users’ acceptance of ERP system adoption
Dear Sir / Madam,
Hello! This is a questionnaire for bachelor thesis. It is used for the study of ERP system users’ acceptance. Your suggestion is very important to us. Please answer the question on your own situation. For the next part, we'd like you to answer a number of questions. Your answers will be used for research purposes only. Never will we publish your personal data and scores, nor will these be traceable in this research. Thanks for your corporations.
General information
1. At what level do you work?
Executive
Coordinator
Team leader
Management
Staff
2. Are you..?
Male
Female
3. For how long have you been working in your organization?
Less than1 year
1 - 3 years
4 - 8 years
9 - 12 years
13 - 20 years
21 years or more
4. How old are you?
Younger than 20 years
20 - 29 years
30 - 39 years
40 - 49 years
50 years or older
5. For how long have you been use a computer?
Less than 1 year
1 – 3 years
4 – 8 years
More than 8 years

Appendix
50
6. For how long have you been use ERP (Enterprise Resource Planning) system? Less than 3 months
3– 6 months
7 – 11 months
1 – 3 years
More than 3 years
The questions below refer to factors influencing your acceptance of ERP system.
Please indicate to the amount of agreement with the statement mentioned.
Performance expectancy:
1. Business process adaption The ERP system adapts well with my positions’ business requirement
Strongly disagree
1
2
3
4
5
6
7
Strongly agree
The ERP system adapts well with my departments’ business requirement
Strongly disagree
1
2
3
4
5
6
7
Strongly agree
All part of the ERP system is acceptable in fulfilling my requirement
Strongly disagree
1
2
3
4
5
6
7
Strongly agree
2. ERP performance ERP system makes it faster to search data
Strongly disagree
1
2
3
4
5
6
7
Strongly agree
ERP system makes it faster to retrieve data
Strongly disagree
1
2
3
4
5
6
7
Strongly agree
ERP system improves my job efficiency
Strongly disagree
1
2
3
4
5
6
7
Strongly agree
ERP system makes my job easier
Strongly disagree
1
2
3
4
5
6
7
Strongly agree
3. ERP communication I have always been informed about the status of the ERP project in my company
Strongly disagree
1
2
3
4
5
6
7
Strongly agree

Appendix
51
I am aware of the changes that will happen in my position brought by the ERP project
Strongly disagree
1
2
3
4
5
6
7
Strongly agree
I am aware of the changes that will happen in my department brought by the ERP project
Strongly disagree
1
2
3
4
5
6
7
Strongly agree
Effort expectancy:
1. Quality of data I can receive accurate information provides by ERP system
Strongly disagree
1
2
3
4
5
6
7
Strongly agree
The data and information provides by ERP system fulfill my requirement in my job
Strongly disagree
1
2
3
4
5
6
7
Strongly agree
I receive adequate data with complete features
Strongly disagree
1
2
3
4
5
6
7
Strongly agree
The reports generated by the ERP system precisely meet my needs.
Strongly disagree
1
2
3
4
5
6
7
Strongly agree
2. ERP functionality I think the ERP system in our company is functionally well and stable.
Strongly disagree
1
2
3
4
5
6
7
Strongly agree
ERP system in my company can generate a rapid response if there is a change in business process.
Strongly disagree
1
2
3
4
5
6
7
Strongly agree
I think ERP system is easy to use and its functions are flexible.
Strongly disagree
1
2
3
4
5
6
7
Strongly agree
3. Computer anxiety I am nervous when I working with computer
Strongly disagree
1
2
3
4
5
6
7
Strongly agree

Appendix
52
I feel comfortable to work with computer
Strongly disagree
1
2
3
4
5
6
7
Strongly agree
4. Technological innovation If I hear about a new appeared IT, I will strive to try it in different ways.
Strongly disagree
1
2
3
4
5
6
7
Strongly agree
Among my working companions, I am always the first to try out new IT
Strongly disagree
1
2
3
4
5
6
7
Strongly agree
I always like to try the new appeared IT.
Strongly disagree
1
2
3
4
5
6
7
Strongly agree
Social influence
Social impact and support I have support from my manager on the use of ERP system for my job
Strongly disagree
1
2
3
4
5
6
7
Strongly agree
People who influence my behavior think that I should use ERP system
Strongly disagree
1
2
3
4
5
6
7
Strongly agree
Generally, my company supports the use of ERP system
Strongly disagree
1
2
3
4
5
6
7
Strongly agree
Facilitating conduction
1. User manuals
The context and index of the user manuals are useful
Strongly disagree
1
2
3
4
5
6
7
Strongly agree
The user manuals are current (up to date)
Strongly disagree
1
2
3
4
5
6
7
Strongly agree
The user manuals are complete
Strongly disagree
1
2
3
4
5
6
7
Strongly agree

Appendix
53
2. ERP training
An ERP training program is available with predictable results that follow the training guides and show examples.
Strongly disagree
1
2
3
4
5
6
7
Strongly agree
User training is helpful to use ERP system.
Strongly disagree
1
2
3
4
5
6
7
Strongly agree
ERP training has good training materials.
Strongly disagree
1
2
3
4
5
6
7
Strongly agree
3. ERP support
IT staff will help when I met system problems
Strongly disagree
1
2
3
4
5
6
7
Strongly agree
Those kind of urgent situations (computer virus, data losing) are always priority to IT sup-port department.
Strongly disagree
1
2
3
4
5
6
7
Strongly agree
User behavior
After company introduces ERP system, I always want to use this system.
Strongly disagree
1
2
3
4
5
6
7
Strongly agree
Behavior Intention
I plan to use ERP system in the future.
Strongly disagree
1
2
3
4
5
6
7
Strongly agree