erisc phase ii - united nations environment … capital management (marieke de leede and hans...
TRANSCRIPT

Un
it
ed
n
at
io
ns
e
nv
ir
on
me
nt
P
ro
gr
am
me
ERISC: Environmental Risk Integration in Sovereign Credit Analysis
ERISC PHASE II: HOW FOOD PRICES LINK
ENVIRONMENTAL CONSTRAINTS TO SOVEREIGN CREDIT RISK

Copyright © United Nations Environment Programme, May 2016
This publication may be reproduced in whole or in part and in any form for educational or non-profit purposes without special permission from the copyright holder, provided acknowledgement of the source is made. UNEP would appreciate receiving a copy of any publication that uses this publication as a source.
No use of this publication may be made for resale or for any other commercial purpose whatsoever without prior permission in writing from the United Nations Environment Programme.
DisclaimerThe designations employed and the presentation of the material in this publication do not imply the expression of any opinion whatsoever on the part of the United Nations Environment Programme concerning the legal status of any country, territory, city or area or of its authorities, or concerning delimitation of its frontiers or boundaries. Moreover, the views expressed do not necessarily represent the decision or the stated policy of the United Nations Environment Programme, nor does citing of trade names or commercial processes constitute endorsement.
UNEP promotes environ-
mentally sound practices globally and in its own activities.
This publication is printed on 100% recycled paper, using vegetable-based inks and other eco-friendly practices. Our distribution policy aims to reduce
UNEP’s carbon footprint.
ACKNOWLEDGEMENTS
UNEP Finance Initiative and Global Footprint Network would like to thank all the contributors to the development of the ERISC project. We especially thank the financial institutions for input, suggestions, guidance and funding for this phase of the project.
Caisse des Dépôts et Consignations (Héléna Charrier and Pascal Coret)
KfW (Christina Hack and Thomas Linne)
Kempen Capital Management (Marieke de Leede and Hans Kamminga)
First State Investments (Will Oulton and Manuel Canas)
S&P Global Ratings (Moritz Kraemer)
HSBC (Zoe Knight)
Lead author: Martin Halle (Global Footprint Network)
Project team: Susan Burns, Derek Eaton, Nicole Grunewald, Ronna Kelly, Jon Martindill (all Global Footprint Network), Anders Nordheim (UNEP Finance Initiative), Ivo Mulder (UNEP), Richard Lewney (Cambridge Econometrics)
Reviewers: Eric Usher (UNEP Finance Initiative), Jacqueline McGlade, Niklas Hagelberg, Steven Stone, Thierry Lucas, Linda Kaseva (all UNEP), Andrew Voysey (CISL), Liesel van Ast (Global Canopy Programme)
Designer: Rob Wilson (UNEP Finance Initiative)
Cover photo: http://photos.jdhancock.com/photo/2009-06-23-071424-apple-earth.htmlhttps://creativecommons.org/licenses/by/2.0/
This report contributes to implementation of:

KEY MESSAGES
Higher and more volatile food prices are key transmission mechanisms through which environmental risks and constraints such as climate change, ecosys-tem degradation and water scarcity will impact national economies. If these impacts are significant enough, they may affect a country’s credit rating and the risk exposure of sovereign bondholders.
The global food system is vulnerable to changing environmental conditions. Climate change along with land and water scarcity will increasingly affect food production on the supply side. At the same time, demand for food will increase as a result of global population and income growth. The growing imbalance between rising demand for food and the capacity to supply it, will lead to greater variability in food production, higher and more volatile food commodity prices, and a higher likelihood of price shocks.
These food commodity price shocks will affect every country differently. To assess which countries would face the largest economic risks, we have modelled the impact of a rapid doubling in global food commodity prices on three macro-economic indicators for 110 countries: Gross Domestic Product (GDP); Current account balance; and Consumer Price Index (CPI).
KEY F INDINGS
◾ The risk exposure of individual countries is largely determined by their net food trade and the share of average household spending on food commodities. Countries such as Egypt, Morocco, and the Philippines that combine high food commodity imports and high household spending on these commodities see the worst effects in terms of reduction in absolute GDP, worsening of current account balances, and higher inflation. A number of large emerging market countries, including China, Indonesia, and Turkey, are also strongly impacted as they have high household spending levels on food commodities and moderate net imports of these commodities.
◾ Nine countries experience an increase in GDP, including South American cash crop exporters such as Paraguay and Uruguay and agricultural powerhouses such as Brazil, Australia, Canada, and the United States.
◾ Globally, negative effects massively outweigh positive effects in absolute terms. In the stress test, China experiences an absolute reduction in GDP of USD 161 billion, the highest negative value of any country. The highest positive effect on GDP, seen in the US, is 50 times smaller, at USD 3 billion.
◾ In 23 countries, a doubling in food commodity prices leads to an absolute increase in the consumer price index of more than 10 percentage points. These include many of the countries that experienced social unrest during the food price crisis of 2007-08, including Morocco, Bangladesh, Egypt, and Indonesia.
◾ Overall, countries with higher credit ratings tend to be less exposed to economic risks resulting from a food commodity price spike. Nonetheless, there is considerable variety in the economic risks highlighted by the stress test for each credit rating grade, and countries in each of these grades face potentially significant effects.
◾ Wealthy countries tend to contribute most to the environmental constraints that make food prices higher and more volatile as they consume the most natural resources and environmental services on a per capita basis. The resulting economic risk, however, is largely borne by poorer countries.
◾ A simulated integration of the results in a country risk assessment carried out by a participating financial institution in the ERISC project found that 58 out of 78 countries experience a downgrade in the quantitative rating module of at least one notch (in a 19-notch rating scale). Sixteen countries, including India, would be downgraded by three notches or more.

2 United Nations Environment Programme
Ranking of Countries Most Affected by Food Price Shocks According to GDP Impact
RANKCOUNTRY/REGION
GDP effect* (%)
Current account
effect** (% of GDP)
CPI effect***
(%)
Net Food Commodity
Imports, including
embedded (% of GDP)
GNI, PPP (2014)
Gen. Gvt. Debt/GDP
(2014)
S&P rating (foreign currency LT) ****
1 Benin -8.6 -11.9 18.8 10.4% 2,020 34.0 -2 Nigeria -7.2 -1.4 47.8 1.0% 5,710 10.5 B+3 Côte d'Ivoire -7.0 -7.1 21.7 7.1% 3,130 36.6 -4 Senegal -6.6 -7.5 17.4 7.1% 2,300 53.1 B+5 Ghana -6.5 -1.0 35.7 2.2% 3,900 69.0 B-6 Mozambique -6.1 -1.5 29.0 4.1% 1,120 57.5 B-7 Rwanda -5.5 0.9 46.5 1.3% 1,630 30.2 B+8 Malawi -5.4 0.7 35.3 1.6% 790 --9 Ethiopia -5.4 -1.4 32.4 2.2% 1,500 22.3 B10 Tanzania -5.2 -0.1 30.0 1.2% 2,510 35.2 -11 Burkina Faso -5.1 -2.3 23.0 2.5% 1,600 28.5 B-12 Cameroon -4.9 -2.7 23.6 3.2% 2,950 25.4 B13 Guinea -4.6 -4.8 14.6 5.4% 1,130 41.1 -14 Morocco -4.5 -1.7 19.4 2.1% 7,290 63.4 BBB-15 Kenya -4.4 -0.6 28.4 1.8% 2,940 52.6 B+16 Lao PDR -4.1 -0.1 24.9 0.4% 5,060 62.5 -17 Tunisia -3.9 -1.9 15.7 2.2% 11,020 50.0 -18 Bangladesh -3.5 -1.3 19.0 1.3% 3,330 33.9 BB-19 Egypt -3.3 -2.2 13.2 2.4% 10,260 90.5 B-20 Georgia -3.2 -1.3 13.8 1.9% 7,510 34.8 BB-21 Nepal -3.2 -1.3 17.5 1.3% 2,410 27.7 -22 Nicaragua -3.2 -2.3 12.8 2.8% 4,790 29.5 -23 Uganda -3.2 0.0 19.1 0.9% 1,720 31.4 B24 Togo -3.1 -0.5 23.9 1.6% 1,290 58.7 -25 Madagascar -3.1 -1.9 14.9 2.6% 1,400 34.7 -26 Jordan -2.9 -3.7 4.8 3.3% 11,910 89.0 BB-27 Kyrgyzstan -2.8 -2.6 8.3 2.8% 3,220 53.0 -28 Sri Lanka -2.7 -0.3 13.7 0.6% 10,370 75.5 B+29 Zambia -2.6 0.8 15.0 -1.0% 3,690 35.2 B30 Indonesia -2.5 -0.6 11.0 0.7% 10,190 25.0 BB+31 Honduras -2.5 -2.8 4.8 2.6% 4,570 45.7 B+32 India -2.4 0.7 13.8 -0.6% 5,630 66.1 BBB-33 Albania -2.4 -1.4 8.6 1.7% 10,180 72.5 B+34 Armenia -2.3 -0.9 11.4 1.6% 8,450 41.3 -35 Bolivia -2.3 -0.4 11.1 0.3% 6,290 33.0 BB36 Belarus -2.2 0.0 10.7 0.2% 17,610 40.5 B-37 Jamaica -2.1 -2.4 4.0 2.3% 8,640 135.7 B38 Mauritius -2.1 -1.9 5.4 1.9% 18,150 56.2 -39 Guatemala -2.0 -1.1 11.1 1.3% 7,250 24.3 BB40 Philippines -1.9 -1.2 7.1 1.2% 8,450 36.4 BBB41 Peru -1.6 -0.8 5.9 0.8% 11,440 20.7 BBB+42 Costa Rica -1.6 -1.3 4.4 1.3% 14,420 39.7 BB-43 China -1.6 -0.5 7.4 0.5% 13,170 41.1 AA-44 Dominican Republic -1.5 -1.1 5.0 1.1% 12,600 35.0 BB-45 Croatia -1.5 0.0 7.5 0.0% 20,500 85.1 BB46 Ecuador -1.5 -0.6 5.8 0.6% 11,190 31.3 B47 Botswana -1.3 -1.2 3.9 1.1% 16,030 14.5 A-48 El Salvador -1.3 -0.7 10.3 1.0% 8,000 56.8 B+49 Panama -1.3 -1.2 3.4 1.2% 19,930 45.6 BBB50 Namibia -1.2 -0.6 4.3 0.7% 9,810 24.7 -51 Romania -1.2 0.6 8.9 -0.4% 19,020 40.6 BBB-52 Colombia -1.2 -0.5 4.4 0.6% 12,910 44.3 BBB53 Turkey -1.1 0.1 6.4 0.1% 18,980 33.6 BB+54 Mongolia -1.1 -1.0 3.3 0.9% 11,120 - B55 Venezuela -1.1 -0.5 4.1 0.5% 17,700* 51.8 CCC56 Kazakhstan -1.0 0.7 6.3 -0.7% 21,710 14.9 BBB-57 Malaysia -1.0 -0.8 3.1 0.9% 24,770 55.2 A-
ERISC PHASE II: How Food Prices Link Environmental Constraints to Sovereign Credit Risk 3
58 Saudi Arabia -1.0 -0.9 4.3 1.0% 51,320* 1.6 A-59 Israel -1.0 -0.6 3.5 0.6% 32,830 67.1 A+60 Cambodia -0.9 1.0 12.0 -0.7% 3,080 33.9 -61 Korea, Rep. of -0.8 -0.4 3.0 0.4% 34,620 36.0 AA-62 Mexico -0.8 -0.5 2.7 0.5% 16,640 49.8 BBB+63 Cyprus -0.8 -1.1 1.2 1.0% 29,800 107.5 BB-64 Portugal -0.8 -0.7 1.8 0.7% 28,010 130.2 BB+65 Russian Federation -0.7 0.1 3.6 -0.2% 24,710 17.8 BB+66 South Africa -0.7 -0.2 2.5 0.2% 12,700 46.0 BBB-67 Slovenia -0.6 -0.4 2.0 0.4% 29,920 80.8 A-68 Oman -0.6 -0.7 1.9 0.8% 33,690* 5.1 BBB-69 Bahrain -0.6 -0.7 1.5 0.8% 37,680* 43.8 BB70 Greece -0.5 -0.1 2.3 0.2% 25,660* 177.1 B-71 Spain -0.5 -0.3 1.5 0.3% 33,080 97.7 BBB+72 Kuwait -0.5 -0.4 2.0 0.6% 79,850 6.9 AA73 Hong Kong, China
SAR-0.5 -0.4 1.1 0.4% 56,570 0.1 AAA
74 New Zealand -0.4 0.1 2.2 -0.1% 34,970 30.4 AA75 Czech Republic -0.4 0.2 2.3 -0.2% 28,020 42.6 AA-76 Japan -0.4 -0.2 1.5 0.2% 37,920 246.2 A+77 Slovakia -0.4 0.1 2.1 -0.1% 26,820 53.6 A+78 Estonia -0.4 0.1 2.0 -0.1% 26,330 10.4 AA-79 Luxembourg -0.4 -0.2 1.7 0.2% 65,040 22.1 AAA80 Poland -0.3 0.1 1.9 -0.1% 23,930 50.1 BBB+81 Netherlands -0.3 -0.2 1.1 0.2% 48,260 67.9 AAA82 Chile -0.3 -0.2 0.9 0.2% 21,580 15.1 AA-83 Finland -0.3 0.0 1.2 0.0% 39,940 59.0 AA+84 Belgium -0.3 0.0 1.3 0.0% 43,220 106.6 AA85 Norway -0.3 -0.2 0.9 0.2% 66,330 28.1 AAA86 United Kingdom -0.2 -0.1 1.0 0.1% 39,040 89.4 AAA87 Austria -0.2 0.0 1.1 0.0% 45,930 84.4 AA+88 Italy -0.2 0.0 1.2 0.0% 34,700 132.1 BBB-89 Germany -0.2 0.0 1.2 0.0% 46,850 74.6 AAA90 Sweden -0.2 0.0 1.0 0.0% 46,750 43.8 AAA91 Qatar -0.2 -0.2 1.5 0.3% 134,420 31.7 AA92 Lithuania -0.2 0.9 3.3 -0.9% 25,490 40.9 A-93 Denmark -0.2 0.1 0.9 -0.1% 46,210 45.2 AAA94 Ireland -0.2 0.2 1.1 -0.2% 42,270 107.6 A+95 Switzerland -0.2 -0.1 0.5 0.1% 57,960* 46.3 AAA96 Singapore -0.1 0.1 0.7 -0.1% 80,270 98.6 AAA97 Thailand -0.1 2.6 6.5 -2.8% 14,870 43.5 BBB+98 France -0.1 0.3 1.1 -0.3% 39,610 95.6 AA99 Ukraine -0.1 3.1 8.9 -2.9% 8,560 71.2 B-100 Latvia 0.0 0.7 1.9 -0.7% 22,690 37.8 A-101 Pakistan 0.0 2.0 11.5 -2.1% 5,090 64.9 B-102 Viet Nam 0.0 3.6 11.4 -3.9% 5,350 57.2 BB-103 Hungary 0.0 1.1 2.3 -1.1% 23,630 77.0 BB+104 United States of
America0.0 0.3 0.7 -0.3% 55,860 104.8 AA+
105 Canada 0.0 0.5 0.9 -0.5% 43,360 87.9 AAA106 Brazil 0.1 0.7 1.6 -0.7% 15,590 65.2 BB107 Australia 0.1 0.5 0.7 -0.5% 42,760 33.9 AAA108 Bulgaria 0.6 1.8 2.1 -1.9% 16,260 26.9 BB+109 Uruguay 2.5 5.0 2.2 -5.0% 20,220 61.3 BBB110 Paraguay 5.7 9.9 4.2 -10.7% 8,470 19.0 BB
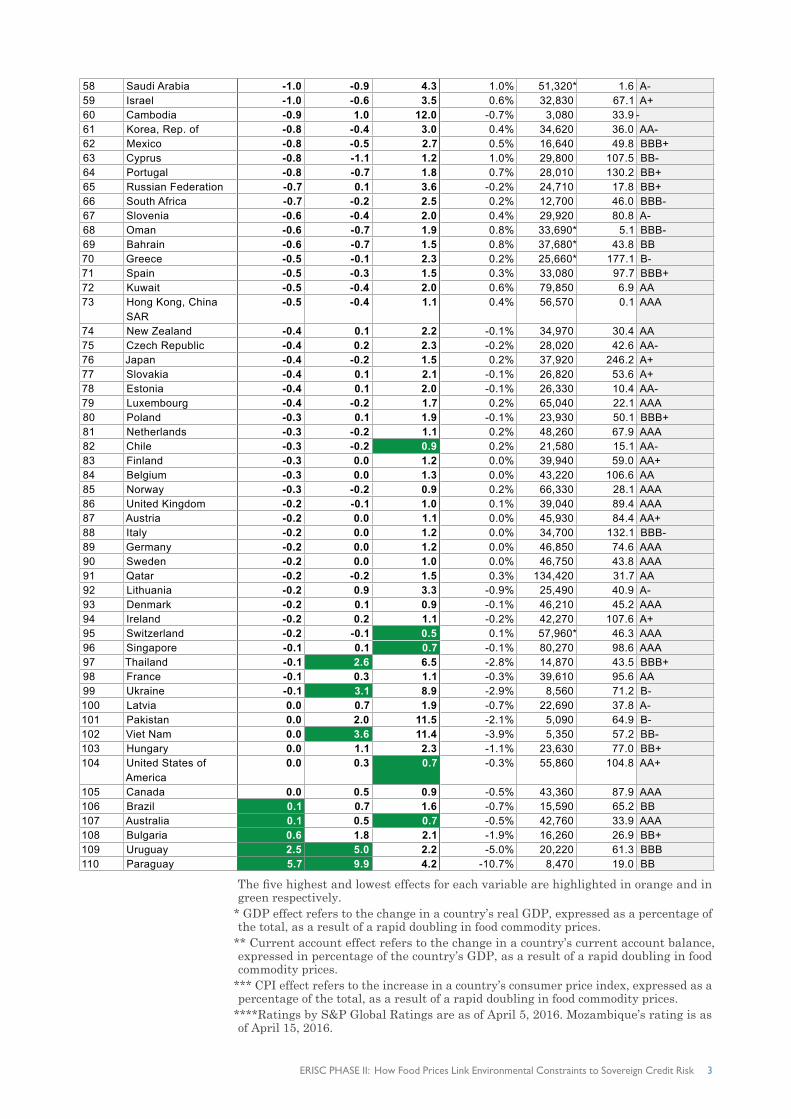
The five highest and lowest effects for each variable are highlighted in orange and in green respectively.
* GDP effect refers to the change in a country’s real GDP, expressed as a percentage of the total, as a result of a rapid doubling in food commodity prices.
** Current account effect refers to the change in a country’s current account balance, expressed in percentage of the country’s GDP, as a result of a rapid doubling in food commodity prices.
*** CPI effect refers to the increase in a country’s consumer price index, expressed as a percentage of the total, as a result of a rapid doubling in food commodity prices.
****Ratings by S&P Global Ratings are as of April 5, 2016. Mozambique’s rating is as of April 15, 2016.
4 United Nations Environment Programme
FOREWORD
The increasing global competition for the planet’s finite resources is becoming an ever more significant factor of economic performance. The 2016 Global Risk Report by the World Economic Forum, for instance, found that the risks related to ecosystem degradation, water scarcity and climate change are among the most severe the world faces in terms of their likelihood and their potential impact on our global economy. While the report underscores a growing under-standing about the materiality of such environmental risks, their effects on national economies is largely absent from credit risk analysis in bond markets. Indeed, in the debate over the impacts of climate change and resource scar-city, the sovereign bond market has been a long overlooked portion of the financial system. However, with more than US$ 40 trillion in outstanding debt, government bonds are one of the most important asset classes held by investors worldwide.
The Environmental Risk Integration in Sovereign Credit (ERISC) project, a joint collaboration of UNEP Finance Initiative (UNEP FI) and Global Footprint Network, assesses how environmental phenomena such as deforestation, climate change and resource scarcity affect a country’s economy and therefore, potentially, its sovereign credit worthiness and country risk ratings. The first phase of the project was completed in 2012 with an introductory report showing that environmental risks are material, unevenly distributed between countries and not adequately reflected in sovereign credit risk analysis.
We are pleased to hereby release this report summarizing the second phase of ERISC, which looks specifically at how environmental risks affect food production and food prices and how this in turn can have material macroe-conomic impacts. It was developed in collaboration with S&P Global Ratings, HSBC, Caisse des Dépôts, First State Investments, KfW, Kempen Capital Management, and Cambridge Econometrics.
Disruptions to our food system are an increasingly important risk to national economies, as climate change, changing diets, population pressure and compe-tition for land push food prices higher and create more volatility. In this report, we examine the linkages between the resulting food price shocks and sover-eign credit risk by submitting 110 countries to a stress test simulating a food commodity price shock. The results can inform bond investors and credit rating agencies, but also governments looking for ways to reduce economic impacts from environmental risks.
We invite both the financial industry and governments to collaborate with us to scale up this work.
Eric UsherHead UNEP Finance Initiative (a.i.)
Susan BurnsDirector, Finance Initiative Global Footprint Network

ERISC PHASE II: How Food Prices Link Environmental Constraints to Sovereign Credit Risk 5
TABLE OF CONTENTS
Introduction: ERISC and food prices ............................................................. 6
Environmental risk and the link to food price shocks .................................. 6
Modelling food price shocks ............................................................................ 12
Results ............................................................................................................. 14
How can results inform country risk assessment? ....................................... 20
Concluding remarks and future work ........................................................... 21
Appendix 1 ...................................................................................................... 22Model Assumptions
Appendix 2 ...................................................................................................... 23The 2007-08 Food Crisis: The foundation for our model
Bibliography ................................................................................................... 24

6 United Nations Environment Programme
INTRODUCTION: ERISC AND FOOD PRICES
The Environmental Risk Integration in Sovereign Credit Analysis (ERISC) project is a pioneering exploration by UNEP FI and Global Footprint Network (GFN) in collaboration with financial institutions to uncover and quantify the economic risks at country-level resulting from environmental degradation. Poor environmental management by countries puts pressure on their ability to maintain and grow economies. Indeed, environmental risks such as water scarcity, climate change, and overuse of renewable natural resources can affect a country’s economy in multiple ways, ultimately impacting its ability to manage its public debt.
In the first phase of ERISC we showed that environmental risks can be material, but are not systematically incorporated into credit analysis. The consequences of environmental degradation have attracted more attention from the finance industry since the publication of the first report, with credit rating agencies and policy makers looking more closely at the effect of climate change in particular.1–3 Research on the broader economic effects of long-term environmental degradation is, however, still rare. This phase of ERISC contrib-utes to bridging this gap by analyzing one of the most direct and impactful channels linking environmental risk to economic effects: food price shocks. Further phases of ERISC will, with the continued support of the finance sector and others, build and expand the research in order to improve financial sector understanding of environmental risk and provide economic evidence for better environmental management by countries.
ENVIRONMENTAL RISK AND THE LINK TO FOOD PRICE SHOCKS
Food prices are one of the most important channels by which environ-mental risks affect national economies.
Food production represents a vital human demand on the natural world – a demand that is ever-growing as a result of increases in population and income. Food is also one of the largest drivers of humanity’s negative impact on the environment (through its use of land and water and alteration of nitrogen and phosphorous cycles) and a major contributor to climate change (through energy use and greenhouse gas emissions). At the same time, agriculture stands to be significantly affected by climate change and other environmental constraints. This complex confluence of factors will result in supply-demand imbalances in the global food system, leading to higher food prices and volatility, with impli-cations for economic risk at the country level and financial risk for sovereign bond holders.

ERISC PHASE II: How Food Prices Link Environmental Constraints to Sovereign Credit Risk 7
Figure 1: How food price shocks link environmental constraints to sovereign credit risk
Supply/demand gap
Higher and more volatile global prices for food
commodities
Economic, social and political effects at country
level
Potential changes in sovereign credit risk or
country risk
Environmental risks Consumption patterns
Growing populationChanging diets
Imbalance between rising demand for food and capacity to supply it
Economic effects vary by country and sectorSocial unrest can exacerbate economic effectsFood subsidies may be unsustainablePoor expected to be hit the hardest
Ecosystem degradation,
water scarcity, climate change
Macroeconomic indicators could change
Capital market view of country credit worthiness may change
Cost of capital could change
Variability in food production can lead to higher and more volatile
food commodity prices

8 United Nations Environment Programme
SUPPLY-S IDE CHALLENGES
Climate change is a significant threat to future food production. While food production may benefit in some regions from mild rises in temperature, negative effects prevail overall, especially as average global temperatures are expected to rise further, driving changes in precipitation patterns and an increase in extreme weather events.4–7 In the short term, extreme weather events may pose the greatest risk to food production.7–10
Climate change will increase the year-on-year variability of yields for crops, and higher temperatures may also affect food supply by increasing the inci-dence of pests and diseases affecting production and processing6,7,11.
Global cereal production growth will be lower as a result of climate change, leading to an imbalance between supply and demand6,9. It is estimated that each decade of climate change will reduce mean agricultural yields by 1 per cent, whereas the demand for food is forecast to increase by 14 per cent per decade.6
Figure 2: Areas identified as highly vulnerable to climate change.10
Water scarcity will be a growing constraint on future production. Agriculture is responsible for 70 per cent of water withdrawals globally and up to 90 per cent in developing countries.10 Surface water is already oversubscribed in many grain producing basins and groundwater is fast depleting.5 Despite this growing threat of water shortages, food production is forecast to become more water intensive. Higher incomes typically lead to higher consumption of meat, dairy, exotic vegetables and fruit, which require more water than the diets they replace. The combination of population and income growth there-fore translate into an exponential increase in the amount of water demanded
Water stress affects yields from rain-fed agriculture
High temperatures and drought
Temperature changes and water scarcity
Water scarcity and high temperatures Fresh water scarcity
in large river basins
Water scarcity in south and eastern Australia, and eastern New Zealand
AFRICA
SOUTHERN EUROPE
SOUTH AMERICA
NORTH AMERICA ASIA
AUSTRALIA & NEW ZEALAND

ERISC PHASE II: How Food Prices Link Environmental Constraints to Sovereign Credit Risk 9
by food production5,10. Additionally, there will be increasing non-agricultural demand for water in the years ahead from industry, municipal, and energy uses. Increasing scarcity means that water for agricultural irrigation will become much more expensive in the future, which will push food commodity prices higher too4. Areas that are forecast to be severely affected by water shortages include some of the world’s most significant agricultural production centres, including Northwest India, Northeast China, California’s Central Valley, and the Midwest of the US10,12.
Land scarcity will also constrain food production. Overall, agriculture is estimated to contribute between 12 and 14 per cent of global greenhouse gas emissions directly, mostly due to livestock production and nitrogen fertilisers.13 If the effects of agriculture on land use, land use change, and forestry are added, the figure more than doubles to around 30 per cent of global emissions.4,13
Given the scale of its contribution, agriculture is likely to face increasing calls to reduce net emissions, which will have significant implications for land use, fertiliser use, production, processing, and transport, potentially contributing to rising costs or lower production. Additionally, there will be increased pres-sures to set aside forest lands for carbon sequestration and, in some countries, increase biofuels production, further constraining the supply of land for food4,9.
Urbanisation is another competing demand for land. Rapid growth in urban-isation will increase the amount of potentially cultivable land that is used to host housing and infrastructure5. It is estimated that the built-up areas of cities with more than 100’000 inhabitants will increase by 175 per cent by 2030.14 With urban land only comprising about 3 per cent of the planet’s land areas, the impact may seem globally modest. This growth is, however, highly concentrated geographically and could result in pressure on the availability of agricultural land at local or regional levels, in particular in China and India4.Amid these growing demands, however, more land is needed. It is estimated that, even if global agricultural productivity were brought to the current levels prevailing in the United States, feeding 9 billion people with current North American diets would require almost doubling cropland area.15
DEMAND-S IDE DYNAMICS
As the world’s population grows and individual consumption levels increase with rising income levels, demand for food is ever-increasing. The world population is on track to reach 9.6 billion people in 2050, an almost 50 per cent jump from 200516. In addition, conservative estimates foresee a doubling of per capita incomes at the global level by 205017–22. Combined, these trends translate to an overall increase in food demand ranging between 54 and 98 per cent18. Partly as a consequence of rising incomes, demand for meat and other animal products is expected to grow faster than the average, contributing to rising demand for cereals and oilcrops, which include soy, to be used as feed.15,17,23 By 2050, demand for cereals is forecast to grow by 31 per cent, demand for meat by 43 per cent, and demand for oilcrops by 47 per cent17.
While the projected growth in demand for food is not significantly larger than what the world has seen in the past five decades, achieving the needed productivity increases will be harder than in the past due to the environmental constraints affecting the supply side. Indeed, the situation is depicted as a potential ‘perfect storm’ in which the global farm and food system will need to feed many more people in addition to serving other competing functions, such as carbon sequestration.4
10 United Nations Environment Programme
PRICES ARE AFFECTED AS RIS ING DEMAND MEETS CONSTR AINED SUPPLY
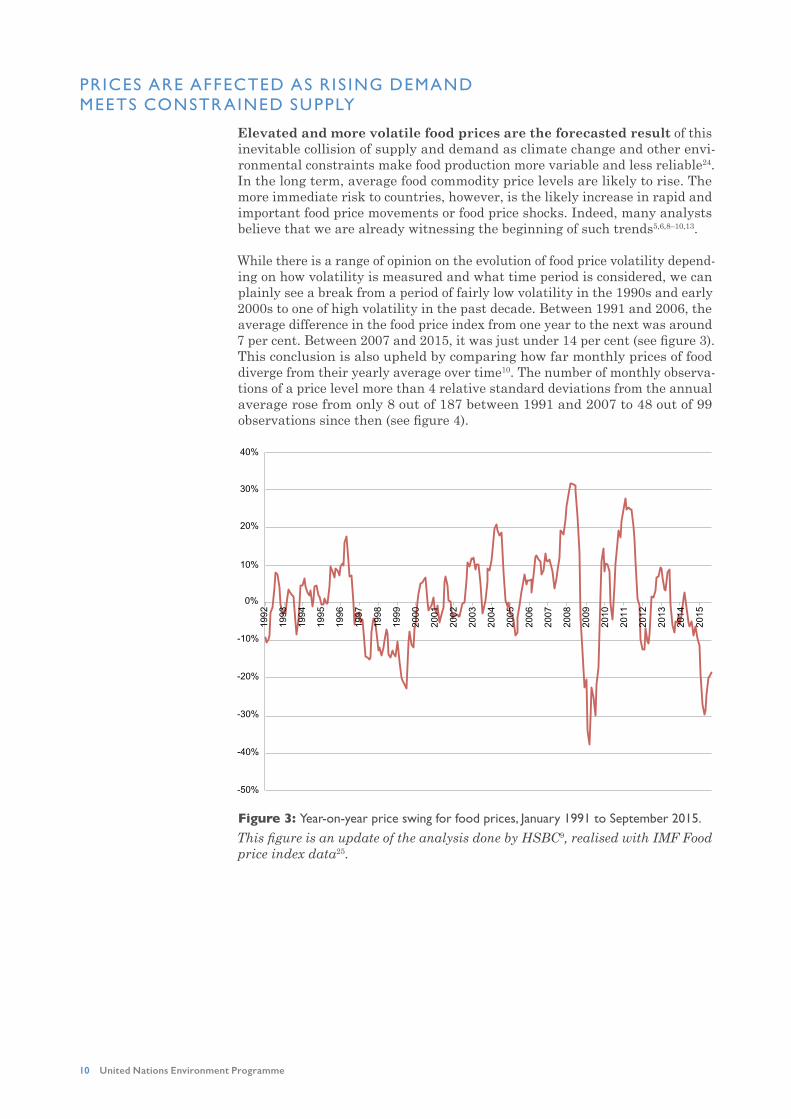
Elevated and more volatile food prices are the forecasted result of this inevitable collision of supply and demand as climate change and other envi-ronmental constraints make food production more variable and less reliable24. In the long term, average food commodity price levels are likely to rise. The more immediate risk to countries, however, is the likely increase in rapid and important food price movements or food price shocks. Indeed, many analysts believe that we are already witnessing the beginning of such trends5,6,8–10,13.
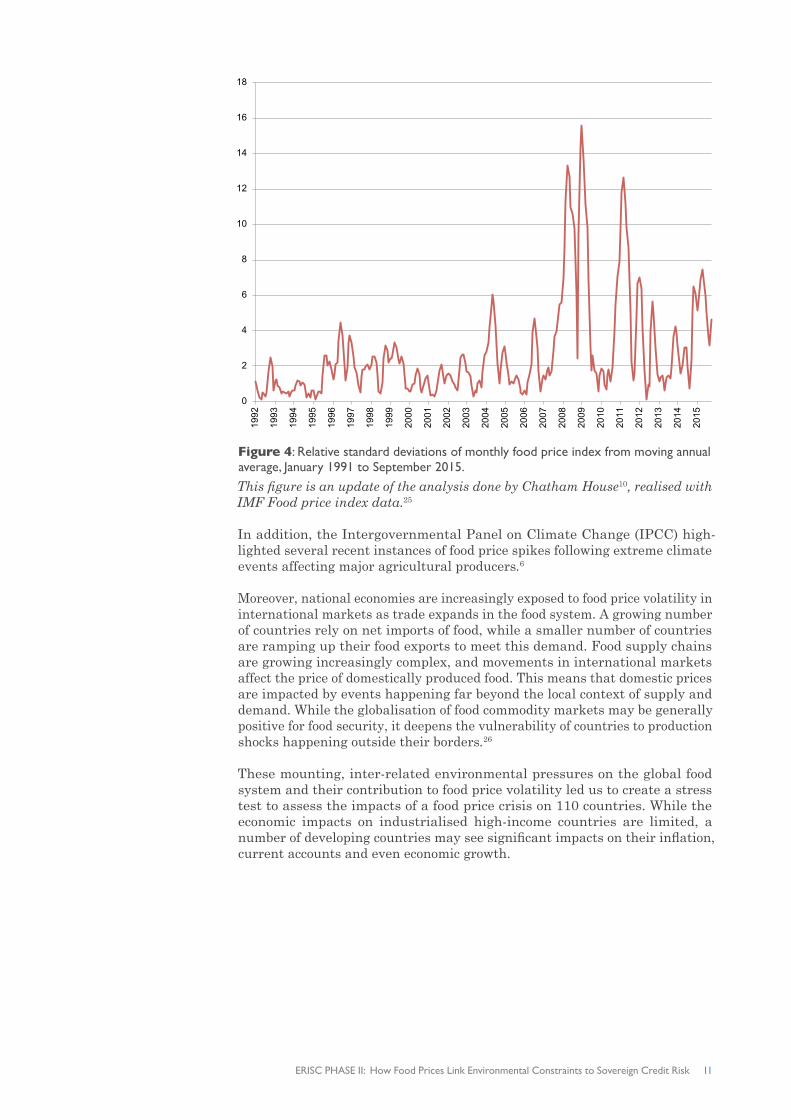
While there is a range of opinion on the evolution of food price volatility depend-ing on how volatility is measured and what time period is considered, we can plainly see a break from a period of fairly low volatility in the 1990s and early 2000s to one of high volatility in the past decade. Between 1991 and 2006, the average difference in the food price index from one year to the next was around 7 per cent. Between 2007 and 2015, it was just under 14 per cent (see figure 3). This conclusion is also upheld by comparing how far monthly prices of food diverge from their yearly average over time10. The number of monthly observa-tions of a price level more than 4 relative standard deviations from the annual average rose from only 8 out of 187 between 1991 and 2007 to 48 out of 99 observations since then (see figure 4).
Figure 3: Year-on-year price swing for food prices, January 1991 to September 2015.
This figure is an update of the analysis done by HSBC9, realised with IMF Food price index data25.
-50%
-40%
-30%
-20%
1992
1993
1994
1995
1996
1997
1998
1999
2000
2001
2002
2003
2004
2005
2006
2007
2008
2009
2010
2011
2012
2013
2014
2015
-10%
0%
10%
20%
30%
40%
ERISC PHASE II: How Food Prices Link Environmental Constraints to Sovereign Credit Risk 11
Figure 4: Relative standard deviations of monthly food price index from moving annual average, January 1991 to September 2015.
This figure is an update of the analysis done by Chatham House10, realised with IMF Food price index data.25
In addition, the Intergovernmental Panel on Climate Change (IPCC) high-lighted several recent instances of food price spikes following extreme climate events affecting major agricultural producers.6
Moreover, national economies are increasingly exposed to food price volatility in international markets as trade expands in the food system. A growing number of countries rely on net imports of food, while a smaller number of countries are ramping up their food exports to meet this demand. Food supply chains are growing increasingly complex, and movements in international markets affect the price of domestically produced food. This means that domestic prices are impacted by events happening far beyond the local context of supply and demand. While the globalisation of food commodity markets may be generally positive for food security, it deepens the vulnerability of countries to production shocks happening outside their borders.26
These mounting, inter-related environmental pressures on the global food system and their contribution to food price volatility led us to create a stress test to assess the impacts of a food price crisis on 110 countries. While the economic impacts on industrialised high-income countries are limited, a number of developing countries may see significant impacts on their inflation, current accounts and even economic growth.
18
16
14
12
10
8
6
4
2
0
1992
1993
1994
1995
1996
1997
1998
1999
2000
2001
2002
2003
2004
2005
2006
2007
2008
2009
2010
2011
2012
2013
2014
2015
12 United Nations Environment Programme
MODELLING FOOD PRICE SHOCKS
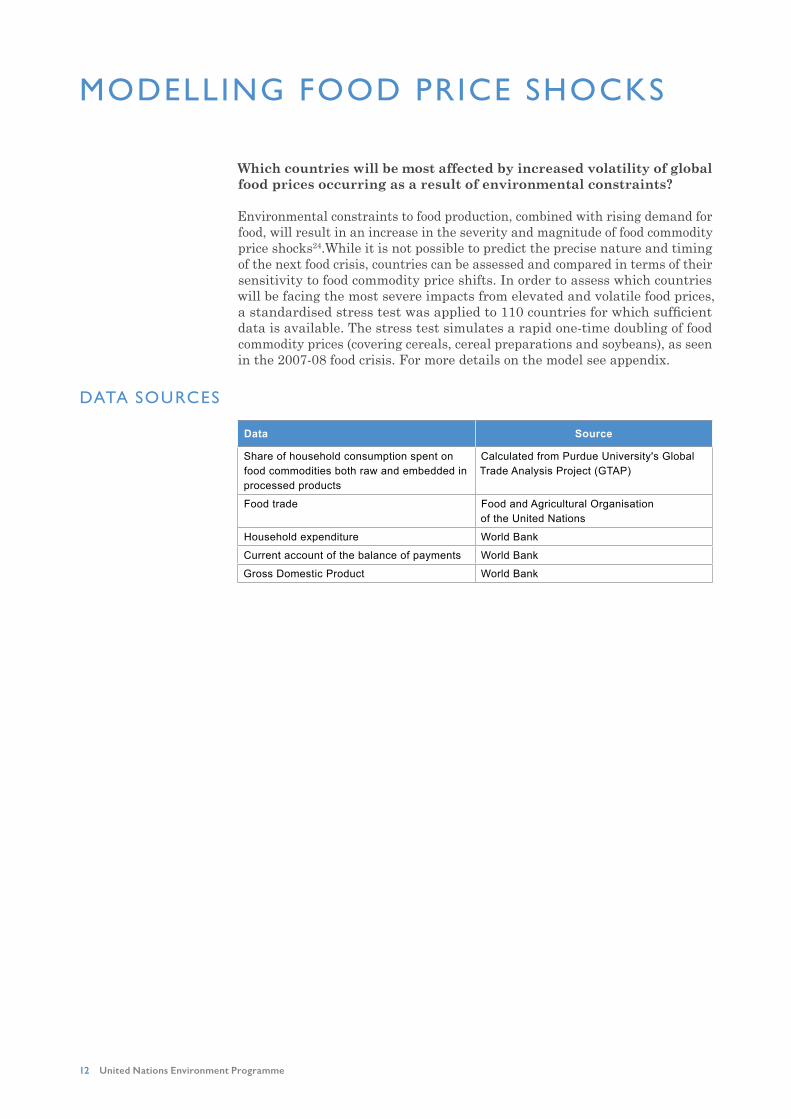
Which countries will be most affected by increased volatility of global food prices occurring as a result of environmental constraints?
Environmental constraints to food production, combined with rising demand for food, will result in an increase in the severity and magnitude of food commodity price shocks24.While it is not possible to predict the precise nature and timing of the next food crisis, countries can be assessed and compared in terms of their sensitivity to food commodity price shifts. In order to assess which countries will be facing the most severe impacts from elevated and volatile food prices, a standardised stress test was applied to 110 countries for which sufficient data is available. The stress test simulates a rapid one-time doubling of food commodity prices (covering cereals, cereal preparations and soybeans), as seen in the 2007-08 food crisis. For more details on the model see appendix.
DATA SOURCES
Data Source
Share of household consumption spent on food commodities both raw and embedded in processed products
Calculated from Purdue University's Global Trade Analysis Project (GTAP)
Food trade Food and Agricultural Organisation of the United Nations
Household expenditure World Bank
Current account of the balance of payments World Bank
Gross Domestic Product World Bank

ERISC PHASE II: How Food Prices Link Environmental Constraints to Sovereign Credit Risk 13
HOW ARE NATIONAL ECONOMIES AFFECTED BY FOOD PRICE SHOCKS? Price effects: Increases in international food commodity prices affect import and export prices, as well as the prices of food produced for domestic consumption.
Income and expenditure effect: Higher consumer prices reduce real incomes, resulting in lower consumer spending, partly on food but particularly on income-elastic products, also leading to reductions in imports and domestic output and employment, with multiplier effects. The negative impact is partially offset by higher farm incomes in some countries.Government budget effects: Lower incomes and private spending in the economy result in lower government revenues. If the government operates a
food subsidy scheme then government spending rises. To the extent that the government operates welfare programmes, spending on these will be triggered as employment falls.
Current account effects: If a country is a net importer, the net effect is a deterioration in the current account of the balance of payments, mitigated partly by the reduction in imports associated with lower real spending in the economy.
Exchange rate effects: The analysis presented in this report has assumed no change in the exchange rate. If financial markets respond to the less favourable prospects for the country’s economy by selling its currency, the impact on the current account of the balance of payments will be mitigated by a lower exchange rate, which will curb imports and boost exports
Balance of payments
current account
Domestic prices
BALANCE OF PAYMENT EFFECTS
PRICE EFFECTS
INCOME ANDSPENDING EFFECTS
GOVERNMENTBUDGET EFFECTS
Value of Imports
Government budget deficit
Food subsidies
Global commodity prices
Import prices
Consumer prices
Value of Exports
Export prices
Import volume
Farmers’ incomes
Household incomes and spending
GDP
Government spending Government revenues

14 United Nations Environment Programme
RESULTS
The outcomes of the stress test are calculated for three key variables: countries’ real GDP, current account balance, and consumer price index. The impact on GDP provides a comprehensive measure of the economic impact of a food commodity price shock on a country. The impact on current accounts shows how this shock affects its foreign exchange earnings and/or reserves. The impact on consumer prices shows how a rise in food price commodities will impact household spending on non-food goods and services for the average consumer. Although not modelled, the impact on household spending can also be a cause for socio-political unrest in some cases, as witnessed in the 2007-08, and 2011 food price crises, which can exacerbate economic effects.
The effect on countries’ GDP offers the most comprehensive view of the economic impacts of a food price shock on the economy. While a handful of countries experience GDP increases as a result of a rapid doubling in food commodity prices, most (101 out of 110) experience a negative impact on GDP.
Highest Positive Effect Highest Negative Effect
Country Real GDP Effect (%) Country Real GDP Effect (%)
Paraguay 5.7 Benin -8.6
Uruguay 2.5 Nigeria -7.2
Bulgaria 0.6 Côte d'Ivoire -7.0
Australia 0.1 Senegal -6.6
Brazil 0.1 Ghana -6.5
Canada <0.1 Mozambique -6.1
United States of America
<0.1 Rwanda -5.5
Hungary <0.1 Malawi -5.4
Viet Nam <0.1 Ethiopia -5.4
Tanzania -5.2
Table 1: Countries experiencing the largest positive and negative effects on real GDP from a doubling in food commodity prices.
The effect on countries’ current account reflects the balance of their exter-nal trade in food commodities. Of the 110 countries covered by this analysis, 41 are forecast to see improvements in their balance of payments as a result of a food price spike. For the 69 remaining countries, the impact on the balance of payments is negative, and in some cases very strongly so. The vulnerability to a deterioration of the balance of payments is perhaps most concerning for those countries who are already experiencing a negative current account balance and who would see a further deterioration in the event of a food price spike.
ERISC PHASE II: How Food Prices Link Environmental Constraints to Sovereign Credit Risk 15
Highest Positive Effect Highest Negative Effect
Country Current account effect (% of GDP) Country Current account
effect (% of GDP)Paraguay 9.9 Benin -11.9
Uruguay 5.0 Senegal -7.5
Viet Nam 3.6 Côte d'Ivoire -7.1
Ukraine 3.1 Guinea -4.8
Thailand 2.6 Jordan -3.7
Pakistan 2.0 Honduras -2.8
Bulgaria 1.8 Cameroon -2.7
Hungary 1.1 Kyrgyzstan -2.6
Cambodia 1.0 Jamaica -2.4
Lithuania 0.9 Burkina Faso -2.3
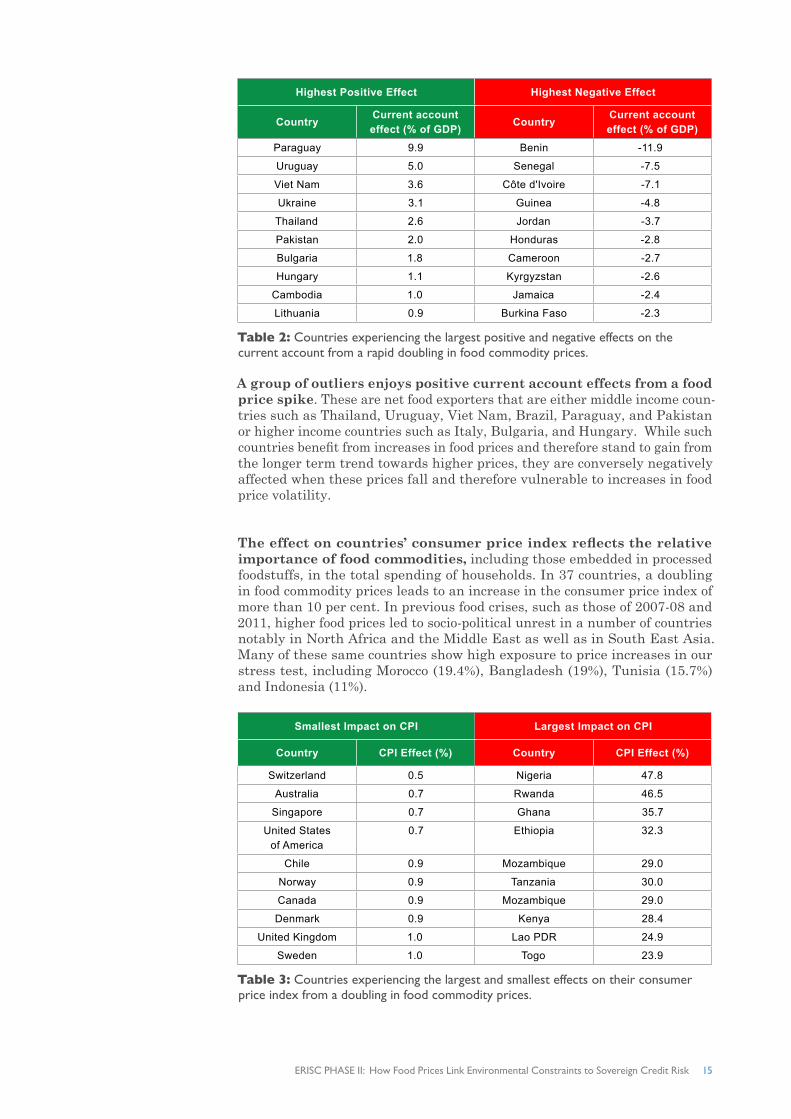
Table 2: Countries experiencing the largest positive and negative effects on the current account from a rapid doubling in food commodity prices.
A group of outliers enjoys positive current account effects from a food price spike. These are net food exporters that are either middle income coun-tries such as Thailand, Uruguay, Viet Nam, Brazil, Paraguay, and Pakistan or higher income countries such as Italy, Bulgaria, and Hungary. While such countries benefit from increases in food prices and therefore stand to gain from the longer term trend towards higher prices, they are conversely negatively affected when these prices fall and therefore vulnerable to increases in food price volatility.
The effect on countries’ consumer price index reflects the relative importance of food commodities, including those embedded in processed foodstuffs, in the total spending of households. In 37 countries, a doubling in food commodity prices leads to an increase in the consumer price index of more than 10 per cent. In previous food crises, such as those of 2007-08 and 2011, higher food prices led to socio-political unrest in a number of countries notably in North Africa and the Middle East as well as in South East Asia. Many of these same countries show high exposure to price increases in our stress test, including Morocco (19.4%), Bangladesh (19%), Tunisia (15.7%) and Indonesia (11%).
Smallest Impact on CPI Largest Impact on CPI
Country CPI Effect (%) Country CPI Effect (%)
Switzerland 0.5 Nigeria 47.8
Australia 0.7 Rwanda 46.5
Singapore 0.7 Ghana 35.7
United States of America
0.7 Ethiopia 32.3
Chile 0.9 Mozambique 29.0
Norway 0.9 Tanzania 30.0
Canada 0.9 Mozambique 29.0
Denmark 0.9 Kenya 28.4
United Kingdom 1.0 Lao PDR 24.9
Sweden 1.0 Togo 23.9
Table 3: Countries experiencing the largest and smallest effects on their consumer price index from a doubling in food commodity prices.

16 United Nations Environment Programme
Furthermore, in the event of a food price crisis, the effects on GDP, current accounts, and consumer prices are closely correlated. The most vulnerable countries are likely to face all three of these effects simultaneously.
DISCUSS ION OF F INDINGS
Major drivers of economic impacts from food commodity price shocks
Net trade in food commodities and share of household spending on them are major determinants of food shock impacts. Countries that are most exposed combine high household spending on food and high levels of net imports of food. These include emerging market countries such as Egypt, the Philippines and Morocco, as well as many sub-Saharan African countries.
Other countries, however, are not immune to impacts. Some of the larg-est emerging market economies such as China, Turkey and Indonesia are in the highest categories for one of the variable but only medium-high on the other. These countries also face significant negative impacts from a food price crisis.In table x below we have divided countries into 10 categories based on their net trade in food commodities and their household spending on food. The average impact on GDP (in %) is shown for each category. The impact on GDP ranges from a 2.2 per cent increase for net food exporters with low household spending on food to a 4.1 per cent decrease for net food importers with high household spending on food. The countries or regions in each category are shown below the table listed by size of GDP in 2014.
Net trade in food commodities (value in % of GDP)Imports
worth more than 1% of
GDP
Imports worth be-
tween 0 and 1% of GDP
Exports worth be-
tween 0 and -1% of GDP
Exports worth more than 1% of
GDPHousehold spending on food commodities (% of total household spending)
Over 5% -4.1%1 -2.6%2 -1.6%3 0.0%4
Between 2% and 5%
-1.8%5 -1.0%6 -0.4%7 2.2%8
Less than 2% - 0.4%9 -0.1%10 -
Table 4: Average effect on GDP for countries based on net trade in food commodities and household spending on food
1. Egypt, Philippines, Bangladesh, Morocco, Dominican Republic, Kenya, Guatemala, Ethiopia, Tunisia, Tanzania, Ghana, Côte d’Ivoire, Cameroon, El Salvador, Nepal, Georgia, Mozambique, Senegal, Albania, Mauritius, Burkina Faso, Nicaragua, Armenia, Madagascar, Benin, Rwanda Kyrgyzstan, Equatorial Guinea, Togo, Malawi
2. China, Indonesia, Turkey, Nigeria, Peru, Ecuador, Sri Lanka, Belarus, Croatia, Bolivia, Uganda, Lao PDR
3. India, Kazakhstan, Romania, Zambia, Cambodia4. Thailand, Pakistan, Viet Nam, Ukraine5. Saudi Arabia, Costa Rica, Panama, Jordan, Honduras, Botswana, Jamaica6. Republic of Korea, Mexico, Colombia, South Africa, Malaysia, Israel, Greece,
Namibia, Mongolia, Venezuela (no GDP data for 2014)7. Russian Federation, Czech Republic, New Zealand, Slovakia, Lithuania8. Hungary, Uruguay, Bulgaria, Paraguay9. Japan, United Kingdom, Spain, Netherlands, Switzerland, Belgium, Norway,
Austria, Hong Kong (China SAR), Finland, Chile, Portugal, Qatar, Kuwait, Oman, Luxembourg, Slovenia, Bahrain, Cyprus
10. USA, Germany, France, Brazil, Italy, Canada, Australia, Sweden, Poland, Denmark, Singapore, Ireland, Latvia, Estonia

ERISC PHASE II: How Food Prices Link Environmental Constraints to Sovereign Credit Risk 17
Negative economic impacts far outweigh positive impacts
The absolute value of the economic shock reveals important potential shortfalls for large emerging market countries. We calculate this absolute value by taking the projected effect on GDP and multiplying it by the most recent GDP value for each country. While net food exporters do see a positive effect that can amount to several billion dollars, this is dwarfed by the down-side risk facing the most negatively affected countries. The potential losses for China are, for example, roughly 50 times larger than the gain experienced by the US.
Highest Positive Effect Highest Negative Effect
Country Effect on GDP (million $) Country Effect on GDP
(million $)United States
of America3’282 China -161’301
Paraguay 1’775 India -49’470
Australia 1’502 Nigeria -40’659
Uruguay 1’458 Indonesia -22’239
Brazil 1’178 Japan -19’360
Table 5: Highest positive and negative effects on GDP in absolute terms.
How economic impacts compare to sovereign credit ratings
Higher credit ratings correlate to lower vulnerability to food price shocks. Overall, because both the share of household spending on food commodities and the importance of food trade in the economy tend to decline as per capita incomes rise, the effects of a food price crisis are more severe for countries with lower incomes than for wealthy countries. As per capita incomes also carry significant weight in determining a country’s existing sovereign credit rating, we can observe that better credit ratings tend to be correlated with lower exposure to food price shocks.
Figure 5: Country ranking of GDP effects of a food price crisis by S&P sovereign rating
Cou
ntr
y R
anki
ng
(1=
stro
nge
st n
egat
ive
GD
P e
ffec
t)
Sovereign Credit Rating
AAA AA A BBB BB B CCC CC
Ratings below BBB, in red above, are considered to be below investment-grade.
18 United Nations Environment Programme
Despite the overall correlation between better ratings and lower exposure to food price crisis effects, there are countries in each rating grade that face potentially significant effects.
AAA AA A BBB
Hong Kong (China SAR) (-0.5%)
China (-1.6%) Botswana (-1.3%) Morocco (-4.5%)
Luxembourg (-0.4%) Republic of Korea (-0.8%)
Malaysia (-1.0%) India (-2.4%)
Netherlands (-0.3%) Kuwait (-0.5%) Saudi Arabia (-1.0%) Philippines (-1.9%)
Table 6: Countries or regions experiencing the largest negative GDP effects from a rapid doubling of food commodity prices per S&P rating category.
Environmental constraints to production could exacerbate the impacts of high prices
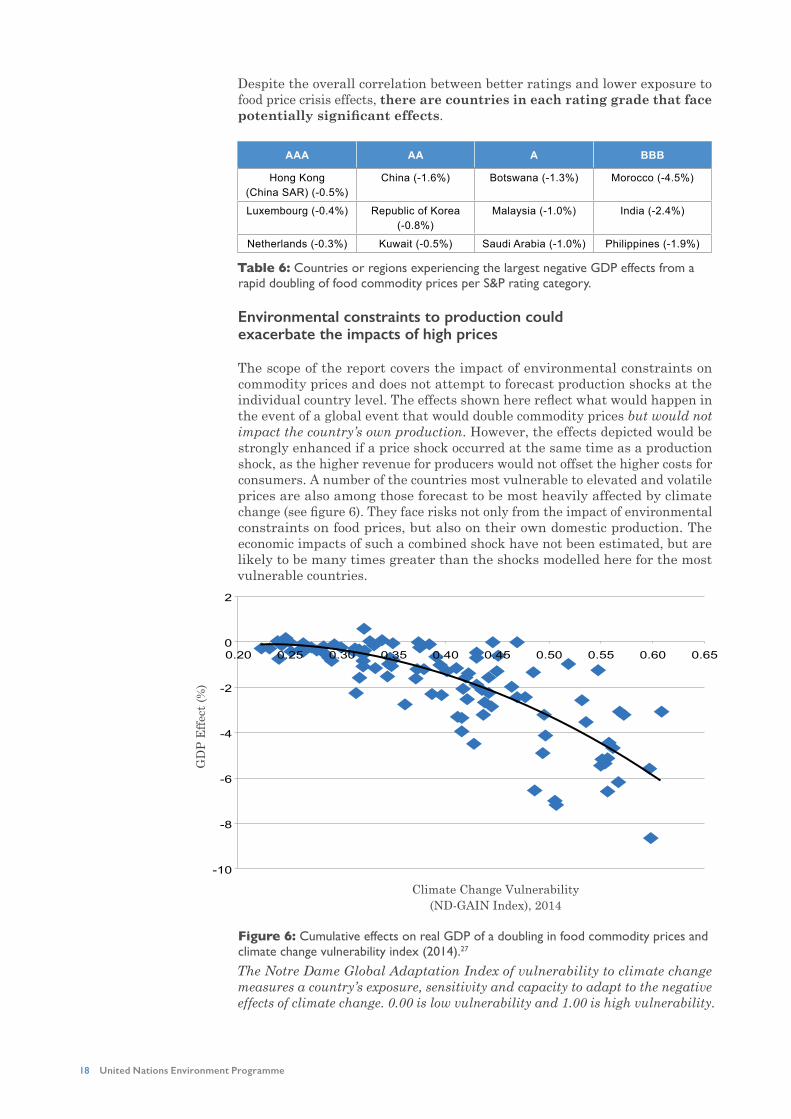
The scope of the report covers the impact of environmental constraints on commodity prices and does not attempt to forecast production shocks at the individual country level. The effects shown here reflect what would happen in the event of a global event that would double commodity prices but would not impact the country’s own production. However, the effects depicted would be strongly enhanced if a price shock occurred at the same time as a production shock, as the higher revenue for producers would not offset the higher costs for consumers. A number of the countries most vulnerable to elevated and volatile prices are also among those forecast to be most heavily affected by climate change (see figure 6). They face risks not only from the impact of environmental constraints on food prices, but also on their own domestic production. The economic impacts of such a combined shock have not been estimated, but are likely to be many times greater than the shocks modelled here for the most vulnerable countries.
Figure 6: Cumulative effects on real GDP of a doubling in food commodity prices and climate change vulnerability index (2014).27
The Notre Dame Global Adaptation Index of vulnerability to climate change measures a country’s exposure, sensitivity and capacity to adapt to the negative effects of climate change. 0.00 is low vulnerability and 1.00 is high vulnerability.
GD
P E
ffec
t (%
)
Climate Change Vulnerability(ND-GAIN Index), 2014
ERISC PHASE II: How Food Prices Link Environmental Constraints to Sovereign Credit Risk 19
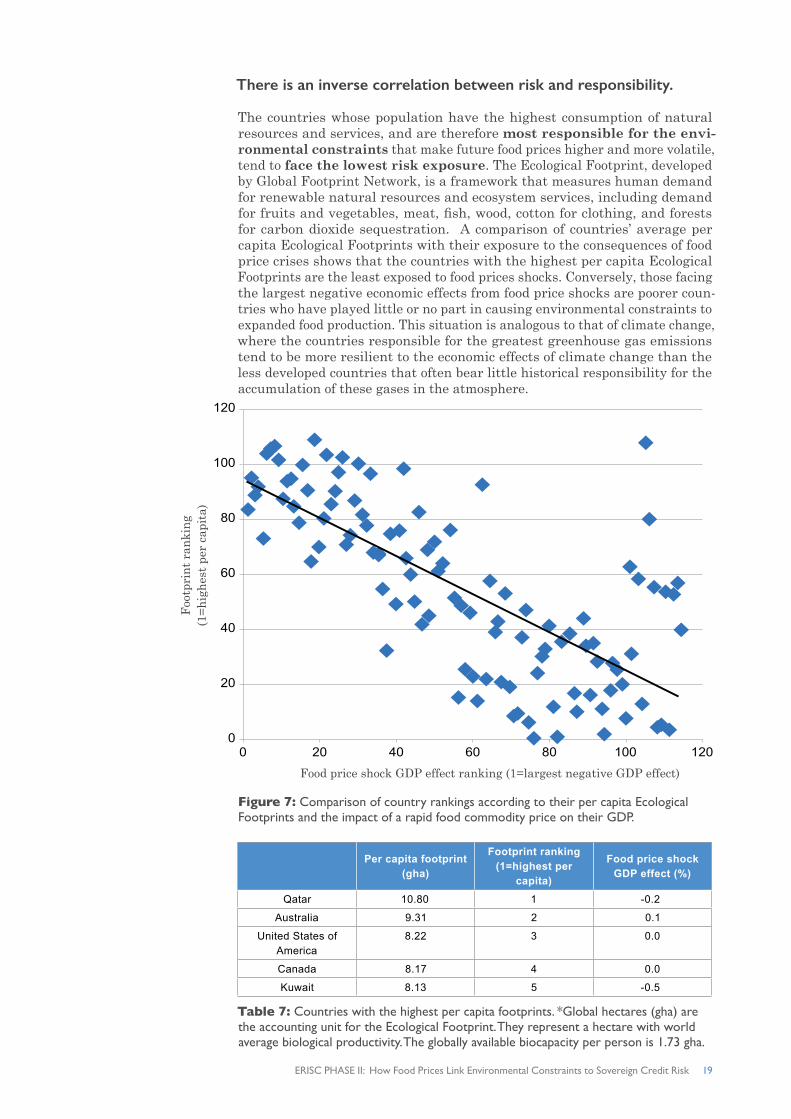
There is an inverse correlation between risk and responsibility.
The countries whose population have the highest consumption of natural resources and services, and are therefore most responsible for the envi-ronmental constraints that make future food prices higher and more volatile, tend to face the lowest risk exposure. The Ecological Footprint, developed by Global Footprint Network, is a framework that measures human demand for renewable natural resources and ecosystem services, including demand for fruits and vegetables, meat, fish, wood, cotton for clothing, and forests for carbon dioxide sequestration. A comparison of countries’ average per capita Ecological Footprints with their exposure to the consequences of food price crises shows that the countries with the highest per capita Ecological Footprints are the least exposed to food prices shocks. Conversely, those facing the largest negative economic effects from food price shocks are poorer coun-tries who have played little or no part in causing environmental constraints to expanded food production. This situation is analogous to that of climate change, where the countries responsible for the greatest greenhouse gas emissions tend to be more resilient to the economic effects of climate change than the less developed countries that often bear little historical responsibility for the accumulation of these gases in the atmosphere.
Figure 7: Comparison of country rankings according to their per capita Ecological Footprints and the impact of a rapid food commodity price on their GDP.
Per capita footprint (gha)
Footprint ranking (1=highest per
capita)
Food price shock GDP effect (%)
Qatar 10.80 1 -0.2
Australia 9.31 2 0.1
United States of America
8.22 3 0.0
Canada 8.17 4 0.0
Kuwait 8.13 5 -0.5
Table 7: Countries with the highest per capita footprints. *Global hectares (gha) are the accounting unit for the Ecological Footprint. They represent a hectare with world average biological productivity. The globally available biocapacity per person is 1.73 gha.
Foo
tpri
nt
ran
kin
g
(1=
hig
hes
t pe
r ca
pita
)
Food price shock GDP effect ranking (1=largest negative GDP effect)

20 United Nations Environment Programme
HOW CAN RESULTS INFORM COUNTRY RISK ASSESSMENT?
This report establishes that food prices are a principal channel through which environmental constraints will affect national economies. The results from the stress test provide quantitative and comparative information on how a global food price crisis would impact key macroeconomic performance indicators. Financial institutions can integrate this information into their models and analysis to inform their risk assessments of countries and ultimately their investment decisions.
To assess how the integration of these findings would affect risk assessment, a participating financial institution in the ERISC project used the GDP and consumer price index results to simulate the impact that the food shock might have on their internal country risk ratings. The institution carried out this exercise for the 78 developing countries that are covered by both the stress test and its country risk assessment methodology.
In the exercise, 58 out of the 78 countries were downgraded in the quantitative rating module by at least one notch in a 19-notch rating system. The countries facing the most severe impacts were downgraded by four notches. No country experienced an upgrade, suggesting that the positive GDP effect that some experience is not large enough to offset the higher inflation caused by rising food prices. Overall, the countries already rated as relatively high risk expe-rience the largest downgrades.
Rating actionNumber of
countries/regions (out of 78)
Examples
No change 20 South Africa, Czech Republic, Saudi Arabia, Poland, Chile
1 notch downgrade 26 China, Hong Kong (China SAR), Israel, Mexico, Russia
2 notch downgrade 16 Indonesia, Nigeria, Pakistan, Ghana, Sri Lanka
3 notch downgrade 14 India, Morocco, Egypt, Tunisia, Kenya
4 notch downgrade 2 Cameroon, Rwanda
Table 8: Changes in the institution’s quantitative rating module resulting from stress test.
It should be noted that the downgrades listed above only affect the quantitative part of the rating procedure. This is followed by a qualitative assessment of other factors that can influence a country’s creditworthiness. This second step can modify the rating up or down, meaning that the final impact on ratings may be different from that presented above.
The institution indicated they see the results as useful for running a scenario to stress test their investment portfolio in line with regulatory requirements, or in response to specific market events such as a food price shock. This underscores the stress test results’ usefulness in the event of a market signal or price event. Due to the uncertainty in timing such an event, however, it is not yet consid-ered appropriate to make any changes to their internal rating methodology to reflect the higher risks facing some countries as a result of environmental risks and constraints to food production. This is because the probability of a food commodity price shock is judged to be low in comparison with other risk factors in their short-term rating horizon.
ERISC PHASE II: How Food Prices Link Environmental Constraints to Sovereign Credit Risk 21
CONCLUDING REMARKS AND FUTURE WORK
The ERISC project, short for Environmental Risk Integration in Sovereign Credit Analysis, aims to help financial institutions to integrate environmental risks in their risk assessments and investment decisions by identifying and quantifying how they can affect countries’ economic performance and thereby their cost of credit in the sovereign debt market. The project’s premise is that sovereign credit risk can be materially affected by environmental risks such as climate change, ecosystem degradation, water scarcity, and deforestation. Phase I showed that environmental risks are material, and quantified this for five countries. In this second phase of research, we focus on food prices as one of the key transmission mechanisms between environmental risks and economic impacts and quantify these impacts for 110 countries.
The results show that many countries can face material risks to their credit quality from a food price shock. Further, the global pressure on food prices is driven by overconsumption in mainly advanced economies, which adversely affects a number of small developing economies. Institutional investors and asset managers would therefore be well served by understanding these risks and their dynamics, and incorporating them into their risk models. Uncertainty in the timing of a food price shock might delay incorporation of these results into current ratings without a strong signal that such a shock may indeed be imminent, especially given the short time horizon of most credit ratings (typically less than two years for sub-investment grade and five years for investment grade). However, analysts should note that the probability of such a shock is likely to increase in the coming years.
Governments are coming to realize that climate change could have a signif-icant material impact on their economies. They should also recognize that the consumption patterns of their populations can have environmental and economic impacts far beyond their borders. Those countries with the highest consumption levels, thus contributing most to global environmental degrada-tion, often face little risk themselves from the food price shocks that can occur as a consequence. By taking steps towards more sustainable production and consumption, these countries can help to alleviate the demand pressures that result in higher and more volatile food prices, thereby reducing both the food security and the economic risks facing poorer countries.
As a next step we therefore encourage governments, investors, credit rating agencies, and banks to work together with us to further investigate the link-ages between environmental risks, economic and socio-political impacts, and to better integrate this information in their sovereign credit risk assessments and investment decisions.

22 United Nations Environment Programme
APPENDIX 1 MODEL ASSUMPTIONS
To gauge the scale of impact of a global food price shock for a wide range of countries, we established a simple model with the following logic:
1. An increase in world dollar food crop prices is passed on to consumer prices in proportion to the direct and indirect importance of food crops in household consumption; domestic food crop prices move in line with world food crop prices. The model does not incorporate the effect of food subsidies.
2. Household incomes are increased (in nominal terms) by the value of the increase in revenue of the country’s food crop producers.
3. The net impact on household real incomes depends on the balance between the scale of the increase in consumer prices and the scale of the increase in revenues of the country’s food crop producers. This depends on whether the country is a net food crop importer or exporter.
4. Real household final expenditure changes in response to real household incomes, with an elasticity of 0.9; no distinction is made between households that gain (food crop producers) and those who lose (food consumers).
5. The model does not have an explicit time dimension. The historical record of recent food crises however suggests that estimated impacts should be interpreted as cumulative over a period of about two years.
6. No attempt is made to model the impact of each country’s tax regime or food subsidy arrangements.
7. No switching of spending between higher-priced food crops and other house-hold consumption items is incorporated; we expect that, for food crops taken as a whole, the price elasticity is low.
8. No exchange rate adjustment is incorporated; the likely change in the short run would be a depreciation in the currencies of the net food crop importers, exacerbating the impact on local consumer prices and increas-ing the differential impact between food crop consumers (negative) and producers (positive).

ERISC PHASE II: How Food Prices Link Environmental Constraints to Sovereign Credit Risk 23
APPENDIX 2 THE 2007-08 FOOD CRISIS : THE FOUNDATION FOR OUR MODEL
The food crisis of 2007-08 provided the parameters of the food price shock for our stress test, which modelled a doubling of food commodity prices.
During this crisis, commodity prices for the main traded cereal crops increased between 80 and 105 per cent. Between early 2007 and mid-2008, the UN Food and Agriculture Organisation’s cereals price index nearly doubled while the price of food in general increased by nearly 60 per cent.28
In large part, the food crisis was a consequence of a long-term trend of increas-ing demand for food driven by population and average income growth. When extreme weather events hit several major grain producing areas in 2006, the imbalance between supply and demand pushed prices upwards.
A number of factors intervened to make the price crisis more severe. The price of oil, a key input to agricultural production in the form of fertilisers and fuel for machinery and transportation, was climbing rapidly. The increasing diversion of agricultural production for biofuel production was also reducing the amount of food being produced. In addition, the depreciation of the US Dollar (the currency in which international commodity prices are set) made crops more expensive in a number of countries. The initial policy response to the rapid jump in food prices only worsened the crisis. A number of impor-tant cereal exporters announced export restriction measures in 2008: India, Viet Nam, Cambodia, and Egypt for rice; Russia, Ukraine, Kazakhstan, and Argentina for wheat. These measures led to large precautionary orders by importing countries that moved food commodity prices significantly higher.
The food crisis pushed 130 million to 155 million people into poverty and contributed to socio-political unrest, with massive public protests over higher food prices held in Egypt, Indonesia, Mexico, Morocco, Peru, and Yemen. Many food importing countries also experienced negative macroeconomic effects, including deteriorations in the balance of payments, exchange rate appreci-ation against the dollar, diminishing foreign exchange reserves, and reduced government revenues.
The food price crisis was brought to an abrupt end by the 2008 financial and economic crisis, which led to a dramatic decrease in global demand. Nonetheless, food prices never fell back to their pre-crisis levels. Indeed, they experienced another spike in 2011, again following drought in some key produc-ing areas. Although they have come down from that peak, food prices remain at levels well above their historical average.
Many of the factors that led to the 2007-08 crisis are still present today. As extreme weather events that can severely disrupt food production become more frequent, a repeat of the sequence of events leading to price spikes and severe socio-economic effects is becoming more likely.

24 United Nations Environment Programme
BIBLIOGRAPHY
1. S&P Global Ratings. The Heat Is On: How Climate Change Can Impact Sovereign Ratings. (2015).
2. Moody’s. Environmental Risks: Heat Map Shows Wide Variation in Credit Impact Across Sectors. (2015).
3. Moody’s. Moody’s Approach to Assessing the Credit Impacts of Environmental Risks. (2015).
4. Hertel, T. W. The Global Supply and Demand for Agricultural Land in 2050: A Perfect Storm in the Making? Am. J. Agric. Econ. 93, 259–275 (2011).
5. Evans, A. The feeding of the nine billion: global food security for the 21st century. (Royal Institute of International Affairs, 2009).
6. Porter, J. R. et al. Food Security and Food Production Systems. In: Climate Change 2014: Impacts, Adaptation and Vulnerability. Part A: Global and Sectoral Aspects. Contribution of Working Group II to the Fifth Assessment Report of the International Panel on Climate Change. (Cambridge University Press, 2014).
7. Gornall, J. et al. Implications of climate change for agricultural productivity in the early twenty-first century. Philos. Trans. R. Soc. B Biol. Sci. 365, 2973–2989 (2010).
8. Global Food Security programme. Extreme weather and resilience of the global food system. Final project report from the UK-US taskforce on extreme weather and global food system resilience. (The global Food Security programme, UK, 2015).
9. Knight, Z., Robins, N., Chan, W.-S. & Weisz, Y. Agriculture: Double trouble - How climate change could disrupt global agriculture. (HSBC, 2011).
10. Lee, B., Preston, F., Kooroshy, J., Bailey, R., and Lahn, G. Resources futures – A Chatham House Report. (Royal Inst. of Intern. Affairs, 2012).
11. WRAP. Food Futures - from business as usual to business unusual. (2015).
12. Strzepek, K. & Boehlert, B. Competition for water for the food system. Philos. Trans. Biol. Sci. 365, 2927–2940 (2010).
13. UK Government Office for Science. Foresight. The Future of Food and Farming. Final Project Report. (2011).
14. United Nations Population Fund. State of the world population 2007 - Unleashing the potential of urban growth. (2007).
15. Kastner, T., Rivas, M. J. I., Koch, W. & Nonhebel, S. Global changes in diets and the consequences for land requirements for food. Proc. Natl. Acad. Sci. 109, 6868–6872 (2012).
16. United Nations Department of Economic and Social Affairs. World Population Prospects
- 2015 Revision: Key findings and advance tables. (2015).
17. Alexandratos, N., Bruinsma, J. & others. World agriculture towards 2030/2050: the 2012 revision. ESA Work Pap 3, (2012).
18. Valin, H. et al. The future of food demand: understanding differences in global economic models. Agric. Econ. 45, 51–67 (2014).
19. OECD. Shifting Gear: Policy challenges for the next 50 years. (2014).
20. Foure, J., Bénassy-Quéré, A. & Fontagne, L. The Great Shift: Macroeconomic Projections for the World Economy at the 2050 Horizon. (Social Science Research Network, 2012).
21. Ward, K. The World in 2050: From the Top 30 to the Top 100. (HSBC Global Research, 2012).
22. Pricewaterhouse Coopers. The world in 2050: The BRICs and beyond: prospects, challenges and opportunities. (2015).
23. Godfray, H. C. J. & Garnett, T. Food security and sustainable intensification. Philos. Trans. R. Soc. B Biol. Sci. 369, 20120273–20120273 (2014).
24. Lloyd’s. Food System Shock – The insurance impacts of acute disruption to global food supply. (2015).
25. International Monetary Fund. IMF Primary Commodity Prices. Available at: https://www.imf.org/external/np/res/commod/index.aspx. (Accessed: 3rd November 2015)
26. Baldos, U. L. C. & Hertel, T. W. The role of international trade in managing food security risks from climate change. Food Secur. 7, 275–290 (2015).
27. ND-GAIN Index. Available at: http://index.gain.org/. (Accessed: 1st December 2015)
28. Food and Agriculture Organization of the United Nations. FAO Food Price Index. Available at: http://www.fao.org/worldfoodsit-uation/foodpricesindex/en/. (Accessed: 30th November 2015)
ERISC PHASE II: How Food Prices Link Environmental Constraints to Sovereign Credit Risk 25
ABOUT
GLOBAL FOOTPRINT NETWORKGlobal Footprint Network is an international research organization that is chang-ing how the world manages its natural resources and responds to climate change. Since 2003 Global Footprint Network engaged with more than 50 nations, 30 cities, and 70 global partners to deliver scientific insights that have driven high-impact policy and investment decisions. Global Footprint Network’s finance initiative helps financial institutions quantify and integrate environmental risk in their investments, credit ratings, and country risk analysis.
www.footprintnetwork.org
UNEP F INANCE INITIATIVEThe United Nations Environment Programme Finance Initiative (UNEP FI) is a unique global partnership between the United Nations Environment Programme (UNEP) and the global financial sector. UNEP FI works closely with over 200 financial institutions who are Signatories to the UNEP FI Statements, and a range of partner organizations to develop and promote linkages between sustainability and financial performance. Through peer-to-peer networks, research and training, UNEP FI carries out its mission to identify, promote, and realise the adoption of best environmental and sustainability practice at all levels of financial institution operations
www.unepfi.org
NATUR AL CAPITAL DECLAR ATIONThe NCD was launched at the UN Conference on Sustainable Development (Rio+ 20 Earth Summit) in 2012 by UNEP FI and the UK-based non-governmental organ-isation, Global Canopy Programme (GCP). It is a worldwide finance led initiative to integrate natural capital considerations into financial products and services, and to work towards their inclusion in financial accounting, disclosure and reporting. Signatory financial institutions are working towards implementing the commit-ments in the Declaration through NCD projects. These are overseen by a steering committee of signatories and supporters and supported by a secretariat formed of the UNEP FI and GCP.
www.naturalcapitaldeclaration.org

For more information, contact:UNEP Finance Initiative15, Chemin des AnemonesCH-1219 Chatelaine, GenevaSwitzerlandTel: +41 (0) 22 917 8178Fax: +41 (0) 22 796 9240E-mail: [email protected]
DTI/1983/GEISBN No: 978-92-807-3561-1
The ERISC project, short for Environmental Risk Integration in Sovereign Credit Analysis, aims to help financial institutions to integrate environmental risks in their risk assessments and investment decisions by identifying and quantifying how they can affect countries’ economic performance and thereby their cost of credit in the sovereign debt market. The project’s premise is that sovereign credit risk can be materially affected by environmen-tal risks such as climate change, ecosystem degradation, water scarcity, and deforestation. Phase I showed that environmental risks are material, and quantified this for five countries. In this second phase of research, we focus on food prices as one of the key transmission mechanisms between environmental risks and economic impacts and quantify these impacts for 110 countries.