eries - journals.lib.unb.ca
TRANSCRIPT
GEOSCIENCE CANADA
SERIES
Remote Predictive Mapping 2.Gamma-RRay Spectrometry:A Tool for Mapping Cana-da's North
K. Ford1, J. R. Harris, R. Shives2, J.Carson and J. BuckleGeological Survey of Canada601 Booth StreetOttawa, ON, Canada, K1A 0E91E-mail: [email protected]
2GamX308 Edward Scott RoadMountain, ON, Canada, K0E 1S0E-mail: [email protected]
SUMMARYThis paper reviews the theory, acquisi-tion and application of gamma-rayspectrometric data for geological map-ping, especially for Canada's North.Theoretical principals are reviewed andsurvey parameters and data acquisitionprocedures are discussed. Interpreta-tion principles are then presented andvarious methods, utilizing computerprocessing, enhancement and classifi-cation procedures are introduced usingmany image examples.
The ability of gamma-rayspectrometry to map the distribution
of potassium, uranium, and thoriumon the surface of the Earth providespowerful assistance for regional andlocal bedrock and surficial geologicalmapping. Important direct and indirectexploration guidance, in a wide varietyof geological settings, is also provided,as is important information for envi-ronmental radiation monitoring andland-use planning.
SOMMAIRELe présent article passe en revue lesfondements théoriques, l'acquisition etl'application des données spec-trométriques du rayonnement gammacomme outil de cartographiegéologique, particulièrement pour leNord canadien. On y examine lesprincipes théoriques et on y discute desparamètres de levé et des méthodesd'acquisition des données. Puis, on yprésente les principes et diverses méth-odes d'interprétation, utilisant le traite-ment de rehaussement et de classifica-tion par ordinateur, à partir de nom-breux exemples d'images.
La cartographie de la distribu-tion du potassium, de l'uranium, et duthorium à la surface de la Terre à partirde techniques de spectrométrie du ray-onnement gamma est une aide pré-cieuse pour la cartographie géologiquede surface locale et régionale. Cettetechnique constitue aussi un importantguide d'exploration direct et indirect,dans une large gamme de contextesgéologiques, tout comme une impor-tante source d'information pour lemonitorage des radiations dans l'envi-ronnement et la planification de l'amé-nagement du territoire.
INTRODUCTIONAll rocks and soils are naturallyradioactive, containing various propor-tions of a variety of radioactive ele-
ments. The natural decay of these ele-ments produces a variety of radiationtypes (alpha, beta, and gamma) at spe-cific energy levels. Only gamma-rayradiation has sufficient range to be use-ful for airborne geophysical surveying,providing a method of measuring con-centrations of individual radioactiveelements (in particular potassium, ura-nium, and thorium) in support ofbedrock and surficial geological map-ping, exploration for a variety of min-eral commodities, and for environmen-tal radiation monitoring. Airbornegamma-ray spectrometric (AGRS) sur-veys provide valuable, systematic cov-erage of large areas, whereas groundgamma-ray spectrometry (GGRS)greatly improves the resolution of indi-vidual radioactive element sources.
Gamma rays are releasedthrough the spontaneous decay ofradioactive elements. The three mostcommon, naturally occurring radioac-tive elements are potassium, uranium,and thorium, which are found in vary-ing concentrations in most rock-form-ing minerals. Potassium occurs mainlyin the mineral feldspar, which is anabundant and widespread mineral inthe Earth's crust. It also occurs inother common rock-forming minerals,such as biotite and muscovite. Uraniumand thorium are generally present inlow concentrations (measured in partsper million, ppm) in a wide range ofminerals. The range of radioactive ele-ment concentrations in most commonrock types is shown in Table 1 (Killeen1979).
Directly or indirectly, thesethree radioactive elements can providean indication of economic concentra-tions of many other metals. For exam-ple, high concentrations of uraniummay directly represent a target of eco-nomic interest, but may also be used as
Volume 35 Numbers 3/4 September/December 2008 109

indirect indicators of other types ofmineralization if they occur as traceelements associated with that mineral-ization, or if they are enriched ordepleted due to alteration. For exam-ple, gamma-ray surveys are effective inmapping potassic alteration associatedwith certain mineral deposit types,including porphyry Cu (–Au–Mo), vol-canogenic massive sulphide and iron-oxide–copper–gold (IOCG; Shives etal. 1997). Maps that show radioactiveelement distribution provide informa-tion about fundamental mineralogicaland geochemical properties of bedrockand surficial deposits, and have provenhighly useful for geological mapping,mineral exploration, and environmentalstudies, often indicating geological fea-tures not seen by other techniques.
Gamma-ray spectrometry(GRS) is a surface technique only, pro-viding a direct measurement ofradioactive element concentrations atthe surface of the Earth. There is nosignificant depth of penetrationbecause the source of most gammaradiation is limited to the top 0.30 mof the Earth's surface. This surface-only characteristic allows geologists toreliably relate the measured radioactiveelement contrasts to the subjacentbedrock and surficial materials, andalteration associated with mineral
deposits. All rocks, and the materialsderived from them, are radioactive,containing detectable amounts of avariety of radioactive elements. Agamma-ray spectrometer is designed todetect the gamma rays associated withthese radioactive elements and to accu-rately sort the detected gamma rays bytheir respective energies. It is this sort-ing ability that distinguishes the spec-trometer from instruments that meas-ure only total radioactivity, e.g. scintil-lometers.
THE GAMMA-RRAYENERGY SPECTRUMData acquired bygamma-ray spectromet-ric methods are normallyportrayed as a multi-channel gamma-rayenergy spectrum. A typi-cal natural radiationenergy spectrum (Fig. 1)depicts the relative countrates at each energy levelfrom 0 to 3 mega-elec-tron volts (MeV). Theinterval from 0 to 0.4MeV is not used becauseit is dominated byCompton scattering ofhigher energy radiation(Grasty 1979). For geo-
logical mapping, the 40K (potassium),bismuth-214 (214Bi, a decay product ofuranium), and thallium-208 (208Tl, adecay product of thorium) peaks are ofinterest. Concentrations of uraniumand thorium are determined indirectlyfrom their daughter products (214Bi and208Tl, respectively), which are assumedto be in equilibrium with their parentisotope. Potassium concentration isdetermined directly from 40K. The term'equivalent' or the abbreviation 'e' isused for reporting concentrations of
110
Table 1. Radioelement concentrations in different classes of rocks (Killeen 1979).
Rock Type Potassium (%) Uranium (ppm) Thorium (ppm)Mean Range Mean Range Mean Range
Felsic Extrusives 3.1 1.0 – 6.2 4.1 0.8 – 16.4 11.9 1.1 – 41.0Felsic Intrusives 3.4 0.1 – 7.6 4.5 0.1 – 30.0 25.7 0.1 – 253.1Intermediate Extrusives 1.1 1.1 – 2.5 1.1 0.2 – 2.6 2.4 0.4 – 6.4Intermediate Intrusives 2.1 0.1 – 6.2 3.2 0.1 – 23.4 12.2 0.4 – 106.0Mafic Extrusives 0.7 0.06 – 2.4 0.8 0.03 – 3.3 2.2 0.05 – 8.8Mafic Intrusives 0.8 0.01 – 2.6 0.8 0.01 – 5.7 2.3 0.03 – 15.0Ultramafic 0.3 0 – 0.8 0.3 0 – 1.6 1.4 0 – 7.5Alkali Feldspathoidal 6.5 2.0 – 9.0 29.7 1.9 – 62.0 133.9 9.5 – 265.0Intermediate ExtrusivesAlkali Feldspathoidal 4.2 1.0 – 9.9 55.8 0.3 – 720.0 132.6 0.4 – 880.0Intermediate IntrusivesAlkali Feldspathoidal 1.9 0.2 – 6.9 2.4 0.5 – 12.0 8.2 2.1 – 60.0Mafic ExtrusivesAlkali Feldspathoidal 1.8 0.3 – 4.8 2.3 0.4 – 5.4 8.4 2.8 – 19.6Mafic IntrusivesChemical Sedimentary Rocks 0.6 0.02 – 8.4 3.6 0.03 – 26.7 14.9 0.03 – 132.0Carbonates 0.3 0.01 – 3.5 2 0.03 – 18.0 1.3 0.03 – 10.8Detrital Sedimentary Rocks 1.5 0.01 – 9.7 4.8 0.01 – 80.0 12.4 0.2 – 362.0Metamorphosed Igneous Rocks 2.5 0.1 – 6.1 4 0.1 – 148.5 14.8 0.1 – 104.2Metamorphosed Sedimentary Rocks 2.1 0.01 – 5.3 3 0.1 – 53.4 12 0.1 – 91.4
Figure 1. Typical gamma-ray spectrometry energy win-dows.

uranium and thorium determined bygamma-ray spectrometry. During anairborne survey, the full spectrum isrecorded once per second, using a 256-channel histogram. During post-flightdata processing, the counts for theradioelements of interest (i.e. 40K, 214Bi,208Tl) are accumulated; this summationincludes the counts for a range ofenergies (a 'window' or 'region ofinterest') centred on each peak. Thestandard energy windows are shown inTable 2. For presentation purposes, theaccumulated count rates are convertedto equivalent ground concentrations ofpotassium, uranium, and thorium usinga set of calibration constants unique tothe spectrometer system being used.
AIRBORNE GAMMA-RRAY SPECTRO-METRIC SURVEYSAirborne geophysical surveys are nor-mally flown in a direction perpendicu-lar to the main geological strike of thesurvey area. For AGRS surveying, theline spacing depends on the objectivesof the survey: in reconnaissance sur-veys it may vary between 2000 and5000 m; in regional surveys it may varybetween 500 and 2000 m; and indetailed surveys flown for mineralexploration purposes, flight line spac-ing can be as little as 100 or 200 m.The above-ground flight elevation (ter-rain clearance) in fixed-wing spectro-metric surveys is normally 120 m,although it may vary between 100 and150 m. For helicopter-borne surveys,the detectors are mounted in the heli-copter, and the nominal terrain clear-ance varies between 60 and 120 m,depending on local terrain conditionsand the configuration of other surveyequipment. Typically, aircraft fly at aspeed of approximately 120 knots (190km/h).
A typical gamma-ray systemincludes a 256-channel spectrometerthat records data at 1-second intervals,
which is equivalent to about 60 m onthe ground. Surveys flown with afixed-wing aircraft usually employ sen-sors consisting of 50 l of thallium-doped sodium iodide NaI(Tl) crystalsin the main detector array, and 8 to 12l of NaI(Tl) crystals in the upward-looking detector array. When using ahelicopter platform, the main detectorarray will usually consist of 33 l ofNaI(Tl) crystals, and the upward-look-ing array from 4 to 8 l. After energycalibration of the spectra, counts fromthe main detector are recorded in thefive windows listed in Table 2. Radia-tion in the upward-looking detector isrecorded in a radon window (1660–1860 kilo-electron volts (keV)). Com-prehensive descriptions of airborneand ground gamma-ray spectrometricsurveys, including fundamentals,instrumentation, calibration, data pro-cessing, and interpretation, are present-ed by Grasty (1979), Grasty et al.(1991), Grasty and Minty (1995), Shiv-es et al. (1995), Dickson and Scott(1997), Horsfall (1997), Minty (1997),Minty et al. (1997), Wilford et al.(1997), and the International AtomicEnergy Agency (2003), and referencestherein.
Spectral enhancement tech-niques such as Noise Adjusted SingularValue Decomposition (NASVD) orMinimum Noise Fraction (MNF) canbe used in GRS to improve the signal-to-noise ratio compared to recordedraw spectra (International AtomicEnergy Agency 2003). These spectral-enhancement techniques impose rigor-ous constraints on the means of meas-uring raw spectra (see Grasty andMinty 1995). The use of these tech-niques will not change the averageresponse for an area but will reducethe noise in individual readings. It hasbeen estimated (Hovgaard and Grasty1997) that NASVD yields an improve-ment similar to that obtained by
increasing the detector volume by afactor of between three and four.
Constants such as strippingratios, attenuation coefficients, andsensitivities must be carefully deter-mined for each acquisition system.Proper application of these constantsduring processing usually results inseamless datasets across individual sur-vey boundaries, regardless of theacquisition system used. Over-watervalues should not be deleted from adataset or set to zero, because such val-ues contain useful data-quality infor-mation. The statistical nature of theGRS technique means that 'negative'concentrations are acceptable in lowaverage count-rate areas. If back-ground corrections are properly deter-mined, and correctly applied, thenradioactive element concentrationsshould yield a mean concentration ofzero over large bodies of water.
Radioelement ratios can offera useful tool for lithological mapping.However, due to statistical uncertain-ties in the individual radioelementmeasurements, some care should betaken in the calculation of theseradioelement ratios. Ratios shouldalways be determined by using radioac-tive element concentrations becauseconcentrations are computed usinginstrument-specific calibration con-stants, ensuring that results from other(calibrated) spectrometer systems willbe consistent. An acceptable methodof determining ratios neglects any datapoints for which the potassium con-centration is less than a predeterminedthreshold, usually 0.25%, as thesemeasurements are likely to have beencollected over water. Next, the elementconcentrations of pairs of adjacentpoints on either side of the data pointare progressively summed until thetotal accumulated concentration inboth the numerator and denominatorexceed values equivalent to at least 100counts prior to conversion to concen-trations. The ratios are then calculatedusing the accumulated sums of con-centration values. With this method,the errors associated with the calculat-ed ratios will be similar for all datapoints.
DATA SOURCESMost of the airborne GRS data forCanada were collected through a vari-
GEOSCIENCE CANADA Volume 35 Numbers 3/4 September/December 2008 111
Table 2. Typical gamma-ray spectrometry energy windows.
Name Element Peak (keV) Energy Range (keV)
K 40K 1460 1360 - 1560U 214Bi 1760 1660 - 1860Th 208Tl 2615 2410 - 2810
Total Count 410 - 2810Cosmic 3000 - 6000
U (Up detector) 214Bi 1760 1660 - 1860

ety of federal and federal/provincialcooperative programs to supportongoing and future geological mappingand mineral resource exploration activ-ities. For these reasons, survey areaswere typically chosen because of theirhigh mineral potential. SystematicAGRS data have been acquired fromabout 1970 to the present, using a vari-ety of aircraft and instrument pack-ages. Figure 2 shows an index map ofAGRS coverage for Canada.
Gamma ray spectrometric datafor Canada are easily accessiblethrough the internet using the Geo-science Data Repository (GDR) at[http://gdr.nrcan.gc.ca]. These data arederived from the digital archives of theRadiation Geophysics Section. Loca-tions of the original flight lines andgridded data for over 300 surveys arecurrently available from the GDR web-site. Grids of Canada at 250 m cellsize, using all digitally archived surveydata, are also available from the GDRwebsite. More information regardingthe collection, distribution, and appli-cations of GRS data can be found byvisiting the Radiation Geophysics web-site at [http://gsc.nrcan.gc.ca/gamma].
INTERPRETATIONUnlike conventional magnetic, electro-magnetic, gravity, and seismic tech-niques that measure physical rockproperties (often in response toinduced effects), and that may detectvariations from source depths of tensto thousands of metres, AGRS andGGRS measure variations in radioac-tivity emanating from the top 0.30 mof the Earth's surface. The three mostabundant natural radioactive elements,potassium, uranium and thorium,occur as major, mobile and immobileelements, respectively, in varying pro-portions, in all rocks and soils.
Because the concentration ofeach radioactive element variesbetween different rock types, a gamma-ray spectrometer can be used to meas-ure these variations and effectively mapthe different rock types. Where thenormal radioactive signature is alteredby a mineralizing process, the resultingalteration-related signature providesexploration guidance. Interpretationbecomes complicated when thesebedrock-related signatures becomeobscured by overlying transported sur-
ficial material or by extreme weatheringeffects. In Canada, extensive glaciationhas mechanically reworked and trans-ported bedrock-derived material. How-ever, the resulting overburden usuallyreflects local bedrock chemistry. Onlywhen the surficial material is composedpredominantly of reworked material,such as glaciofluvial or glaciolacustrinedeposits, does the resulting radioactivi-ty signature not reflect the underlyingbedrock. Effective interpretation,therefore, requires some knowledgenot only of the radioactive elementcontents of rock types expected to befound in the survey area, but alsoknowledge of the glacial history ofthat area.
Interpretation of AGRS datarequires understanding of some basicconcepts of gamma-ray spectrometryand the importance of proper controlson system calibration, data acquisition,data processing, and presentationmethods. Some basic concepts are list-ed here:• AGRS is a remotely sensed geo-
physical technique providing infor-mation about the distribution ofK, U, and Th that is directly inter-pretable in terms of surface geolo-gy.
• AGRS is a surface technique only;interpretation requires an under-standing of the nature of the sur-ficial materials and their relation-ship to bedrock geology.
• Although AGRS measures a physi-cal phenomenon, it is, for geologi-cal and exploration purposes, bestconsidered in geochemical terms,i.e. as 'Airborne Geochemistry'.
• Unlike a camera lens, a gamma-rayspectrometer does not have a'fixed field of view' – a highlyradioactive point source may bedetected even when it lies outsidesome nominal field of view.
• The gamma-ray flux decreasesexponentially with distance fromthe source.
• A single AGRS measurement pro-vides an estimate of the averagesurface concentration for an areaof several thousand square metres;this area is commonly underlain byvariable proportions of bedrock,overburden, soil moisture, openwater, and vegetation.
• Typically, bedrock concentrations
are higher than AGRS values,whereas concentrations in glacialdrift are only slightly higher thanAGRS values. However, AGRSratios (eU/eTh, eU/K, andeTh/K) are normally a closeapproximation of those ratios atground level.
• Ratio patterns can enhance subtlevariations in elemental concentra-tions related to lithological changesor to alteration processes associat-ed with mineralization.
• Not all ratio anomalies are createdequal; caution should be usedwhen interpreting ratio patterns, asquestionable high-ratio anomaliescan be generated by low countrates in the denominator.
The usefulness of AGRS ingeological mapping and mineral explo-ration depends on two factors: 1) theextent to which radioelement distribu-tion relates to bedrock differences andhow this distribution may be modifiedby mineralizing processes; and 2) theextent to which bedrock radioelementcontent is reflected in surficial materi-als that can be spatially related tobedrock sources. Therefore, effectiveapplication of AGRS to geologicalmapping and mineral exploration mustrely on knowledge of: i) how theacquired radioactive element distribu-tions correlate with normal lithologicsignatures; ii) how these normal litho-logic signatures are recognizably modi-fied by mineralizing processes (alter-ation signatures); iii) how these litho-logical and alteration signatures areincorporated into surficial materials;and iv) how these surficial materialscan be spatially related to bedrocksources. Remote predictive mapping(RPM) applications and methodsshould be directed toward improvingour ability to address these four basicproblems of effective AGRS interpre-tation.
Interpretation Issues
Resolution and Line SpacingAirborne gamma-ray spectrometricdata are collected along lines that arespaced anywhere from 5000 to lessthan 500 m apart. The data are denselysampled along the line, but sparselysampled in the across-line direction,depending on the line spacing. This
112

could potentially lead to problems ingridding (interpolating) the data, i.e. increating a continuous image asopposed to a profile. The concept ofspatial correlation comes into play, theterm being a statistical one that can besimply defined as a measure of thetendency for places that are near toeach other to have more similar or dis-similar values (positive or negative cor-relations, respectively). The problemcan be summarized succinctly as fol-lows: if there is little spatial correlationacross each flight line, then interpola-tion of the data should not be under-taken. A variogram can be used to testwhether spatial correlation exists, bothalong-line and across-line. Figure 3shows variograms of AGRS dataacquired with 5 km flight line spacingover the Melville Peninsula, Nunavut.Clearly, as might be expected, spatialcorrelation exists along the flight linewith a range parameter from 500 to1000 m (Fig. 3a, c). However, correla-tion also exists, albeit at much greaterdistances (approximately 25 000 to atleast 40 000 m; Figs. 3b, d) across theline as well, indicating that, generally,gamma-ray data can be gridded (inter-
polated), even at 5000 m spacing. Spa-tial correlation also depends on the ori-entation of the flight line with respectto the regional geological strike (seeFigs. 4, 5); e.g. spatial correlation willincrease if the flight lines are parallelto the regional strike.
Like any other remote sensor,spatial resolution plays a significantrole in determining how much geologi-cal detail can be extracted from theimagery, either in a visual sense orthrough the use of computer-process-ing techniques. With respect togamma-ray data, this is clearly illustrat-ed in Figure 4, which shows gridded,ternary images of an area in south-western Nova Scotia at three differentline spacings. It is interesting to note inthis survey, which was flown over vari-ous phases of the South MountainBatholith, that the same basic geologi-cal information (i.e. the major geologi-cal features) is available at a wider linespacing (lower resolution) as in higherresolution surveys with closer linespacings. In fact, the overall correlationbetween the images acquired at differ-ent line spacings is statistically similar(Table 3). The difference is a simple
matter of detail. In fact, details of rap-idly varying surface cover conditions,such as soil moisture and surface water,are often suppressed on lower resolu-tion data, in which much of theresponse reflects regional bedrock pat-terns.
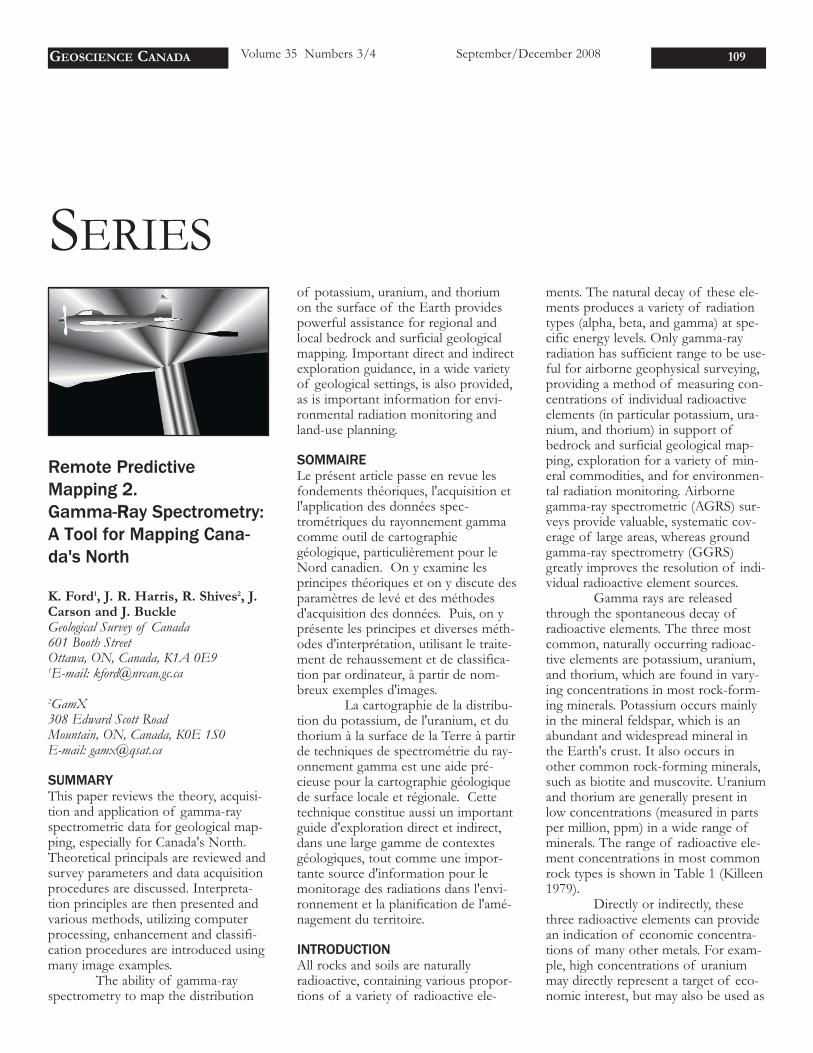
Grid versus Profile Data Presenta-tionsGridded data are useful for regionalmapping; however, due to the smooth-ing effect of the interpolation process,the detail offered by along-line profiledata is much greater (Fig. 5). Many ofthe small-scale variations that may beuseful for mineral exploration applica-tions (e.g. identification of small anom-alies) are averaged-out in the interpola-tion process. This illustrates the benefitof using both gridded and profile datafrom regional and more detailed map-ping studies.
Bedrock Response versus SurficialResponseGamma-ray data are erroneouslythought to be a tool only for mappingsurficial cover, and not bedrock. Eventhough gamma rays originate from thetop 0.30 m of the ground, under con-ditions of thin, residual till cover orincorporation of a significant percent-age of locally derived bedrock materialinto the overburden, the surfaceresponse will often reflect underlyingbedrock patterns. As with any othersurface remote-sensing technique, thegeological environment must beassessed beforehand in order to deter-mine what data types will be appropri-ate for predictive mapping.
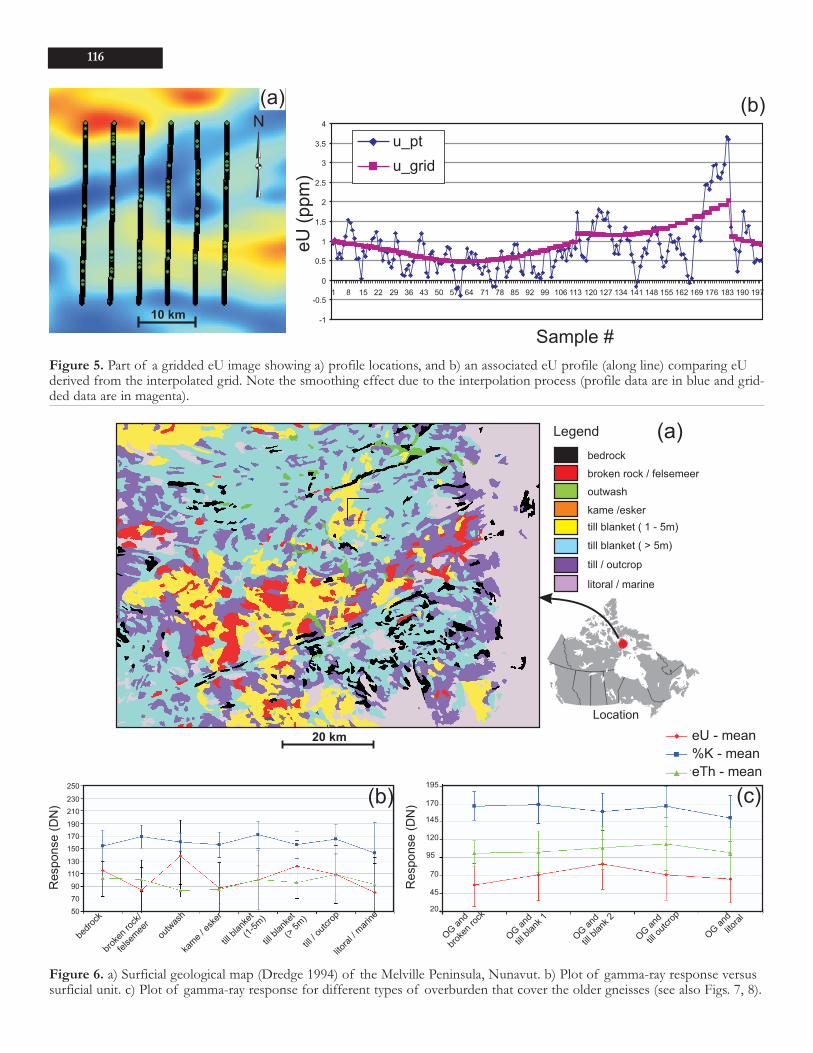
How much of the gamma-rayresponse can be attributed to bedrockand how much to surficial cover? Thiswill again depend on the geologicalenvironment, but the Melville Peninsu-la study has resulted in some importantobservations. A plot of gamma-rayresponse for various mapped surficialunits is shown in Figure 6. Clearly, avariation in the gamma-ray signal fromdifferent surficial units can be seen,especially for eU. However, thegamma-ray response pattern is alsosimilar to the mapped bedrock geology,and produces a unique statisticalresponse (Fig. 7). If one were to meas-ure the variability of the surficialresponse over a single geological unit
GEOSCIENCE CANADA Volume 35 Numbers 3/4 September/December 2008 113
Figure 2. Index of airborne gamma-ray spectrometry coverage in Canada (Sep-tember, 2008).

(Fig. 6b), a small part of the responsecan be attributed to variation in surfacecover. However, the range of response,in this area, is greater for the bedrockthan for the surface cover (Fig. 8). Infact, the gamma-ray data can show sig-nificant variations within a given rockunit (Fig. 9). This is useful for mappingpurposes, as it points to discrepanciesor inconsistencies in the geologicalfield data that can be indicated on apredictive map and followed up in thefield.
DATA VISUALIZATION AND PRO-CESSING
Variables and Standard SurveyProductsAirborne gamma-ray spectrometricdata are usually represented by fourmeasured variables, potassium (K, %),equivalent uranium (eU, ppm), equiva-lent thorium (eTh, ppm), and total airabsorbed dose rate (nano Grays/hour:nGy/h). Five derived products arerequired to fully present the AGRSdata. These include the three radioac-tive element ratios (eU/eTh, eU/K(ppm/%), and eTh/K (ppm/%)), theternary radioactive element map(Broome et al. 1987), and the natural
air absorbed dose rate (nGy/h). Thecomplete display of all these datarequires eight colour interval maps orimages, including the ternary map.Examples of standard colour intervalmaps and ternary radioactive elementmaps are shown in Figures 10 and 11,respectively. In addition, a full suite ofstandard maps is presented in the Geo-logical Survey of Canada's RemotePredictive Mapping Manual (Chapter 4,Figs. 4-16 and 4-17; Geological Surveyof Canada 2008). Most map productsrequire the data to be interpolated ontoa regular grid. Many of the standardgridding algorithms are unsuited toAGRS data because of the inherentstatistical variations. A suitable gridding
114
Figure 3. Variograms calculated from gamma-ray sample points acquired over the Melville Peninsula, Nunavut: a) eU alongline; b) eU across line, c) eTh along line, and d) eTh across line. Note the differences in variogram structure (variation of sill,range, and nugget). e) The hypothetical (ideal) variogram shows the range, sill, and nugget. Range represents the distance atwhich sample points are no longer spatially associated. Sill represents the portion of the variogram where the model flattens,indicating where samples are no longer associated. Nugget represents small-scale variations at distances of less than the lag dis-tance.

algorithm is one that takes the averageof all data points lying within a circularor elliptical area, inversely weighted fordistance from the grid point orthrough the use of geostatistics (vari-ogram in concert with kriging).
The ternary or three-compo-nent radioactive element map (Fig. 11)is an effective method of displayingvariations in total radioactivity and therelative abundances of the threeradioactive elements. Areas of theimage with the same colour will havesimilar ratios of K, eU, eTh, and theintensity of that colour is a measure ofthe total radioactivity. This allows themap to represent the radioactive ele-ment distribution better than any ofthe other single variable or ratio maps.The ternary map is often easier towork with to get an overview of thedistribution of radioactivity; however,it does not replace the more detailed,quantitative information available onthe other seven maps (total or naturalair absorbed dose rate, K, eU, eTh,eU/eTh, eU/K, and eTh/K).
Often, depending on the com-plexity of the geology, subtle variationsin K, U, and/or Th may not be readilyapparent. For these reasons, the properinterpretation of GRS data requires theexamination of all of the measuredvariables and associated derived prod-ucts. Ratio maps (Fig. 11b) canenhance or reinforce subtle variationsin the measured variables, which canbe particularly important, especiallywhen dealing with varying intensitiesof alteration associated with a mineral-izing process. For example, potassiumalteration (enrichment) associated withcertain types of mineral deposits mayoccur in host rocks with normally lowto moderate levels of K, resulting in ahigh total K signature. This would beeasily recognized if this alterationoccurred in isolation. However, theremay be normal, high-K rock types inclose proximity to the altered rocks. Inthis situation, the K associated with thealteration may not be distinguishablefrom other high-K rock types. Theratio maps, in particular eTh/K, can bea sensitive indicator of K alterationassociated with mineralization and canbe used as a direct indicator of miner-alization. The addition of K associatedwith alteration will normally result inlow eTh/K because thorium is relative-
GEOSCIENCE CANADA Volume 35 Numbers 3/4 September/December 2008 115
Figure 4. Interpolated ternary gamma-ray data acquired using different line spac-ings, and classified maps (unsupervised K-means algorithm) for an area underlainby the South Mountain Batholith in southwestern Nova Scotia (a and b); 5 km linespacing (c and d); 1 km line spacing (e and f); 250 m line spacing (g and h). In c), e)and g), eU (ppm), eTh (ppm), and K (%) are displayed through red, green, andblue colours, respectively; d), f) and h) are classified maps showing five distinctradioelement classes that define the South Mountain Batholith and surroundingarea. Note the difference in the detail with respect to radioelement domains provid-ed by the higher resolution data. However, the overall general patterns of radioele-ment zones are similar, regardless of spatial resolution.
Table 3. Correlation of gamma-ray data acquired from different line spacings foreU (ppm), eTh (ppm), and K (%). The correlations between the data are moderateto strong with the lowest correlations between data with the largest difference inline spacing (i.e. 5 km vs. 250 m). Sample dataset is from southwestern Nova Sco-tia, the same as that used in Figure 4.
eU – 5 km eU – 1 km eU – 0.25 kmeU – 5 km 0.84 0.76eU – 1 km 0.87eU – 0.25 km
eTh – 5 km eTh – 1 km eTh – 0.25 kmeTh – 5 km 0.75 0.63eTh – 1 km 0.85eTh – 0.25 km
%K – 5 km %K – 1 km %K – 0.25 km%K – 5 km 0.82 0.63%K – 1 km 0.86%K – 0.25 km
116
Figure 5. Part of a gridded eU image showing a) profile locations, and b) an associated eU profile (along line) comparing eUderived from the interpolated grid. Note the smoothing effect due to the interpolation process (profile data are in blue and grid-ded data are in magenta).
Figure 6. a) Surficial geological map (Dredge 1994) of the Melville Peninsula, Nunavut. b) Plot of gamma-ray response versussurficial unit. c) Plot of gamma-ray response for different types of overburden that cover the older gneisses (see also Figs. 7, 8).

ly immobile and its concentrationremains constant. Shives et al. (1995,1997) present a number of case histo-ries that demonstrate the use of AGRSand GGRS to map potassium alter-ation associated with different styles ofmineralization, including volcanogenicmassive sulphides, polymetallic, mag-matic-hydrothermal (Au–Co–Cu–Bi–W–As (Olympic Dam-type)), and por-phyry Cu–Au–(Mo) deposits. On aregional scale, subtle variations in themeasured variables, which are rein-forced on the ratio maps, have beenshown on maps of eU, eTh, andeU/eTh for southern Nova Scotia(Ford and O'Reilly 1985; Ford et al.1989). Within the peraluminousgranitic rocks of southern Nova Sco-tia, uranium concentrations generallyincrease and thorium concentrationsdecrease with increasing magmatic dif-ferentiation, resulting in abnormallyhigh eU/eTh associated with the most
GEOSCIENCE CANADA Volume 35 Numbers 3/4 September/December 2008 117
Figure 7. Gamma-ray data acquired from flight lines spaced 5 km apart over the Melville Peninsula, Nunavut. a) Geologicalmap of Melville Peninsula (Henderson 1987) and associated legend; b) ternary image in which eU (ppm), eTh (ppm), and K(%) are displayed through red, blue, and green colours, respectively; c) generalized bedrock geology; and d) gamma-ray responseover each generalized lithologic unit shown in c); legend as in c). Note the variation, especially in K and eU, between young peg-matites and pelitic and older gneisses. Units in the Y axis have been converted from eU (ppm), eTh (ppm), and K (%) to byteunits (DN–digital numbers ranging from 0 to 255).
Figure 8. Bar chart showing the variation (range) in gamma-ray response for eU,eTh, and %K over bedrock and till, Melville Peninsula, Nunavut. Variation for eUand %K is greater for bedrock than till, indicating that compositional variations inthe bedrock contribute more to the range of radioelement variations.

evolved parts of these granitic intru-sions.
While gridding (interpolating)GRS data to produce colour intervalmaps or images, it is important to visu-ally represent the geographic variationsof a single variable. In contrast, a mul-tivariable stacked-profile display (Fig.12) is an essential tool for the visualanalysis of all variables at each samplepoint. A stacked-profile presentation
format permits the viewing of point-to-point data for all variables (meas-ured and derived). Gridding airbornegamma-ray spectrometric data, particu-larly if the data were collected with awide flight line spacing, requires a sig-nificant amount of interpolation,which will result in the loss of somedetailed point-to-point information.Viewing of the point-to-point or linedata in a stacked-profile format (Fig.
12) requires only a minimum amountof along-line filtering, thereby preserv-ing more of the detailed point-to-pointinformation.
Data Visualization
Single BandGamma-ray data can be presented asprofiles (Figs. 5 and 12), as griddedblack and white images, or as colouredimages (Fig. 10), and the data usuallyvary over a narrow range of valuescompared with other geophysical (e.g.total-magnetic field) data. The data canbe displayed as an image in concentra-tion units or contrast-stretched to abyte format. The advantage of colourimages is that the human eye can dis-tinguish a much larger range ofcolours compared to black and whitetones.
MultibandLike optical LANDSAT and/or multi-beam radar data, gamma-ray channels(bands) can be displayed as ternarycolour composite images (Fig. 11),allowing for the interpretation of threechannels of elemental or ratio datausing an additive mix of the primarycolours (red-green-blue) of the com-puter display system.
EnhancementLike any raster-based dataset, the datacan be contrast-stretched to improveits dynamic range. A decorrelationand/or saturation stretch (Gillespie etal. 1986), often applied to improve the
118
Figure 9. Ternary gamma-ray image (eU, %K, eTh – red, green, blue) of just theolder gneissic units from Melville Peninsula, Nunavut. Note the variation ingamma-ray response within the gneisses; especially prominent is the dichotomy inresponse between the north (with high eU and moderate %K) and south (mostlyhigher %K and lower eTh and eU). Surficial geological contacts are shown as solidwhite lines (see Fig. 6).
Figure 10. Visualizations of gamma-ray spectrometric data over the Melville Peninsula, Nunavut. a) Black and white map of eU(ppm); b) colour map of eU (ppm) (geological contacts are shown as solid lines).

colour range of LANDSAT data, canalso be applied to gamma-ray datausing most image analysis systems (Fig.13). These stretches are more thansimple arithmetic transforms that uti-lize simple mathematical functions (lin-
ear, square root, etc.) to transform thedata. They involve either a multivariatestatistical transform of the data (decor-relation stretch) or a colour-spacetransform (saturation stretch). In bothcases the goal is the same: to provide
an image in which subtle geologicalfeatures are enhanced though a widerange of hues.
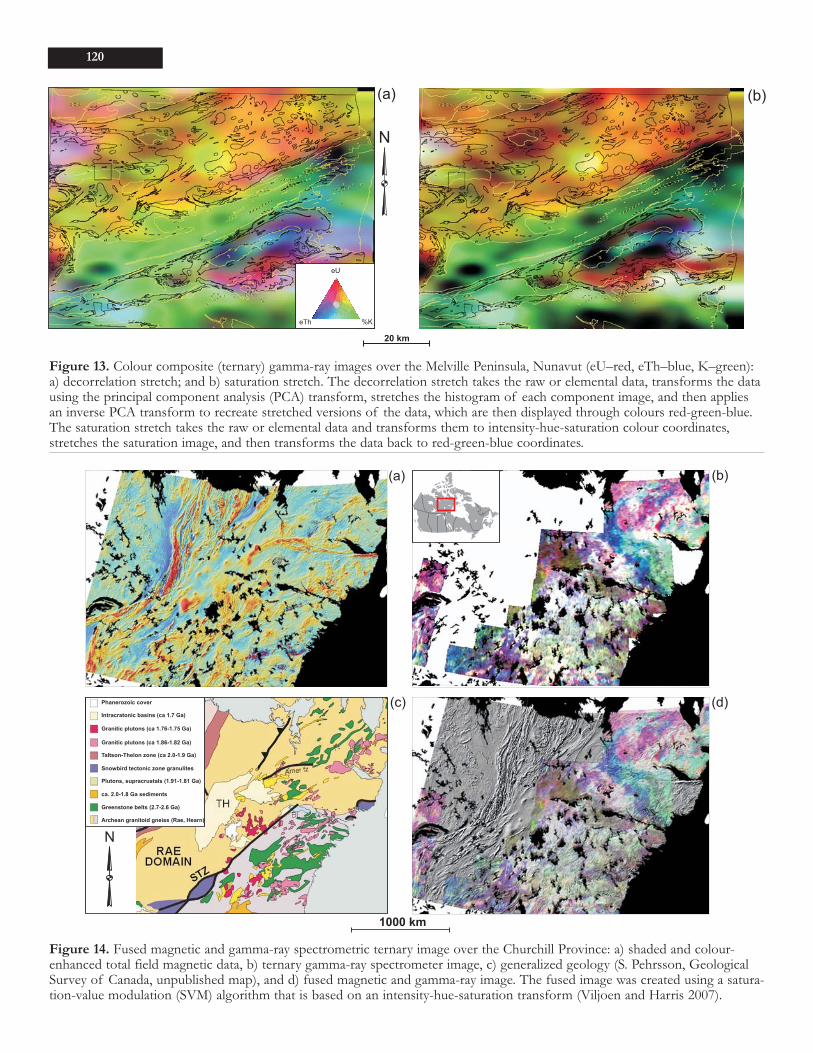
FusionLike optical and microwave data,gamma-ray data may be fused withother types of remotely sensed infor-mation to create complementaryimagery from the combined datasets. Afusion of gamma-ray and magneticdata (Fig. 14) often provides an imagein which many geological features canbe identified including radioelementdomains (Fig. 15), faults, lineaments,plutons (Fig. 4), various rock units,and, in some cases, metamorphicdomains (Fig. 15c).
Gamma-ray data can also befused with topographic data creating,an image in which potential gamma-rayanomalies can be directly compared totopographic patterns (Fig. 16a). Thiscan be applied to help determine thesource of gamma-ray anomalies.Gamma-ray data can also be fused withother geophysical variables, such astotal magnetic field data or othergamma-ray images; e.g. eTh/K on Kmay potentially illustrate the locationof potassium alteration zones.
2.5-Dimensional VisualizationsDifferent perspectives (e.g. 2.5-D) canbe employed to not only fuse differentdata types but also to effectively visual-ize the relationships (both spatial andsignature response) between them. Fig-
GEOSCIENCE CANADA Volume 35 Numbers 3/4 September/December 2008 119
Figure 11. Colour composite (ternary) gamma-ray images over the Melville Peninsula, Nunavut. a) Raw (elemental) data(eU–red, eTh–blue, K–green). Note the major geological/tectonic divisions (A–pelitic gneiss and pegmatites, B–older gneiss,C–supracrustals); b) ratio data (U/K–red, Th/K–blue, U/Th–green) (geological contacts are shown as solid lines).
Figure 12. Airborne gamma-ray spectrometric multivariable stacked profiles fromflight line 405 for the Quoich River area in the southern Melville Peninsula,Nunavut. Note the broad elevated eU/eTh ratio area between records 160 and 350,which is coincident with a broad low eTh area. Within this area, narrower higheU/eTh anomalies are coincident with high eU anomalies. These signatures aretypical of the late pegmatitic intrusive rocks that are commonly anomalous in ura-nium.
120
Figure 13. Colour composite (ternary) gamma-ray images over the Melville Peninsula, Nunavut (eU–red, eTh–blue, K–green):a) decorrelation stretch; and b) saturation stretch. The decorrelation stretch takes the raw or elemental data, transforms the datausing the principal component analysis (PCA) transform, stretches the histogram of each component image, and then appliesan inverse PCA transform to recreate stretched versions of the data, which are then displayed through colours red-green-blue.The saturation stretch takes the raw or elemental data and transforms them to intensity-hue-saturation colour coordinates,stretches the saturation image, and then transforms the data back to red-green-blue coordinates.
Figure 14. Fused magnetic and gamma-ray spectrometric ternary image over the Churchill Province: a) shaded and colour-enhanced total field magnetic data, b) ternary gamma-ray spectrometer image, c) generalized geology (S. Pehrsson, GeologicalSurvey of Canada, unpublished map), and d) fused magnetic and gamma-ray image. The fused image was created using a satura-tion-value modulation (SVM) algorithm that is based on an intensity-hue-saturation transform (Viljoen and Harris 2007).

ure 16b shows a 2.5-D perspectiveimage in which the relief reflects themagnetic total field and the colourreflects eU response over the MelvillePeninsula, Nunavut. Correlationsbetween the two data types can be seenover the supracrustal rocks (labelled Aand B on Fig. 16b).
Computer-Assisted AnalysisGamma-ray data often comprise 7channels of data, as mentioned above;hence, multivariate processing tech-niques can be applied to the data bothfor enhancement and classificationpurposes.
Principal Component AnalysisThe principal component analysis
(PCA) transform can be applied tomake a reduced dataset comprising aseries of component images that are alinear combination of all the gamma-ray data (Fig. 17). Individually, thesecomponent images often reveal geolog-ical information, but when combinedin colour ternary images (Fig. 18), geo-logical features are often enhanced byvariations in colour.
ClassificationThe computer can be used to enhancegamma-ray data to create images forvisual interpretation, as already dis-cussed. However, the same classifica-tion techniques that are applied toLANDSAT and radar data can also beapplied to gamma-ray data to automati-
cally or semi-automatically create pre-dictive maps.
UnsupervisedVarious combinations of the gamma-ray data channels can be classifiedusing an unsupervised classificationalgorithm to produce a thematic mapof radioelement domains (classes) thatshow a distinct statistical separation(Fig. 19). The advantage of thisapproach is that it requires little inputby the geologist other than specifyingthe number of classes. In many cases,this type of predictive map reveals pat-terns that can be directly related tolithological variations.
GEOSCIENCE CANADA Volume 35 Numbers 3/4 September/December 2008 121
Figure 15. Geological interpretations of gamma-ray spectrometer data. a) Ternary image over the Melville Peninsula, Nunavutand interpreted radioelement domains; b) geological map of Melville Peninsula (Henderson 1987); c) ternary gamma-ray imageof part of the Churchill Province showing interpreted radioelement domains that reflect small-scale compositional and meta-morphic domains (Rob Berman, pers. comm. 2007); d) geological map of the area shown in (c) (S. Pehrsson, Geological Surveyof Canada, unpublished map).

SupervisedSupervised classification involves theuse of 'training' area statistics to char-acterize each rock type to be classified.These signatures are then used to clas-sify the image into classes that havesimilar statistics to the training areas(Fig. 20). The results of a supervisedclassification (using a maximum likeli-hood algorithm) of major tectonicdivisions over the Melville Peninsula,Nunavut, using a number of combina-tions of gamma-ray channels, as wellas total field magnetic data, is present-ed in Figure 21. Using all GRS chan-nels, a classification accuracy of closeto 70% can be achieved for the majortectonic units. The misclassified areas(30%) are characterized by variations ingamma-ray response resulting fromboth surficial and bedrock variations.
Different supervised classifica-tion algorithms are available and atpresent much emphasis is being placedon neural network classifiers that arequite robust and often lead to verypositive results. Figure 22 presents aneural network classification of litho-logical units (as opposed to major tec-tonic units) in the Melville Peninsula.In this example, a 64% classificationaccuracy of the lithological units wasachieved when using just eU, eTh, andK. This increased to 70% when themagnetic data were included.
122
Figure 16. An example of fused gamma-ray and topographic imagery over theMelville Peninsula, Nunavut (see Figs. 6 and 7 for location). a) Digital ElevationModel (DEM) fused with gamma-ray ternary image showing topographic patternsthat can be directly related to the radioelement response; b) 2.5-D visualization ofmagnetic data provides 'topographic relief' with eU gamma-ray spectrometer dataproviding the colour. Features labelled "A" and "B" indicate areas of correlationbetween magnetic and eU data.
Figure 17. (adjacent) A description ofthe principal component analysis(PCA) transform. This example showsPCA applied to gamma-ray data overthe Melville Peninsula, Nunavut (seeFigs. 6 and 7 for location). Raw (ele-mental) data (eU, eTh, K) and ratiodata are transformed using PCA creat-ing component images (PCA1 to 6),which are linear combinations of theinput data. The first few componentimages contain most of the informa-tion (variance) of the dataset (see thetable of eigenvalues). The individualcontribution of each input band (i.e.eU, eTh, K, and ratios) can beobtained from a table of eigenvectors(component loadings).

GEOSCIENCE CANADA Volume 35 Numbers 3/4 September/December 2008 123
Figure 18. Ternary gamma-ray images of principal component (PCA) transform images from the Melville Peninsula, Nunavut.a) PCA 1, 2, 3 (red, green, blue); b) PCA 3, 4, 6 (red, green, blue). The ternary images comprising the PCA component imagesprovide good enhancement of major geological/tectonic units (geological contacts are shown as solid background lines). SeeFigures 6 and 7 for location.
Figure 19. Unsupervised classification of gamma-ray data over the Melville Peninsula, Nunavut, showing automatically generat-ed radioelement domains (classes). a) Classification (prediction) map of radioelement domains derived from eU, eTh, and K; b)classification (prediction) map of radioelement domains derived from ratio data (eU/eTh, eU/K, eTh/K; see Figures 6 and 7for location). The classification maps show radioelement domains (i.e. areas that display similar gamma-ray response); see theassociated plots of gamma-ray response for each cluster or radioelement domain in Figure 11. The classification maps display agood correspondence to the bedrock geology but also show areas that do not show the expected response for a given bedrocktype; these areas warrant checking in the field.

CONCLUSIONSThe ability of gamma-ray spectrometryto map the distribution of potassium,uranium, and thorium at the surface ofthe Earth provides powerful assistancefor regional and local bedrock and sur-ficial geological mapping. Importantdirect and indirect exploration guid-ance in a wide variety of geological set-tings is also provided, as is importantinformation for environmental radia-tion monitoring and land-use planning.
Data enhancement and pres-entation methods can provide valuableinterpretation assistance for gamma-rayspectrometric data. Ratio maps, includ-ing ternary K-U-Th colour presenta-tions, are useful but, in the absence ofcorresponding radioelement concentra-tion maps, are ambiguous. Flight linedata, presented as stacked profiles, pro-vide more detail than the inherentlysmoothed contour maps.
Proper interpretation of
gamma-ray spectrometric data requiresa clear understanding of petrology, sur-ficial and bedrock geology, and geo-chemistry, as well as the gamma-rayspectrometric method itself. Despitethe availability of large quantities ofairborne gamma-ray spectrometric datacollected since the 1970s and thedevelopment and publication ofnumerous case histories that clearlydemonstrate the application to map-ping and mineral exploration, the tech-nique remains under-utilized and poor-ly understood by many potential users.The challenge remains to further devel-op techniques and case histories thatcontinue to illustrate the broad rangeof applications, and to effectively dis-seminate this knowledge.
ACKNOWLEDGEMENTSThis work was carried out and
funded under the Remote PredictiveMapping Project, part of NRCAN's
Earth Sciences Sector's (ESS) North-ern Minerals Development Program.This paper is GSC contribution #20070579. The authors wish to expresstheir appreciation to John Spray andthe editorial staff of Geoscience Cana-da for their very constructive com-ments to improve this manuscript.
REFERENCESBroome, J., Carson, J.M., Grant, J.A., and
Ford, K.L., 1987, A modified ternaryradioelement mapping technique andits application to the south coast ofNewfoundland: Geological Survey ofCanada, Paper 87-14, scale 1:100 000.
Dickson, B.L., and Scott, K.M., 1997,Interpretation of aerial gamma-raysurveys–adding the geochemical fac-tors: Australian Geological SurveyOrganization, Journal of AustralianGeology and Geophysics, v. 17, p.187-200.
Dredge, L.A., 1994, Surficial geology, Bar-row River, District of Franklin,Northwest Territories: Geological Sur-vey of Canada, Map 1849A, scale1:200 000.
Ford, K.L., and O'Reilly, G.A., 1985, Air-borne gamma-ray spectrometric sur-veys as an indicator of granophile ele-ment specialization and associatedmineral deposits in the granitic rocksof the Meguma Zone of Nova Scotia,Canada, in High Heat Production(HHP) Granites, Hydrothermal Circu-lation and Ore Genesis, papers pre-sented at the High Heat Production(HHP) Granites, Hydrothermal Circu-lation and Ore Genesis Conference:The Institution of Mining and Metal-lurgy, London, England, p. 113-133.
Ford, K.L., MacDonald, M.A., Finck, P.W.,Boner, F.J., Ham, L.J., Horne, R.J.Corey, M.C., and Graves, R.M., 1989,Airborne gamma ray spectrometry,and bedrock and surficial geology ofthe Davis Lake Pluton, in Mines andMinerals, Report of Activities 1989,Part A: Nova Scotia Department ofMines and Energy, Report 89-3.
Geological Survey of Canada, 2008,Remote Predictive Mapping: An Aidfor Northern Mapping, GeologicalSurvey of Canada Open File Report5643, DVD, Natural Resources Cana-da.
Gillespie, A. R., Kahle, A.B., and Walker,R.E., 1986, Color enhancement ofhighly correlated images. I. Decorrela-tion and HIS contrast stretches:Remote Sensing of Environment, v.20, p. 209-235.
Grasty, R.L., 1979, Gamma-ray spectromet-ric methods in uranium
124
Figure 20. A supervised classification process involves collecting representativestatistics for each rock type, for each image to be classified (eU, eTh, K, etc.).These are referred to as ‘training areas’. Statistical measures (e.g. transformed diver-gence) are then calculated to determine whether the training areas are statisticallyseparable. If they are, then a classification algorithm (maximum likelihood, neuralnetworks, etc.) is selected to classify the entire image from all or a selected set ofinput bands using the statistics derived from the training areas. This produces aclassification (or prediction) map that can be validated using cross-correlationmeasures (i.e. the classification is compared to a check training site or the geologi-cal map itself).

GEOSCIENCE CANADA Volume 35 Numbers 3/4 September/December 2008 125
Figure 21. Supervised classification(prediction) of major tectonic divi-sions using a maximum likelihoodalgorithm applied to gamma-ray andmagnetic data for the Melville Peninsu-la, Nunavut (see Figs. 6 and 7 for loca-tion). Training samples for each of themajor tectonic units were gatheredfrom legacy field data (point loca-tions). Some of these were used forclassification purposes whereas otherswere used for validation (cross-correla-tion) purposes . The accuracy, whencompared to the check training sites,varied from close to 60% accuracy,when just using eTh, eU, and K forclassification, to 72% when using bothgamma-ray data (raw or elemental +ratios) and magnetic data.
Figure 22. Supervised classification (prediction) of geological units using a neural network algorithm applied to gamma-ray andmagnetic data over the Melville Peninsula, Nunavut (see Figure 7 for location). Training samples for each of the major unitswere gathered from the geological map areas. Some of these were used for classification purposes, whereas others were used forvalidation (cross-correlation) purposes. Accuracies, when compared to the check training sites, varied from 56% using thegamma-ratio data to 70% using both gamma-ray data (raw (elemental) + ratios) and magnetic data.

exploration–theory and operation pro-cedures, in P.J. Hood, ed., Geophysicsand Geochemistry in the Search forMetallic Ores: Geological Survey ofCanada, Economic Geology Report31, p. 147-162.
Grasty, R.L., and Minty, B.R.S., 1995, Aguide to the technical specificationsfor airborne gamma-ray surveys: Aus-tralian Geological Survey Organisa-tion, Record 1995/60, 89 p.
Grasty, R.L., Mellander, H., and Parker M.,1991, Airborne gamma-ray spectrome-ter surveying: International AtomicEnergy Agency, Technical ReportSeries 323, Vienna, 97 p.
Henderson, J.R., 1987, Geology, southeast-ern Melville Peninsula, District ofFranklin, Northwest Territories: Geo-logical Survey of Canada, Map 1655A,scale 1:100 000.
Horsfall, K.R., 1997, Airborne magneticand gamma-ray data acquisition: Aus-tralian Geological Survey Organiza-tion, Journal of Australian Geologyand Geophysics, v. 17, p. 23-30.
Hovgaard, J. and Grasty, R.L., 1997,Reducing Statistical Noise in AirborneGamma-Ray Data Through SpectralComponent Analysis, in A.G. Gubins,ed., Proceedings of Exploration 97,Fourth Decennial International Con-ference on Mineral Exploration: Geo-physics and Geochemistry at the Mil-lennium, p. 753-764.
International Atomic Energy Agency, 2003,Guidelines for radioelement mappingusing gamma ray spectrometry data:International Atomic Energy Agency,TECDOC-1363, 173 p.
Killeen, P.G., 1979, Gamma-ray spectro-metric methods in uranium explo-ration–application and interpretation,in P.J. Hood, ed., Geophysics and Geo-chemistry in Search for Metallic Ores:Geological Survey of Canada, Eco-nomic Geology Report 31, p. 163-230.
Minty, B.R.S., 1997, Fundamentals of air-borne gamma-ray spectrometry: Aus-tralian Geological Survey Organiza-tion, Journal of Australian Geologyand Geophysics, v. 17, p. 39-50.
Minty, B.R.S., Luyendyk, A.P.J., and Brodie,R.C., 1997, Calibration and data pro-cessing for airborne gamma-ray spec-trometry: Australian Geological Sur-vey Organization, Journal of Aus-tralian Geology and Geophysics, v. 17,p. 51-62.
Shives, R.B.K., Ford, K.L., and Charbon-neau, B.W., 1995, Applications ofgamma-ray spectrometric/magnetic/VLF-EM surveys–Workshop Manual:Geological Survey of Canada, OpenFile 3061, 82 p.
Shives, R.B.K., Charbonneau, B.W., andFord, K.L., 1997, The detection ofpotassic alteration by gamma-ray spec-trometry–recognition of alterationrelated to mineralization, in A.G.Gubins, ed., Proceedings of Explo-ration 97, Fourth Decennial Interna-tional Conference on Mineral Explo-ration: Geophysics and Geochemistryat the Millennium, p. 741-752.
Viljoen, D., and Harris, J.R., 2007, Satura-tion and value modulation (SVM): Anew method for integrating color andgrayscale imagery, in D.R. Soller, ed.,Digital Mapping Techniques'06–Workshop Proceedings: UnitedStates Geological Survey, Open FileReport 2007-1285.
Wilford, J.R., Bierwirth, P.N., and Craig,M.A., 1997, Application of airbornegamma-ray spectrometry insoil/regolith mapping and appliedgeomorphology: Australian GeologicalSurvey Organization, Journal of Aus-tralian Geology and Geophysics, v. 17,p. 201-216.
Submitted June, 2008Accepted as revised November, 2008
126