erie ar 10k
TRANSCRIPT

66460.indd 1 3/26/19 3:00 PM

66460.indd 2 3/26/19 3:00 PM

OUR FOUNDING PURPOSE
To provide our Policyholders
with as near perfect protection,
as near perfect service
as is humanly possible,
and to do so at the
lowest possible cost.
1
66460.indd 3 3/26/19 3:00 PM

This past fall, I spent a day with a group of Agents and ERIE leaders as part of an annual meeting to discuss what’s working, what we can improve and how our path to the future might unfold.
On that particular afternoon, I was with a group of 16 Agents and Employees. We were ready to close the day with a good meal and good conversation. When we arrived at our restaurant, though, we discovered our reservation was at another location across town. The restaurant couldn’t or wouldn’t serve us—even if we separated into smaller tables. We could sit on the patio, we were told, but no servers worked outside and we couldn’t order food. No negotiation, no accommodation.
The message was clear: we didn’t matter.
We left, unhappy and famished. Someone in the group pointed out a small Mexican restaurant across the street, in a shopping plaza. We walked in and two young workers—high school students maybe—welcomed us from behind the counter. Could they take on our group? Absolutely. They were happy to have us.
They kept our tables fi lled with fresh tortilla chips and cold drinks. They asked about our business and where we were from. They took photos of our group with our cell phones. And they delivered our food quickly and as ordered.
We mattered.
It was an experience I won’t soon forget. Over just minutes, I felt what it means when there’s a true focus on service—and when there isn’t. That distinction is powerful. A clear focus can rally a team—like the workers at the second restaurant. It establishes priorities, driving decisions and actions across an organization. And all of that can create a Customer for life, eager to refer friends and family.
It’s the kind of focus we have—and continually aspire to—at ERIE. Being Above all in Service has been a part of who we are since our start in 1925. When it comes to service—whether it’s customer service, claims service or community service—we are “all in.”
This past year, we sharpened our focus on service, further solidifying our plans and direction for the future. We delivered for our Employees, Agents, Customers,
2
TOOURSHAREHOLDERS
66460.indd 4 3/26/19 3:00 PM

Shareholders and the communities we serve. And those eff orts were supported by a year of strong results for both Erie Indemnity and Erie Insurance Exchange.
ALLTOLDOnce again, I’m proud to share with you the results of another strong year. ERIE is in a solid place fi nancially, refl ected in the highlights for both Indemnity and the Exchange on page 6. The relationship between these two entities is key: the health of The Exchange, the primary insurer we manage, drives the success of Indemnity.
In 2018, the Exchange grew property and casualty premium 7 percent over the prior year, exceeding Conning’s latest industry growth forecast of 5.6 percent. We’ve grown premium faster than the industry for 11 straight years while making steady gains in market share across our territory. Driving ERIE’s growth was a solid combination of strong retention and higher average premium per policy, combined with new business premiums.
In contrast to the prior year, weather events were a bigger part of the 2018 narrative. Snow, wind and hailstorms blew through much of our territory, and with greater frequency. Our reported combined ratio of 103.1 percent refl ects these storms. In times like these, we have an opportunity to demonstrate our value to the Agents and Customers who rely on us. The need for compassionate service is essential—and so is the need for a strong fi nancial foundation. We’re positioned to deliver on both fronts—and we did.
In 2018, our Policyholder surplus declined 2.3 percent from $8.8 billion in 2017 to $8.6 billion. The slight decrease refl ects our response to storm claims and a down investment year—and follows a year of signifi cant gains in surplus. In 2017, surplus grew over $1 billion. ERIE’s operational and fi nancial position remain healthy.
For Indemnity, operating income ended at $344 million, up $54 million compared to 2017. Investment income fi nished $3 million less than 2017, at $26 million.
We’ve done a good job investing in areas that are producing strong results, like our online commercial platform for Agents. We’re seeing double-digit premium growth in the lines of business on this system, which was expanded in 2018 to encourage cross-selling and drive additional revenue. Revenues are outpacing expenses, leading to 18.6 percent growth in operating income over 2017, from $290 million to $344 million.
Like other U.S. businesses, ERIE benefi ted from the enactment of the federal Tax Cuts and Jobs Act. Our executive team extended some of that initial benefi t to our workforce, with funds they could use both now and later. We paid a $1,000 cash bonus to our full- and part-time Employees, made a one-time contribution of $1,000 to eligible Employees’ 401(k) accounts and invested more in ERIE’s pension. Our Employees drive our success and it’s their commitment and eff ort that helps maintain ERIE’s strong and valued service reputation.
I’m proud to share with you that in October—just three years after the initial launch of our new claims management system—ERIE ranked highest in overall Customer satisfaction in J.D. Power’s 2018 U.S. Auto Claims Satisfaction Study. This is ERIE’s fi rst top honor for claims handling (and our 24th award overall since J.D. Power began studying our industry in 1999). It’s an honor that refl ects the deep commitment of our claims team to do the right thing for our Customers and claimants, as well as our ability to do it even better today.
ERIE also earned top honors from J.D. Power for performance in the auto insurance purchase experience and in auto insurance in the Mid-Atlantic region. (ERIE earned recognition in other ways in 2018; see page 7 for other acknowledgements.)
3
66460.indd 5 3/26/19 3:00 PM

ALLCLEARWe came into 2018 with the framework for a strategy to make sure ERIE remains a healthy, vibrant organization well into the future. That framework supports the four areas of focus we identifi ed in 2017 as key to our progress in the years ahead:
• Strengthening business platforms and uses of data
• Continuing to enhance the ERIE experience
• Identifying and developing new sources of revenue
• Preparing for the workforce of the future
We dug into these areas of focus in 2018, building on the roadmaps started in 2017 to get the work done. I think of it as the “what’s next” or page two of our strategy. We also built an even stronger understanding of the challenges and opportunities we face. The speed of change aff ecting our market, our workforce and Agents is accelerating. Competition is increasing, especially in the personal lines market. We’re confi dent in our strategy. At the same time, we continue to look for ways to be even better and succeed in any environment.
Beyond the strategic planning and foundational work for these areas of focus, we continued to work across all fronts to make a diff erence now for our Agents, Customers and Employees.
We’ve made strides in improving effi ciencies through enhancements to our platforms. These updates make it easier for our Agents to do business with ERIE and serve our Customers. Agents have new online capabilities for writing business with ERIE and helping Customers recover after a claim. We’ve also delivered new and enhanced products, including a second option for homeowners insurance to further bolster our competitive position.
Within our ERIE Experience initiative, we began the work necessary to expand our distinctive service culture through what we call our “Service Model of the Future” strategy. It’s an expansive, collaborative eff ort to enhance the ERIE experience in ways that will couple the best of digital capabilities with the human touch where it matters most. The result is a truly Customer-centric experience that we believe is really “Above All.”
4
Additionally, we’ve ramped up experiments, testing the capabilities of telematics for pricing private passenger auto insurance and expanded use of home sensors to consumers in all of our states. We’re also testing automation of claims payments so that we can compensate our Customers and claimants faster.
ALLTOGETHER Beyond our operations, we are strongly engaged in the revitalization of our hometown of Erie, Pennsylvania. As I shared with you last year, being a good corporate citizen is important to us. It’s also good business: a vibrant downtown core will attract new businesses and people, helping us recruit and retain top talent at ERIE.
We recently invested in two start-up companies to help support not only their endeavors, but also help encourage other innovators to see Erie as an entrepreneurial hub. The start-ups’ products are of interest to us as well. SimpleSense has developed a sensor system that helps speed up emergency response by providing fi rst responders key information about a building and its occupants. The other, CityGrows, is a cloud-based platform that enables local governments to manage permitting, licensing, surveying and other processes online. The energy around our collective eff orts to secure a brighter future for Erie continues to grow as we engage more deeply with local leaders in business, government and nonprofi ts—and support more visible investment in the area.
Enjoying an Erie summer sunset with members of our fi eld sales and product teams.
66460.indd 6 3/26/19 3:00 PM

And it made a notable diff erence. Bryan Miranda, an Agent in North Carolina, described the team’s work as “nothing short of amazing.”
It’s the kind of commitment that communicates clearly: You matter.
Throughout ERIE—across our footprint, in our offi ces and in those of our Agents—our dedication to service has set ERIE apart in the industry for nearly 95 years. It’s helped us forge strong relationships with Customers, Agents, our Employees and Communities, and with you, our Shareholders.
We thank you for the opportunity.
Timothy G. NeCastroPresident & CEO
ALLINLooking back, one of the defi ning moments of 2018 occurred during the week leading up to Hurricane Florence’s U.S. landfall in September. While the hurricane—described by the National Weather Service as a “storm of a lifetime”—convulsed in the Atlantic Ocean off the coast of North Carolina, our claims Employees and Agents readied for the worst. Our fi rst notice of loss team expanded as Employees from other teams volunteered to help answer Customers’ calls. A steady stream of conference calls linked our teams in North Carolina and the Home Offi ce for updates and coordination.
For seven days, we stood by, preparing for the worst while hoping for the best.
As more than one claims Employee said, “This is what we do.”
When the winds and rain arrived, Hurricane Florence did not land the punch we expected. It wasn’t one of our biggest storms, but it kept our team busy—in preparations and in the response that followed. Through it all, our team kept a clear, consistent focus on what matters— our Customers, our Agents, service. They were all in, from the beginning through the end.
President and CEO Tim NeCastro
5
66460.indd 7 3/26/19 3:00 PM

We reimbursed
Our new building in Erie, Pennsylvania—set to open in spring 2020—could house up to
to Employees for higher education tuition
We welcomed new Employees in 2018
Employees joined our dedicated Claims team
653
87%HUMIDITY
500,000
350
$900,000
1,200EMPLOYEES
OurTeam
OurService
a sign there may be a problem, according to one of the more than 2,000 water leak and freeze sensors in our Customers’ homes
calls answered by ERIE’s fi rst notice of loss team in 2018—most in 40 seconds or less
Financial Results
Indemnity• Net income of $5.51 per diluted Class A Share,
compared to $3.76 in 2017
• Net income of $288 million, compared to $197 million in 2017
• $156 million in dividends paid to Shareholders
• Regular quarterly cash dividend grew 7.1 percent in payout per share over the prior year dividend rate
• From $0.84 to $0.90 on each Class A share
• From $126.00 to $135.00 on each Class B share
Exchange*• Direct written premium grew to $7.1 billion—
up 7%—our 11th year in a row of growth
• New direct written premium of $886 million
• Reported combined ratio of 103.1% (compared to 96.2% at the end of 2017)
• Policyholder surplus decreased $200 million to $8.6 billion
• 3.3% increase in total policies in force—and average premium per policy grew 3.5%
• Strong policy retention at 90.1%
Life• Collected nearly $219 million in total life
insurance, annuity and Medicare Supplement premium—a 7.5% increase over 2017
*The Exchange results include those of the wholly owned property/casualty subsidiaries
6
drivers using telematics 3,000
while we test a pay-as-you-drive pricing model for private passenger auto insurance
full- and part-timeEmployees carry 5,598
good spirit, providing exceptional service to Customers, Agents and one another
2018 REVIEW
66460.indd 8 3/26/19 3:00 PM

OurHonors and Awards
donated to the American Red Cross
our Employees
donated to community
$70,000
225DAYS
$382,500
$1.5MILLION
$1+BILLION
$900,000+
OurProtection
OurCommunity
$298MILLIONpremium from optional coverages that boost protection for our Customers’ homes and vehicles—nearly double that premium in 2013
donated for scholarships and work experiences for students at Penn State Erie, The Behrend College
in ERIE Custom Collection premium, a program that supports Agents’ eff orts to reach more commercial Customers
raised for non-profi t ventures through ERIE’s annual Charity Challenge Golf Tournament since its fi rst tee time in 2010
National Business Group on
HEALTHGOLD AWARD for our workforce well-being program
American Heart Association
GOLDAWARD for steps in building a culture of health
100BEST PLACES to Work for LGBTQ Equality, Human Rights Campaign
TOP250
Highest among auto insurers for a
SATISFYINGPURCHASE experience, J.D. Power 2018 U.S. Insurance Shopping Study
Highest in
CUSTOMERSATISFACTION J.D. Power 2018 U.S. Auto Insurance Study—Mid-Atlantic Region
Highest in
OVERALLSATISFACTION J.D. Power 2018 U.S. Auto Claims Satisfaction Study
A+(SUPERIOR) rating by A.M. Best
ERIE RANKS378among the 2018 Fortune 500, up from 381 in 2017
WARD’S50 top-performing property/casualty insurers for 2018—our 18th time on the list since 1991
“BEST OF THE BEST”Black Equal Opportunity Employers Journal and Hispanic Network Magazine
7
spent helping build homes, renovate school properties, package food donations and more for our communities through our Service Corps. initiative
causes supported by our Agents since 2010 through our Giving Network Agent awards
ERIE Customers turn 65 each year—70,000
and become eligible for our new Medicare Supplement product
FlexJob Companies for Flexible Jobs
66460.indd 9 3/26/19 3:00 PM

“(Our ERIE Agent and claims specialist) went above and beyond to allay our fears and handle our claim in the most professional and caring manner.”— Nancy,
an ERIE Customer, about recovery following a house fi re
Keeping a promiseWith fi refi ghters on the way to her burning home, Nancy’s next call was to her ERIE Agent, Robin Tinsley of Sabatino Insurance in Pennsylvania’s Lehigh Valley. The fi re had started on the front porch, and then spread to the home’s second fl oor. Nancy and her husband were both inside at the time, getting ready to leave for an appointment when they smelled smoke. They, and their cat, Bo, escaped unharmed.
“She said, ‘we have a house fi re—what do we do?’” said Robin, “I told her, ‘you’ve done it—you called me. I’ll take care of the rest.’”
Nancy admits she was surprised to soon see Robin walking up her street that cold March morning. But she welcomed his presence—“in general, things are less face-to-face today,” she notes.
While fi refi ghters worked to extinguish the fl ames, ERIE property claims specialist Samantha Biegley joined Robin and began the recovery process. For Robin, it was a moment of truth in the 33 years he’d known Nancy as a Customer.
“Hopefully a house fi re is a once-in-a-lifetime event. But when it happens, we’re there—always,” Robin said. “We sell a piece of paper. A promise.
“Now is our time to do what we promised.”
The second fl oor of the house was gutted and the downstairs badly damaged by smoke, soot and water. Nancy and her husband returned home four months later, following reconstruction.
8
Our numbers tell an important story.They refl ect a strong fi nancial foundation. They show continued investment in technology, products and services. And demonstrate ways ERIE delivers on its commitment to do the right thing.
Equally important are the stories of our Employees, Agents and Customers.Their stories speak to the diff erence ERIE has made in their lives, to what drives our investments and what it looks like when a company is truly “Above all in SERVICE.”
Here are some of the stories that show we who are—and how we are—at ERIE.
66460.indd 10 3/26/19 3:00 PM

Boosting businessFor an insurance agency, speed and agility are key to writing—and winning—business. Agent Patrick Howard of Howard Insurance in Chevy Chase, Maryland, credits ERIE’s online commercial quote and application system for improving his agency’s abilities on both fronts.
“It’s the very best quoting system available to my team,” he said. “It’s extremely intuitive and fast.”
Using ERIE’s commercial system, an Agent can quote a commercial account in less than 10 minutes. A 2018 enhancement taps ERIE’s growing wealth of commercial Customer data to off er suggestions for relevant optional coverages based on what similar Customers have purchased. The Amazon-inspired addition helps an Agent build a fuller, more complete package of protection.
The system continues to grow in capabilities. In 2019, Agents will be able to use it for transactions beyond new business, including endorsements and renewals. Lines of business on the system— commercial auto, package policies and workers’ compensation—continue to post double-digit premium growth year over year.
“This is seriously and without a doubt the very best platform in the market right now.”— Patrick Howard,
Silver Spring Branch Agent, on ERIE’s commercial quote and application system
9
66460.indd 11 3/26/19 3:00 PM

Building careers“You need to help yourself.”
Those words were the nudge Julie Mikotowicz needed to make a change—and set a new course for her 21-year career at ERIE. While attending college, she took a part-time position at ERIE and stayed on after graduation in a full-time role in accounting. Six years later, as a new mom, she took a part-time job in processing. Julie returned to full-time hours when her children were in elementary school. And began looking for new opportunities to grow her career.
“It was kind of hard,” said Julie. “I had earned the Associate in General Insurance and the Associate in Insurance Services designations and had a degree. But I was kind of stagnant for a while and a lot had changed (in the accounting fi eld).
“It took my husband saying, ‘you need to help yourself.’”
Challenge accepted. Julie began looking for ways to develop her skills and capabilities. After talking with her manager, Julie enrolled in Aspire!, ERIE’s seven-month leadership development program. In addition to workshops and lectures, the program requires participants to develop and pitch solutions and engage with a career coach.
“I’m not the type to get in front of a crowd and present but I wanted to push myself,” she said. “Aspire! gave me that opportunity and more—I also gained a big picture view of leadership and the company.”
Additionally, Julie took on new responsibilities in processing as a training delivery specialist. And she began building her knowledge of insurance with study materials from ERIE for the Chartered Property Casualty Underwriter (CPCU) designation. She’s passed the fi rst of 10 required exams and is preparing to take the second exam.
Julie took on perhaps her biggest challenge yet in December 2018, when she started a new job. She’s now a supervisor in processing, where she’s able to hone her leadership abilities and help connect Employees with the resources that can help shape their careers.
“It’s important to see how much ERIE off ers us, but it truly is what we make of it.”— Julie Mikotowicz,
21-year Employee on the value of development opportunities at ERIE
10
66460.indd 12 3/26/19 3:00 PM

Investing in the futureCody Cook remembers his dad taking an old-school approach to making sure his son drove safely.
“My dad was an insurance underwriter, so I wasn’t allowed to drive recklessly,” said Cody, senior vice president, Personal Products. “He would actually time me between locations. I would have a baseball game, and if I got home too quickly, he would know it—and I would hear about it.”
These days, Cody and a cross-functional team from across ERIE have crafted a modern-day version of his dad’s Timex approach that’s aimed at delivering a similar outcome—and then some. It’s called YourTurnSM, a program that provides cash incentives to young drivers for driving safely.
The program is part of ERIE’s broader strategic eff ort to leverage telematics technology. The technology tracks driver behavior and performance as a means to more accurately assess and price the risk of individual drivers. There are a range of potential benefi ts related to telematics—the long-distance transmission of computerized information—for both ERIE and Customers.
“In the simplest terms, we’re trying to revolutionize auto insurance,” said Cody. “Ultimately, we would like to create a completely mobile experience where someone literally earns their price as they drive—maybe even down to the mile. So if you text while you’re driving or turn too abruptly, you’d pay extra for that mile. It would almost be a real-time pricing and coverage option.”
A lot has to happen before ERIE achieves that aspiration. The YourTurn program marks an important step forward by providing useful data and insights about young drivers, Along the way, it encourages and incentivizes teens to drive more safely. More than 3,000 young drivers are using YourTurn in the initial states of Ohio and West Virginia. YourTurn will launch in additional states in 2019.
“I like that I can check on my daughter’s driving. She’s doing wonderfully and checks the app all the time to see how she’s doing.” — Jennifer,
an ERIE Customer whose teen-age daughter is test-driving telematics
11
66460.indd 13 3/26/19 3:00 PM

Corporate Directory
Board of Directors
J. Ralph Borneman, Jr., CIC, CPIAPresident, Chief Executive Officer and Chairman of the Board, Body-BornemanInsurance & Financial Services, LLC
Eugene C. Connell, FCAS, CFA, CPCUChief Executive Officer, RendrFX, Inc.
Salvatore Correnti, CFA, CCM, FLMIRetired Non-executive Vice Chair of the Board of Directors, Conning Holdings Corporation
LuAnn Datesh, Esq.A Director and Shareholder of the law firm Sherrard, German & Kelly, P.C.
Jonathan Hirt Hagen, J.D.Vice Chairman of the Board, Erie Indemnity Company; and Co-Trustee, H.O. Hirt Trusts
Thomas B. HagenChairman of the Board, Erie Indemnity Company; and Chairman, Custom Group Industries
C. Scott Hartz, CPAChairman, TaaSera, Inc. and Chief Executive Officer, Hartz Group
Brian A. Hudson, Sr., CPA, CGMA, CTPExecutive Director and Chief Executive Officer, Pennsylvania Housing Finance Agency
Claude C. Lilly III, PhD, CPCU, CLURetired President, Presbyterian College
George R. Lucore, CIC, CPCU, LUTCFManaging Director, PAFLA Properties, LLC
Thomas W. Palmer, Esq.A member of the law firm Marshall & Melhorn, LLC
Martin P. Sheffield, CPCUOwner, Sheffield Consulting, LLC
Elizabeth Hirt VorsheckCo-Trustee, H.O. Hirt Trusts
12
Name Audit
Charitable
Giving
Exchange
Relationship Executive Compensation Investment Nominating Strategy
J. Ralph Borneman, Jr. • • • CHAIR
Eugene C. Connell • • •
Salvatore Correnti CHAIR
LuAnn Datesh • •
Jonathan Hirt Hagen • • • • CHAIR •
Thomas B. Hagen(1) CHAIR
C. Scott Hartz • •
Brian A. Hudson, Sr. CHAIR • •
Claude C. Lilly, III • • • •
George R. Lucore(2) • • •
Thomas W. Palmer • CHAIR •
Martin P. Sheffield(3) • •
Elizabeth Hirt Vorsheck CHAIR • • • •
Board Committee Membership and Chair Appointments(Eff ective as of April 24, 2018)
(1) As chairman of the board of directors, Mr. Hagen serves ex offi cio as a non-voting member of our Audit and Compensation committees and a voting member of all other committees.
(2) Mr. Lucore serves as a non-voting member of our Compensation Committee.(3) Mr. Sheffi eld currently serves as the Audit Committee ERM Liaison.
66460.indd 14 3/26/19 3:00 PM

Executive Leadership
Timothy G. NeCastro, CPA, CICPresident and Chief Executive Officer
Gregory J. Gutting, CPA, CPCUExecutive Vice President and Chief Financial Officer
Lorianne Feltz, CPCUExecutive Vice President, Claims and Customer Service
Robert C. Ingram IIIExecutive Vice President and Chief Information Officer
Douglas E. Smith, CPCU, FCAS, MAAAExecutive Vice President, Sales and Products
Dionne Wallace OakleyExecutive Vice President, Human Resources and Strategy
Senior Leadership
Jeffrey W. Brinling, CPCUSenior Vice President, Corporate Services
Patrick J. Burns, CPCU, AIC, AISSenior Vice President, Customer Service
Marc Cipriani, CICSenior Vice President, Underwriting
Louis F. Colaizzo, CICSenior Vice President, Erie Family Life Insurance Company
Cody W. Cook, FCAS, CPCUSenior Vice President, Personal Products
Bradley C. Eastwood, FCAS, MAAASenior Vice President, Actuarial, and Chief Actuary
Ruben F. Fechner IIISenior Vice President, Business Applications and Support, Information Technology
C. Michael Fletcher, CICSenior Vice President, Sales and Marketing
Keith E. KennedySenior Vice President, Strategic & Integrated Services, Information Technology
Matthew W. Myers, CPCU, CIC, SCLASenior Vice President, Learning & Development and Workforce of the Future
Julie M. Pelkowski, CPASenior Vice President and Controller
Bradley G. PostemaSenior Vice President and Chief Investment Officer
Sheryl A. RuckerSenior Vice President, Law
David S. Russo, CPCU, CIC, AReSenior Vice President, Service Operations and Support
Sarah J. Shine, CPCU, FCASSenior Vice President, Commercial Products
Christopher J. Zimmer, LUTCFSenior Vice President, Claims
Brian W. Bolash, Esq.Secretary and Senior Counsel
Robert W. McNutt, CTPTreasurer
13
66460.indd 15 3/26/19 3:00 PM
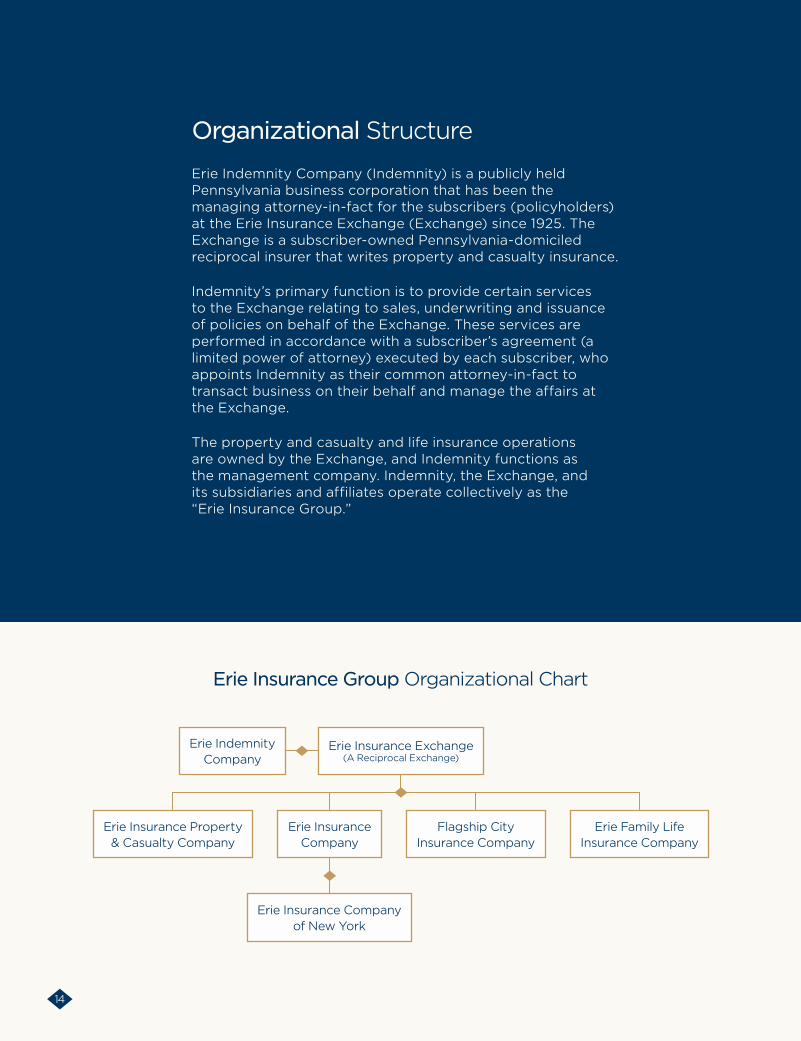
Erie Insurance Group Organizational Chart
Erie InsuranceCompany
Erie Indemnity Company
Erie Insurance Property & Casualty Company
Erie Insurance Exchange(A Reciprocal Exchange)
Erie Insurance Company of New York
Erie Family Life Insurance Company
Flagship City Insurance Company
Organizational Structure
Erie Indemnity Company (Indemnity) is a publicly held Pennsylvania business corporation that has been the managing attorney-in-fact for the subscribers (policyholders) at the Erie Insurance Exchange (Exchange) since 1925. The Exchange is a subscriber-owned Pennsylvania-domiciled reciprocal insurer that writes property and casualty insurance.
Indemnity’s primary function is to provide certain services to the Exchange relating to sales, underwriting and issuance of policies on behalf of the Exchange. These services are performed in accordance with a subscriber’s agreement (a limited power of attorney) executed by each subscriber, who appoints Indemnity as their common attorney-in-fact to transact business on their behalf and manage the affairs at the Exchange.
The property and casualty and life insurance operations are owned by the Exchange, and Indemnity functions as the management company. Indemnity, the Exchange, and its subsidiaries and affiliates operate collectively as the “Erie Insurance Group.”
14
66460.indd 16 3/26/19 3:00 PM

Erie Indemnity Company Financial Highlights(dollars in millions, except share data)
2016 2017 2018
FINANCIAL OPERATING DATA
Management fee rate
Operating income(1)
Investment income
Interest expense and Other (income), net(1)
Net income
Return on equity
25%
294
28
1
210
26.5%
25%
290
29
3
197
23.5%
25%
344
26
(1)
288
31.5%
$4.01
2.9725
445.875
$3.76
3.1875
478.125
$5.51
3.42
513.00
$1,549
817
52,435,303
$1,666
857
52,337,463
$1,778
974
52,315,213
PER SHARE DATA
Net income per Class A share - diluted
Dividends declared per Class A share
Dividends declared per Class B share
FINANCIAL POSITION DATA
Total assets
Total equity
Weighted average Class A common and equivalent B shares outstanding - diluted
(1) Certain amounts previously reported for years 2017 and 2016 have been reclassified for comparative purposes to conform to the current period’s presentation.
15
Return on equity
Net income per Class A share - diluted
Dividends declared per Class A share
31.5%$3.42
$5.51
2018 201820182017 201720172016 20162016
23.5%
$3.1875
$3.76
26.5%$2.9725
$4.01
66460.indd 17 3/26/19 3:00 PM

F.W. Hirt Quality Agency Award Winners 2014-2018
Allentown Branch2018 Cellucci Foran Insurance
2016 Earley-Poli Agency
2015 Yutz-Merkle Insurance Agency, Inc.
2014 Body-Borneman Agency, Inc.
Canton Branch2018 Troy Miller Agency
2017 Vince Hrobat Agency
2016 The Agent Insurance Services
Charlotte Branch2018 Trey Siner Insurance Group
2015 Catawba Valley Insurance Agency
Columbus Branch2018 Dolbow Insurance
2017 Welty Financial Services
2016 Burrey Insurance Agency
2014 Mitchell Insurance Agency, Inc.
Erie Branch2018 Rossbacher Insurance Service
2017 St. Marys Insurance Agency
2016 Great Lakes Insurance Services Group
2015 Reinhardt’s Agency, Inc.
2014 Turner Insurance Agency, Inc.
Harrisburg Branch2018 Covenant Insurance Group
2017 CrossKeys Insurance Group
2016 James B. Murdoch Insurance Group
2015 Wm. R. Karschner & Sons
2014 CRS Insurance, Inc.
Indiana Branch2018 Patton Insurance
2017 Vince Hrobat Agency
2017 VanVleet Insurance Agency
2016 Johnson Insurance Agency
2014 Aldridge Insurance, Inc.
New York Branch2017 A.T. Matthews & Dier
2014 The Ryan Agency
Pittsburgh Branch2017 Brian Ruscello Agency
2016 The Kerr Agency
2015 Laurel Highlands Insurance Group
2014 Bruner Insurance Agency, LLC
Raleigh Branch2016 Schultze Insurance Agency
2015 The Insurance Pros
Richmond Branch2016 Foundation Insurance Group
2015 Frank D. Spicer Jr., Inc.
2014 Cascade Insurance Group, LLC
Roanoke Branch2018 Walter & Walter Insurance
Agency
2017 Wampler’s Insurance Agency
Silver Spring Branch2016 Joseph W. McCartin Agency
2015 Cumberland Valley Insurance
2014 Walker Poole Insurance, Inc.
Tennessee Branch2017 Bailey Insurance Service
West Virginia Branch2018 United Security Agency
2017 Mercer Insurance Associates
2016 Morris Insurance Services
2015 Smallwood and Small
2014 Insurance Centers, Inc.
Wisconsin Branch2015 Midwest Insurance Group
The F.W. Hirt Quality Agency Award is the highest honor bestowed on an ERIE agency. It recognizes long-term profi tability and growth, thorough and responsible underwriting practices, and continuing commitment to education.
16
66460.indd 18 3/26/19 3:00 PM

★ Home Office, Erie Field Office ● Field Offices
Erie Indemnity Company Corporate Information
Corporate Headquarters/Home Offi ce
100 Erie Insurance PlaceErie, PA 16530814.870.2000
Stock Listing
Erie Indemnity Company’s Class A nonvoting common stock is traded on The Nasdaq Stock Market®, Inc.,under the symbol “ERIE.”
Stock Transfer Information
Broadridge Corporate Issuer Solutions, Inc.P.O. Box 1342Brentwood, NY 11717877.830.4936
Annual Meeting of Shareholders
The Annual Meeting of Shareholders will be held on April 30, 2019, at 9:30 a.m., EDT, at our corporate headquarters in Erie, Pennsylvania.
Independent Registered Public
Accounting Firm
Ernst & Young, LLP950 Main AvenueSuite 1800Cleveland, OH 44113
Online Information
Erie Indemnity’s information statement and annual report are available online at www.erieproxy.com. Additional fi nancial and shareholder information, press releases, and general news about the Company may be accessed at erieinsurance.com.
Field Offi cesSoutheast Region
Hagerstown, MDSilver Spring, MDCharlotte, NCRaleigh, NCRichmond, VARoanoke, VAWaynesboro, VA
Northeast Region
Rochester, NYAllentown, PAErie, PAHarrisburg, PAJohnstown, PAMurrysville, PAPhiladelphia, PAPittsburgh, PA
West Region
Peoria, ILFort Wayne, INIndianapolis, INLexington, KYCanton, OHColumbus, OHKnoxville, TNNashville, TNParkersburg, WVWaukesha, WI
17
66460.indd 19 3/26/19 3:00 PM

Erie Indemnity CompanyExcerpts From Form 10-K
18
66460.indd 20 3/26/19 3:00 PM

[X] ANNUAL REPORT PURSUANT TO SECTION 13 OR 15(d) OF THE SECURITIES EXCHANGE ACT OF 1934For the fiscal year ended December 31, 2018
OR[ ] TRANSITION REPORT PURSUANT TO SECTION 13 OR 15(d) OF THE SECURITIES EXCHANGE ACT OF 1934
Commission File Number 0-24000
ERIE INDEMNITY COMPANY(Exact name of registrant as specified in its charter)
Pennsylvania 25-0466020(State or other jurisdiction (I.R.S. Employer
of incorporation or organization) Identification No.)
100 Erie Insurance Place, Erie, Pennsylvania 16530(Address of principal executive offices) (Zip code)
(814) 870-2000(Registrant's telephone number, including area code)
Securities registered pursuant to Section 12(b) of the Act:
Class A common stock, stated value $0.0292 per share, listed on the NASDAQ Stock Market, LLC(Title of each class) (Name of each exchange on which registered)
Securities registered pursuant to Section 12(g) of the Act: None
Indicate by check mark if the registrant is a well-known seasoned issuer, as defined in Rule 405 of the Securities Act. Yes X No
Indicate by check mark if the registrant is not required to file reports pursuant to Section 13 or Section 15(d) of the Act. Yes No X
Indicate by check mark whether the registrant (1) has filed all reports required to be filed by Section 13 or 15(d) of the Securities Exchange Act of 1934 during the preceding 12 months (or for such shorter period that the registrant was required to file such reports), and (2) has been subject to such filing requirements for the past 90 days. Yes X No
Indicate by check mark whether the registrant has submitted electronically every Interactive Data File required to be submitted pursuant to Rule 405 of Regulation S-T during the preceding 12 months (or for such shorter period that the registrant was required to submit such files). Yes X No ___
Indicate by check mark if disclosure of delinquent filers pursuant to Item 405 of Regulation S-K is not contained herein, and will not be contained, to the best of registrant's knowledge, in definitive proxy or information statements incorporated by reference in Part III of this Form 10-K or any amendment to this Form 10-K. [ ]
Indicate by check mark whether the registrant is a large accelerated filer, an accelerated filer, a non-accelerated filer, smaller reporting company, or an emerging growth company. See the definitions of "large accelerated filer," "accelerated filer," "smaller reporting company," and "emerging growth company" in Rule 12b-2 of the Exchange Act. (Check one):
Large accelerated filer X Accelerated filer Non-accelerated filer Smaller reporting company Emerging growth company
If an emerging growth company, indicate by check mark if the registrant has elected not to use the extended transition period for complying with any new or revised financial accounting standards provided pursuant to Section 13(a) of the Exchange Act. [ ]
Indicate by check mark whether the registrant is a shell company (as defined in Rule 12b-2 of the Exchange Act). Yes No X
Aggregate market value of voting and non-voting common stock held by non-affiliates as of the last business day of the registrant's most recently completed second fiscal quarter: $2.9 billion of Class A non-voting common stock as of June 30, 2018. There is no active market for the Class B voting common stock. The Class B common stock is closely held by few shareholders.
Indicate the number of shares outstanding of each of the registrant's classes of common stock, as of the latest practicable date:46,189,068 shares of Class A common stock and 2,542 shares of Class B common stock outstanding on February 15, 2019.
DOCUMENTS INCORPORATED BY REFERENCE
Portions of Part III of this Form 10-K (Items 10, 11, 12, 13, and 14) are incorporated by reference to the information statement on Schedule 14(C) to be filed with the Securities and Exchange Commission no later than 120 days after December 31, 2018.
ERIE INDEMNITY COMPANYEXCERPTS FROM FORM 10-K
This Annual Report includes the Company’s Audited Financial Statements and excerpts from the Company’s full Form 10-K
report as filed with the Securities and Exchange Commission (“SEC”) on February 21, 2019.The complete Form 10-K can be found on the SEC Web site at www.sec.gov.
6460_Fin.pdf 1 3/19/19 10:46 PM

2
INDEX
PART ITEM NUMBER AND CAPTION PAGE
I Item 1. Business Item 1A. Risk Factors Item 1B. Unresolved Staff Comments Item 2. Properties Item 3. Legal Proceedings Item 4. Mine Safety Disclosures II Item 5. Market for Registrant's Common Equity, Related Stockholder Matters and Issuer Purchases
of Equity Securities Item 6. Selected Financial Data Item 7. Management's Discussion and Analysis of Financial Condition and Results of Operations Item 7A. Quantitative and Qualitative Disclosures About Market Risk Item 8. Financial Statements and Supplementary Data Item 9. Changes In and Disagreements With Accountants on Accounting and Financial Disclosure Item 9A. Controls and Procedures Item 9B. Other Information III Item 10. Directors, Executive Officers and Corporate Governance Item 11. Executive Compensation Item 12. Security Ownership of Certain Beneficial Owners and Management and Related
Stockholder Matters Item 13. Certain Relationships and Related Transactions, and Director Independence Item 14. Principal Accountant Fees and Services IV Item 15. Exhibits and Financial Statement Schedules Item 16. Form 10-K Summary Signatures
35
11121315
1617183943848484
8687
878787
8888
92
6460_Fin.pdf 2 3/19/19 10:46 PM

3
PART I
ITEM 1. BUSINESS GeneralErie Indemnity Company ("Indemnity", "we", "us", "our") is a publicly held Pennsylvania business corporation that has since its incorporation in 1925 served as the attorney-in-fact for the subscribers (policyholders) at the Erie Insurance Exchange ("Exchange"). The Exchange, which also commenced business in 1925, is a Pennsylvania-domiciled reciprocal insurer that writes property and casualty insurance. The Exchange has wholly owned property and casualty subsidiaries including: Erie Insurance Company, Erie Insurance Company of New York, Erie Insurance Property and Casualty Company and Flagship City Insurance Company, and a wholly owned life insurance company, Erie Family Life Insurance Company ("EFL"). Our primary function as attorney-in-fact is to perform policy issuance and renewal services on behalf of the subscribers at the Exchange. We also act as attorney-in-fact on behalf of the Exchange with respect to all claims handling and investment management services, as well as the service provider for all claims handling, life insurance, and investment management services for its insurance subsidiaries, collectively referred to as "administrative services". Acting as attorney-in-fact in these two capacities is done in accordance with a subscriber's agreement (a limited power of attorney) executed individually by each subscriber (policyholder), which appoints us as their common attorney-in-fact to transact certain business on their behalf. Pursuant to the subscriber’s agreement for acting as attorney-in-fact in these two capacities, we earn a management fee calculated as a percentage, not to exceed 25%, of the direct and assumed premiums written by the Exchange. The management fee rate is set at least annually by our Board of Directors. The process of setting the management fee rate includes the evaluation of current year operating results compared to both prior year and industry estimated results for both Indemnity and the Exchange, and consideration of several factors for both entities including: their relative financial strength and capital position; projected revenue, expense and earnings for the subsequent year; future capital needs; as well as competitive position.
ServicesThe policy issuance and renewal services we provide to the Exchange are related to the sales, underwriting and issuance of policies. The sales related services we provide include agent compensation and certain sales and advertising support services. Agent compensation includes scheduled commissions to agents based upon premiums written as well as additional commissions and bonuses to agents, which are earned by achieving targeted measures. Agent compensation comprised approximately 67% of our 2018 policy issuance and renewal expenses. The underwriting services we provide include underwriting and policy processing and comprised approximately 10% of our 2018 policy issuance and renewal expenses. The remaining services we provide include customer service and administrative support. We also provide information technology services that support all the functions listed above that comprised approximately 10% of our 2018 policy issuance and renewal expenses. Included in these expenses are allocations of costs for departments that support these policy issuance and renewal functions. By virtue of its legal structure as a reciprocal insurer, the Exchange does not have any employees or officers. Therefore, it enters into contractual relationships by and through an attorney-in-fact. Indemnity serves as the attorney-in-fact on behalf of the Exchange with respect to its administrative services. The Exchange's insurance subsidiaries also utilize Indemnity for these services in accordance with the service agreements between each of the subsidiaries and Indemnity. Claims handling services include costs incurred in the claims process, including the adjustment, investigation, defense, recording and payment functions. Life insurance management services include costs incurred in the management and processing of life insurance business. Investment management services are related to investment trading activity, accounting and all other functions attributable to the investment of funds. Included in these expenses are allocations of costs for departments that support these administrative functions. The amounts incurred for these services are reimbursed to Indemnity at cost in accordance with the subscriber's agreement and the service agreements. State insurance regulations require that intercompany service agreements and any material amendments be approved in advance by the state insurance department.
Erie Insurance ExchangeAs our primary purpose is to manage the affairs at the Exchange for the benefit of the subscribers (policyholders) through the policy issuance and renewal services and administrative services, the Exchange is our sole customer. Our earnings are largely generated from management fees based on the direct and assumed premiums written by the Exchange. We have no direct competition in providing these services to the Exchange.
The Exchange generates revenue by insuring preferred and standard risks, with personal lines comprising 71% of the 2018 direct and assumed written premiums and commercial lines comprising the remaining 29%. The principal personal lines products are private passenger automobile and homeowners. The principal commercial lines products are commercial multi-peril, commercial automobile and workers compensation. Historically, due to policy renewal and sales patterns, the Exchange's
6460_Fin.pdf 3 3/19/19 10:46 PM

4
direct and assumed written premiums are greater in the second and third quarters than in the first and fourth quarters of the calendar year.
The Exchange is represented by independent agencies that serve as its sole distribution channel. In addition to their principal role as salespersons, the independent agents play a significant role as underwriting and service providers and are an integral part of the Exchange's success.
Our results of operations are tied to the growth and financial condition of the Exchange. If any events occurred that impaired the Exchange's ability to grow or sustain its financial condition, including but not limited to reduced financial strength ratings, disruption in the independent agency relationships, significant catastrophe losses, or products not meeting customer demands, the Exchange could find it more difficult to retain its existing business and attract new business. A decline in the business of the Exchange almost certainly would have as a consequence a decline in the total premiums paid and a correspondingly adverse effect on the amount of the management fees we receive. We also have an exposure to a concentration of credit risk related to the unsecured receivables due from the Exchange for its management fee and cost reimbursements. See Part II, Item 8. "Financial Statements and Supplementary Data - Note 15, Concentrations of Credit Risk, of Notes to Financial Statements" contained within this report. See the risk factors related to our dependency on the growth and financial condition of the Exchange in Item 1A. "Risk Factors" contained within this report.
CompetitionOur primary function as attorney-in-fact is to perform policy issuance and renewal services on behalf of the subscribers at the Exchange. We also act as attorney-in-fact on behalf of the Exchange, as well as the service provider for its insurance subsidiaries, with respect to all administrative services. There are a limited number of companies that provide services under a reciprocal insurance exchange structure. We do not directly compete against other such companies, given we are appointed by the subscribers at the Exchange to provide these services.
The direct and assumed premiums written by the Exchange drive our management fee which is our primary source of revenue. The property and casualty insurance industry is highly competitive. Property and casualty insurers generally compete on the basis of customer service, price, consumer recognition, coverages offered, claims handling, financial stability and geographic coverage. Vigorous competition, particularly in the personal lines automobile and homeowners lines of business, is provided by large, well-capitalized national companies, some of which have broad distribution networks of employed or captive agents, by smaller regional insurers, and by large companies who market and sell personal lines products directly to consumers. In addition, because the insurance products of the Exchange are marketed exclusively through independent insurance agents, the Exchange faces competition within its appointed agencies based upon ease of doing business, product, price, and service relationships. Market competition bears directly on the price charged for insurance products and services subject to regulatory limitations. Industry capital levels can also significantly affect prices charged for coverage. Growth is driven by a company's ability to provide insurance services and competitive prices while maintaining target profit margins. Growth is a product of a company's ability to retain existing customers and to attract new customers, as well as movement in the average premium per policy.
The Exchange's strategic focus includes employing an underwriting philosophy and product mix targeted to produce an underwriting profit on a long-term basis through careful risk selection and rational pricing, and consistently providing superior service to policyholders and agents. The Exchange's business model is designed to provide the advantages of localized marketing and claims servicing with the economies of scale and low cost of operations from centralized support services. The Exchange also carefully selects the independent agencies that represent it and seeks to be the lead insurer with its agents in order to enhance the agency relationship and the likelihood of receiving the most desirable underwriting opportunities from its agents.
See the risk factors related to our dependency on the growth and financial condition of the Exchange in Item 1A. "Risk Factors" contained within this report for further discussion on competition in the insurance industry.
EmployeesWe had over 5,500 full-time employees at December 31, 2018, of which over 2,700, or 49%, provide claims related services exclusively for the Exchange. The Exchange reimburses us monthly for the cost of these services.
6460_Fin.pdf 4 3/19/19 10:46 PM

5
Government RegulationMost states have enacted legislation that regulates insurance holding company systems, defined as two or more affiliated persons, one or more of which is an insurer. Indemnity and the Exchange, and its wholly owned subsidiaries, meet the definition of an insurance holding company system.
Each insurance company in the holding company system is required to register with the insurance supervisory authority of its state of domicile and furnish information regarding the operations of companies within the holding company system that may materially affect the operations, management, or financial condition of the insurers within the system. Pursuant to these laws, the respective insurance departments may examine us and the Exchange and its wholly owned subsidiaries at any time, and may require disclosure and/or prior approval of certain transactions with the insurers and us, as an insurance holding company.
All transactions within a holding company system affecting the member insurers of the holding company system must be fair and reasonable and any charges or fees for services performed must be reasonable. Approval by the applicable insurance commissioner is required prior to the consummation of transactions affecting the members within a holding company system.
Website AccessOur annual reports on Form 10-K, quarterly reports on Form 10-Q, current reports on Form 8-K, and any amendments to those reports are available free of charge on our website at www.erieinsurance.com as soon as reasonably practicable after such material is filed electronically with the Securities and Exchange Commission. Additionally, copies of our annual report on Form 10-K are available free of charge, upon written request, by contacting Investor Relations, Erie Indemnity Company, 100 Erie Insurance Place, Erie, PA 16530, or calling (800) 458-0811.
ITEM 1A. RISK FACTORS
Our business involves various risks and uncertainties, including, but not limited to those discussed in this section. The risks and uncertainties described in the risk factors below, or any additional risk outside of those discussed below, could have a material adverse effect on our business, financial condition, operating results, cash flows, or liquidity if they were to develop into actual events. This information should be considered carefully together with the other information contained in this report and in other reports and materials we file periodically with the Securities and Exchange Commission.
If the management fee rate paid by the Exchange is reduced or if there is a significant decrease in the amount of direct and assumed premiums written by the Exchange, revenues and profitability could be materially adversely affected.
We are dependent upon management fees paid by the Exchange, which represent our principal source of revenue. Pursuant to the subscriber's agreement with the subscribers at the Exchange, we may retain up to 25% of all direct and assumed premiums written by the Exchange. Therefore, management fee revenue from the Exchange is calculated by multiplying the management fee rate by the direct and assumed premiums written by the Exchange. Accordingly, any reduction in direct and assumed premiums written by the Exchange and/or the management fee rate would have a negative effect on our revenues and net income.
The management fee rate is determined by our Board of Directors and may not exceed 25% of the direct and assumed premiums written by the Exchange. The Board of Directors sets the management fee rate each December for the following year. At their discretion, the rate can be changed at any time. The process of setting the management fee rate includes the evaluation of current year operating results compared to both prior year and industry estimated results for both Indemnity and the Exchange, and consideration of several factors for both entities including: their relative financial strength and capital position; projected revenue, expense and earnings for the subsequent year; future capital needs; as well as competitive position. The evaluation of these factors could result in a reduction to the management fee rate and our revenues and profitability could be materially adversely affected.
6460_Fin.pdf 5 3/19/19 10:46 PM

6
Serving as the attorney-in-fact in the reciprocal insurance exchange structure results in the Exchange being our sole customer. We have an interest in the growth of the Exchange as our earnings are largely generated from management fees based on the direct and assumed premiums written by the Exchange. If the Exchange's ability to grow or renew policies were adversely impacted, the premium revenue of the Exchange would be adversely affected which would reduce our management fee revenue. The circumstances or events that might impair the Exchange's ability to grow include, but are not limited to, the items discussed below.
Unfavorable changes in macroeconomic conditions, including declining consumer confidence, inflation, high unemployment, and the threat of recession, among others, may lead the Exchange's customers to modify coverage, not renew policies, or even cancel policies, which could adversely affect the premium revenue of the Exchange, and consequently our management fee.
The Exchange faces significant competition from other regional and national insurance companies. The property and casualty insurance industry is highly competitive on the basis of product, price and service. If the Exchange's competitors offer property and casualty products with more coverage or offer lower rates, and the Exchange is unable to implement product improvements quickly enough to keep pace, its ability to grow and renew its business may be adversely impacted. In addition, due to the Exchange's premium concentration in the automobile and homeowners insurance markets, it may be more sensitive to trends that could affect auto and home insurance coverages and rates over time, for example changing vehicle usage, usage-based methods of determining premiums, ownership and driving patterns such as ride sharing, advancements in vehicle or home technology or safety features such as accident and loss prevention technologies, the development of autonomous vehicles, or residential occupancy patterns, among other factors.
The Exchange markets and sells its insurance products through independent, non-exclusive insurance agencies. These agencies are not obligated to sell only the Exchange's insurance products, and generally also sell products of the Exchange's competitors. If agencies do not maintain their current levels of marketing efforts, bind the Exchange to unacceptable risks, place business with competing insurers, or the Exchange is unsuccessful in attracting or retaining agencies in its distribution system as well as maintaining its relationships with those agencies, the Exchange's ability to grow and renew its business may be adversely impacted. Additionally, consumer preferences may cause the insurance industry as a whole to migrate to a delivery system other than independent agencies.
The Exchange maintains a brand recognized for customer service. The perceived performance, actions, conduct and behaviors of employees, independent insurance agency representatives, and third-party service partners may result in reputational harm to the Exchange's brand. Specific incidents which may cause harm include but are not limited to disputes, long customer wait times, errors in processing a claim, failure to protect sensitive customer data, and negative or inaccurate social media communications. Likewise, an inability to match or exceed the service provided by competitors, which is increasingly relying on digital delivery and enhanced distribution technology, may impede the Exchange's ability to maintain and/or grow its customer base. If third-party service providers fail to perform as anticipated, the Exchange may experience operational difficulties, increased costs and reputational damage. If an extreme catastrophic event were to occur in a heavily concentrated geographic area of subscribers/policyholders, an extraordinarily high number of claims could have the potential to strain claims processing and affect the Exchange's ability to satisfy its customers. Any reputational harm to the Exchange could have the potential to impair its ability to grow and renew its business.
We also have an interest in the financial condition of the Exchange based on serving as the attorney-in-fact in the reciprocal insurance exchange structure and the Exchange being our sole customer. Our earnings are largely generated from management fees based on the direct and assumed premiums written by the Exchange. If the Exchange were to fail to maintain acceptable financial strength ratings, its competitive position in the insurance industry would be adversely affected. If a rating downgrade led to customers not renewing or canceling policies, or impacted the Exchange's ability to attract new customers, the premium revenue of the Exchange would be adversely affected which would reduce our management fee revenue. The circumstances or events that might impair the Exchange's financial condition include, but are not limited to, the items discussed below.
Financial strength ratings are an important factor in establishing the competitive position of insurance companies such as the Exchange. Higher ratings generally indicate greater financial stability and a stronger ability to meet ongoing obligations to policyholders. The Exchange's A.M. Best rating is currently A+ ("Superior"). Rating agencies periodically review insurers' ratings and change their rating criteria; therefore, the Exchange's current rating may not be maintained in the future. A significant downgrade in this or other ratings would reduce the competitive position of the Exchange, making it more difficult to attract profitable business in the highly competitive property and casualty insurance market and potentially result in reduced sales of its products and lower premium revenue.
6460_Fin.pdf 6 3/19/19 10:46 PM

7
The performance of the Exchange's investment portfolio is subject to a variety of investment risks. The Exchange's investment portfolio is comprised principally of fixed income securities, equity securities and limited partnerships. The fixed income portfolio is subject to a number of risks including, but not limited to, interest rate risk, investment credit risk, sector/concentration risk and liquidity risk. The Exchange's common stock and preferred equity securities have exposure to price risk, the risk of potential loss in estimated fair value resulting from an adverse change in prices. Limited partnerships are significantly less liquid and generally involve higher degrees of price risk than publicly traded securities. Limited partnerships, like publicly traded securities, have exposure to market volatility; but unlike fixed income securities, cash flows and return expectations are less predictable. If any investments in the Exchange's investment portfolio were to suffer a substantial decrease in value, the Exchange's financial position could be materially adversely affected through increased unrealized losses or impairments. A significant decrease in the Exchange's portfolio could also put it, or its subsidiaries, at risk of failing to satisfy regulatory or rating agency minimum capital requirements.
Property and casualty insurers are subject to extensive regulatory supervision in the states in which they do business. This regulatory oversight includes, by way of example, matters relating to licensing, examination, rate setting, market conduct, policy forms, limitations on the nature and amount of certain investments, claims practices, mandated participation in involuntary markets and guaranty funds, reserve adequacy, insurer solvency, restrictions on underwriting standards, accounting standards, and transactions between affiliates. Such regulation and supervision are primarily for the benefit and protection of policyholders. Changes in applicable insurance laws, regulations, or changes in the way regulators administer those laws or regulations could adversely change the Exchange's operating environment and increase its exposure to loss or put it at a competitive disadvantage, which could result in reduced sales of its products and lower premium revenue.
As insurance industry practices and legal, judicial, social and other environmental conditions change, unexpected and unintended issues related to claims and coverage may emerge. In some instances, these emerging issues may not become apparent for some time after the Exchange has issued the affected insurance policies. As a result, the full extent of liability under the Exchange's insurance policies may not be known for many years after the policies are issued. These issues may adversely affect the Exchange's business by either extending coverage beyond its underwriting intent or by increasing the number or size of claims.
The Exchange's insurance operations are exposed to claims arising out of catastrophes. Common natural catastrophic events include hurricanes, earthquakes, tornadoes, hail storms, and severe winter weather. The frequency and severity of these catastrophes is inherently unpredictable. Changing climate conditions have added to the unpredictability, frequency and severity of natural disasters and have created additional uncertainty as to future trends and exposures. A single catastrophic occurrence or aggregation of multiple smaller occurrences within its geographical region could adversely affect the financial condition of the Exchange. Terrorist attacks could also cause losses from insurance claims related to the property and casualty insurance operations. The Exchange could incur large net losses if terrorist attacks were to occur which could adversely affect its financial condition.
If the costs of providing services to the Exchange are not controlled, our profitability could be materially adversely affected.
Pursuant to the subscriber's agreement, we perform policy issuance and renewal services for the subscribers at the Exchange and we serve as the attorney-in-fact on behalf of the Exchange with respect to its administrative services. The most significant costs we incur in providing policy issuance and renewal services are commissions, employee costs, and technology costs.
Commissions to independent agents are our largest expense. Commissions include scheduled commissions to agents based upon premiums written as well as additional commissions and bonuses to agents, which are earned by achieving certain targeted measures. Changes to commission rates or bonus programs may result in increased future costs and lower profitability.
Our second largest expense is employee costs, including salaries, healthcare, pension, and other benefit costs. Regulatory developments, provider relationships, and demographic and economic factors that are beyond our control indicate that employee healthcare costs could continue to increase. Although we actively manage these cost increases, there can be no assurance that future cost increases will not occur and reduce our profitability. The defined benefit pension plan we offer to our employees is affected by variable factors such as the interest rate used to discount pension liabilities, asset performance and changes in retirement patterns, which are beyond our control and any related future costs increases would reduce our profitability.
Technological development is necessary to facilitate ease of doing business for employees, agents and customers. Insurance company technological developments are focused on simplifying and improving the customer experience, increasing efficiencies, redesigning products and addressing other potentially disruptive changes in the insurance industry. As we continue
6460_Fin.pdf 7 3/19/19 10:46 PM

8
to develop technology initiatives in order to remain competitive, our profitability could be negatively impacted as we invest in system development projects.
We are subject to credit risk from the Exchange because the management fees from the Exchange are not paid immediately when premiums are written.
We recognize a significant portion of management fees due from the Exchange as income when the premiums are written because at that time we have performed substantially all of the services we are required to perform related to policy issuance and renewal. However, the management fees are not paid to us by the Exchange until the Exchange collects the premiums from subscribers/policyholders. As a result, we hold receivables for management fees on premiums that have been written and assumed by the Exchange but not yet collected. We also hold receivables from the Exchange for claims related and administrative costs for which we are reimbursed at actual costs. These costs are settled monthly. The receivable from the Exchange totaled $449.9 million, or approximately 25% of our total assets at December 31, 2018.
Our ability to attract, develop, and retain talented executives, key managers, and employees is critical to our success.
Our success is largely dependent upon our ability to attract and retain executives and other key management. The loss of the services and leadership of certain key officers and the failure to attract and develop talented new executives and managers could prevent us from successfully communicating, implementing, and executing business strategies, and therefore have a material adverse effect on our financial condition and results of operations.
Our success also depends on our ability to attract, develop, and retain a talented employee base. The inability to staff all functions of our business with employees possessing the appropriate technical expertise, or our failure to recognize and respond to changing trends and other circumstances that affect our employees, could have an adverse effect on our business performance. Staffing appropriately skilled employees for the handling of claims and servicing of customers, rendering of disciplined underwriting, and effective sales and marketing are critical to the core functions of our business. In addition, skilled employees in the actuarial, finance, human resources, law, and information technology areas are also essential to support our core functions.
If we are unable to ensure system availability or effectively manage technology initiatives, we may experience adverse financial consequences and/or may be unable to compete effectively.
Our business is highly dependent upon the effectiveness of our technology and information systems which support key functions of our core business operations including processing applications and premium payments, providing customer support, performing actuarial and financial analysis, and maintaining key data. Additionally, the Exchange relies heavily on technology systems for processing claims. In order to support our business processes and strategic initiatives in a cost and resource efficient manner, we must maintain the effectiveness of existing technology systems and continue to both develop new, and enhance existing, technology systems. As we invest in the development of our systems, costs and completion times could exceed original estimates, and/or the project may not deliver the anticipated benefit, or perform as expected. If we do not effectively and efficiently manage and upgrade our technology systems, our ability to serve our customers and implement our strategic initiatives could be adversely impacted.
We utilize third-party software for certain technology and business process functions. If our third-party software vendors are subjected to intellectual property infringement claims, we may lose the ability to use their software until the dispute is resolved.
Additionally, we depend on a large amount of data to price policies appropriately, track exposures, perform financial analysis, report to regulatory bodies, and ultimately make business decisions. Should this data be inaccurate or insufficient, risk exposure may be underestimated and/or poor business decisions may be made. This may in turn lead to adverse operational or financial performance and adverse customer or investor confidence.
If we experience difficulties with technology, data and network security, including as a result of cyber attacks, third-party relationships or cloud-based relationships, our ability to conduct our business could be adversely impacted.
In the normal course of business we collect, use, store and where appropriate, disclose data concerning individuals and businesses. We also conduct business using third-party vendors who may provide software, data storage, cloud-based computing and other technology services. Like other companies, we have on occasion experienced, and will continue to experience, cyber threats to our data and systems. Cyber threats can create significant risks such as destruction of systems or data, denial of service, disruption of transaction execution, loss or exposure of customer data, theft or exposure of our intellectual property, theft of funds or disruption of other important business functions. The business we conduct with our
6460_Fin.pdf 8 3/19/19 10:46 PM

9
third-party vendors may expose us to increased risk related to data security, service disruptions or effectiveness of our control system.
In addition, we are subject to numerous federal and state data privacy laws relating to the privacy of the nonpublic personal information of our customers, employees and others. The misuse or mishandling of information sent to or received from a customer, employee or third party could result in legal liability, regulatory action and reputational damage. Third parties on whom we rely for certain business processing functions are also subject to these risks, and their failure to adhere to these laws and regulations could negatively impact us.
We employ a company-wide cybersecurity program of technical, administrative, physical and disclosure controls intended to reduce the risk of cyber threats and protect our information, as well as to communicate potential material threats and incidents. Our cybersecurity philosophy and approach align to the National Institute of Standards and Technology Cybersecurity Framework and its core elements to identify, protect, detect, respond and recover from the various forms of cyber threats. Our practices include, but are not limited to, cybersecurity protocols and controls, system monitoring and detection, communication of incidents to appropriate management, vendor risk management, and ongoing privacy and cybersecurity training for employees and contractors concerning cyber risk. We periodically assess the effectiveness of our cybersecurity efforts including independent validation and verification and security assessments conducted by independent third parties. The number, complexity and sophistication of cyber threats continue to increase over time. The controls we have implemented, and continue to develop, may not be sufficient to prevent events like unauthorized physical or electronic access, denial of service, cyber attacks, or other security breaches to our computer systems or those of third parties with whom we do business. In some cases, such events may not be immediately detected and/or the impact of such events immediately determined.
Our Board of Directors oversees our activities with respect to managing cyber risk through a specific cybersecurity subcommittee. Management periodically reports on our cybersecurity risk management program including our risk evaluation and the results of independent third party security assessments, and our efforts to mitigate cyber related risks.
To date, we are not aware of any material cybersecurity breach with respect to our systems or data. Any cyber incident or other security breach could cause disruption in our business operations and may result in other negative consequences including significant remediation costs, loss of revenue, additional regulatory scrutiny, fines, litigation, monetary damages and reputational harm. While we maintain cyber liability insurance to mitigate the financial risk around cyber incidents, such insurance may not cover all costs associated with the consequences of information or systems being compromised. As a result, in the event of a material cybersecurity breach, our business, cash flows, financial condition or results of operations could be materially, adversely affected.
If events occurred causing interruption of our operations, facilities, systems or business functions, it could have a material adverse effect on our operations and financial results.
We have an established business continuity plan to ensure the continuation of core business operations in the event that normal business operations could not be performed due to a catastrophic event. While we continue to test and assess our business continuity plan to ensure it meets the needs of our core business operations and addresses multiple business interruption events, there is no assurance that core business operations could be performed upon the occurrence of such an event. Systems failures or outages could compromise our ability to perform our business functions in a timely manner, which could harm our ability to conduct business and hurt our relationships with our business partners and customers. Our business continuity is also dependent on third-party systems on which our information technology systems interface and rely. Our systems and those of our third-party vendors may become vulnerable to damage or disruption due to circumstances beyond our or their control, such as from catastrophic events, power anomalies or outages, natural disasters, network failures, and viruses. The failure of our information systems for any reason could result in a material adverse effect on our business, cash flows, financial condition, or results of operations.
The performance of our investment portfolio is subject to a variety of investment risks, which may in turn have a material adverse effect on our results of operations or financial condition.
Our investment portfolio is comprised principally of fixed income securities. At December 31, 2018, our investment portfolio consisted of approximately 88% fixed income securities. The remaining 12% is comprised of other investments, limited partnerships and equity securities.
All of our marketable securities are subject to market volatility. To the extent that future market volatility negatively impacts our investments, our financial condition will be negatively impacted. We review the investment portfolio on a continuous basis to evaluate positions that might have incurred other-than-temporary declines in value. Inherent in management's evaluation of
6460_Fin.pdf 9 3/19/19 10:46 PM

10
a security are assumptions and estimates about the operations of the issuer and its future earnings potential. The primary factors considered in our review of investment valuation include the extent and duration to which fair value is less than cost, historical operating performance and financial condition of the issuer, short- and long-term prospects of the issuer and its industry, specific events that occurred affecting the issuer, including rating downgrades, and, depending on the type of security, our intent to sell or our ability and intent to retain the investment for a period of time sufficient to allow for a recovery in value. As the process for determining impairments is highly subjective, changes in our assessments may have a material effect on our operating results and financial condition. See also Item 7A. "Quantitative and Qualitative Disclosures about Market Risk".
If the fixed income, equity, or limited partnership portfolios were to suffer a substantial decrease in value, our financial position and results of operations could be materially adversely affected through increased realized/unrealized losses or impairments.
The performance of the fixed income portfolio is subject to a number of risks including, but not limited to:
• Interest rate risk - the risk of adverse changes in the value of fixed income securities as a result of increases in market interest rates.
• Investment credit risk - the risk that the value of certain investments may decrease due to the deterioration in financial condition of, or the liquidity available to, one or more issuers of those securities or, in the case of asset-backed securities, due to the deterioration of the loans or other assets that underlie the securities, which, in each case, also includes the risk of permanent loss.
• Sector/Concentration risk - the risk that the portfolio may be too heavily concentrated in the securities of one or more issuers, sectors, or industries. Events or developments that have a negative impact on any particular industry, group of related industries, or geographic region may have a greater adverse effect on our investment portfolio to the extent that the portfolio is concentrated within those issuers, sectors, or industries.
• Liquidity risk - the risk that we will not be able to convert investment securities into cash on favorable terms and on a timely basis, or that we will not be able to sell them at all, when desired. Disruptions in the financial markets or a lack of buyers for the specific securities that we are trying to sell, could prevent us from liquidating securities or cause a reduction in prices to levels that are not acceptable to us.
General economic conditions and other factors beyond our control can adversely affect the value of our investments and the realization of net investment income, or result in realized investment losses. In addition, downward economic trends also may have an adverse effect on our investment results by negatively impacting the business conditions and impairing credit for the issuers of securities held in our respective investment portfolios. This could reduce fair values of investments and generate significant unrealized losses or impairment charges which may adversely affect our financial results.
In addition to the fixed income securities, a portion of our portfolio is invested in limited partnerships. At December 31, 2018, we had investments in limited partnerships of $34.8 million, or 2% of total assets. While we have an obligation to invest up to an additional $12.2 million in limited partnerships, including private equity, mezzanine debt, and real estate partnership investments, the potential of the partnerships calling for the satisfaction of these obligations is low given the age of these investments. Limited partnerships are significantly less liquid and generally involve higher degrees of price risk, the risk of potential loss in estimated fair value resulting from an adverse change in prices, than publicly traded securities. Limited partnerships, like publicly traded securities, have exposure to market volatility; but unlike fixed income securities, cash flows and return expectations are less predictable. We have made no new limited partnership commitments since 2006, and the balance of limited partnership investments is expected to decline over time as additional distributions are received.
The primary basis for the valuation of limited partnership interests are financial statements prepared by the general partner. Because of the timing of the preparation and delivery of these financial statements, the use of the most recently available financial statements provided by the general partners result in a quarter delay in the inclusion of the limited partnership results in our Statements of Operations. Due to this delay, our financial statements at December 31, 2018 do not reflect market conditions experienced in the fourth quarter of 2018.
Our equity securities have exposure to price risk. We do not hedge our exposure to equity price risk inherent in our equity investments. Equity markets, sectors, industries, and individual securities may also be subject to some of the same risks that affect our fixed income portfolio, as discussed above.
6460_Fin.pdf 10 3/19/19 10:46 PM

11
Deteriorating capital and credit market conditions or a failure to accurately estimate capital needs may significantly affect our ability to meet liquidity needs and access capital.
Sufficient liquidity and capital levels are required to pay operating expenses, income taxes, and to provide the necessary resources to fund future growth opportunities, satisfy certain financial covenants, pay dividends on common stock, and repurchase common stock. Management estimates the appropriate level of capital necessary based upon current and projected results, which includes evaluating potential risks. Failure to accurately estimate our capital needs may have a material adverse effect on our financial condition until additional sources of capital can be obtained. Further, a deteriorating financial condition may create a negative perception of us by third parties, including rating agencies, investors, financial institutions, agents, and customers which could impact our ability to access additional capital in the debt or equity markets.
Our primary sources of liquidity are management fee revenue and cash flows generated from our investment portfolio. In the event our current sources do not satisfy our liquidity needs, we have the ability to access our $100 million bank revolving line of credit, from which there were no borrowings as of December 31, 2018, or liquidate assets in our investment portfolio. Volatility in the financial markets could limit our ability to sell certain of our fixed income securities or cause such investments to sell at deep discounts.
In the event these traditional sources of liquidity are not available, we may have to seek additional financing. Our access to funds will depend upon a number of factors including current market conditions, the availability of credit, market liquidity, and credit ratings. In deteriorating market conditions, there can be no assurance that we will obtain additional financing, or, if available, that the cost of financing will not substantially increase and affect our overall profitability.
We are subject to applicable insurance laws, tax statutes, and regulations, as well as claims and legal proceedings, which, if determined unfavorably, could have a material adverse effect on our business, results of operations, or financial condition.
We face a significant risk of litigation and regulatory investigations and actions in the ordinary course of operating our businesses including the risk of class action lawsuits. Our pending legal and regulatory actions include proceedings specific to us and others generally applicable to business practices in the industries in which we operate. In our operations, we are, have been, or may become subject to class actions and individual suits alleging, among other things, issues relating to sales or underwriting practices, payment of contingent or other sales commissions, product design, product disclosure, policy issuance and administration, additional premium charges for premiums paid on a periodic basis, charging excessive or impermissible fees on products, recommending unsuitable products to customers, and breaching alleged fiduciary or other duties, including our obligations to indemnify directors and officers in connection with certain legal matters. We are also subject to litigation arising out of our general business activities such as contractual and employment relationships and claims regarding the infringement of the intellectual property of others. Plaintiffs in class action and other lawsuits against us may seek very large or indeterminate amounts, including punitive and treble damages, which may remain unknown for substantial periods of time. We are also subject to various regulatory inquiries, such as information requests, subpoenas, and books and record examinations from state and federal regulators and authorities. Changes in the way regulators administer those laws, tax statutes, or regulations could adversely impact our business, cash flows, results of operations, or financial condition.
ITEM 1B. UNRESOLVED STAFF COMMENTS None.
6460_Fin.pdf 11 3/19/19 10:46 PM

12
ITEM 2. PROPERTIES Indemnity and the Exchange share a corporate home office complex in Erie, Pennsylvania, which comprises approximately 637,000 square feet. In 2016, we began the construction of a new office building that will serve as part of our principal headquarters. The project is expected to span approximately three years and will add approximately 346,000 square feet to our existing home office complex. Additionally, we lease one office building and one warehouse facility from unaffiliated parties. We are charged rent for the related square footage we occupy. Indemnity and the Exchange also operate 25 field offices in 12 states to perform primarily claims-related activities. Indemnity previously owned three field offices. On December 31, 2018, we sold the three field offices to the Exchange at the current independent appraised value in order to align the ownership interest of these facilities with the functions being performed at these locations. See Part II, Item 8. "Financial Statements and Supplementary Data - Note 14, Related Party, of Notes to Financial Statements" contained within this report. As a result, the Exchange now owns seven field offices and the remaining field offices are leased from other parties. Commitments for properties leased from other parties expire periodically through 2027. We expect that most leases will be renewed or replaced upon expiration. Rental costs of shared facilities are allocated based upon usage or square footage occupied.
6460_Fin.pdf 12 3/19/19 10:46 PM

13
ITEM 3. LEGAL PROCEEDINGS
State Court Lawsuit Against Erie Indemnity CompanyErie Indemnity Company (“Indemnity”) was named as a defendant in a complaint filed on August 1, 2012 by alleged subscribers of the Erie Insurance Exchange (the “Exchange”) in the Court of Common Pleas Civil Division of Fayette County, Pennsylvania captioned Erie Insurance Exchange, an unincorporated association, by Joseph S. Sullivan and Anita Sullivan, Patricia R. Beltz, and Jenna L. DeBord, trustees ad litem v. Erie Indemnity Co. (the “Sullivan” lawsuit).
As subsequently amended, the complaint alleges that, beginning on September 1, 1997, Indemnity retained “Service Charges” (installment fees) and “Added Service Charges” (late fees and policy reinstatement charges) on policies written by Exchange and its insurance subsidiaries, which allegedly should have been paid to Exchange, in the amount of approximately $308 million. In addition to their claim for monetary relief on behalf of Exchange, Plaintiffs seek an accounting of all so-called intercompany transactions between Indemnity and Exchange from 1996 to date. Plaintiffs allege that Indemnity breached its contractual, fiduciary, and equitable duties by retaining Service Charges and Added Service Charges that should have been retained by Exchange. Plaintiffs bring these same claims under three separate derivative-type theories. First, Plaintiffs purport to bring suit as members of Exchange on behalf of Exchange. Second, Plaintiffs purport to bring suit as trustees ad litem on behalf of Exchange. Third, Plaintiffs purport to bring suit on behalf of Exchange pursuant to Rule 1506 of the Pennsylvania Rules of Civil Procedure, which allows shareholders to bring suit derivatively on behalf of a corporation or similar entity.
Indemnity filed a motion in the state court in November 2012 seeking dismissal of the lawsuit. On December 19, 2013, the court granted Indemnity’s motion in part, holding that the Pennsylvania Insurance Holding Company Act “provides the [Pennsylvania Insurance] Department with special competence to address the subject matter of plaintiff’s claims” and referring “all issues” in the Sullivan lawsuit to the Pennsylvania Insurance Department (the “Department”) for “its views and any determination.” The court stayed all further proceedings and reserved decision on all other grounds for dismissal raised by Indemnity. Plaintiffs sought reconsideration of the court’s order, and on January 13, 2014, the court entered a revised order affirming its prior order and clarifying that the Department “shall decide any and all issues within its jurisdiction.” On January 30, 2014, Plaintiffs asked the court to certify its order to permit an immediate appeal to the Superior Court of Pennsylvania and to stay any proceedings in the Department pending completion of any appeal. On February 18, 2014, the court issued an order denying Plaintiffs’ motion. On March 20, 2014, Plaintiffs filed a petition for review with the Superior Court, which was denied by the Superior Court on May 5, 2014.
The Sullivan matter was assigned to an Administrative Judge within the Department for determination. The parties agreed that an evidentiary hearing was not required, entered into a stipulated record, and submitted briefing to the Department. Oral argument was held before the Administrative Judge on January 6, 2015. On April 29, 2015, the Department issued a declaratory opinion and order: (1) finding that the transactions between Exchange and Indemnity in which Indemnity retained or received revenue from installment and other service charges from Exchange subscribers complied with applicable insurance laws and regulations and that Indemnity properly retained charges paid by Exchange policyholders for certain installment premium payment plans, dishonored payments, policy cancellations, and policy reinstatements; and (2) returning jurisdiction over the matter to the Fayette County Court of Common Pleas.
On May 26, 2015, Plaintiffs appealed the Department’s decision to the Pennsylvania Commonwealth Court. Oral argument was held before the Commonwealth Court en banc on December 9, 2015. On January 27, 2016, the Commonwealth Court issued an opinion vacating the Department’s ruling and directing the Department to return the case to the Court of Common Pleas, essentially holding that the primary jurisdiction referral of the trial court was improper at this time because the allegations of the complaint do not implicate the special competency of the Department.
On February 26, 2016, Indemnity filed a petition for allowance of appeal to the Pennsylvania Supreme Court seeking further review of the Commonwealth Court opinion. On March 14, 2016, Plaintiffs filed an answer opposing Indemnity’s petition for allowance of appeal; and, on March 28, 2016, Indemnity sought permission to file a reply brief in further support of its petition for allowance of appeal. On August 10, 2016, the Pennsylvania Supreme Court denied Indemnity’s petition for allowance of appeal; and the Sullivan lawsuit returned to the Court of Common Pleas of Fayette County.
On September 12, 2016, Plaintiffs filed a motion to stay the Sullivan lawsuit pending the outcome of the Federal Court Lawsuit they filed against Indemnity and former and current Directors of Indemnity on July 8, 2016. (See below.) Indemnity filed an opposition to Plaintiff’s motion to stay on September 19, 2016; and filed amended preliminary objections seeking dismissal of the Sullivan lawsuit on September 20, 2016. The motion to stay and the amended preliminary objections remain pending. On June 27, 2018, Plaintiffs filed a motion for a status conference in the Sullivan lawsuit.
6460_Fin.pdf 13 3/19/19 10:46 PM

14
On July 30, 2018, the Court held a status conference and thereafter lifted the stay of proceedings. On September 28, 2018, Indemnity filed a Motion to Enforce the Federal Judgment in the Beltz II lawsuit, seeking dismissal of the Sullivan lawsuit with prejudice. On October 26, 2018, Plaintiffs filed an opposition to that Motion; and Indemnity filed a reply in further support on November 5, 2018. Oral argument was held on Indemnity’s Motion to Enforce the Federal Judgment on November 20, 2018. The Motion to Enforce the Federal Judgment remains pending.
Indemnity believes that it continues to have meritorious legal and factual defenses to the Sullivan lawsuit and intends to vigorously defend against all allegations and requests for relief.
Federal Court Lawsuit Against Erie Indemnity Company and DirectorsOn February 6, 2013, a lawsuit was filed in the United States District Court for the Western District of Pennsylvania, captioned Erie Insurance Exchange, an unincorporated association, by members Patricia R. Beltz, Joseph S. Sullivan and Anita Sullivan, and Patricia R. Beltz, on behalf of herself and others similarly situate v. Richard L. Stover; J. Ralph Borneman, Jr.; Terrence W. Cavanaugh; Jonathan Hirt Hagen; Susan Hirt Hagen; Thomas B. Hagen; C. Scott Hartz; Claude C. Lilly, III; Lucian L. Morrison; Thomas W. Palmer; Martin P. Sheffield; Elizabeth H. Vorsheck; and Robert C. Wilburn (the “Beltz” lawsuit), by alleged policyholders of Exchange who are also the plaintiffs in the Sullivan lawsuit. The individuals named as defendants in the Beltz lawsuit were the then-current Directors of Indemnity.
As subsequently amended, the Beltz lawsuit asserts many of the same allegations and claims for monetary relief as in the Sullivan lawsuit. Plaintiffs purport to sue on behalf of all policyholders of Exchange, or, alternatively, on behalf of Exchange itself. Indemnity filed a motion to intervene as a Party Defendant in the Beltz lawsuit in July 2013, and the Directors filed a motion to dismiss the lawsuit in August 2013. On February 10, 2014, the court entered an order granting Indemnity’s motion to intervene and permitting Indemnity to join the Directors’ motion to dismiss; granting in part the Directors’ motion to dismiss; referring the matter to the Department to decide any and all issues within its jurisdiction; denying all other relief sought in the Directors’ motion as moot; and dismissing the case without prejudice. To avoid duplicative proceedings and expedite the Department’s review, the Parties stipulated that only the Sullivan action would proceed before the Department and any final and non-appealable determinations made by the Department in the Sullivan action will be applied to the Beltz action.
On March 7, 2014, Plaintiffs filed a notice of appeal to the United States Court of Appeals for the Third Circuit. Indemnity filed a motion to dismiss the appeal on March 26, 2014. On November 17, 2014, the Third Circuit deferred ruling on Indemnity’s motion to dismiss the appeal and instructed the parties to address that motion, as well as the merits of Plaintiffs’ appeal, in the parties’ briefing. Briefing was completed on April 2, 2015. In light of the Department’s April 29, 2015 decision in Sullivan, the Parties then jointly requested that the Beltz appeal be voluntarily dismissed as moot on June 5, 2015. The Third Circuit did not rule on the Parties’ request for dismissal and instead held oral argument as scheduled on June 8, 2015. On July 16, 2015, the Third Circuit issued an opinion and judgment dismissing the appeal. The Third Circuit found that it lacked appellate jurisdiction over the appeal, because the District Court’s February 10, 2014 order referring the matter to the Department was not a final, appealable order.
On July 8, 2016, the Beltz plaintiffs filed a new action labeled as a “Verified Derivative And Class Action Complaint” in the United States District Court for the Western District of Pennsylvania. The action is captioned Patricia R. Beltz, Joseph S. Sullivan, and Anita Sullivan, individually and on behalf of all others similarly situated, and derivatively on behalf of Nominal Defendant Erie Insurance Exchange v. Erie Indemnity Company; Kaj Ahlmann; John T. Baily; Samuel P. Black, III; J. Ralph Borneman, Jr.; Terrence W. Cavanaugh; Wilson C. Cooney; LuAnn Datesh; Patricia A. Goldman; Jonathan Hirt Hagen; Thomas B. Hagen; C. Scott Hartz; Samuel P. Katz; Gwendolyn King; Claude C. Lilly, III; Martin J. Lippert; George R. Lucore; Jeffrey A. Ludrof; Edmund J. Mehl; Henry N. Nassau; Thomas W. Palmer; Martin P. Sheffield; Seth E. Schofield; Richard L. Stover; Jan R. Van Gorder; Elizabeth A. Hirt Vorsheck; Harry H. Weil; and Robert C. Wilburn (the “Beltz II” lawsuit). The individual defendants are all present or former Directors of Indemnity (the “Directors”).
The allegations of the Beltz II lawsuit arise from the same fundamental, underlying claims as the Sullivan and prior Beltz litigation, i.e., that Indemnity improperly retained Service Charges and Added Service Charges. The Beltz II lawsuit alleges that the retention of the Service Charges and Added Service Charges was improper because, for among other reasons, that retention constituted a breach of the Subscriber’s Agreement and an Implied Covenant of Good Faith and Fair Dealing by Indemnity, breaches of fiduciary duty by Indemnity and the other defendants, conversion by Indemnity, and unjust enrichment by defendants Jonathan Hirt Hagen, Thomas B. Hagen, and Elizabeth A. Hirt Vorsheck, at the expense of Exchange. The Beltz II lawsuit requests, among other things, that a judgment be entered against the Defendants certifying the action as a class action pursuant to Rule 23 of the Federal Rules of Civil Procedure; declaring Plaintiffs as representatives of the Class and Plaintiffs’ counsel as counsel for the Class; declaring the conduct alleged as unlawful, including, but not limited to, Defendants’ retention of the Service Charges and Added Service Charges; enjoining Defendants from continuing to retain the Service Charges and Added Service Charges; and awarding compensatory and punitive damages and interest.
6460_Fin.pdf 14 3/19/19 10:46 PM

15
On September 23, 2016, Indemnity filed a motion to dismiss the Beltz II lawsuit. On September 30, 2016, the Directors filed their own motions to dismiss the Beltz II lawsuit. On July 17, 2017, the Court granted Indemnity’s and the Directors’ motions to dismiss the Beltz II lawsuit, dismissing the case in its entirety. The Court ruled that “the Subscriber’s Agreement does not govern the separate and additional charges at issue in the Complaint” and, therefore, dismissed the breach of contract claim against Indemnity for failure to state a claim. The Court also ruled that the remaining claims, including the claims for breach of fiduciary duty against Indemnity and the Directors, are barred by the applicable statutes of limitation or fail to state legally cognizable claims. On August 14, 2017, Plaintiffs filed a notice of appeal to the United States Court of Appeals for the Third Circuit.
On May 10, 2018, the United States Court of Appeals for the Third Circuit affirmed the District Court’s dismissal of the Beltz II lawsuit. On May 24, 2018, Plaintiffs filed a petition seeking rehearing of their appeal before the Third Circuit. The Third Circuit denied that petition on June 14, 2018.
Federal Court Lawsuit Against Erie Indemnity Company and DirectorsOn December 28, 2017 a lawsuit was filed in the United States District Court for the Western District of Pennsylvania captioned Lynda Ritz, individually and on behalf of all others similarly situated and derivatively on behalf of Nominal Defendant Erie Insurance Exchange v. Erie Indemnity Company, J. Ralph Borneman, Jr., Terrence W. Cavanaugh, Eugene C. Connell, LuAnn Datesh, Jonathan Hirt Hagen, Thomas B. Hagen, C. Scott Hartz, Brian A. Hudson, Sr., Claude C. Lilly, III, George R. Lucore, Thomas W. Palmer, Martin P. Sheffield, Richard L. Stover, Elizabeth A. Hirt Vorsheck, and Robert C. Wilburn, and Erie Insurance Exchange (Nominal Defendant) (the “Ritz” lawsuit). The individual named as Plaintiff is alleged to be a policyholder (subscriber) of the Erie Insurance Exchange (the “Exchange”). With the exception of Terrence W. Cavanaugh and Robert C. Wilburn, the individuals named as Defendants comprise the current Board of Directors of Indemnity. Messrs. Cavanaugh and Wilburn are former Directors of Indemnity (the “Directors”).
The Complaint alleges that since at least 2007, Erie Indemnity Company has taken “unwarranted and excessive” management fees as compensation for its services under the Subscriber’s Agreement. Count I of the Complaint purports to allege a claim for breach of alleged fiduciary duties against Indemnity and the Directors on behalf of Plaintiff and a putative class of subscribers. Count II purports to allege a claim for breach of alleged fiduciary duties against Indemnity and the Directors on behalf of Exchange. Count III purports to allege a claim for breach of contract and an alleged implied covenant of good faith and fair dealing against Indemnity on behalf of Plaintiff and a putative class. Count IV purports to allege a claim of unjust enrichment against several Directors.
The Complaint seeks compensatory and punitive damages and requests the Court to enjoin Indemnity from continuing to retain excessive management fees; and order such other relief as may be appropriate.
On March 5, 2018, Indemnity filed a motion to dismiss the Ritz lawsuit. The Directors also filed their own motions to dismiss the Ritz lawsuit on March 5, 2018. Plaintiff filed her responses to both motions on April 26, 2018; and Indemnity and the Directors filed their replies in support of their motions on May 25, 2018. On February 4, 2019, the Court granted Indemnity’s and the Directors’ motions to dismiss the Ritz suit in its entirety, with prejudice, on the basis that all of the alleged claims in the Ritz suit are barred and precluded as a matter of law by the judgment entered in favor of Indemnity and the Directors in the Beltz II suit.
Indemnity believes it has meritorious legal and factual defenses and intends to vigorously defend against all allegations and requests for relief in the Ritz lawsuit. The Directors have advised Indemnity that they intend to vigorously defend against the claims in the Ritz lawsuit and have sought indemnification and advancement of expenses from the Company in connection with the Ritz lawsuit.
For additional information on contingencies, see Part II, Item 8. "Financial Statements and Supplementary Data - Note 16, Commitment and Contingencies, of Notes to Financial Statements".
ITEM 4. MINE SAFETY DISCLOSURES
Not applicable.
6460_Fin.pdf 15 3/19/19 10:46 PM
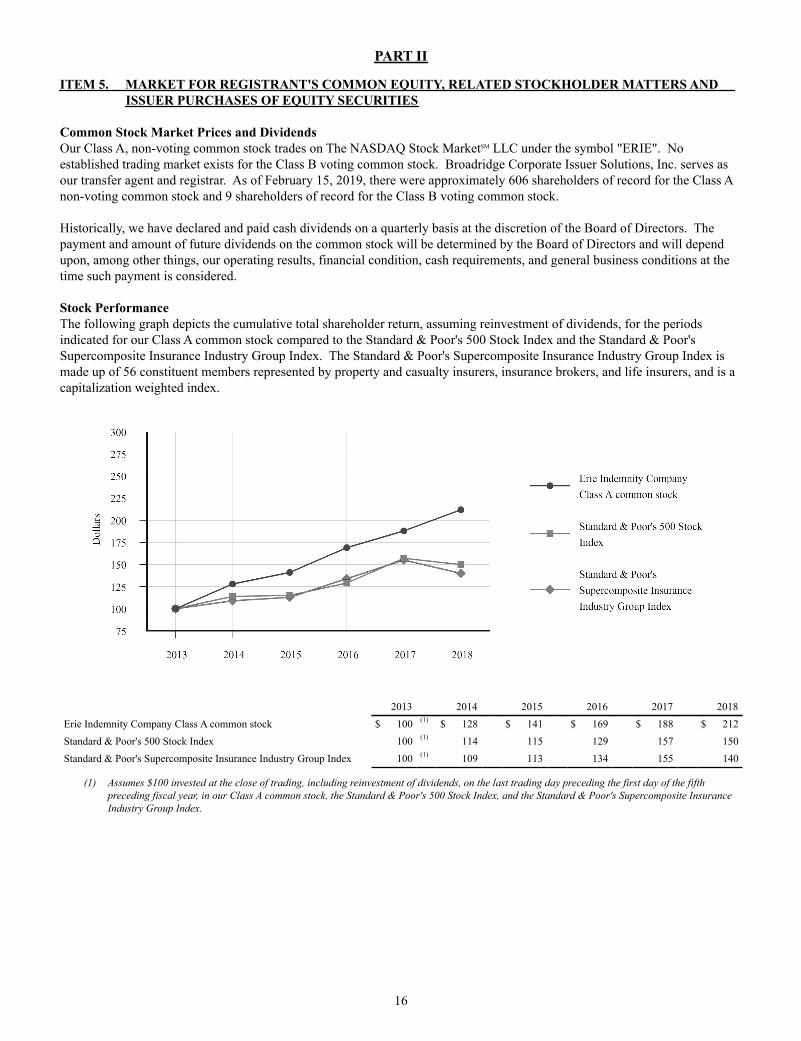
16
PART II
ITEM 5. MARKET FOR REGISTRANT'S COMMON EQUITY, RELATED STOCKHOLDER MATTERS AND ISSUER PURCHASES OF EQUITY SECURITIES
Common Stock Market Prices and DividendsOur Class A, non-voting common stock trades on The NASDAQ Stock MarketSM LLC under the symbol "ERIE". No established trading market exists for the Class B voting common stock. Broadridge Corporate Issuer Solutions, Inc. serves as our transfer agent and registrar. As of February 15, 2019, there were approximately 606 shareholders of record for the Class A non-voting common stock and 9 shareholders of record for the Class B voting common stock. Historically, we have declared and paid cash dividends on a quarterly basis at the discretion of the Board of Directors. The payment and amount of future dividends on the common stock will be determined by the Board of Directors and will depend upon, among other things, our operating results, financial condition, cash requirements, and general business conditions at the time such payment is considered.
Stock PerformanceThe following graph depicts the cumulative total shareholder return, assuming reinvestment of dividends, for the periods indicated for our Class A common stock compared to the Standard & Poor's 500 Stock Index and the Standard & Poor's Supercomposite Insurance Industry Group Index. The Standard & Poor's Supercomposite Insurance Industry Group Index is made up of 56 constituent members represented by property and casualty insurers, insurance brokers, and life insurers, and is a capitalization weighted index.
2013 2014 2015 2016 2017 2018Erie Indemnity Company Class A common stock $ 100 (1) $ 128 $ 141 $ 169 $ 188 $ 212Standard & Poor's 500 Stock Index 100 (1) 114 115 129 157 150Standard & Poor's Supercomposite Insurance Industry Group Index 100 (1) 109 113 134 155 140
(1) Assumes $100 invested at the close of trading, including reinvestment of dividends, on the last trading day preceding the first day of the fifth preceding fiscal year, in our Class A common stock, the Standard & Poor's 500 Stock Index, and the Standard & Poor's Supercomposite Insurance Industry Group Index.
6460_Fin.pdf 16 3/19/19 10:46 PM

17
Issuer Purchases of Equity SecuritiesWe may purchase shares, from time-to-time, in the open market, through trading plans entered into with one or more brokerage firms pursuant to Rule 10b5-1 under the Securities Exchange Act of 1934, or through privately negotiated transactions. The purchase of shares is dependent upon prevailing market conditions and alternate uses of capital, and at times and in a manner that is deemed appropriate.
Our Board of Directors authorized a stock repurchase program effective January 1, 1999, allowing the repurchase of our outstanding Class A nonvoting common stock. Various approvals for continuation of this program have since been authorized, with the most recent occurring in 2011 for $150 million, which was authorized with no time limitation. There were no repurchases of our Class A common stock under this program during the quarter ending December 31, 2018. We had approximately $17.8 million of repurchase authority remaining under this program, based upon trade date, at both December 31, 2018 and February 15, 2019. See Part II, Item 8. "Financial Statements and Supplementary Data – Note 12, Capital Stock, of Notes to Financial Statements" contained within this report for discussion of additional shares purchased outside of this program.
ITEM 6. SELECTED FINANCIAL DATA
(in thousands, except per share data) Years Ended December 31,
2018 2017 (4) 2016 (4) 2015 2014Operating Data:
Operating revenue (1) $ 2,382,212 $ 1,691,774 $ 1,596,631 $ 1,505,508 $ 1,407,119Operating expenses (1) 2,037,869 1,401,522 1,303,114 1,272,967 1,184,272Investment income 25,796 28,592 27,839 33,708 28,417Interest expense and other (income), net (1,181) 3,149 1,265 — —Income before income taxes 371,320 315,695 320,091 266,249 251,264Net income (2) 288,224 196,999 210,366 174,678 167,505
Per Share Data:
Net income per Class A share – diluted (2) $ 5.51 $ 3.76 $ 4.01 $ 3.33 $ 3.18Book value per share – Class A common and equivalent B shares 18.62 16.40 15.62 14.72 13.45Dividends declared per Class A share 3.42 3.1875 2.9725 2.773 2.586Dividends declared per Class B share 513.00 478.125 445.875 415.95 387.90
Financial Position Data:
Investments $ 795,197 $ 803,835 $ 771,450 $ 688,476 $ 702,387Receivables from Erie Insurance Exchange and affiliates 449,873 418,328 378,540 348,055 335,220Current and long-term borrowings 99,730 74,728 24,766 — —Total assets 1,778,327 1,665,859 1,548,955 1,407,296 1,319,198Total equity (3) 973,672 857,344 816,910 769,503 703,134
(1) In accordance with Accounting Standards Codification 606, "Revenue from Contracts with Customers" ("ASC 606"), effective January 1, 2018, we allocate our management fee between the two performance obligations we have in the subscriber's agreement, policy issuance and renewal services and administrative services. We also present expenses we incur and the related reimbursements we receive for administrative services gross in our Statement of Operations. See Part II, Item 8. "Financial Statements and Supplementary Data - Note 2, Significant Accounting Policies, of Notes to Financial Statements" contained within this report.
(2) The corporate tax rate was 35% for years 2014-2017 and was reduced to 21% in 2018 with the enactment of the Tax Cuts and Jobs Act. This, coupled with increased operating income, drove the increase in net income and net income per Class A share - diluted in 2018 when compared to 2017.
(3) On January 1, 2018, we adopted ASC 606 and recorded a cumulative effect adjustment that reduced retained earnings by $38.3 million. See Part II, Item 8. "Financial Statements and Supplementary Data - Note 2, Significant Accounting Policies, of Notes to Financial Statements" contained within this report.
(4) Certain amounts previously reported for years 2017 and 2016 have been reclassified for comparative purposes to conform to the current period’s
presentation.
6460_Fin.pdf 17 3/19/19 10:46 PM

18
ITEM 7. MANAGEMENT'S DISCUSSION AND ANALYSIS OF FINANCIAL CONDITION AND RESULTS OF OPERATIONS
The following discussion of financial condition and results of operations highlights significant factors influencing Erie Indemnity Company ("Indemnity", "we", "us", "our"). This discussion should be read in conjunction with the audited financial statements and related notes and all other items contained within this Annual Report on Form 10-K as these contain important information helpful in evaluating our financial condition and results of operations.
INDEX
Page Number
Cautionary Statement Regarding Forward-Looking InformationRecently Adopted Accounting StandardsRecent Accounting StandardsOperating OverviewCritical Accounting EstimatesResults of OperationsFinancial Condition
InvestmentsShareholders' EquityHome Office Expansion
Liquidity and Capital ResourcesTransactions/Agreements with Related Parties
CAUTIONARY STATEMENT REGARDING FORWARD-LOOKING INFORMATION "Safe Harbor" Statement under the Private Securities Litigation Reform Act of 1995:Statements contained herein that are not historical fact are forward-looking statements and, as such, are subject to risks and uncertainties that could cause actual events and results to differ, perhaps materially, from those discussed herein. Forward-looking statements relate to future trends, events or results and include, without limitation, statements and assumptions on which such statements are based that are related to our plans, strategies, objectives, expectations, intentions, and adequacy of resources. Examples of forward-looking statements are discussions relating to premium and investment income, expenses, operating results, and compliance with contractual and regulatory requirements. Forward-looking statements are not guarantees of future performance and involve risks and uncertainties that are difficult to predict. Therefore, actual outcomes and results may differ materially from what is expressed or forecasted in such forward-looking statements. Among the risks and uncertainties, in addition to those set forth in our filings with the Securities and Exchange Commission, that could cause actual results and future events to differ from those set forth or contemplated in the forward-looking statements include the following:
• dependence upon our relationship with the Exchange and the management fee under the agreement with the subscribers at the Exchange;
• dependence upon our relationship with the Exchange and the growth of the Exchange, including: general business and economic conditions; factors affecting insurance industry competition; dependence upon the independent agency system; and ability to maintain our reputation for customer service;
• dependence upon our relationship with the Exchange and the financial condition of the Exchange, including: the Exchange's ability to maintain acceptable financial strength ratings; factors affecting the quality and liquidity of the Exchange's investment portfolio; changes in government regulation of the insurance industry; emerging claims and coverage issues in the industry; and severe weather conditions or other catastrophic losses, including terrorism;
• costs of providing policy issuance and renewal services to the Exchange under the subscriber's agreement;• credit risk from the Exchange;• ability to attract and retain talented management and employees;• ability to ensure system availability and effectively manage technology initiatives;
181919192227323234343538
6460_Fin.pdf 18 3/19/19 10:46 PM

19
• difficulties with technology or data security breaches, including cyber attacks;• ability to maintain uninterrupted business operations; • factors affecting the quality and liquidity of our investment portfolio;• our ability to meet liquidity needs and access capital; and• outcome of pending and potential litigation.
A forward-looking statement speaks only as of the date on which it is made and reflects our analysis only as of that date. We undertake no obligation to publicly update or revise any forward-looking statement, whether as a result of new information, future events, changes in assumptions, or otherwise.
RECENTLY ADOPTED ACCOUNTING STANDARDS
In May 2014, the Financial Accounting Standards Board issued Accounting Standards Codification 606, "Revenue from Contracts with Customers" ("ASC 606"). ASC 606 requires an entity to recognize revenue to depict the transfer of goods or services to customers in an amount that reflects the consideration to which the entity expects to be entitled in exchange for those goods or services. (See Part II, Item 8. "Financial Statements and Supplementary Data - Note 2, Significant Accounting Policies, of Notes to Financial Statements" contained within this report.) We adopted ASC 606 as of January 1, 2018 using the modified retrospective method.
Under ASC 606, we determined that we are acting as the attorney-in-fact for the subscribers at the Exchange in two capacities pursuant to the subscriber's agreement. The first is providing policy issuance and renewal services. The second is acting as the attorney-in-fact on behalf of the Exchange, as well as the service provider for its insurance subsidiaries, with respect to all claims handling, life insurance, and investment management services, collectively referred to as "administrative services". Beginning January 1, 2018, the management fee, currently 25% of all direct and assumed premiums written by the Exchange, is allocated between the two performance obligations. Prior to the adoption of ASC 606, the entire management fee was allocated to the policy issuance and renewal services. Additionally, the expenses we incur and related reimbursements we receive for administrative services are presented gross in our Statement of Operations effective January 1, 2018.
A significant portion of the management fee is allocated to the policy issuance and renewal services and recognized at a point in time, i.e. the time of policy issuance or renewal. Therefore, the related revenue recognition pattern for the vast majority of our revenues remains unchanged. The management fee allocated to the administrative services is recognized as revenue over a four-year period in correlation to costs incurred. Upon adoption at January 1, 2018, we established a contract liability related to the administrative services of $48.5 million, a deferred tax asset of $10.2 million, and recorded a cumulative effect adjustment that reduced shareholders' equity by $38.3 million. If ASC 606 had been effective in 2017, based on current estimates our revenue would have been reduced by approximately $2.8 million for the year ended December 31, 2017.
RECENT ACCOUNTING STANDARDS See Part II, Item 8. "Financial Statements and Supplementary Data - Note 2, Significant Accounting Policies, of Notes to Financial Statements" contained within this report for a discussion of other recently adopted as well as recently issued accounting standards and the impact on our financial statements if known.
OPERATING OVERVIEW OverviewWe are a Pennsylvania business corporation that since 1925 has been the managing attorney-in-fact for the subscribers (policyholders) at the Erie Insurance Exchange ("Exchange"), a reciprocal insurer that writes property and casualty insurance. Our primary function as attorney-in-fact is to perform policy issuance and renewal services on behalf of the subscribers at the Exchange. We also act as attorney-in-fact on behalf of the Exchange, as well as the service provider for its insurance subsidiaries, with respect to all administrative services. The Exchange is a reciprocal insurance exchange, which is an unincorporated association of individuals, partnerships and corporations that agree to insure one another. Each applicant for insurance to the Exchange signs a subscriber's agreement, which contains an appointment of Indemnity as their attorney-in-fact to transact the business of the Exchange on their behalf.
6460_Fin.pdf 19 3/19/19 10:46 PM

20
Pursuant to the subscriber’s agreement for acting as attorney-in-fact in these two capacities, we earn a management fee. Management fee revenue is based upon all direct and assumed premiums written by the Exchange and the management fee rate, which is not to exceed 25%. Our Board of Directors establishes the management fee rate at least annually, generally in December for the following year. The process of setting the management fee rate includes the evaluation of current year operating results compared to both prior year and industry estimated results for both Indemnity and the Exchange, and consideration of several factors for both entities including: their relative financial strength and capital position; projected revenue, expense and earnings for the subsequent year; future capital needs; as well as competitive position. The management fee rate was set at 25% for 2018, 2017 and 2016. Our Board of Directors set the 2019 management fee rate again at 25%, its maximum level.
Our earnings are primarily driven by the management fee revenue generated for the services we provide to the Exchange. The policy issuance and renewal services we provide to the Exchange are related to the sales, underwriting and issuance of policies. The sales related services we provide include agent compensation and certain sales and advertising support services. Agent compensation includes scheduled commissions to agents based upon premiums written as well as additional commissions and bonuses to agents, which are earned by achieving targeted measures. Agent compensation comprised approximately 67% of our 2018 policy issuance and renewal expenses. The underwriting services we provide include underwriting and policy processing and comprised approximately 10% of our 2018 policy issuance and renewal expenses. The remaining services we provide include customer service and administrative support. We also provide information technology services that support all the functions listed above that comprised approximately 10% of our 2018 policy issuance and renewal expenses. Included in these expenses are allocations of costs for departments that support these policy issuance and renewal functions.
By virtue of its legal structure as a reciprocal insurer, the Exchange does not have any employees or officers. Therefore, it enters into contractual relationships by and through an attorney-in-fact. Indemnity serves as the attorney-in-fact on behalf of the Exchange with respect to its administrative services. The Exchange's insurance subsidiaries also utilize Indemnity for these services in accordance with the service agreements between each of the subsidiaries and Indemnity. Claims handling services include costs incurred in the claims process, including the adjustment, investigation, defense, recording and payment functions. Life insurance management services include costs incurred in the management and processing of life insurance business. Investment management services are related to investment trading activity, accounting and all other functions attributable to the investment of funds. Included in these expenses are allocations of costs for departments that support these administrative functions. The amounts incurred for these services are reimbursed to Indemnity at cost in accordance with the subscriber's agreement and the service agreements. State insurance regulations require that intercompany service agreements and any material amendments be approved in advance by the state insurance department.
Our results of operations are tied to the growth and financial condition of the Exchange as the Exchange is our sole customer, and our earnings are largely generated from management fees based on the direct and assumed premiums written by the Exchange. The Exchange generates revenue by insuring preferred and standard risks, with personal lines comprising 71% of the 2018 direct and assumed written premiums and commercial lines comprising the remaining 29%. The principal personal lines products are private passenger automobile and homeowners. The principal commercial lines products are commercial multi-peril, commercial automobile and workers compensation.
We generate investment income from our fixed maturity, equity security, and limited partnership investment portfolios. Our portfolio is managed with the objective of maximizing after-tax returns on a risk-adjusted basis. We actively evaluate the portfolios for impairments, and record impairment write-downs on investments in instances where the fair value of the investment is substantially below cost, and it is concluded that the decline in fair value is other-than-temporary, which includes consideration for intent to sell.
6460_Fin.pdf 20 3/19/19 10:46 PM

21
Financial Overview
Years ended December 31,(dollars in thousands, except per share data) 2018 % Change 2017 % Change 2016
Operating income $ 344,343 18.6 % $ 290,252 (1.1) % $ 293,517Total investment income 25,796 (9.8) 28,592 2.7 27,839Interest expense, net 2,460 98.8 1,238 NM 101Other income (expense) 3,641 NM (1,911) (64.2) (1,164)
Income before income taxes 371,320 17.6 315,695 (1.4) 320,091Income tax expense 83,096 (30.0) 118,696 8.2 109,725
Net income $ 288,224 46.3 % $ 196,999 (6.4) % $ 210,366Net income per share - diluted $ 5.51 46.4 % $ 3.76 (6.2) % $ 4.01
NM = not meaningful
Operating income increased $54.1 million in 2018 as the growth in total operating revenue outpaced the growth in total operating expenses. Offsetting some of the increase in operating expenses in 2018 were lower agent and employee incentive costs related to less profitable growth. In 2017, operating income decreased $3.3 million primarily due to higher incentive compensation and information technology-related professional fees. Management fee revenue for policy issuance and renewal services increased $56.9 million and $95.2 million in 2018 and 2017, respectively. Management fee revenue allocated to administrative services was $53.6 million in 2018. No management fee revenue was allocated to administrative services in 2017 and 2016. Management fee revenue is based upon the management fee rate we charge, and the direct and assumed premiums written by the Exchange. The management fee rate was 25% for 2018, 2017 and 2016. The direct and assumed premiums written by the Exchange increased 6.9% to $7.1 billion in 2018 and 6.0% to $6.7 billion in 2017. The administrative services reimbursement revenue and corresponding cost of operations increased both total operating revenue and total operating expenses by $580.3 million in 2018, but had no net impact on operating income.
Cost of operations for policy issuance and renewal services increased 4.0% in 2018 primarily due to higher commissions driven by direct written premium growth, and increased 7.6% in 2017 driven by higher commissions, personnel costs and information technology-related professional fees.
Total investment income decreased $2.8 million in 2018 driven by lower earnings generated from limited partnership investments and higher net realized investment losses, partially offset by higher net investment income. Total investment income increased $0.8 million in 2017 driven by higher net investment income and net realized investment gains offset by lower earnings generated from limited partnership investments.
Income tax expense was impacted by the enactment of the Tax Cuts and Jobs Act on December 22, 2017, which reduced the corporate income tax rate from 35% to 21% effective January 1, 2018. Income before income taxes increased $55.6 million in 2018 while income tax expense decreased $35.6 million due to the lower income tax rate. Income tax expense increased $10.1 million in 2017 due to the re-measurement of our deferred tax assets and liabilities at the new corporate income tax rate.
General Conditions and Trends Affecting Our BusinessEconomic conditionsUnfavorable changes in economic conditions, including declining consumer confidence, inflation, high unemployment, and the threat of recession, among others, may lead the Exchange's customers to modify coverage, not renew policies, or even cancel policies, which could adversely affect the premium revenue of the Exchange, and consequently our management fee. Further, unanticipated increased inflation costs including medical cost inflation, construction and auto repair cost inflation, and tort issues may impact the estimated loss reserves and future premium rates. If any of these items impacted the financial condition or continuing operations of the Exchange, it could have an impact on our financial results. Financial market volatilityOur portfolio of fixed maturity, equity security, and limited partnership investments is subject to market volatility especially in periods of instability in the worldwide financial markets. Over time, net investment income could also be impacted by volatility and by the general level of interest rates, which impact reinvested cash flow from the portfolio and business operations. Depending upon market conditions, which are unpredictable and remain uncertain, considerable fluctuation could exist in the fair value of our investment portfolio and reported total investment income, which could have an adverse impact on our financial condition, results of operations, and cash flows.
6460_Fin.pdf 21 3/19/19 10:46 PM

22
CRITICAL ACCOUNTING ESTIMATES The financial statements include amounts based upon estimates and assumptions that have a significant effect on reported amounts of assets and liabilities at the date of the financial statements and the reported amounts of revenues and expenses during the reporting period and related disclosures. We consider an accounting estimate to be critical if 1) it requires assumptions to be made that were uncertain at the time the estimate was made, and 2) different estimates that could have been used, or changes in the estimate that are likely to occur from period-to-period, could have a material impact on our Statements of Operations or Financial Position. The following presents a discussion of those accounting policies surrounding estimates that we believe are the most critical to our reported amounts and require the most subjective and complex judgment. If actual events differ significantly from the underlying assumptions, there could be material adjustments to prior estimates that could potentially adversely affect our results of operations, financial condition, and cash flows. The estimates and the estimating methods used are reviewed continually, and any adjustments considered necessary are reflected in current earnings.
Investment ValuationAvailable-for-sale securitiesWe make estimates concerning the valuation of all investments. Valuation techniques are used to derive the fair value of the available-for-sale securities we hold. Fair value is the price that would be received to sell an asset in an orderly transaction between willing market participants at the measurement date. Fair value measurements are based upon observable and unobservable inputs. Observable inputs reflect market data obtained from independent sources, while unobservable inputs reflect our view of market assumptions in the absence of observable market information. We utilize valuation techniques that maximize the use of observable inputs and minimize the use of unobservable inputs. For purposes of determining whether the market is active or inactive, the classification of a financial instrument is based upon the following definitions:
• An active market is one in which transactions for the assets being valued occur with sufficient frequency and volume to provide reliable pricing information.
• An inactive (illiquid) market is one in which there are few and infrequent transactions, where the prices are not current, price quotations vary substantially, and/or there is little information publicly available for the asset being valued.
We continually assess whether or not an active market exists for all of our investments and as of each reporting date re-evaluate the classification in the fair value hierarchy. All assets carried at fair value are classified and disclosed in one of the following three categories:
• Level 1 – Quoted prices (unadjusted) in active markets for identical assets or liabilities that the reporting entity can access at the measurement date.
• Level 2 – Inputs other than quoted prices included within Level 1 that are observable for the asset or liability, either directly or indirectly.
• Level 3 – Unobservable inputs for the asset or liability. Level 1 includes nonredeemable preferred stock and reflects market data obtained from independent sources, such as prices obtained from an exchange or a nationally recognized pricing service for identical instruments in active markets. Level 2 includes those financial instruments that are valued using industry-standard models that consider various inputs, such as the interest rate and credit spread for the underlying financial instruments. All significant inputs are observable, or derived from observable information in the marketplace, or are supported by observable levels at which transactions are executed in the marketplace. Financial instruments in this category primarily include U.S. government & agency securities, corporate bonds, municipal bonds, structured securities and certain nonredeemable preferred stock. Level 3 securities are valued based upon unobservable inputs, reflecting our estimates of value based upon assumptions used by market participants. Securities are assigned to Level 3 in cases where non-binding broker quotes are significant to the
6460_Fin.pdf 22 3/19/19 10:46 PM

23
valuation and there is a lack of transparency as to whether these quotes are based upon information that is observable in the marketplace. Fair value estimates for securities valued using unobservable inputs require significant judgment due to the illiquid nature of the market for these securities and represent the best estimate of the fair value that would occur in an orderly transaction between willing market participants at the measurement date under current market conditions. Fair value for these securities are generally determined using non-binding broker quotes received from outside broker dealers based upon security type and market conditions. Remaining securities, where a price is not available, are valued using an estimate of fair value based upon indicative market prices that include significant unobservable inputs not based upon, nor corroborated by, market information, including the utilization of discounted cash flow analyses which have been risk-adjusted to take into account illiquidity and other market factors. This category primarily consists of corporate bonds and structured securities priced using non-binding broker quotes. As of each reporting period, financial instruments recorded at fair value are classified based upon the lowest level of input that is significant to the fair value measurement. The presence of at least one unobservable input that has significant impact to the fair value measurement would result in classification as a Level 3 instrument. Our assessment of the significance of a particular input to the fair value measurement requires judgment, and considers factors specific to the asset, such as the relative impact on the fair value as a result of including a particular input and market conditions. We did not make any other significant judgments except as described above. Estimates of fair values for our investment portfolio are obtained primarily from a nationally recognized pricing service. Our Level 1 category includes those securities valued using an exchange traded price provided by the pricing service. The methodologies used by the pricing service that support a Level 2 classification of a financial instrument include multiple verifiable, observable inputs including benchmark yields, reported trades, broker/dealer quotes, issuer spreads, two-sided markets, benchmark securities, bids, offers, and reference data. Pricing service valuations for Level 3 securities are based upon proprietary models and are used when observable inputs are not available in illiquid markets. In limited circumstances we adjust the price received from the pricing service when, in our judgment, a better reflection of fair value is available based upon corroborating information and our knowledge and monitoring of market conditions such as a disparity in price of comparable securities and/or non-binding broker quotes. In other circumstances, certain securities are internally priced because prices are not provided by the pricing service. We perform continuous reviews of the prices obtained from the pricing service. This includes evaluating the methodology and inputs used by the pricing service to ensure we determine the proper classification level of the financial instrument. Price variances, including large periodic changes, are investigated and corroborated by market data. We have reviewed the pricing methodologies of our pricing service as well as other observable inputs, such as market data and transaction volumes, and believe that the prices adequately consider market activity in determining fair value.
When a price from the pricing service is not available, values are determined by obtaining broker/dealer quotes and/or market comparables. When available, we obtain multiple quotes for the same security. The ultimate value for these securities is determined based upon our best estimate of fair value using corroborating market information. Our evaluation includes the consideration of benchmark yields, reported trades, issuer spreads, two-sided markets, benchmark securities, bids, offers, and reference data.
Other-than-temporary impairmentsInvestments are evaluated monthly for other-than-temporary impairment loss. Some factors considered in evaluating whether or not a decline in fair value is other-than-temporary include:
• the extent and duration for which fair value is less than cost;• historical operating performance and financial condition of the issuer;• short- and long-term prospects of the issuer and its industry based upon analysts' recommendations;• specific events that occurred affecting the issuer, including rating downgrades;• intent to sell or more likely than not we would be required to sell (debt securities); and• ability and intent to retain the investment for a period of time sufficient to allow for a recovery in value (equity
securities prior to the adoption of Accounting Standards Update 2016-01, "Financial Instruments-Overall"). For debt securities in which we do not expect full recovery of amortized cost, the security is deemed to be credit-impaired. Credit-related impairments and impairments on securities we intend to sell or more likely than not will be required to sell are recorded in the Statements of Operations. It is our intention to sell all debt securities with credit impairments.
6460_Fin.pdf 23 3/19/19 10:46 PM

24
Limited partnershipsThe primary basis for the valuation of limited partnership interests is financial statements prepared by the general partner. Because of the timing of the preparation and delivery of these financial statements, the use of the most recently available financial statements provided by the general partners generally result in a quarter delay in the inclusion of the limited partnership results in our Statements of Operations. Due to this delay, these financial statements do not reflect the market conditions experienced in the fourth quarter of 2018.
The majority of our limited partnership holdings are considered investment companies where the general partners record assets at fair value. These limited partnerships are recorded using the equity method of accounting. We also own one real estate limited partnership that does not meet the criteria of an investment company. This partnership prepares audited financial statements on a cost basis. We have elected to report this limited partnership under the fair value option, which is based on the net asset value (NAV) from our partner's capital statement reflecting the general partner's estimate of fair value for the fund's underlying assets. Fair value provides consistency in the evaluation and financial reporting for this limited partnership and limited partnerships accounted for under the equity method. We have three types of limited partnership investments: private equity, mezzanine debt, and real estate. Nearly all of the underlying investments in our limited partnerships are valued using a source other than quoted prices in active markets. The fair value amounts for our private equity and mezzanine debt partnerships are based upon the financial statements prepared by the general partners, who use various methods to estimate fair value including the market approach, income approach, and the cost approach. The market approach uses prices and other pertinent information from market-generated transactions involving identical or comparable assets or liabilities. Such valuation techniques often use market multiples derived from a set of comparables. The income approach uses valuation techniques to convert future cash flows or earnings to a single discounted present value amount. The measurement is based upon the value indicated by current market expectations about those future amounts. The cost approach is derived from the amount that is currently required to replace the service capacity of an asset. If information becomes available that would impair the cost of investments owned by the partnerships, then the general partner would adjust the investments to the net realizable value.
The fair value of investments in real estate limited partnerships is determined by the general partner based upon independent appraisals and/or internal valuations. Real estate projects under development are generally valued at cost and impairment tested by the general partner. While we perform various procedures in review of the general partners' valuations, we rely on the general partners' financial statements as the best available information to record our share of the partnership unrealized gains and losses resulting from valuation changes. Due to the limited market for these investments, there is higher potential for variability. We survey each of the general partners quarterly about expected significant changes (plus or minus 10% compared to previous quarter) to valuations prior to the release of the fund's quarterly and annual financial statements. Based upon that information from the general partner, we consider whether additional disclosure is warranted. We analyze the limited partnership measured at fair value based upon NAV to determine if the most recently available NAV reflects fair value at the balance sheet date, with an adjustment being made where appropriate (change of plus or minus 5% compared to most recent NAV).
We have made no new limited partnership commitments since 2006, and the balance of limited partnership investments is expected to decline over time as additional distributions are received.
Retirement Benefit Plans for EmployeesOur pension plans consist of a noncontributory defined benefit pension plan covering substantially all employees and an unfunded supplemental employee retirement plan ("SERP") for certain members of executive and senior management. Although we are the sponsor of these postretirement plans and record the funded status of these plans, the Exchange and its subsidiaries reimburse us for approximately 59% of the annual benefit expense of these plans, which includes pension benefits for employees performing administrative services and the Exchange's allocated share of costs for employees in departments that support the administrative functions.
Our pension obligation is developed from actuarial estimates. Several statistical and other factors, which attempt to anticipate future events, are used in calculating the expense and liability related to the plans. Key factors include assumptions about the discount rates and expected rates of return on plan assets. We review these assumptions annually and modify them considering historical experience, current market conditions, including changes in investment returns and interest rates, and expected future trends.
Accumulated and projected benefit obligations are expressed as the present value of future cash payments. We discount those cash payments based upon a yield curve developed from corporate bond yield information with maturities that correspond to
6460_Fin.pdf 24 3/19/19 10:46 PM

25
the payment of benefits. Lower discount rates increase present values and subsequent year pension expense, while higher discount rates decrease present values and subsequent year pension expense. The construction of the yield curve is based upon yields of corporate bonds rated AA or equivalent quality. Target yields are developed from bonds at various maturity points and a curve is fitted to those targets. Spot rates (zero coupon bond yields) are developed from the yield curve and used to discount benefit payment amounts associated with each future year. The present value of plan benefits is calculated by applying the spot/discount rates to projected benefit cash flows. A single discount rate is then developed to produce the same present value. The cash flows from the yield curve were matched against our projected benefit payments in the pension plan, which have a duration of about 18 years. This yield curve supported the selection of a 4.47% discount rate for the projected benefit obligation at December 31, 2018 and for the 2019 pension expense. The same methodology was used to develop the 3.73% and 4.24% discount rates used to determine the projected benefit obligation for 2017 and 2016, respectively, and the pension expense for 2018 and 2017, respectively. A 25 basis point decrease in the discount rate assumption, with other assumptions held constant, would increase pension cost in the following year by $4.2 million, of which our share would be approximately $1.7 million, and would increase the pension benefit obligation by $39.0 million. Unrecognized actuarial gains and losses arise from several factors, including experience and assumption changes in the obligations and from the difference between expected returns and actual returns on plan assets. These unrecognized gains and losses are recorded in the pension plan obligation and accumulated other comprehensive income (loss) on the Statements of Financial Position. These amounts are systematically recognized to net periodic pension expense in future periods, with gains decreasing and losses increasing future pension expense. If actuarial net gains or losses exceed 5% of the greater of the projected benefit obligation and the market-related value of plan assets, the excess is recognized through the net periodic pension expense equally over the estimated service period of the employee group, which is currently 14 years.
The expected long-term rate of return for the pension plan represents the average rate of return to be earned on plan assets over the period the benefits included in the benefit obligation are to be paid. To determine the expected long-term rate of return assumption, we utilized models based upon rigorous historical analysis and forward-looking views of the financial markets based upon key factors such as historical returns for the asset class' applicable indices, the correlations of the asset classes under various market conditions and consensus views on future real economic growth and inflation. The expected future return for each asset class is then combined by considering correlations between asset classes and the volatilities of each asset class to produce a reasonable range of asset return results within which our expected long-term rate of return assumption falls. The expected long-term rate of return is less susceptible to annual revisions, as there are typically no significant changes in the asset mix. In 2018, we changed our target asset allocation to reduce investment risk by shifting portfolio assets from equity securities to debt securities. Based on the current asset allocation and a review of the key factors and expectations of future asset performance, we reduced the expected return on asset assumption from 6.75% to 6.00% for 2019. A change of 25 basis points in the expected long-term rate of return assumption, with other assumptions held constant, would have an estimated $2.0 million impact on net pension benefit cost in the following year, of which our share would be approximately $0.8 million.
We use a four year averaging method to determine the market-related value of plan assets, which is used to determine the expected return component of pension expense. Under this methodology, asset gains or losses that result from returns that differ from our long-term rate of return assumption are recognized in the market-related value of assets on a level basis over a four year period. The market-related asset experience during 2018 that related to the actual investment return being different from that assumed during the prior year was a loss of $89.6 million. Recognition of this loss will be deferred and recognized over a four year period, consistent with the market-related asset value methodology. Once factored into the market-related asset value, these experience gains and losses will be amortized over a period of 14 years, which is the remaining service period of the employee group. Estimates of fair values of the pension plan assets are obtained primarily from the trustee and custodian of our pension plan. Our Level 1 category includes a money market fund that is a mutual fund for which the fair value is determined using an exchange traded price provided by the trustee and custodian. Our Level 2 category includes commingled pools. Estimates of fair values for securities held by our commingled pools are obtained primarily from the trustee and custodian. The methodologies used by the trustee and custodian that support a financial instrument Level 2 classification include multiple verifiable, observable inputs including benchmark yields, reported trades, broker/dealer quotes, issuers spreads, two-sided markets, benchmark securities, bids, offers, and reference data. There were no Level 3 investments in 2018 or 2017.
We expect our net pension benefit costs to decrease from $36.3 million in 2018 to $30.7 million in 2019 primarily due to the higher discount rate, partially offset by less than expected asset returns during 2018. Our share of the net pension benefit costs after reimbursements was $14.9 million in 2018. We expect our share of the net pension benefit costs to be approximately $12.6 million in 2019.
6460_Fin.pdf 25 3/19/19 10:46 PM

26
The actuarial assumptions we used in determining our pension obligation may differ materially from actual results due to changing market and economic conditions, higher or lower withdrawal rates, or longer or shorter life spans of participants. While we believe that the assumptions used are appropriate, differences in actual experience or changes in assumptions may materially affect our financial position, results of operations, or cash flows. See Part II, Item 8. "Financial Statements and Supplementary Data - Note 9, Postretirement Benefits, of Notes to Financial Statements" contained within this report for additional details on the pension plans.
6460_Fin.pdf 26 3/19/19 10:46 PM

27
RESULTS OF OPERATIONS Management fee revenueOn January 1, 2018, we adopted ASC 606, "Revenue from Contracts with Customers". Upon adoption, we determined we have two performance obligations in the subscriber’s agreement, providing policy issuance and renewal services and acting as attorney-in-fact for the Exchange, as well as the service provider for its insurance subsidiaries, with respect to all administrative services. We earn management fees for acting as the attorney-in-fact for the subscribers at the Exchange in these two capacities. Upon adoption of ASC 606, we are required to allocate our revenues between our performance obligations. Prior to the adoption of ASC 606, the entire management fee was allocated to the policy issuance and renewal services. Management fee rateThe management fee is calculated by multiplying all direct and assumed premiums written by the Exchange by the management fee rate, which is determined by our Board of Directors at least annually. The management fee rate was set at 25%, the maximum rate, for 2018, 2017 and 2016. Changes in the management fee rate can affect our revenue and net income significantly.
Change in allowance for management fee returned on cancelled policiesManagement fees are returned to the Exchange when subscribers/policyholders cancel their insurance coverage mid-term and unearned premiums are refunded to them. We maintain an allowance for management fees returned on mid-year policy cancellations that recognizes the management fee anticipated to be returned to the Exchange based on historical mid-term cancellation experience. Our cash flows are unaffected by the recording of this allowance.
The following table presents the allocation and disaggregation of revenue for our two performance obligations:
Years ended December 31,(dollars in thousands) 2018 % Change 2017 % Change 2016
Policy issuance and renewal servicesDirect and assumed premiums written by the
Exchange $ 7,112,846 6.9 % $ 6,656,501 6.0 % $ 6,278,126Management fee rate 24.2% 25.0% 25.0%Management fee revenue 1,721,309 3.4 1,664,125 6.0 1,569,531Change in allowance for management fee returned
on cancelled policies (1) (1,742) NM (1,500) NM (2,100)Management fee revenue - policy issuance and
renewal services, net (2) $ 1,719,567 3.4 % $ 1,662,625 6.1 % $ 1,567,431
Administrative servicesDirect and assumed premiums written by the
Exchange $ 7,112,846 N/A % $ — N/A % $ —Management fee rate 0.8% — —Management fee revenue 56,903 N/A — N/A —Change in contract liability (3) (3,209) N/A N/A N/A N/AChange in allowance for management fee returned
on cancelled policies (1) (62) N/A N/A N/A N/AManagement fee revenue - administrative services,
net 53,632 N/A — N/A —Administrative services reimbursement revenue 580,336 N/A — N/A —Total revenue from administrative services $ 633,968 N/A % $ — N/A % $ —
NM = not meaningfulN/A = not applicable
(1) Management fees are returned to the Exchange when policies are cancelled mid-term and unearned premiums are refunded. We record an estimated allowance for management fees returned on mid-term policy cancellations. This estimated allowance has been allocated between the two performance obligations consistent with the revenue allocation proportion.
(2) The allocation of management fee revenue between the two performance obligations beginning January 1, 2018 caused the growth in management fee revenue - policy issuance and renewal services to not correspond directly with the growth in direct and assumed premiums written by the Exchange in 2018, compared to 2017.
(3) With the adoption of ASC 606 effective January 1, 2018, management fee revenue - administrative services is recognized over time as the services are performed. See Part II, Item 8. "Financial Statements and Supplementary Data - Note 2, Significant Accounting Policies and Note 3, Revenue, of Notes to Financial Statements" contained within this report.
6460_Fin.pdf 27 3/19/19 10:46 PM

28
Direct and assumed premiums written by the ExchangeDirect and assumed premiums include premiums written directly by the Exchange and premiums assumed from its wholly owned property and casualty subsidiaries. Direct and assumed premiums written by the Exchange increased 6.9% to $7.1 billion in 2018, from $6.7 billion in 2017, driven by increases in both policies in force and average premium per policy. Year-over-year policies in force for all lines of business increased 3.3% in 2018 as the result of continuing strong policyholder retention, compared to 3.5% in 2017. The year-over-year average premium per policy for all lines of business increased 3.5% at December 31, 2018, compared to 2.4% at December 31, 2017.
Premiums generated from new business increased 4.7% to $886 million in 2018. While 2018 new business policies written decreased 1.4%, the year-over-year average premium per policy on new business increased 6.2% at December 31, 2018, driving this new business premium increase. Premiums generated from new business increased 12.3% to $846 million in 2017. Underlying this trend in new business premium was a 7.6% increase in new business policies written in 2017 and a year-over-year average premium per policy on new business increase of 4.4% at December 31, 2017.
Premiums generated from renewal business increased 7.2% to $6.2 billion in 2018, compared to 5.2%, or $5.8 billion, in 2017. Underlying the trend in renewal business premiums were increases in average premium per policy and steady policy retention ratios. The renewal business year-over-year average premium per policy increased 3.1% at December 31, 2018, compared to 2.2% at December 31, 2017.
The Exchange implemented rate increases in 2018, 2017, and 2016 in order to meet loss cost expectations. As the Exchange writes policies with annual terms only, rate actions take 12 months to be fully recognized in written premium and 24 months to be fully recognized in earned premiums. Since rate changes are realized at renewal, it takes 12 months to implement a rate change to all policyholders and another 12 months to earn the increased or decreased premiums in full. As a result, certain rate actions approved in 2017 were reflected in 2018, and recent rate actions in 2018 will be reflected in 2019. The Exchange continuously evaluates pricing and product offerings to meet consumer demands. Personal lines – Total personal lines premiums written increased 6.6% to $5.0 billion in 2018, from $4.7 billion in 2017, driven by an increase of 3.4% in total personal lines policies in force and an increase of 3.3% in the total personal lines year-over-year average premium per policy. Commercial lines – Total commercial lines premiums written increased 7.5% to $2.1 billion in 2018, from $1.9 billion in 2017, driven by a 2.7% increase in total commercial lines policies in force and a 4.6% increase in the total commercial lines year-over-year average premium per policy.
Future trends-premium revenue – The Exchange plans to continue its efforts to grow premiums and improve its competitive position in the marketplace. Expanding the size of its agency force through a careful agency selection process and increased market penetration in our existing operating territories is expected to contribute to future growth as existing and new agents build their books of business. Changes in premium levels attributable to the growth in policies in force directly affects the profitability of the Exchange and has a direct bearing on our management fee. Our continued focus on underwriting discipline and the maturing of pricing sophistication models has contributed to the Exchange's steady policy retention ratios and increased average premium per policy. The continued growth of its policy base is dependent upon the Exchange's ability to retain existing, and attract new, subscribers/policyholders. A lack of new policy growth or the inability to retain existing customers could have an adverse effect on the Exchange's premium level growth, and consequently our management fee. Changes in premium levels attributable to rate changes also directly affect the profitability of the Exchange and have a direct bearing on our management fee. Pricing actions contemplated or taken by the Exchange are subject to various regulatory requirements of the states in which it operates. The pricing actions already implemented, or to be implemented, have an effect on the market competitiveness of the Exchange's insurance products. Such pricing actions, and those of the Exchange's competitors, could affect the ability of the Exchange's agents to retain and attract new business. We expect the Exchange's pricing actions to result in a net increase in direct written premium in 2019; however, exposure reductions and/or changes in mix of business as a result of economic conditions could impact the average premium written and assumed by the Exchange, as customers may reduce coverages.
6460_Fin.pdf 28 3/19/19 10:46 PM
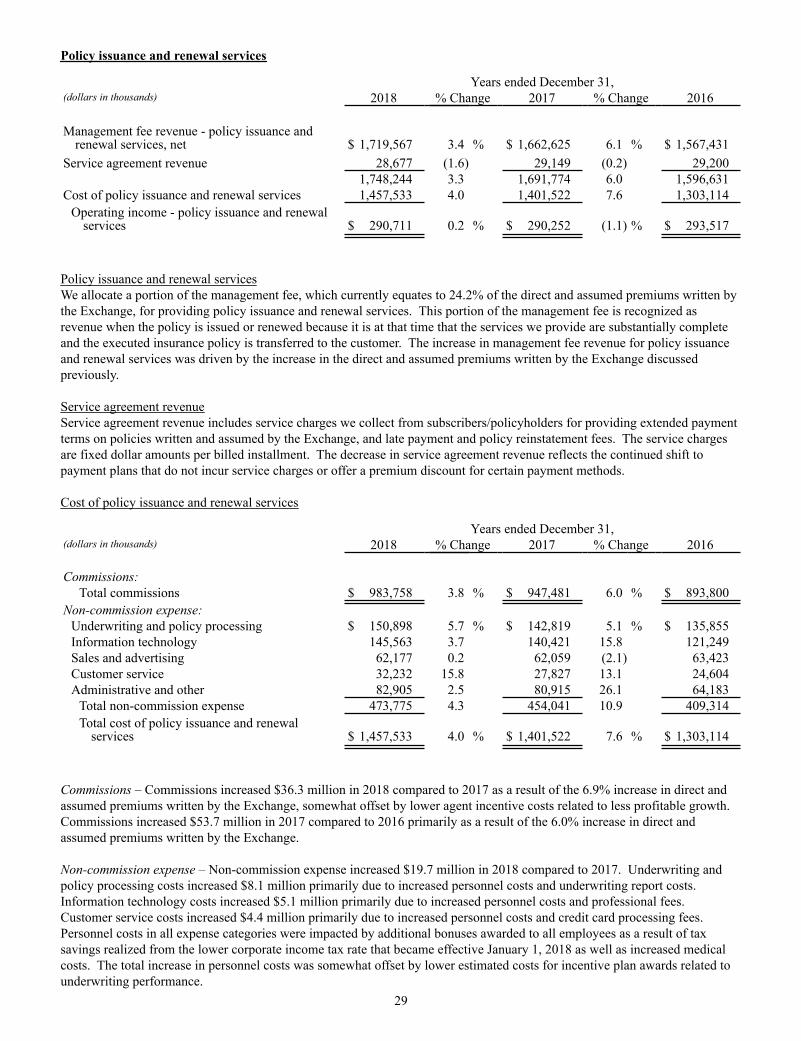
29
Policy issuance and renewal services
Years ended December 31,(dollars in thousands) 2018 % Change 2017 % Change 2016
Management fee revenue - policy issuance andrenewal services, net $ 1,719,567 3.4 % $ 1,662,625 6.1 % $ 1,567,431
Service agreement revenue 28,677 (1.6) 29,149 (0.2) 29,2001,748,244 3.3 1,691,774 6.0 1,596,631
Cost of policy issuance and renewal services 1,457,533 4.0 1,401,522 7.6 1,303,114Operating income - policy issuance and renewal
services $ 290,711 0.2 % $ 290,252 (1.1) % $ 293,517
Policy issuance and renewal servicesWe allocate a portion of the management fee, which currently equates to 24.2% of the direct and assumed premiums written by the Exchange, for providing policy issuance and renewal services. This portion of the management fee is recognized as revenue when the policy is issued or renewed because it is at that time that the services we provide are substantially complete and the executed insurance policy is transferred to the customer. The increase in management fee revenue for policy issuance and renewal services was driven by the increase in the direct and assumed premiums written by the Exchange discussed previously.
Service agreement revenueService agreement revenue includes service charges we collect from subscribers/policyholders for providing extended payment terms on policies written and assumed by the Exchange, and late payment and policy reinstatement fees. The service charges are fixed dollar amounts per billed installment. The decrease in service agreement revenue reflects the continued shift to payment plans that do not incur service charges or offer a premium discount for certain payment methods.
Cost of policy issuance and renewal services
Years ended December 31,(dollars in thousands) 2018 % Change 2017 % Change 2016
Commissions:Total commissions $ 983,758 3.8 % $ 947,481 6.0 % $ 893,800
Non-commission expense:Underwriting and policy processing $ 150,898 5.7 % $ 142,819 5.1 % $ 135,855Information technology 145,563 3.7 140,421 15.8 121,249Sales and advertising 62,177 0.2 62,059 (2.1) 63,423Customer service 32,232 15.8 27,827 13.1 24,604Administrative and other 82,905 2.5 80,915 26.1 64,183
Total non-commission expense 473,775 4.3 454,041 10.9 409,314Total cost of policy issuance and renewal
services $ 1,457,533 4.0 % $ 1,401,522 7.6 % $ 1,303,114
Commissions – Commissions increased $36.3 million in 2018 compared to 2017 as a result of the 6.9% increase in direct and assumed premiums written by the Exchange, somewhat offset by lower agent incentive costs related to less profitable growth. Commissions increased $53.7 million in 2017 compared to 2016 primarily as a result of the 6.0% increase in direct and assumed premiums written by the Exchange.
Non-commission expense – Non-commission expense increased $19.7 million in 2018 compared to 2017. Underwriting and policy processing costs increased $8.1 million primarily due to increased personnel costs and underwriting report costs. Information technology costs increased $5.1 million primarily due to increased personnel costs and professional fees. Customer service costs increased $4.4 million primarily due to increased personnel costs and credit card processing fees. Personnel costs in all expense categories were impacted by additional bonuses awarded to all employees as a result of tax savings realized from the lower corporate income tax rate that became effective January 1, 2018 as well as increased medical costs. The total increase in personnel costs was somewhat offset by lower estimated costs for incentive plan awards related to underwriting performance.
6460_Fin.pdf 29 3/19/19 10:46 PM

30
In 2017, non-commission expense increased $44.7 million compared to 2016. Underwriting and policy processing costs increased $7.0 million primarily due to increased personnel costs and underwriting report costs. Information technology costs increased $19.2 million primarily due to increased professional fees, hardware and software costs and personnel costs. Customer service costs increased $3.2 million primarily due to increased personnel costs and credit card processing fees. Administrative and other costs increased $16.7 million primarily driven by increased personnel costs, including higher incentive plan costs. The incentive plan cost increase was driven by an increase in long-term incentive plan cost due to the increase in the company stock price during 2017 coupled with lower incentive plan cost in the prior year due to incentive compensation that was forfeited by senior executives who separated from service during 2016. Additionally, the employee incentive plan program was expanded to additional employee groups beginning in 2017. Personnel costs in all expense categories were impacted by increased medical and pension costs.
Administrative services
Years ended December 31,(dollars in thousands) 2018 % Change 2017 % Change 2016
Management fee revenue - administrative services,net $ 53,632 N/A % $ — N/A % $ —
Administrative services reimbursement revenue 580,336 N/A — N/A —Total revenue allocated to administrative services 633,968 N/A — N/A —Administrative services expenses
Claims handling services 505,843 N/A — N/A —Investment management services 32,065 N/A — N/A —Life management services 42,428 N/A — N/A —
Operating income - administrative services $ 53,632 N/A % $ — N/A % $ —
N/A = not applicable
Administrative servicesWe allocate a portion of the management fee, which currently equates to 0.8% of the direct and assumed premiums written by the Exchange, to the administrative services. This portion of the management fee is recognized as revenue over a four-year period representing the time over which the services are provided. We also report reimbursed costs as revenues, which are recognized monthly as services are provided. Beginning with the adoption of ASC 606 on January 1, 2018, the administrative services expenses we incur and the related reimbursements we receive are recorded gross in the Statement of Operations.
Cost of administrative servicesBy virtue of its legal structure as a reciprocal insurer, the Exchange does not have any employees or officers. Therefore, it enters into contractual relationships by and through an attorney-in-fact. Indemnity serves as the attorney-in-fact on behalf of the Exchange with respect to its administrative services in accordance with the subscriber's agreement. The Exchange's insurance subsidiaries also utilize Indemnity for these services in accordance with the service agreements between each of the subsidiaries and Indemnity. The amounts incurred for these services are reimbursed to Indemnity at cost in accordance with the subscriber's agreement and the service agreements. We record these reimbursements due from the Exchange and its insurance subsidiaries as a receivable.
6460_Fin.pdf 30 3/19/19 10:46 PM

31
Total investment incomeA summary of the results of our investment operations is as follows for the years ended December 31:
(dollars in thousands) 2018 % Change 2017 % Change 2016Net investment income $ 30,209 22.6 % $ 24,639 19.9 % $ 20,558Net realized investment (losses) gains (2,010) NM 1,334 98.6 672Net impairment losses recognized in earnings (1,581) NM (182) 56.4 (416)Equity in (losses) earnings of limited partnerships (822) NM 2,801 (60.1) 7,025
Total investment income $ 25,796 (9.8) % $ 28,592 2.7 % $ 27,839
NM = not meaningful
Net investment incomeNet investment income primarily includes interest and dividends on our fixed maturity and equity security portfolios, net of investment expenses.
Net investment income increased by $5.6 million in 2018, compared to 2017, primarily due to an increase in cash and cash equivalent income due an increase in rates, and an increase in bond income due to higher investment yields. Net investment income increased by $4.1 million in 2017, compared to 2016, primarily due to higher invested balances and investment yields from fixed maturity investments.
Net realized investment (losses) gainsA breakdown of our net realized investment (losses) gains is as follows for the years ended December 31:
(in thousands) 2018 2017 2016Securities sold:
Fixed maturities $ (1,297) $ 1,385 $ (2)Equity securities (111) (145) (33)Common stock trading securities — 0 707
Equity securities change in fair value (1) (708) 0 0Other 106 94 0
Net realized investment (losses) gains (2) $ (2,010) $ 1,334 $ 672
(1) The fair value of our equity portfolio is based upon exchange traded prices provided by a nationally recognized pricing service.(2) See Part II, Item 8. "Financial Statements and Supplementary Data - Note 6, Investments, of Notes to Financial Statements" contained within this
report for additional disclosures regarding net realized investment (losses) gains. Net realized losses were $2.0 million in 2018, compared to gains of $1.3 million in 2017 and $0.7 million in 2016. Net realized losses in 2018 were due to losses from sales of fixed maturity and equity securities and decreases in fair value of equity securities. Net realized gains in 2017 were primarily due to gains from the sales of fixed maturity securities, partially offset by losses from sales of equity securities, while gains in 2016 were primarily attributable to gains from sales of common stock trading securities.
Net impairment losses recognized in earningsNet impairment losses recognized in earnings were $1.6 million in 2018, compared to $0.2 million in 2017, and $0.4 million in 2016. Net impairment losses recognized in earnings in all three years included securities in an unrealized loss position that we intended to sell prior to expected recovery of our amortized cost basis as well as securities in an unrealized loss position where we determined the loss was other-than-temporary based on credit factors.
Equity in (losses) earnings of limited partnershipsThe components of equity in (losses) earnings of limited partnerships are as follows for the years ended December 31:
(in thousands) 2018 2017 2016Private equity $ 297 $ 492 $ (2,756)Mezzanine debt (428) 345 51Real estate (691) 1,964 9,730
Equity in (losses) earnings of limited partnerships $ (822) $ 2,801 $ 7,025
6460_Fin.pdf 31 3/19/19 10:46 PM

32
Limited partnership earnings pertain to investments in U.S. and foreign private equity, mezzanine debt, and real estate partnerships. Valuation adjustments are recorded to reflect the changes in fair value of the underlying investments held by the limited partnerships. These adjustments are recorded as a component of equity in (losses) earnings of limited partnerships in the Statements of Operations. Limited partnership earnings tend to be cyclical based upon market conditions, the age of the partnership, and the nature of the investments. Generally, limited partnership earnings are recorded on a quarter lag from financial statements we receive from our general partners. As a consequence, earnings from limited partnerships reported at December 31, 2018 reflect investment valuation changes resulting from the financial markets and the economy for the twelve month period ending September 30, 2018.
Equity in earnings of limited partnerships decreased by $3.6 million in 2018, compared to 2017, and decreased by $4.2 million in 2017, compared to 2016. The decrease in earnings in 2018 was the result of lower earnings in all sectors. The decrease in earnings in 2017 was primarily the result of lower earnings in real estate investments that were partially offset by higher earnings from private equity investments.
Financial Condition of Erie Insurance ExchangeServing in the capacity of attorney-in-fact for the Exchange, we are dependent on the growth and financial condition of the Exchange, who is our sole customer. The strength of the Exchange and its wholly owned subsidiaries is rated annually by A.M. Best Company. Higher ratings of insurance companies generally indicate financial stability and a strong ability to pay claims. The ratings are generally based upon factors relevant to policyholders and are not directed toward return to investors. The Exchange and each of its property and casualty subsidiaries are rated A+ "Superior". On June 18, 2018, the outlook for the financial strength rating was affirmed as stable. According to A.M. Best, this second highest financial strength rating category is assigned to those companies that, in A.M. Best's opinion, have achieved superior overall performance when compared to the standards established by A.M. Best and have a superior ability to meet obligations to policyholders over the long term. Only approximately 12% of insurance groups are rated A+ or higher, and the Exchange is included in that group.
The financial statements of the Exchange are prepared in accordance with statutory accounting principles prescribed by the Commonwealth of Pennsylvania. Financial statements prepared under statutory accounting principles focus on the solvency of the insurer and generally provide a more conservative approach than under U.S. generally accepted accounting principles. Statutory direct written premiums of the Exchange and its wholly owned property and casualty subsidiaries grew 6.9% to $7.1 billion in 2018 from $6.7 billion in 2017. These premiums, along with investment income, are the major sources of cash that support the operations of the Exchange. Policyholders' surplus, determined under statutory accounting principles, was $8.6 billion and $8.8 billion at December 31, 2018 and 2017, respectively. The Exchange and its wholly owned property and casualty subsidiaries' year-over-year policy retention ratio continues to be high at 90.1% at December 31, 2018 and 89.6% at December 31, 2017.
FINANCIAL CONDITION
InvestmentsOur investment portfolio is managed with the objective of maximizing after-tax returns on a risk-adjusted basis. Distribution of investments
Carrying value at December 31,(dollars in thousands)
2018% tototal 2017
% tototal
IndemnityFixed maturities $ 748,523 88 % $ 745,961 90 %Equity securities:
Preferred stock 11,853 1 12,752 2Limited partnerships:
Private equity 28,271 3 31,663 4Mezzanine debt 1,152 0 3,516 0Real estate 5,398 1 9,943 1
Other investments (1) 58,394 7 21,985 3 Total investments $ 853,591 100 % $ 825,820 100 %(1) Other investments primarily include agent loans. Agent loans are included with other assets in the Statements of Financial Position.
6460_Fin.pdf 32 3/19/19 10:46 PM

33
We continually review our investment portfolio to evaluate positions that might incur other-than-temporary declines in value. We record impairment write-downs on investments in instances where the fair value of the investment is substantially below cost, and we conclude that the decline in fair value is other-than-temporary, which includes consideration for intent to sell. For all investment holdings, general economic conditions and/or conditions specifically affecting the underlying issuer or its industry, including downgrades by the major rating agencies, are considered in evaluating impairment in value. In addition to specific factors, other factors considered in our review of investment valuation are the length of time the fair value is below cost and the amount the fair value is below cost. We individually analyze all positions with emphasis on those that have, in our opinion, declined significantly below cost. In compliance with impairment guidance for debt securities, we perform further analysis to determine if a credit-related impairment has occurred. Some of the factors considered in determining whether a debt security is credit impaired include potential for the default of interest and/or principal, level of subordination, collateral of the issue, compliance with financial covenants, credit ratings and industry conditions. We have the intent to sell all credit-impaired debt securities; therefore, the entire amount of the impairment charges are included in earnings and no impairments are recorded in other comprehensive income. We believe our investment valuation philosophy and accounting practices result in appropriate and timely measurement of value and recognition of impairment.
Fixed maturitiesUnder our investment strategy, we maintain a fixed maturity portfolio that is of high quality and well diversified within each market sector. This investment strategy also achieves a balanced maturity schedule. Our fixed maturity portfolio is managed with the goal of achieving reasonable returns while limiting exposure to risk. Our municipal bond portfolio currently accounts for $159.0 million, or 21%, of the total fixed maturity portfolio at December 31, 2018. As part of a rebalancing of our portfolio, we began selling off our municipal bond portfolio and reinvesting the proceeds in short-term U.S. Treasury securities in the fourth quarter of 2018. We intend to liquidate the remaining municipal bond portfolio during the first half of 2019. Fixed maturities classified as available-for-sale are carried at fair value with unrealized gains and losses, net of deferred taxes, included in shareholders' equity. Net unrealized losses on fixed maturities, net of deferred taxes, amounted to $7.0 million at December 31, 2018, compared to net unrealized gains of $3.3 million at December 31, 2017.
The following table presents a breakdown of the fair value of our fixed maturity portfolio by sector and rating: (1)
At December 31, 2018(in thousands) Non-
investment FairIndustry Sector AAA AA A BBB grade value
Basic materials $ 0 $ 0 $ 0 $ 0 $ 15,330 $ 15,330Communications 0 1,976 0 3,489 22,491 27,956Consumer 0 0 3,490 22,345 43,952 69,787Diversified 0 0 0 0 1,106 1,106Energy 0 998 0 3,619 15,672 20,289Financial 0 3,981 16,355 28,286 15,903 64,525Government-municipal 59,707 88,286 11,030 0 0 159,023Healthcare 0 0 0 0 524 524Industrial 0 0 2,481 4,019 21,634 28,134Structured securities (2) 93,369 26,835 7,940 2,997 0 131,141Technology 0 0 0 5,644 12,632 18,276U.S. Treasury 171,792 36,620 0 0 0 208,412Utilities 0 0 0 1,978 2,042 4,020
Total $ 324,868 $ 158,696 $ 41,296 $ 72,377 $ 151,286 $ 748,523
(1) Ratings are supplied by S&P, Moody’s, and Fitch. The table is based upon the lowest rating for each security.(2) Structured securities include residential mortgage-backed securities, commercial mortgage-backed securities, collateralized debt obligations, and
asset-backed securities.
6460_Fin.pdf 33 3/19/19 10:46 PM

34
Equity SecuritiesOur equity securities consist of nonredeemable preferred stock and are carried at fair value in the Statements of Financial Position with all changes in unrealized gains and losses reflected in the Statements of Operations, effective January 1, 2018 with the adoption of Accounting Standards Update 2016-01. Previously, changes in unrealized gains and losses were reflected in other comprehensive income, net of deferred taxes.
The following table presents an analysis of the fair value of our preferred stock securities by industry sector at December 31:
(in thousands)
2018 2017Financial $ 11,853 $ 11,659Utilities 0 1,093
Total $ 11,853 $ 12,752
Limited partnershipsIn 2018, investments in limited partnerships decreased from the investment levels at December 31, 2017. Changes in partnership values are a function of contributions and distributions, adjusted for market value changes in the underlying investments. The decrease in limited partnership investments was primarily due to net distributions received from the partnerships. We have made no new limited partnership commitments since 2006, and the balance of limited partnership investments is expected to decline over time as additional distributions are received. The results from our limited partnerships are based upon financial statements received from our general partners, which are generally received on a quarter lag. As a result, the market values and earnings recorded at December 31, 2018 reflect the partnership activity experienced during the twelve month period ending September 30, 2018.
Shareholders' EquityPostretirement benefit plansThe funded status of our postretirement benefit plans is recognized in the Statements of Financial Position, with a corresponding adjustment to accumulated other comprehensive income, net of tax. At December 31, 2018, shareholders' equity amounts related to these postretirement plans increased by $35.7 million, net of tax at the 21% corporate income tax rate that became effective January 1, 2018, of which $10.9 million represents amortization of the prior service cost and net actuarial loss and $24.8 million represents the current period actuarial gain. The 2018 actuarial gain was primarily due to the change in the discount rate assumption used to measure the future benefit obligations to 4.47% in 2018, from 3.73% in 2017. At December 31, 2017, shareholders' equity amounts related to these postretirement plans decreased by $8.1 million, net of tax at the 21% corporate income tax rate that became effective January 1, 2018, of which $7.7 million represents amortization of the prior service cost and net actuarial loss and $15.8 million represents the current period actuarial loss. The 2017 actuarial loss was primarily due to the change in the discount rate assumption used to measure the future benefit obligations to 3.73% in 2017, from 4.24% in 2016, somewhat offset by the actual investment returns outperforming the assumed rate of return. Although we are the sponsor of these postretirement plans and record the funded status of these plans, the Exchange and its subsidiaries reimburse us for approximately 59% of the annual benefit expense of these plans, which includes pension benefits for employees performing administrative services and their allocated share of costs for employees in departments that support the administrative functions.
Home Office ExpansionIn 2016, we entered into a credit agreement for a $100 million senior secured draw term loan credit facility ("Credit Facility") for the acquisition of real property and construction of an office building that will serve as part of our principal headquarters. As of December 31, 2018, we have drawn $100 million against the Credit Facility. During the draw period from December 1, 2016 through December 31, 2018, we made monthly interest payments under the Credit Facility. Upon expiration of the draw period, the Credit Facility converted to a fully-amortized term loan with monthly payments of principal and interest over a period of 28 years, which commenced on January 1, 2019. Borrowings under the Credit Facility will bear interest at a fixed rate of 4.35%. In addition, we were required to pay a quarterly commitment fee of 0.08% on the unused portion of the Credit Facility during the draw period. We capitalize applicable interest charges incurred during the construction period of long-term building projects as part of the historical cost of the asset.
6460_Fin.pdf 34 3/19/19 10:46 PM

35
LIQUIDITY AND CAPITAL RESOURCES Sources and Uses of CashLiquidity is a measure of a company's ability to generate sufficient cash flows to meet the short- and long-term cash requirements of its business operations and growth needs. Our liquidity requirements have been met primarily by funds generated from management fee revenue and income from investments. Cash provided from these sources is used primarily to fund the costs of our management operations including commissions, salaries and wages, pension plans, share repurchases, dividends to shareholders, and the purchase and development of information technology. We expect that our operating cash needs will be met by funds generated from operations. Volatility in the financial markets presents challenges to us as we do occasionally access our investment portfolio as a source of cash. Some of our fixed income investments, despite being publicly traded, are illiquid. Volatility in these markets could impair our ability to sell certain of our fixed income securities or cause such securities to sell at deep discounts. Additionally, our limited partnership investments are significantly less liquid. We believe we have sufficient liquidity to meet our needs from other sources even if market volatility persists throughout 2019.
Cash flow activitiesThe following table provides condensed cash flow information for the years ended December 31:
(in thousands) 2018 2017 2016Net cash provided by operating activities $ 263,585 $ 197,126 $ 254,336Net cash used in investing activities (81,398) (74,663) (136,944)Net cash used in financing activities (131,491) (95,814) (111,209)
Net increase in cash $ 50,696 $ 26,649 $ 6,183 Net cash provided by operating activities was $263.6 million in 2018, compared to $197.1 million in 2017 and $254.3 million in 2016. Increased cash provided by operating activities in 2018 was primarily due to an increase in management fee revenue received driven by growth in direct and assumed premiums written by the Exchange along with a decrease in income taxes paid due to the lower corporate income tax rate effective January 1, 2018, compared to 2017. Somewhat offsetting the increase in cash from operating activities was higher commissions and bonuses paid to agents and pension contributions, compared to 2017. Cash paid for agent commissions and bonuses increased to $988.1 million in 2018, compared to $923.4 million in 2017, due to higher scheduled commissions driven by premium growth and higher bonus award payments resulting from profitable underwriting results. Our Board approved an $80 million accelerated pension contribution, which was paid in the first half of 2018. We contributed $58.9 million to our pension plan in 2017. We are reimbursed approximately 59% of the net periodic benefit cost of the pension plans from the Exchange and its subsidiaries, which includes pension benefits for employees performing administrative services and their allocated share of costs for employees in departments that support the administrative functions. In 2017, decreased cash from operating activities was primarily due to higher commissions and bonuses paid to agents, pension contributions, and general operating expenses paid, compared to 2016. Somewhat offsetting the decrease in cash provided in 2017 was an increase in management fee revenue received, reflecting the increase in direct and assumed premiums written by the Exchange.
At December 31, 2018, we recorded a net deferred tax asset of $24.1 million, compared to $19.4 million at December 31, 2017. There was no deferred tax valuation allowance recorded at December 31, 2018.
Net cash used in investing activities totaled $81.4 million in 2018, compared to $74.7 million in 2017 and $136.9 million in 2016. The increase in cash used in 2018, compared to 2017, was driven by increased agent loans and purchases of fixed assets primarily due to construction in progress related to the home office expansion. These increases were somewhat offset by more cash being generated from the sale, maturities and calls of available-for-sale securities and EFL's repayment of the $25 million surplus note. Also impacting our future investing activities are limited partnership commitments, which totaled $12.2 million at December 31, 2018, and will be funded as required by the partnerships' agreements. Of this amount, the total remaining commitment to fund limited partnerships that invest in private equity securities was $4.4 million, mezzanine debt securities was $7.5 million, and real estate activities was $0.3 million. Additionally, we have committed to incur future costs related to the construction of the building that will serve as part of our principal headquarters, which is expected to cost $100 million and is being funded by the senior secured draw term loan credit facility of the same amount. As of December 31, 2018, $66.1 million of costs have been incurred related to this project. The decrease in cash used in 2017, compared to 2016, was driven by more cash being generated from the sales, maturities and calls of available-for-sale securities.
6460_Fin.pdf 35 3/19/19 10:46 PM

36
Net cash used in financing activities totaled $131.5 million in 2018, compared to $95.8 million in 2017 and $111.2 million in 2016. The increase in cash used in 2018, compared to 2017, was primarily due to the lower scheduled draws on the senior secured draw term loan credit facility along with an increase in cash paid for dividends to shareholders. Proceeds from scheduled draws were $25 million in 2018 compared to $50 million in 2017. Future financing activities will include the principal payments due annually over the term of the senior secured draw term loan credit facility, of which $1.9 million will be paid in 2019. The decrease in cash used in 2017, compared to 2016, was primarily due to the higher scheduled draws on the senior secured draw term loan credit facility, somewhat offset by an increase in cash paid for dividends to shareholders. No shares of our Class A nonvoting common stock were repurchased in 2018, 2017 and 2016 in conjunction with our stock repurchase program. In 2011, our Board of Directors approved a continuation of the current stock repurchase program for a total of $150 million with no time limitation. This repurchase authority includes, and is not in addition to, any unspent amounts remaining under the prior authorization. We had approximately $17.8 million of repurchase authority remaining under this program at December 31, 2018, based upon trade date.
In 2018, 2017 and 2016, we purchased shares of our outstanding Class A nonvoting common stock outside of our publicly announced share repurchase program for certain stock-based incentive plans. In 2018, we purchased 27,120 shares for $3.2 million for our equity compensation plan and to fund the rabbi trust for the outside director deferred stock compensation plan and the incentive compensation deferral plan. These shares were delivered in 2018. In 2017, we purchased 60,332 shares for $7.3 million for our long-term incentive plan, to fund the rabbi trust for the outside director deferred stock compensation plan, and for our equity compensation plan. These shares were delivered in 2017. In 2016, we purchased 15,093 shares for $1.5 million for our long-term incentive plan and to fund the rabbi trust for the outside director deferred stock compensation plan. These shares were delivered in 2016.
Capital OutlookWe regularly prepare forecasts evaluating the current and future cash requirements for both normal and extreme risk events. Should an extreme risk event result in a cash requirement exceeding normal cash flows, we have the ability to meet our future funding requirements through various alternatives available to us. Outside of our normal operating and investing cash activities, future funding requirements could be met through: 1) cash and cash equivalents, which total approximately $266.4 million at December 31, 2018, 2) a $100 million bank revolving line of credit, and 3) liquidation of unpledged assets held in our investment portfolio, including preferred stock and investment grade bonds which totaled approximately $386.1 million at December 31, 2018. Volatility in the financial markets could impair our ability to sell certain fixed income securities or cause such securities to sell at deep discounts. Additionally, we have the ability to curtail or modify discretionary cash outlays such as those related to shareholder dividends and share repurchase activities. As of December 31, 2018, we have access to a $100 million bank revolving line of credit with a $25 million letter of credit sublimit that expires on October 30, 2023. As of December 31, 2018, a total of $99.1 million remains available under the facility due to $0.9 million outstanding letters of credit, which reduce the availability for letters of credit to $24.1 million. We had no borrowings outstanding on our line of credit as of December 31, 2018. Bonds with a fair value of $108.7 million were pledged as collateral on the line at December 31, 2018. These securities have no trading restrictions and are reported as available-for-sale securities in the Statements of Financial Position. The bank requires compliance with certain covenants, which include leverage ratios and debt restrictions. We were in compliance with our bank covenants at December 31, 2018.
6460_Fin.pdf 36 3/19/19 10:46 PM

37
Contractual ObligationsWe have certain obligations and commitments to make future payments under various contracts. As of December 31, 2018, the aggregate obligations were as follows:
Payments due by period
(in thousands) Total 2019 2020-2021 2022-20232024 and thereafter
Long-term debt (1) $ 173,127 $ 6,183 $ 12,366 $ 12,366 $ 142,212Home office expansion (2) 57,725 29,225 28,500 0 0Limited partnership commitments (3) 12,250 12,250 0 0 0Other commitments (4) 214,850 112,963 79,670 16,872 5,345Operating leases – vehicles 26,779 21,482 5,297 0 0Operating leases – real estate (5) 81,093 22,559 44,838 4,508 9,188Operating leases – computer equipment 10,241 5,846 4,395 0 0
Gross contractual obligations (6) 576,065 210,508 175,066 33,746 156,745Estimated reimbursements from affiliates (7) 126,472 64,125 40,712 9,081 12,554
Net contractual obligations $ 449,593 $ 146,383 $ 134,354 $ 24,665 $ 144,191
(1) Long-term debt amount differs from the balance presented on the Statements of Financial Position as the amount in the table above includes interest and principal payments based upon total draw commitments and excludes commitment fees.
(2) On July 10, 2017, we agreed to the guaranteed maximum price terms of an agreement with our construction manager for the construction of the office building that will serve as part of our principal headquarters. Substantial completion of the project is expected in the first half of 2020. The costs of this project are being funded by the senior secured draw term loan credit facility included in long-term debt in the table above.
(3) Limited partnership commitments will be funded as required for capital contributions at any time prior to the agreement expiration date. The commitment amounts are presented using the expiration date as the factor by which to age when the amounts are due. At December 31, 2018, our total commitment to fund limited partnerships that invest in private equity securities was $4.4 million, mezzanine debt was $7.5 million, and real estate activities was $0.3 million.
(4) Other commitments include various agreements for services, including information technology, support, and maintenance obligations, and other obligations in the ordinary course of business. These agreements are enforceable and legally binding and specify fixed or minimum quantities to be purchased and the approximate timing of the transaction. The table above also includes agreements that contain cancellation provisions, some of which may require us to pay a termination fee. The amounts under such contracts are included in the table above as we expect to make future cash payments according to the contract terms.
(5) Operating leases – real estate are for third party and related party office space and a warehouse facility. Commitments include minimum rental payments and related operating costs.
(6) The obligation for our unfunded Supplemental Employee Retirement Plan (SERP) for our executive and senior management is not included in gross contractual obligations. The recorded accumulated benefit obligation for this plan at December 31, 2018 is $18.9 million. We expect to have sufficient cash flows from operations to meet the future benefit payments as these become due. Additionally, a $3.1 million uncertain tax position related to the timing of deductibility is not included in gross contractual obligations.
(7) We are reimbursed from the Exchange and its subsidiaries for a portion of the costs related to other commitments and operating leases.
Our funding policy for our defined benefit pension plan is generally to contribute an amount equal or greater of the target normal cost for the plan year, or the amount necessary to fund the plan to 100%. Historically, this has resulted in an annual pension contribution. In 2018, however, we made accelerated pension contributions totaling $80 million. Following our 2018 contribution, we would not expect to make a subsequent contribution until the sum of the target normal costs for plan years beginning on and after December 31, 2017 exceeds $80 million, or earlier if a contribution is necessary to fund the plan to 100%.
Off-Balance Sheet ArrangementsOff-balance sheet arrangements include those with unconsolidated entities that may have a material current or future effect on our financial condition or results of operations, including material variable interests in unconsolidated entities that conduct certain activities. We have no material off-balance sheet obligations.
Enterprise Risk ManagementThe role of our Enterprise Risk Management ("ERM") function is to ensure that all significant risks are clearly identified, understood, proactively managed and consistently monitored to achieve strategic objectives for all stakeholders. Our ERM program views risk holistically across our entire group of companies. It ensures implementation of risk responses to mitigate potential impacts. See Item 1A "Risk Factors" contained in this report for a list of risk factors.
6460_Fin.pdf 37 3/19/19 10:46 PM

38
Our ERM process is founded on a governance framework that includes oversight at multiple levels of our organization, including our Board of Directors and executive management. Accountability to identify, manage, and mitigate risk is embedded within all functions and areas of our business. We have defined risk tolerances to monitor and manage significant risks within acceptable levels. In addition to identifying, evaluating, prioritizing, monitoring, and mitigating significant risks, our ERM process includes extreme event analyses and scenario testing. Given our defined tolerance for risk, risk model output is used to quantify the potential variability of future performance and the sufficiency of capital and liquidity levels.
TRANSACTIONS/AGREEMENTS WITH RELATED PARTIES Board OversightOur Board of Directors has a broad oversight responsibility over our intercompany relationships with the Exchange. As a consequence, our Board of Directors may be required to make decisions or take actions that may not be solely in the interest of our shareholders, such as setting the management fee rate paid by the Exchange to us and ratifying any other significant intercompany activity.
Insurance holding company systemMost states have enacted legislation that regulates insurance holding company systems, defined as two or more affiliated persons, one or more of which is an insurer. The Exchange has the following wholly owned property and casualty subsidiaries: Erie Insurance Company, Erie Insurance Company of New York, Erie Insurance Property and Casualty Company and Flagship City Insurance Company, and a wholly owned life insurance company, Erie Family Life Insurance Company. Indemnity and the Exchange, and its wholly owned subsidiaries, meet the definition of an insurance holding company system.
All transactions within a holding company system affecting the member insurers of the holding company system must be fair and reasonable and any charges or fees for services performed must be reasonable. Approval by the applicable insurance commissioner is required prior to the consummation of transactions affecting the members within a holding company system.
Intercompany AgreementsSubscriber's and services agreementsWe serve as attorney-in-fact for the subscribers at the Exchange, a reciprocal insurance exchange. Each applicant for insurance to a reciprocal insurance exchange signs a subscriber's agreement that contains an appointment of an attorney-in-fact. Through the designation of attorney-in-fact, we are required to provide policy issuance and renewal services and act as the attorney-in-fact for the Exchange with respect to all administrative services, as discussed previously. Pursuant to the subscriber's agreement, we earn a management fee for these services calculated as a percentage of the direct and assumed premiums written by the Exchange. By virtue of its legal structure as a reciprocal insurer, the Exchange does not have any employees or officers. Therefore, it enters into contractual relationships by and through the attorney-in-fact. The Exchange's insurance subsidiaries also utilize Indemnity for all administrative services in accordance with the service agreements between each of the subsidiaries and Indemnity. The amounts incurred for all administrative services are reimbursed to Indemnity at cost in accordance with the subscriber's agreement and the service agreements. These reimbursements are settled on a monthly basis. State insurance regulations require that intercompany service agreements and any material amendments be approved in advance by the state insurance department.
Leased propertyWe lease certain property from the Exchange including the home office and certain field office space. For the home office, rent is based on rental rates of like property in Erie, Pennsylvania and all operating expenses including utilities, cleaning, repairs, real estate taxes, property insurance and leasehold improvements are the responsibility of the tenant (Indemnity). Rental costs of shared facilities are allocated based upon usage or square footage occupied. We also had a lease commitment with EFL for a field office until December 31, 2018.
We previously owned three field offices for which rental costs of shared facilities were allocated based upon usage or square footage occupied. On December 31, 2018, we sold the three field offices to the Exchange at the current independent appraised value in order to align the ownership interest of these facilities with the functions being performed at these locations, which are claims-related activities.
Cost AllocationThe allocation of costs affects our financial condition and that of the Exchange and its wholly owned subsidiaries. Management's role is to determine that allocations are consistently made in accordance with the subscriber's agreement with the subscribers at the Exchange, intercompany service agreements, and applicable insurance laws and regulations. Allocation of
6460_Fin.pdf 38 3/19/19 10:46 PM

39
costs under these various agreements requires judgment and interpretation, and such allocations are performed using a consistent methodology, which is intended to adhere to the terms and intentions of the underlying agreements.
Intercompany Receivables
(dollars in thousands) 2018
Percent oftotal
assets 2017
Percent oftotal
assets
Receivables from the Exchange and other affiliates (management fees,costs and reimbursements) $449,873 25.3 % $418,328 25.1 %
Note receivable from EFL 0 0.0 25,000 1.5 Total intercompany receivables $449,873 25.3 % $443,328 26.6 %
We have significant receivables from the Exchange and its subsidiaries that result in a concentration of credit risk. These receivables include management fees due for policy issuance and renewal services performed by us under the subscriber's agreement, and certain costs we incur acting as the attorney-in-fact on behalf of the Exchange as well as the service provider for its insurance subsidiaries with respect to all administrative services, as discussed previously. We continually monitor the financial strength of the Exchange. These receivables from the Exchange and its subsidiaries are settled monthly.
Surplus NoteWe previously held a $25 million surplus note that was issued to us by EFL in 2003 and was payable on demand on or after December 31, 2018. On December 14, 2018, EFL, with the appropriate approval from the Pennsylvania Insurance Commissioner, satisfied its obligation and repaid the surplus note. The note bore an annual interest rate of 6.7% and EFL paid interest to us of $1.6 million in 2018, and $1.7 million in both 2017 and 2016.
ITEM 7A. QUANTITATIVE AND QUALITATIVE DISCLOSURES ABOUT MARKET RISK Market RiskMarket risk is the risk of loss arising from adverse changes in interest rates, credit spreads, equity prices, or foreign exchange rates, as well as other relevant market rate or price changes. The volatility and liquidity in the markets in which the underlying assets are traded directly influence market risk. The following is a discussion of our primary risk exposures, including interest rate risk, investment credit risk, concentration risk, liquidity risk, and equity price risk, and how those exposures are currently managed as of December 31, 2018. Interest Rate RiskWe invest primarily in fixed maturity investments, which comprised 88% of our invested assets at December 31, 2018. The value of the fixed maturity portfolio is subject to interest rate risk. As market interest rates decrease, the value of the portfolio increases with the opposite holding true in rising interest rate environments. We do not hedge our exposure to interest rate risk. A common measure of the interest sensitivity of fixed maturity assets is effective duration, a calculation that utilizes maturity, coupon rate, yield, and call terms to calculate an expected change in fair value given a change in interest rates. The longer the duration, the more sensitive the asset is to market interest rate fluctuations. Duration is analyzed quarterly to ensure that it remains in the targeted range we established. A sensitivity analysis is used to measure the potential loss in future earnings, fair values, or cash flows of market-sensitive instruments resulting from one or more selected hypothetical changes in interest rates and other market rates or prices over a selected period. In our sensitivity analysis model, a hypothetical change in market rates is selected that is expected to reflect reasonably possible changes in those rates. The following pro forma information is presented assuming a 100-basis point increase in interest rates at December 31 of each year and reflects the estimated effect on the fair value of our fixed maturity portfolio. We used the effective duration of our fixed maturity portfolio to model the pro forma effect of a change in interest rates at December 31, 2018 and 2017.
6460_Fin.pdf 39 3/19/19 10:46 PM

40
Fixed maturities interest-rate sensitivity analysis
(dollars in thousands) At December 31,2018 2017
Fair value of fixed maturity portfolio $ 748,523 $ 745,961Fair value assuming 100-basis point rise in interest rates $ 735,806 $ 727,787Effective duration (as a percentage) (1) 1.6 2.5
(1) Effective duration at December 31, 2018 reflects the reduction in municipal bonds and increase in short-term U.S. Treasury securities as we shift the portfolio away from tax-exempt securities.
While the fixed maturity portfolio is sensitive to interest rates, the future principal cash flows that will be received by contractual maturity date are presented below at December 31, 2018 and 2017. Actual cash flows may differ from those stated as a result of calls, prepayments, or defaults.
Contractual repayments of principal by maturity date
(in thousands)
Fixed maturities: December 31, 20182019 $ 265,0062020 55,8082021 46,6472022 19,9112023 37,645Thereafter 317,446
Total $ 742,463Fair value $ 748,523
(in thousands)
Fixed maturities: December 31, 20172018 $ 70,8622019 86,1672020 104,5612021 76,9702022 37,131Thereafter 336,717
Total (1) $ 712,408Fair value $ 745,961
(1) This amount excludes Indemnity's $25 million surplus note due from EFL.
Investment Credit RiskOur objective is to earn competitive returns by investing in a diversified portfolio of securities. Our portfolios of fixed maturity securities, nonredeemable preferred stock and, to a lesser extent, short-term investments are subject to credit risk. This risk is defined as the potential loss in fair value resulting from adverse changes in the borrower's ability to repay the debt. We manage this risk by performing upfront underwriting analysis and ongoing reviews of credit quality by position and for the fixed maturity portfolio in total. We do not hedge the credit risk inherent in our fixed maturity investments. Generally, the fixed maturities in our portfolio are rated by external rating agencies. If not externally rated, we rate them internally on a basis consistent with that used by the rating agencies. We classify all fixed maturities as available-for-sale securities, allowing us to meet our liquidity needs and provide greater flexibility to appropriately respond to changes in market conditions.
6460_Fin.pdf 40 3/19/19 10:46 PM

41
The following tables show our fixed maturity investments by rating(1):
At December 31, 2018(dollars in thousands) Amortized cost Fair value Percent of totalAAA, AA, A $ 524,560 $ 524,860 70 %BBB 73,378 72,377 10
Total investment grade 597,938 597,237 80BB 51,733 49,480 6B 94,122 89,229 12CCC, CC, C, and below 13,602 12,577 2
Total non-investment grade 159,457 151,286 20Total $ 757,395 $ 748,523 100 %(1) Ratings are supplied by S&P, Moody's, and Fitch. The table is based upon the lowest rating for each security.
At December 31, 2017(dollars in thousands) Amortized cost Fair value Percent of totalAAA, AA, A $ 448,823 $ 452,983 61 %BBB 121,821 121,488 16
Total investment grade 570,644 574,471 77BB 61,111 61,521 8B 94,827 94,996 13CCC, CC, C, and below 15,217 14,973 2
Total non-investment grade 171,155 171,490 23Total $ 741,799 $ 745,961 100 %
(1) Ratings are supplied by S&P, Moody's, and Fitch. The table is based upon the lowest rating for each security.
Approximately 18% of the fixed income portfolio is invested in structured products at December 31, 2018 compared to approximately 17% at December 31, 2017. Our structured portfolio includes residential mortgage-backed securities, commercial mortgage-backed securities, collateralized debt obligations, and asset-backed securities. The overall credit rating of the structured product portfolio is AA+ at December 31, 2018, compared to AA at December 31, 2017.
Our municipal bond portfolio currently accounts for $159.0 million, or 21% of the total fixed maturity portfolio at December 31, 2018 compared to $259.3 million, or 35% of the total fixed maturity portfolio at December 31, 2017. In the fourth quarter of 2018, we began selling off our municipal bonds as part of a portfolio rebalancing. We intend to sell the remaining municipal bonds in the first half of 2019. The overall credit rating of our municipal portfolio is AA+ at both December 31, 2018 and 2017. Our limited partnership investment portfolio is exposed to credit risk, as well as price risk. Price risk is defined as the potential loss in estimated fair value resulting from an adverse change in prices. Our investments are directly affected by the impact of changes in these risk factors on the underlying investments held by our fund managers, which could vary significantly from fund to fund. We manage these risks by performing up-front due diligence on our fund managers, ongoing monitoring, and through the construction of a diversified portfolio. We are also exposed to a concentration of credit risk with the Exchange. See the section, "Transactions/Agreements with Related Parties, Intercompany Receivables" for further discussion of this risk. Concentration RiskWhile our portfolio is well diversified within each market sector, there is an inherent risk of concentration in a particular industry or sector. We continually monitor our level of exposure to individual issuers as well as our allocation to each industry and market sector against internally established policies. See the "Financial Condition" section of Item 7. "Management's Discussion and Analysis of Financial Condition and Results of Operations" contained within this report for details of investment holdings by sector. Liquidity RiskPeriods of volatility in the financial markets can create conditions where fixed maturity investments, despite being publicly traded, can become illiquid. However, we actively manage the maturity profile of our fixed maturity portfolio such that
6460_Fin.pdf 41 3/19/19 10:46 PM

42
scheduled repayments of principal occur on a regular basis. Additionally, there is no ready market for limited partnerships, which increases the risk that these investments may not be converted to cash on favorable terms and on a timely basis.
Equity Price RiskOur portfolio of equity securities, which includes nonredeemable preferred stock, are carried on the Statements of Financial Position at estimated fair value. Equity securities are exposed to the risk of potential loss in estimated fair value resulting from an adverse change in prices ("price risk"). We do not hedge our exposure to price risk inherent in our equity investments.
6460_Fin.pdf 42 3/19/19 10:46 PM
43
ITEM 8. FINANCIAL STATEMENTS AND SUPPLEMENTARY DATA
Report of Independent Registered Public Accounting Firm
To the Board of Directors and Shareholders of Erie Indemnity Company
Opinion on the Financial Statements
We have audited the accompanying statements of financial position of Erie Indemnity Company (the "Company") as of December 31, 2018 and 2017, and the related statements of operations, comprehensive income, shareholders' equity and cash flows for each of the three years in the period ended December 31, 2018, and the related notes (collectively referred to as the "financial statements"). In our opinion, the financial statements present fairly, in all material respects, the financial position of the Company as of December 31, 2018 and 2017, and the results of its operations and its cash flows for each of the three years in the period ended December 31, 2018, in conformity with U.S. generally accepted accounting principles.
We also have audited, in accordance with the standards of the Public Company Accounting Oversight Board (United States) (PCAOB), the Company's internal control over financial reporting as of December 31, 2018, based on criteria established in Internal Control-Integrated Framework issued by the Committee of Sponsoring Organizations of the Treadway Commission (2013 framework) and our report dated February 21, 2019 expressed an unqualified opinion thereon.
Adoption of New Accounting Standard
As discussed in Note 3 to the financial statements, the Company changed its method of accounting for revenue in 2018 due to the adoption of ASU No. 2014-09, "Revenue from Contracts with Customers".
Basis for Opinion
These financial statements are the responsibility of the Company's management. Our responsibility is to express an opinion on the Company's financial statements based on our audits. We are a public accounting firm registered with the PCAOB and are required to be independent with respect to the Company in accordance with the U.S. federal securities laws and the applicable rules and regulations of the Securities and Exchange Commission and the PCAOB.
We conducted our audits in accordance with the standards of the PCAOB. Those standards require that we plan and perform the audit to obtain reasonable assurance about whether the financial statements are free of material misstatement, whether due to error or fraud. Our audits included performing procedures to assess the risks of material misstatement of the financial statements, whether due to error or fraud, and performing procedures that respond to those risks. Such procedures include examining, on a test basis, evidence regarding the amounts and disclosures in the financial statements. Our audits also included evaluating the accounting principles used and significant estimates made by management, as well as evaluating the overall presentation of the financial statements. We believe that our audits provide a reasonable basis for our opinion.
/s/ Ernst & Young LLP
We have served as the Company's auditor since 2003.
Cleveland, OHFebruary 21, 2019
6460_Fin.pdf 43 3/19/19 10:46 PM

44
ERIE INDEMNITY COMPANYSTATEMENTS OF OPERATIONS
Years ended December 31, 2018, 2017 and 2016(dollars in thousands, except per share data)
2018 2017 2016Operating revenue
Management fee revenue - policy issuance and renewal services, net $ 1,719,567 $ 1,662,625 $ 1,567,431Management fee revenue - administrative services, net 53,632 — —Administrative services reimbursement revenue 580,336 — —Service agreement revenue 28,677 29,149 29,200
Total operating revenue 2,382,212 1,691,774 1,596,631
Operating expensesCost of operations - policy issuance and renewal services 1,457,533 1,401,522 1,303,114Cost of operations - administrative services 580,336 — —
Total operating expenses 2,037,869 1,401,522 1,303,114Operating income 344,343 290,252 293,517
Investment incomeNet investment income 30,209 24,639 20,558Net realized investment (losses) gains (2,010) 1,334 672Net impairment losses recognized in earnings (1,581) (182) (416)Equity in (losses) earnings of limited partnerships (822) 2,801 7,025
Total investment income 25,796 28,592 27,839
Interest expense, net 2,460 1,238 101Other income (expense) 3,641 (1,911) (1,164)Income before income taxes 371,320 315,695 320,091Income tax expense 83,096 118,696 109,725
Net income $ 288,224 $ 196,999 $ 210,366
Earnings Per ShareNet income per share
Class A common stock – basic $ 6.19 $ 4.23 $ 4.52Class A common stock – diluted $ 5.51 $ 3.76 $ 4.01Class B common stock – basic $ 928 $ 635 $ 678Class B common stock – diluted $ 928 $ 634 $ 677
Weighted average shares outstanding – BasicClass A common stock 46,188,637 46,186,831 46,188,952Class B common stock 2,542 2,542 2,542
Weighted average shares outstanding – DilutedClass A common stock 52,315,213 52,337,463 52,435,303Class B common stock 2,542 2,542 2,542
See accompanying notes to Financial Statements. See Note 13, "Accumulated Other Comprehensive Income (Loss)", for amounts reclassified out of accumulated other comprehensive income (loss) into the Statements of Operations.
6460_Fin.pdf 44 3/19/19 10:46 PM
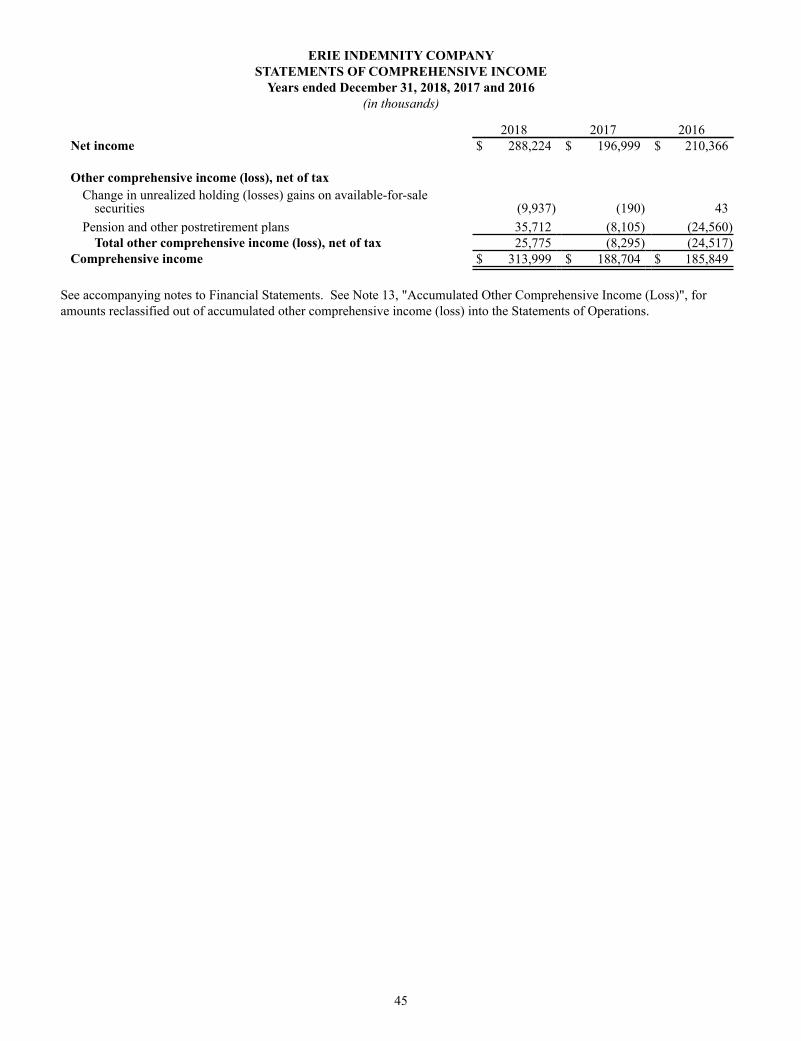
45
ERIE INDEMNITY COMPANYSTATEMENTS OF COMPREHENSIVE INCOME
Years ended December 31, 2018, 2017 and 2016(in thousands)
2018 2017 2016Net income $ 288,224 $ 196,999 $ 210,366
Other comprehensive income (loss), net of tax
Change in unrealized holding (losses) gains on available-for-salesecurities (9,937) (190) 43
Pension and other postretirement plans 35,712 (8,105) (24,560)Total other comprehensive income (loss), net of tax 25,775 (8,295) (24,517)
Comprehensive income $ 313,999 $ 188,704 $ 185,849
See accompanying notes to Financial Statements. See Note 13, "Accumulated Other Comprehensive Income (Loss)", for amounts reclassified out of accumulated other comprehensive income (loss) into the Statements of Operations.
6460_Fin.pdf 45 3/19/19 10:46 PM

46
ERIE INDEMNITY COMPANYSTATEMENTS OF FINANCIAL POSITION
At December 31, 2018 and 2017(dollars in thousands, except per share data)
2018 2017AssetsCurrent assets:
Cash and cash equivalents $ 266,417 $ 215,721Available-for-sale securities 402,339 71,190Receivables from Erie Insurance Exchange and affiliates 449,873 418,328Prepaid expenses and other current assets 36,892 34,890Federal income taxes recoverable 8,162 29,900Note receivable from Erie Family Life Insurance Company — 25,000Accrued investment income 5,263 6,853
Total current assets 1,168,946 801,882
Available-for-sale securities 346,184 687,523Equity securities 11,853 —Limited partnership investments 34,821 45,122Fixed assets, net 130,832 83,149Deferred income taxes, net 24,101 19,390Other assets 61,590 28,793
Total assets $ 1,778,327 $ 1,665,859
Liabilities and shareholders' equityCurrent liabilities:
Commissions payable $ 241,573 $ 228,124Agent bonuses 103,462 122,528Accounts payable and accrued liabilities 111,291 104,533Dividends payable 41,910 39,116Contract liability 33,854 —Deferred executive compensation 13,107 15,605Current portion of long-term borrowings 1,870 —
Total current liabilities 547,067 509,906
Defined benefit pension plans 116,866 207,530Contract liability 17,873 —Deferred executive compensation 13,075 14,452Long-term borrowings 97,860 74,728Other long-term liabilities 11,914 1,899
Total liabilities 804,655 808,515
Shareholders' equityClass A common stock, stated value $0.0292 per share; 74,996,930 shares
authorized; 68,299,200 shares issued; 46,189,068 shares outstanding 1,992 1,992Class B common stock, convertible at a rate of 2,400 Class A shares for one Class B
share, stated value $70 per share; 3,070 shares authorized; 2,542 shares issued andoutstanding 178 178
Additional paid-in-capital 16,459 16,470Accumulated other comprehensive loss (130,284) (156,059)Retained earnings 2,231,417 2,140,853
Total contributed capital and retained earnings 2,119,762 2,003,434Treasury stock, at cost; 22,110,132 shares held (1,157,625) (1,155,668)Deferred compensation 11,535 9,578
Total shareholders' equity 973,672 857,344Total liabilities and shareholders' equity $ 1,778,327 $ 1,665,859
See accompanying notes to Financial Statements.
6460_Fin.pdf 46 3/19/19 10:46 PM

47
ERIE INDEMNITY COMPANYSTATEMENTS OF SHAREHOLDERS' EQUITY
Years ended December 31, 2018, 2017 and 2016(dollars in thousands, except per share data)
Class Acommon
stock
Class Bcommon
stock
Additionalpaid-in-capital
Accumulatedother
comprehensiveincome (loss)
Retainedearnings Treasury stock
Deferredcompensation
Totalshareholders'
equityBalance, December 31, 2015 $ 1,992 $ 178 $ 16,311 $ (96,864) $ 1,993,976 $ (1,155,108) $ 9,018 $ 769,503Net income 210,366 210,366Other comprehensive loss (24,517) (24,517)Dividends declared:
Class A $2.9725 per share (137,297) (137,297)Class B $445.875 per share (1,134) (1,134)
Net purchase of treasury stock (1) (11) 0 (11)Deferred compensation (738) 738 0Balance, December 31, 2016 $ 1,992 $ 178 $ 16,300 $ (121,381) $ 2,065,911 $ (1,155,846) $ 9,756 $ 816,910Net income 196,999 196,999Other comprehensive loss (8,295) (8,295)Dividends declared:
Class A $3.1875 per share (147,225) (147,225)Class B $478.125 per share (1,215) (1,215)
Net purchase of treasury stock (1) 170 0 170Deferred compensation (1,177) 1,177 0Rabbi trust distribution (2) 1,355 (1,355) 0AOCI reclassification (3) (26,383) 26,383 0Balance, December 31, 2017 $ 1,992 $ 178 $ 16,470 $ (156,059) $ 2,140,853 $ (1,155,668) $ 9,578 $ 857,344Cumulative effect adjustments (4) (38,392) (38,392)Net income 288,224 288,224Other comprehensive income 25,775 25,775Dividends declared:
Class A $3.42 per share (157,964) (157,964)Class B $513.00 per share (1,304) (1,304)
Net purchase of treasury stock (1) (11) 0 (11)Deferred compensation (2,566) 2,566 0Rabbi trust distribution (2) 609 (609) 0Balance, December 31, 2018 $ 1,992 $ 178 $ 16,459 $ (130,284) $ 2,231,417 $ (1,157,625) $ 11,535 $ 973,672
(1) Net purchases of treasury stock in 2016, 2017 and 2018 includes the repurchase of our Class A common stock in the open market that were subsequently distributed to satisfy stock based compensation awards. See Note 12, "Capital Stock", for additional information on treasury stock transactions.
(2) Distributions of our Class A shares were made from the rabbi trust to a retired director and an incentive compensation deferral plan participant in 2018 and to a retired director in 2017. See Note 10, "Incentive and Deferred Compensation Plans".
(3) A one-time adjustment was made in the fourth quarter of 2017 to reclassify stranded tax effects of the components of accumulated other comprehensive income ("AOCI") resulting from enactment of Tax Cuts and Jobs Act ("TCJA") from AOCI to retained earnings. See Note 2, "Significant Accounting Policies".
(4) Cumulative effect adjustments are primarily related to the implementation of new revenue recognition guidance effective January 1, 2018. See Note 2, "Significant Accounting Policies".
See accompanying notes to Financial Statements.
6460_Fin.pdf 47 3/19/19 10:46 PM
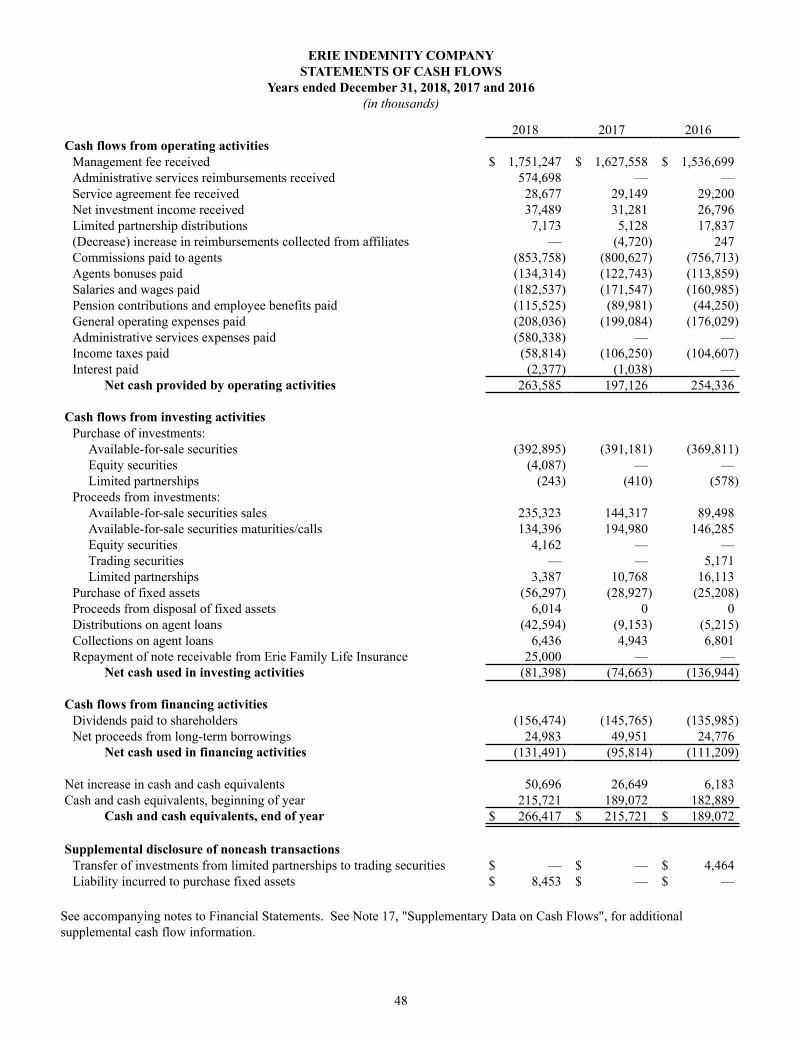
48
ERIE INDEMNITY COMPANYSTATEMENTS OF CASH FLOWS
Years ended December 31, 2018, 2017 and 2016(in thousands)
2018 2017 2016Cash flows from operating activities
Management fee received $ 1,751,247 $ 1,627,558 $ 1,536,699Administrative services reimbursements received 574,698 — —Service agreement fee received 28,677 29,149 29,200Net investment income received 37,489 31,281 26,796Limited partnership distributions 7,173 5,128 17,837(Decrease) increase in reimbursements collected from affiliates — (4,720) 247Commissions paid to agents (853,758) (800,627) (756,713)Agents bonuses paid (134,314) (122,743) (113,859)Salaries and wages paid (182,537) (171,547) (160,985)Pension contributions and employee benefits paid (115,525) (89,981) (44,250)General operating expenses paid (208,036) (199,084) (176,029)Administrative services expenses paid (580,338) — —Income taxes paid (58,814) (106,250) (104,607)Interest paid (2,377) (1,038) —
Net cash provided by operating activities 263,585 197,126 254,336
Cash flows from investing activitiesPurchase of investments:
Available-for-sale securities (392,895) (391,181) (369,811)Equity securities (4,087) — —Limited partnerships (243) (410) (578)
Proceeds from investments:Available-for-sale securities sales 235,323 144,317 89,498Available-for-sale securities maturities/calls 134,396 194,980 146,285Equity securities 4,162 — —Trading securities — — 5,171Limited partnerships 3,387 10,768 16,113
Purchase of fixed assets (56,297) (28,927) (25,208)Proceeds from disposal of fixed assets 6,014 0 0Distributions on agent loans (42,594) (9,153) (5,215)Collections on agent loans 6,436 4,943 6,801Repayment of note receivable from Erie Family Life Insurance 25,000 — —
Net cash used in investing activities (81,398) (74,663) (136,944)
Cash flows from financing activitiesDividends paid to shareholders (156,474) (145,765) (135,985)Net proceeds from long-term borrowings 24,983 49,951 24,776
Net cash used in financing activities (131,491) (95,814) (111,209)
Net increase in cash and cash equivalents 50,696 26,649 6,183Cash and cash equivalents, beginning of year 215,721 189,072 182,889
Cash and cash equivalents, end of year $ 266,417 $ 215,721 $ 189,072
Supplemental disclosure of noncash transactionsTransfer of investments from limited partnerships to trading securities $ — $ — $ 4,464Liability incurred to purchase fixed assets $ 8,453 $ — $ —
See accompanying notes to Financial Statements. See Note 17, "Supplementary Data on Cash Flows", for additional supplemental cash flow information.
6460_Fin.pdf 48 3/19/19 10:46 PM

49
ERIE INDEMNITY COMPANYNOTES TO FINANCIAL STATEMENTS
Note 1. Nature of Operations Erie Indemnity Company ("Indemnity", "we", "us", "our") is a publicly held Pennsylvania business corporation that has since its incorporation in 1925 served as the attorney-in-fact for the subscribers (policyholders) at the Erie Insurance Exchange ("Exchange"). The Exchange, which also commenced business in 1925, is a Pennsylvania-domiciled reciprocal insurer that writes property and casualty insurance. Our primary function as attorney-in-fact is to perform policy issuance and renewal services on behalf of the subscribers at the Exchange. We also act as attorney-in-fact on behalf of the Exchange with respect to all claims handling and investment management services, as well as the service provider for all claims handling, life insurance, and investment management services for its insurance subsidiaries, collectively referred to as "administrative services". Acting as attorney-in-fact in these two capacities is done in accordance with a subscriber's agreement (a limited power of attorney) executed individually by each subscriber (policyholder), which appoints us as their common attorney-in-fact to transact certain business on their behalf. Pursuant to the subscriber's agreement for acting as attorney-in-fact in these two capacities, we earn a management fee calculated as a percentage of the direct and assumed premiums written by the Exchange.
The policy issuance and renewal services we provide to the Exchange are related to the sales, underwriting and issuance of policies. The sales related services we provide include agent compensation and certain sales and advertising support services. Agent compensation includes scheduled commissions to agents based upon premiums written as well as additional commissions and bonuses to agents, which are earned by achieving targeted measures. Agent compensation comprised approximately 67% of our 2018 policy issuance and renewal expenses. The underwriting services we provide include underwriting and policy processing and comprised approximately 10% of our 2018 policy issuance and renewal expenses. The remaining services we provide include customer service and administrative support. We also provide information technology services that support all the functions listed above that comprised approximately 10% of our 2018 policy issuance and renewal expenses. Included in these expenses are allocations of costs for departments that support these policy issuance and renewal functions.
By virtue of its legal structure as a reciprocal insurer, the Exchange does not have any employees or officers. Therefore, it enters into contractual relationships by and through an attorney-in-fact. Indemnity serves as the attorney-in-fact on behalf of the Exchange with respect to its administrative services. The Exchange's insurance subsidiaries also utilize Indemnity for these services in accordance with the service agreements between each of the subsidiaries and Indemnity. Claims handling services include costs incurred in the claims process, including the adjustment, investigation, defense, recording and payment functions. Life insurance management services include costs incurred in the management and processing of life insurance business. Investment management services are related to investment trading activity, accounting and all other functions attributable to the investment of funds. Included in these expenses are allocations of costs for departments that support these administrative functions. The amounts incurred for these services are reimbursed to Indemnity at cost in accordance with the subscriber's agreement and the service agreements. State insurance regulations require that intercompany service agreements and any material amendments be approved in advance by the state insurance department.
Our results of operations are tied to the growth and financial condition of the Exchange. If any events occurred that impaired the Exchange’s ability to grow or sustain its financial condition, including but not limited to reduced financial strength ratings, disruption in the independent agency relationships, significant catastrophe losses, or products not meeting customer demands, the Exchange could find it more difficult to retain its existing business and attract new business. A decline in the business of the Exchange almost certainly would have as a consequence a decline in the total premiums paid and a correspondingly adverse effect on the amount of the management fees we receive. We also have an exposure to a concentration of credit risk related to the unsecured receivables due from the Exchange for its management fee and cost reimbursements. See Note 15, "Concentrations of Credit Risk".
6460_Fin.pdf 49 3/19/19 10:46 PM

50
Note 2. Significant Accounting Policies Basis of presentationThe accompanying financial statements have been prepared in conformity with U.S. generally accepted accounting principles ("GAAP"). Use of estimates The preparation of financial statements in conformity with GAAP requires us to make estimates and assumptions that affect the reported amounts of assets and liabilities and disclosure of contingent assets and liabilities at the date of the financial statements and the reported amounts of revenues and expenses during the reporting period. Actual results could differ from those estimates.
Recently adopted accounting standardsWe adopted Accounting Standards Codification 606, "Revenue from Contracts with Customers" ("ASC 606") on January 1, 2018, using the modified retrospective method applied to all contracts. We recognized the cumulative effect of initially adopting ASC 606 as an adjustment to the opening balance of retained earnings at January 1, 2018. The comparative information for periods preceding January 1, 2018 has not been restated and continues to be reported under the accounting standards in effect for those periods.
Under ASC 606, we determined that we have two performance obligations under the subscriber’s agreement. The first performance obligation is providing policy issuance and renewal services. The second performance obligation is acting as the attorney-in-fact on behalf of the Exchange, as well as the service provider for its insurance subsidiaries, with respect to all administrative services. Therefore, upon adoption of ASC 606 beginning January 1, 2018, the management fee earned per the subscriber’s agreement, currently 25% of all direct and assumed premiums written by the Exchange, is allocated between the two performance obligations. Prior to the adoption of ASC 606, the entire management fee was allocated to the policy issuance and renewal services. Additionally, the expenses we incur and related reimbursements we receive related to the administrative services are presented gross in our Statement of Operations effective January 1, 2018. There was no significant impact to service agreement revenue upon adoption of ASC 606.
Revenue allocated to the policy issuance and renewal services continues to be recognized at the time of policy issuance or renewal because it is at the time of policy issuance or renewal when the economic benefits of the service Indemnity provides (i.e. the substantially completed policy issuance or renewal service) and the control of the promised asset (i.e. the executed insurance policy) transfers to the customer. A significant portion of the management fee is currently allocated to this performance obligation and therefore, the related revenue recognition pattern for the vast majority of our revenues remains unchanged.
The revenue allocated to the second performance obligation is recognized over several years in correlation with the costs incurred because the economic benefit of the services provided (i.e. management of the administrative services) transfers to the customer over a period of time. The amounts incurred for these services are reimbursed to Indemnity at cost in accordance with the subscriber's agreement and the service agreements. On January 1, 2018, we established a contract liability of $48.5 million representing the portion of revenue not yet earned related to the administrative services to be provided in subsequent years. We recorded a related deferred tax asset of $10.2 million and a cumulative effect adjustment that reduced retained earnings by $38.3 million. The adoption of ASC 606 changed the presentation of our Statement of Cash Flows, but had no net impact to our cash flows.
The cumulative effect of the changes made to our Statement of Financial Position at January 1, 2018 were as follows:
(in thousands)Balance at
December 31, 2017Adjustments due
to ASC 606Balance at
January 1, 2018Statement of Financial Position:Assets
Deferred tax asset $ 19,390 $ 10,188 $ 29,578Liabilities
Contract liability — 48,514 48,514Equity
Retained earnings 2,140,853 (38,326) 2,102,527
6460_Fin.pdf 50 3/19/19 10:46 PM

51
The impact of adoption on our Statement of Financial Position at December 31, 2018 was as follows:
(in thousands) As ReportedBalances without
ASC 606Impact of ChangeHigher/(Lower)
Statement of Financial Position:Assets
Deferred tax asset $ 24,101 $ 13,238 $ 10,863Liabilities
Contract liability 51,727 — 51,727Equity
Retained earnings 2,231,417 2,272,281 (40,864)
The impact of adoption on our Statement of Operations for the year ended December 31, 2018 was as follows:
(in thousands) As ReportedBalances without
ASC 606Impact of ChangeHigher/(Lower)
Statement of Operations:Management fee revenue allocated to policy issuance and
renewal services, gross $ 1,721,309 $ 1,778,212 $ (56,903)Less: change in allowance for management fee returned on
cancelled policies (1,742) (1,800) 58Management fee revenue allocated to policy issuance and
renewal services, net $ 1,719,567 $ 1,776,412 $ (56,845)
Management fee revenue allocated to administrative services,gross $ 53,694 $ — $ 53,694
Less: change in allowance for management fee returned oncancelled policies (62) — (62)
Management fee revenue allocated to administrative services,net 53,632 — 53,632
Administrative services reimbursement revenue 580,336 — 580,336Total revenue allocated to administrative services $ 633,968 $ — $ 633,968
Administrative services expenses $ 580,336 $ — $ 580,336
In February 2018, the Financial Accounting Standards Board ("FASB") issued Accounting Standards Update ("ASU") 2018-02, "Income Statement-Reporting Comprehensive Income-Reclassification of Certain Tax Effects from Accumulated Other Comprehensive Income", which permits entities to reclassify from accumulated other comprehensive income to retained earnings tax effects stranded in accumulated other comprehensive income as a result of tax reform. ASU 2018-02 is effective for all entities for fiscal years beginning after December 15, 2018, including interim periods within those fiscal years. Early adoption is permitted for reporting periods for which financial statements have not yet been issued or made available for issuance. We elected to early adopt this guidance effective December 31, 2017 using a portfolio method, which resulted in a decrease of $26.4 million in accumulated other comprehensive income and a corresponding increase in retained earnings.
In January 2016, the FASB issued ASU 2016-01, "Financial Instruments-Overall". ASU 2016-01 revises the accounting related to the classification and measurement of investments in equity securities and the presentation of certain fair value changes for financial liabilities measured at fair value. ASU 2016-01 is effective for interim and annual reporting periods beginning after December 15, 2017. We adopted this guidance on a prospective basis effective January 1, 2018. The adoption of this guidance resulted in reclassifying unrealized losses, net of tax, on equity securities from accumulated other comprehensive loss to retained earnings, which reduced retained earnings by $0.1 million at January 1, 2018. As of January 1,
6460_Fin.pdf 51 3/19/19 10:46 PM

52
2018, equity securities are presented separately in our Statement of Financial Position. Our disclosures were prepared in accordance with this guidance.
In March 2017, the FASB issued ASU 2017-07, "Compensation-Retirement Benefits", which requires the service cost component of net benefit costs to be reported with other compensation costs arising from services rendered by the pertinent employees during the period. The other components of net benefit costs are required to be presented separately from the service cost component and outside of income from operations on a retrospective basis. This amendment also allows only the service cost component to be eligible for capitalization, when applicable, prospectively after the effective date. ASU 2017-07 is effective for interim and annual periods beginning after December 15, 2017. We adopted this guidance effective January 1, 2018 and have included the other components of net benefit costs in "Other income (expense)" in the Statements of Operations and conformed the prior-period presentation. The adoption of this guidance did not have a material impact on the presentation of our financial statements or related disclosures.
In August 2018, the FASB issued ASU 2018-14, "Compensation-Retirement Benefits-Defined Benefit Plans-General", which modifies the disclosure requirements for employers that sponsor defined benefit pension or other post retirement plans. ASU 2018-14 is effective for fiscal years ending after December 15, 2020 and should be applied on a retrospective basis to all periods presented. Early adoption is permitted. We implemented this guidance as of December 31, 2018, and presented our disclosures in accordance with the new requirements. The adoption of this guidance did not have a material impact on our disclosures.
In August 2018, the FASB issued ASU 2018-13, "Fair Value Measurement", which is effective for fiscal years beginning after December 15, 2019, including interim periods within those fiscal years. Early adoption is permitted. This guidance both modifies and adds new disclosure requirements primarily related to Level 3 fair value measurements. We implemented this guidance as of December 31, 2018, and presented our disclosures in accordance with the new requirements. The adoption of this guidance did not have a material impact on our disclosures.
Recently issued accounting standardsIn August 2018, the FASB issued ASU 2018-15, "Intangibles-Goodwill and Other Internal-Use Software", which align the requirements for capitalizing implementation costs incurred in a hosting arrangement that is a service contract with the requirements for capitalizing implementation costs incurred to develop or obtain internal-use software. ASU 2018-15 is effective for fiscal years beginning after December 15, 2019 and interim periods within those fiscal years. The amendments under ASU 2018-15 may be applied either retrospectively or prospectively to all implementation costs incurred after the date of adoption. Early adoption is permitted. We are currently evaluating the impact of ASU 2018-15 on our financial statements and disclosures.
In June 2016, the FASB issued ASU 2016-13, "Financial Instruments-Credit Losses", which requires financial assets measured at amortized cost to be presented at the net amount expected to be collected through the use of a new forward-looking expected loss model and credit losses relating to available-for-sale debt securities to be recognized through an allowance for credit losses. ASU 2016-13 is effective for interim and annual reporting periods beginning after December 15, 2019. Early adoption for interim and annual periods beginning after December 15, 2018 is permitted. We have evaluated the impact of this guidance on our invested assets. Our investments are not measured at amortized cost, and therefore do not require the use of a new expected loss model. Our available-for-sale debt securities will continue to be monitored for credit losses which would be reflected as an allowance for credit losses rather than a reduction of the carrying value of the asset. Other financial assets subject to this guidance include our receivables from the Exchange and its subsidiaries and agent loans. Given the financial strength of the Exchange, demonstrated by its strong surplus position and industry ratings, it is unlikely these receivables would have significant, if any, credit loss exposure. Accordingly, we do not expect a material impact on our financial statements or related disclosures as a result of this guidance.
In February 2016, the FASB issued ASU 2016-02, "Leases", which requires lessees to recognize assets and liabilities arising from operating leases on the Statements of Financial Position and to disclose key information about leasing arrangements. Under existing guidance, we recognize our operating lease expense in the Statements of Operations. The new lease guidance is effective for fiscal years beginning after December 15, 2018, including interim periods within those fiscal years. In July 2018, the FASB issued ASU 2018-11, "Leases-Targeted Improvements", which permits entities to apply the existing lease guidance in comparative periods and recognize any cumulative effect adjustment in the year of adoption. We will apply this optional transition method upon adoption of ASU 2016-02. Leases for which an asset and related liability are recognized include agreements for real estate, computer equipment, vehicles, and copiers. While we will recognize lease assets and liabilities on our Statement of Financial Position at adoption date, there will not be a material cumulative effect adjustment. New disclosures are required with the adoption of this guidance. There will not be a material impact to our results of operations or cash flows in 2019.
6460_Fin.pdf 52 3/19/19 10:46 PM

53
Cash and cash equivalents – Cash, money market accounts and other short-term, highly liquid investments with a maturity of three months or less at the date of purchase, are considered cash and cash equivalents.
InvestmentsAvailable-for-sale securities – Fixed maturity, preferred stock, and common stock securities, prior to the adoption of ASU 2016-01 on January 1, 2018, are classified as available-for-sale and reported at fair value. Common stock securities classified as available-for-sale represent certain exchange traded funds with underlying holdings of fixed maturity securities. Unrealized holding gains and losses, net of related tax effects, on available-for-sale securities are recorded directly to shareholders' equity as accumulated other comprehensive income (loss). As discussed in the recently adopted accounting standards, we prospectively adopted ASU 2016-01 as of January 1, 2018. Subsequently, changes in the fair value of equity securities formerly classified as available-for-sale, which include preferred and common stock securities, are recognized in earnings rather than in other comprehensive income (loss). Additionally, equity securities are presented separately in the Statement of Financial Position.
Available-for-sale securities with a remaining maturity of 12 months or less are reported as current assets on the Statements of Financial Position. Realized gains and losses on sales of available-for-sale securities are recognized in income based upon the specific identification method. Interest and dividend income are recognized as earned and recorded to net investment income.
Available-for-sale securities are evaluated monthly for other-than-temporary impairment loss. For fixed maturity securities that have experienced a decline in fair value and that we intend to sell, or for which it is more likely than not we will be required to sell the security before recovery of its amortized cost, an other-than-temporary impairment is deemed to have occurred, and is recognized in earnings. Fixed maturity securities that have experienced a decline in fair value and that we do not intend to sell, and that we will not be required to sell before recovery, are evaluated to determine if the decline in fair value is other-than-temporary. Some factors considered in this evaluation include:
• the extent and duration to which fair value is less than cost;• historical operating performance and financial condition of the issuer;• short and long-term prospects of the issuer and its industry based upon analysts' recommendations;• specific events that occurred affecting the issuer, including a ratings downgrade;• near term liquidity position of the issuer; and• compliance with financial covenants.
If a decline is deemed to be other-than-temporary, an assessment is made to determine the amount of the total impairment related to a credit loss and that related to all other factors. Consideration is given to all available information relevant to the collectability of the security in this determination. If the entire amortized cost basis of the security will not be recovered, a credit loss exists. Currently, we have the intent to sell all of our securities that have been determined to have a credit-related impairment. As a result, the entire amount of any impairment is recognized in earnings. If we had securities with credit impairments that we did not intend to sell, the non-credit portion of the impairment would be recorded in other comprehensive income.
Limited partnerships – Limited partnerships include U.S. and foreign private equity, mezzanine debt, and real estate investments. The majority of our limited partnership holdings are considered investment companies and are recorded using the equity method of accounting. For these limited partnerships the general partners record assets at fair value, including any other-than-temporary impairments of these individual investments. Our ownership interest in partnerships accounted for under the equity method is generally less than 10%, and does not provide us the ability to significantly influence the operations of the partnerships. However, we believe the equity method most appropriately reflects the value of our economic interest in these investments. We also own one real estate limited partnership that does not meet the criteria of an investment company. This partnership prepares audited financial statements on a cost basis. We have elected to report this limited partnership under the fair value option, which is based on the net asset value (NAV) from our partner's capital statement reflecting the general partner's estimate of fair value for the fund's underlying assets. Fair value provides consistency in the evaluation and financial reporting for this limited partnership and limited partnerships accounted for under the equity method. Limited partnerships reported under the fair value option are disclosed in Note 5, "Fair Value" as other limited partnership investments. Because of the timing of the preparation and delivery of financial statements for limited partnership investments, the use of the most recently available financial statements provided by the general partners results in a quarter delay in the inclusion of the limited partnership results in our Statements of Operations. Due to this delay, these financial statements do not yet reflect the market conditions experienced in the fourth quarter of 2018 for all partnerships other than the real estate limited partnership that is reported under the fair value option.
6460_Fin.pdf 53 3/19/19 10:46 PM

54
Nearly all of the underlying investments in our limited partnerships are valued using a source other than quoted prices in active markets. The fair value amounts for our private equity and mezzanine debt partnerships are based upon the financial statements of the general partners, who use multiple methods to estimate fair value including the market approach, income approach or the cost approach. The market approach uses prices and other pertinent information from market-generated transactions involving identical or comparable assets or liabilities. Such valuation techniques often use market multiples derived from a set of comparables. The income approach uses valuation techniques to convert future cash flows or earnings to a single discounted present value amount. The measurement is based upon the value indicated by current market expectations on those future amounts. The cost approach is derived from the amount that is currently required to replace the service capacity of an asset. If information becomes available that would impair the cost of investments owned by the partnerships, then the general partner would adjust to the net realizable value. For real estate limited partnerships, the general partners record these at fair value based upon an independent appraisal or internal estimates of fair value. While we perform various procedures in review of the general partners' valuations, we rely on the general partners' financial statements as the best available information to record our share of the partnership unrealized gains and losses resulting from valuation changes. Due to the limited market for these investments, there is a greater potential for market price variability. Unrealized gains and losses for these investments are reflected in equity in (losses) earnings of limited partnerships in our Statements of Operations in accordance with the equity method of accounting or the fair value option, as applicable. Cash contributions made to and distributions received from the partnerships are recorded in the period in which the transaction occurs.
Deferred taxesDeferred tax assets and liabilities are recorded for temporary differences between the tax basis of assets and liabilities and the reported amounts in the financial statements, using the statutory tax rates in effect for the year in which the differences are expected to reverse. The effect on deferred tax assets and liabilities of a change in tax rates is recognized in the results of operations in the period that includes the enactment date under the law. The need for valuation allowances on deferred tax assets are estimated based upon our assessment of the realizability of such amounts.
Fixed assetsFixed assets are stated at cost less accumulated depreciation and amortization. Fixed assets are primarily comprised of software, which includes internally used capitalized software and development costs, as well as equipment, buildings and building improvements, and leasehold improvements. Assets in use are depreciated using the straight-line method over the estimated useful life except for leasehold improvements, which are depreciated over the shorter of their economic useful life or the lease term. Software is depreciated over periods ranging from 3-7 years, equipment is depreciated over 3-10 years, and buildings and building improvements are depreciated over 20-45 years. We review long-lived assets for impairment whenever events or changes indicate that the carrying value may not be recoverable. Under these circumstances, if the fair value were less than the carrying amount of the asset, we would recognize a loss for the difference. We capitalize applicable interest charges incurred during the construction period of significant long-term building projects as part of the historical cost of the asset.
Other assetsOther assets include agent loans and other long-term assets. Agent loans are carried at unpaid principal balance with interest recorded in investment income as earned. It is our policy to charge the loans that are in default directly to expense. We do not record an allowance for credit losses on these loans, as the majority of the loans are senior secured and historically have had insignificant default amounts.
Agent bonus estimatesAgent bonuses are based upon an individual agency's property and casualty underwriting profitability and also include a component for growth in agency property and casualty premiums if the agency's underwriting profitability targets for the book of business are met. The estimate for agent bonuses, which are based upon the performance over 36 months, is modeled on a monthly basis using actual underwriting results for the two prior years and current year-to-date actual results and forecasted results for the remainder of the year.
At December 31 of each year, we use actual data available and record an accrual based upon the expected payment amount. These costs are included in "Cost of operations - policy issuance and renewal services" in the Statements of Operations.
Recognition of management fee revenueWe earn management fees from the Exchange under the subscriber’s agreement for services provided. Pursuant to the subscriber’s agreement, we may retain up to 25% of all direct and assumed premiums written by the Exchange. The
6460_Fin.pdf 54 3/19/19 10:46 PM

55
management fee rate is set at least annually by our Board of Directors. The management fee revenue is calculated by multiplying the management fee rate by the direct and assumed premiums written by the Exchange. Upon adoption of ASC 606 beginning January 1, 2018, we determined we have two performance obligations under the subscriber’s agreement. The first performance obligation is to provide policy issuance and renewal services. The second performance obligation is acting as the attorney-in-fact with respect to the administrative services. Beginning January 1, 2018, our management fee revenue is allocated to these two performance obligations. Prior to the adoption of ASC 606, the entire management fee was allocated to the policy issuance and renewal services.
Management fee revenue allocated to the policy issuance and renewal services is recognized at the time of policy issuance or renewal, because it is at the time of policy issuance or renewal when the economic benefit of the service we provide (the substantially completed policy issuance or renewal service) and the control of the promised asset (the executed insurance policy) transfers to the customer.
Management fee revenue allocated to the second performance obligation relates to us acting as the attorney-in-fact on behalf of the Exchange, as well as the service provider for its insurance subsidiaries, with respect to the administrative services and is recognized over a four-year period representing the time over which the economic benefit of the services provided (i.e. management of the administrative services) transfers to the customer.
Administrative servicesBy virtue of its legal structure as a reciprocal insurer, the Exchange does not have any employees or officers. Therefore, it enters into contractual relationships by and through an attorney-in-fact. Indemnity serves as the attorney-in-fact on behalf of the Exchange with respect to its administrative services in accordance with the subscriber's agreement. The Exchange's insurance subsidiaries also utilize Indemnity for these services in accordance with the service agreements between each of the subsidiaries and Indemnity. Claims handling services include costs incurred in the claims process, including the adjustment, investigation, defense, recording and payment functions. Life insurance management services include costs incurred in the management and processing of life insurance business. Investment management services are related to investment trading activity, accounting and all other functions attributable to the investment of funds. Included in these expenses are allocations of costs for departments that support these administrative functions. Common overhead expenses and certain service department costs incurred by us on behalf of the Exchange and its insurance subsidiaries are reimbursed by the proper entity based upon appropriate utilization statistics (employee count, square footage, vehicle count, project hours, etc.) specifically measured to accomplish proportional allocations, which we believe are reasonable. Prior to the adoption of ASC 606, we recorded the reimbursements we receive for the administrative services expenses as receivables from the Exchange and its subsidiaries with a corresponding reduction to our expenses. Total cash settlements for the Exchange and its subsidiaries were $522.3 million and $496.1 million in 2017 and 2016, respectively. Upon adoption of ASC 606 on January 1, 2018, the expenses we incur and related reimbursements we receive for administrative services are presented gross in our Statement of Operations. Reimbursements are settled on a monthly basis. The amounts incurred for these services are reimbursed to Indemnity at cost in accordance with the subscriber's agreement and the service agreements. State insurance regulations require that intercompany service agreements and any material amendments be approved in advance by the state insurance department.
Recognition of service agreement revenueService agreement revenue consists of service charges we collect from policyholders for providing multiple payment plans on policies written by the Exchange. Service charges, which are flat dollar charges for each installment billed beyond the first installment, are recognized as revenue when bills are rendered to the policyholder. Service agreement revenue also includes late payment and policy reinstatement fees, which are also recognized as revenue when bills are rendered to the policyholder.
ReclassificationsCertain amounts previously reported in the 2017 and 2016 financial statements have been reclassified for comparative purposes to conform to the current period’s presentation. One of the reclassifications resulted from new accounting guidance and only affected the Statements of Operations. Most notably, "Commissions", "Salaries and employee benefits", and "All other operating expenses" have been combined within "Cost of operations - policy issuance and renewal services" in the Statements of Operations (see Note 3, "Revenue"). This reclassification had no effect on previously reported net income.
6460_Fin.pdf 55 3/19/19 10:46 PM

56
Note 3. Revenue
The majority of our revenue is derived from the subscriber’s agreement between us and the subscribers (policyholders) at the Exchange. Pursuant to the subscriber’s agreement, we earn a management fee calculated as a percentage, not to exceed 25%, of all direct and assumed written premiums of the Exchange. We account for management fee revenue earned under the subscriber’s agreement in accordance with ASC 606, which we adopted on January 1, 2018, using the modified retrospective method. See Note 2, "Significant Accounting Policies" for further discussion of the adoption, including the impact on our financial statements.
We allocate a portion of our management fee revenue, currently 25% of the direct and assumed written premiums of the Exchange, between the two performance obligations we have under the subscriber’s agreement. The first performance obligation is to provide policy issuance and renewal services to the subscribers (policyholders) at the Exchange, and the second is to act as attorney-in-fact on behalf of the Exchange, as well as the service provider for its insurance subsidiaries, with respect to all administrative services. The transaction price, including management fee revenue and administrative service reimbursement revenue, is allocated based on the estimated standalone selling prices developed using industry information and other available information for similar services.
The first performance obligation is to provide policy issuance and renewal services that result in executed insurance policies between the Exchange or one of its insurance subsidiaries and the subscriber (policyholder). Our customer, the subscriber (policyholder), receives economic benefits when substantially all the policy issuance or renewal services are complete and an insurance policy is issued or renewed by the Exchange or one of its insurance subsidiaries. It is at the time of policy issuance or renewal that the allocated portion of revenue is recognized.
The Exchange, by virtue of its legal structure as a reciprocal insurer, does not have any employees or officers. Therefore, it enters into contractual relationships by and through an attorney-in-fact. Indemnity serves as the attorney-in-fact on behalf of the Exchange with respect to its administrative services in accordance with the subscriber's agreement. The Exchange's insurance subsidiaries also utilize Indemnity for these services in accordance with the service agreements between each of the subsidiaries and Indemnity. Collectively, these services represent a second performance obligation under the subscriber’s agreement and the service agreements. The revenue allocated to this performance obligation is recognized over time as these services are provided. The portion of revenue not yet earned is recorded as a contract liability in the Statement of Financial Position. We recorded a contract liability of $48.5 million at January 1, 2018, upon adoption of ASC 606. The gross management fee revenue recognized as earned for these services for the year ended December 31, 2018 was $53.7 million. Beginning with the adoption of ASC 606 on January 1, 2018, the administrative services expenses we incur and the related reimbursements we receive are recorded gross in the Statement of Operations.
Indemnity records a receivable from the Exchange for management fee revenue when the premium is written or assumed by the Exchange. Indemnity collects the management fee from the Exchange when the Exchange collects the premiums from the subscribers (policyholders). As the Exchange issues policies with annual terms only, cash collections generally occur within one year.
A constraining estimate exists around the management fee received as consideration related to the potential for management fee to be returned if a policy were to be cancelled mid-term. Management fees are returned to the Exchange when policyholders cancel their insurance coverage mid-term and unearned premiums are refunded to them. We maintain an estimated allowance to reduce the management fee to its estimated net realizable value to account for the potential of mid-term policy cancellations based on historical cancellation rates. This estimated allowance has been allocated between the two performance obligations consistent with the revenue allocation proportions.
The following table disaggregates revenue by our two performance obligations for the years ended December 31:
(in thousands) 2018 2017 2016Management fee revenue - policy issuance and renewal services, net $ 1,719,567 $ 1,662,625 $ 1,567,431
Management fee revenue - administrative services, net 53,632 — —Administrative services reimbursement revenue 580,336 — —
Total administrative services $ 633,968 $ — $ —
6460_Fin.pdf 56 3/19/19 10:46 PM

57
Note 4. Earnings Per Share Class A and Class B basic earnings per share and Class B diluted earnings per share are calculated under the two-class method. The two-class method allocates earnings to each class of stock based upon its dividend rights. Class B shares are convertible into Class A shares at a conversion ratio of 2,400 to 1. See Note 12, "Capital Stock".
Class A diluted earnings per share are calculated under the if-converted method, which reflects the conversion of Class B shares to Class A shares. Diluted earnings per share calculations include the dilutive effect of assumed issuance of stock-based awards under compensation plans that have the option to be paid in stock using the treasury stock method. See Note 10, "Incentive and Deferred Compensation Plans". At December 31, 2017, we recorded a one-time net non-cash tax expense of $10.1 million as a result of the enactment of the Tax Cuts and Jobs Act ("TCJA") on December 22, 2017. See Note 11, "Income Taxes". This resulted in a reduction in Class A basic earnings per share of $0.22 and diluted earnings per share of $0.19, and a reduction in Class B basic earnings per share of $33 and diluted earnings per share of $32.
A reconciliation of the numerators and denominators used in the basic and diluted per-share computations is presented as follows for each class of common stock:
(dollars in thousands,except per share data) For the years ended December 31,
2018 2017 2016Allocated
net income(numerator)
Weightedshares
(denominator)
Per-share
amount
Allocatednet income(numerator)
Weightedshares
(denominator)
Per-share
amount
Allocatednet income(numerator)
Weightedshares
(denominator)
Per-share
amountClass A – Basic EPS:Income available to
Class A stockholders $ 285,864 46,188,637 $ 6.19 $ 195,386 46,186,831 $ 4.23 $ 208,644 46,188,952 $ 4.52Dilutive effect of stock-
based awards 0 25,776 — 0 49,832 — 0 145,551 —Assumed conversion of
Class B shares 2,360 6,100,800 — 1,613 6,100,800 — 1,722 6,100,800 —Class A – Diluted EPS:
Income available to ClassA stockholders onClass A equivalentshares $ 288,224 52,315,213 $ 5.51 $ 196,999 52,337,463 $ 3.76 $ 210,366 52,435,303 $ 4.01
Class B – Basic EPS:
Income available to ClassB stockholders $ 2,360 2,542 $ 928 $ 1,613 2,542 $ 635 $ 1,722 2,542 $ 678
Class B – Diluted EPS:
Income available to ClassB stockholders $ 2,359 2,542 $ 928 $ 1,613 2,542 $ 634 $ 1,721 2,542 $ 677
6460_Fin.pdf 57 3/19/19 10:46 PM

58
Note 5. Fair Value Our available-for-sale debt securities and equity securities are recorded at fair value, which is the price that would be received to sell the asset in an orderly transaction between willing market participants as of the measurement date. Valuation techniques used to derive the fair value of our available-for-sale debt securities and equity securities are based upon observable and unobservable inputs. Observable inputs reflect market data obtained from independent sources. Unobservable inputs reflect our own assumptions regarding fair market value for these securities. Although virtually all of our prices are obtained from third-party sources, we also perform an internal pricing review on outliers, which include securities with price changes inconsistent with current market conditions. Financial instruments are categorized based upon the following characteristics or inputs to the valuation techniques:
• Level 1 – Quoted prices (unadjusted) in active markets for identical assets or liabilities that the reporting entity can access at the measurement date.
• Level 2 – Inputs other than quoted prices included within Level 1 that are observable for the asset or liability, either directly or indirectly.
• Level 3 – Unobservable inputs for the asset or liability. Estimates of fair values for our investment portfolio are obtained primarily from a nationally recognized pricing service. Our Level 1 category includes those securities valued using an exchange traded price provided by the pricing service. The methodologies used by the pricing service that support a Level 2 classification of a financial instrument include multiple verifiable, observable inputs including benchmark yields, reported trades, broker/dealer quotes, issuer spreads, two-sided markets, benchmark securities, bids, offers, and reference data. Pricing service valuations for Level 3 securities are based upon proprietary models and are used when observable inputs are not available or in illiquid markets. In limited circumstances we adjust the price received from the pricing service when, in our judgment, a better reflection of fair value is available based upon corroborating information and our knowledge and monitoring of market conditions such as a disparity in price of comparable securities and/or non-binding broker quotes. In other circumstances, certain securities are internally priced because prices are not provided by the pricing service. We perform continuous reviews of the prices obtained from the pricing service. This includes evaluating the methodology and inputs used by the pricing service to ensure that we determine the proper classification level of the financial instrument. Price variances, including large periodic changes, are investigated and corroborated by market data. We have reviewed the pricing methodologies of our pricing service as well as other observable inputs, such as market data, and transaction volumes and believe that the prices adequately consider market activity in determining fair value. When a price from the pricing service is not available, values are determined by obtaining broker/dealer quotes and/or market comparables. When available, we obtain multiple quotes for the same security. The ultimate value for these securities is determined based upon our best estimate of fair value using corroborating market information. Our evaluation includes the consideration of benchmark yields, reported trades, issuer spreads, two-sided markets, benchmark securities, bids, offers, and reference data.
6460_Fin.pdf 58 3/19/19 10:46 PM

59
The following tables present our fair value measurements on a recurring basis by asset class and level of input:
At December 31, 2018Fair value measurements using:
(in thousands)Total
Quoted prices inactive markets for
identical assetsLevel 1
Observableinputs
Level 2
Unobservableinputs
Level 3Available-for-sale securities:
U.S. Treasury (1) $ 208,412 $ 0 $ 208,412 $ 0States & political subdivisions (1) 159,023 0 159,023 0Corporate debt securities 249,947 0 237,370 12,577Residential mortgage-backed securities 4,609 0 4,609 0Commercial mortgage-backed securities 46,515 0 46,515 0Collateralized debt obligations 64,239 0 64,239 0Other debt securities 15,778 0 15,778 0
Total available-for-sale securities 748,523 0 735,946 12,577Equity securities Nonredeemable preferred stock - financial services sector 11,853 1,809 10,044 0Total equity securities 11,853 1,809 10,044 0Other limited partnership investments (2) 3,206 — — —Total $ 763,582 $ 1,809 $ 745,990 $ 12,577
At December 31, 2017Fair value measurements using:
(in thousands)Total
Quoted prices inactive markets for
identical assetsLevel 1
Observableinputs
Level 2
Unobservableinputs
Level 3Available-for-sale securities:
U.S. Treasury $ 11,734 $ 0 $ 11,734 $ 0States & political subdivisions 259,264 0 259,264 0Foreign government securities 503 0 503 0Corporate debt securities 346,523 0 338,644 7,879Residential mortgage-backed securities 25,571 0 25,571 0Commercial mortgage-backed securities 32,804 0 32,804 0Collateralized debt obligations 58,034 0 55,834 2,200Other debt securities 11,528 0 11,528 0
Total fixed maturities 745,961 0 735,882 10,079 Nonredeemable preferred stock - financial services sector 11,659 2,015 9,644 0 Nonredeemable preferred stock - utilities sector 1,093 0 1,093 0Total available-for-sale securities 758,713 2,015 746,619 10,079Other limited partnership investments (2) 4,816 — — —Total $ 763,529 $ 2,015 $ 746,619 $ 10,079
(1) In the fourth quarter of 2018, we began selling off our municipal bonds as part of a portfolio rebalancing. We intend to sell the remaining municipal bonds in the first half of 2019. We have currently invested proceeds from these sales in short-term U.S. Treasuries.
(2) The limited partnership investment measured at fair value represents one real estate fund included on the balance sheet as a limited partnership investment reported under the fair value option using the net asset value practical expedient. These amounts are not required to be categorized in the fair value hierarchy. The investment can never be redeemed with the fund. Instead, distributions are received when liquidation of the underlying assets of the fund occurs. The fair value of this investment is based on the net asset value (NAV) information provided by the general partner. Fair value is based on our proportionate share of the NAV based on the most recent partners' capital statements received from the general partner, which is generally one quarter prior to our balance sheet date. These values are then analyzed to determine if the NAV represents fair value at our balance sheet date, with adjustment being made where appropriate. We consider observable market data and perform a review validating the appropriateness of the NAV at each balance sheet date. During the years ended December 31, 2018 and 2017, no contributions were made and distributions totaling $1.2 million and $0.5 million, respectively, were received from this investment. There were no unfunded commitments related to the investment as of December 31, 2018 and 2017. In 2018, the one remaining real estate fund was in the process of liquidating the underlying assets. Liquidation of the fund was completed in January 2019.
6460_Fin.pdf 59 3/19/19 10:46 PM

60
We review the fair value hierarchy classifications each reporting period. Transfers between hierarchy levels may occur due to changes in available market observable inputs.
Level 3 Assets – Year-to-Date Change:
(in thousands)
Beginning balance at
December 31, 2017
Included in
earnings(1)
Includedin other
comprehensiveincome Purchases Sales
Transfersinto
Level 3(2)
Transfersout of
Level 3(2)
Ending balance at
December 31, 2018
Available-for-sale securities:Corporate debt securities $ 7,879 $ 6 $ (312) $ 5,550 $ (2,854) $ 18,232 $ (15,924) $ 12,577Collateralized debt obligations 2,200 0 10 905 0 0 (3,115) 0
Total Level 3 available-for-salesecurities $ 10,079 $ 6 $ (302) $ 6,455 $ (2,854) $ 18,232 $ (19,039) $ 12,577
Level 3 Assets – Year-to-Date Change:
(in thousands)
Beginning balance at
December 31, 2016
Included in
earnings(1)
Includedin other
comprehensiveincome Purchases Sales
Transfersinto
Level 3(2)
Transfersout of
Level 3(2)
Ending balance at
December 31, 2017
Available-for-sale securities:Corporate debt securities $ 9,352 $ (85) $ (41) $ 4,954 $ (5,411) $ 11,196 $ (12,086) $ 7,879Collateralized debt obligations 0 0 0 2,200 0 0 0 2,200
Total Level 3 available-for-salesecurities $ 9,352 $ (85) $ (41) $ 7,154 $ (5,411) $ 11,196 $ (12,086) $ 10,079
(1) These amounts are reported in the Statements of Operations as net investment income and net realized investment gains (losses) for each of the periods presented above.
(2) Transfers into and/or (out) of Level 3 are primarily attributable to the availability of market observable information and the re-evaluation of the observability of pricing inputs.
The change in unrealized gains or losses included in other comprehensive income related to Level 3 securities held at the reporting date is as follows for the years ended December 31:
(in thousands) 2018 2017 2016Available-for-sale securities:
Corporate debt securities $ (554) $ — $ —Net unrealized losses on Level 3 securities held at reporting date $ (554) $ — $ —
Quantitative and Qualitative Disclosures about Unobservable Inputs
When a non-binding broker quote was the only input available, the security was classified as Level 3. The quantitative detail of the unobservable inputs is neither provided nor reasonably available to us.
The following table presents our fair value measurements on a recurring basis by pricing source:
(in thousands) At December 31, 2018Total Level 1 Level 2 Level 3 (1)
Available-for-sale securities: Priced via pricing services $ 748,480 $ 0 $ 735,946 $ 12,534 Priced via market comparables/broker quotes 43 0 0 43
Total available-for-sale securities 748,523 0 735,946 12,577Equity securities priced via pricing services 11,853 1,809 10,044 0Other limited partnership investments priced via unobservable inputs (2) 3,206 — — —Total $ 763,582 $ 1,809 $ 745,990 $ 12,577
(1) Securities classified as Level 3 were priced using non-binding broker quotes.(2) Represents one real estate fund included on the Statements of Financial Position as limited partnership investments that is reported under the fair
value option using the NAV practical expedient. These amounts are not required to be categorized in the fair value hierarchy.
6460_Fin.pdf 60 3/19/19 10:46 PM

61
Financial instruments disclosed, but not carried at fair value
The following table presents the carrying values and fair value measurements, which are categorized as Level 3 in the fair value hierarchy, of financial instruments disclosed, but not carried at fair value:
At December 31, 2018 At December 31, 2017(in thousands) Carrying Value Fair Value Carrying Value Fair Value
Agent loans (1) $ 58,006 $ 54,110 $ 21,849 $ 21,849Long-term borrowings 99,730 94,057 74,728 72,424
(1) The fair value of agent loans approximates carrying value at December 31, 2017.
6460_Fin.pdf 61 3/19/19 10:46 PM

62
Note 6. Investments Available-for-sale securitiesThe following tables summarize the cost and fair value of our available-for-sale securities. See also Note 5, "Fair Value" for additional fair value disclosures.
At December 31, 2018(in thousands)
Amortizedcost
Grossunrealized
gains
Grossunrealized
lossesEstimated fair
valueAvailable-for-sale securities:
U.S. Treasury (1) $ 208,610 $ 18 $ 216 $ 208,412States & political subdivisions (1) 157,003 2,020 0 159,023Corporate debt securities 259,362 139 9,554 249,947Residential mortgage-backed securities 4,603 38 32 4,609Commercial mortgage-backed securities 47,022 80 587 46,515Collateralized debt obligations 65,039 30 830 64,239Other debt securities 15,756 33 11 15,778
Total available-for-sale securities $ 757,395 $ 2,358 $ 11,230 $ 748,523
(1) In the fourth quarter of 2018, we began selling off our municipal bonds as part of a portfolio rebalancing. We intend to sell the remaining municipal bonds in the first half of 2019. We have currently invested proceeds from these sales in short-term U.S. Treasuries.
At December 31, 2017(in thousands)
Amortizedcost
Grossunrealized
gains
Grossunrealized
lossesEstimated fair
valueAvailable-for-sale securities:
U.S. Treasury $ 11,873 $ 0 $ 139 $ 11,734States & political subdivisions 254,533 5,351 620 259,264Foreign government securities 501 2 0 503Corporate debt securities 346,759 1,688 1,924 346,523Residential mortgage-backed securities 25,324 371 124 25,571Commercial mortgage-backed securities 33,475 26 697 32,804Collateralized debt obligations 57,838 237 41 58,034Other debt securities 11,496 32 0 11,528
Total fixed maturities 741,799 7,707 3,545 745,961 Nonredeemable preferred stock - financial services sector 11,719 15 75 11,659 Nonredeemable preferred stock - utilities sector 1,118 0 25 1,093Total available-for-sale securities $ 754,636 $ 7,722 $ 3,645 $ 758,713
The amortized cost and estimated fair value of available-for-sale securities at December 31, 2018, are shown below by remaining contractual term to maturity. Mortgage-backed securities are allocated based upon stated maturity dates. Expected maturities may differ from contractual maturities because borrowers may have the right to call or prepay obligations with or without call or prepayment penalties.
At December 31, 2018(in thousands) Amortized Estimated
cost fair valueDue in one year or less $ 263,957 $ 263,837Due after one year through five years 163,276 160,504Due after five years through ten years 217,659 212,692Due after ten years 112,503 111,490
Total available-for-sale securities(1) $ 757,395 $ 748,523
(1) The contractual maturities of our municipal bond portfolio are included in the table. However, given our intent to sell this portfolio, municipal bond securities are classified as current assets in our Statements of Financial Position at December 31, 2018.
6460_Fin.pdf 62 3/19/19 10:46 PM

63
Available-for-sale securities in a gross unrealized loss position are as follows. Data is provided by length of time for securities in a gross unrealized loss position.
At December 31, 2018(dollars in thousands) Less than 12 months 12 months or longer Total
Fair Unrealized Fair Unrealized Fair Unrealized No. ofvalue losses value losses value losses holdings
Available-for-sale securities:U.S. Treasury $ 129,474 $ 19 $ 11,656 $ 197 $ 141,130 $ 216 7Corporate debt securities 157,300 6,866 86,586 2,688 243,886 9,554 635Residential mortgage-backed securities 777 6 1,618 26 2,395 32 3Commercial mortgage-backed securities 17,624 175 16,997 412 34,621 587 30Collateralized debt obligations 55,246 826 1,248 4 56,494 830 39Other debt securities 8,213 11 0 0 8,213 11 7
Total available-for-sale securities $ 368,634 $ 7,903 $ 118,105 $ 3,327 $ 486,739 $ 11,230 721Quality breakdown of available-for-salesecurities:
Investment grade $ 242,821 $ 1,295 $ 98,118 $ 1,641 $ 340,939 $ 2,936 147Non-investment grade 125,813 6,608 19,987 1,686 145,800 8,294 574
Total available-for-sale securities $ 368,634 $ 7,903 $ 118,105 $ 3,327 $ 486,739 $ 11,230 721
At December 31, 2017(dollars in thousands) Less than 12 months 12 months or longer Total
Fair Unrealized Fair Unrealized Fair Unrealized No. ofvalue losses value losses value losses holdings
Available-for-sale securities:U.S. Treasury $ 10,237 $ 110 $ 1,497 $ 29 $ 11,734 $ 139 4States & political subdivisions 52,553 288 14,361 332 66,914 620 33Corporate debt securities 171,154 1,585 31,113 339 202,267 1,924 331Residential mortgage-backed securities 4,156 29 7,064 95 11,220 124 11Commercial mortgage-backed securities 10,836 85 11,984 612 22,820 697 19Collateralized debt obligations 21,598 41 0 0 21,598 41 12Other debt securities 1,499 0 0 0 1,499 0 1
Total fixed maturities 272,033 2,138 66,019 1,407 338,052 3,545 411Nonredeemable preferred stock - financialservices sector 9,644 75 0 0 9,644 75 5Nonredeemable preferred stock - utilitiessector 1,093 25 0 0 1,093 25 1
Total available-for-sale securities $ 282,770 $ 2,238 $ 66,019 $ 1,407 $ 348,789 $ 3,645 417Quality breakdown of fixed maturities:
Investment grade $ 214,586 $ 1,064 $ 62,193 $ 985 $ 276,779 $ 2,049 158Non-investment grade 57,447 1,074 3,826 422 61,273 1,496 253
Total fixed maturities $ 272,033 $ 2,138 $ 66,019 $ 1,407 $ 338,052 $ 3,545 411 The above securities have been evaluated and determined to be temporary impairments for which we expect to recover our entire principal plus interest. The primary components of this analysis include a general review of market conditions and financial performance of the issuer along with the extent and duration at which fair value is less than cost. Any securities that we intend to sell or will more likely than not be required to sell before recovery are included in other-than-temporary impairments, which are recognized in earnings.
6460_Fin.pdf 63 3/19/19 10:46 PM
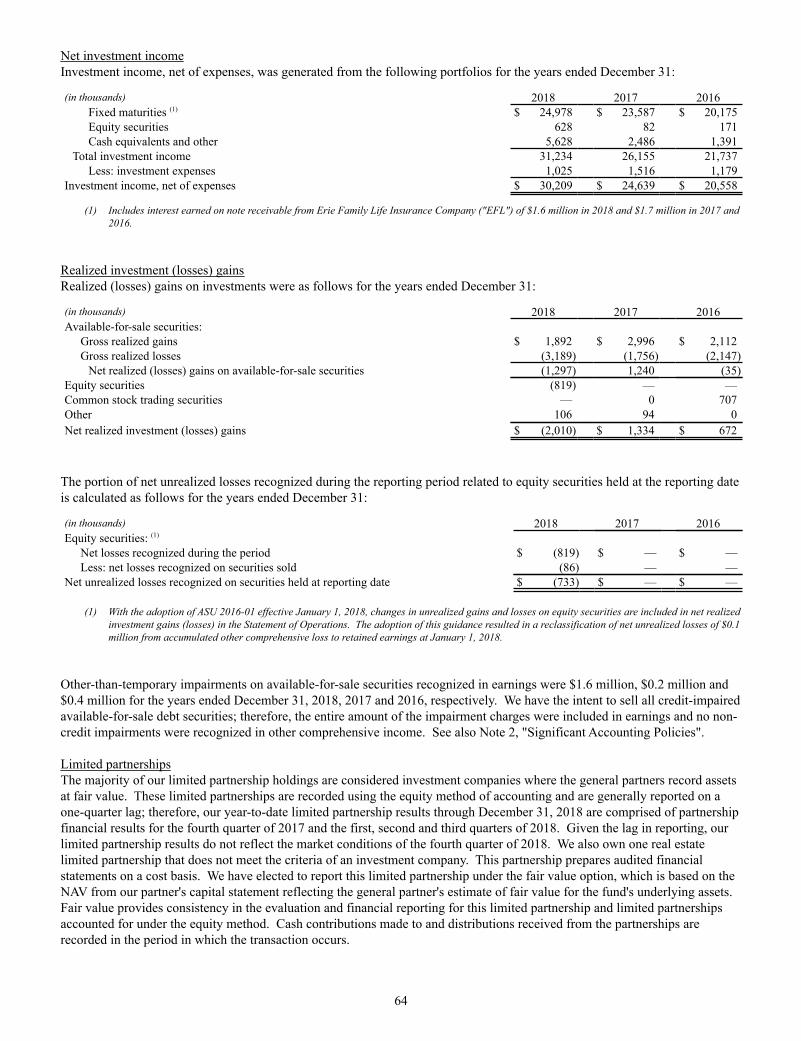
64
Net investment incomeInvestment income, net of expenses, was generated from the following portfolios for the years ended December 31:
(in thousands) 2018 2017 2016Fixed maturities (1) $ 24,978 $ 23,587 $ 20,175Equity securities 628 82 171Cash equivalents and other 5,628 2,486 1,391
Total investment income 31,234 26,155 21,737Less: investment expenses 1,025 1,516 1,179
Investment income, net of expenses $ 30,209 $ 24,639 $ 20,558
(1) Includes interest earned on note receivable from Erie Family Life Insurance Company ("EFL") of $1.6 million in 2018 and $1.7 million in 2017 and 2016.
Realized investment (losses) gainsRealized (losses) gains on investments were as follows for the years ended December 31:
(in thousands) 2018 2017 2016Available-for-sale securities:
Gross realized gains $ 1,892 $ 2,996 $ 2,112Gross realized losses (3,189) (1,756) (2,147)
Net realized (losses) gains on available-for-sale securities (1,297) 1,240 (35)Equity securities (819) — —Common stock trading securities — 0 707Other 106 94 0Net realized investment (losses) gains $ (2,010) $ 1,334 $ 672
The portion of net unrealized losses recognized during the reporting period related to equity securities held at the reporting date is calculated as follows for the years ended December 31:
(in thousands) 2018 2017 2016Equity securities: (1)
Net losses recognized during the period $ (819) $ — $ —Less: net losses recognized on securities sold (86) — —
Net unrealized losses recognized on securities held at reporting date $ (733) $ — $ —
(1) With the adoption of ASU 2016-01 effective January 1, 2018, changes in unrealized gains and losses on equity securities are included in net realized investment gains (losses) in the Statement of Operations. The adoption of this guidance resulted in a reclassification of net unrealized losses of $0.1 million from accumulated other comprehensive loss to retained earnings at January 1, 2018.
Other-than-temporary impairments on available-for-sale securities recognized in earnings were $1.6 million, $0.2 million and $0.4 million for the years ended December 31, 2018, 2017 and 2016, respectively. We have the intent to sell all credit-impaired available-for-sale debt securities; therefore, the entire amount of the impairment charges were included in earnings and no non-credit impairments were recognized in other comprehensive income. See also Note 2, "Significant Accounting Policies".
Limited partnershipsThe majority of our limited partnership holdings are considered investment companies where the general partners record assets at fair value. These limited partnerships are recorded using the equity method of accounting and are generally reported on a one-quarter lag; therefore, our year-to-date limited partnership results through December 31, 2018 are comprised of partnership financial results for the fourth quarter of 2017 and the first, second and third quarters of 2018. Given the lag in reporting, our limited partnership results do not reflect the market conditions of the fourth quarter of 2018. We also own one real estate limited partnership that does not meet the criteria of an investment company. This partnership prepares audited financial statements on a cost basis. We have elected to report this limited partnership under the fair value option, which is based on the NAV from our partner's capital statement reflecting the general partner's estimate of fair value for the fund's underlying assets. Fair value provides consistency in the evaluation and financial reporting for this limited partnership and limited partnerships accounted for under the equity method. Cash contributions made to and distributions received from the partnerships are recorded in the period in which the transaction occurs.
6460_Fin.pdf 64 3/19/19 10:46 PM

65
Equity in (losses) earnings of limited partnerships by method of accounting were as follows for the years ended December 31:
(in thousands) 2018 2017 2016Equity in (losses) earnings of limited partnerships - equity method $ (448) $ 1,925 $ 6,273Change in fair value of limited partnerships - fair value option (374) 876 752
Equity in (losses) earnings of limited partnerships $ (822) $ 2,801 $ 7,025
The following table summarizes limited partnership investments by sector at December 31:
(in thousands) 2018 2017Private equity $ 28,271 $ 31,663Mezzanine debt 1,152 3,516Real estate 2,192 5,127Real estate - fair value option 3,206 4,816
Total limited partnership investments $ 34,821 $ 45,122
See also Note 16, "Commitments and Contingencies", for investment commitments related to limited partnerships.
6460_Fin.pdf 65 3/19/19 10:46 PM

66
Note 7. Fixed Assets
The following table summarizes our fixed assets by category at December 31:
(in thousands) 2018 2017Land, buildings, and building improvements $ — $ 7,627Leasehold improvements 617 1,375Software 163,735 129,553Equipment 15,075 13,858Projects in progress 10,392 21,898Construction in progress 66,088 26,312
Total fixed assets, gross 255,907 200,623Less: Accumulated depreciation and amortization (125,075) (117,474)
Fixed assets, net $ 130,832 $ 83,149
On December 31, 2018, we sold the field offices we owned to the Exchange at the current independent appraised value in order to align the ownership interest of these facilities with the functions being performed at these locations, which are claims-related activities. We recognized a gain on the sale of $3.4 million, which is included in "Other income (expense)" in the Statements of Operations. See Note 14, "Related Party".
Software increased primarily related to an investment in platform technology, as well as internally developed software projects in progress that were completed and placed in production related to providing new quote and application processing capabilities for commercial lines and new web-based system functionality for personal lines.
Projects in progress include certain computer software and software developments costs for internal use that are not yet subject to amortization.
In 2016, we announced the construction of a new office building that will serve as part of our principal headquarters. The costs associated with this project are included in construction in progress. Capitalized interest included in construction in progress was $2.1 million at December 31, 2018 and $0.6 million at December 31, 2017, respectively. The building is expected to be completed in 2020 and is financed using a senior secured draw term loan credit facility. See Note 8, "Borrowing Arrangements".
For the years ended December 31, 2018, 2017 and 2016, depreciation and amortization of fixed assets totaled $13.4 million, $14.8 million and $15.1 million, respectively, and is included in "Cost of operations - policy issuance and renewal services" in the Statements of Operations.
6460_Fin.pdf 66 3/19/19 10:46 PM

67
Note 8. Borrowing Arrangements Bank Line of CreditAs of December 31, 2018, we have access to a $100 million bank revolving line of credit with a $25 million letter of credit sublimit that expires on October 30, 2023. As of December 31, 2018, a total of $99.1 million remains available under the facility due to $0.9 million outstanding letters of credit, which reduces the availability for letters of credit to $24.1 million. We had no borrowings outstanding on our line of credit as of December 31, 2018. Bonds with a fair value of $108.7 million were pledged as collateral on the line at December 31, 2018. The securities pledged as collateral have no trading restrictions and are reported as available-for-sale securities in the Statements of Financial Position as of December 31, 2018. The banks require compliance with certain covenants, which include leverage ratios and debt restrictions, for our line of credit. We are in compliance with all covenants at December 31, 2018. Term Loan Credit FacilityIn 2016, we entered into a credit agreement for a $100 million senior secured draw term loan credit facility ("Credit Facility") for the acquisition of real property and construction of an office building that will serve as part of our principal headquarters. Under the agreement, $25 million was drawn on December 1, 2016, June 1, 2017, December 1, 2017, and June 1, 2018, for a total drawn amount of $100 million. During the draw period from December 1, 2016 through December 31, 2018, we made monthly interest payments under the Credit Facility. At expiration of the draw period, the Credit Facility converted to a fully-amortized term loan with monthly payments of principal and interest over a period of 28 years, commencing on January 1, 2019. Borrowings under the Credit Facility will bear interest at a fixed rate of 4.35%. In addition, we were required to pay a quarterly commitment fee of 0.08% on the unused portion of the Credit Facility during the draw period. Bonds with a fair value of $114.3 million were pledged as collateral for the facility and are reported as available-for-sale securities in the Statements of Financial Position as of December 31, 2018. The bank requires compliance with certain covenants, which include leverage ratios, debt restrictions and minimum net worth, for our Credit Facility. We are in compliance with all covenants at December 31, 2018. Amounts drawn from the Credit Facility are reported at carrying value on our Statements of Financial Position, net of unamortized loan origination and commitment fees. See Note 5, "Fair Value" for the estimated fair value of these borrowings.
Annual principal paymentsThe scheduled maturity of the $100 million Credit Facility began on January 1, 2019. The following table sets forth future principal payments:
(in thousands)
YearPrincipalpayments
2019 $ 1,8702020 1,9532021 2,0402022 2,1302023 2,225
Thereafter 89,782
6460_Fin.pdf 67 3/19/19 10:46 PM

68
Note 9. Postretirement Benefits Pension plansOur pension plans consist of a noncontributory defined benefit pension plan covering substantially all employees and an unfunded supplemental employee retirement plan ("SERP") for certain members of executive and senior management. The pension plans provide benefits to covered individuals satisfying certain age and service requirements. The defined benefit pension plan and SERP each provide benefits through a final average earnings formula. Although we are the sponsor of these postretirement plans and record the funded status of these plans, the Exchange and its subsidiaries reimburse us for approximately 59% of the annual benefit expense of these plans, which represents pension benefits for employees performing administrative services and their allocated share of costs for employees in departments that support the administrative functions. For our funded pension plan, amounts are settled in cash for the portion of pension costs allocated to the Exchange and its subsidiaries. For our unfunded plans, we pay the obligations when due and amounts are settled in cash between entities when there is a payout. Cost of pension plansPension plan cost includes the following components:
(in thousands)
2018 2017 2016Service cost for benefits earned $ 38,052 $ 31,106 $ 28,201Interest cost on benefit obligation 35,382 34,275 33,125Expected return on plan assets (51,260) (41,267) (39,520)Prior service cost amortization 1,353 871 696Net actuarial loss amortization 12,809 9,301 8,111Settlement cost (1) — 302 —
Pension plan cost (2) $ 36,336 $ 34,588 $ 30,613
(1) The final SERP benefit for two former executives was settled with lump sum payments in 2017.(2) Pension plan costs represent the total cost before reimbursements to Indemnity from the Exchange and its subsidiaries.
Actuarial assumptionsThe following table describes the assumptions at December 31 used to measure the year-end obligations and the net periodic benefit costs for the subsequent year:
2018 2017 2016 2015Employee pension plan:
Discount rate 4.47% 3.73% 4.24% 4.57%Expected return on assets 6.75 6.75 7.00 7.00Compensation increases (1) 3.32 3.32 3.32 3.32
SERP:Discount rate – pre-retirement/post-retirement 4.47/3.97 3.73/3.23 4.24/3.74 4.57/4.07Rate of compensation increase 5.00 5.00 5.00 5.00
(1) The rate of compensation increase for the employee plan is age-graded. An equivalent single compensation increase rate of 3.32% in 2018, 2017 and 2016 would produce similar results.
The economic assumptions that have the most impact on the postretirement benefits expense are the discount rate and the long-term rate of return on plan assets. The discount rate assumption used to determine the benefit obligation for all periods presented was based upon a yield curve developed from corporate bond yield information.
The pension plan's expected long-term rate of return represents the average rate of return to be earned on plan assets over the period the benefits included in the benefit obligation are to be paid. To determine the expected long-term rate of return assumption, we utilized models based upon rigorous historical analysis and forward-looking views of the financial markets based upon key factors such as historical returns for the asset class' applicable indices, the correlations of the asset classes under various market conditions and consensus views on future real economic growth and inflation. The expected future return for each asset class is then combined by considering correlations between asset classes and the volatilities of each asset class to produce a reasonable range of asset return results within which our expected long-term rate of return assumption falls.
6460_Fin.pdf 68 3/19/19 10:46 PM

69
Funding policy/funded statusIn 2018, we made accelerated pension contributions totaling $80 million. Following our 2018 contributions, we would not expect to make a subsequent contribution until the sum of the target normal costs for plan years beginning on and after December 31, 2017 exceeds $80 million, or earlier if a contribution is necessary to fund the plan to 100%. At that time, our funding policy will again generally be to contribute an amount equal or greater of the target normal cost for the plan year, or the amount necessary to fund the plan to 100%. Additional contributions may be necessary or desirable due to future plan changes, our particular business or investment strategy, or pending law changes. In 2017, in addition to our planned contribution of $19.0 million, we made additional unplanned contributions of $39.9 million. The following table sets forth the funded status of the pension plans and the amounts recognized in the Statements of Financial Position at December 31:
(in thousands)
2018 2017Funded status at end of year $ (118,596) $ (207,766)
Pension liabilities – due within one year (1) $ (1,730) $ (236)Pension liabilities – due after one year (116,866) (207,530)
Net amount recognized $ (118,596) $ (207,766)
(1) The current portion of pension liabilities is included in accounts payable and accrued liabilities in the Statements of Financial Position.
Benefit obligationsBenefit obligations are described in the following tables. Accumulated and projected benefit obligations represent the obligations of a pension plan for past service as of the measurement date. The accumulated benefit obligation is the present value of pension benefits earned as of the measurement date based on employee service and compensation prior to that date. It differs from the projected benefit obligation in that the accumulated benefit obligation includes no assumptions to reflect expected future compensation. The following table sets forth a reconciliation of beginning and ending balances of the projected benefit obligation, as well as the accumulated benefit obligation at December 31:
(in thousands)
2018 2017Projected benefit obligation, beginning of year $ 951,666 $ 816,659
Service cost for benefits earned 38,052 31,106Interest cost on benefit obligation 35,382 34,275Plan amendments 3,007 5,050Actuarial (gain) loss (123,910) 82,940Benefits paid (18,032) (16,184)Settlement cost — (2,180)
Projected benefit obligation, end of year $ 886,165 $ 951,666
Accumulated benefit obligation, end of year $ 727,340 $ 767,527
Projected benefit obligations decreased $65.5 million at December 31, 2018 compared to December 31, 2017 due primarily to actuarial gains resulting from the increase in the discount rate used to measure the future benefit obligations. The discount rate increased to 4.47% in 2018 from 3.73% in 2017.
6460_Fin.pdf 69 3/19/19 10:46 PM

70
The following table describes plans with assets less than projected benefit obligation at December 31:
(in thousands) Projected Benefit Obligation inExcess of Plan Assets
2018 2017Projected benefit obligation $ 886,165 $ 951,666Plan assets 767,569 743,900
At December 31, 2018 and 2017, both the defined benefit plan and the SERP had projected benefit obligations in excess of plan assets.
The following table describes plans with assets less than accumulated benefit obligation at December 31:
(in thousands) Accumulated Benefit Obligationin Excess of Plan Assets2018 2017
Accumulated benefit obligation $ 18,908 $ 767,527Plan assets — 743,900
At December 31, 2018, the SERP had an accumulated benefit obligation in excess of plan assets. At December 31, 2017, both the defined benefit plan and the SERP had accumulated benefit obligations in excess of plan assets.
Pension assetsThe following table sets forth a reconciliation of beginning and ending balances of the fair value of plan assets at December 31:
(in thousands)
2018 2017Fair value of plan assets, beginning of year $ 743,900 $ 592,544
Actual (loss) gain on plan assets (38,360) 108,618Employer contributions 80,061 61,102Benefits paid (18,032) (16,184)Settlements (1) — (2,180)
Fair value of plan assets, end of year $ 767,569 $ 743,900
(1) The final SERP benefit for two former executives was settled with lump sum payments in 2017.
Accumulated other comprehensive incomeNet actuarial loss and prior service cost included in accumulated other comprehensive income that were not yet recognized as components of net benefit costs were as follows:
(in thousands)
2018 2017Net actuarial loss $ 144,165 $ 191,264Prior service cost 11,855 10,201
Net amount not yet recognized $ 156,020 $ 201,465
6460_Fin.pdf 70 3/19/19 10:46 PM

71
Other comprehensive incomeAmounts recognized in other comprehensive income for pension plans were as follows:
(in thousands)
2018 2017Net actuarial (gain) loss arising during the year $ (34,290) $ 15,588Amortization of net actuarial loss (12,809) (9,301)Amortization of prior service cost (1,353) (871)Amendments (1) 3,007 5,050Impact due to settlement (2) — (302)
Total recognized in other comprehensive income $ (45,445) $ 10,164
(1) In 2018, there were five new SERP participants. In 2017, amendments include an enactment to the surviving spouse's death benefits, which increased the pension plan obligation by $3.6 million and the SERP obligation by $0.3 million, additionally there were two new SERP participants in 2017, which contributed $1.2 million.
(2) The final SERP benefit for two former executives was settled with lump sum payments in 2017.
Asset allocationThe employee pension plan utilizes a return seeking and a liability asset matching allocation strategy. It is based upon the understanding that 1) equity investments are expected to outperform debt investments over the long-term, 2) the potential volatility of short-term returns from equities is acceptable in exchange for the larger expected long-term returns, and 3) a portfolio structured across investment styles and markets (both domestic and foreign) reduces volatility. As a result, the employee pension plan's investment portfolio utilizes a broadly diversified asset allocation across domestic and foreign equity and debt markets. The investment portfolio is composed of commingled pools that are dedicated exclusively to the management of employee benefit plan assets.
The target and actual asset allocations for the portfolio are as follows for the years ended December 31:
Target assetallocation (1)
Target assetallocation
Actual assetallocation
Actual assetallocation
Asset allocation: 2018 2017 2018 2017Equity securities:
U.S. equity securities 25% (2) 35% 24% 39%Non-U.S. equity securities 16 (3) 20 14 19
Total equity securities 41 55 38 58Debt securities 58 (4) 44 61 41Other 1 (5) 1 1 1Total 100% 100% 100% 100%
(1) Changes to the target asset allocation in 2018 were made to reduce investment risk by shifting portfolio assets from equity securities to debt securities.
(2) U.S. equity securities – 21% seek to achieve excess returns relative to the Russell 2000 Index. The remaining 79% of the allocation to U.S. equity securities are comprised of equity index funds that track the S&P 500.
(3) Non-U.S. equity securities – 11% are allocated to international small cap investments, while another 20% are allocated to international emerging market investments. The remaining 69% of the Non-U.S. equity securities are allocated to investments seeking to achieve excess returns relative to an international market index.
(4) Debt securities – 32% are allocated to long U.S. Treasury Strips, 62% are allocated to U.S. corporate bonds with an emphasis on long duration bonds rated A or better, while the remaining 6% are allocated to floating rate high income leverage loans.
(5) Institutional money market fund.
6460_Fin.pdf 71 3/19/19 10:46 PM

72
The following tables represent the fair value measurements for the pension plan assets by major category and level of input:
At December 31, 2018Fair value measurements of plan assets using:
(in thousands) Total
Quoted prices inactive markets for
identical assetsLevel 1
Significantobservable
inputsLevel 2
Significantunobservable
inputsLevel 3
Equity securities:U.S. equity securities $ 182,495 $ 0 $ 182,495 $ 0Non-U.S. equity securities 110,942 0 110,942 0
Total equity securities 293,437 0 293,437 0Debt securities 464,613 0 464,613 0Other 9,519 9,519 0 0Total $ 767,569 $ 9,519 $ 758,050 $ 0
At December 31, 2017Fair value measurements of plan assets using:
(in thousands) Total
Quoted prices inactive markets for
identical assetsLevel 1
Significantobservable
inputsLevel 2
Significantunobservable
inputsLevel 3
Equity securities:U.S. equity securities $ 288,861 $ 0 $ 288,861 $ 0Non-U.S. equity securities 145,238 0 145,238 0
Total equity securities 434,099 0 434,099 0Debt securities 303,331 0 303,331 0Other 6,470 6,470 0 0Total $ 743,900 $ 6,470 $ 737,430 $ 0
Estimates of fair values of the pension plan assets are obtained primarily from the trustee and custodian of our pension plan. Our Level 1 category includes a money market fund that is a mutual fund for which the fair value is determined using an exchange traded price provided by the trustee and custodian. Our Level 2 category includes commingled pools. Estimates of fair values for securities held by our commingled pools are obtained primarily from the trustee and custodian. The methodologies used by the trustee and custodian that support a financial instrument Level 2 classification include multiple verifiable, observable inputs including benchmark yields, reported trades, broker/dealer quotes, issuers spreads, two-sided markets, benchmark securities, bids, offers, and reference data. Estimated future benefit paymentsThe following table sets forth amounts of benefits expected to be paid over the next 10 years from our pension plans as of December 31:
(in thousands)
Year endingDecember 31,
Expected futurebenefit payments
2019 $ 22,0392020 23,2442021 25,9462022 29,3192023 32,631
2024 - 2028 213,490
6460_Fin.pdf 72 3/19/19 10:46 PM
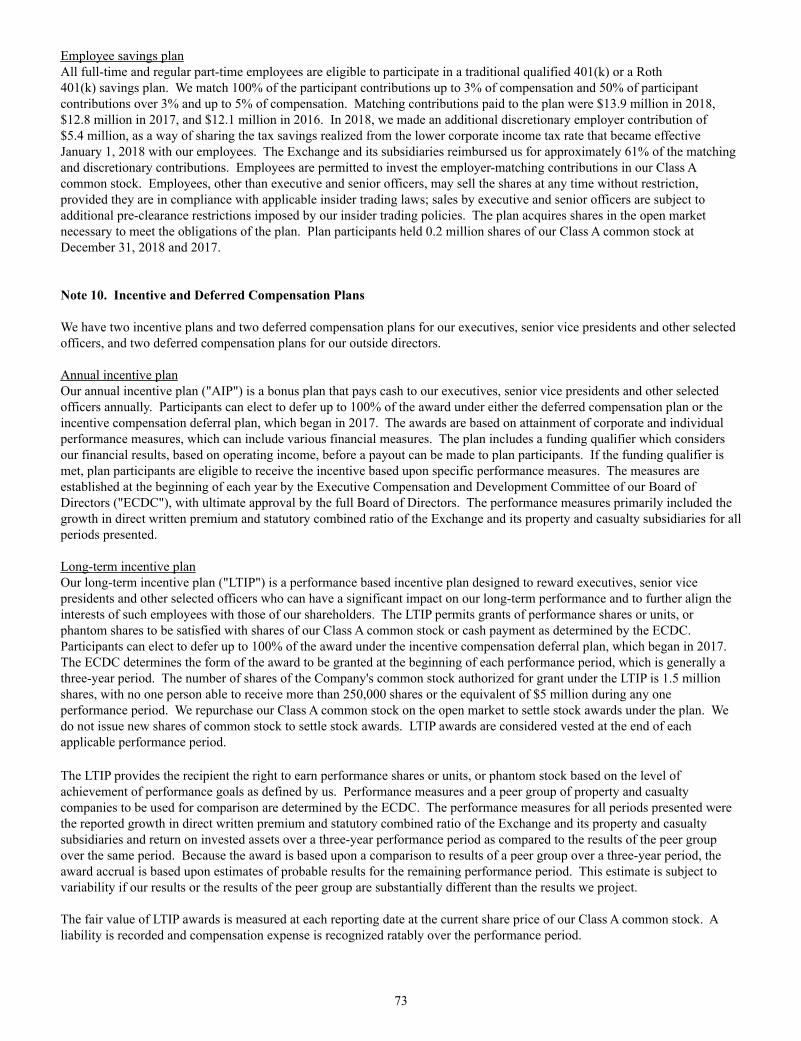
73
Employee savings planAll full-time and regular part-time employees are eligible to participate in a traditional qualified 401(k) or a Roth 401(k) savings plan. We match 100% of the participant contributions up to 3% of compensation and 50% of participant contributions over 3% and up to 5% of compensation. Matching contributions paid to the plan were $13.9 million in 2018, $12.8 million in 2017, and $12.1 million in 2016. In 2018, we made an additional discretionary employer contribution of $5.4 million, as a way of sharing the tax savings realized from the lower corporate income tax rate that became effective January 1, 2018 with our employees. The Exchange and its subsidiaries reimbursed us for approximately 61% of the matching and discretionary contributions. Employees are permitted to invest the employer-matching contributions in our Class A common stock. Employees, other than executive and senior officers, may sell the shares at any time without restriction, provided they are in compliance with applicable insider trading laws; sales by executive and senior officers are subject to additional pre-clearance restrictions imposed by our insider trading policies. The plan acquires shares in the open market necessary to meet the obligations of the plan. Plan participants held 0.2 million shares of our Class A common stock at December 31, 2018 and 2017.
Note 10. Incentive and Deferred Compensation Plans We have two incentive plans and two deferred compensation plans for our executives, senior vice presidents and other selected officers, and two deferred compensation plans for our outside directors.
Annual incentive planOur annual incentive plan ("AIP") is a bonus plan that pays cash to our executives, senior vice presidents and other selected officers annually. Participants can elect to defer up to 100% of the award under either the deferred compensation plan or the incentive compensation deferral plan, which began in 2017. The awards are based on attainment of corporate and individual performance measures, which can include various financial measures. The plan includes a funding qualifier which considers our financial results, based on operating income, before a payout can be made to plan participants. If the funding qualifier is met, plan participants are eligible to receive the incentive based upon specific performance measures. The measures are established at the beginning of each year by the Executive Compensation and Development Committee of our Board of Directors ("ECDC"), with ultimate approval by the full Board of Directors. The performance measures primarily included the growth in direct written premium and statutory combined ratio of the Exchange and its property and casualty subsidiaries for all periods presented.
Long-term incentive planOur long-term incentive plan ("LTIP") is a performance based incentive plan designed to reward executives, senior vice presidents and other selected officers who can have a significant impact on our long-term performance and to further align the interests of such employees with those of our shareholders. The LTIP permits grants of performance shares or units, or phantom shares to be satisfied with shares of our Class A common stock or cash payment as determined by the ECDC. Participants can elect to defer up to 100% of the award under the incentive compensation deferral plan, which began in 2017. The ECDC determines the form of the award to be granted at the beginning of each performance period, which is generally a three-year period. The number of shares of the Company's common stock authorized for grant under the LTIP is 1.5 million shares, with no one person able to receive more than 250,000 shares or the equivalent of $5 million during any one performance period. We repurchase our Class A common stock on the open market to settle stock awards under the plan. We do not issue new shares of common stock to settle stock awards. LTIP awards are considered vested at the end of each applicable performance period. The LTIP provides the recipient the right to earn performance shares or units, or phantom stock based on the level of achievement of performance goals as defined by us. Performance measures and a peer group of property and casualty companies to be used for comparison are determined by the ECDC. The performance measures for all periods presented were the reported growth in direct written premium and statutory combined ratio of the Exchange and its property and casualty subsidiaries and return on invested assets over a three-year performance period as compared to the results of the peer group over the same period. Because the award is based upon a comparison to results of a peer group over a three-year period, the award accrual is based upon estimates of probable results for the remaining performance period. This estimate is subject to variability if our results or the results of the peer group are substantially different than the results we project.
The fair value of LTIP awards is measured at each reporting date at the current share price of our Class A common stock. A liability is recorded and compensation expense is recognized ratably over the performance period.
6460_Fin.pdf 73 3/19/19 10:46 PM

74
At December 31, 2018, the plan awards for the 2016-2018 performance period, which will be granted as a cash award, were fully vested. Distributions will be made in 2019 once peer group financial information becomes available. The estimated plan award based upon the peer group information as of September 30, 2018 is $7.4 million. At December 31, 2017, the awards paid in cash for the 2015-2017 performance period were fully vested and resulted in an $8.3 million payment to participants in June 2018. At December 31, 2016, the awards for the 2014-2016 performance period were fully vested. Participants had the option of receiving either cash or stock for the 2014-2016 awards. The cash award of $4.7 million was paid in June 2017 and the stock award of 46,884 shares with an average share price of $126.21 and a market value of $5.9 million was delivered to plan participants in June 2017. The ECDC has determined that the plan awards for the 2017-2019 and 2018-2020 performance periods will be paid in cash. The Exchange and its subsidiaries reimburse us for compensation costs of employees performing administrative services. Earned compensation costs are allocated to these entities and reimbursed to us in cash once the payout is made. The total compensation cost charged to operations related to these LTIP awards was $6.3 million in 2018, $10.3 million in 2017, and $8.2 million in 2016. The related tax benefits recognized in income were $1.3 million in 2018, $3.6 million in 2017, and $2.9 million in 2016. The Exchange and its subsidiaries reimburse us for approximately 47% of the annual compensation cost of these plans. At December 31, 2018, there was $5.7 million of total unrecognized compensation cost for non-vested LTIP awards related to open performance periods. Unrecognized compensation is expected to be recognized over a period of two years.
Deferred compensation planOur deferred compensation plan allows executives, senior vice presidents and other selected officers to elect to defer receipt of a portion of their compensation and AIP cash awards until a later date. Employer 401(k) matching contributions that are in excess of the annual contribution or compensation limits are also credited to the participant accounts for those who elected to defer receipt of some portion of their base salary. Participants select hypothetical investment funds for their deferrals which are credited with the hypothetical returns generated.
Incentive compensation deferral planEffective January 1, 2017, our Board of Directors approved an unfunded, non-qualified incentive compensation deferral plan for participants of the AIP and LTIP. Participants can elect to defer up to 100% of their annual AIP award and/or up to 100% of their LTIP award for each performance period. Deferred awards will be credited to a deferred stock account as credits denominated in Class A shares of the Company stock until retirement or other separation from service from the Company. Participants are 100% vested at date of deferral. The shares are held in a rabbi trust, which was established to hold the shares earned under both the incentive compensation deferral plan and the deferred stock compensation plan for outside directors. The rabbi trust is classified and accounted for as equity in a manner consistent with the accounting for treasury stock. Dividends received on the shares in the rabbi trust are used to purchase additional shares. Vested share credits will be paid to participants from the rabbi trust upon separation from service in approximate equal annual installments of Class A shares for a period of three years. In 2018, the rabbi trust purchased 12,005 shares of our common stock in the open market at an average price of $119.28 for $1.4 million to satisfy the liability for the 2017 AIP awards deferred under the incentive compensation deferral plan. The total compensation charged to operations related to these deferred AIP awards was $0.7 million in 2018 and $1.4 million in 2017. The Exchange and its subsidiaries reimbursed us for approximately 42% of the annual compensation cost of this plan. Deferred compensation plans for outside directorsWe have a deferred compensation plan for our outside directors that allows participants to defer receipt of a portion of their annual compensation until a later date. Participants select hypothetical investment funds for their deferrals which are credited with the hypothetical returns generated.
We also have a deferred stock compensation plan for our outside directors to further align the interests of directors with those of our shareholders that provides for a portion of the directors' annual compensation in shares of our Class A common stock. Each director vests in the grant 25% every three months over the course of a year. Dividends paid by us are credited to each director's account which vest immediately. We do not issue new shares of common stock to directors. Our practice is to repurchase shares of our Class A common stock in the open market to satisfy these awards, which are held in the rabbi trust.
The rabbi trust purchased 9,285 shares of our common stock on the open market at an average price of $122.19 for $1.1 million in 2018, 9,663 shares at an average price of $121.85 for $1.2 million in 2017, and 7,432 shares at an average price of $99.23 for $0.7 million in 2016 to satisfy the liability of the stock compensation plan for outside directors. The shares are distributed to the outside director from the rabbi trust upon ending board service. The total compensation charged to operations related to these awards totaled $0.8 million, $0.9 million and $0.5 million in 2018, 2017 and 2016, respectively.
6460_Fin.pdf 74 3/19/19 10:46 PM

75
The following summarizes our deferred executive and outside directors' compensation liability for December 31:
(in thousands)
2018 2017 2016
Annual incentive plan awards $ 4,751 $ 6,118 $ 6,460Long-term incentive plan awards 6,331 10,931 11,321Employer match and hypothetical earnings on deferred compensation 1,484 2,664 1,164
Total plan awards and earnings 12,566 19,713 18,945Total plan awards paid (14,482) (20,621) (20,418)
Compensation deferred 1,928 680 1,214Distributions from the deferred compensation plans (1,321) (853) (435)Forfeitures (1) 0 (593) (3,117)Funding of rabbi trust for deferred stock compensation plan for outside directors (1,165) (1,177) (738)Funding of rabbi trust for incentive compensation deferral plan (1,401) — —
Incentive plan and deferred compensation liabilities at end of period $ 26,182 $ 30,057 $ 32,908
(1) Forfeitures are the result of plan participants who separated from service with the Company.
Equity compensation planWe also have an equity compensation plan ("ECP") which is designed to reward key employees, as determined by the ECDC or the chief executive officer, who can have a significant impact on our long-term performance and to further align the interests of such employees with those of our shareholders. The ECP permits grants of restricted shares, restricted share units and other share based awards, to be satisfied with shares of our Class A common stock or cash. The ECDC determines the form of the award to be granted at the beginning of each performance period. The number of shares of the Company's Class A common stock authorized for grant under the ECP is 100,000 shares, with no one person able to receive more than 5,000 shares in a calendar year. We do not issue new shares of common stock to satisfy plan awards. Share awards are settled through the repurchase of our Class A common stock on the open market. Restricted share awards may be entitled to receive dividends payable during the performance period, or, if subject to performance goals, to receive dividend equivalents payable upon vesting. Dividend equivalents may provide for the crediting of interest or hypothetical reinvestment experience payable after expiration of the performance period. Vesting conditions are determined at the time the award is granted and may include continuation of employment for a specific period, satisfaction of performance goals and the defined performance period, and the satisfaction of any other terms and conditions as determined to be appropriate. The plan is to remain in effect until December 31, 2022, unless earlier amended or terminated by our Board of Directors. Awards will be satisfied with shares of our Class A common stock. In 2018, 5,830 Class A shares with an average share price of $115.45 and a market value of $0.7 million were delivered to plan participants to satisfy the 2015 plan year and remainder of 2014 plan year awards. In 2017, 3,785 Class A shares with an average share price of $109.41 and a market value of $0.4 million were delivered to plan participants to satisfy a portion of the 2014 plan year award. The total compensation charged to operations related to these ECP awards was $0.4 million in 2018, $0.2 million in 2017, and $0.8 million in 2016. The Exchange and its subsidiaries reimburse us for earned compensation costs of employees performing administrative services, which can fluctuate each year based on the plan participants. The Exchange and its subsidiaries reimbursed us for approximately 68% and 38% of the awards paid in 2018 and 2017, respectively. Unearned compensation expense of $0.3 million is expected to be recognized over a period of three years.
6460_Fin.pdf 75 3/19/19 10:46 PM

76
Note 11. Income Taxes The provision for income taxes consists of the following for the years ended December 31:
(in thousands)
2018 2017 2016Current income tax expense $ 84,454 $ 81,689 $ 109,727Deferred income tax (benefit) expense (1,358) 26,912 (2)Other income tax expense — 10,095 —
Income tax expense $ 83,096 $ 118,696 $ 109,725
Other income tax expense for 2017 was impacted by the re-measurement of our deferred tax assets and liabilities due to the enactment of the Tax Cuts and Jobs Act ("TCJA") on December 22, 2017, which reduced the corporate tax rate from 35% to 21% effective January 1, 2018. The current and deferred income tax (benefit) expense for 2018 is measured at the statutory rate of 21% and 35% for 2017 and 2016.
A reconciliation of the provision for income taxes, with amounts determined by applying the statutory federal income tax rate to pre-tax income, is as follows for the years ended December 31:
(in thousands)
2018 2017 2016Income tax at statutory rate $ 77,977 $ 110,493 $ 112,032Change in tax rate (1) — 10,095 —Tax-exempt interest (1,305) (2,278) (2,270)Unrecognized tax benefits 3,088 — —Other, net 3,336 386 (37)
Income tax expense $ 83,096 $ 118,696 $ 109,725
(1) The change in tax rate represents the tax effect of the re-measurement of deferred tax assets and liabilities due to the enactment of the TCJA.
The statutory rate for the year ended December 31, 2018 is 21% and 35% for the years ended December 31, 2017 and 2016.
At December 31, 2017, we recorded provisional amounts for certain enactment-date effects of the TCJA based on information available at that time. The Securities and Exchange Commission issued rules that allowed for a measurement period of one year after the enactment date of the TCJA to finalize the recording of the related tax impact. We completed our analysis for the effects of the TCJA and there were no material changes made in 2018 to the provisional amounts and no material impact on the effective tax rate.
6460_Fin.pdf 76 3/19/19 10:46 PM

77
Temporary differences and carry-forwards, which give rise to deferred tax assets and liabilities, are as follows for the years ended December 31:
(in thousands)
2018 2017Deferred tax assets:
Other employee benefits $ 12,237 $ 14,092Pension and other postretirement benefits 20,124 22,758Allowance for management fee returned on cancelled policies 3,292 3,024Deferred revenue 3,524 0Unrealized losses on investments 2,030 0Other 1,246 812 Total deferred tax assets 42,453 40,686
Deferred tax liabilities:Depreciation 13,015 10,204Prepaid expenses 1,376 5,568Commissions 1,270 0Limited partnerships 2,534 4,509Unrealized gains on investments 0 856Other 157 159 Total deferred tax liabilities 18,352 21,296
Net deferred tax asset $ 24,101 $ 19,390
If we determine that any of our deferred tax assets will not result in future tax benefits, a valuation allowance must be established for the portion of the assets that are not expected to be realized. We had no valuation allowance recorded at December 31, 2018 or December 31, 2017.
A reconciliation of unrecognized tax benefits for the years ended December 31 is as follows:
(in thousands)
2018 2017 2016Balance at the beginning of the year $ 0 $ — $ —
Additions for current year tax positions 7,719 — —Reductions for current year tax positions (4,631) — —Additions for prior year tax positions — 2,337 —Reductions for prior year tax positions — (2,337) —
Balance at the end of the year $ 3,088 $ 0 $ —
Included in the balance at December 31, 2018 was $3.1 million of tax expense related to uncertain tax positions for which the ultimate deductibility is certain, but for which there is uncertainty around the timing of deductibility. The amounts recorded in 2018 resulted from the difference in measuring the tax liability at the previous tax rate and the current enacted tax rate. This increased our effective tax rate by 0.8% in 2018. In 2017, we had an uncertain tax position of $2.3 million, for which a current liability was recorded. As a related temporary tax difference was also recognized, there was no impact to our results of operations or financial position. It is not expected that there will be a significant change in the unrecognized tax benefits in the next 12 months. Interest expense related to uncertain tax positions is recognized in income tax expense. Interest expense was $0.8 million and $0.1 million in 2018 and 2017, respectively. There was no interest expense related to uncertain tax positions in 2016.
Tax years ending December 31, 2017, 2016 and 2015 remain open to IRS examination. We are not currently under IRS audit, nor have we been notified of an upcoming IRS audit.
We are the attorney-in-fact for the subscribers (policyholders) at the Exchange, a reciprocal insurance exchange. In that capacity, we provide all services and facilities necessary to conduct the Exchange's insurance business. Indemnity and the Exchange together constitute a single insurance business. Consequently, we are not subject to state corporate income or franchise taxes in states where the Exchange conducts its business and the states collect premium tax in lieu of corporate income or franchise tax, as a result of the Exchange's remittance of premium taxes in those states.
6460_Fin.pdf 77 3/19/19 10:46 PM

78
Note 12. Capital Stock Class A and B common stockWe have two classes of common stock: Class A which has a dividend preference and Class B which has voting power and a conversion right. Each share of Class A common stock outstanding at the time of the declaration of any dividend upon shares of Class B common stock shall be entitled to a dividend payable at the same time, at the same record date, and in an amount at least equal to 2/3 of 1.0% of any dividend declared on each share of Class B common stock. We may declare and pay a dividend in respect to Class A common stock without any requirement that any dividend be declared and paid in respect to Class B common stock. Sole shareholder voting power is vested in Class B common stock except insofar as any applicable law shall permit Class A common shareholders to vote as a class in regards to any changes in the rights, preferences, and privileges attaching to Class A common stock. Holders of Class B shares may, at their option, convert their shares into Class A shares at the rate of 2,400 Class A shares per Class B share. There were no shares of Class B common stock converted into Class A common stock in 2018, 2017 or 2016.
Stock repurchasesOur Board of Directors authorized a stock repurchase program effective January 1, 1999 allowing the repurchase of our outstanding Class A nonvoting common stock. Treasury shares are recorded in the Statements of Financial Position at total cost based upon trade date. There were no shares repurchased under this program during 2018, 2017 or 2016. In 2011, our Board of Directors approved a continuation of the current stock repurchase program for a total of $150 million, with no time limitation. We had approximately $17.8 million of repurchase authority remaining under this program at December 31, 2018, based upon trade date.
In 2018, we purchased 27,120 shares of our outstanding Class A nonvoting common stock outside of our publicly announced share repurchase program at a total cost of $3.2 million. Of this amount, we purchased 5,830 shares for $0.7 million, or $117.39 per share, for stock-based awards in conjunction with our equity compensation plan. We purchased 9,285 shares for $1.1 million, or $122.19 per share, to fund the rabbi trust for the outside director deferred stock compensation plan. The remaining 12,005 shares were purchased at a total cost of $1.4 million, or $119.28 per share, to fund the rabbi trust for the incentive compensation deferral plan. These shares were delivered in 2018.
In 2017, we purchased 60,332 shares of our outstanding Class A nonvoting common stock outside of our publicly announced share repurchase program at a total cost of $7.3 million. Of this amount, we purchased 3,785 shares for $0.4 million, or $111.55 per share, for stock-based awards in conjunction with our equity compensation plan. We purchased 9,663 shares for $1.2 million, or $121.85 per share, to fund the rabbi trust for the outside director deferred stock compensation plan. The remaining 46,884 shares were purchased at a total cost of $5.7 million, or $122.40 per share, for the vesting of stock-based awards in conjunction with our long-term incentive plan. These shares were delivered in 2017.
In 2016, we purchased 15,093 shares of our outstanding Class A nonvoting common stock outside of our publicly announced share repurchase program at a total cost of $1.5 million. Of this amount, we purchased 7,432 shares for $0.7 million, or $99.23 per share, to fund the rabbi trust for the outside director deferred stock compensation plan. The remaining 7,661 shares were purchased at a total cost of $0.8 million, or $98.20 per share, for the vesting of stock-based awards in conjunction with our long-term incentive plan. These shares were delivered in 2016.
6460_Fin.pdf 78 3/19/19 10:46 PM

79
Note 13. Accumulated Other Comprehensive Income (Loss) Changes in accumulated other comprehensive income ("AOCI") (loss) by component, including amounts reclassified to other comprehensive income ("OCI") (loss) and the related line item in the Statements of Operations where net income is presented, are as follows for the year ended December 31:
(in thousands) 2018 2017 2016
Before TaxIncome Tax (1) Net Before Tax
Income Tax (1) Net Before Tax
Income Tax (1) Net
Investment securities:AOCI, beginning of year $ 3,410 $ 716 $ 2,694 $ 3,954 $ 1,384 $ 2,570 $ 3,888 $ 1,361 $ 2,527OCI (loss) before reclassifications - pre TCJA (1) — — — (648) (227) (421) (385) (135) (250)OCI before reclassifications - post TCJA (1) (15,372) (3,228) (12,144) 1,162 243 919 — — —Realized investmentlosses (gains) 1,297 272 1,025 (1,240) (434) (806) 35 12 23Impairment losses 1,581 332 1,249 182 64 118 416 146 270Cumulative effect of adopting ASU 2016-01 (2) (85) (18) (67) — — — — — —OCI (loss) (12,579) (2,642) (9,937) (544) (354) (190) 66 23 43Reclassification adjustment (3) — — — — (314) 314 — — —AOCI, end of year $ (9,169) $ (1,926) $ (7,243) $ 3,410 $ 716 $ 2,694 $ 3,954 $ 1,384 $ 2,570
Pension and other postretirement plans:AOCI (loss), beginningof year $ (200,954) $ (42,201) $ (158,753) $ (190,695) $ (66,744) $ (123,951) $ (152,910) $ (53,519) $ (99,391)OCI (loss) beforereclassifications 31,401 6,594 24,807 (20,314) (7,111) (13,203) (46,244) (16,185) (30,059)Amortization of prior service costs (4) 1,353 284 1,069 871 306 565 695 243 452Amortization of net actuarial loss (4) 12,451 2,615 9,836 8,882 3,109 5,773 7,764 2,717 5,047Settlement loss (4) — — — 302 106 196 — — —Impact of change in tax rate (5) — — — — 1,436 (1,436) — — —OCI (loss) 45,205 9,493 35,712 (10,259) (2,154) (8,105) (37,785) (13,225) (24,560)Reclassification adjustment (3) — — — — 26,697 (26,697) — — —AOCI (loss), end of year $ (155,749) $ (32,708) $ (123,041) $ (200,954) $ (42,201) $ (158,753) $ (190,695) $ (66,744) $ (123,951)
TotalAOCI (loss), beginningof year $ (197,544) $ (41,485) $ (156,059) $ (186,741) $ (65,360) $ (121,381) $ (149,022) $ (52,158) $ (96,864)Investment securities (12,579) (2,642) (9,937) (544) (354) (190) 66 23 43Pension and otherpostretirement plans 45,205 9,493 35,712 (10,259) (2,154) (8,105) (37,785) (13,225) (24,560)OCI (loss) 32,626 6,851 25,775 (10,803) (2,508) (8,295) (37,719) (13,202) (24,517)Reclassification adjustment (3) — — — — 26,383 (26,383) — — —AOCI (loss), end of year $ (164,918) $ (34,634) $ (130,284) $ (197,544) $ (41,485) $ (156,059) $ (186,741) $ (65,360) $ (121,381)
(1) Deferred taxes related to unrealized gains and losses for the period from December 23, 2017 through December 31, 2018 were recognized at the 21% corporate rate following enactment of the TCJA. Prior to enactment, they were recognized at the 35% corporate rate.
(2) A reclassification of unrealized losses of equity securities from AOCI to retained earnings was required at January 1, 2018 due to the implementation of ASU 2016-01. See Note 2, "Significant Accounting Policies".
(3) A one-time adjustment was made in the fourth quarter of 2017 to reclassify stranded tax effects of the components of AOCI resulting from enactment of TCJA from AOCI to retained earnings, resulting in the ending AOCI balances now reflected at the 21% corporate rate, which represents the rate in which the amounts are expected to be settled. See Note 2, "Significant Accounting Policies".
(4) These components of accumulated other comprehensive income (loss) are included in the computation of net periodic pension cost. See Note 9, "Postretirement Benefits", for additional information.
(5) Deferred taxes related to the December 31, 2017 portion of the pension and other postretirement component recognized in AOCI of $10.3 million were recognized at the 21% corporate rate following the enactment of the TCJA.
6460_Fin.pdf 79 3/19/19 10:46 PM
80
Note 14. Related Party
Management feeA management fee is charged to the Exchange for services we provide under the subscriber's agreement with subscribers at the Exchange. The fee is a percentage of direct and assumed premiums written by the Exchange. This percentage rate is determined at least annually by our Board of Directors but cannot exceed 25%. The effective management fee rate charged the Exchange was 25% in 2018, 2017 and 2016. The Board of Directors elected to maintain the fee at 25% beginning January 1, 2019.
There is no provision in the subscriber's agreement for termination of our appointment as attorney-in-fact by the subscribers at the Exchange and the appointment is not affected by a policyholder's disability or incapacity.
Insurance holding company systemMost states have enacted legislation that regulates insurance holding company systems, defined as two or more affiliated persons, one or more of which is an insurer. The Exchange has the following wholly owned property and casualty subsidiaries: Erie Insurance Company, Erie Insurance Company of New York, Erie Insurance Property and Casualty Company and Flagship City Insurance Company, and a wholly owned life insurance company, Erie Family Life Insurance Company. Indemnity and the Exchange, and its wholly owned subsidiaries, meet the definition of an insurance holding company system.
All transactions within a holding company system affecting the member insurers of the holding company system must be fair and reasonable and any charges or fees for services performed must be reasonable. Approval by the applicable insurance commissioner is required prior to the consummation of transactions affecting the members within a holding company system.
Office leasesWe lease certain office space from the Exchange including the home office. On April 28, 2017, after securing approval from the Pennsylvania Insurance Department, a new home office lease was executed between the Exchange and Indemnity, which was retroactive to January 1, 2017, when the prior lease expired. Under the new lease, rent is based on rental rates of like property in Erie, Pennsylvania and all operating expenses including utilities, cleaning, repairs, real estate taxes, property insurance and leasehold improvements are the responsibility of the tenant (Indemnity). This lease agreement expires December 31, 2021. Under the previous lease, rents were determined considering returns on invested capital and included building operating and overhead costs. Rent costs and related operating expenses of shared facilities are allocated between Indemnity, Exchange and its subsidiaries based upon usage or square footage occupied. Rent expenses under the new lease totaled $6.2 million in 2018 and $6.3 million in 2017. Rent expense totaled $14.3 million in 2016, under the prior lease agreement, which included all operating expenses. Operating expenses totaled $14.5 million in 2018 and $13.1 million in 2017. The Exchange and its subsidiaries reimburse us for space used to perform administrative services. Reimbursements related to the use of this space totaled $4.7 million in 2018, $4.6 million in 2017 and $4.9 million in 2016. We also had a lease commitment with EFL for a field office until December 31, 2018. Annual rentals paid to EFL under this lease totaled $0.4 million in 2018, 2017 and 2016.
We previously owned three field offices for which rental costs of shared facilities were allocated based upon usage or square footage occupied. On December 31, 2018, we sold the three field offices to the Exchange. See Note 7, "Fixed Assets".
Notes receivable from EFLWe previously held a $25 million surplus note that was issued to us by EFL in 2003 and was payable on demand on or after December 31, 2018. On December 14, 2018, EFL, with the appropriate approval from the Pennsylvania Insurance Commissioner, satisfied its obligation and repaid the surplus note. The note bore an annual interest rate of 6.7% and EFL paid interest to us of $1.6 million in 2018, and $1.7 million in both 2017 and 2016.
Note 15. Concentrations of Credit Risk
Financial instruments could potentially expose us to concentrations of credit risk, including unsecured receivables from the Exchange. A large majority of our revenue and receivables are from the Exchange and its subsidiaries. See also Note 1, "Nature of Operations". Management fee amounts and other reimbursements due from the Exchange and its subsidiaries were $449.9 million and $418.3 million at December 31, 2018 and 2017, respectively.
6460_Fin.pdf 80 3/19/19 10:46 PM

81
Note 16. Commitments and Contingencies We have contractual commitments to invest up to $12.2 million related to our limited partnership investments at December 31, 2018. These commitments are split between private equity securities of $4.4 million, mezzanine debt securities of $7.5 million, and real estate activities of $0.3 million. These commitments will be funded as required by the limited partnership agreements.
We are involved in litigation arising in the ordinary course of conducting business. In accordance with current accounting standards for loss contingencies and based upon information currently known to us, we establish reserves for litigation when it is probable that a loss associated with a claim or proceeding has been incurred and the amount of the loss or range of loss can be reasonably estimated. When no amount within the range of loss is a better estimate than any other amount, we accrue the minimum amount of the estimable loss. To the extent that such litigation against us may have an exposure to a loss in excess of the amount we have accrued, we believe that such excess would not be material to our financial condition, results of operations, or cash flows. Legal fees are expensed as incurred. We believe that our accruals for legal proceedings are appropriate and, individually and in the aggregate, are not expected to be material to our financial condition, operations, or cash flows.
We review all litigation on an ongoing basis when making accrual and disclosure decisions. For certain legal proceedings, we cannot reasonably estimate losses or a range of loss, if any, particularly for proceedings that are in their early stages of development or where the plaintiffs seek indeterminate damages. Various factors, including, but not limited to, the outcome of potentially lengthy discovery and the resolution of important factual questions, may need to be determined before probability can be established or before a loss or range of loss can be reasonably estimated. If the loss contingency in question is not both probable and reasonably estimable, we do not establish an accrual and the matter will continue to be monitored for any developments that would make the loss contingency both probable and reasonably estimable. In the event that a legal proceeding results in a substantial judgment against, or settlement by, us, there can be no assurance that any resulting liability or financial commitment would not have a material adverse effect on our financial condition, results of operations, or cash flows.
6460_Fin.pdf 81 3/19/19 10:46 PM

82
Note 17. Supplementary Data on Cash Flows
A reconciliation of net income to net cash provided by operating activities as presented in the Statements of Cash Flows is as follows for the years ended December 31:
(in thousands) 2018 2017 2016
Cash flows from operating activities:Net income $ 288,224 $ 196,999 $210,366Adjustments to reconcile net income to net cash provided by operating activities:
Depreciation and amortization 13,368 14,831 15,095Deferred income tax (benefit) expense (1,358) 26,912 (2)Other income tax expense (1) — 10,095 —Realized losses (gains) and impairments on investments 3,591 (1,152) (256)Equity in losses (earnings) of limited partnerships 822 (2,801) (7,025)(Gain) loss on disposal of fixed assets (3,047) 98 59Net amortization of bond premium 5,601 7,038 7,436
Decrease in deferred compensation (3,886) (2,681) (4,561)Limited partnership distributions 7,173 5,128 17,837Increase in receivables from affiliates (30,804) (39,788) (30,485)Decrease (increase) in accrued investment income 1,590 (516) (846)Decrease (increase) in federal income taxes recoverable 21,738 (24,640) 6,687(Increase) decrease in prepaid pension (47,335) (27,265) 10,524Increase in prepaid expenses and other assets (727) (7,636) (4,674)Increase in accounts payable and accrued expenses 11,039 17,183 11,144Increase in commissions payable 13,449 17,565 15,017(Decrease) increase in accrued agent bonuses (19,066) 7,756 8,020Increase in contract liability 3,213 — —
Net cash provided by operating activities $ 263,585 $ 197,126 $254,336
(1) Other income tax expense for 2017 was impacted by the re-measurement of our deferred tax assets and liabilities due to the enactment of the TCJA on December 22, 2017, which reduced the corporate tax rate from 35% to 21% effective January 1, 2018.
6460_Fin.pdf 82 3/19/19 10:46 PM

83
Note 18. Quarterly Results of Operations (unaudited)
Year ended December 31, 2018
(in thousands, except per share data)First
quarterSecondquarter
Thirdquarter
Fourthquarter Year
Operating revenue (1) $ 572,160 $ 621,458 $ 612,126 $ 576,468 $ 2,382,212Operating expenses (1) 494,593 526,135 515,431 501,710 2,037,869Investment income 6,163 6,207 8,431 4,995 25,796Interest expense and other (income), net (2) 509 544 655 (2,889) (1,181)Income before income taxes 83,221 100,986 104,471 82,642 371,320Net income $ 65,758 $ 79,706 $ 80,446 $ 62,314 $ 288,224
Earnings per share (3)
Net income per shareClass A common stock – basic $ 1.41 $ 1.71 $ 1.73 $ 1.34 $ 6.19Class A common stock – diluted $ 1.26 $ 1.52 $ 1.54 $ 1.19 $ 5.51Class B common stock – basic and diluted $ 212 $ 257 $ 259 $ 201 $ 928
(1) In accordance with ASC 606, "Revenue from Contracts with Customers", effective January 1, 2018, we allocate our management fee between the two performance obligations we have in the subscriber's agreement, policy issuance and renewal services and administrative services. We also present expenses we incur and the related reimbursements we receive for administrative services gross in our Statement of Operations. See Note 2, "Significant Accounting Policies".
(2) The decrease in interest expense and other (income), net in the fourth quarter is driven by the $3.4 million gain recognized on the sale of the field offices we owned to Exchange. See Note 7, "Fixed Assets".
(3) The cumulative sum of quarterly basic and diluted net income per share amounts may not equal total basic and diluted net income per share for the year due to differences in weighted average shares and equivalent shares outstanding for each of the periods presented.
Year ended December 31, 2017
(in thousands, except per share data)First
quarter Second quarter
Third quarter
Fourth quarter Year
Operating revenue $ 399,316 $ 448,564 $ 442,492 $ 401,402 $ 1,691,774Operating expenses (1) 332,376 365,116 361,253 342,777 1,401,522Investment income (1) 6,589 6,451 8,418 7,134 28,592Interest expense and other, net (1) 575 664 792 1,118 3,149Income before income taxes 72,954 89,235 88,865 64,641 315,695Net income $ 47,876 $ 58,527 $ 58,543 $ 32,053 $ 196,999
Earnings per share (2)
Net income per shareClass A common stock – basic $ 1.03 $ 1.26 $ 1.26 $ 0.69 $ 4.23Class A common stock – diluted (3) $ 0.91 $ 1.12 $ 1.12 $ 0.61 $ 3.76Class B common stock – basic $ 154 $ 189 $ 189 $ 103 $ 635Class B common stock – diluted $ 154 $ 188 $ 189 $ 103 $ 634
(1) Amounts presented have been reclassified from previously reported amounts as a result of the adoption of ASU 2017-07, "Compensation-Retirement Benefits". See Note 2, "Significant Accounting Policies".
(2) The cumulative sum of quarterly basic and diluted net income per share amounts may not equal total basic and diluted net income per share for the year due to differences in weighted average shares and equivalent shares outstanding for each of the periods presented.
(3) Class A diluted earnings per share was reduced by $0.19 for the fourth quarter and total year as a result of increased income tax expense from enactment of the TCJA of $10.1 million. See Note 4, "Earnings Per Share" and Note 11, "Income Taxes".
Note 19. Subsequent Events No items were identified in this period subsequent to the financial statement date that required adjustment or additional disclosure.
6460_Fin.pdf 83 3/19/19 10:46 PM

84
ITEM 9. CHANGES IN AND DISAGREEMENTS WITH ACCOUNTANTS ON ACCOUNTING AND FINANCIAL DISCLOSURE
None.
ITEM 9A. CONTROLS AND PROCEDURES Evaluation of Disclosure Controls and ProceduresWe maintain disclosure controls and procedures designed to ensure that information required to be disclosed in our reports filed under the Securities Exchange Act of 1934, as amended, is recorded, processed, summarized and reported within the time periods specified in the Securities and Exchange Commission rules and forms, and that such information is accumulated and communicated to management, including our Chief Executive Officer and Chief Financial Officer, as appropriate, to allow for timely decisions regarding required disclosures. As required by the Securities and Exchange Commission Rule 13a-15(e), we carried out an evaluation, under the supervision and with the participation of management, including our Chief Executive Officer and Chief Financial Officer, of the effectiveness of the design and operation of our disclosure controls and procedures as of December 31, 2018. Based upon the foregoing, our Chief Executive Officer and Chief Financial Officer concluded that our disclosure controls and procedures were effective. Changes in Internal Control over Financial ReportingThere has been no change in our internal controls over financial reporting during our most recent fiscal quarter that has materially affected, or is reasonably likely to materially affect our internal controls over financial reporting. Upon adoption of the new revenue recognition guidance on January 1, 2018, we implemented changes to our processes related to revenue recognition and the related control activities. There were no significant changes to our internal control over financial reporting due to the adoption of this new standard. Our process for evaluating controls and procedures is continuous and encompasses constant improvement of the design and effectiveness of established controls and procedures. Management's Report on Internal Control over Financial ReportingManagement is responsible for establishing and maintaining adequate internal control over financial reporting of Erie Indemnity Company, as defined in Rules 13a-15(f) under the Exchange Act. Under the supervision and with the participation of our management, including our Chief Executive Officer and Chief Financial Officer, we conducted an evaluation of the effectiveness of the Erie Indemnity Company's internal control over financial reporting based upon the framework in the Internal Control-Integrated Framework issued in 2013 by the Committee of Sponsoring Organizations of the Treadway Commission. Based upon our evaluation under the framework in the Internal Control-Integrated Framework issued in 2013, management has concluded that Erie Indemnity Company's internal control over financial reporting was effective as of December 31, 2018.
/s/ Timothy G. NeCastro /s/ Gregory J. Gutting /s/ Julie M. Pelkowski
Timothy G. NeCastro Gregory J. Gutting Julie M. Pelkowski
President and Executive Vice President Senior Vice President
Chief Executive Officer and Chief Financial Officer and Controller
February 21, 2019 February 21, 2019 February 21, 2019
Our independent auditor, Ernst & Young LLP, a registered public accounting firm, has issued an attestation report on our internal control over financial reporting. This report appears on the following page.
ITEM 9B. OTHER INFORMATION There was no additional information in the fourth quarter of 2018 that has not already been filed in a Form 8-K.
6460_Fin.pdf 84 3/19/19 10:46 PM

85
Report of Independent Registered Public Accounting Firm
To the Board of Directors and Shareholders of Erie Indemnity Company
Opinion on Internal Control over Financial Reporting
We have audited Erie Indemnity Company's internal control over financial reporting as of December 31, 2018, based on criteria established in Internal Control-Integrated Framework issued by the Committee of Sponsoring Organizations of the Treadway Commission (2013 framework) (the COSO criteria). In our opinion, Erie Indemnity Company (the "Company") maintained, in all material respects, effective internal control over financial reporting as of December 31, 2018, based on the COSO criteria.
We also have audited, in accordance with the standards of the Public Company Accounting Oversight Board (United States) (PCAOB), the statements of financial position of the Company as of December 31, 2018 and 2017, and the related statements of operations, comprehensive income, shareholders' equity and cash flows for each of the three years in the period ended December 31, 2018, and the related notes (collectively referred to as the "financial statements") of the Company and our report dated February 21, 2019 expressed an unqualified opinion thereon.
Basis for Opinion
The Company's management is responsible for maintaining effective internal control over financial reporting and for its assessment of the effectiveness of internal control over financial reporting included in the accompanying Management's Report on Internal Control over Financial Reporting. Our responsibility is to express an opinion on the Company's internal control over financial reporting based on our audit. We are a public accounting firm registered with the PCAOB and are required to be independent with respect to the Company in accordance with the U.S. federal securities laws and the applicable rules and regulations of the Securities and Exchange Commission and the PCAOB.
We conducted our audit in accordance with the standards of the PCAOB. Those standards require that we plan and perform the audit to obtain reasonable assurance about whether effective internal control over financial reporting was maintained in all material respects.
Our audit included obtaining an understanding of internal control over financial reporting, assessing the risk that a material weakness exists, testing and evaluating the design and operating effectiveness of internal control based on the assessed risk, and performing such other procedures as we considered necessary in the circumstances. We believe that our audit provides a reasonable basis for our opinion.
Definition and Limitations of Internal Control Over Financial Reporting
A company's internal control over financial reporting is a process designed to provide reasonable assurance regarding the reliability of financial reporting and the preparation of financial statements for external purposes in accordance with generally accepted accounting principles. A company's internal control over financial reporting includes those policies and procedures that (1) pertain to the maintenance of records that, in reasonable detail, accurately and fairly reflect the transactions and dispositions of the assets of the company; (2) provide reasonable assurance that transactions are recorded as necessary to permit preparation of financial statements in accordance with generally accepted accounting principles, and that receipts and expenditures of the company are being made only in accordance with authorizations of management and directors of the company; and (3) provide reasonable assurance regarding prevention or timely detection of unauthorized acquisition, use, or disposition of the company's assets that could have a material effect on the financial statements.
Because of its inherent limitations, internal control over financial reporting may not prevent or detect misstatements. Also, projections of any evaluation of effectiveness to future periods are subject to the risk that controls may become inadequate because of changes in conditions, or that the degree of compliance with the policies or procedures may deteriorate. /s/ Ernst & Young LLP
Cleveland, OH February 21, 2019
6460_Fin.pdf 85 3/19/19 10:46 PM
86
PART III
ITEM 10. DIRECTORS, EXECUTIVE OFFICERS AND CORPORATE GOVERNANCE The information with respect to our outside directors, audit committee and audit committee financial experts and Section 16(a) beneficial ownership reporting compliance, is incorporated by reference to the information statement on Schedule 14(C) to be filed with the Securities and Exchange Commission no later than 120 days after December 31, 2018. We have adopted a Code of Conduct that applies to all of our outside directors, officers and employees. We have previously filed a copy of the Code of Conduct as Exhibit 14.3 to the Registrant's Form 10-K as filed with the Securities and Exchange Commission on February 25, 2016. In addition to this, we have adopted a Code of Ethics for Senior Financial Officers that also applies to our Chief Executive Officer, Chief Financial Officer, Chief Accounting Officer and any other person performing similar functions. We have previously filed a copy of the Code of Ethics for Senior Financial Officers as Exhibit 14.4 to the Registrant's Form 8-K as filed with the Securities and Exchange Commission on June 1, 2016. Our Code of Conduct and Code of Ethics for Senior Financial Officers are also available on our website at www.erieinsurance.com. Executive Officers of the Registrant
NameAge as of
12/31/2018 Principal Occupation and Positions for Past Five Years
President & Chief Executive Officer:
Timothy G. NeCastro 58 President and Chief Executive Officer since January 2017; ChiefExecutive Officer, August 2016 through December 2016; Presidentand Chief Executive Officer Designate, June 2016 through July2016; Senior Vice President, West Region, February 2010 throughJune 2016; Director, Erie Family Life Insurance Company ("EFL"),Erie Insurance Company ("EIC"), Flagship City Insurance Company("Flagship"), Erie Insurance Company of New York ("ENY") andErie Insurance Property & Casualty Company ("EPC").
Executive Vice Presidents:
Lorianne Feltz 49 Executive Vice President, Claims & Customer Service sinceNovember 2016; Senior Vice President, Customer Service, January2011 through November 2016.
Gregory J. Gutting 55 Executive Vice President and Chief Financial Officer since August2016; Interim Executive Vice President and Chief Financial Officer,October 2015 through July 2016; Senior Vice President andController, March 2009 through September 2015; Director, EFL,EIC, Flagship, ENY and EPC.
Robert C. Ingram, III 60 Executive Vice President and Chief Information Officer sinceAugust 2012; Director, EFL, EIC, Flagship, ENY and EPC.
Sean J. McLaughlin * 63 Executive Vice President and General Counsel since January 2016;Executive Vice President, Secretary and General Counsel,August 2013 through December 2015; Chief Judge, United StatesDistrict Court for the Western District of Pennsylvania, April 2013through August 2013; United States District Judge for the WesternDistrict of Pennsylvania, October 1994 through April 2013; Director,EFL, EIC, Flagship, ENY and EPC.
Douglas E. Smith 44 Executive Vice President, Sales & Products since November 2016;Senior Vice President, Personal Lines, November 2008 throughOctober 2016.
Dionne Wallace Oakley 51 Executive Vice President, Human Resources & Strategy sinceJanuary 2018; Senior Vice President, Human Resources, September2012 through December 2017.
* Retired effective December 31, 2018
6460_Fin.pdf 86 3/19/19 10:46 PM

87
ITEM 11. EXECUTIVE COMPENSATION The information required by this item with respect to executive compensation is incorporated by reference to the information statement on Schedule 14(C) to be filed with the Securities and Exchange Commission no later than 120 days after December 31, 2018.
ITEM 12. SECURITY OWNERSHIP OF CERTAIN BENEFICIAL OWNERS AND MANAGEMENT AND RELATED STOCKHOLDER MATTERS
The information with respect to security ownership of certain beneficial owners and management and securities authorized for issuance under equity compensation plans, is incorporated by reference to the information statement on Schedule 14(C) to be filed with the Securities and Exchange Commission no later than 120 days after December 31, 2018.
ITEM 13. CERTAIN RELATIONSHIPS AND RELATED TRANSACTIONS, AND DIRECTOR INDEPENDENCE
Information with respect to certain relationships with our outside directors is incorporated by reference to the information statement on Schedule 14(C) to be filed with the Securities and Exchange Commission no later than 120 days after December 31, 2018.
ITEM 14. PRINCIPAL ACCOUNTANT FEES AND SERVICES The information required by this item is incorporated by reference to the information statement on Schedule 14(C) to be filed with the Securities and Exchange Commission no later than 120 days after December 31, 2018.
6460_Fin.pdf 87 3/19/19 10:46 PM

88
PART IV
ITEM 15. EXHIBITS AND FINANCIAL STATEMENT SCHEDULES (a) The following documents are filed as part of this report:
1. Financial StatementsIncluded in Item 8 "Financial Statements and Supplementary Data" contained in this report.
Erie Indemnity Company:• Report of Independent Registered Public Accounting Firm on the Effectiveness of Internal Control over
Financial Reporting
• Report of Independent Registered Public Accounting Firm on the Financial Statements
• Statements of Operations for the three years ended December 31, 2018, 2017 and 2016
• Statements of Comprehensive Income for the three years ended December 31, 2018, 2017 and 2016
• Statements of Financial Position as of December 31, 2018 and 2017
• Statements of Shareholders' Equity for the three years ended December 31, 2018, 2017 and 2016
• Statements of Cash Flows for the three years ended December 31, 2018, 2017 and 2016
• Notes to Financial Statements
2. Financial Statement Schedules
All schedules are not required, not applicable, or the information is included in the financial statements or notes thereto.
Page3. Exhibit Index
ITEM 16. FORM 10-K SUMMARY None.
89
6460_Fin.pdf 88 3/19/19 10:46 PM

92
SIGNATURES
Pursuant to the requirements of Section 13 or 15(d) of the Securities Exchange Act of 1934, the Registrant has duly caused this report to be signed on its behalf by the undersigned, thereunto duly authorized.
February 21, 2019 ERIE INDEMNITY COMPANY
(Registrant)
By: /s/ Timothy G. NeCastro
Timothy G. NeCastro, President and CEO
(Principal Executive Officer)
Pursuant to the requirements of the Securities Exchange Act of 1934, this report has been signed below by the following persons on behalf of the Registrant and in the capacities and on the date indicated.
February 21, 2019 /s/ Timothy G. NeCastro
Timothy G. NeCastro, President and CEO
(Principal Executive Officer)
/s/ Gregory J. Gutting
Gregory J. Gutting, Executive Vice President and CFO
(Principal Financial Officer)
/s/ Julie M. Pelkowski
Julie M. Pelkowski, Senior Vice President and Controller
(Principal Accounting Officer)
Board of Directors:
/s/ J. Ralph Borneman, Jr. /s/ Brian A. Hudson, Sr.J. Ralph Borneman, Jr. Brian A. Hudson, Sr.
/s/ Eugene C. Connell /s/ Claude C. Lilly, III
Eugene C. Connell Claude C. Lilly, III
/s/ Salvatore Correnti /s/ George R. LucoreSalvatore Correnti George R. Lucore
/s/ LuAnn Datesh /s/ Thomas W. Palmer
LuAnn Datesh Thomas W. Palmer /s/ Jonathan Hirt Hagen /s/ Martin P. Sheffield
Jonathan Hirt Hagen Martin P. Sheffield /s/ Thomas B. Hagen /s/ Elizabeth Hirt Vorsheck
Thomas B. Hagen, Chairman Elizabeth Hirt Vorsheck /s/ C. Scott Hartz
C. Scott Hartz
6460_Fin.pdf 89 3/19/19 10:46 PM

[THIS PAGE INTENTIONALLY LEFT BLANK]
6460_Fin.pdf 90 3/19/19 10:46 PM

66460.indd 21 3/26/19 3:00 PM

GF405 3/19 © 2019 Erie Indemnity Company
Member • Erie Insurance Group
Home Office • 100 Erie Insurance Place on Perry Square • Erie, Pennsylvania 16530 814.870.2000 • erieinsurance.com • An Equal Opportunity Employer
66460.indd 22 3/26/19 3:00 PM