eric a. hanushek and ludger woessmann · nber working paper series do better schools lead to more...
TRANSCRIPT
NBER WORKING PAPER SERIES
DO BETTER SCHOOLS LEAD TO MORE GROWTH? COGNITIVE SKILLS, ECONOMICOUTCOMES, AND CAUSATION
Eric A. HanushekLudger Woessmann
Working Paper 14633http://www.nber.org/papers/w14633
NATIONAL BUREAU OF ECONOMIC RESEARCH1050 Massachusetts Avenue
Cambridge, MA 02138January 2009
We thank Mark Bils, Pete Klenow, and participants at seminars at Stanford University, the LondonSchool of Economics, and the Institute for International Economic Studies, Stockholm University. We are grateful to the International Association for the Evaluation of Educational Achievement (IEA)for providing us with the microdata for the FISS, SIMS, and SISS studies. Jason Grissom and TreyMiller provided important research assistance. Support has come from CESifo and the Packard HumanitiesInstitute. The views expressed herein are those of the author(s) and do not necessarily reflect the viewsof the National Bureau of Economic Research.
NBER working papers are circulated for discussion and comment purposes. They have not been peer-reviewed or been subject to the review by the NBER Board of Directors that accompanies officialNBER publications.
© 2009 by Eric A. Hanushek and Ludger Woessmann. All rights reserved. Short sections of text, notto exceed two paragraphs, may be quoted without explicit permission provided that full credit, including© notice, is given to the source.

Do Better Schools Lead to More Growth? Cognitive Skills, Economic Outcomes, and CausationEric A. Hanushek and Ludger WoessmannNBER Working Paper No. 14633January 2009JEL No. H4,I2,J3,J61,O1,O4
ABSTRACT
We provide evidence that the robust association between cognitive skills and economic growth reflectsa causal effect of cognitive skills and supports the economic benefits of effective school policy. Wedevelop a new common metric that allows tracking student achievement across countries, over time,and along the within-country distribution. Extensive sensitivity analyses of cross-country growth regressionsgenerate remarkably stable results across specifications, time periods, and country samples. In addressingcausality, we find, first, significant growth effects of cognitive skills when instrumented by institutionalfeatures of school systems. Second, home-country cognitive-skill levels strongly affect the earningsof immigrants on the U.S. labor market in a difference-in-differences model that compares home-educatedto U.S.-educated immigrants from the same country of origin. Third, countries that improved theircognitive skills over time experienced relative increases in their growth paths. From a policy perspective,the shares of basic literates and high performers have independent significant effects on growth thatare complementary to each other, and the high-performer effect is larger in poorer countries.
Eric A. HanushekHoover InstitutionStanford UniversityStanford, CA 94305-6010and [email protected]
Ludger WoessmannUniversity of MunichIfo Institute for Economic Research and CESifoPoschingerstr. 581679 Munich, [email protected]

1
Schooling and human capital investments have been a central focus of development policy,
but doubts have arisen as disappointments with results grow. Nowhere is this more apparent
than in the case of growth policy, where schooling investments have not appeared to return the
economic outcomes promised by theoretical growth models. While prior analyses have
investigated various issues in the specification of empirical cross-country growth models, a
warranted scepticism about the identification of causal effects remains. We argue that the most
significant problem with these analyses has been the valid measurement of skill differences
across countries and that, once remedied, a strong case can be made for identification of true
causal impacts in more elaborate econometric specifications.
As a simple summary observation, world policy attention today focuses on the lagging
fortunes of Sub-Saharan Africa and of Latin America. Considerably less attention goes to East
Asia, and, if anything, East Asia is proposed as a role model for the lagging regions. Yet to
somebody contemplating development policy in the 1960s, none of this would be so obvious.
Latin America had average income exceeding that in Sub-Saharan Africa and the Middle East
and North Africa regions, and both of these exceeded East Asia (see Appendix Table A1).1
Further, Latin America had schooling levels that exceeded those in the others, which were
roughly equal. Thus, on the basis of observed human capital investments, one might have
expected Latin America to pull even farther ahead while having no strong priors on the other
regions. The unmistakable failure of such expectations, coupled with a similar set of
observations for separate countries in the regions, suggests scepticism about using human capital
policies to foster development. But, this scepticism appears to be more an outgrowth of
imperfect measurement of human capital investments than an empirical reality.
The measurement issues become apparent when we introduce direct measures of cognitive
skills from international tests of math and science into the growth picture. The entire picture
changes. Figure 1 plots regional growth in real per capita GDP between 1960 and 2000 against
average test scores after conditioning on initial GDP per capita in 1960.2 Regional annual
1 Japan was significantly ahead of the rest of the East Asia region, but its exclusion does not change the regional ordering (see Appendix Table A1). 2 Regional data come from averaging all countries with available data in a region. The 50 countries are not chosen to be representative but instead represent the universe of countries that participated in international tests and had available the requisite economic data. Still, Appendix A shows that the average 1960 incomes for all countries in each region are quite similar to those for our subset of countries. The division of Europe into three regions illustrates the heterogeneity within OECD countries, but a combined Europe also falls on the line in Figure 1.

2
growth rates, which vary from 1.4 percent in Sub-Saharan Africa to 4.5 percent in East Asia, fall
on a straight line with an R2=0.985. But, school attainment, when added to this regression, is
unrelated to growth-rate differences. Conditional on initial income levels, regional growth over
the last four decades is completely described by differences in cognitive skills!
This paper builds on the motivation of Figure 1 to describe the importance of cognitive skills
in explaining growth rates across nations. Using a new series of cognitive skills for 50 countries
(Section III), we show that this relationship is extraordinarily robust to a variety of samples
across different time periods and sets of countries and across different specifications of the skills
measure and the growth relationship (Section IV).
We move from the stylized facts of the strong relationship between cognitive skills and
growth to the question of whether this reflects a causal relationship that can support direct policy
actions. Because of the limited data and multiplicity of factors affecting observed international
economic outcomes, little headway has been made in clarifying the underlying causal structure
of growth. Perhaps the strongest evidence has related to the importance of fundamental
economic institutions using identification through historical factors (Acemoglu, Johnson, and
Robinson (2001)), but this has not yielded clear advice about the kinds of feasible policies that
will lead to national payoffs.
We attack this question from a number of angles and conclude that there is strong evidence
that the influence of cognitive skills described in Figure 1 is indeed a causal one. Each of our
individual approaches to the issue addresses a different set of the potential concerns about
causation. While each may not be individually conclusive – not least because data limitations set
clear limits for analyses identified by cross-country variation – the set of consistent findings
provides much more persuasive evidence on the issue.
A related aspect of these separate causal investigations is the pinpointing of a specific policy
role for improved school quality. While variations in cognitive skills can arise from various
influences – families, culture, health, and ability – we provide evidence that schools are one
avenue for improvement available to policy makers.
The causal investigation begins by instrumenting our test-score measures by characteristics
of the school systems in the countries (Section V). This approach provides information on how
variations in student outcomes that are related to institutional policies affect growth and strongly
supports the potential for school policies to affect economic growth.

3
The aggregate instruments of institutional features could still be correlated with other
features of economies such as cultural variations, health differences, or country-specific
efficiency differences found both in the economy and in the organization of schools. Therefore,
we develop two approaches in the spirit of a difference-in-differences analysis that separately
factor out different potential threats to the identification of the impacts of cognitive skills.
The first difference-in-differences approach focuses on U.S. labor-market outcomes for
immigrants (Section VI). We consider whether schooling-based cognitive-skill differences
between immigrants educated at home and educated in the U.S. are related to how well a
country’s immigrants will do economically, holding constant cultural and other differences by
country-of-origin fixed effects. Because we consider earnings in a single economy, country
differences in basic economic institutions, the structure of industry, and the like are held
constant, permitting clearer identification of the economic returns to cognitive skills. The results
show clearly that aggregate country differences in cognitive skills directly affect individual
wages of immigrants – but only if they received their schooling in their home country.
The second difference-in-differences approach, using the intertemporal dimension of our
newly devised database, ignores variations in levels of student achievement across countries
altogether and investigates whether countries that have improved their cognitive skills have seen
commensurate increases in their growth rates (Section VII). This analysis shows a close
association between secular improvement in cognitive skills and increases in growth rates over
time across OECD countries. Countries that have improved the cognitive skills of their
population have seen rewards through improved growth rates.
A final issue is that average test scores do not adequately reflect the range of policy options.
Specifically, one could institute policies chiefly directed to the lower end of the cognitive
distribution, such as the Education for All initiative, or one could aim more at the top end, such
as the focused technological colleges of India. We investigate the impact on growth of a
concentration on either end of the achievement distribution along with how these might interact
with the nation’s technology, enabled by the within-country-distribution dimension of our new
database (Section VII). We find improving both ends of the distribution to be beneficial and
both increasing basic literacy and advancing the best students to be complementary. Finally, the
importance of a cadre of highly skilled individuals is even more important in developing
countries that have scope for imitation than in developed countries that are innovating.

4
In sum, the simple premise that improving the schools can produce benefits in national
growth rates is strongly supported.
I. Existing Literature on Schooling and Growth
Recent interest in economic growth has led to an upsurge of empirical analyses of why some
nations grow faster than others. The standard method for establishing the effect of education on
economic growth is to estimate cross-country growth regressions where countries’ average
annual growth in gross domestic product (GDP) per capita over several decades is expressed as a
function of measures of schooling and a set of other variables deemed to be important for
economic growth. Following the seminal contributions by Barro (1991, 1997) and Mankiw,
Romer, and Weil (1992), a vast literature of cross-country growth regressions, mostly using the
important internationally comparable data on average years of schooling provided by Barro and
Lee (1993) as the proxy for the human capital of an economy, has tended to find a significant
positive association between quantitative measures of schooling and economic growth.3 Various
branches of subsequent work have attempted to distinguish among alternative mechanisms
behind this association and have delved into measurement and specification issues – while
generally supporting a role for schooling in determining growth.4
But, using average years of schooling as the education measure in cross-country analyses
implicitly assumes that a year of schooling delivers the same increase in knowledge and skills
regardless of the education system. For example, a year of schooling in Peru is assumed to
create the same increase in productive human capital as a year of schooling in Japan. Equally as
important, this measure assumes that formal schooling is the primary source of education and
that variations in the quality of nonschool factors have a negligible effect on education outcomes.
3 For extensive reviews of the literature, see Topel (1999), Krueger and Lindahl (2001), and Pritchett (2006). The robustness of the association is highlighted by the extensive analysis by Sala-i-Martin, Doppelhofer, and Miller (2004): Of 67 explanatory variables in growth regressions on a sample of 88 countries, primary schooling turns out to be the most robust influence factor (after an East Asian dummy) on growth in GDP per capita in 1960-1996. 4 Hanushek and Woessmann (2008) discuss the alternative branches and their findings. These investigations are driven by varying, and contradictory, theoretical models about different mechanisms through which education may affect economic growth. First, education may increase the human capital of the labor force, which in turn increases labor productivity (as in augmented neoclassical growth theories; see, for example, Mankiw, Romer, and Weil (1992)). Second, education may increase the innovative capacity of the economy (as in theories of endogenous growth; see, for example, Lucas (1988), Romer (1990), Aghion and Howitt (1998)). Third, education may facilitate the diffusion and transmission of knowledge needed to implement new technologies (see, for example, Nelson and Phelps (1966), Welch (1970), Benhabib and Spiegel (2005)). Jamison, Jamison, and Hanushek (2007) provide some suggestive tests among these alternatives, and our estimates below relate to the predictions of the different models.
5
An alternative perspective, developed over the past ten years, concentrates directly on
cognitive skills. This work, which forms the foundation for our current analysis, fundamentally
alters the assessment of the role of education in the process of economic development. When
using the data from the international student achievement tests through 1991 to build a measure
of cognitive skills, Hanushek and Kimko (2000) find a statistically and economically significant
positive effect of cognitive skills on economic growth in 1960-1990 that dwarfs the association
between years of schooling and growth. Their estimates stem from a statistical model that relates
annual growth rates of real GDP per capita to the measure of cognitive skills, years of schooling,
the initial level of income, and a variety of other control variables. They find that adding
cognitive skills to a base specification including only initial income and years of schooling
boosts the variance in GDP per capita among the 31 countries in their sample that can be
explained by the model from 33 to 73 percent. At the same time, the effect of years of schooling
is greatly reduced by including cognitive skills, leaving it mostly insignificant, while adding
other factors leaves the effects of cognitive skills basically unchanged. The general pattern of
results is duplicated by a series of other studies that pursue different tests and specifications
along with different variations of skills measurement.5
However, the extent to which the associations found in these studies can be interpreted as a
causal effect of cognitive skills remains unclear. Questions about the identification of underlying
causal effects in cross-country growth models have existed for a long time. Beginning with the
analysis of Levine and Renelt (1992), evidence of the sensitivity of results to model specification
has been plentiful. In terms of schooling, Bils and Klenow (2000) provide convincing evidence
of the endogeneity of school attainment in growth models. Further, it is unclear to what extent
prior attempts to deal with endogeneity such as the panel data approaches of Barro (1997) or
Vandenbussche, Aghion, and Meghir (2006) have been successful in a setting where the
dominant information is in the cross-country variation.6
II. A Simple Growth Model with Cognitive Skills
We begin with a very simple growth model: a country’s growth rate (g) is a function of the
skills of workers (H) and other factors (X) that include initial levels of income and technology,
5 Detailed discussion of the innovations and findings of past work is available in Hanushek and Woessmann (2008). 6 Aghion, Boustan, Hoxby, and Vandenbussche (2005) approach causality by relying on within-country variation.

6
economic institutions, and other systematic factors. Skills are frequently referred to simply as
the workers’ human capital stock. For simplicity in equation (1), we assume that H is a one-
dimensional index and that growth rates are linear in these inputs, although these are not
important for our purposes.7
(1) g H Xγ β ε= + +
It is useful at this stage to understand where the skills (H) might come from. As discussed in
the extensive educational production function literature (Hanushek (2002)), these skills are
affected by a range of factors including family inputs (F), the quantity and quality of inputs
provided by schools (qS), individual ability (A), and other relevant factors (Z) which include
labor market experience, health, and so forth as in:
(2) ( )H F qS A Zλ φ η α ν= + + + +
The schooling term combines school attainment (S) and its quality (q).
Human capital is nonetheless a latent variable that is not directly observed. To be useful and
verifiable, it is necessary to specify the measurement of H. The vast majority of existing
theoretical and empirical work on growth begins – frequently without discussion – by taking the
quantity of schooling of workers (S) as a direct measure of H.
We concentrate on the cognitive skills component of human capital and consider measuring
H with test-score measures of mathematics, science, and reading achievement. The use of
measures of cognitive skills has a number of potential advantages. First, they capture variations
in the knowledge and ability that schools strive to produce and thus relate the putative outputs of
schooling to subsequent economic success. Second, by emphasizing total outcomes of
education, they incorporate skills from any source – families, schools, and ability. Third, by
allowing for differences in performance among students with differing quality of schooling (but
possibly the same quantity of schooling), they open the investigation of the importance of
different policies designed to affect the quality aspects of schools.
At the same time, recent work has introduced the possibility that noncognitive skills also
enter into economic outcomes, but we do not separately identify the effects of noncognitive skills
7 The form of this relationship has been the subject of considerable debate and controversy. As we write it, it is consistent with a basic endogenous growth model. We generally keep this formulation, in part because we cannot adequately distinguish among alternative forms.

7
below.8 Because evidence suggests that cognitive and noncognitive skills are correlated and are
both affected by school factors, our evidence is interpreted as the effects of cognitive skills
including their correlated components with noncognitive skills.
III. Consistent International Measures of Cognitive Skills
This analysis starts with the development of new measures of international differences of
cognitive skills. The measures developed here extend those developed in Hanushek and Kimko
(2000) to add new international tests, more countries, and intertemporal and within-country
dimensions, while dealing with a set of problems that remained with the early calculations.
Between 1964 and 2003, twelve different international tests of math, science, or reading were
administered to a voluntarily participating group of countries (see Appendix Table B2). These
include 36 different possible scores for year-age-test combinations (e.g., science for students of
grade 8 in 1972 as part of the First International Science Study or math of 15-year-olds in 2000
as a part of the Programme on International Student Assessment). Only the United States
participated in all possible tests.
The assessments are designed to identify a common set of expected skills, which were then
tested in the local language. It is easier to do this in math and science than in reading, and a
majority of the international testing has focused on math and science. Each test is newly
constructed, usually with no effort to link to any of the other tests.
We wish to construct consistent measures at the national level that will allow comparing, say,
math performance of 13-year-olds in 1972 to that in 2003. This would permit us to compare
performance across countries, even when they did not each participate in a common assessment,
as well as track performance over time. It would also provide the ability to aggregate scores
across different ages, years, and even subjects as appropriate. The details of this construction
along with the final data are found in Appendix B. Here we simply sketch the methodology.
Test-Score Levels across Assessments. Comparisons of the difficulty of tests across time are
readily possible because the United States has participated in all assessments and because there is
external information on the absolute level of performance of U.S. students of different ages and
8 See importantly Bowles, Gintis, and Osborne (2001), Heckman, Stixrud, and Urzua (2006), and Cunha, Heckman, Lochner, and Masterov (2006). Hanushek and Woessmann (2008) integrate noncognitive skills into the interpretation of general models such as above and show how this affects the interpretation of the parameter on school attainment and other estimates.

8
across subjects. The United States began consistent testing of a random sample of students
around 1970 under the National Assessment of Educational Progress (NAEP). By using the
pattern of NAEP scores for the U.S. over time, it is possible to equate the U.S. performance
across each of the international tests.
Test-Score Variance across Assessments. The comparison of performance of other countries
to the U.S. requires a distance metric for each test. Each assessment has varying country
participation and has different test construction so that the variance of scores for each assessment
cannot be assumed to be constant. Our approach is built on the observed variations of country
means for a group of countries that have well developed and relatively stable educational
systems over the time period.9 We create the “OECD Standardization Group” (OSG) by using
the thirteen OECD countries that had half or more of the relevant population attaining a
secondary education in the 1960s (the time of the first tests). For each assessment, we then
calibrate the variance in country mean scores for the subset of the OSG participating to the
variance observed on the PISA tests in 2000 (when all countries of the OSG participate). The
identifying assumption of this approach is that the variance in the mean performance among a
group of relatively stable education systems does not change substantially over time.
By combining the adjustments in levels (based on the U.S. NAEP scores) and the adjustment
in variances (based on the OECD Standardization Group), we can directly calculate standardized
scores for all countries on all assessments. Each age group and subject is normalized to the PISA
standard of mean 500 and individual standard deviation of 100 across OECD countries. We can
then aggregate scores across time, ages, and subjects as we desire.
IV. Stylized Facts about Cognitive Skills and Growth
The basic growth model in equation (1) is estimated for the 50 countries with cognitive-skill
and economic data over the period 1960-2000.10 Cognitive skills are measured by the simple
average of all observed math and science scores between 1964 and 2003 for each country.
9 The development of aggregate scores by Hanushek and Kimko (2000) and by Barro (2001) assumed that the test variances across assessments were constant, but there is no reason for this to be the case. Our approach is in the spirit of Gundlach, Woessmann, and Gmelin (2001). 10 See Appendix B for details on the country sample. The source of the income data is version 6.1 of the Penn World Tables (cf. Heston, Summers, and Aten (2002)). The data on years of schooling are an extended version of the Cohen and Soto (2007) data. Descriptive statistics are found in Appendix Table C1.

9
As a comparison to prior cross-country analyses, the first column of Table 1 presents
estimates of a simple growth model with school attainment.11 While this model explains one-
quarter of the variance in growth rates, adding cognitive skills increases this to three-quarters of
the variance. The test score is strongly significant with a magnitude that is unchanged by
excluding school attainment (col. 2), including initial attainment in 1960 (col. 3), or including
average attainment over the period (col. 4). School attainment is never statistically significant in
the presence of the direct cognitive-skill measure of human capital.
One standard deviation in test scores (measured at the OECD student level) is associated with
a two percentage points higher average annual growth rate in GDP per capita across 40 years.
The remaining columns of Table 1 provide alternative perspectives on these basic results.
Estimating the model with regression techniques robust to outliers yields virtually identical
coefficient estimates to those including Nigeria and Botswana, the two significant outliers
countries in the growth equation (col. 5).12 Because the robust model assigns essentially zero
weight to these two observations, they are dropped from the remaining models. Including fixed
effects for the eight world regions depicted in Figure 1 (so that none of the between-region
variation in test scores is used in the estimation) reduces the estimated test effect to 1.666 (col.
6). Adding institutional differences for openness of the economy and security of property rights
(col. 7) and for these plus fertility rates and location in the tropics (col. 8) does reduce the
estimated test-score effect to around 1.25,13 but the effect remains strongly statistically
significant. The stock of physical capital per adult in 1960 does not enter the basic growth model
significantly and does not affect the test-score coefficient.
While the estimated effect of test scores varies some across these different specifications, the
cognitive-skill coefficients are always very significant and the variation is quite limited: A move
of one standard deviation of individual student performance translates into 1.2-2.0 percentage
points difference in annual growth rates, other things equal. How much is one standard deviation
in performance? The difference between the U.S. average and the top performers on the PISA
11 While not the focal point of this analysis, all specifications include GDP per capita in 1960, which provides consistent evidence for conditional convergence, i.e., countries with higher initial income tend to grow more slowly. 12 The specific robust regression technique reported is Stata’s rreg command, which eliminates gross outliers with Cook’s distance measure greater than one and iteratively downweights observations with large absolute residuals. The OLS estimate of the test effect in the 52-country sample is 1.752 (t-statistic 5.75). Nigeria and Botswana each participated only in a single international test. 13 While openness and security of property rights enter the model (jointly) significantly, fertility and tropical location do not.
10
tests is approximately 0.4 standard deviations, while the difference between the average Mexican
student and the rest of the OECD was approximately one standard deviation.
Two important questions that relate to interpretation arise, and we consider a wide range of
alternative specifications that demonstrate the stability of the estimates. The first set of issues is
whether the sample of countries or years of observation heavily influences the results. The
second is whether the specific measure of cognitive skills drives the estimates.
Table 2 provides the matrix of estimated cognitive-skill coefficients across different samples
of observations. The columns consider sample sensitivity and concentrate on whether the overall
results are driven by specific subsets of countries, which might indicate that the cognitive-skill
measures simply proxy for other facets of the economies. The two rows consider basic
sensitivity to test measurement, because the measurement may interact with the sample
sensitivity. The top row focuses on the average of all observed math and science scores – as
presented previously – while the second includes just lower-secondary-school scores. Each entry
comes from a separate regression that includes GDP per capita in 1960 and school attainment.
The first two comparisons (col. 2-3 and col. 4-5) present evidence on whether cognitive skills
are more or less important in developed countries. The first comparison divides the estimation
into the 23 OECD countries and 27 non-OECD countries, while the second comparison divides
countries into above and below the median level of per-capita GDP in 1960. The statistically
significant difference of high-income and lower (below median)-income countries indicates that
developing countries are somewhat more affected by cognitive skills than developed countries.14
Nonetheless, variations in math and science skills remain very important in distinguishing among
growth rates of the developed countries.
A portion of the influence of cognitive skills comes from the high growth of East Asian
countries. As shown in column 6, excluding the ten East Asian countries lowers the estimated
impact of math and science skills to 1.3, but it remains highly significant in the remaining
countries. In other words, the overall estimates, while influenced by the East Asian growth
experience, are not simply identifying the high growth – high test-score position of East Asia,
which would raise the possibility that the growth relationships might be driven by other factors
that were simply correlated with East Asian test performance if true.
14 While not shown, the school attainment measures are insignificantly related to growth even among the developing countries where the levels are low and where there is considerable cross-country variance.

11
The growth estimates are meant to identify long-run factors, but the sample period of 1960-
2000 includes subperiods of world stagnation, fast growth, and currency crises. Some have
suggested, for example, that the observed growth rates are dominated by the early-period growth
explosion of East Asia and that this changed considerably with the currency crises of the 1990s
(Ramirez, Luo, Schofer, and Meyer (2006)). Our results (col. 7 and 8) indicate, however, a
consistent impact of cognitive skills across the period that, if anything, has grown stronger in the
second half of our observations. Indeed, the estimated impact doubles in the most recent period,
consistent with various arguments that, at least for the U.S. and OECD countries, the importance
of skills has increased (Murnane, Willett, and Levy (1995), Katz and Autor (1999), and Goldin
and Katz (2008)). The same impact on 1980-2000 growth is found when restricting the test
scores to measures obtained before 1985 (available for only 22 countries), so that test scores
nearly fully pre-date the growth period (col. 9).
Finally, the level of schooling and cognitive scores are correlated across our sample (r=0.62),
in part because of the differences between developed and developing countries. The separation
of the impact of cognitive skills from that of school attainment in our estimation relies upon
information where these two diverge, and it might be a peculiar set of countries in terms of
growth where the pattern of school attainment and skills varies most. The final two columns
divide countries based on deviations of cognitive scores from school attainment. Specifically,
the “score-schooling outliers” are the 25 countries with the largest residuals when test scores are
regressed on attainment, and the “score-schooling core” are the 25 with the smallest residuals.
Interestingly, the relationship between cognitive skills and growth is virtually the same across
these two samples, making it clear that the results are not driven by “peculiar” countries in the
production of cognitive skills.
The preceding results hold looking across columns, but the pattern also obtains for the
alternative measures of test scores. The estimated coefficients using only lower-secondary-
school math and science scores are systematically a little smaller than those from all scores,
which may reflect attenuation bias when using fewer test observations in the construction of the
cognitive-skill measure, but there are no changes in patterns across any of the columnar
comparisons. This test-score measure excludes any test in primary schooling or in the final year
of secondary education. Test scores at the end of the secondary level, which combine the
knowledge accumulated over primary and secondary schooling, may be most relevant for the

12
labor force, but, at the same time, the duration of secondary education differs across countries, so
that tests performed in the final year of secondary schooling may not be as readily comparable
across countries. Further, given differing school completion rates, tests in the final year of
secondary schooling may produce samples with differential selectivity of test takers. Yet neither
the primary-school tests nor the tests in the final secondary year are crucial for the results.
Table 3 provides more detail on sensitivity to the measure of cognitive skills, comparing
several additional plausible alternatives for the aggregation of scores, including using math,
science, and reading scores separately. We also provide breakdowns by OECD and non-OECD
countries, although this breakdown makes little qualitative difference and we concentrate on the
variations in aggregate test information found in the table rows.
Results are qualitatively the same when using only scores on tests performed since 1995 (row
A). These recent tests have not been used in previously available analyses and are generally
viewed as having the highest standard of sampling and quality control. Likewise, results are
robust to using tests scores since 1995 for just lower secondary grades (row B).
A drawback of using only the more recent tests is that such an approach requires a strong
version of the assumption that test performance is reasonably constant over time, because it
relates test performance measured since 1995 to the economic data for 1960-2000. To make sure
that higher previous economic growth is not driving the measured test performance, the test-
score measure used in row C disregards all tests since the late 1990s. Our results turn out to be
robust, with a point estimate on the test-score variable that is significantly higher (sample
reduced to 34 countries). Our results are also robust to using the average early test scores as an
instrument for the average of all test scores in a two-stage least-squares regression, in order to
utilize only that part of the total test-score measure that can be traced back to the early test scores
(row D). In sum, the results are not driven by either early or late test scores alone.
The remainder of the table investigates different combinations of the math, science, and
reading tests. While we were concerned about the reliability of the reading tests and thus have
focused on math and science, the use of reading tests provides similar results in the growth
models (rows E-G). In a specification that enters the different subjects together (panel H), the
three are always jointly significant at the 1% level and higher, even though the science effect
gets smaller and the reading effect loses significance in the joint model.
13
V. Variations in Cognitive Skills Driven by Schools: Instrumental Variable Models
The main subject of this paper is that the stylized facts from cross-sectional growth
regressions using existing variation across countries may be hampered by endogeneity biases.
Endogeneity of cognitive skills could arise because nations with conditions favorable to
economic growth and performance also produce high test performance. This correlation could
arise because of cultural factors, historically good economic institutions, variations in health
status, or any other set of factors that lead to strong economic performance might also be
systematically related to high cognitive skills. Indeed, it does not matter whether such
relationships are causal or purely associational. If these factors are omitted from the growth
estimation, they will tend to bias the coefficient on cognitive skills. Likewise, there might be
reverse causality if economic growth facilitates investments in the school system or increases
family resources that improve cognitive skills.
Even if the cognitive skills-growth relationship is causal, it is further important to remember
that cognitive skills are likely to depend not only on formal schooling but also on non-school
factors such as families, peers, and ability. Therefore, the results presented so far would only be
relevant for school policy if the variation in cognitive skills emanating from school policies is in
fact related to economic growth.
One means of addressing the set of issues is to use measures of the institutional structure of
the school systems as instruments for the cognitive-skill measure, thereby using only that part of
the international variation in cognitive skills that can be traced back to international differences
in school systems. We use several institutional features – notably the existence of external exit
exam systems, the share of privately operated schools, and the centralization of decision-making
– that have been shown in the literature on international educational production to be associated
with student achievement (see Woessmann (2007a) for a review).
While other school policies such as those surrounding educational spending may well be
endogenous to the growth process, these institutional features can be assumed uncorrelated with
the regression disturbances of our models. First, many institutional features such as the existence
and extent of private schooling reflect long standing polices embedded in constitutions and law
and thus are not outcomes of the growth process per se (see, for example, the review of private
schooling across countries in Glenn and De Groof (2002)). Second, while there have been some
14
trends in these institutions – such as the slow movement toward decentralizing school decision-
making – there is no suggestion that this reflects either growth or other systematic differences in
cultural and economic systems.15 Third, there is empirical support from the literature on
educational production that these institutional effects on student learning are robust to including
regional fixed effects in cross-country analyses, to within-country analyses, and to the use of
historical instruments (see Woessmann (2003b, 2007b), West and Woessmann (2008)). These
results suggest that institutional impacts are not driven by cultural differences and do not suffer
directly from reverse causality.
External exit exam systems are a devise to increase accountability in the school system that
has been repeatedly shown to be related to better student achievement (see Bishop (2006) for a
review).16 The first specification reported in Table 4 uses the share of students in a country who
are subject to external exit exams as an instrument for our measure of cognitive skills in the
growth regression. The first-stage results confirm a statistically significant association between
external exit exams and cognitive skills. The effect of cognitive skills on economic growth in
the second stage of the instrumental variable (IV) estimation is statistically significant and close
to the OLS estimate.17 The rule of thumb of a first stage F-statistic greater than 10 suggested by
Stock, Wright, and Yogo (2002), however, indicates the possibility of a weak instrument
problem. Instruments that are only weakly correlated with the endogenous explanatory variable
render standard IV estimators biased in small samples and may compromise the reliability of the
conventional asymptotic approximations used for hypothesis testing. Thus, we also report
estimates based on the modification of the limited information maximum likelihood (LIML)
estimator by Fuller (1977), but the results are hardly affected.18
Because years of schooling are insignificant in the growth model once test scores are
controlled for (both in the OLS and in the IV specification), another possibility is to include
15 Glenn and De Groof (2002), p. 267, note that “there has been in most Western democracies a slow but very marked shift in the allocation of responsibility for the organization and control of education, in the public as well as the nonpublic education sector, through decentralization of various aspects of decision-making to the local school community.” The cross-country details suggest no obvious political or cultural differences in these trends. 16 Data on external exit exams are available for 43 countries in Woessmann, Lüdemann, Schütz, and West (forthcoming), who update Bishop (2006)’s collection from reviews of comparative-education studies, educational encyclopedia, government documents, background papers, and interviews with national representatives. 17 The Durbin-Wu-Hausman test does not reject the exogeneity of cognitive skills at conventional levels. 18 Fuller’s modification of the LIML estimator is more robust than 2SLS in the presence of weak instruments and performs relatively well in the simulations by Hahn, Hausman, and Kuersteiner (2004). We set the user-specified constant (Fuller (1977)’s alpha) to a value of one, but our results are hardly affected if we set alpha to four.

15
years of schooling as a second instrument for test scores. Specification (2) of Table 4 reveals
that years of schooling are significantly associated with test scores in the first stage, and the first-
stage F-statistic now is just above 10. The Sargan test does not reject the overidentification
restrictions of the model, suggesting that, if having an external exit exam is a valid instrument,
years of schooling is also valid. Both the 2SLS and the Fuller estimates confirm that schooling-
induced differences in cognitive skills are significantly related to economic growth.
School choice, as measured by the share of privately operated schools in a system,
consistently shows a positive association with student achievement in OECD countries (see the
review in Woessmann, Lüdemann, Schütz, and West (forthcoming), along with West and
Woessmann (2008)) and provides an additional instrument. In our sample, the share of private
enrollment in a country is significantly positively associated with cognitive skills in the first
stage of our IV model (specification (3) of Table 4).19 The second-stage estimate of the growth
model confirms our previous results – schooling-induced differences in cognitive skills are
significantly related to economic growth. Again, the Sargan test does not reject the validity of
the overidentification restrictions, and the Durbin-Wu-Hausman test presents no evidence of
endogeneity of the cognitive-skill measure.20
A final institutional feature regularly shown to be positively associated with student
achievement is the extent to which schools (or at least local decision-makers) are autonomous to
make their own decisions about the organization of instruction (see Woessmann (2003a)).
Specification (4) of Table 4 shows that the share of decisions on the organization of instruction
that are made at the central government level is significantly negatively associated with our
cognitive-skill measure, and the 2SLS and Fuller estimators confirm the significantly positive
effect of cognitive skills on economic growth.21
19 The data on private enrollment as percentage of total enrollment in general secondary education are from UNESCO (1998) and refer to 1985, the earliest year with consistent data. For greater consistency of the time spans, the dependent variable in this specification is economic growth in 1980-2000; results are robust to using growth in 1960-2000. Given that the results from the educational production literature mostly refer to the sample of OECD countries, we restrict the analysis to the OECD sample, for which 19 observations are available. 20 Results are very similar without years of schooling as a second instrument, but the first-stage F-statistic is 4.62. 21 Data on the percentage of decisions on the organization of instruction in public lower secondary education taken at the central level of government are available in Organisation for Economic Co-operation and Development (1998), available only for 1998. The IV results are very similar without using years of schooling as a second instrument, with a first-stage F-statistic of 6.18. In this specification, the estimated growth effect is even larger than the OLS estimate, a result consistent with downward bias in the OLS estimate due to measurement error in the cognitive-skill measure. Alternatively, the exclusion restrictions for this instrument may be questionable given the weakness of this instrument; note that the Fuller estimate is already closer to the OLS estimate in this model.

16
The results suggest that cognitive skills generated in the school system lead to higher long-
run growth of economies. There are obvious limits of cross-country regressions with small data
samples, and these are particularly salient in IV specifications. Nonetheless, the results using
several institutional features of the school systems as instruments strongly suggest a causal
interpretation of the results previously presented. Caution is appropriate in interpreting IV
results for our relatively small samples of countries and employing the aggregate nature of the
institutional measures, but these make the statistical significance, reasonable precision, and
quantitative robustness of the results based on various instruments even more striking.22
VI. Comparing the Impacts of U.S. and Home-Country Education on the U.S. Labor Market
The IV estimates of the previous section could, nonetheless, fail if the favorable educational
institutions were correlated with generally favorable economic institutions – a possibility
introduced by the previous results. When measured economic institutions were accounted for,
the strength of the cognitive skills impact declined (even though the estimate remained
statistically significant). Unmeasured institutional or cultural factors could also be important and
could bias the cognitive-skill coefficient.
An alternative approach for assessing the causal importance of our measured skill differences
on economic outcomes relies on microdata on earnings differences within a single labor market –
the U.S. labor market. Following a difference-in-differences strategy, we can compare the
returns to skill of immigrants schooled in their country of origin to those of immigrants schooled
within the United States. If it is the measured differences in cognitive skills and not other
economically relevant attributes of the families and economies that are important, the impact of
skills can be derived from the different earnings of immigrants who received their schooling at
home and in the United States.
The structure of the estimation is derived from a standard Mincer (1974) wage equation
augmented by measured cognitive skills such as:
(3) 2
0 1 2 3ln ic ic ic ic y ic icy S PE PE Hα α α α γ υ= + + + + +
22 The IV results hold when employing two or all three of the institutional instruments jointly in the specification, but only one of them tends to capture statistical significance in the joint specifications.

17
where y is annual earnings for immigrant i from country c, S is years of school attainment, PE
(=age-S-6) is potential experience, H is cognitive skills, and υ is a random error.
We look at immigrants to the U.S. who were either educated entirely in their country of
origin or entirely in the United States.23 (This excludes any individuals partially educated in both
the U.S. and their home countries in order to obtain a clear separation of treatment and control
groups.) We assign the average cognitive-skill score for the home country ( cT ) for each
immigrant and estimate the Mincer earnings equation (3) as:
(4) 2
0 1 2 3 4ln [ ( )]c cic ic ic ic i O i icy S PE PE ORIGIN T T ORIGINα α α α α δ δ υ= + + + + + + × +
where ORIGIN is an indicator that is one if immigrant i was educated entirely in schools in the
country of origin and zero otherwise and the combined terms in brackets indicate the skills of
individuals from country c. The parameter Oδ is the relevant contrast in skills between home-
country schooling and U.S. schooling. We interpret Oδ as a difference-in-differences estimate of
the effect of home-country test scores on earnings, where the first difference is between home-
country educated immigrants (the “treatment group”) and U.S.-educated immigrants (the
“control group”) from the same country, and the second difference is in the average cognitive-
skill score of the home country.
The first two columns of Table 5 give the estimates of the impact of cognitive skills from
stratified samples for the two groups of immigrants. Test scores are normalized to mean zero
and a standard deviation of one, so that the estimates indicate the proportionate increase in
earnings from a one standard deviation increase in scores. Other things equal, there is essentially
no relationship of U.S. earnings to scores for their country of origin, either quantitatively or
statistically, for the 50,597 immigrants educated entirely in the U.S. On the other hand, one
standard deviation greater performance translates into a statistically significant earnings increase
of approximately 16 percent for the 258,977 immigrants educated in their country of origin.
This estimate is surprisingly close to recent estimates for cognitive skills of U.S. workers,
which indicate 10-15 percent returns to a standard deviation of test scores for young workers and
23 Immigrants are individuals born in a foreign country. The sample includes all individuals age 25 or older currently in the labor force with wage and salary earnings of at least $1,000 and not enrolled in school. Included immigrants had to have been born in a country with international test data (see Appendix B). The number of included countries is larger than in the previous growth regressions because of the lack of need to have internationally comparable GDP data. Descriptive statistics are found in Appendix Table C2.

18
19 percent across the full age range of workers.24 The closeness to the various estimates is
surprising given that just average country scores as opposed to individual specific scores are used
in the estimation here, although the averaging of scores does eliminate the measurement error
found in individual test scores.
Column 3 combines the samples and fully estimates equation (4). These estimates indicate a
significant impact of test scores with schooling in country of origin ( Oδ ). The estimate of (home
country) test score for U.S. educated immigrants is statistically insignificant, although the point
estimate is noticeably greater than zero. Column 4 demonstrates that this latter effect comes
entirely from the influence of immigrants from Mexico (who constitute 37 percent of all
immigrants to the U.S.). The estimation for immigrants from Mexico is prone to classification
error, because many Mexican families tend to move back and forth from Mexico – thus making
assignment to U.S. or Mexican schooling prone to error.25 Excluding Mexican immigrants, $Oδ
is highly significant with a point estimate of 0.13, while the coefficient for U.S. educated
immigrants falls to -0.026 and remains statistically insignificant.
The prior estimates indicate that the estimation strategy might be sensitive to variations in
immigration patterns across the 64 sampled countries. For example, in addition to the
complications for Mexican immigrants, the immigrants from other countries might vary by
where they come in the ability distribution of the home country and the like. For this reason, the
remaining columns of Table 5 contain country-of-origin fixed effects. Thus, immigrants
educated entirely abroad in their home country are compared directly to immigrants from the
same country educated entirely in the U.S. This should eliminate any potential bias emanating
from features specific to the country of origin, be it specific selectivity of the immigrant
population or country-specific cultural traits. The only remaining assumption required for
24 Murnane, Willett, Duhaldeborde, and Tyler (2000) provide evidence from the High School and Beyond and the National Longitudinal Survey of the High School Class of 1972. Their estimates suggest some variation with males obtaining a 15 percent increase and females a 10 percent increase per standard deviation of test performance. Lazear (2003), relying on a somewhat younger sample from NELS88, provides a single estimate of 12 percent. These estimates are also very close to those in Mulligan (1999), who finds 11 percent for the normalized AFQT score in the NLSY data. Hanushek and Zhang (2008) estimate a return of 19 percent from the International Adult Literacy Survey, which samples workers aged 16-65. 25 The assignment of individuals to U.S. schooling is based on census data indicating immigration before age 6. The assignment of individuals to schooling all in country of origin is based on age of immigration greater than years of schooling plus six. A person who moves back and forth during the schooling years could be erroneously classified as all U.S. or no U.S. schooling, even though they are really in the partial treatment category (which is excluded from the difference-in-differences estimation).

19
identification of our parameter of interest is that any potential difference between the early-
immigrated U-S.-educated and the late-immigrated home-educated group of immigrants from
each country (as captured by the ORIGIN indicator) does not vary across countries in a way
associated with country-of-origin test scores.
Column 5 displays the primary estimation across all sampled countries with country-specific
fixed effects. The estimated impact of cognitive skills is a 14 percent increase in earnings from
each standard deviation increase in origin-country test scores (when educated there). This
estimate is highly significant. Further, the point estimate is virtually unchanged by excluding the
Mexican immigrants (col. 6). The standard error is reduced by clearer assignment to treatment
category (when Mexicans excluded), even though the sample is substantially reduced.
The final two columns investigate the sensitivity of these estimates to sample definition.
First, our estimation of growth models used the 50 countries for which we could obtain the
relevant economic data for GDP growth. Restricting this analysis to that smaller sample yields a
slight increase in the magnitude of $Oδ to 17 percent, while it remains statistically significant.
Second, because immigrants from non-English speaking countries may have lower earnings
because of language difficulties, the final column shows estimates that come entirely from
countries where English is the primary or official language.26 Again, even for this sample of just
12 countries, variations in cognitive skills across countries have a strongly significant impact on
earnings of 16 percent.
The remaining rows of Table 5 provide estimates of the complete set of parameters. While
there is some variance across samples in the estimate of the effect on earnings of being educated
entirely in the country of origin, this appears to reduce average earnings by 6-13 percent with the
exception of English speaking immigrants, who appear to suffer no significant average earnings
loss compared to people educated entirely in the U.S. The estimated “Mincer” parameters
( 1α , 2α , and 3α ) appear within the range of typical estimates for the general population (see
Heckman, Lochner, and Todd (2008)). Results remain qualitatively the same when indicators for
decade of immigration and for gender are added to the model.27
26 Data on English language come from the CIA World Factbook. Countries were coded as English speaking if the CIA World Factbook listed English as an official language or as the most widely spoken language in the country. See https://www.cia.gov/library/publications/the-world-factbook/. 27 When analyzed separately by gender, the results hold strongly for males whereas results for females – while pointing in the same direction – mostly do not reach statistical significance, as is common in labor-market analyses.

20
These difference-in-differences estimates provide strong support for two conclusions about
the causal impacts of cognitive skills. First, they contrast individuals receiving the treatment of
home-country schooling to immigrants from the same country, all within the same labor market.
Thus, they cannot indicate differences in economic institutions around the globe that are
correlated with differences in cognitive skills. Second, they pinpoint the impact of schooling
differences across countries, as distinct from family or cultural differences in attitudes,
motivation, child rearing, and the like. In sum, the estimates, which are extraordinarily stable
across different estimation samples, provide evidence that the economic impact is a causal one,
and not purely associational.
VII. Skill Improvement and Improved Growth
The prior analyses have relied upon the average test score for each nation in order to
characterize differences in skills of their labor forces. An alternative difference-in-differences
approach uses the time-series evidence on performance within each country to identify the
impact of skills on growth. Specifically, countries that improve the skills of their population –
no matter how it is done – should see commensurate improvements in their rate of growth. This
estimation removes any country-specific fixed effects affecting growth rates – such as basic
economic institutions, political environment, and the like – and focuses on whether a country that
alters the cognitive skills of its population is observed to have an economic return.
While others have investigated turning points in growth, our focus is low-frequency changes
such as those that might result from evolutionary schooling policies and that alter the path of
economic growth.28 Policies affecting the skill composition of the labor force necessarily unfold
over lengthy periods and are not seen as sharp changes in outcomes.
To characterize the longitudinal patterns of test scores, we regress separate test scores by
year, age group, and subject on a time variable (as well as age-group and subject indicators) and
use the time coefficient as the measure of change in cognitive skills for each nation (see
Appendix B for details). The amount of noise in each test observation, particularly with our
common scaling, implies that such trends are also estimated with considerable noise. We
28 Relevant studies include Hausmann, Pritchett, and Rodrik (2005) that looks for episodes of “growth accelerations”; Jones and Olken (2008) that considers patterns of 10-year periods of acceleration and collapse; and Barro and Ursúa (2008) that identifies events of major declines in consumption that have potential implications for long-run growth. The identified periods are generally characterized by financial crisis, political instability, or war.

21
therefore trust the rough cross-country pattern more than the specific point estimates of changes
in each country. To put limits on the amount of noise affecting our analyses, we rely on the
sample of OECD countries that have test observations both before 1985 and up to 2003.29
As is evident from Figure 2 (see also Appendix Figure B3), substantial changes in test
performance – both positive and negative – have occurred for OECD countries. The rapid
growth in performance of such countries as Canada, Finland, and the Netherlands contrasts
sharply with the declining scores in Germany, Italy, and Norway. For our purposes, however,
we are not interested in test scores for the school-aged population but instead in the skills of the
relevant portions of the labor force. Thus, we need to assume that the currently observed trends
in performance reflect long-run patterns of skill change and specifically those holding during the
earlier time periods.
In a parallel manner, we estimate a time trend for annual growth rates in each country using
the Penn World Tables data. The annual growth rate series for each country contains
considerable noise, largely reflecting short-run business cycle phenomena or financial crises, and
the trend estimation is designed to extract long-run changes in growth.30
The consistency of changes in test performance and changes in growth rates is evident in
Figure 2. When we split countries by being above or below the median change in growth rates
and above or below the median change in cognitive skills, all countries fall into either the
positive or negative quadrants on both measures.
We provide estimates of simple models of the change in growth rates over the 1975-2000
period in Table 6. For the 15 OECD countries, 38 percent of the variance in growth-rate changes
can be explained by test-score changes. If we add measures for the average growth rate in each
country and the initial GDP per capita (col. 2-3), the change in achievement scores remains
statistically significant at near the same level as found in the simple regressions of column 1.
The same is true when the change in quantitative educational attainment is added to the model
(col. 4). Importantly, the change in educational attainment is orthogonal to the change in growth
29 In fact, all countries except Canada, Korea, and Norway have test scores dating back at least to 1971. 30 Descriptive statistics are found in Appendix Table C3. We also tried alternative measures of growth-rate changes, including the difference between the average growth rate in the first five years and in the last five years; trend growth using IMF data in national currencies; and IMF national currency data for the period 1975-2004. Using IMF national currency data is consistent with Hanousek, Hajkova, and Filer (2008) who argue that the price and exchange-rate adjustments in the basic Penn World Tables data give biased estimates of growth rates. In all of these options, the estimates of the impact of changes in test scores remain statistically significant and quantitatively very similar across alternatives and compared to the estimates reported in Table 6.

22
rates (either with controlling for the test-score trend or without), reinforcing the introductory
skepticism about the efficacy of past schooling policies. Likewise, results are hardly affected if
we weigh each observation by the inverse of the standard error with which the trend in test
scores was estimated, in order to downweigh those that are more noisily estimated (col. 5).
If, however, we restrict the analysis to those countries with test scores spanning a range of
more than three decades, from at least 1971 to 2003, both the coefficient estimate and the
explained variance grow in size (col. 5). In fact, it is already evident from Figure 2 that the three
countries with no test-score data before the 1980s (Canada, Korea, and Norway) fall relatively
far off the diagonal, suggesting that the more limited longitudinal informational content may lead
to noisy trend measures in these countries. In the sample without these countries, the test-score
trend alone accounts for 64 percent of the variation in growth trends. Alternative specifications
look simply at whether the test-score trend is above or below the OECD median (col. 6-7). In all
cases, the impact of changes in test scores on changes in growth rates remains very stable and is
always statistically significant.
This analysis requires extrapolation of the test-score data in order to capture changes for
workers in the labor force. Thus, by itself it should be considered suggestive and not definitive.
Nonetheless, the remarkable positive relationship between improving cognitive skills and
improving growth rates provides another approach to identifying the causal impact of cognitive
skills – a focus on changes within each country that removes country-specific fixed effects.
VIII. Rocket Scientists or Basic Education for All?
While addressing the range of potential schooling policy options is clearly beyond the scope
of this paper, our new data series allows us to extend the growth analysis to illuminate one
important issue – whether to concentrate attention at the lowest or at the highest achievers.
Some argue in favor of elitist school systems which focus on the top performers as potential
future managers of the economy and drivers of innovation. Others favor more egalitarian school
systems to ensure well-educated masses that will be capable of implementing established
technologies. In other words, should education policy focus on forming a small group of “rocket
scientists,” or are approaches such as the Education for All initiative (UNESCO (2005)) more
promising in spurring growth?
23
To capture these differences in the distributional patterns of the test-score performance in
different countries, we use the microdata from each of the international assessments to calculate
measures of the share of students in each country who reach at least basic skills as well as those
who reach superior performance levels (see Appendix B). We use performance of at least 400
test-score points on our transformed international scale – one standard deviation below the
OECD mean – as our threshold of basic literacy and numeracy.31 The international median of
this share of students is 86 percent in our sample, ranging from 18 percent in Peru to 97 percent
in the Netherlands and Japan. As our threshold for superior performance, we take 600 points or
one standard deviation above the OECD mean.32 This level is reached by an international
median of only 5 percent, although it ranges from below 0.1 percent in Colombia and Morocco
to 18 percent in Singapore and Korea and 22 percent in Taiwan.33 (As shown in Appendix
Figure B2, these differences represent more than simple mean displacement.)
As seen in the first three columns of Table 7, both measures of the test-score distribution are
significantly related to economic growth, either when entered individually or jointly.34 Both the
basic-skill and the top-performing dimensions of educational performance appear separately
important for growth. From the estimates in column 3, a ten percentage point increase in the
share of students reaching basic literacy is associated with 0.3 percentage points higher annual
growth, and a ten percentage point increase in the share of top-performing students is associated
with 1.3 percentage points higher annual growth. However, it may be much more feasible to
increase the basic-literacy share than to increase the top-performing share by the same amount,
as suggested by the fact that the international standard deviations of these two shares are 0.215
31 The PISA 2003 science test uses the threshold of 400 points as the lowest bound for a basic level of science literacy (Organisation for Economic Co-operation and Development (2004), p. 292), and on the math test this corresponds to the middle of the level 1 range (358 to 420 test-score points), which denotes that students can answer questions involving familiar contexts where all relevant information is present and the questions are clearly defined. 32 A score of 600 points is near the threshold of the level 5 range of performance on the PISA 2003 math test, which denotes that students can develop and work with models for complex situations, identifying constraints and specifying assumptions; they can reflect on their answers and can formulate and communicate their interpretations and reasoning. 33 The distributions depicted in Figure B2 reveal that such distributional measures capture much more of the overall distribution than a simple measure such as the standard deviation in national test scores. The standard deviation in test scores does not enter our basic model significantly (see Castelló and Doménech (2002) for related analyses using measures of educational inequality based on years of schooling). 34 In the joint model, the two measures are separately significant even though they are highly correlated across countries with a simple correlation of 0.73. The mean test score used in previous models is more highly correlated with the basic literacy share (r=0.96) than with the top-performing share (r=0.85). If the mean test score is added to column 3, the basic-literacy share becomes insignificant, but in a specification with just the mean, mean and top-performing shares both remain significant.
24
and 0.054, respectively. Thus, increasing each share by roughly half a standard deviation (10
percentage points basic-literacy share and 2.5 percentage points top-performing share) yields a
similar growth effect of roughly 0.3 percentage points.
The impact of having more top performers is only slightly reduced by introducing the
measures of economic institutions, fertility, and tropical geography (col. 4). On the other hand,
the separate influence of basic literacy levels falls quantitatively and becomes statistically
insignificant in the expanded model (for the 45 countries with complete data).
The effect of the basic-literacy share does not vary significantly with the initial level of
development, but the effect of the top-performing share is significantly larger in countries that
have more scope to catch up to the initially most productive countries (col. 5). These results
appear consistent with a mixture of the basic models of human capital and growth mentioned
earlier. The accumulation of skills as a standard production factor, emphasized by augmented
neoclassical growth models (e.g., Mankiw, Romer, and Weil (1992)), is probably best captured
by the basic-literacy term, which has positive effects that are similar in size across all countries.
But, the larger growth effect of high-level skills in countries farther from the technological
frontier is most consistent with technological diffusion models (e.g., Nelson and Phelps (1966)).
From this perspective, countries need high-skilled human capital for an imitation strategy, and
the process of economic convergence is accelerated in countries with larger shares of high-
performing students.35 Obvious cases are East Asian countries such as Taiwan, Singapore, and
Korea that all have particularly large shares of high-performers, started from relatively low
levels, and have shown outstanding growth performances, but the results of column 5 are
nonetheless robust to the inclusion of an East Asian dummy, or a full set of regional dummies.
A particularly informative extension considers the interaction of the top-performing and
basic-literacy shares (col. 6 and 7). This complementarity between basic skills and top-level
skills suggests that in order to be able to implement the imitation and innovation strategies
developed by scientists, countries need a workforce with at least basic skills.36
35 For an alternative model of imitation and innovation that emphasizes the innovation margin, see Vandenbussche, Aghion, and Meghir (2006) and Aghion, Boustan, Hoxby, and Vandenbussche (2005). 36 The issue of skill complementarity in production has been addressed in explaining the pattern of earnings inequality. The U.S. analysis of Autor, Katz, and Kearney (2006, 2008) suggests that high-skilled workers and low-skilled workers are complements, a result that helps explain income variations across the educational spectrum.

25
Many countries have focused on either basic skills or engineers and scientists. In terms of
growth, our estimates suggest that developing basic skills and highly talented people reinforce
each other. Moreover, achieving basic literacy for all may well be a precondition for identifying
those who can reach “rocket scientist” status. In other words, tournaments among a large pool of
students with basic skills may be an efficient way to obtain a large share of high-performers.
Finally, our emphasis has been growth and aggregate economic outcomes, and our results
suggest a balanced investment in skills. This focus, of course, does not capture the range of
policy objectives. In particular, initiatives may be aimed at basic literacy for equity and income-
distribution reasons. In any event, however, the economic returns come only from policies that
effectively improve student achievement and that thus add to the skills of the labor force – and
not from ones that increase schooling without improving achievement.
IX. Conclusions
A myriad of empirical estimates of cross-country growth models exist. The general criticism
of these is that they provide little confidence that the models satisfactorily identify the causal
impact of their included determinants of growth. And, a related criticism is that they then cannot
provide any real policy guidance.
We have focused on the role of cognitive skills in determining economic growth and have
taken the quest for policy guidance seriously. We have investigated a set of models that
approach identification from different vantage points. While each of the approaches can be
subjected to some questions, the key is that each is subject to different questions. As a result,
each potentially fails for very different reasons.
The consistency of the alternative estimates – both in terms of quantitative impacts and
statistical significance – provides strong support for a causal interpretation of the impact of
cognitive skills produced in schools. It would simply take an extensive and improbable set of
circumstances to make all of them simultaneously fail.
First, the stability of the models in the face of alternative specifications, varying samples, and
alternative measures of cognitive skills is quite remarkable. Second, the instrumental variables
estimation using institutional characteristics of each country’s school system yield results close
to those of the OLS regressions. Third, immigrants to the U.S. who have been educated in their
home countries receive labor-market returns reflecting the cognitive skills of the home country –
26
but the control group of immigrants from the same home country schooled in the U.S. receive no
return to home-country quality. This difference-in-differences approach rules out the possibility
that test scores simply reflect cultural factors or economic institutions of the home country. It
also provides further support to the potential role of schools to change the cognitive skills of
citizens in economically meaningful ways. Finally, perhaps the toughest test of causality is
reliance on how changes in test scores over time lead to changes in growth rates. By eliminating
the level effects which may be interrelated with country-specific institutions and cultures, this
investigation provides more evidence of the causal influence of cognitive skills.
The simple conclusion from the combined evidence is that differences in cognitive skills lead
to economically significant differences in economic growth. Moreover, since the tests
concentrate on the impact of schools, the evidence suggests that school policy can, if effective in
raising cognitive skills, be an important force in economic development.
By itself, finding a potential role for schools does not point to any clear policies. Indeed, that
discussion would enter into a variety of controversial areas and would lead us far afield.
Nonetheless, our aggregate data provide direct evidence on where to focus attention. We find
clear evidence that both providing broad basic education – education for all – and pushing
significant numbers to very high achievement levels have strong economic payoffs. Moreover,
there is some reason to believe that the policies are complementary: providing a broadly
educated population elevates the effectiveness of “rocket scientists” and vice versa.
27
References
Acemoglu, Daron, Simon Johnson, and James A. Robinson. 2001. "The Colonial Origins of
Comparative Development: An Empirical Investigation." American Economic Review 91, no.
5 (December): 1369-1401.
Aghion, Philippe, Leah Boustan, Caroline M. Hoxby, and Jérôme Vandenbussche. 2005.
"Exploiting States’ Mistakes to Identify the Causal Impact of Higher Education on Growth."
(mimeo), Department of Economics, Harvard University.
Aghion, Philippe, and Peter Howitt. 1998. Endogenous Growth Theory. Cambridge, MA: MIT
Press.
Autor, David H., Lawrence F. Katz, and Melissa S. Kearney. 2006. "The Polarization of the U.S.
Labor Market." American Economic Review 96, no. 2 (May): 189-194.
———. 2008. "Trends in U.S. Wage Inequality: Revising the Revisionists." Review of
Economics and Statistics 90, no. 2 (May): 300–323.
Barro, Robert J. 1991. "Economic Growth in a Cross Section of Countries." Quarterly Journal of
Economics 106, no. 2 (May): 407-443.
———. 1997. Determinants of Economic Growth: A Cross-Country Empirical Study.
Cambridge, MA: MIT Press.
———. 2001. "Human Capital and Growth." American Economic Review 91, no. 2 (May): 12-
17.
Barro, Robert J., and Jong-Wha Lee. 1993. "International Comparisons of Educational
Attainment." Journal of Monetary Economics 32, no. 3 (December): 363-394.
Barro, Robert J., and José F. Ursúa. 2008. "Macroeconomic Crises since 1870." Brookings
Papers on Economic Activity, no. 1: 336-350.
Benhabib, Jess, and Mark M. Spiegel. 2005. "Human Capital and Technology Diffusion." In
Handbook of Economic Growth, edited by Philippe Aghion and Steven N. Durlauf.
Amsterdam: North Holland: 935-966.
Bils, Mark, and Peter J. Klenow. 2000. "Does Schooling Cause Growth?" American Economic
Review 90, no.5 (December): 1160-1183.
Bishop, John H. 2006. "Drinking from the Fountain of Knowledge: Student Incentive to Study
and Learn – Externalities, Information Problems, and Peer Pressure." In Handbook of the

28
Economics of Education, edited by Eric A. Hanushek and Finis Welch. Amsterdam: North
Holland: 909-944.
Bowles, Samuel, Herbert Gintis, and Melissa Osborne. 2001. "The Determinants of Earnings: A
Behavioral Approach." Journal of Economic Literature 39, no. 4 (December): 1137-1176.
Castelló, Amparo, and Rafael Doménech. 2002. "Human Capital Inequality and Economic
Growth: Some New Evidence." Economic Journal 112, no. 478: C187-C200.
Cohen, Daniel, and Marcelo Soto. 2007. "Growth and Human Capital: Good Data, Good
Results." Journal of Economic Growth 12, no. 1 (March): 51–76.
Cunha, Flavio, James J. Heckman, Lance Lochner, and Dimitriy V. Masterov. 2006.
"Interpreting the Evidence on Life Cycle Skill Formation." In Handbook of the Economics of
Education, edited by Eric A. Hanushek and Finis Welch. Amsterdam: Elsevier: 697-812.
Fuller, Wayne A. 1977. "Some Properties of a Modification of the Limited Information
Estimator." Econometrica 45, no. 4: 939-954.
Glenn, Charles L., and Jan De Groof. 2002. Finding the Right Balance: Freedom, Autonomy
and Accountability in Education. Vol. II. The Netherlands: Lemma Publishers.
Goldin, Claudia, and Lawrence F. Katz. 2008. The Race between Education and Technology.
Cambridge: Harvard University Press.
Gundlach, Erich, Ludger Woessmann, and Jens Gmelin. 2001. "The Decline of Schooling
Productivity in OECD Countries." Economic Journal 111, no. 471 (May): C135-C147.
Hahn, Jinyong, Jerry A. Hausman, and Guido Kuersteiner. 2004. "Estimation with Weak
Instruments: Accuracy of Higher-order Bias and MSE Approximations." Econometrics
Journal 7, no.1: 272-306.
Hanousek, Jan, Dana Hajkova, and Randall K. Filer. 2008. "A Rise by Any Other Name?
Sensitivity of Growth Regressions to Data Source." Journal of Macroeconomics 30, no. 3
(September): 1188-1206.
Hanushek, Eric A. 2002. "Publicly Provided Education." In Handbook of Public Economics,
edited by Alan J. Auerbach and Martin Feldstein. Amsterdam: Elsevier: 2045-2141.
Hanushek, Eric A., and Dennis D. Kimko. 2000. "Schooling, Labor Force Quality, and the
Growth of Nations." American Economic Review 90, no. 5 (December): 1184-1208.
Hanushek, Eric A., and Ludger Woessmann. 2008. "The Role of Cognitive Skills in Economic
Development." Journal of Economic Literature 46, no. 3 (September): 607-608.
29
Hanushek, Eric A., and Lei Zhang. 2008. "Quality Consistent Estimates of International Returns
to Skill." (mimeo), Hoover Institution, Stanford University (March).
Hausmann, Ricardo, Lant Pritchett, and Dani Rodrik. 2005. "Growth Accelerations." Journal of
Economic Growth 10, no. 4 (December): 303-329.
Heckman, James J., Lance Lochner, and Petra Todd. 2008. "Earnings Functions and Rates of
Return." Journal of Human Capital 2, no. 1 (Spring): 1-31.
Heckman, James J., Jora Stixrud, and Sergio Urzua. 2006. "The Effects of Cognitive and
Noncognitive Abilities on Labor Market Outcomes and Social Behavior." Journal of Labor
Economics 24, no. 3 (July): 411-482.
Heston, Alan, Robert Summers, and Bettina Aten. 2002. "Penn World Table Version 6.1."
Philadelphia, Center for International Comparisons at the University of Pennsylvania
(CICUP), University of Pennsylvania.
Jamison, Eliot A., Dean T. Jamison, and Eric A. Hanushek. 2007. "The Effects of Education
Quality on Mortality Decline and Income Growth." Economics of Education Review 26, no. 6
(December): 772-789.
Jones, Benjamin F., and Benjamin A. Olken. 2008. "The Anatomy of Start-Stop Growth."
Review of Economics and Statistics 90, no. 3 (August): 582-587.
Katz, Lawrence F., and David H. Autor. 1999. "Changes in the Wage Structure and Earnings
Inequality." In Handbook of Labor Economics, edited by Orley Ashenfelter and David Card.
Amsterdam: Elsevier: 1463-1558.
Krueger, Alan B., and Mikael Lindahl. 2001. "Education for Growth: Why and for Whom?"
Journal of Economic Literature 39, no. 4 (December): 1101-1136.
Lazear, Edward P. 2003. "Teacher Incentives." Swedish Economic Policy Review 10, no. 3: 179-
214.
Levine, Ross, and David Renelt. 1992. "A Sensitivity Analysis of Cross-country Growth
Regressions." American Economic Review 82, no.4 (September): 942-963.
Lucas, Robert E. 1988. "On the Mechanics of Economic Development." Journal of Monetary
Economics 22, no. 1 (July): 3-42.
Mankiw, N. Gregory, David Romer, and David Weil. 1992. "A Contribution to the Empirics of
Economic Growth." Quarterly Journal of Economics 107, no. 2 (May): 407-437.
Mincer, Jacob. 1974. Schooling Experience and Earnings. New York: NBER.

30
Mulligan, Casey B. 1999. "Galton versus the Human Capital Approach to Inheritance." Journal
of Political Economy 107, no.6, pt. 2 (December): S184-S224.
Murnane, Richard J., John B. Willett, Yves Duhaldeborde, and John H. Tyler. 2000. "How
Important Are the Cognitive Skills of Teenagers in Predicting Subsequent Earnings?"
Journal of Policy Analysis and Management 19, no.4 (Fall): 547-568.
Murnane, Richard J., John B. Willett, and Frank Levy. 1995. "The Growing Importance of
Cognitive Skills in Wage Determination." Review of Economics and Statistics 77, no. 2
(May): 251-266.
Neidorf, Teresa S., Marilyn Binkley, Kim Gattis, and David Nohara. 2006. Comparing
Mathematics Content in the National Assessment of Educational Progress (NAEP), Trends in
International Mathematics and Science Study (TIMSS), and Program for International
Student Assessment (PISA) 2003 Assessments. Washington: National Center for Education
Statistics (May).
Nelson, Richard R., and Edmund Phelps. 1966. "Investment in Humans, Technology Diffusion
and Economic Growth." American Economic Review 56, no.2 (May): 69-75.
Organisation for Economic Co-operation and Development. 1998. Education at a Glance:
OECD Indicators. Paris: Organisation for Economic Co-operation and Development.
———. 2004. Learning for Tomorrow’s World: First Results from PISA 2003. Paris: OECD.
Pritchett, Lant. 2006. "Does Learning to Add Up Add Up? The Returns to Schooling in
Aggregate Data." In Handbook of the Economics of Education, edited by Eric A. Hanushek
and Finis Welch. Amsterdam: North Holland: 635-695.
Ramirez, Francisco, Xiaowei Luo, Evan Schofer, and John Meyer. 2006. "Student Achievement
and National Economic Growth." American Journal of Education 113, no. 1 (Nov.): 1-29.
Romer, Paul. 1990. "Endogenous Technological Change." Journal of Political Economy 99,
no.5, pt. II: S71-S102.
Sala-i-Martin, Xavier, Gernot Doppelhofer, and Ronald I. Miller. 2004. " Determinants of Long-
Term Growth: A Bayesian Averaging of Classical Estimates (BACE) Approach." American
Economic Review 94, no. 4 (September): 813-835.
Stock, James H., Jonathan H. Wright, and Motohiro Yogo. 2002. "A Survey of Weak
Instruments and Weak Identification in Generalized Method of Moments." Journal of
Business and Economic Statistics 20, no.4: 518-529.

31
Topel, Robert. 1999. "Labor Markets and Economic Growth." In Handbook of Labor Economics,
edited by Orley Ashenfelter and David Card. Amsterdam: Elsevier: 2943-2984.
UNESCO. 1998. World Education Report, 1998: Teachers and Teaching in a Changing World.
Paris: UNESCO.
———. 2005. Education for All: The Quality Imperative, EFA Global Monitoring Report.
Paris: UNESCO.
Vandenbussche, Jérôme, Philippe Aghion, and Costas Meghir. 2006. "Growth, Distance to
Frontier and Composition of Human Capital." Journal of Economic Growth 11, no. 2 (June):
97-127.
Welch, Finis. 1970. "Education in Production." Journal of Political Economy 78, no. 1
(January/February): 35-59.
West, Martin R., and Ludger Woessmann. 2008. "'Every Catholic Child in a Catholic School':
Historical Resistance to State Schooling, Contemporary School Competition, and Student
Achievement." CESifo Working Paper 2332, Munich: CESifo.
Woessmann, Ludger. 2003a. "Schooling Resources, Educational Institutions, and Student
Performance: The International Evidence." Oxford Bulletin of Economics and Statistics 65,
no. 2: 117-170.
———. 2003b. "Central Exit Exams and Student Achievement: International Evidence." In No
Child Left Behind? The Politics and Practice of School Accountability, edited by Paul E.
Peterson and Martin R. West. Washington: Brookings: 292-323.
———. 2007a. "International Evidence on School Competition, Autonomy and Accountability:
A Review." Peabody Journal of Education 82, no.2-3: 473-497.
———. 2007b. "Fundamental Determinants of School Efficiency and Equity: German States as
a Microcosm for OECD Countries." Working Paper PEPG 07-02, Cambridge, MA: Harvard
University.
Woessmann, Ludger, Elke Lüdemann, Gabriela Schütz, and Martin R. West. forthcoming.
School Accountability, Autonomy, Choice around the World. Northampton, MA: Edward
Elgar Publishing.

Figure 1: Cognitive Skills and Growth across World Regions
Notes: Added-variable plot of a regression of the average annual rate of growth (in percent) of real GDP per capita in 1960-2000 on the initial level of real GDP per capita in 1960 and average test scores on international student achievement tests. Authors’ calculations. See Table A1 for a list of the countries contained in each world region. Region codes: East Asia and India (ASIA), Central Europe (C-EUR), Commonwealth OECD members (COMM), Latin America (LATAM), Middle East and North Africa (MENA), Northern Europe (N-EUR), Southern Europe (S-EUR), Sub-Saharan Africa (SSAFR).

Figure 2: Trends in Growth Rates vs. Trends in Test Scores
Notes: Scatter plot of trend in the growth rate of GDP per capita from 1975 to 2000 against trend in test scores. Equivalent of first column of Table 6. See Appendix B for details.
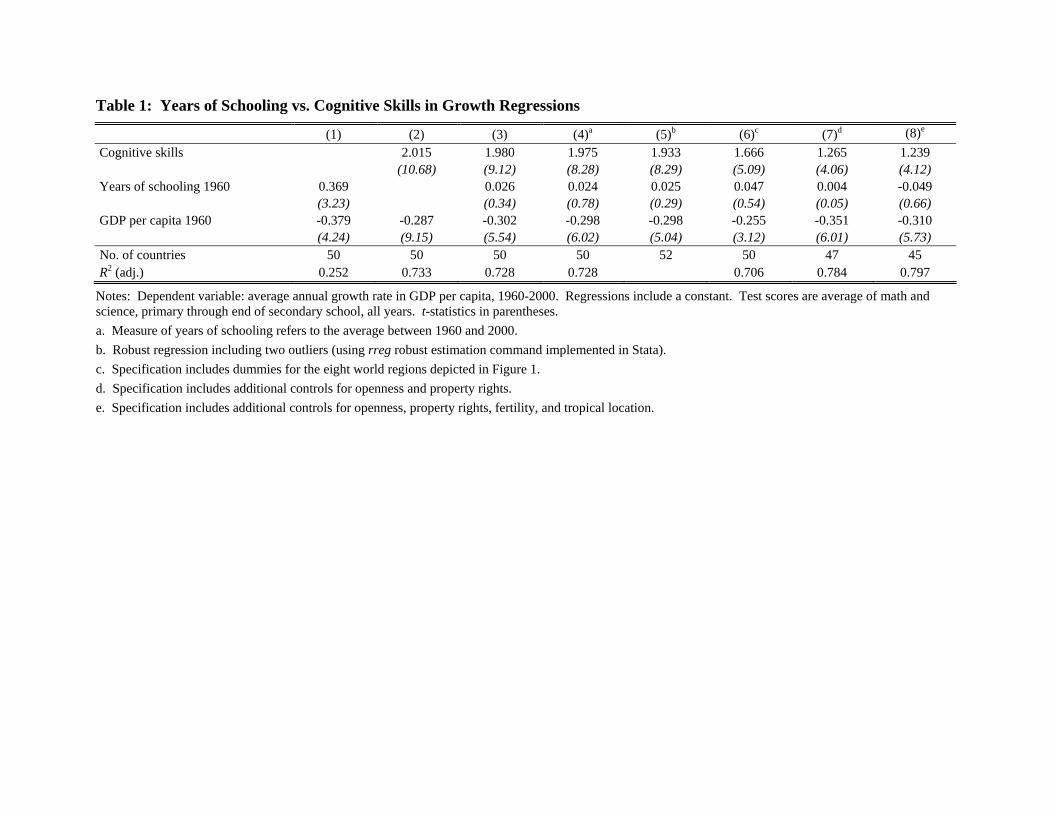
Table 1: Years of Schooling vs. Cognitive Skills in Growth Regressions
(1) (2) (3) (4)a (5)b (6)c (7)d (8)e Cognitive skills 2.015 1.980 1.975 1.933 1.666 1.265 1.239
(10.68) (9.12) (8.28) (8.29) (5.09) (4.06) (4.12) Years of schooling 1960 0.369 0.026 0.024 0.025 0.047 0.004 -0.049
(3.23) (0.34) (0.78) (0.29) (0.54) (0.05) (0.66) GDP per capita 1960 -0.379 -0.287 -0.302 -0.298 -0.298 -0.255 -0.351 -0.310 (4.24) (9.15) (5.54) (6.02) (5.04) (3.12) (6.01) (5.73) No. of countries 50 50 50 50 52 50 47 45 R2 (adj.) 0.252 0.733 0.728 0.728 0.706 0.784 0.797
Notes: Dependent variable: average annual growth rate in GDP per capita, 1960-2000. Regressions include a constant. Test scores are average of math and science, primary through end of secondary school, all years. t-statistics in parentheses. a. Measure of years of schooling refers to the average between 1960 and 2000. b. Robust regression including two outliers (using rreg robust estimation command implemented in Stata). c. Specification includes dummies for the eight world regions depicted in Figure 1. d. Specification includes additional controls for openness and property rights. e. Specification includes additional controls for openness, property rights, fertility, and tropical location.

Table 2: Sensitivity of Estimated Effects of Cognitive Skills to the Sample of Countries and Time Periods
(1) (2) (3) (4) (5) (6) (7) (8) (9) (10) (11) Country/year sample ► Full OECD Non- High- Low- W/o 1960- 1980- 1980- Score-schooling Score-schooling
▼ Test-score specification OECD incomea incomea East Asia 1980 2000 2000b outliersc corec All math and science 1.980 1.736 2.056 1.287 2.286 1.301 1.522 2.996 3.523 1.888 2.175 (9.12) (4.17) (6.10) (5.37) (6.98) (4.90) (4.29) (9.42) (2.89) (7.81) (3.47) Only lower secondary 1.759 1.646 1.792 1.040 2.083 1.137 1.407 2.580 3.703 1.673 1.887
(9.22) (4.02) (6.19) (4.70) (7.44) (4.82) (4.56) (8.88) (3.49) (7.83) (3.45) No. of countries 50 23 27 25 25 40 50 50 22 25 25
Notes: Reported numbers are the coefficient on test scores in each model specification. Dependent variable: Unless noted otherwise, average annual growth rate in GDP per capita, 1960-2000. Control variables: Initial GDP per capita, initial years of schooling, and a constant. Test scores: Unless noted otherwise, average of math and science, primary through end of secondary school, all years. t-statistics in parentheses. a. Countries above/below sample median of GDP per capita 1960. b. Test scores refer only to tests performed until 1984. c. Countries with largest (outliers)/smallest (core) residuals when regressing years of schooling on test scores.

Table 3: Sensitivity of Estimated Effects of Cognitive Skills to the Measurement of Skills
(1) (2) (3) Country sample ► Full OECD Non-OECD
▼ Test-score specification No. of countries (A) Only since 1995 1.814 1.473 1.850 47
(9.91) (3.80) (6.74) (B) Only lower secondary since 1995 1.644 1.379 1.657 47
(9.57) (3.49) (6.48) (C) Only until 1995 3.568 1.193 4.696 34
(8.31) (1.80) (7.48) (D) Early as instrument for averagea 1.988 1.187 2.472 34
(7.49) (1.85) (4.75) (E) Only math 2.009 1.529 2.063 47
(8.98) (4.62) (5.81) (F) Only science 1.576 1.769 1.556 50
(7.00) (3.28) (4.48) (G) Only reading 2.351 1.616 2.529 46 (6.21) (3.33) (3.68)
(H) All subjects entered jointly 41 Math 1.662 2.270 1.882
(3.69) (2.97) (1.97) Science 1.007 -2.414 1.270
(2.34) (1.62) (1.92) Reading -0.793 1.333 -1.457 (1.15) (1.44) (0.94)
Notes: Reported numbers are the coefficient on test scores in each model specification. Dependent variable: Average annual growth rate in GDP per capita, 1960-2000. Control variables: GDP per capita 1960, years of schooling 1960, and a constant. Test scores: Unless noted otherwise, average of math and science, primary through end of secondary school, all years. t-statistics in parentheses. a. 2SLS with average of test scores until 1995 as instrument for average of all test scores.
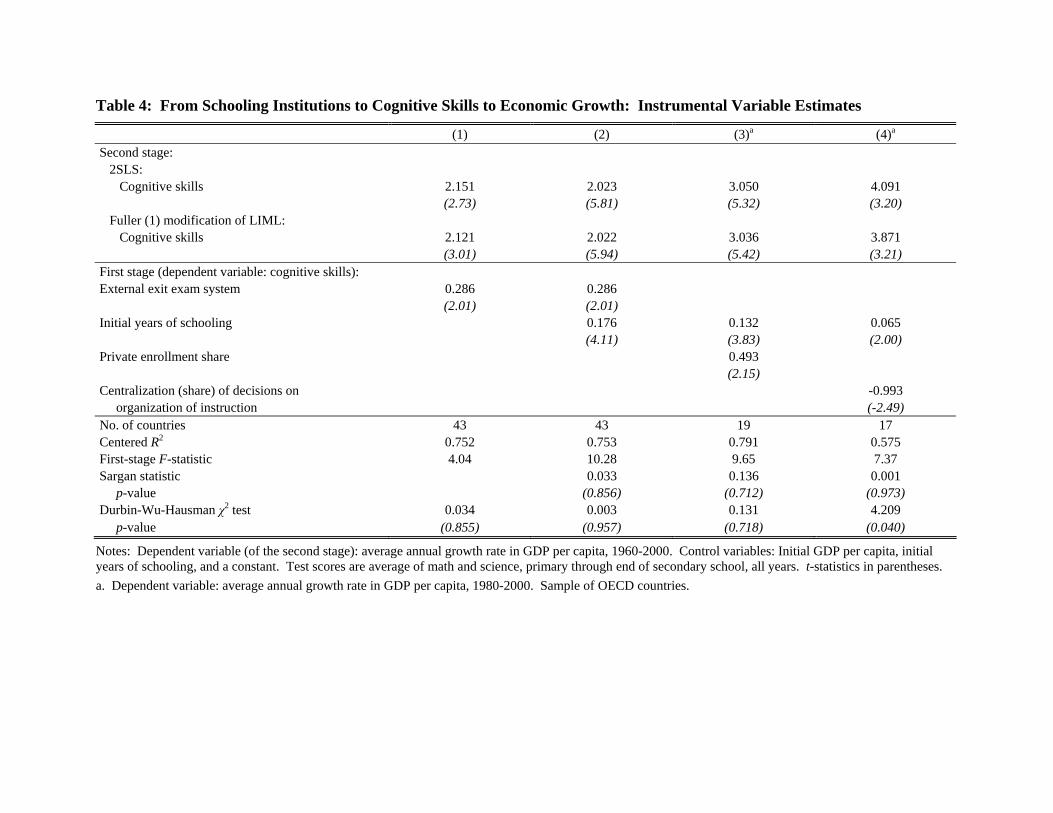
Table 4: From Schooling Institutions to Cognitive Skills to Economic Growth: Instrumental Variable Estimates
(1) (2) (3)a (4)a Second stage: 2SLS: Cognitive skills 2.151 2.023 3.050 4.091
(2.73) (5.81) (5.32) (3.20) Fuller (1) modification of LIML: Cognitive skills 2.121 2.022 3.036 3.871 (3.01) (5.94) (5.42) (3.21) First stage (dependent variable: cognitive skills): External exit exam system 0.286 0.286 (2.01) (2.01) Initial years of schooling 0.176 0.132 0.065 (4.11) (3.83) (2.00) Private enrollment share 0.493 (2.15) Centralization (share) of decisions on -0.993 organization of instruction (-2.49) No. of countries 43 43 19 17 Centered R2 0.752 0.753 0.791 0.575 First-stage F-statistic 4.04 10.28 9.65 7.37 Sargan statistic 0.033 0.136 0.001 p-value (0.856) (0.712) (0.973) Durbin-Wu-Hausman χ2 test 0.034 0.003 0.131 4.209 p-value (0.855) (0.957) (0.718) (0.040)
Notes: Dependent variable (of the second stage): average annual growth rate in GDP per capita, 1960-2000. Control variables: Initial GDP per capita, initial years of schooling, and a constant. Test scores are average of math and science, primary through end of secondary school, all years. t-statistics in parentheses. a. Dependent variable: average annual growth rate in GDP per capita, 1980-2000. Sample of OECD countries.

Table 5: Difference-in-Differences Estimates of Returns to Country-of-Origin Cognitive Skills for U.S. Immigrants
Sample: U.S. educateda
Educated in country of originb
All immigrants
W/o Mexico
All immigrants
W/o Mexico
Growth samplec
Only English speaking countries
(1) (2) (3) (4) (5) (6) (7) (8) Cognitive skills x Educated in 0.0873 0.1324 0.1375 0.1398 0.1670 0.1616 country of origin (2.02) (3.31) (3.16) (4.13) (3.77) (3.57) Cognitive skills 0.0050 0.1582 0.0634 -0.0258 not not not not
(0.14) (2.37) (1.06) (1.42) identified identified identified identified Educated in country of origin -0.1385 -0.1011 -0.1298 -0.0626 -0.1309 -0.0206 (3.95) (3.03) (2.98) (2.07) (2.58) (0.83) Years of schooling 0.1155 0.0673 0.0700 0.0863 0.0579 0.0856 0.0553 0.0992 (14.08) (7.35) (7.43) (13.47) (4.14) (17.40) (4.06) (15.41) Potential experience 0.0372 0.0235 0.0243 0.0215 0.0241 0.0227 0.0233 0.0205 (19.71) (4.12) (5.67) (4.75) (7.68) (5.57) (6.50) (2.80) Potential experience squared -0.00064 -0.00035 -0.00036 -0.0004 -0.00039 -0.0004 -0.0004 -0.0004 (13.02) (4.79) (6.10) (4.90) (7.40) (5.87) (6.46) (3.25) Fixed effects for country of origin no no no no yes yes yes yes Observations 50,597 258,977 309,574 187,506 309,574 187,506 273,213 72,091 No. of countries 64 64 64 63 64 63 47 12 R2 0.157 0.170 0.180 0.132 0.196 0.150 0.202 0.156
Notes: Dependent variable: log(annual earnings). Cognitive skills refers to average test score of country of origin (centered at zero). Sample: All immigrants identified by country of birth not in school whose age is greater than 25, who are employed, and who earned more than $1,000 in 1999. Immigrants who had obtained some but not all of their education in the U.S. were excluded from the sample. Immigrants from all countries of origin for which there are cognitive-skill scores, except for the following countries (areas) which could not be identified because of census restrictions on release of data for small cells: Swaziland, Slovenia, Macau-China, Luxembourg, Liechtenstein, Estonia, Botswana, Bahrain, Tunisia, and Iceland. Israel could not be identified separately from Palestine; both were assigned the Israeli score. Robust absolute values of t-statistics in parentheses with clustering by country of origin. Source: Authors’ calculations from 2000 Census IPUMS data. a. U.S. educated immigrants are identified as immigrating to the U.S. before the beginning year of schooling. b. Immigrants educated in their country of origin are identified as immigrating to the U.S. after the final year of schooling. c. The economic growth sample relies on the data for immigrants from the 50 countries in the basic growth regressions.

Table 6: Changes in Cognitive Skills and Changes in Growth Paths
(1) (2) (3) (4) (5)a (6)b (7) (8) Trend in cognitive skills 0.084 0.073 0.074 0.074 0.080 0.117 (3.10) (3.21) (3.07) (3.04) (3.34) (6.90) Dummy for cognitive-skill trend 0.117 0.103 above median (5.98) (4.87) Average annual growth rate -0.030 -0.035 -0.028 -0.039 -0.085 -0.004 in GDP per capita 1975-2000 (2.73) (1.61) (1.69) (-2.32) (5.26) (0.21) Initial GDP per capita -0.002 0.005 (0.27) (0.80) Change in years of schooling -0.004 1975-2000 (0.21) No. of countries 15 15 15 15 15 12 15 15 R2 (adj.) 0.380 0.586 0.551 0.550 0.582 0.891 0.713 0.735
Notes: Dependent variable: trend in the growth rate of GDP per capita from 1975 to 2000. Regressions include a constant. Sample: OECD countries with test-score data both before 1985 and up to 2003. Test scores are average of math and science, primary through end of secondary school. t-statistics in parentheses. a. WLS with inverse of standard error with which the trend in test scores was estimated as weights. b. Excluding countries without test scores before 1972 (Canada, Korea, and Norway).

Table 7: Rocket Scientists or Basic Education for All?
(1) (2) (3) (4)a (5)b (6)b (7)b Share of students reaching basic literacy 4.717 2.732 1.002 3.460 5.150 5.869 (6.64) (3.61) (1.33) (3.81) (2.87) (3.33) Share of top-performing students 19.347 12.880 11.735 8.460 4.226 -1.530 (2.653) (4.35) (4.18) (2.37) (0.65) (0.22) Share of students reaching basic literacy 0.376 x Initial GDP per capita (1.25) Share of top-performing students -2.148 -1.649 x Initial GDP per capita (2.11) (2.07) Share of students reaching basic literacy 42.357 53.538 x Share of top-performing students (1.48) (1.91) No. of countries 50 50 50 45 50 50 50 R2 (adj.) 0.610 0.646 0.719 0.823 0.734 0.727 0.746
Notes: Dependent variable: average annual growth rate in GDP per capita, 1960-2000. Control variables: GDP per capita 1960, years of schooling 1960, and a constant. Shares are based on average test scores in math and science, primary through end of secondary school, all years. t-statistics in parentheses. a. Specification includes additional controls for openness, property rights, fertility, and tropical location. b. All interacted variables are centered on zero.

A1
APPENDIX A. Regional Data
Table A1: Income, Education, and Growth across World Regions All Penn World Tables Countries
Regiona No. countriesb GDP per
capita 1960 (US$)
Growth of GDP per
capita 1960-2000 (%)
GDP per capita 2000
(US$)
Years of schooling
1960 Test score
No. countriesc GDP per capita 1960 (US$)
Asia 11 1,891 4.5 13,571 4.0 479.8 15 1,642 Sub-Saharan Africa 3 2,304 1.4 3,792 3.3 360.0 40 1,482 Middle East and North Africa 8 2,599 2.7 8,415 2.7 412.4 10 2,487 Southern Europe 5 4,030 3.4 14,943 5.6 466.4 5 4,030 Latin America 7 4,152 1.8 8,063 4.7 388.3 24 3,276 Central Europe 7 8,859 2.6 24,163 8.3 505.3 7 8,859 Northern Europe 5 8,962 2.6 25,185 8.0 497.3 5 8,962 Commonwealth OECD 4 11,251 2.1 26,147 9.5 500.3 4 11,251 Note: Asia w/o Japan 10 1,614 4.5 12,460 3.5 474.7 14 1,427
Notes: a. The country observations contained in the eight regions are: Asia (11): China, Hong Kong, India, Indonesia, Japan, Rep. of Korea, Malaysia, Philippines, Singapore, Taiwan, Thailand; Sub-Saharan Africa (3): Ghana, South Africa, Zimbabwe; Middle East and North Africa (8): Cyprus, Egypt, Iran, Israel, Jordan, Morocco, Tunisia, Turkey; Southern Europe (5): Greece, Italy, Portugal, Romania, Spain; Latin America (7): Argentina, Brazil, Chile, Colombia, Mexico, Peru, Uruguay; Central Europe (7): Austria, Belgium, France, Ireland, Netherlands, Switzerland, United Kingdom; Northern Europe (5): Denmark, Finland, Iceland, Norway, Sweden; Commonwealth OECD members (4): Australia, Canada, New Zealand, USA. b. Sample of all countries by region with internationally comparable data on GDP that ever participated in an international student achievement test; see Appendix B for details. c. Sample of all countries in Penn World Tables with data on GDP per capita in 1960 by region. Sources: GDP: own calculations based on Penn World Tables (Heston, Summers, and Aten (2002)); years of schooling: own calculations based on Cohen and Soto (2007); test score: own calculations based on international student achievement tests; see Appendix B for details.

A2
APPENDIX B. Measures of Cognitive Skills
A key element of our work is developing a measure that can equate knowledge of people
across countries. In many ways this is an extension of notions of human capital that have been
developed over the past half century. But it is a specific refinement that, while important in a
variety of applications within nations, becomes a necessity when comparing different countries.
Within a country, human capital is often proxied by quantity of schooling. This is partly
necessitated by commonly available data but partly justified on the idea that differences in
knowledge between levels of schooling are greater than those within levels of schooling.
Until recent publicity, most people were unaware of the international student testing that
could provide direct comparisons of student knowledge across countries. In fact, international
assessments of student achievement, aimed largely at math and science, were begun over four
decades ago. Although national participation has been voluntary, recent expansions to all OECD
countries and more have led to increasingly valid and reliable indicators of cognitive skills.
Internationally comparable student achievement tests have been conducted since the First
International Mathematics Study (FIMS), which tested in 1964. The latest international studies
used in our analyses are the 2003 cycles of the Trends in International Mathematics and Science
Study (TIMSS) and the Programme for International Student Assessment (PISA). From FIMS to
the latest TIMSS and PISA, a total of 12 international student achievement tests (ISATs) were
conducted.37 Although varying across the individual assessments, testing covers math, science,
and reading for three age/grade groups: primary education (age 9/10), lower secondary education
(age 13 to 15), and the final year of secondary education (generally grade 12 or 13).
Given this 3x3 grade-by-subject matrix, Table B1 summarizes the specific ISATs that have
been conducted in three periods of time: late 1960s/early 1970s (1964-72), 1980s (1982-91), and
late 1990s/early 2000s (1995-2003). Several features of the emerging pattern are worth noting.
First, math and science have been tested at all three grade levels, while reading has not been
tested in the final grade of secondary school. Second, all subjects are available in all periods,
37 In this study, we do not include the two tests conducted by the International Assessment of Educational Progress (IAEP) in 1988 and 1991, because they used the U.S. NAEP test as their testing instrument, which is geared to the U.S. curriculum and may thus introduce bias to the international testing. By contrast, the tests included here are not associated with the curriculum in any particular country, but have been devised in an international cooperative process between all participating countries.

A3
although coverage is more extensive in math and science than in reading. Third, in each period,
the lower secondary level has been tested in all three subjects; thus, there is no primary or final-
secondary study that would add a subject not already tested at lower secondary in the period.
Fourth, each cell available in 1964-91 has at least one counterpart in 1995-2003.
Table B2 provides additional detail on each ISAT. A total of 77 countries have participated
in at least one of the ISATs in math or science, but several of the countries have participated at
only one or a few points in time. Even within the same assessment, countries do not always
participate at all grade levels. The largest number of countries tends to have participated at the
lower secondary level.
To obtain a common measure of cognitive skills, we want to draw on as much internationally
comparable information as possible. This raises the issue whether the different ISATs with their
different participating countries, student samples, and perspectives on what should be tested (see
Neidorf, Binkley, Gattis, and Nohara (2006)) are measuring a common dimension of cognitive
skills. For example, the TIMSS tests are related to elements of the school curricula common to
participating countries, while the PISA tests are designed to be applied assessments of real-world
problems, irrespective of specific curricula. However, the fact is that the TIMSS tests with their
curricular focus and the PISA tests with their applied focus are highly correlated at the country
level. For example, the correlation between the TIMSS 2003 tests of 8th graders and the PISA
2003 tests of 15-year-olds across the 19 countries participating in both is as high as 0.87 in math
and 0.97 in science. It is also 0.86 in both math and science across the 21 countries participating
both in the TIMSS 1999 tests and the PISA 2000/02 tests. Thus, ISATs with very different foci
and perspectives tend, nonetheless, to be highly related, lending support to our approach of
aggregating different ISATs for each country.
The general idea behind our approach to aggregation is that of empirical calibration. We rely
upon information about the overall distribution of scores on each ISAT to compare national
responses. This contrasts with the psychometric approach to scaling that calibrates tests through
common elements on each test. In reality, the international testing situations are separate events
with no general attempt to provide common scaling across tests and across the full time period.
The fact that the scales of their test-score results are not directly equated across tests is a
major drawback in comparative uses of the various ISATs. They do not use the same test
questions; nor do they even use the same technique and scale of mapping answers into test

A4
scores.38 The early tests mainly used aggregate scores in “percent correct” format, but with
questions of varying difficulty in the different tests, these scores will not be comparable across
tests. The later tests use a more sophisticated scale, constructed using Item Response Theory
(IRT). Among other things, IRT weights different questions by their revealed difficulty and then
maps answers onto a pre-set scale set to yield a given international mean and standard deviation
among the participating countries. However, the questions on which the mapping is based are
not the same in the different tests. Even more, the set of participating countries varies
considerably across tests, making the separately developed scales incomparable across ISATs.
Therefore, to compare performance on the ISATs across tests and thus over time, we have to
project the performance of different countries on different tests onto a common metric. For that,
we have to develop a common metric both for the level and for the variation of test performance.
Comparable level. To make the level of ISATs comparable, we need information on test
performance that is comparable over time. Such information is available in the United States in
the form of the National Assessment of Educational Progress (NAEP), which tests the math,
science, and reading performance of nationally representative samples of 9-, 13-, and 17-year-old
U.S. students in an intertemporally comparable way since 1969. This is the only available
information on educational performance that is consistently available for comparisons over time.
The United States is also the only country that participated in every ISAT. Given the time-series
evidence on the performance of U.S. students, we can thus scale the level of each ISAT relative
to the known intertemporally comparable test performance of the United States. Figure B1
shows the available NAEP results in the three subjects and age groups. Despite some notable
changes, the performance of U.S. students has been relatively flat over the period 1969-1999.
We start by calculating the U.S. performance difference between 1999 and any earlier point
in time and express it in standard deviations (s.d.) of the international PISA 2000 study:
(A1) ( ) NAEPUS
sa
PISAUSsUS
saUS
tsaUS
tsa SDSD
NAEPNAEPU ,,
,
1999,,,,,, −=
where U is the standardized performance difference of U.S. students at age a in subject s at time t
relative to 1999, NAEP is the age-, subject-, and time-specific NAEP test score, SDUS,PISA is the
38 Recent testing in both TIMSS and PISA has involved overlapping test items that permit test calibration, but these do not provide any benchmarks across the two testing regimes or linked with earlier testing.
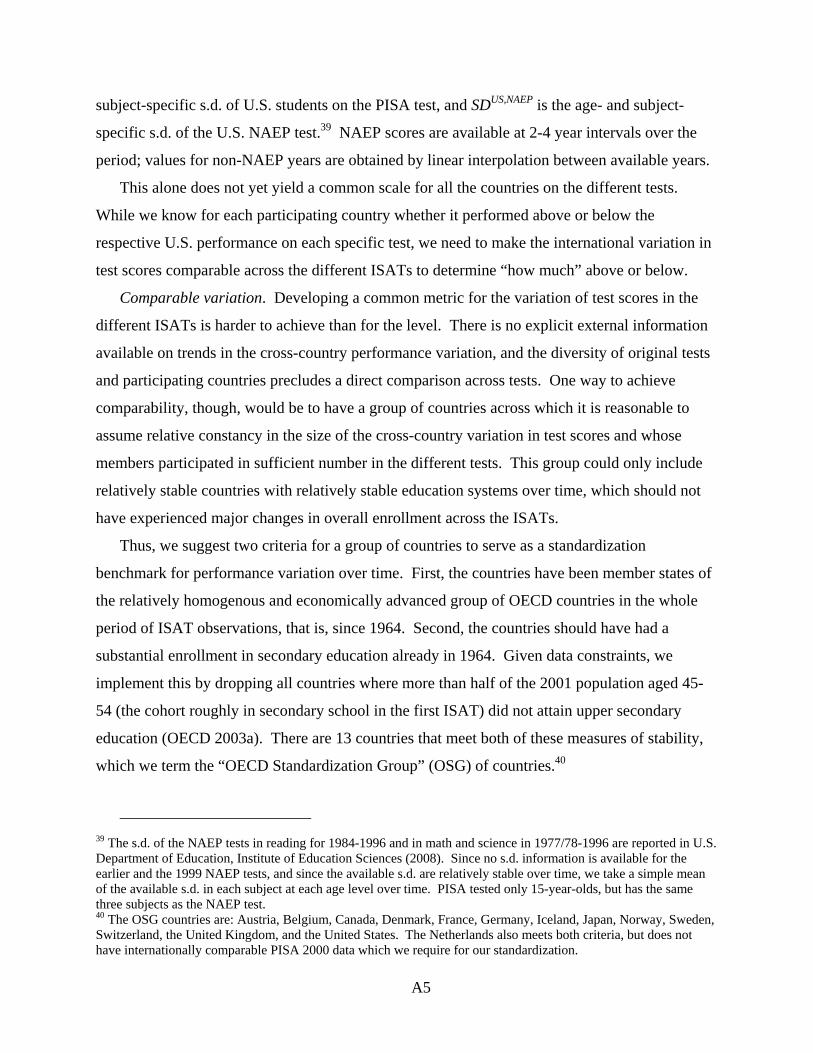
A5
subject-specific s.d. of U.S. students on the PISA test, and SDUS,NAEP is the age- and subject-
specific s.d. of the U.S. NAEP test.39 NAEP scores are available at 2-4 year intervals over the
period; values for non-NAEP years are obtained by linear interpolation between available years.
This alone does not yet yield a common scale for all the countries on the different tests.
While we know for each participating country whether it performed above or below the
respective U.S. performance on each specific test, we need to make the international variation in
test scores comparable across the different ISATs to determine “how much” above or below.
Comparable variation. Developing a common metric for the variation of test scores in the
different ISATs is harder to achieve than for the level. There is no explicit external information
available on trends in the cross-country performance variation, and the diversity of original tests
and participating countries precludes a direct comparison across tests. One way to achieve
comparability, though, would be to have a group of countries across which it is reasonable to
assume relative constancy in the size of the cross-country variation in test scores and whose
members participated in sufficient number in the different tests. This group could only include
relatively stable countries with relatively stable education systems over time, which should not
have experienced major changes in overall enrollment across the ISATs.
Thus, we suggest two criteria for a group of countries to serve as a standardization
benchmark for performance variation over time. First, the countries have been member states of
the relatively homogenous and economically advanced group of OECD countries in the whole
period of ISAT observations, that is, since 1964. Second, the countries should have had a
substantial enrollment in secondary education already in 1964. Given data constraints, we
implement this by dropping all countries where more than half of the 2001 population aged 45-
54 (the cohort roughly in secondary school in the first ISAT) did not attain upper secondary
education (OECD 2003a). There are 13 countries that meet both of these measures of stability,
which we term the “OECD Standardization Group” (OSG) of countries.40
39 The s.d. of the NAEP tests in reading for 1984-1996 and in math and science in 1977/78-1996 are reported in U.S. Department of Education, Institute of Education Sciences (2008). Since no s.d. information is available for the earlier and the 1999 NAEP tests, and since the available s.d. are relatively stable over time, we take a simple mean of the available s.d. in each subject at each age level over time. PISA tested only 15-year-olds, but has the same three subjects as the NAEP test. 40 The OSG countries are: Austria, Belgium, Canada, Denmark, France, Germany, Iceland, Japan, Norway, Sweden, Switzerland, the United Kingdom, and the United States. The Netherlands also meets both criteria, but does not have internationally comparable PISA 2000 data which we require for our standardization.

A6
Under the assumption that the cross-country variation among the OSG countries did not vary
substantially since 1964, we can use the OSG countries to develop a comparable scale for the
variation on the different ISATs. We do so by projecting the s.d. among those of the OSG
countries that participated in any particular ISAT from the subject-specific PISA test onto the
particular ISAT. That is, we transform the original test score O of country i (specific for each
age a and subject s) at time t into a transformed test score X according to:
(A2) ( ) OSGtsa
OSGPISAsOSG
tsai
tsai
tsa SDSD
OOX,,
,,,,,,, −=
The test score X has the following distributional characteristics for each ISAT. First, it has a
mean of zero among the OSG (attained by subtracting the OSG mean OSGO from each country’s
original test score). Second, it has a between-country s.d. among the OSG that is the same as the
s.d. of the very same countries on the PISA test in the specific subject (attained by dividing
through the s.d. among the OSG countries in the specific test and multiplying by the s.d. of these
same countries in the relevant PISA test). In effect, this rescaled test score now has a metric
whose variation is comparable across tests.
Performance on a common metric. Finally, we use the time-series evidence on educational
performance in the U.S. derived above to put a common level to the intertemporally comparable
metric for the different ISATs. This is achieved in the standardized test score I:
(A3) UStsa
USPISAs
UStsa
itsa
itsa UOXXI ,,,,,,,,, ++−=
which adjusts the variation-adjusted test score X so that the U.S. performance level on each test
equals the U.S. performance on the PISA test in the specific subject plus the age- and subject-
specific adjustment factor U based on NAEP as derived in equation (A1) above.
Equation (A3) yields measures of the performance of the participating countries in each
ISAT on a common scale that is comparable across ISATs. In effect, the internationally and
intertemporally standardized test score I projects the PISA scale onto all other tests.
While we are reasonably confident about the comparisons of the standardized scores within
the OECD countries which are fully tested in recent years, we are less certain about countries
that are far from the measured OECD performance. In particular, countries far off the scale of
the original test scores – e.g., two s.d. below the mean – may not be well represented because the

A7
tests may be too hard and thus not very informative for them. Our linear transformations are
susceptible to considerable noise for these countries.
Our main measure of cognitive skills is a simple average of all standardized math and science
test scores of the ISATs in which a country participated. Table B3 reports the basic combined
measure for the 77 countries that have ever participated in any of the math and science tests.41
The sample for our growth regressions contains 50 of these countries.42
Distributional measures. Apart from the mean scores, we also analyze the distribution of test
scores in each country by accessing the microdata of all ISATs.43 The kernel density plots for
math achievement on the 2003 PISA in Figure B2 show that countries vary significantly in their
patterns of test-score distributions. The depicted selected examples of developed countries
reveals that it is possible to achieve relatively high median performance both with a relatively
equitable spread (Finland) and with a relatively unequal spread (Belgium) in the test scores at the
student level. The same is true for countries with low average performance such as the depicted
developing countries, where Brazil has a long right tail in contrast to Indonesia which shows a
much greater density around its median.
To depict both ends of the distribution, we aim to calculate both the share of students
reaching a basic level of literacy in the different subjects equivalent to 400 test-score points on
the PISA scale (one student-level s.d. below the OECD mean) and the share of students reaching
a top performance level equivalent to 600 test-score points on the PISA scale.
To do so, we use the above transformation to translate these two thresholds into the specific
metric of each ISAT. Using the microdata of each ISAT, we then calculate the share of students
in each country reaching the thresholds in the overall distribution of the ISAT. The information
from the different ISATs is again combined by taking a simple average of the shares across tests.
41 The sources of the underlying international test data are: Beaton et al. (1996a, 1996b), Lee and Barro (2001), Martin et al. (1997, 2000, 2004), Mullis et al. (1997, 1998, 2000, 2003, 2004), OECD (2001, 2003b, 2004), and own calculations based on the microdata of the early tests. 42 Twenty-five of the total of 77 countries with cognitive-skill data are not included in the growth database due to lack of data on economic output or because they drop out of the sample for a standard exclusion criterion in growth analyses (15 former communist countries, 3 countries for which oil production is the dominant industry, 2 small countries, 3 newly created countries, 2 further countries lacking early output data). In addition, two strong outliers are excluded in most models (see above). There are four countries with cognitive-skill data which have a few years of economic data missing at the beginning or end of the 1960-2000 period. Data for Tunisia start in 1961, and data for Cyprus (1996), Singapore (1996), and Taiwan (1998) end slightly earlier than in 2000. These countries were included in the growth regressions by estimating average annual growth over the available 36-to-39-year period. 43 Unfortunately, the microdata from the FIMS test do not seem to be available in an accessible way any more, so that the distributional measures only draw on the remaining ISATs.

A8
Trends over time. The standardized performance information over a long period of time also
allows us to derive longitudinal patterns of test scores for countries that participated both in early
and recent ISATs. Given the amplification of noise in first-differenced data and the limitations
of our rescaling method for poorly performing countries mentioned above, we perform the trend
estimation only for the sample of 15 OECD countries that participated both in an ISAT before
1985 (i.e., on FIMS, FISS, FIRS, SIMS, or SISS) and up to 2003, spanning a period of nearly 20
years. (Twelve countries participated in a test before 1971, spanning a period of over 30 years.)
To estimate the trend in test performance, for each country we regress performance on the
different ISATs, expressed on the standardized test metric developed above, on dummies for the
subjects, dummies for the age groups, and on the year the test was conducted. The unit of
observation in these country-specific regressions is each subject-by-age-by-year occasion of an
ISAT, using all available tests, subjects, and age groups (see Appendix Table B2). To account
for heteroscedasticity and for the fact that the signal-to-noise ratio will be larger the smaller the
number of OSG countries that participated in a test, we weight the regression by the square root
of the number of OSG countries participating in each test. The coefficient on the year variable
provides us with the time trend that we are interested in. The patterns captured by these country-
specific regressions are shown in Figure B3 that simply extrapolates scores for the range of
1975-2000 with scores anchored by the PISA 2000 score.
One possible worry with combining the different tests into a single measure and with
estimating performance changes over time is that enrollment shares have changed to different
extents over time, especially at the secondary level. To test the extent to which this affects our
cognitive-skill measures, we calculated the correlation between our measure of trend in test
scores and changes in enrollment rates. It turns out that the two are orthogonal to each other,
diluting worries that differential changes in enrollment bias the results reported in this paper.
Data Sources
Beaton, Albert E., Ina V.S. Mullis, Michael O. Martin, Eugenio J. Gonzalez, Dana L. Kelly, and Teresa A. Smith.
1996. Mathematics Achievement in the Middle School Years: IEA’s Third International Mathematics and
Science Study (TIMSS). Chestnut Hill, MA: Boston College.
Beaton, Albert E., Michael O. Martin, Ina V.S. Mullis, Eugenio J. Gonzalez, Teresa A. Smith, and Dana L. Kelly.
1996. Science Achievement in the Middle School Years: IEA’s Third International Mathematics and Science
Study (TIMSS). Chestnut Hill, MA: Boston College.

A9
Lee, Jong-Wha, and Robert J. Barro. 2001. Schooling Quality in a Cross-Section of Countries. Economica 68, no.
272: 465-488.
Martin, Michael O., Ina V.S. Mullis, Albert E. Beaton, Eugenio J. Gonzalez, Teresa A. Smith, and Dana L. Kelly.
1997. Science Achievement in the Primary School Years: IEA’s Third International Mathematics and Science
Study (TIMSS). Chestnut Hill, MA: Boston College.
Martin, Michael O., Ina V.S. Mullis, Eugenio J. Gonzalez, Kelvin D. Gregory, Teresa A. Smith, Steven J.
Chrostowski, Robert A. Garden, and Kathleen M. O’Connor. 2000. TIMSS 1999 International Science Report:
Findings from IEA’s Repeat of the Third International Mathematics and Science Study at the Eighth Grade.
Chestnut Hill, MA: Boston College.
Martin, Michael O., Ina V.S. Mullis, Eugenio J. Gonzalez, and Steven J. Chrostowski. 2004. TIMSS 2003
International Science Report: Findings from IEA’s Trends in International Mathematics and Science Study at
the Fourth and Eighth Grades. Chestnut Hill, MA: Boston College.
Mullis, Ina V.S., Michael O. Martin, Albert E. Beaton, Eugenio J. Gonzalez, Dana L. Kelly, and Teresa A. Smith.
1997. Mathematics Achievement in the Primary School Years: IEA’s Third International Mathematics and
Science Study (TIMSS). Chestnut Hill, MA: Boston College.
———. 1998. Mathematics and Science Achievement in the Final Year of Secondary School: IEA’s Third
International Mathematics and Science Study (TIMSS). Chestnut Hill, MA: Boston College.
Mullis, Ina V.S., Michael O. Martin, Eugenio J. Gonzalez, Kelvin D. Gregory, Robert A. Garden, Kathleen M.
O’Connor, Steven J. Chrostowski, and Teresa A. Smith. 2000. TIMSS 1999 International Mathematics Report:
Findings from IEA’s Repeat of the Third International Mathematics and Science Study at the Eighth Grade.
Chestnut Hill, MA: Boston College.
Mullis, Ina V.S., Michael O. Martin, Eugenio J. Gonzalez, and Ann M. Kennedy. 2003. PIRLS 2001 International
Report: IEA’s Study of Reading Literacy Achievement in Primary School in 35 Countries. Chestnut Hill, MA:
International Study Center, Boston College.
Mullis, Ina V.S., Michael O. Martin, Eugenio J. Gonzalez, and Steven J. Chrostowski. 2004. TIMSS 2003
International Mathematics Report: Findings from IEA’s Trends in International Mathematics and Science Study
at the Fourth and Eighth Grades. Chestnut Hill, MA: Boston College.
Organisation for Economic Co-operation and Development (OECD). 2001. Knowledge and Skills for Life: First
Results from the OECD Programme for International Student Assessment (PISA) 2000. Paris: OECD.
———. 2003a. Education at a Glance: OECD Indicators 2003. Paris: OECD.
———. 2003b. Literacy Skills for the World of Tomorrow: Further Results from PISA 2000. Paris: OECD.
———. 2004. Learning for Tomorrow’s World: First Results from PISA 2003. Paris: OECD.
U.S. Department of Education, Institute of Education Sciences. 2008. National Assessment of Educational Progress
– The Nation’s Report Card. Website: http://nces.ed.gov/nationsreportcard/aboutnaep.asp.

A10
Figure B1: Student Achievement in the United States over Time: The National Assessment of Educational Progress (NAEP)
200
220
240
260
280
300
32019
6919
7119
73
1975
1977
1979
1981
1983
1985
1987
1989
1991
1993
1995
1997
1999
read-9read-13read-17math-9math-13math-17science-9science-13science-17
Source: U.S. Department of Education, Institute of Education Sciences (2008).

A11
Figure B2: Selected Examples of the Distribution of Student Performance 0
.001
.002
.003
.004
200 400 600 800BEL
0.0
01.0
02.0
03.0
04
200 400 600 800DEU
0.0
01.0
02.0
03.0
04.0
05
200 400 600 800FIN
0.0
01.0
02.0
03.0
04
200 400 600 800USA
0.0
01.0
02.0
03.0
04
200 400 600 800BRA
0.0
02.0
04.0
06
200 400 600 800IDN
0.0
01.0
02.0
03.0
04.0
05
200 400 600 800THA
0.0
01.0
02.0
03.0
04
200 400 600 800URY
Notes: Kernel densities of student performance on the PISA 2003 math test. Bold solid line: specified country; thin dotted line: OECD countries. Codes: Belgium (BEL), Germany (DEU), Finland (FIN), United States of America (USA), Brazil (BRA), Indonesia (IDN), Thailand (THA), Uruguay (URY).
Mean: 529 Median: 537
Mean: 503 Median: 510
Mean: 544 Median: 543
Mean: 483 Median: 483
Mean: 356 Median: 348
Mean: 360 Median: 354
Mean: 417 Median: 409
Mean: 422 Median: 423
BEL
FIN
BRA
THA
DEU
USA
IDN
URY
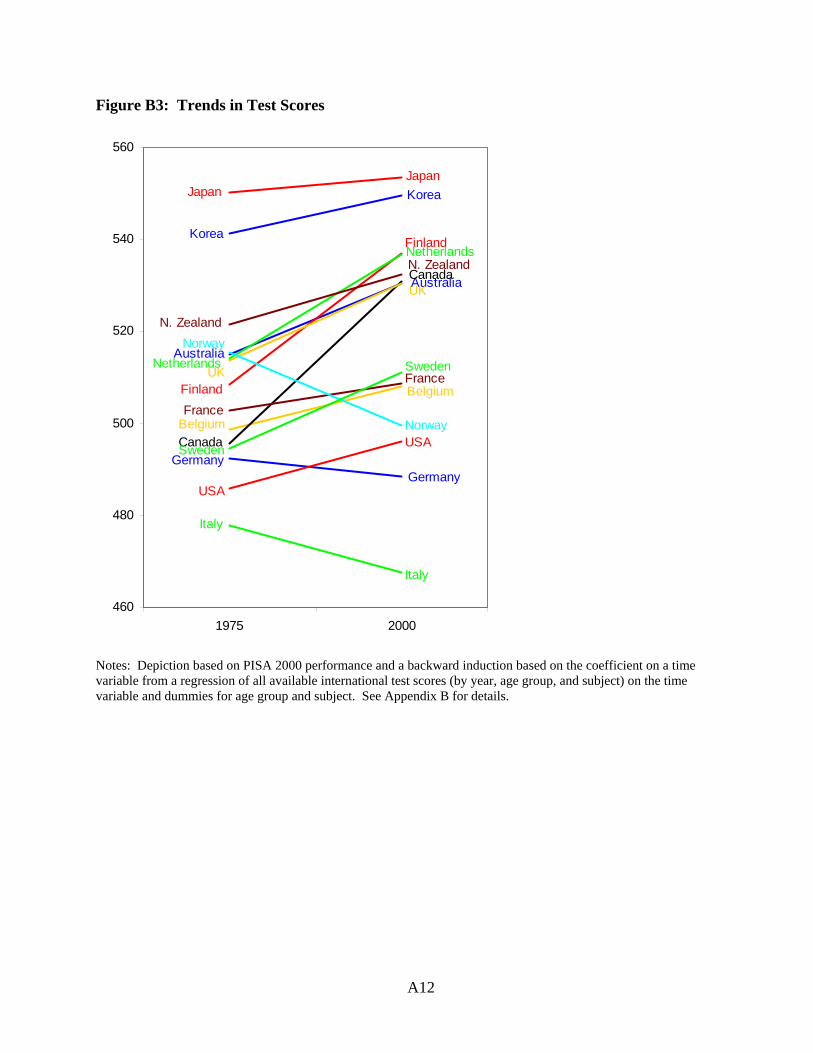
A12
Figure B3: Trends in Test Scores
Australia
Australia
Belgium
BelgiumCanada
Canada
Finland
Finland
France
FranceUK
UK
GermanyGermany
Italy
Italy
JapanJapanKorea
KoreaNetherlands
Netherlands
N. Zealand
N. ZealandNorway
Norway
Sweden
Sweden
USA
USA
460
480
500
520
540
560
1975 2000
Notes: Depiction based on PISA 2000 performance and a backward induction based on the coefficient on a time variable from a regression of all available international test scores (by year, age group, and subject) on the time variable and dummies for age group and subject. See Appendix B for details.
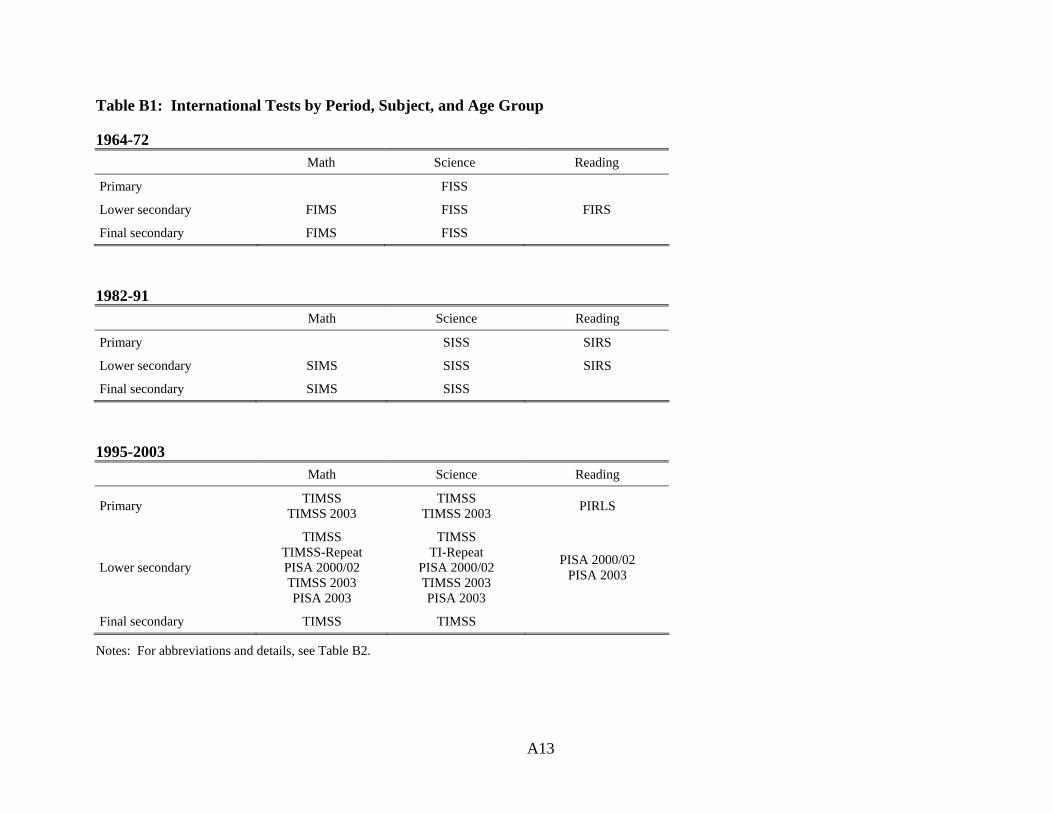
A13
Table B1: International Tests by Period, Subject, and Age Group
1964-72 Math Science Reading
Primary FISS
Lower secondary FIMS FISS FIRS
Final secondary FIMS FISS
1982-91 Math Science Reading
Primary SISS SIRS
Lower secondary SIMS SISS SIRS
Final secondary SIMS SISS
1995-2003 Math Science Reading
Primary TIMSS TIMSS 2003
TIMSS TIMSS 2003 PIRLS
Lower secondary
TIMSS TIMSS-Repeat PISA 2000/02 TIMSS 2003 PISA 2003
TIMSS TI-Repeat
PISA 2000/02 TIMSS 2003 PISA 2003
PISA 2000/02 PISA 2003
Final secondary TIMSS TIMSS
Notes: For abbreviations and details, see Table B2.

A14
Table B2: The International Student Achievement Tests
Abbr. Study Year Subject Agea,b Countriesc Organizationd Scalee
1 FIMS First International Mathematics Study 1964 Math 13,FS 11 IEA PC
2 FISS First International Science Study 1970-71 Science 10,14,FS 14,16,16 IEA PC
3 FIRS First International Reading Study 1970-72 Reading 13 12 IEA PC
4 SIMS Second International Mathematics Study 1980-82 Math 13,FS 17,12 IEA PC
5 SISS Second International Science Study 1983-84 Science 10,13,FS 15,17,13 IEA PC
6 SIRS Second International Reading Study 1990-91 Reading 9,13 26,30 IEA IRT
7 TIMSS Third International Mathematics and Science Study 1994-95 Math/Science 9(3+4), 13(7+8),FS 25,39,21 IEA IRT
8 TIMSS-Repeat TIMSS-Repeat 1999 Math/Science 13(8) 38 IEA IRT
9 PISA 2000/02 Programme for International Student Assessment 2000+02 Reading/ Math/Science 15 31+10 OECD IRT
10 PIRLS Progress in International Reading Literacy Study 2001 Reading 9(4) 34 IEA IRT
11 TIMSS 2003 Trends in International Mathematics and Science Study 2003 Math/Science 9(4),13(8) 24,45 IEA IRT
12 PISA 2003 Programme for International Student Assessment 2003 Reading/ Math/Science 15 40 OECD IRT
Notes: a. Grade in parentheses where grade level was target population. b. FS = final year of secondary education (differs across countries). c. Number of participating countries that yielded internationally comparable performance data. d. Conducting organization: International Association for the Evaluation of Educational Achievement (IEA); Organisation for Economic Co-operation and Development (OECD). e. Test scale: percent-correct formal (PC); item-response-theory proficiency scale (IRT).
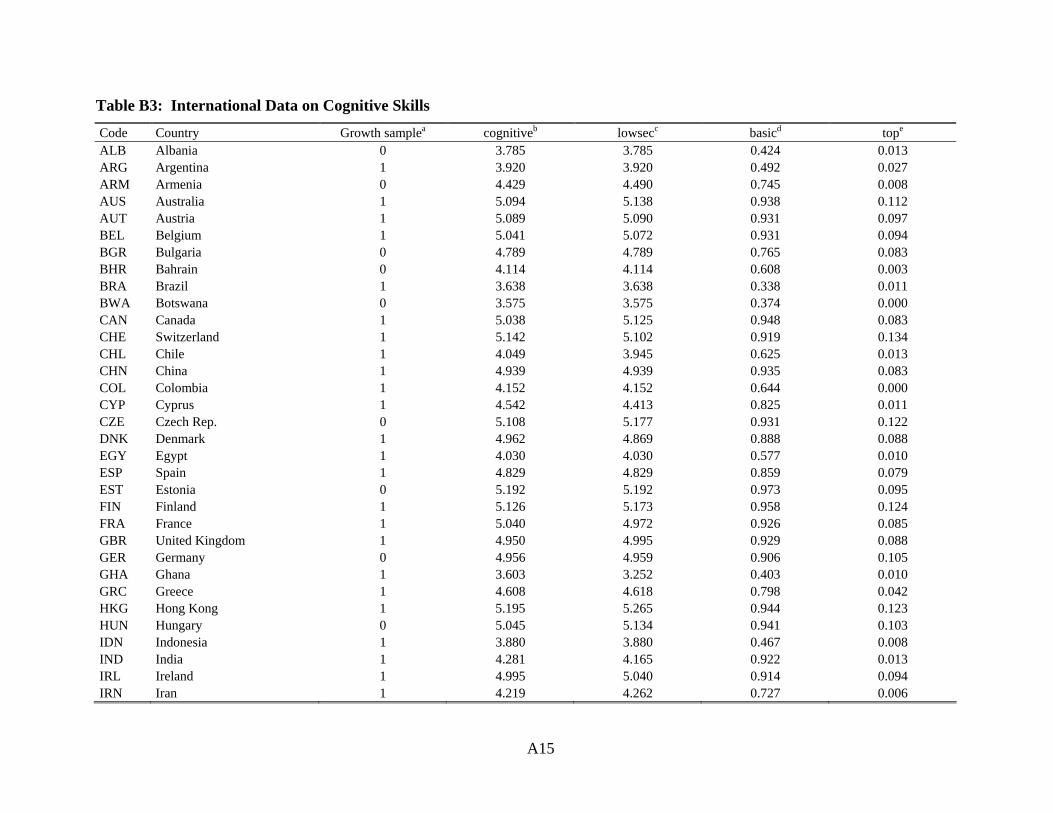
A15
Table B3: International Data on Cognitive Skills
Code Country Growth samplea cognitiveb lowsecc basicd tope ALB Albania 0 3.785 3.785 0.424 0.013 ARG Argentina 1 3.920 3.920 0.492 0.027 ARM Armenia 0 4.429 4.490 0.745 0.008 AUS Australia 1 5.094 5.138 0.938 0.112 AUT Austria 1 5.089 5.090 0.931 0.097 BEL Belgium 1 5.041 5.072 0.931 0.094 BGR Bulgaria 0 4.789 4.789 0.765 0.083 BHR Bahrain 0 4.114 4.114 0.608 0.003 BRA Brazil 1 3.638 3.638 0.338 0.011 BWA Botswana 0 3.575 3.575 0.374 0.000 CAN Canada 1 5.038 5.125 0.948 0.083 CHE Switzerland 1 5.142 5.102 0.919 0.134 CHL Chile 1 4.049 3.945 0.625 0.013 CHN China 1 4.939 4.939 0.935 0.083 COL Colombia 1 4.152 4.152 0.644 0.000 CYP Cyprus 1 4.542 4.413 0.825 0.011 CZE Czech Rep. 0 5.108 5.177 0.931 0.122 DNK Denmark 1 4.962 4.869 0.888 0.088 EGY Egypt 1 4.030 4.030 0.577 0.010 ESP Spain 1 4.829 4.829 0.859 0.079 EST Estonia 0 5.192 5.192 0.973 0.095 FIN Finland 1 5.126 5.173 0.958 0.124 FRA France 1 5.040 4.972 0.926 0.085 GBR United Kingdom 1 4.950 4.995 0.929 0.088 GER Germany 0 4.956 4.959 0.906 0.105 GHA Ghana 1 3.603 3.252 0.403 0.010 GRC Greece 1 4.608 4.618 0.798 0.042 HKG Hong Kong 1 5.195 5.265 0.944 0.123 HUN Hungary 0 5.045 5.134 0.941 0.103 IDN Indonesia 1 3.880 3.880 0.467 0.008 IND India 1 4.281 4.165 0.922 0.013 IRL Ireland 1 4.995 5.040 0.914 0.094 IRN Iran 1 4.219 4.262 0.727 0.006

A16
Table B3 (continued)
Code Country Growth samplea cognitiveb lowsecc basicd tope ISL Iceland 1 4.936 4.945 0.908 0.074 ISR Israel 1 4.686 4.660 0.826 0.053 ITA Italy 1 4.758 4.693 0.875 0.054 JOR Jordan 1 4.264 4.264 0.662 0.044 JPN Japan 1 5.310 5.398 0.967 0.168 KOR Korea, Rep. 1 5.338 5.401 0.962 0.178 KWT Kuwait 0 4.046 4.223 0.575 0.000 LBN Lebanon 0 3.950 3.950 0.595 0.002 LIE Liechtenstein 0 5.128 5.128 0.860 0.198 LTU Lithuania 0 4.779 4.694 0.891 0.030 LUX Luxembourg 0 4.641 4.641 0.776 0.067 LVA Latvia 0 4.803 4.779 0.869 0.050 MAC Macao-China 0 5.260 5.260 0.919 0.204 MAR Morocco 1 3.327 3.243 0.344 0.001 MDA Moldova 0 4.530 4.419 0.787 0.029 MEX Mexico 1 3.998 3.998 0.489 0.009 MKD Macedonia 0 4.151 4.151 0.609 0.028 MYS Malaysia 1 4.838 4.838 0.864 0.065 NGA Nigeria 0 4.154 4.163 0.671 0.001 NLD Netherlands 1 5.115 5.149 0.965 0.092 NOR Norway 1 4.830 4.855 0.894 0.056 NZL New Zealand 1 4.978 5.009 0.910 0.106 PER Peru 1 3.125 3.125 0.182 0.002 PHL Philippines 1 3.647 3.502 0.485 0.006 POL Poland 0 4.846 4.861 0.838 0.099 PRT Portugal 1 4.564 4.592 0.803 0.032 PSE Palestine 0 4.062 4.062 0.571 0.008 ROM Romania 1 4.562 4.562 0.780 0.046 RUS Russian Fed. 0 4.922 4.906 0.884 0.081 SAU Saudi Arabia 0 3.663 3.663 0.331 0.000 SGP Singapore 1 5.330 5.512 0.945 0.177 SRB Serbia 0 4.447 4.447 0.718 0.024 SVK Slovak Rep. 0 5.052 5.052 0.906 0.112
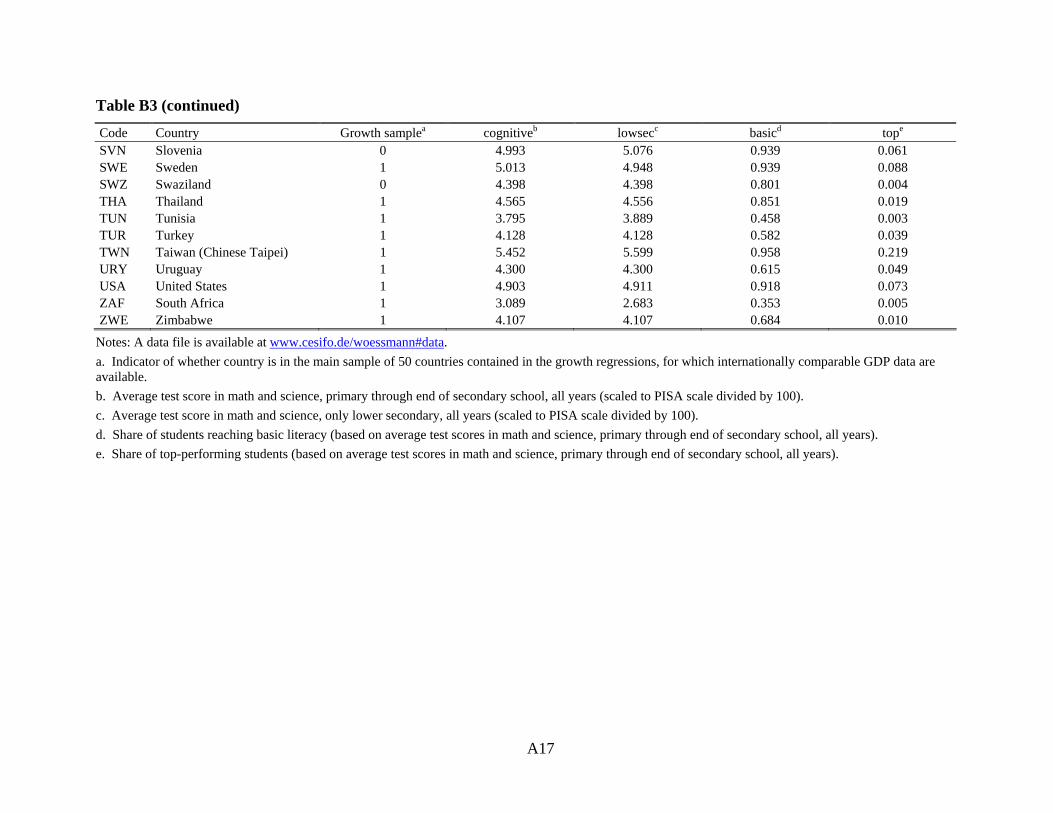
A17
Table B3 (continued)
Code Country Growth samplea cognitiveb lowsecc basicd tope SVN Slovenia 0 4.993 5.076 0.939 0.061 SWE Sweden 1 5.013 4.948 0.939 0.088 SWZ Swaziland 0 4.398 4.398 0.801 0.004 THA Thailand 1 4.565 4.556 0.851 0.019 TUN Tunisia 1 3.795 3.889 0.458 0.003 TUR Turkey 1 4.128 4.128 0.582 0.039 TWN Taiwan (Chinese Taipei) 1 5.452 5.599 0.958 0.219 URY Uruguay 1 4.300 4.300 0.615 0.049 USA United States 1 4.903 4.911 0.918 0.073 ZAF South Africa 1 3.089 2.683 0.353 0.005 ZWE Zimbabwe 1 4.107 4.107 0.684 0.010
Notes: A data file is available at www.cesifo.de/woessmann#data. a. Indicator of whether country is in the main sample of 50 countries contained in the growth regressions, for which internationally comparable GDP data are available. b. Average test score in math and science, primary through end of secondary school, all years (scaled to PISA scale divided by 100). c. Average test score in math and science, only lower secondary, all years (scaled to PISA scale divided by 100). d. Share of students reaching basic literacy (based on average test scores in math and science, primary through end of secondary school, all years). e. Share of top-performing students (based on average test scores in math and science, primary through end of secondary school, all years).
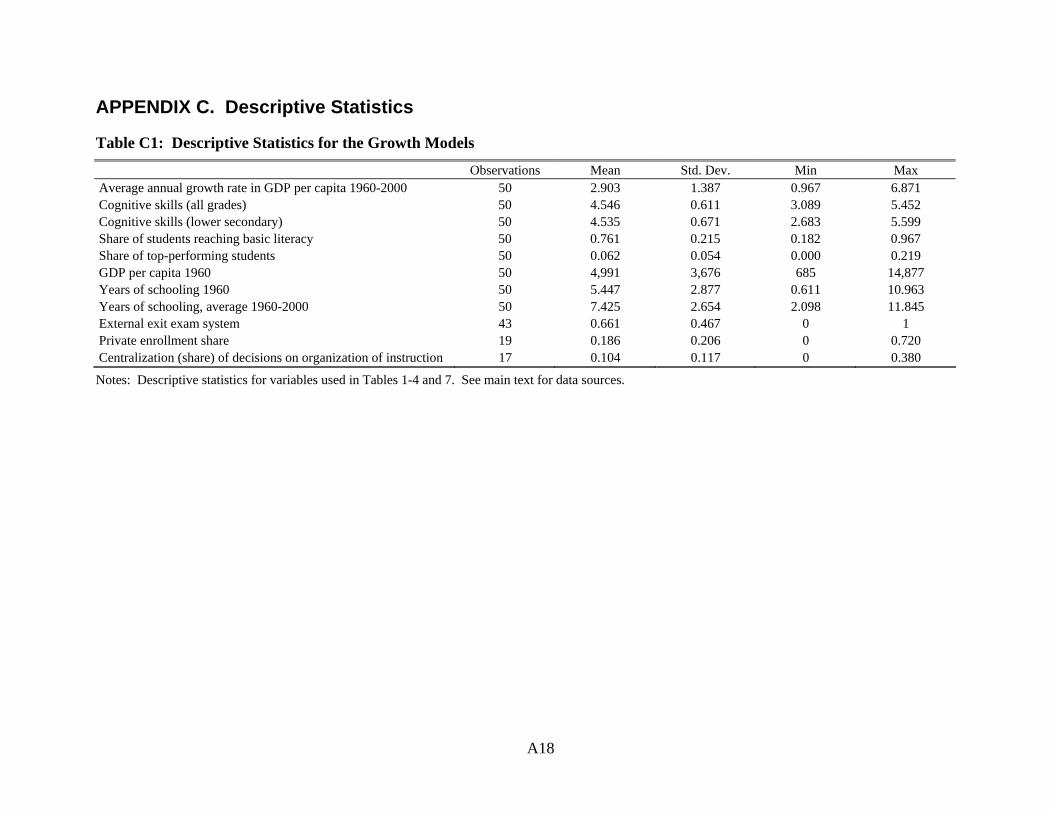
A18
APPENDIX C. Descriptive Statistics
Table C1: Descriptive Statistics for the Growth Models
Observations Mean Std. Dev. Min Max Average annual growth rate in GDP per capita 1960-2000 50 2.903 1.387 0.967 6.871 Cognitive skills (all grades) 50 4.546 0.611 3.089 5.452 Cognitive skills (lower secondary) 50 4.535 0.671 2.683 5.599 Share of students reaching basic literacy 50 0.761 0.215 0.182 0.967 Share of top-performing students 50 0.062 0.054 0.000 0.219 GDP per capita 1960 50 4,991 3,676 685 14,877 Years of schooling 1960 50 5.447 2.877 0.611 10.963 Years of schooling, average 1960-2000 50 7.425 2.654 2.098 11.845 External exit exam system 43 0.661 0.467 0 1 Private enrollment share 19 0.186 0.206 0 0.720 Centralization (share) of decisions on organization of instruction 17 0.104 0.117 0 0.380
Notes: Descriptive statistics for variables used in Tables 1-4 and 7. See main text for data sources.

A19
Table C2: Descriptive Statistics for the U.S.-Immigrant Models
Observations Mean Std. Dev. Min Max Annual earnings 309,574 33,243 40,983 1,000 385,000 Cognitive skills 309,574 4.334 0.535 3.089 5.452 Educated in country of origin 309,574 0.837 0.370 0 1 Years of schooling 309,574 11.558 5.006 0 20 Potential experience 309,574 24.841 11.966 0 87
Notes: Descriptive statistics for variables used in Table 5. See main text for data sources.
Table C3: Descriptive Statistics for the Changes-in-Growth-Paths Models
Observations Mean Std. Dev. Min Max Trend in growth rate of GDP per capita 1975-2000 15 -0.007 0.071 -0.118 0.106 Trend in cognitive skills 15 0.409 0.546 -0.630 1.420 Average annual growth rate in GDP per capita 1975-2000 15 2.318 1.106 0.855 5.978 GDP per capita 1975 15 13,884 3,217 3,720 18,175 Change in years of schooling 1975-2000 15 1.994 0.895 0.899 4.376
Notes: Descriptive statistics for variables used in Table 6. See main text for data sources.