erdc/el tr-10-18 'characterization of park visitors
TRANSCRIPT

ERD
C/EL
TR-
10-1
8
Recreation Management Support Program
Characterization of Park Visitors, Visitation Levels, and Associated Economic Impacts of Recreation at Bull Shoals, Norfork, and Table Rock Lakes
Envi
ronm
enta
l Lab
orat
ory
Richard Kasul, Daniel Stynes, Lichu Lee, Wen-Huei Chang, R. Scott Jackson, Christine Wibowo, Sam Franco, and Kathleen Perales
November 2010
Approved for public release; distribution is unlimited.

Recreation Management Support Program
ERDC/EL TR-10-18 November 2010
Characterization of Park Visitors, Visitation Levels, and Associated Economic Impacts of Recreation at Bull Shoals, Norfork, and Table Rock Lakes
Richard Kasul, Lichu Lee, R. Scott Jackson, Christine Wibowo, Sam Franco, and Kathleen Perales Environmental Laboratory U.S. Army Engineer Research and Development Center 3909 Halls Ferry Road Vicksburg, MS 39180-6199
Daniel Stynes Department of Community, Agriculture, Recreation, and Resource Studies Michigan State University East Lansing, MI 48824-1222
Lichu Lee Bowhead Information Technology Services, Inc. Vicksburg, MS 39180
Wen-Huei Chang U.S. Army Institute for Water Resources Alexandria, VA 22315
Final report Approved for public release; distribution is unlimited
Prepared for Headquarters, U.S. Army Corps of Engineers Washington, DC 20314-1000
ERDC/EL TR-10-18 ii
Abstract: Planning for future needs of recreation visitors presents many challenges at federal lakes that have a mix of public (federal, state, and local) and private recreation providers, and where ongoing regional growth and other trends are influencing visitor number and activities. Under these circumstances, a periodic assessment of lake recreation is often used to document current recreational patterns and identify ongoing and emerging trends that could or should influence recreation planning and investment decisions. This study provides a broadly scoped examination of park-based recreation at Bull Shoals, Norfork, and Table Rock Lakes, so that present and emerging recreation needs can be included in the broader planning efforts for the upper White River watershed of Arkansas and Missouri. This study was based on survey data collected from recreation visitors and other current data collected by lake managers as part of their visitor monitoring programs. This report provides estimates of annual visitor use levels, profiles of visitor spending, and the economic impact of visitor spending on the region surrounding the lakes. The report also examines visitor recreation patterns, visitor perceptions of lake and park attributes that affect the recreational experience, and visitor-perceived trends on the lakes and in the parks, and the impact of these trends on the park visitors who recreate on these lakes.
DISCLAIMER: The contents of this report are not to be used for advertising, publication, or promotional purposes. Citation of trade names does not constitute an official endorsement or approval of the use of such commercial products. All product names and trademarks cited are the property of their respective owners. The findings of this report are not to be construed as an official Department of the Army position unless so designated by other authorized documents. DESTROY THIS REPORT WHEN NO LONGER NEEDED. DO NOT RETURN IT TO THE ORIGINATOR.
ERDC/EL TR-10-18 iii
Contents Figures and Tables ........................................................................................................................................ iv
Preface ............................................................................................................................................................ vi
Unit Conversion Factors ........................................................................................................................... viii
1 Introduction ............................................................................................................................................ 1
2 Study Area .............................................................................................................................................. 4
Norfork Lake ............................................................................................................................. 4 Bull Shoals Lake ....................................................................................................................... 5 Table Rock Lake ....................................................................................................................... 6 Informal lakeshore access sites .............................................................................................. 7
3 Methods .................................................................................................................................................. 9
Visitor surveys ........................................................................................................................... 9 Measuring traffic volume ....................................................................................................... 12 Estimating visitor statistics .................................................................................................... 13 Estimating visitor use ............................................................................................................. 14 Economic impact analysis ..................................................................................................... 15
4 Results ..................................................................................................................................................18
Survey data ............................................................................................................................. 18 Visitor use levels at metered recreation parks and access points ...................................... 20 Visitor use levels at unmetered access points and informal lakeshore recreation sites ......................................................................................................................................... 29 Recreation activities ............................................................................................................... 29 Further characterization of fishing activity ........................................................................... 34 Characterization of visitors and visitor groups ..................................................................... 35 Respondent socio-demographics .......................................................................................... 40 Visitor perceptions .................................................................................................................. 40 Visitor-Perceived Trends ......................................................................................................... 46 Trip spending .......................................................................................................................... 50 Total annual spending ............................................................................................................ 57 Local economic significance and impacts of visitor spending ............................................ 60
5 Discussion ............................................................................................................................................ 67
Comparison of lakes .............................................................................................................. 67 Visitor feedback for managers ............................................................................................... 69
References ................................................................................................................................................... 71
Appendix A. Recreation Survey ................................................................................................................ 72
Report Documentation Page

ERDC/EL TR-10-18 iv
Figures and Tables
Figures
Figure 1. Corps of Engineers reservoirs located in the White River watershed. This study included Table Rock Lake, Bull Shoals Lake, and Norfork Lake, all of which occur in the upper White River watershed on the boundary separating the states of Arkansas and Missouri. .......................................................................................................................................................... 1
Figure 2. Informal lakeshore recreation site on Table Rock Lake used by visitors for camping, picnicking, swimming. Boats are launched from the natural shoreline. ............................... 8
Figure 3. Private boat ramp associated with a permitted boat dock at Table Rock Lake. Many of these ramps are used by area residents to access the lake for day-use boating. ................. 8
Figure 4. Monthly distribution of day-use and camping visits. ............................................................... 30
Figure 5. Importance and satisfaction with park and lake attributes by boaters, fishers, and campers. ................................................................................................................................................ 47
Tables
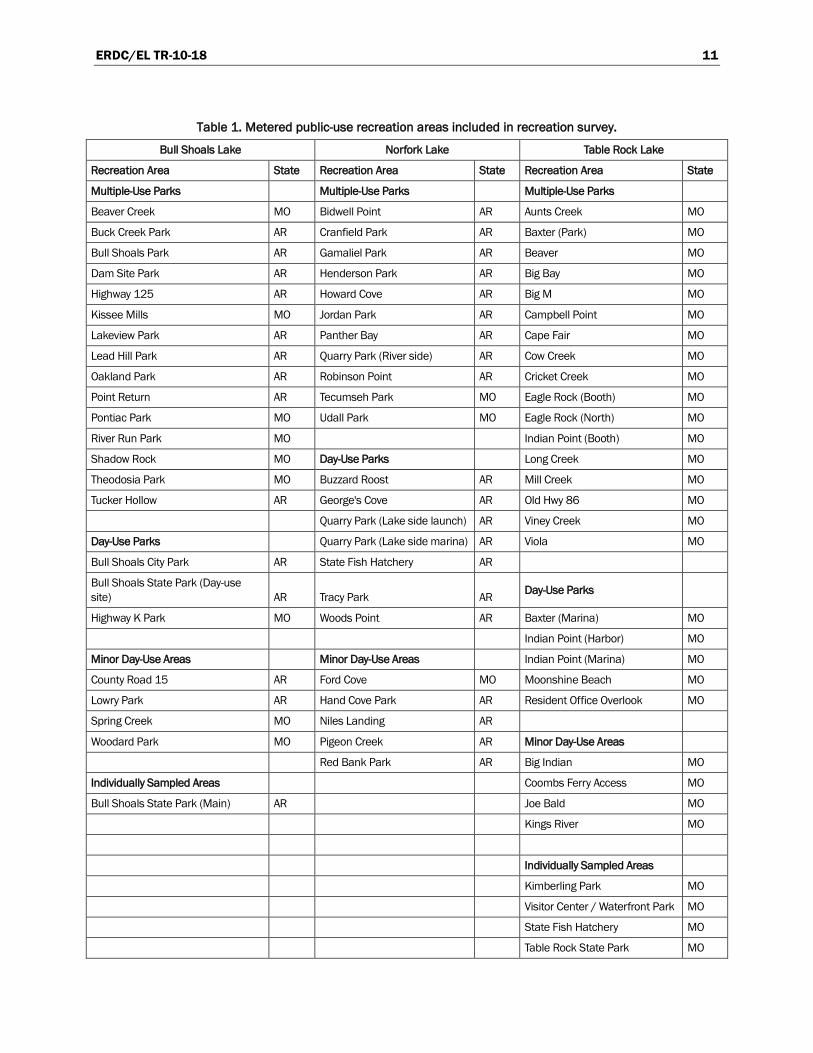
Table 1. Metered public-use recreation areas included in recreation survey. ..................................... 11
Table 2. Allocation of 454 3-hr sampling periods in traffic-stop survey................................................ 12
Table 3. Outcome of sampling effort. ........................................................................................................ 19
Table 4. Complete mail questionnaires available for spending analysis. ............................................. 19
Table 5. Statistics associated with recreation vehicles and visitors at developed recreation areas. .......................................................................................................................................... 21
Table 6. Estimated total lake visits and associated visitor hours at recreation parks from October 2004 through September 2005. ................................................................................................ 27
Table 7. Estimates of annual visits and visitor hours associated with informal lakeshore recreation sites. ............................................................................................................................................ 31
Table 8. Mean participation rate in selected recreational activities during lake visit. ........................ 31
Table 9. Primary activities of lake visitors. ................................................................................................ 32
Table 10. Percentage of recreation parties reporting participation in one or more of 26 recreation activities in the mail survey. ..................................................................................................... 33
Table 11. Fishing party statistics. ............................................................................................................... 34
Table 12. Angler success and fish retention. ........................................................................................... 36
Table 13. Number of people in departing recreation vehicles. .............................................................. 37
Table 14. Primary purpose of trip in which lake visit occurred. ............................................................. 38
Table 15. Respondent familiarity with other Corps of Engineer lakes in the region. .......................... 38
Table 16. Previous history of visiting lake where surveyed. ................................................................... 39
Table 17. Reason for choosing the lake where surveyed rather than another lake. ........................... 40
Table 18. Characteristics of mail survey respondents. ........................................................................... 41
Table 19. Visitor ratings of potential benefits of recreation visit. .......................................................... 42
ERDC/EL TR-10-18 v
Table 20. Importance of lake and site attributes for all lake visitors. ................................................... 43
Table 21. Importance of lake and site attributes for different user groups. ........................................ 44
Table 22. Satisfaction of recreation visitors with lake and site attributes............................................ 45
Table 23. Satisfaction of recreation visitors by lake. ............................................................................... 45
Table 24. Summary of trends identified by lake visitors. ........................................................................ 48
Table 25. Suggestions for improvements offered by lake visitors. ........................................................ 51
Table 26. Mean trip spending by visitor segment .................................................................................... 52
Table 27. Mean trip spending by visitor segment combining data from all lakes. .............................. 53
Table 28. Mean trip spending of visitors to Table Rock Lake ($ per party per trip). ........................... 54
Table 29. Mean trip spending of visitors to Norfork Lake ($ per party per trip). ................................. 55
Table 30. Mean trip spending by visitors to Bull Shoals Lake ($ per party per trip). .......................... 56
Table 31. Per-night spending for overnight trips ($ per party per trip). ................................................. 57
Table 32. Total visitor spending by lake. ................................................................................................... 57
Table 33. Total spending by visitors to Table Rock Lake ($000's). ........................................................ 58
Table 34. Total spending by visitors Norfork Lake ($000's). .................................................................. 59
Table 35. Total spending by visitors to Bull Shoals Lake ($000's). ....................................................... 60
Table 36. Local economic significance and effects, by lake. ................................................................. 61
Table 37. Local economic significance and impacts of Table Rock visitor spending. ......................... 63
Table 38. Local economic significance and impacts of Norfork Lake visitor spending. ..................... 64
Table 39. Local economic significance and impacts of Bull Shoals visitor spending. ........................ 65
Table 40. Economic impacts of visitor spending on two-state region. .................................................. 66

ERDC/EL TR-10-18 vi
Preface
This work was performed by the U.S. Army Engineer Research and Development Center (ERDC) with substantial participation and support from Corps of Engineers Mountain Home and Table Rock Lake Project staffs and Missouri Department of Conservation (MDOC) and Arkansas Department of Fish and Game (ADFG) fisheries policy and management staffs.
Funds for this study were provided by the U.S Army Corps of Engineers, MDOC and ADFG, through the U.S. Army Engineer District, Memphis, for support of the White River Basin Comprehensive Study. Managers for this study at the Memphis District were initially Timothy Flinn and later, Edward Lambert and Paul Hamm. The study was implemented through the U.S. Army Engineer District, Little Rock, where it was managed init-ially by Tony Hill and later by Jonathan Long.
The survey tools and procedures used in this study were developed as prototypes for visitor use monitoring at Corps recreation lakes nationwide. Because of the need for updated visitor use monitoring tools at Corps lakes and the applicability of the tools and procedures developed as part of this study for meeting those needs, funds for development of data acquisition tools and analysis procedures were provided by the Corps of Engineers Recreation Management and Support Program (RMSP), a program funded by Corps of Engineers Operations and Maintenance General Appropriations.
This report was prepared by Richard Kasul, ERDC Environmental Labor-atory (EL); Dr. Daniel Stynes, Department of Community, Agriculture, Recreation, and Resource Studies, Michigan State University; Dr. Lichu Lee, Bowhead Information Technology Services, Inc. (BITS); Dr. Wen Chang, Institute for Water Resources; and R. Scott Jackson, Christine Wibowo, Sam Franco, and Kathleen Perales, ERDC-EL. It was submitted for publication on September 10, 2008.
Helpful reviews of this report were provided by Jim Henderson and Dr. David Price, ERDC-EL.

ERDC/EL TR-10-18 vii
This work was performed under the general supervision of Dr. Michael Passmore, Chief, and Dr. David Price, Acting Chief, Ecological Resources Branch; EL; Dr. David Tazik, Chief and Dr. Timothy Lewis, Acting Chief, Ecosystem Evaluation and Engineering Division, EL; and Dr. Elizabeth C. Fleming, Director, EL. At the time of publication, Ms. Antisa Webb was Chief, Ecological Resources Branch, EL and Mr. Edmund Russo was Chief, Ecosystem Evaluation and Engineering Division, EL.
COL Richard B. Jenkins was Commander and Executive Director of ERDC during the study and COL Gary E. Johnston was Commander and Executive Director at the time of publication. Dr. Jeffery P. Holland was Director.
ERDC/EL TR-10-18 viii
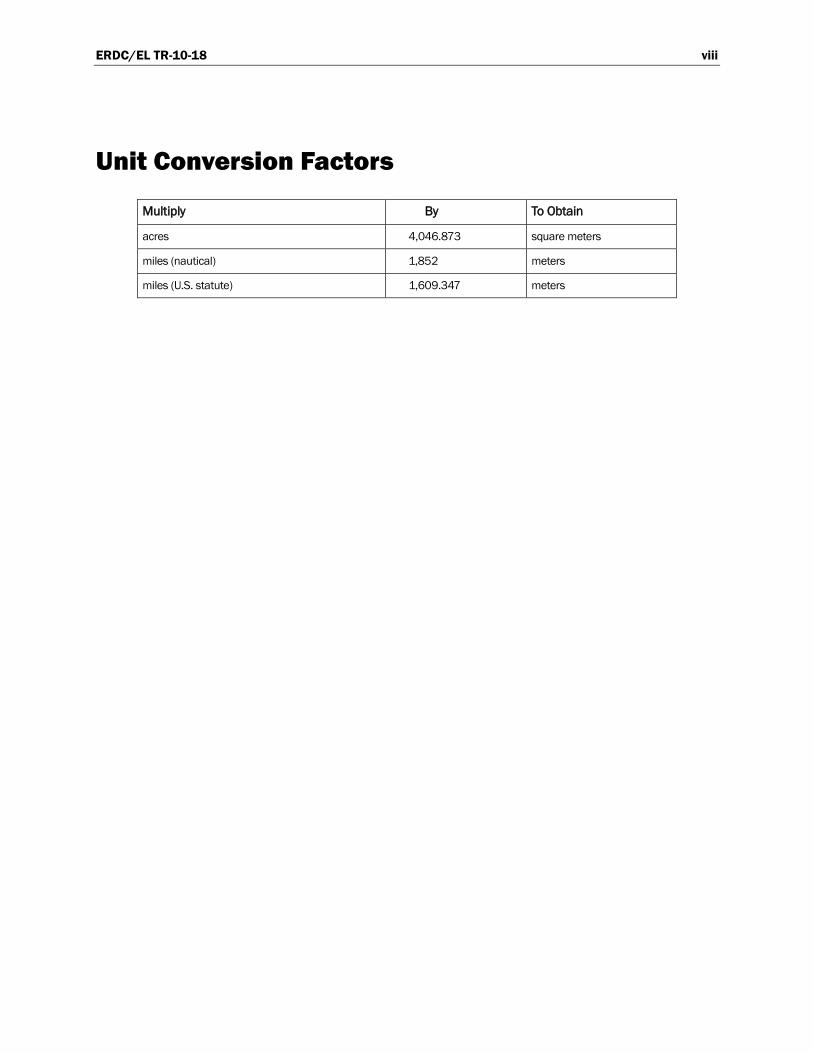
Unit Conversion Factors
Multiply By To Obtain
acres 4,046.873 square meters
miles (nautical) 1,852 meters
miles (U.S. statute) 1,609.347 meters

ERDC/EL TR-10-18 1
1 Introduction
This study is a part of the White River Basin Comprehensive Study, which was authorized by the U.S. Congress for the purpose of assessing water and related land management needs in the White River Basin in Arkansas and Missouri. The overall study is concerned with identifying both short-and long-term management needs associated with navigation, flood damage reduction, feedlot runoff, hydropower, ecosystem restoration and protection, recreation, critical aquifer protection, and agricultural water supply issues. The present report provides data for the recreation comp-onent of the study for three Corps of Engineers reservoirs located on the upper White River. They include Table Rock, Bull Shoals, and Norfork Lakes (Figure 1).
Figure 1. Corps of Engineers reservoirs located in the White River watershed. This study
included Table Rock Lake, Bull Shoals Lake, and Norfork Lake, all of which occur in the upper White River watershed on the boundary separating the states of Arkansas and Missouri.

ERDC/EL TR-10-18 2
The purpose of this study was to provide current data on recreation use, visitor satisfaction, and the economic impacts of recreation on Table Rock, Bull Shoals, and Norfork Lakes. In addition, the resource management agencies requested additional information about lake visitors for recrea-tion and natural resource planning and management, which was also collected as part of this study.
This study was a joint effort of the U.S. Army Corps of Engineers, Missouri Department of Conservation, and Arkansas Department of Fish and Game. The goals and general approach to the study were laid out by an inter-agency planning team of recreation and fisheries policy and management staff from the participating agencies. Participants in the planning effort were Gene Gardner, Missouri Department of Conservation (MDOC); Charles Kuyeda and Mark Oliver, Arkansas Game and Fish Commission (AGFC); Tim Flynn, U.S. Army Corps of Engineers (USACE), Memphis District Office; Jack Johnson and Tony Hill, USACE Little Rock District Office; Tracy Fancher and Jon Hiser, USACE Mountain Home Project Office (MHPO); and Ken Foersterling, Marilyn Jones and Greg Oller, USACE Table Rock Project Office (TRPO). The U.S. Army Engineer Research and Development Center was asked to help refine the study approach developed by the planning team and oversee its implementation.
Outdoor recreation at Corps of Engineer lakes occurs in different recreat-ional settings distinguished primarily by mode of visitor access and the activities that are supported by available recreational facilities. From this perspective, most of the recreation occurring at a lake is associated with recreational settings comprising lakeshore parks (including marinas), access points (public boat ramps), informal recreation sites, private boat docks, and lakeshore resorts. Methods for obtaining information about recreation use of the lake or lakeshore typically differ for the recreational settings that have various modes of visitor access. This study addressed visitors associated with lakeshore parks (including associated marinas), access points, and informal lakeshore access sites, which are all primarily accessed by vehicle. Of these, lakeshore parks were of primary interest because they provide the most available source of public access to the lake and lakeshore and require greater public resources to manage and maintain.

ERDC/EL TR-10-18 3
The study was based primarily on a year-long survey of recreation visitors conducted at each of the lakes between 16 October 2004 and 15 October 2005. The survey consisted of an exit survey of vehicles leaving the lakes and a companion mail survey of these same visitors. The survey instru-ments were developed in cooperation with Ron Reitz and Heather Scroggins (MDOC), Ken Shirley (AGFC), Greg Oller (TRPO), and Jon Hiser (MHPO). The survey instruments were approved for use in this study by the U.S. Office of Management and Budget under the authority of OMB Approval No. 0710-00001. The survey was conducted at recreation parks and access points identified by MDOC, AGFC, MHPO, and TRPO staff. Contract data collection personnel were acquired for this study by USACE project staff. The exit surveys at Bull Shoals and Norfork Lakes were performed under the supervision of Roger Howell (MHPO) and the exit survey at Table Rock Lake was performed under the supervision of Rodney Raley and Larry Hurley (TRPO). Monthly vehicle traffic volume was recorded by MHPO and TRPO staff at permanent traffic meter loca-tions associated with each of the recreation parks and access points.
An additional survey of vehicle traffic volume was conducted using temp-orary traffic meters at the informal recreation sites. An existing inventory of informal recreation sites at Table Rock Lake was updated by TRPO staff for use in this survey. An inventory of informal recreation sites at Bull Shoals and Norfork Lakes was developed by Ken Shirley (AGFC), and Roger Howell and Jon Hiser (MHPO). Traffic meter installations and monthly traffic volume readings associated with this survey activity were conducted by MHPO and TRPO staff in conjunction with traffic moni-toring activities at permanently metered recreation areas.

ERDC/EL TR-10-18 4
2 Study Area
This study took place at the three Corps of Engineers multiple-use reservoirs on the upper White River whose shoreline boundaries occur partly in Arkansas and partly in Missouri (Figure 1). These three reservoirs (Table Rock Lake, Bull Shoals Lake, and Norfork Lake) were constructed between 1941 and 1958. They are currently authorized for flood control, hydroelectric power generation, water supply, recreation, and fish and wildlife. These lakes are an important source of outdoor recreation opportunities in the region.
Norfork Lake
Constructed in the 1940’s on the Norfork River, a tributary of the White River, Norfork Lake was the first Corps of Engineers reservoir to be built in the upper White River watershed. The smallest of the three reservoirs in this study, Norfork Lake has approximately 380 miles of shoreline and 22,000 acres of water surface area at maximum conservation pool level. More than 90 percent of its lakeshore miles and surface acres occur in the state of Arkansas.
The Corps of Engineers, Arkansas Department of Fish and Game, Missouri Department of Conservation, and Fulton County, AR operate more than 25 recreation areas along the lakeshore and the tailrace immediately below Norfork dam. The Corps of Engineers Mountain Home Project Office oper-ates 11 multiple-use parks that offer both day-use and camping recreation opportunities. Most of these parks have a boat ramp(s), picnic and group shelter facilities, swimming beach, playground equipment, and camping facilities. However, service levels vary. Five offer modern restrooms with showers and flush toilets, and camping pads with electrical and water hookups. The other six have restrooms that lack flush toilets and showers, and three of these have primitive campgrounds lacking the hardened pads, electrical service, and water hookups available at the modern camp-grounds. The Corps of Engineers also operates six day-use parks offering varying types of facilities and levels of service as well as five access points that provide only a boat ramp and vault toilet. There are eight concess-ionaire-managed marinas located inside the higher-end, Corps-managed, multiple-use and day-use parks.

ERDC/EL TR-10-18 5
Additional recreation sites on the lake are managed by other agencies. The Missouri Department of Conservation operates access points at Bridges Creek and Liner Creek. The Arkansas Department of Fish and Game operates an access point at Calamity Beach. Fulton County, AR operates the Boggy Creek Access Point. The U.S. Fish and Wildlife Service operates the Norfork National Fish Hatchery below the dam, a facility that is open to the public.
Bull Shoals Lake
Bull Shoals Dam, completed in 1951, is located on the upper White River approximately 42 river miles upstream of the location where the Norfork Lake tailwaters enter the White River. With 740 miles of shoreline and 45,440 acres of water surface area at maximum conservation pool level, Bull Shoals Lake is the largest in surface area and second largest in shore-line miles of the four Corps of Engineer reservoirs on the upper White River. Both Arkansas and Missouri have substantial acres of surface waters and miles of shoreline occurring in their state boundaries.
Outdoor recreation on Bull Shoals Lake is available at approximately 30 recreation parks and access points located on Corps-owned lands along the Bull Shoals lakeshore and the tail race immediately below Bull Shoals Dam. Sixteen of these are multiple-use recreation areas that provide a mix of day-use and camping recreation opportunity.
Eleven of the multiple use parks are operated by the Corps of Engineers Mountain Home Office. These parks all have a launch ramp, playground, picnic and group shelter facilities, drinking water, modern flush toilet facilities, and campsites ranging in number from 30 to 88, most with electrical service. Several also have a swimming beach. Five other multiple use parks are operated by other government agencies. One of these is the Bull Shoals State Park operated by the Arkansas Department of Parks and Tourism. The other four are operated by county or municipal government agencies. Of 11 marinas located on Bull Shoals Lake, 10 are located inside Corps-managed multiple-use parks.
In addition to the multiple use parks, there are two major day-use parks, one operated by the Corps of Engineers and the other by the City of Bull Shoals, AR. There are also seven access points operated by the Arkansas Department of Fish and Game.
ERDC/EL TR-10-18 6
Table Rock Lake
Table Rock Lake is uppermost on the White River of the three reservoirs included in this study. Table Rock Dam is located approximately 23 river miles upstream of the upper end of Bull Shoals Lake. Completed in 1958, Table Rock Lake has 43,100 surface acres of water and 747 miles of shoreline, most of which are located in the state of Missouri. While the region surrounding the upper portion of the reservoir is still largely rural in character, the growth of Branson, Missouri into a major tourist desti-nation has resulted in substantial population, recreation, and tourism growth near the eastern (lower or downriver) portion of the lake.
Table Rock Lake has 24 public recreation areas. Of these, 19 are managed by the Corps of Engineers Table Rock Lake Project Office, two (Table Rock State Park and Shepherd of the Hills Fish Hatchery) by agencies of the State of Missouri, one (Big Bay Recreation Area) by the U.S. National Forest Service, one (Beaver Recreation Area) by the town of Beaver, Arkansas, and one (Kimberling Park) by a private concessionaire. A total of 16 of these areas are multiple-use parks that support both day-use and camping recreation. These parks typically have a boat launch ramp(s), picnic and group shelter facilities, swimming beach, playground equip-ment, restrooms with showers, and RV camping pads with water and electrical service. Four parks that lack camping facilities are designated as day-use recreation areas. Four additional low-visitation day-use areas function primarily as lake access points. There are 11 concessionaire-managed marinas on the lake; nine of these located inside Corps–managed, multiple-use parks.
Because of its proximity to the city of Branson, sightseeing is an important part of the mix of recreational opportunities available at recreation areas on Table Rock Lake. Three of the recreation areas included in this study have tourism-related recreation facilities that attract sightseeing visitors. One of these areas is the Shepherd of the Hills Fish Hatchery that is managed by the Missouri Department of Conservation. Fish hatchery visitors can observe trout being hatched and reared in ponds and tour the onsite visitor center to learn about trout natural history and management. A second area receiving sightseeing visitation is the Corps of Engineers Dewey Short Visitor Center that is located at the Corps of Engineers Project Office. The third area is the Long Creek Recreation Area, where boat tours of the lake are offered by a private concession operator. All three of these sites are present on bus tour routes.
ERDC/EL TR-10-18 7
Two additional sources of significant sightseeing visitation were not included in this study. One is the Kimberling Park Tour of Lights, an annual drive-through Christmas lights display that has historically drawn large numbers of sightseeing visitors to Kimberling Park from October through December. This event was ongoing during this study, but has since been discontinued. Also excluded from this study were visitors to the Branson Belle Showboat, a concession-managed dining and tour boat operating from lakeshore lands leased from the Corps of Engineers that is not associated with any designated recreation area.
Informal lakeshore access sites
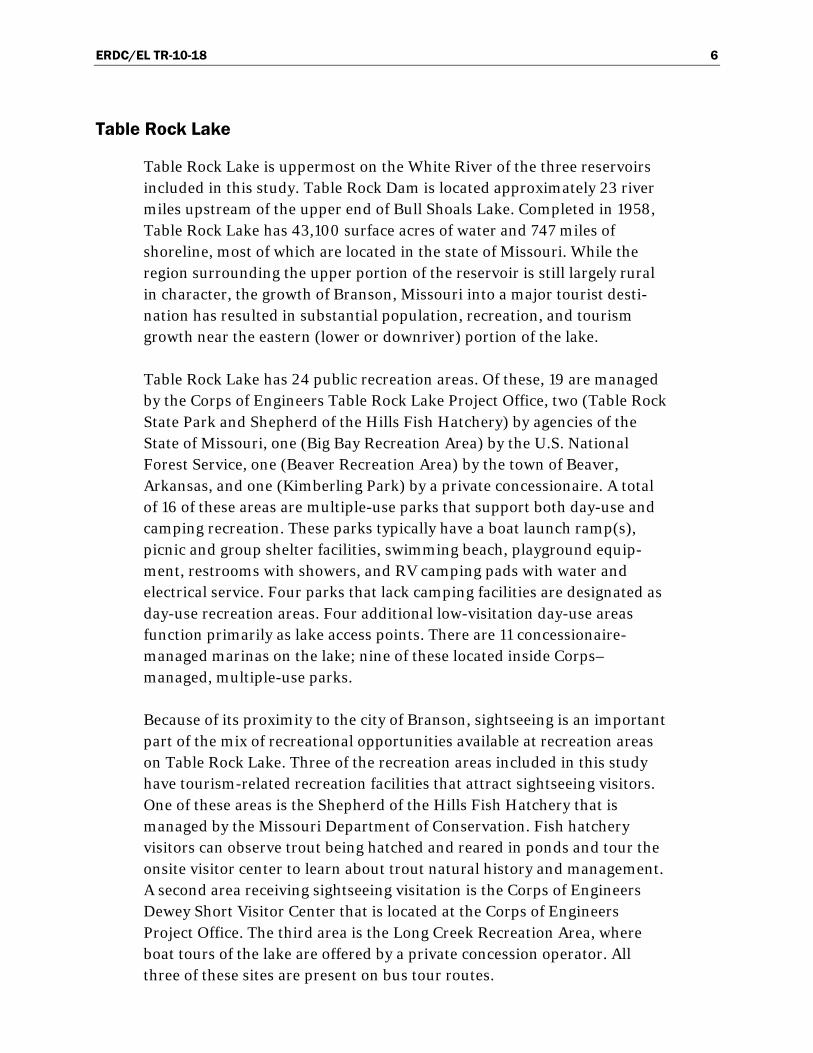
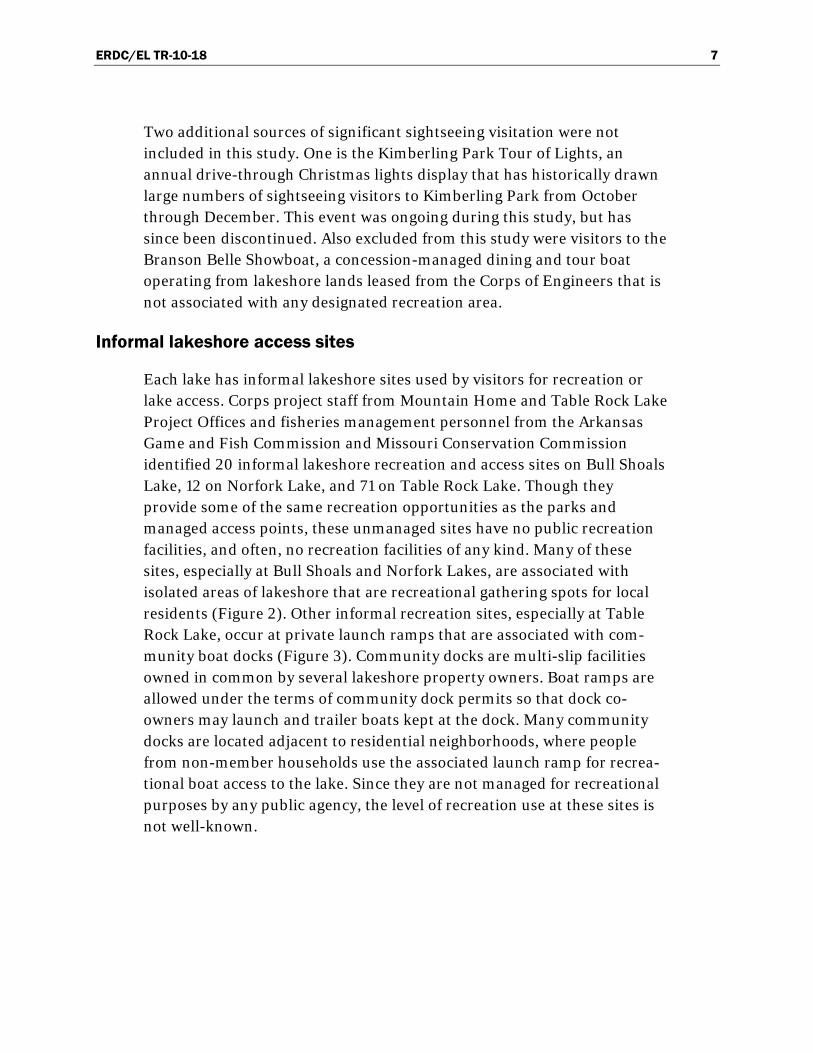
Each lake has informal lakeshore sites used by visitors for recreation or lake access. Corps project staff from Mountain Home and Table Rock Lake Project Offices and fisheries management personnel from the Arkansas Game and Fish Commission and Missouri Conservation Commission identified 20 informal lakeshore recreation and access sites on Bull Shoals Lake, 12 on Norfork Lake, and 71 on Table Rock Lake. Though they provide some of the same recreation opportunities as the parks and managed access points, these unmanaged sites have no public recreation facilities, and often, no recreation facilities of any kind. Many of these sites, especially at Bull Shoals and Norfork Lakes, are associated with isolated areas of lakeshore that are recreational gathering spots for local residents (Figure 2). Other informal recreation sites, especially at Table Rock Lake, occur at private launch ramps that are associated with com-munity boat docks (Figure 3). Community docks are multi-slip facilities owned in common by several lakeshore property owners. Boat ramps are allowed under the terms of community dock permits so that dock co-owners may launch and trailer boats kept at the dock. Many community docks are located adjacent to residential neighborhoods, where people from non-member households use the associated launch ramp for recrea-tional boat access to the lake. Since they are not managed for recreational purposes by any public agency, the level of recreation use at these sites is not well-known.
ERDC/EL TR-10-18 8
Figure 2. Informal lakeshore recreation site on Table Rock Lake
used by visitors for camping, picnicking, and swimming. Boats are launched from the natural shoreline.
Figure 3. Private boat ramp associated with a permitted boat dock at Table Rock Lake. Many of these ramps are used by
area residents to access the lake for day-use boating.

ERDC/EL TR-10-18 9
3 Methods
This study focused mainly on obtaining current information on visitor use and spending for each of the lakes. These data were used to assess the economic impacts of park visitors to the three lakes. The study also docu-mented visitor characteristics and perceptions that are important for multi-agency recreation planning and management. It is especially challenging to obtain rigorous estimates of visitor use in a complex recreational setting. Therefore the data collection effort was primarily designed to obtain the data needed to estimate visitor use levels.
Estimating visitation at lakes and adjoining public lands often employs several different methods, each one suited to measuring use associated with a different class of visitors. This study focused on visitors at public parks, access points, and informal lakeshore recreation sites. These visi-tors typically arrive and depart by vehicle, allowing them to be assessed by a common approach. Included in this group were traditional day-use park visitors; overnight visitors, including campers; recreational boaters and anglers who accessed the lake using a boat launch facility or marina; and sightseers.
Visitor surveys
The primary source of data for this study was a one-year survey of visitors conducted at each lake. A pair of interviewers assigned to each lake con-ducted a traffic stop survey in conjunction with the permanent traffic counters installed near vehicle exits at recreation parks and access points.
In this survey, all vehicles departing during scheduled sampling periods were stopped and interviewed by a trained interviewer who followed an interview script programmed into a laptop computer. Every departing vehicle was classified as a recreation vehicle, returning recreation vehicle, non-recreation vehicle, refusal, or passed vehicle. A vehicle was classified as a recreation vehicle if the occupants had just completed their visit to the lake and were engaged in some recreation activity while there. Information about the number and ages of people, length of visit, and activities was then obtained from the occupants of recreation vehicles. The interview process also distinguished day-use and overnight visits. Overnight visits required one or more nights on the lake or in a recreation area located on

ERDC/EL TR-10-18 10
Corps-owned land managed by the Corps of Engineers, a concessionaire, or an out-grant partner. Many overnight visits occurred at campgrounds, but have occurred in resorts located on Corps-owned lands or on boats somewhere on the lake, or at a marina. A day-use visit consisted of a trip completed without an overnight stay on the lake or at a recreation area located on Corps-owned land.
Upon completion of each interview, a questionnaire and stamped, self-addressed mailing envelope were offered to the occupants of each recrea-tion vehicle. The questionnaire included questions about visitor demo-graphics, attitudes and perceptions about the lake and recreational environment, trends affecting recreation, trip spending, and more detailed information about recreational activities. The mail questionnaire was formatted to show the name of the project in the title and questions, but was otherwise the same for each project. The questionnaire formatted for use at Table Rock Lake is shown in Appendix A.
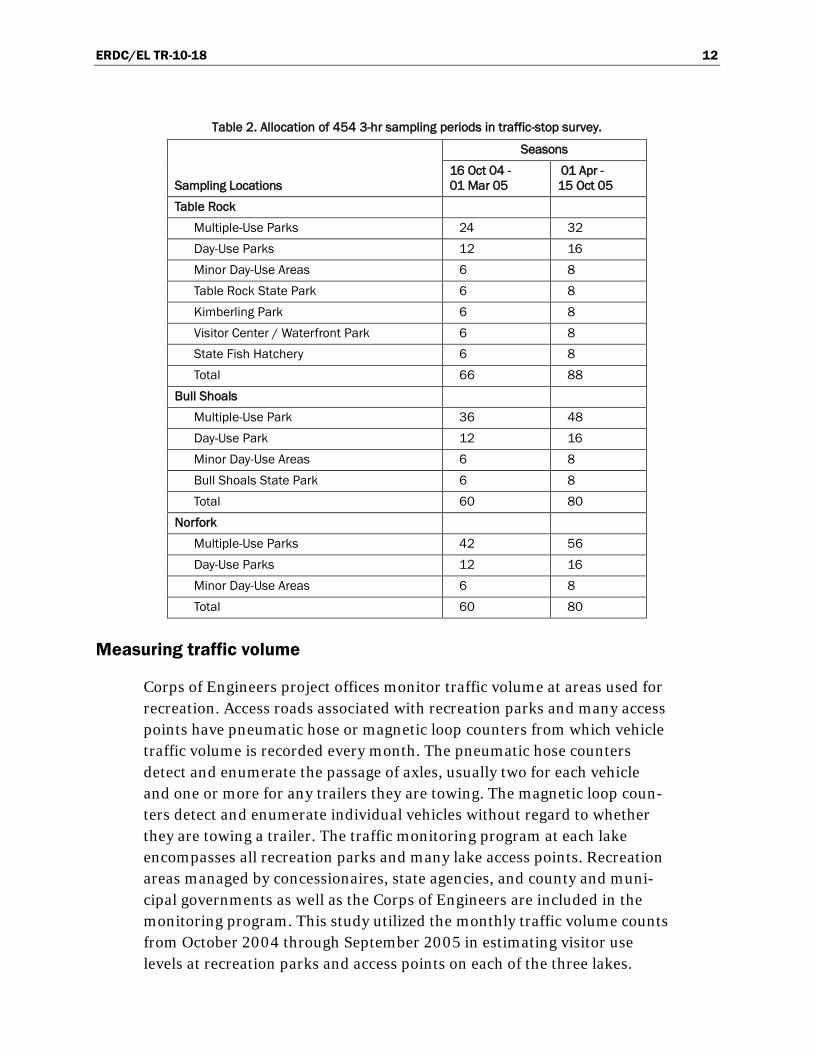
Between 16 October 2004 and 15 October 2005, 140 sampling periods were scheduled at Bull Shoals and Norfolk Lakes and 154 were scheduled at Table Rock Lake. Each sampling period comprised a 3-hr time interval in which all departing vehicles were stopped and interviewed. Sampling periods were selected using a probability-based sample selection process. The sample selection process began by separating all possible sampling periods (i.e., all area x time interval possibilities) into groups that served as sampling strata. These strata were formed based on type of area (Table 1), season of year (Oct-Mar, Apr-Sept), and day of week (Mon-Fri, Sat-Sun). Strata sample sizes were then assigned, usually in proportion to anticipated use levels (Table 2). Samples within strata were then selected with probability proportional to the anticipated use levels, subject to a sampling restriction permitting only one area on a lake to be sampled on any given day and a second sampling restriction requiring an equal number of samples to be selected for each time-of-day sampling period. The selection process produced a set of samples with known selection probabilities.
ERDC/EL TR-10-18 11
Table 1. Metered public-use recreation areas included in recreation survey.
Bull Shoals Lake Norfork Lake Table Rock Lake
Recreation Area State Recreation Area State Recreation Area State
Multiple-Use Parks Multiple-Use Parks Multiple-Use Parks
Beaver Creek MO Bidwell Point AR Aunts Creek MO
Buck Creek Park AR Cranfield Park AR Baxter (Park) MO
Bull Shoals Park AR Gamaliel Park AR Beaver MO
Dam Site Park AR Henderson Park AR Big Bay MO
Highway 125 AR Howard Cove AR Big M MO
Kissee Mills MO Jordan Park AR Campbell Point MO
Lakeview Park AR Panther Bay AR Cape Fair MO
Lead Hill Park AR Quarry Park (River side) AR Cow Creek MO
Oakland Park AR Robinson Point AR Cricket Creek MO
Point Return AR Tecumseh Park MO Eagle Rock (Booth) MO
Pontiac Park MO Udall Park MO Eagle Rock (North) MO
River Run Park MO Indian Point (Booth) MO
Shadow Rock MO Day-Use Parks Long Creek MO
Theodosia Park MO Buzzard Roost AR Mill Creek MO
Tucker Hollow AR George's Cove AR Old Hwy 86 MO
Quarry Park (Lake side launch) AR Viney Creek MO
Day-Use Parks Quarry Park (Lake side marina) AR Viola MO
Bull Shoals City Park AR State Fish Hatchery AR
Bull Shoals State Park (Day-use site) AR Tracy Park AR Day-Use Parks
Highway K Park MO Woods Point AR Baxter (Marina) MO
Indian Point (Harbor) MO
Minor Day-Use Areas Minor Day-Use Areas Indian Point (Marina) MO
County Road 15 AR Ford Cove MO Moonshine Beach MO
Lowry Park AR Hand Cove Park AR Resident Office Overlook MO
Spring Creek MO Niles Landing AR
Woodard Park MO Pigeon Creek AR Minor Day-Use Areas
Red Bank Park AR Big Indian MO
Individually Sampled Areas Coombs Ferry Access MO
Bull Shoals State Park (Main) AR Joe Bald MO
Kings River MO
Individually Sampled Areas
Kimberling Park MO
Visitor Center / Waterfront Park MO
State Fish Hatchery MO
Table Rock State Park MO
ERDC/EL TR-10-18 12
Table 2. Allocation of 454 3-hr sampling periods in traffic-stop survey.
Sampling Locations
Seasons 16 Oct 04 - 01 Mar 05
01 Apr - 15 Oct 05
Table Rock Multiple-Use Parks 24 32 Day-Use Parks 12 16 Minor Day-Use Areas 6 8 Table Rock State Park 6 8 Kimberling Park 6 8 Visitor Center / Waterfront Park 6 8 State Fish Hatchery 6 8 Total 66 88
Bull Shoals Multiple-Use Park 36 48 Day-Use Park 12 16 Minor Day-Use Areas 6 8 Bull Shoals State Park 6 8 Total 60 80
Norfork Multiple-Use Parks 42 56 Day-Use Parks 12 16 Minor Day-Use Areas 6 8 Total 60 80
Measuring traffic volume
Corps of Engineers project offices monitor traffic volume at areas used for recreation. Access roads associated with recreation parks and many access points have pneumatic hose or magnetic loop counters from which vehicle traffic volume is recorded every month. The pneumatic hose counters detect and enumerate the passage of axles, usually two for each vehicle and one or more for any trailers they are towing. The magnetic loop coun-ters detect and enumerate individual vehicles without regard to whether they are towing a trailer. The traffic monitoring program at each lake encompasses all recreation parks and many lake access points. Recreation areas managed by concessionaires, state agencies, and county and muni-cipal governments as well as the Corps of Engineers are included in the monitoring program. This study utilized the monthly traffic volume counts from October 2004 through September 2005 in estimating visitor use levels at recreation parks and access points on each of the three lakes.
ERDC/EL TR-10-18 13
Several access points at Bull Shoals and Norfork Lakes did not have permanent traffic counters because visitor use was very low and their remote locations made the cost of monitoring too high relative to recrea-tion use. At these areas on Bull Shoals and Norfork Lakes and at the infor-mal lakeshore recreation sites on all three lakes, a survey employing temporary traffic counters was used to obtain an estimate of total traffic volume. The temporary meter survey was conducted from October 2004 through September 2005 by Corps of Engineers management staff from the Mountain Home and Table Rock project offices. In this survey, pneu-matic hose counters were placed at selected sites for two consecutive months, then moved to other sites for another two months based on a sampling plan that assigned meters to both sites and bi-monthly periods at random within strata corresponding to anticipated traffic volume levels of low, medium, or high. Eight temporary traffic counters were used to sample 38 sites at Bull Shoals and Norfork Lakes and 12 counters were used to sample 71 sites at Table Rock Lake. The traffic volume counts obtained using this process were expanded from the sample to the samp-ling frame to produce estimates of aggregate traffic volume associated with the entire site inventory for each lake. In a few instances, a monthly traffic count was not obtained from a meter because of vandalism or meter malfunction. If only one monthly value for the two-month meter set was missing, the missing value was inferred by imputation. If both months were missing, the entire sample was omitted from the analysis.
Estimating visitor statistics
Analysis of survey data focused on classification statistics for vehicle departures, visit-related statistics, visitor perceptions, visitor demographics, and trip spending associated with recreation visits to the lake. Most of the statistics estimated with data obtained as part of the traffic stop survey were computed using the complex survey analysis tools in SAS/STAT® software, Version 9.1.3 for Windows, Copyright © 2002-2003, primarily the SURVEYMEANS and SURVEYFREQ procedures (SAS Institute, Inc.). Estimating traffic counter calibration statistics and visitor statistics from the exit survey incorporated the stratified two-stage sample design used to collect the data. Because sampling periods were selected with unequal selection probabilities, sample statistics were produced using Horvitz-Thompson estimators with sampling weights equal to the inverse of the sample selection probabilities, with post-weighting adjustments for vehicle non-response (passed vehicles and refusals). Standard errors presented for sample statistics are those computed by SAS/STAT software for the

ERDC/EL TR-10-18 14
sampling design described above. The first-order Taylor-linearization approximation employed by SAS/STAT SURVEYMEANS and SURVEYFREQ procedures to estimate standard errors incorporated variation associated with sample-to-sample (first stage) outcomes, but ignored the variation associated with vehicle-to-vehicle (second stage) outcomes within samples. Except for activity participation statistics, which were computed as described above, sample statistics for quantitative data collected from the mail survey were computed separately using SPSS 14 for Windows, SPSS Inc., Chicago, IL. Narrative responses to open-response questions asked in the mail survey were categorized using SPSS Text Analysis for Surveys, Version 2.0, SPSS Inc. Chicago, IL.
Estimates of visitation and participation in the camping/overnight activity utilized the classifications of day-use and overnight visitors obtained in the traffic stop survey. As a consequence of the definitions employed to clas-sify overnight visits, trips involving overnight stays on the lake or in parks located on Corps-owned lakeshore lands were treated as overnight visits, while daily trips to the lake involving overnight stays in lodging not located on Corps-owned lands were treated as successive day-use visits to the lake.
Estimating visitor use
Visitor use was estimated as visits and visitor hours, where one visit denotes a recreation trip to the lake by one person for any length of time, and a visitor hour denotes the total number of hours one visitor spends in the park or on the lake during the visit. Using these definitions, three day-use visitors who depart the area in a vehicle after spending 2 hr in the park would be credited with three visits and six visitor hours (3 visits x 2 hr). Similarly, a departing camping party of three that stayed two nights would be credited with three visits and 144 visitor hours (3 visits x 2 nights x 24 hr).
In general terms, visitor use at each lake was estimated as:
Visits = [Total Vehicles] x [Pct Recreation Vehicles ] x [Mean visitors per recreation vehicle],
Visitor Hours = Visits x [Mean length of stay per visit], (1)
where traffic volume was enumerated by magnetic loop counters, or

ERDC/EL TR-10-18 15
Visits = [Total Axles] x [Pct Recreation Axles ] x [Mean Axles per recreation vehicle] x [Mean visitors per recreation vehicle],
Visitor Hours = Visits x [Mean length of stay per visit], (2)
where traffic volume was enumerated by pneumatic hose counters.
In these generalized equations, Total Vehicles and Total Axles indicate total traffic volume as measured by vehicle traffic counters. These values are regarded as census values for the parks and access points included in the Corps of Engineers traffic volume monitoring program. They are treated as estimated values subject to sampling variability for the access points and informal lakeshore sites included in the temporary meter survey.
All other statistics in these equations are estimated load factors obtained from the traffic stop survey data, where
Pct Rec. Vehicles = 100% x Σ [Rec.Vehicles] / Σ [Returning Rec.Vehicles + Non-Rec Vehicles]
Pct Rec Axles = 100% x Σ [Rec. Axles] / Σ [Returning Rec. Axles + Non-Rec Axles]
Mean Axles per Rec Vehicle = Σ [Rec Vehicle Axles] / Σ [ Rec. Vehicles]
Mean Visitors per Rec. Vehicle = Σ [Recreation Visitors] / Σ [Recreation Vehicles]
Mean Length of Stay per Visit = Mean Hours Per Day-Use Visit, or Mean Nights Per Camping Visit.
Economic impact analysis
Regional economic impacts were estimated using the Recreation Economic Assessment System (REAS ) model (U.S. Army Corps of Engineers 2008). This model applies sector-specific multipliers to total spending to compute direct and secondary economic effects expressed in terms of sales, jobs, labor income, and value added. Sales represent sales to firms in the local region. Jobs include part-time and full-time jobs with seasonal positions adjusted to annual equivalents. Labor income covers wages and salaries, payroll benefits, and incomes of sole proprietors. Value

ERDC/EL TR-10-18 16
added is the sum of labor income, profits and rents, and indirect business taxes. Direct effects cover impacts on firms that receive the visitor spending, while total effects also include the indirect and induced effects of these sales. Multipliers used in the REAS model were estimated for each lake with the IMPLAN system using 2001 county level economic data (Minnesota IMPLAN Group 2000). It was assumed that sales, income, and value added multipliers remained the same through 2005. Jobs-to-sales ratios were adjusted using price indicators for each economic sector.
Total lake spending was estimated as the product of total visitation and mean visitor spending for each of seven visitor segments. The segments consisted of two local segments comprising visitors living ≤30 miles from the lake and five non-local segments of visitors living >30 miles away. The visitor segments were:
• Non-local Day Trip: party coming from beyond 30 miles on day trips • Non-local Pass-Through Trip : party reporting an overnight stay on the
trip, but no nights within 30 miles of the lake • Non-local Camping Trip: party staying overnight in the local area and
reporting local camping expenses • Non-local Motel Trip: party staying overnight in the local area and
reporting local motel expenses • Other Non-local Overnight Trip: party reporting a local overnight stay,
but no local lodging expenses. These parties could be staying in a seasonal home or with friends or relatives on a boat or in unpaid lodging. Many reported staying in a seasonal home.
• Local Day Trip: party within 30 miles of the lake that did not report an overnight stay away from home on the trip.
• Local Overnight Trip: party within 30 miles reporting an overnight stay on the trip
In classifying trips away from home, day-use trips involved no nights away from home; overnight trips were separated into classes based on nights spent less than 30 miles from the lake and the type of lodging for which expenses were reported. In the economic impact analysis, non-local visitors reporting both hotel and camping expenditures in the local area were assigned to the segment with the greater spending.
Reported spending associated with very large parties or extended stays are often unreliable. In addition, very high spending may result from inclusion

ERDC/EL TR-10-18 17
of airfares, purchases of durable goods, or other expenses not considered here as local trip expenditures. Therefore, the spending analysis omitted a total of 139 outlier cases where the number of people in the party was more than 8, nights reported within 30 miles of the lake was more than 8, total spending within 30 miles of the lake was more than $5,000, or any individual spending category within 30 miles of the lake was more than $1,000.
ERDC/EL TR-10-18 18
4 Results
Survey data
Survey personnel completed 428 of 434 scheduled 3-hr sampling periods during the traffic stop survey, including 140 of 140 at Bull Shoals Lake, 138 of 140 at Norfork Lake, and 150 of 154 at Table Rock Lake. Over 18,000 vehicles were encountered during the survey (Table 3). The occu-pants of more than 11,000 (67 percent) of these vehicles agreed to be inter-viewed. Forty-five percent (5,942) were recreation vehicles containing occupants who were just completing a recreation visit to an area or the lake. Occupants of these vehicles underwent the detailed traffic stop interview to document their recreation visit. Eighty-nine percent (5,273) of interviewees agreed to take a mail survey, and 36 percent (1,864) completed and returned the mail survey.
Trip expenditures suitable for the spending analysis were obtained from 1,725 mail surveys, including 715 from Bull Shoals Lake, 417 from Norfork Lake, and 732 from Table Rock Lake. These cases were assigned to visitor segments in the numbers available (Table 4).
Non-response bias can produce misleading survey results when the survey non-response rate is high and survey results for respondents differ sub-stantially from what would have been observed in non-respondents, had they chosen to participate in the survey. There were two main sources of unit (or case) non-response in this study, one applicable to the traffic stop survey and one to the mail survey. In the traffic stop survey, an average of 37 percent of vehicles encountered during sampling were not classified either because the vehicles did not stop to be interviewed (28 percent) or they refused to participate (9 percent) in the interview (Table 3). Inter-viewers indicated that some repeat visitors who had already been surveyed on a previous trip refused to be interviewed again. This pattern would result in a sample that under-represents frequent visitors in the sample of visits.

ERDC/EL TR-10-18 19
Table 3. Outcome of sampling effort.
Survey Type Bull Shoals Norfork
Table Rock Total
Traffic Stop Survey Total Vehicles 5,676 3,778 8,671 18,125
Passed Vehicles 976 1, 507 2,535 5,018 Refusals 809 517 377 1,703 Pct Passed Vehicles and Refusals 31% 54% 34% 37% Total vehicles classified 3,891 1,754 5,759 11,494
Non-recreation vehicles 1,001 49 1,508 2,558 Returning recreation vehicles 1,112 349 1,533 2,994 Recreation vehicles 1,868 1,356 2,718 5,942 Pct Recreation vehicles 48% 77% 47% 52%
Mail Survey Distributed 1,841 1,066 2,366 5,273 Returned 715 417 732 1864 Pct Returned 39% 39% 31% 35%
Table 4. Complete mail questionnaires available for spending analysis.
Visitor Segment Bull Shoals Norfork
Table Rock Total
Non-local day trips 68 50 108 226 Non-local pass-through trips 15 7 17 39 Non-local camping trips 46 49 83 178 Non-local motel trips 52 19 211 282 Non-local other overnight trips 49 23 78 150 Local day trips 371 209 148 728 Local other overnight trips 58 35 29 122 Total 659 392 674 1,725
In the mail survey, 65 percent of those receiving a mail survey did not return it, including 61 percent at both Bull Shoals and Norfork Lakes and 69 percent at Table Rock Lake (Table 3). Comparison of traffic stop survey results between mail survey recipients who did and did not return mail surveys indicated that the respondents were slightly more likely to come from within 30 miles of the site and had slightly higher rates of partici-pation in recreation activities with the exception of sightseeing. Non-respondents were more likely to be on an overnight trip. Parties with visitors age 62 or older were more likely to return the mail survey, while parties with visitors under the age of 18 were less likely to return it. In general it appears that the mail survey slightly under-represented parties

ERDC/EL TR-10-18 20
with children and sightseers and casual visitors who were not engaged in any of the usual recreation activities available on Corps of Engineers lakes.
Visitor use levels at metered recreation parks and access points
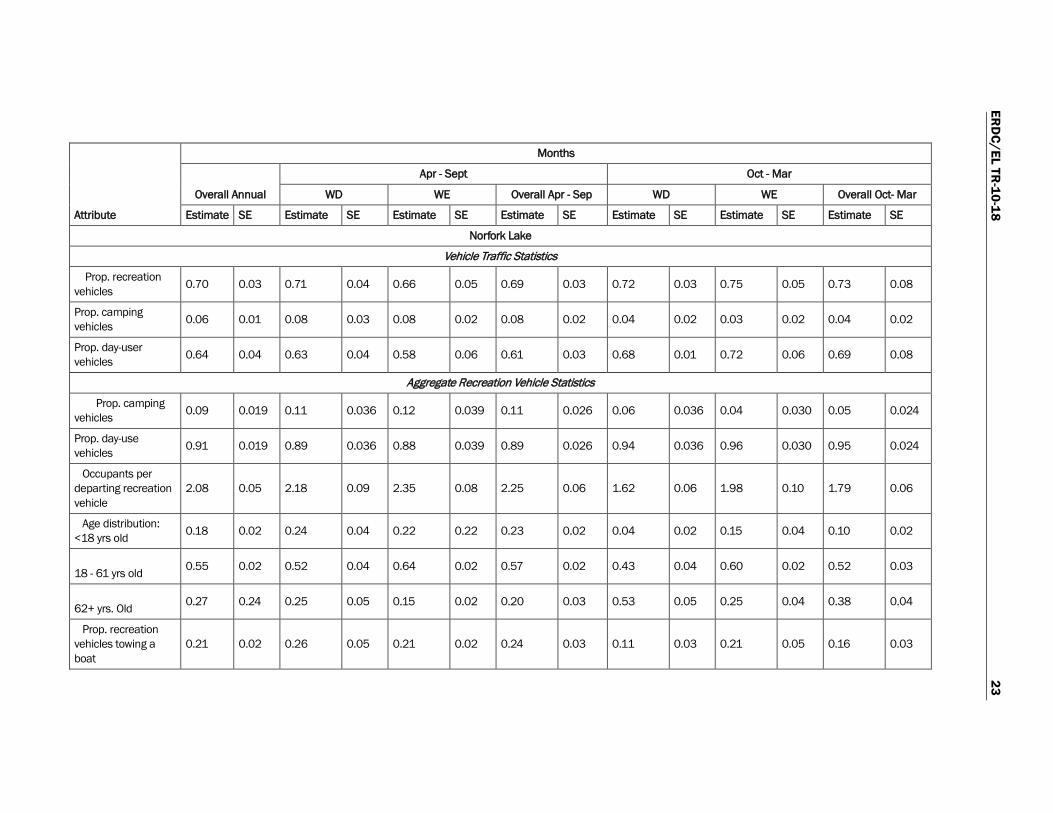
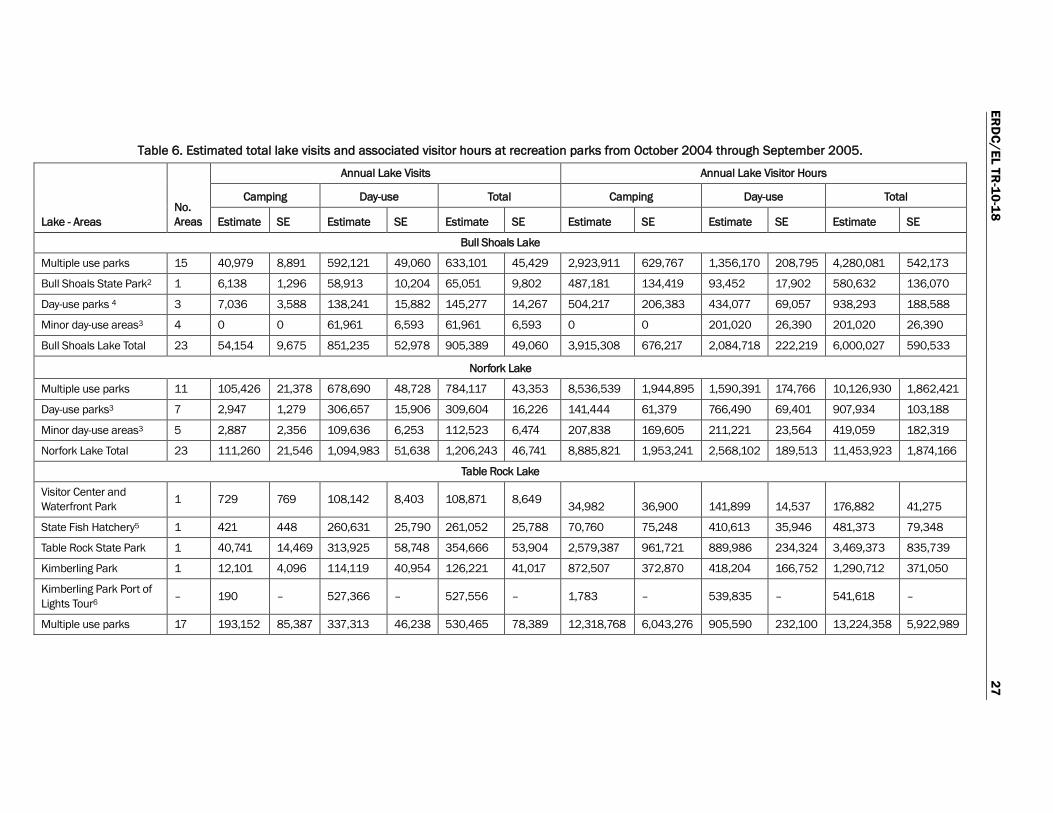
Vehicles exiting a metered recreation park or access point that met the classification criteria for recreation vehicles averaged 38 percent at Table Rock Lake, 42 percent at Bull Shoals Lake, and 70 percent at Norfork Lake and the number of visitors per recreation vehicle departure averaged 2.1 at Bull Shoals and Norfork Lakes, and 2.6 at Table Rock Lake over the 1 year period of the survey (Table 5). Application of these rates to the total vehi-cle exits yields estimated total annual visits (± percent standard error) at metered recreation parks and access points of approximately 905,000 (±5 percent) at Bull Shoals Lake, 1,206,000 (±4 percent) at Norfork Lake, and 2,139,000 (±5 percent) at Table Rock Lake from October 2004 through September 2005 (Table 6). Incorporating the mean length of stay per visit yielded an estimated total annual visitor hours of 6.0 million (±10 percent) at Bull Shoals Lake, 11.5 million (±16 percent) at Norfork Lake, and 20.7 (±29 percent) at Table Rock Lake.
Visitor use levels at Table Rock Lake included 528,000 visits and 542,000 visitor hours associated with the Port of Lights Tour held from October through December at the concession-managed Kimberling Park. This event was a drive-through Christmas lights display sponsored in part by Kimberling City (Table 6). This annual sightseeing event was held during the year that lake visitation was estimated, but has since been discontinued. It accounted for approximately 25 percent of the annual recreation visits and 3 percent of visitor hours at Table Rock Lake from October 2004 through September 2005.
Four recreation parks at Table Rock Lake were surveyed separately because they had unique features or because they comprised a large share of the project visitation. Of these, Table Rock State Park accounted for an estimated 355,000 (±15 percent) annual visits and 3.5 million (±24 per-cent) visitor hours of use. The recreation site containing the Shepherd of the Hills Fish Hatchery accounted for 261,000 (±10 percent) annual visits and 481,000 (±16 percent) visitor hours of use. Kimberling Park received 126,000 (±32 percent) visits and 1.3 (±29 percent) million hours of use, excluding the sightseeing visitation associated with the Port of Lights Tour. The Corps of Engineers project office site, which includes the Dewey Short Visitor Center and associated lakefront walkway, received an

ERD
C/EL TR-10-18
21
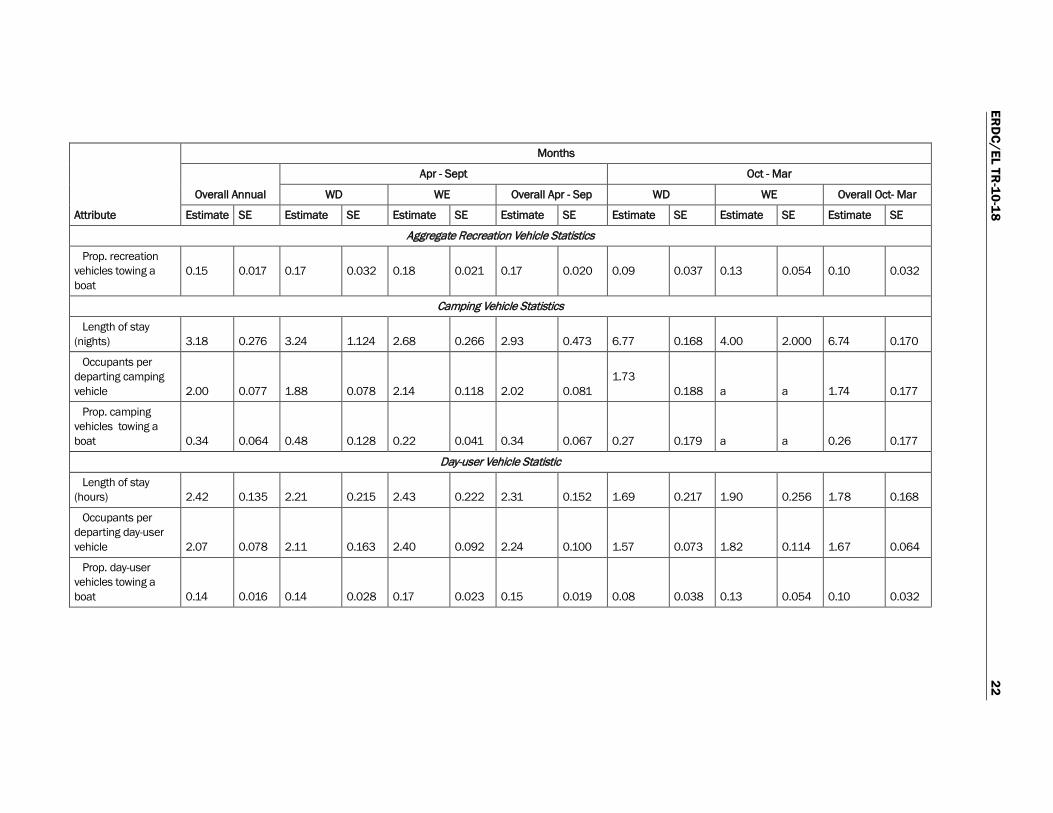
Table 5. Statistics associated with recreation vehicles and visitors at developed recreation areas.
Attribute
Months
Overall Annual
Apr - Sept Oct - Mar
WD WE Overall Apr - Sep WD WE Overall Oct- Mar
Estimate SE Estimate SE Estimate SE Estimate SE Estimate SE Estimate SE Estimate SE
Bull Shoals Lake
Vehicle Traffic Statistics
Prop. recreation vehicles 0.42 0.025 0.37 0.445 0.45 0.044 0.40 0.032 0.42 0.032 0.53 0.043 0.46 0.026
Prop. camping vehicles 0.03 0.008 0.03 0.014 0.06 0.016 0.04 0.010 0.01 0.007 0.00 0.000 0.01 0.004
Prop. day-user vehicles 0.38 0.026 0.34 0.046 0.39 0.047 0.36 0.033 0.41 0.030 0.53 0.043 0.45 0.025
Aggregate Recreation Vehicle Statistics
Prop. camping vehicles 0.08 0.020 0.09 0.039 0.13 0.037 0.11 0.027 0.02 0.015 0.00 0.000 0.01 0.009
Prop. day-use vehicles 0.92 0.020 0.91 0.039 0.87 0.037 0.89 0.027 0.98 0.015 1.00 0.000 0.99 0.009
Occupants per departing recreation vehicle
2.06 0.072 2.09 0.148 2.36 0.084 2.21 0,.889 1.57 0.071 1.82 0.114 1.67 0.628
Age distribution: <18 yrs old 0.18 0.019 0.19 0.037 0.23 0.023 0.21 0.022 0.06 0.020 0.10 0.027 0.08 0.017
18 - 61 yrs old 0.56 0.016 0.56 0.029 0.60 0.021 0.58 0.018 0.43 0.042 0.54 0.047 0.48 0.030
62+ yrs. Old 0.27 0.027 0.25 0.054 0.17 0.207 0.21 0.030 0.51 0.053 0.36 0.048 0.44 0.038
ERD
C/EL TR-10-18
22
Attribute
Months
Overall Annual
Apr - Sept Oct - Mar
WD WE Overall Apr - Sep WD WE Overall Oct- Mar
Estimate SE Estimate SE Estimate SE Estimate SE Estimate SE Estimate SE Estimate SE
Aggregate Recreation Vehicle Statistics
Prop. recreation vehicles towing a boat
0.15 0.017 0.17 0.032 0.18 0.021 0.17 0.020 0.09 0.037 0.13 0.054 0.10 0.032
Camping Vehicle Statistics
Length of stay (nights) 3.18 0.276 3.24 1.124 2.68 0.266 2.93 0.473 6.77 0.168 4.00 2.000 6.74 0.170
Occupants per departing camping vehicle 2.00 0.077 1.88 0.078 2.14 0.118 2.02 0.081
1.73 0.188 a a 1.74 0.177
Prop. camping vehicles towing a boat 0.34 0.064 0.48 0.128 0.22 0.041 0.34 0.067 0.27 0.179 a a 0.26 0.177
Day-user Vehicle Statistic
Length of stay (hours) 2.42 0.135 2.21 0.215 2.43 0.222 2.31 0.152 1.69 0.217 1.90 0.256 1.78 0.168
Occupants per departing day-user vehicle 2.07 0.078 2.11 0.163 2.40 0.092 2.24 0.100 1.57 0.073 1.82 0.114 1.67 0.064
Prop. day-user vehicles towing a boat 0.14 0.016 0.14 0.028 0.17 0.023 0.15 0.019 0.08 0.038 0.13 0.054 0.10 0.032
ERD
C/EL TR-10-18
23
Attribute
Months
Overall Annual
Apr - Sept Oct - Mar
WD WE Overall Apr - Sep WD WE Overall Oct- Mar
Estimate SE Estimate SE Estimate SE Estimate SE Estimate SE Estimate SE Estimate SE
Norfork Lake Vehicle Traffic Statistics
Prop. recreation vehicles 0.70 0.03 0.71 0.04 0.66 0.05 0.69 0.03 0.72 0.03 0.75 0.05 0.73 0.08
Prop. camping vehicles 0.06 0.01 0.08 0.03 0.08 0.02 0.08 0.02 0.04 0.02 0.03 0.02 0.04 0.02
Prop. day-user vehicles 0.64 0.04 0.63 0.04 0.58 0.06 0.61 0.03 0.68 0.01 0.72 0.06 0.69 0.08
Aggregate Recreation Vehicle Statistics
Prop. camping vehicles 0.09 0.019 0.11 0.036 0.12 0.039 0.11 0.026 0.06 0.036 0.04 0.030 0.05 0.024
Prop. day-use vehicles 0.91 0.019 0.89 0.036 0.88 0.039 0.89 0.026 0.94 0.036 0.96 0.030 0.95 0.024
Occupants per departing recreation vehicle
2.08 0.05 2.18 0.09 2.35 0.08 2.25 0.06 1.62 0.06 1.98 0.10 1.79 0.06
Age distribution: <18 yrs old 0.18 0.02 0.24 0.04 0.22 0.22 0.23 0.02 0.04 0.02 0.15 0.04 0.10 0.02
18 - 61 yrs old 0.55 0.02 0.52 0.04 0.64 0.02 0.57 0.02 0.43 0.04 0.60 0.02 0.52 0.03
62+ yrs. Old 0.27 0.24 0.25 0.05 0.15 0.02 0.20 0.03 0.53 0.05 0.25 0.04 0.38 0.04
Prop. recreation vehicles towing a boat
0.21 0.02 0.26 0.05 0.21 0.02 0.24 0.03 0.11 0.03 0.21 0.05 0.16 0.03

ERD
C/EL TR-10-18
24
Attribute
Months
Overall Annual
Apr - Sept Oct - Mar
WD WE Overall Apr - Sep WD WE Overall Oct- Mar
Estimate SE Estimate SE Estimate SE Estimate SE Estimate SE Estimate SE Estimate SE
Camping Vehicle Statistics
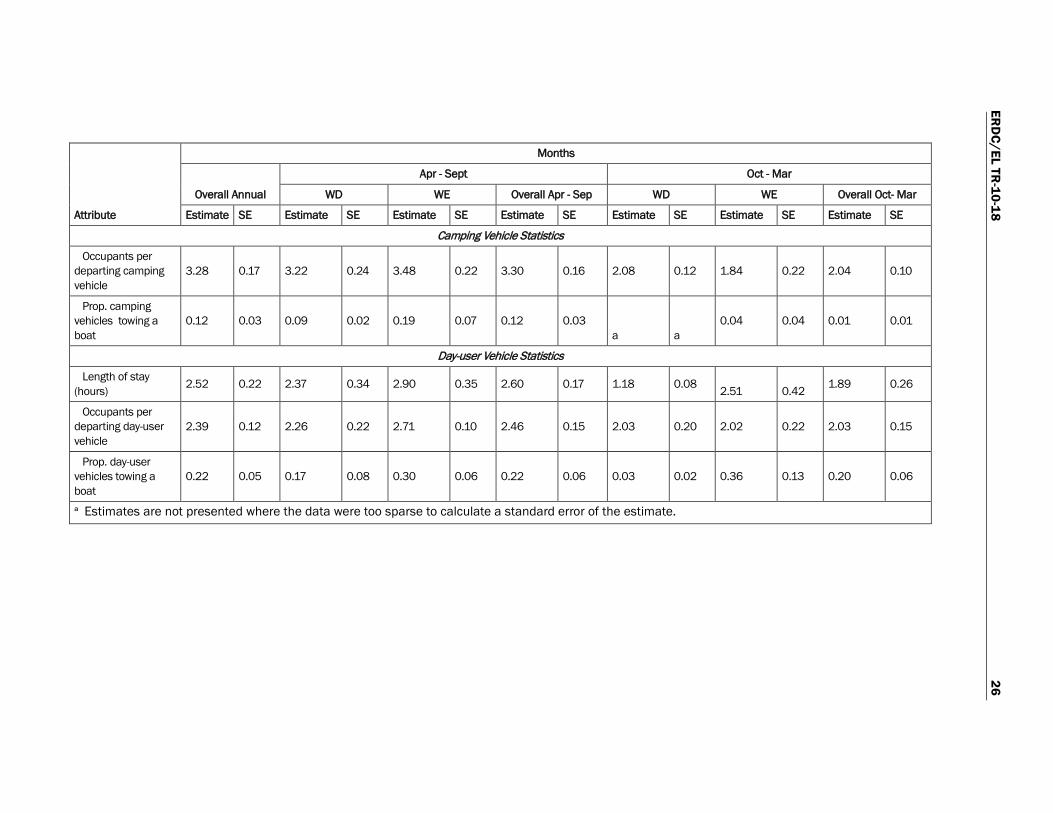
Length of stay (nights) 3.27 0.41 3.09 0.40 2.90 0.22 3.00 0.23 5.59 3.80 2.43 0.28 4.61 2.22
Occupants per departing camping vehicle
2.43 0.12 2.28 0.17 2.96 0.19 2.56 0.12 1.92 0.37 1.96 0.17 1.96 0.24
Prop. camping vehicles towing a boat
0.18 0.04 0.19 0.05 0.25 0.06 0.22 0.04 a a
0.13 0.06 0.05 0.04
Day-user Vehicle Statistics
Length of stay (hours) 2.43 0.11 2.41 0.16 2.95 0.21 2.62 0.14 1.89 0.21 2.21 0.34 2.06 0.21
Occupants per departing day-user vehicle
2.04 0.05 2.16 0.10 2.28 0.08 2.21 0.07 1.60 0.06 1.98 0.10 1.78 0.06
Prop. day-user vehicles towing a boat
0.21 0.02 0.73 0.05 0.20 0.02 0.24 0.03 0.12 0.04 0.21 0.06 0.16 0.03
Table Rock Lake
Vehicle Traffic Statistics
Prop. recreation vehicles 0.38 0.04 0.38 0.07 0.45 0.04 0.41 0.04 0.19 0.05 0.38 0.11 0.26 0.06
Prop. camping vehicles 0.09 0.03 0.12 0.06 0.09 0.03 0.11 0.04 0.01 0.01 0.00 0.00 0.01 0.00

ERD
C/EL TR-10-18
25
Attribute
Months
Overall Annual
Apr - Sept Oct - Mar
WD WE Overall Apr - Sep WD WE Overall Oct- Mar
Estimate SE Estimate SE Estimate SE Estimate SE Estimate SE Estimate SE Estimate SE
Table Rock Lake
Vehicle Traffic Statistics
Prop. day-user vehicles 0.29 0.03 0.26 0.05 0.36 0.04 0.30 0.04 0.18 0.06 0.37 0.11 0.25 0.06
Aggregate Recreation Vehicle Statistics
Prop. camping vehicles 0.23 0.075 0.31 0.122 0.19 0.053 0.26 0.082 0.05 0.041 0.01 0.004 0.03 0.020
Prop. day-use vehicles 0.77 0.075 0.69 0.122 0.81 0.053 0.74 0.082 0.05 0.041 0.99 0.004 0.97 0.020
Occupants per departing recreation vehicle
2.60 0.013 2.56 0.237 2.86 0.103 2.68 0.143 2.03 0.189 2.02 0.219 2.03 0.146
Age distribution: <18 yrs old 0.22 0.02 0.21 0.027 0.25 0.024 0.23 0.02 0.07 0.04 0.18 0.05 0.13 0.04
18 - 61 yrs old 0.64 0.01 0.64 0.017 0.63 0.018 0.64 0.01 0.59 0.09 0.68 0.06 0.64 0.05
62+ yrs. Old 0.14 0.02 0.14 0.030 0.12 0.019 0.13 0.02 0.33 0.10 0.14 0.01 0.24 0.09
Prop. recreation vehicles towing a boat
0.20 0.04 0.15 0.06 0.27 0.05 0.20 0.05 0.03 0.01 0.35 0.13 0.20 0.06
Camping Vehicle Statistics
Length of stay (nights) 2.61 0.16 2.82 0.12 2.12 0.27 2.63 0.25 a a 3.00 2.25 3.59 0.10
ERD
C/EL TR-10-18
26
Attribute
Months
Overall Annual
Apr - Sept Oct - Mar
WD WE Overall Apr - Sep WD WE Overall Oct- Mar
Estimate SE Estimate SE Estimate SE Estimate SE Estimate SE Estimate SE Estimate SE
Camping Vehicle Statistics
Occupants per departing camping vehicle
3.28 0.17 3.22 0.24 3.48 0.22 3.30 0.16 2.08 0.12 1.84 0.22 2.04 0.10
Prop. camping vehicles towing a boat
0.12 0.03 0.09 0.02 0.19 0.07 0.12 0.03 a a
0.04 0.04 0.01 0.01
Day-user Vehicle Statistics
Length of stay (hours) 2.52 0.22 2.37 0.34 2.90 0.35 2.60 0.17 1.18 0.08 2.51 0.42 1.89 0.26
Occupants per departing day-user vehicle
2.39 0.12 2.26 0.22 2.71 0.10 2.46 0.15 2.03 0.20 2.02 0.22 2.03 0.15
Prop. day-user vehicles towing a boat
0.22 0.05 0.17 0.08 0.30 0.06 0.22 0.06 0.03 0.02 0.36 0.13 0.20 0.06
ª Estimates are not presented where the data were too sparse to calculate a standard error of the estimate.
ERD
C/EL TR-10-18
27
Table 6. Estimated total lake visits and associated visitor hours at recreation parks from October 2004 through September 2005.
Lake - Areas No. Areas
Annual Lake Visits Annual Lake Visitor Hours
Camping Day-use Total Camping Day-use Total
Estimate SE Estimate SE Estimate SE Estimate SE Estimate SE Estimate SE
Bull Shoals Lake
Multiple use parks 15 40,979 8,891 592,121 49,060 633,101 45,429 2,923,911 629,767 1,356,170 208,795 4,280,081 542,173
Bull Shoals State Park2 1 6,138 1,296 58,913 10,204 65,051 9,802 487,181 134,419 93,452 17,902 580,632 136,070
Day-use parks 4 3 7,036 3,588 138,241 15,882 145,277 14,267 504,217 206,383 434,077 69,057 938,293 188,588
Minor day-use areas3 4 0 0 61,961 6,593 61,961 6,593 0 0 201,020 26,390 201,020 26,390
Bull Shoals Lake Total 23 54,154 9,675 851,235 52,978 905,389 49,060 3,915,308 676,217 2,084,718 222,219 6,000,027 590,533
Norfork Lake
Multiple use parks 11 105,426 21,378 678,690 48,728 784,117 43,353 8,536,539 1,944,895 1,590,391 174,766 10,126,930 1,862,421
Day-use parks3 7 2,947 1,279 306,657 15,906 309,604 16,226 141,444 61,379 766,490 69,401 907,934 103,188
Minor day-use areas3 5 2,887 2,356 109,636 6,253 112,523 6,474 207,838 169,605 211,221 23,564 419,059 182,319
Norfork Lake Total 23 111,260 21,546 1,094,983 51,638 1,206,243 46,741 8,885,821 1,953,241 2,568,102 189,513 11,453,923 1,874,166
Table Rock Lake
Visitor Center and Waterfront Park 1 729 769 108,142 8,403 108,871 8,649 34,982 36,900 141,899 14,537 176,882 41,275
State Fish Hatchery5 1 421 448 260,631 25,790 261,052 25,788 70,760 75,248 410,613 35,946 481,373 79,348
Table Rock State Park 1 40,741 14,469 313,925 58,748 354,666 53,904 2,579,387 961,721 889,986 234,324 3,469,373 835,739
Kimberling Park 1 12,101 4,096 114,119 40,954 126,221 41,017 872,507 372,870 418,204 166,752 1,290,712 371,050
Kimberling Park Port of Lights Tour6 – 190 – 527,366 – 527,556 – 1,783 – 539,835 – 541,618 –
Multiple use parks 17 193,152 85,387 337,313 46,238 530,465 78,389 12,318,768 6,043,276 905,590 232,100 13,224,358 5,922,989
ERD
C/EL TR-10-18
28
Lake - Areas No. Areas
Annual Lake Visits Annual Lake Visitor Hours
Camping Day-use Total Camping Day-use Total
Estimate SE Estimate SE Estimate SE Estimate SE Estimate SE Estimate SE
Table Rock Lake
Day-use parks3 5 13,434 4,314 158,872 15,416 172,305 16,222 985,397 359,812 360,046 63,083 1,345,443 398,578
Minor day-use areas 4 0 0 58,191 11,840 58,191 11,840 0 0 135,734 34,201 135,734 34,201
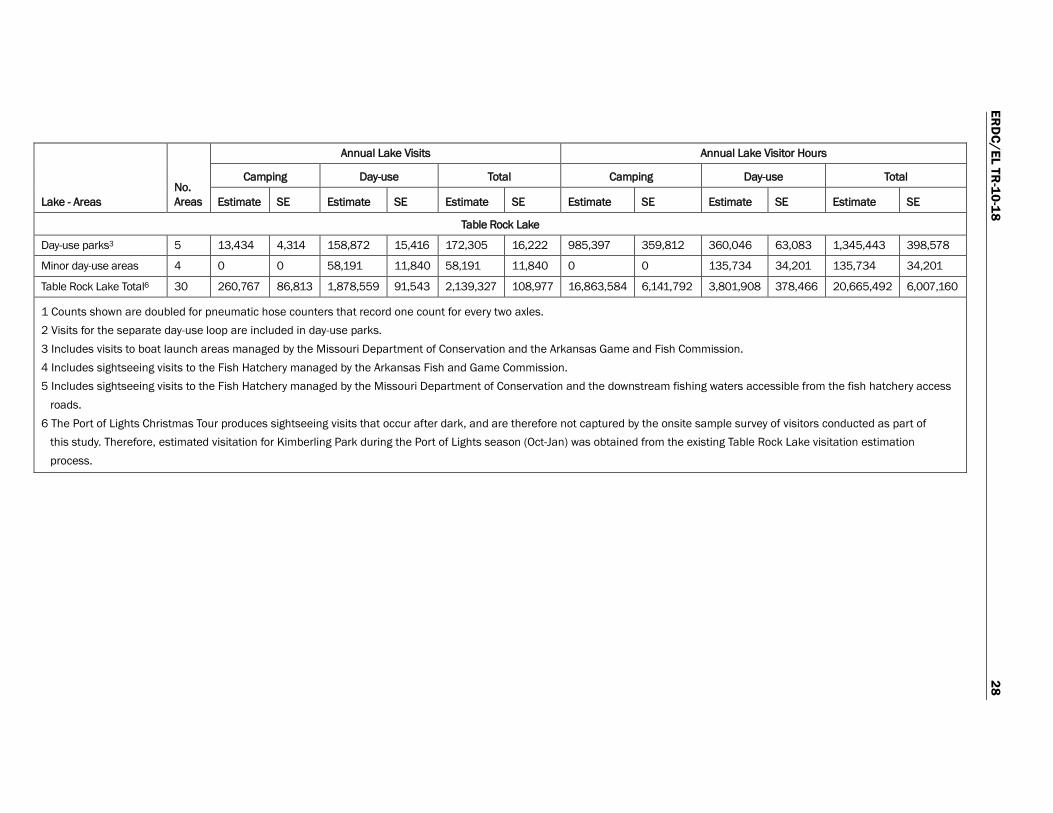
Table Rock Lake Total6 30 260,767 86,813 1,878,559 91,543 2,139,327 108,977 16,863,584 6,141,792 3,801,908 378,466 20,665,492 6,007,160
1 Counts shown are doubled for pneumatic hose counters that record one count for every two axles. 2 Visits for the separate day-use loop are included in day-use parks. 3 Includes visits to boat launch areas managed by the Missouri Department of Conservation and the Arkansas Game and Fish Commission. 4 Includes sightseeing visits to the Fish Hatchery managed by the Arkansas Fish and Game Commission. 5 Includes sightseeing visits to the Fish Hatchery managed by the Missouri Department of Conservation and the downstream fishing waters accessible from the fish hatchery access roads. 6 The Port of Lights Christmas Tour produces sightseeing visits that occur after dark, and are therefore not captured by the onsite sample survey of visitors conducted as part of this study. Therefore, estimated visitation for Kimberling Park during the Port of Lights season (Oct-Jan) was obtained from the existing Table Rock Lake visitation estimation process.

ERDC/EL TR-10-18 29
estimated 109,000 (±8 percent) annual visits with 177,000 (±23 percent) hours of use. In the order just presented, these parks accounted for 22 percent, 16 percent, 7 percent, and 6 percent of annual visits and 17 percent, 2 percent, 6 percent, and 1 percent of annual visitor hours at Table Rock Lake, respectively.
Visitor use varied seasonally (Figure 4). At each of the lakes, visitor use was lowest during the winter months of December through February, increased through the spring and summer to peak in July, and then declined through the fall months. The peak recreation season at Corps parks has traditionally been defined as the period between Memorial Day and Labor Day. Approximately 57 percent of annual visits occurred during the 4 months (May-Aug) that encompass the traditional summer vacation season.
Visitor use levels at unmetered access points and informal lakeshore recreation sites
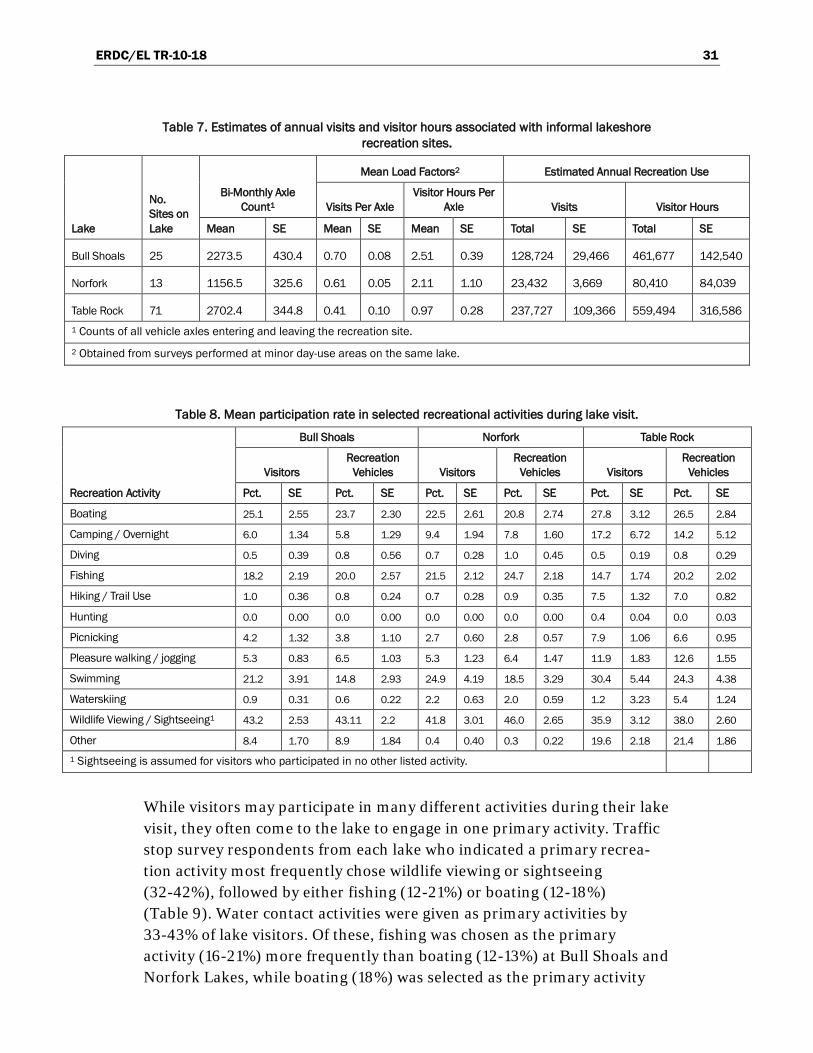
Visitor use associated with the unmetered access points and informal lakeshore recreation sites was approximately 129,000 visits and 462,000 visitor hours at Bull Shoals Lake, 23,000 visits and 80,000 visitor hours at Norfork Lake, and 238,00 visits and 559,000 visitor hours at Table Rock Lake (Table 7). This source of visitation adds to the annual visits associated with metered parks and access points by amounts totaling 14 percent at Bull Shoals Lake, 2 percent at Norfork Lake, and, excluding visitation associated with the Port of Lights Tour, 15 percent at Table Rock Lake.
Recreation activities
In the exit interview, the number of people participating in each of 10 active recreation activities and 1 predominately passive activity (wildlife viewing) was recorded. Those who engaged in none of these activities were assumed to be passive sightseers. Participation rates in the passive activi-ties of wildlife watching and sightseeing totaled 36 – 43% at the three lakes, while the participation in one or more active recreation activities totaled 57-64% of lake visitors (Table 8). Participation in each of the 10 active recreation activities varied from 0 to 30 percent and was generally highest in the water contact activities of boating (23-28 percent), swimming (21-30 percent), and fishing (15-22 percent).

ERDC/EL TR-10-18 30
Figure 4. Monthly distribution of day-use and camping visits.
Day-Use Visits
20
60
100
140
180
220
Sep-04
Oct-04
Nov-04
Dec-04
Jan-05
Feb-05
Mar-05
Apr-05
May-05
Jun-05
Jul-05
Aug-05
Sep-05
Vis
its in
1,0
00's
Bull Shoals
Norfork
Table Rock
Camping Visits
0
10
20
30
40
50
60
Sep-04
Oct-04
Nov-04
Dec-04
Jan-05
Feb-05
Mar-05
Apr-05
May-05
Jun-05
Jul-05
Aug-05
Sep-05
Visi
ts in
1,0
00's
Bull Shoals
Norfork
Table Rock
Total Visits
0
50
100
150
200
250
300
Sep-04
Oct-04
Nov-04
Dec-04
Jan-05
Feb-05
Mar-05
Apr-05
May-05
Jun-05
Jul-05
Aug-05
Sep-05
Visi
ts in
1,0
00's
Bull Shoals
Norfork
Table Rock
ERDC/EL TR-10-18 31
Table 7. Estimates of annual visits and visitor hours associated with informal lakeshore recreation sites.
Lake
No. Sites on Lake
Bi-Monthly Axle Count1
Mean Load Factors2 Estimated Annual Recreation Use
Visits Per Axle Visitor Hours Per
Axle Visits Visitor Hours
Mean SE Mean SE Mean SE Total SE Total SE
Bull Shoals 25 2273.5 430.4 0.70 0.08 2.51 0.39 128,724 29,466 461,677 142,540
Norfork 13 1156.5 325.6 0.61 0.05 2.11 1.10 23,432 3,669 80,410 84,039
Table Rock 71 2702.4 344.8 0.41 0.10 0.97 0.28 237,727 109,366 559,494 316,586 1 Counts of all vehicle axles entering and leaving the recreation site.
2 Obtained from surveys performed at minor day-use areas on the same lake.
Table 8. Mean participation rate in selected recreational activities during lake visit.
Recreation Activity
Bull Shoals Norfork Table Rock
Visitors Recreation
Vehicles Visitors Recreation
Vehicles Visitors Recreation
Vehicles
Pct. SE Pct. SE Pct. SE Pct. SE Pct. SE Pct. SE
Boating 25.1 2.55 23.7 2.30 22.5 2.61 20.8 2.74 27.8 3.12 26.5 2.84
Camping / Overnight 6.0 1.34 5.8 1.29 9.4 1.94 7.8 1.60 17.2 6.72 14.2 5.12
Diving 0.5 0.39 0.8 0.56 0.7 0.28 1.0 0.45 0.5 0.19 0.8 0.29
Fishing 18.2 2.19 20.0 2.57 21.5 2.12 24.7 2.18 14.7 1.74 20.2 2.02
Hiking / Trail Use 1.0 0.36 0.8 0.24 0.7 0.28 0.9 0.35 7.5 1.32 7.0 0.82
Hunting 0.0 0.00 0.0 0.00 0.0 0.00 0.0 0.00 0.4 0.04 0.0 0.03
Picnicking 4.2 1.32 3.8 1.10 2.7 0.60 2.8 0.57 7.9 1.06 6.6 0.95
Pleasure walking / jogging 5.3 0.83 6.5 1.03 5.3 1.23 6.4 1.47 11.9 1.83 12.6 1.55
Swimming 21.2 3.91 14.8 2.93 24.9 4.19 18.5 3.29 30.4 5.44 24.3 4.38
Waterskiing 0.9 0.31 0.6 0.22 2.2 0.63 2.0 0.59 1.2 3.23 5.4 1.24
Wildlife Viewing / Sightseeing1 43.2 2.53 43.11 2.2 41.8 3.01 46.0 2.65 35.9 3.12 38.0 2.60
Other 8.4 1.70 8.9 1.84 0.4 0.40 0.3 0.22 19.6 2.18 21.4 1.86
1 Sightseeing is assumed for visitors who participated in no other listed activity.
While visitors may participate in many different activities during their lake visit, they often come to the lake to engage in one primary activity. Traffic stop survey respondents from each lake who indicated a primary recrea-tion activity most frequently chose wildlife viewing or sightseeing (32-42%), followed by either fishing (12-21%) or boating (12-18%) (Table 9). Water contact activities were given as primary activities by 33-43% of lake visitors. Of these, fishing was chosen as the primary activity (16-21%) more frequently than boating (12-13%) at Bull Shoals and Norfork Lakes, while boating (18%) was selected as the primary activity

ERDC/EL TR-10-18 32
more often than fishing (12%) at Table Rock Lake. While swimming was the most frequent activity of visitors (21-30%) at two of the three lakes (Table 8), it was not often selected as the primary visitor activity (5-8%) at any of the lakes (Table 9).
Table 9. Primary activities of lake visitors.
Primary Activity
Percent Bull Shoals Norfork
Table Rock
Boating 12 13 18 Camping 6 7 8 Diving 0 1 1 Fishing 16 21 12 Hiking / Trail use 0 1 2 Picnicking 3 2 2 Pleasure walking / jogging 5 2 6 Swimming 5 8 6 Wildlife viewing / Sightseeing 39 42 32 Other 14 1 14 Total 100 100 100
Camping is one of the more management-intensive recreational activities on these lakes. Camping along with overnight stays on boats and at resorts located in recreation parks comprised 6%(±1.3%) of visits to Bull Shoals Lake, 9%(±1.9%) to Norfork Lake, and 17 percent (±6.7%) at Table Rock Lake (Table 8). The lower percentage of overnight visits at Norfork and Bull Shoals Lakes is consistent with these lakes having fewer campsites and regulations prohibiting marina visitors from staying overnight on boats docked at a marina. While overnight visits accounted for a modest percentage of visits at the three lakes, it accounted for a large fraction (65-83%) of total visitor hours (Table 6). This reflects the large number of hours associated with mean length of overnight stays of 2.6 – 3.3 nights per visit (Table 5).
Survey respondents were given a more detailed selection of activity choices in the mail survey than in the exit interview. The more detailed activity choices in the mail survey showed that among boaters, similar numbers of boating parties used boats kept at a marina (19-31%) as used boats launched from a ramp (23-29%) (Table 10). They also showed that among fishers, participation in shoreline fishing (19-31%) was only somewhat less common than fishing from a boat (27-49%). In general, respondents claimed higher

ERDC/EL TR-10-18 33
participation levels for many activities in the mail survey than in the traffic stop survey, though participation rates were generally congruent for activities that were the same or similar in both survey modes. As in the traffic stop survey, activity participation was highest overall in the passive recreation activities, which in the mail survey included sightseeing (30-33%), pleasure driving through parks (29-36%), and wildlife or nature observation (23-26%). And like the results of the traffic stop survey, mail survey respondents also had high participation in water contact activities of boating, fishing, and swimming relative to other activities (Table 10).
Table 10. Percentage of recreation parties reporting participation in one or more of 26 recreation activities in the mail survey.
Activity Bull Shoals Norfork Table Rock
Pct. SE Pct. SE Pct. SE Bicycling 5.5 1.5 2.5 0.9 4.8 1.2 Boating from a launch ramp 25.9 2.3 28.8 2.9 22.6 3.3 Boating from a marina slip 30.5 3.0 25.4 4.1 18.6 2.8 Camping in RV or trailer 8.8 1.6 12.7 2.5 11.9 3.9 Camping in tent 6.5 1.7 4.0 1.0 8.0 4.5 Commercial water cruise ride 2.1 0.9 0.3 0.3 1.3 0.5 Fishing from a boat 49.3 3.7 39.4 2.8 26.5 2.9 Fishing from shore / dock / pier 22.4 2.4 24.7 3.2 17.9 2.5 Horseback riding 1.5 1.4 0.0 0.0 0.3 0.2 Hunting or trapping 1.4 0.5 4.3 1.3 1.0 0.7 Jet skiing (personal watercraft) 5.4 1.1 3.3 1.2 5.9 1.7 Kayaking or canoeing 1.7 0.7 2.8 1.1 1.8 0.9 Other activities 7.7 1.9 4.2 1.0 9.2 1.3 Photography 11.5 1.5 11.7 2.1 13.0 2.3 Picnicking 19.6 1.9 22.4 3.0 21.4 3.3 Playing on playground equipment 8.8 1.3 8.3 2.2 8.5 2.2 Pleasure driving through recreation area 35.6 2.3 28.9 2.8 29.5 3.2 Running or jogging 3.9 1.0 3.1 1.2 2.6 0.9 Sail boarding or windsurfing 0.0 0.0 0.0 0.0 0.0 0.0 Scuba diving 2.3 0.8 2.7 0.9 1.5 0.8 Sightseeing 29.9 3.5 29.7 2.5 32.7 3.5 Sunbathing 18.2 2.6 20.5 4.1 28.0 6.4 Swimming 34.6 4.4 37.1 2.7 39.0 6.7 Trail hiking 5.2 1.1 4.7 1.1 9.5 1.5 Walking for fitness or pleasure 26.9 2.8 22.9 3.5 23.7 2.4 Wildlife or nature observation 25.5 2.6 22.9 2.8 23.2 3.1
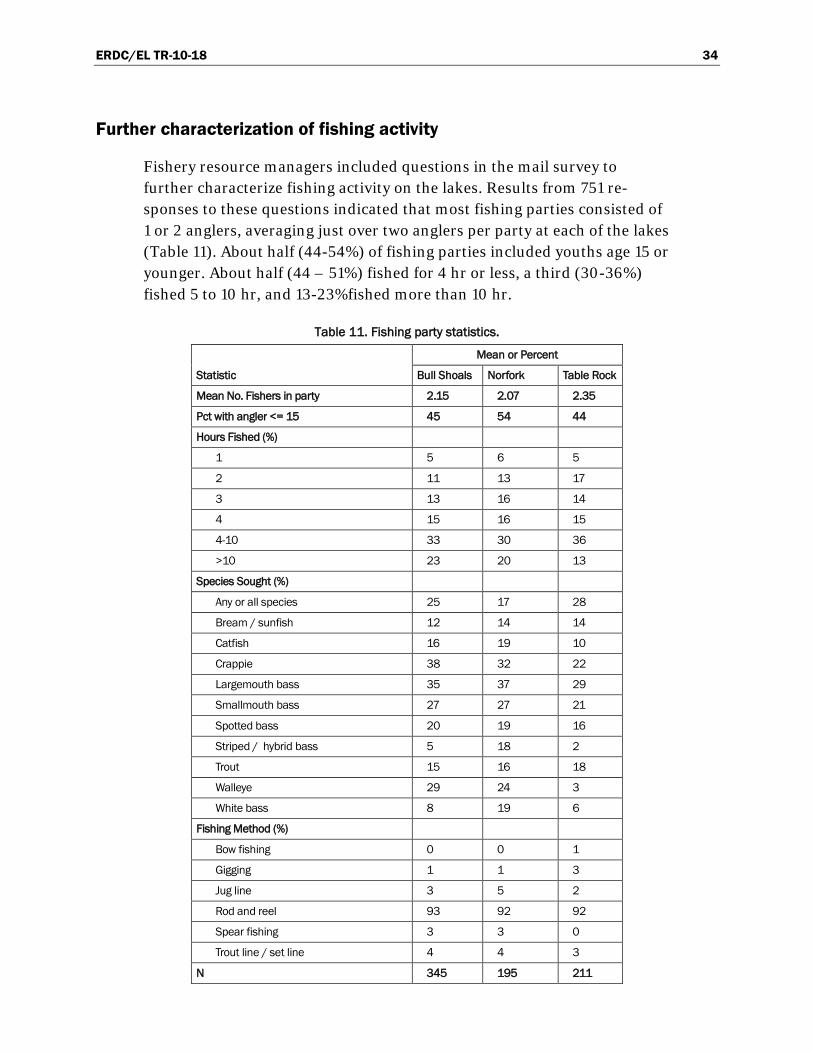
ERDC/EL TR-10-18 34
Further characterization of fishing activity
Fishery resource managers included questions in the mail survey to further characterize fishing activity on the lakes. Results from 751 re-sponses to these questions indicated that most fishing parties consisted of 1 or 2 anglers, averaging just over two anglers per party at each of the lakes (Table 11). About half (44-54%) of fishing parties included youths age 15 or younger. About half (44 – 51%) fished for 4 hr or less, a third (30-36%) fished 5 to 10 hr, and 13-23%fished more than 10 hr.
Table 11. Fishing party statistics.
Statistic
Mean or Percent
Bull Shoals Norfork Table Rock
Mean No. Fishers in party 2.15 2.07 2.35
Pct with angler <= 15 45 54 44
Hours Fished (%)
1 5 6 5
2 11 13 17
3 13 16 14
4 15 16 15
4-10 33 30 36
>10 23 20 13
Species Sought (%)
Any or all species 25 17 28
Bream / sunfish 12 14 14
Catfish 16 19 10
Crappie 38 32 22
Largemouth bass 35 37 29
Smallmouth bass 27 27 21
Spotted bass 20 19 16
Striped / hybrid bass 5 18 2
Trout 15 16 18
Walleye 29 24 3
White bass 8 19 6
Fishing Method (%)
Bow fishing 0 0 1
Gigging 1 1 3
Jug line 3 5 2
Rod and reel 93 92 92
Spear fishing 3 3 0
Trout line / set line 4 4 3
N 345 195 211
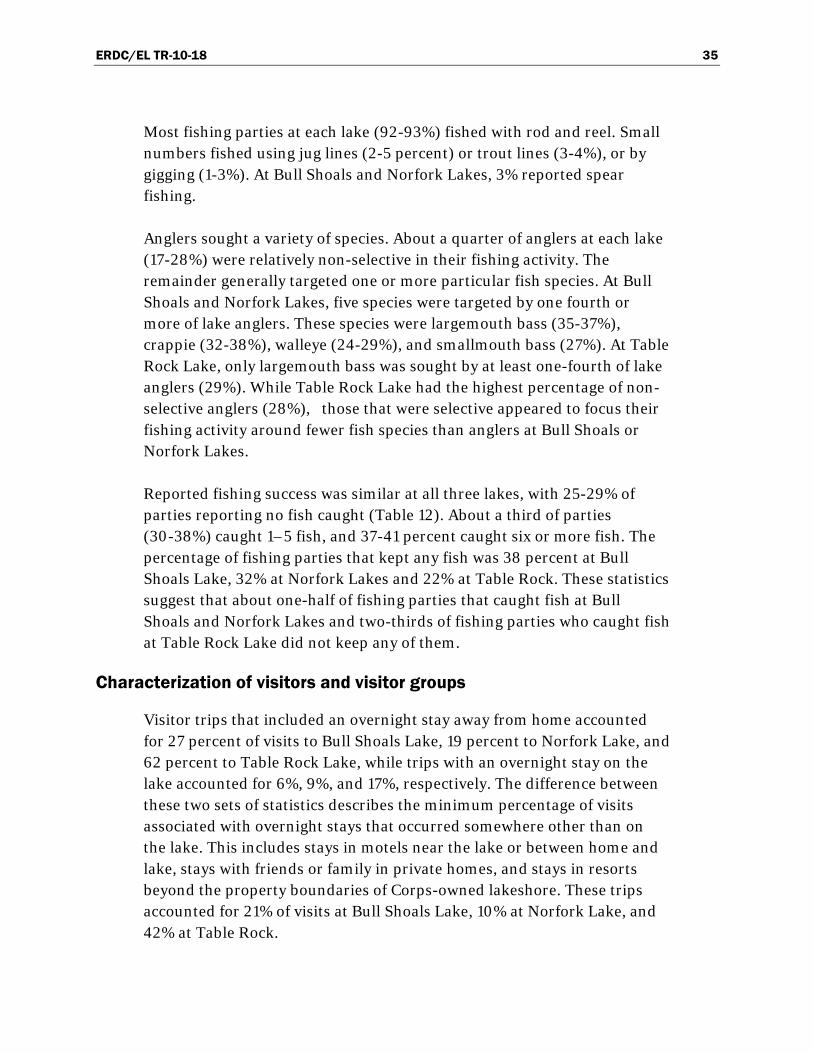
ERDC/EL TR-10-18 35
Most fishing parties at each lake (92-93%) fished with rod and reel. Small numbers fished using jug lines (2-5 percent) or trout lines (3-4%), or by gigging (1-3%). At Bull Shoals and Norfork Lakes, 3% reported spear fishing.
Anglers sought a variety of species. About a quarter of anglers at each lake (17-28%) were relatively non-selective in their fishing activity. The remainder generally targeted one or more particular fish species. At Bull Shoals and Norfork Lakes, five species were targeted by one fourth or more of lake anglers. These species were largemouth bass (35-37%), crappie (32-38%), walleye (24-29%), and smallmouth bass (27%). At Table Rock Lake, only largemouth bass was sought by at least one-fourth of lake anglers (29%). While Table Rock Lake had the highest percentage of non-selective anglers (28%), those that were selective appeared to focus their fishing activity around fewer fish species than anglers at Bull Shoals or Norfork Lakes.
Reported fishing success was similar at all three lakes, with 25-29% of parties reporting no fish caught (Table 12). About a third of parties (30-38%) caught 1–5 fish, and 37-41 percent caught six or more fish. The percentage of fishing parties that kept any fish was 38 percent at Bull Shoals Lake, 32% at Norfork Lakes and 22% at Table Rock. These statistics suggest that about one-half of fishing parties that caught fish at Bull Shoals and Norfork Lakes and two-thirds of fishing parties who caught fish at Table Rock Lake did not keep any of them.
Characterization of visitors and visitor groups
Visitor trips that included an overnight stay away from home accounted for 27 percent of visits to Bull Shoals Lake, 19 percent to Norfork Lake, and 62 percent to Table Rock Lake, while trips with an overnight stay on the lake accounted for 6%, 9%, and 17%, respectively. The difference between these two sets of statistics describes the minimum percentage of visits associated with overnight stays that occurred somewhere other than on the lake. This includes stays in motels near the lake or between home and lake, stays with friends or family in private homes, and stays in resorts beyond the property boundaries of Corps-owned lakeshore. These trips accounted for 21% of visits at Bull Shoals Lake, 10% at Norfork Lake, and 42% at Table Rock.
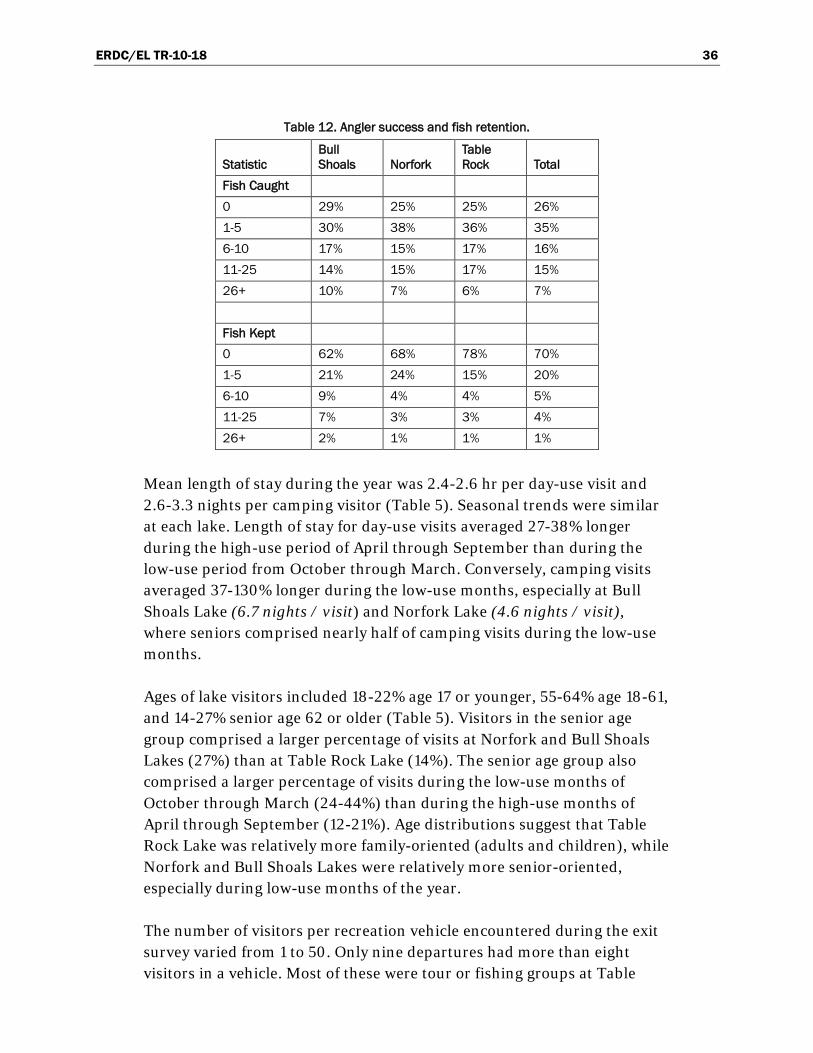
ERDC/EL TR-10-18 36
Table 12. Angler success and fish retention.
Statistic Bull Shoals Norfork
Table Rock Total
Fish Caught 0 29% 25% 25% 26% 1-5 30% 38% 36% 35% 6-10 17% 15% 17% 16% 11-25 14% 15% 17% 15% 26+ 10% 7% 6% 7% Fish Kept 0 62% 68% 78% 70% 1-5 21% 24% 15% 20% 6-10 9% 4% 4% 5% 11-25 7% 3% 3% 4% 26+ 2% 1% 1% 1%
Mean length of stay during the year was 2.4-2.6 hr per day-use visit and 2.6-3.3 nights per camping visitor (Table 5). Seasonal trends were similar at each lake. Length of stay for day-use visits averaged 27-38% longer during the high-use period of April through September than during the low-use period from October through March. Conversely, camping visits averaged 37-130% longer during the low-use months, especially at Bull Shoals Lake (6.7 nights / visit) and Norfork Lake (4.6 nights / visit), where seniors comprised nearly half of camping visits during the low-use months.
Ages of lake visitors included 18-22% age 17 or younger, 55-64% age 18-61, and 14-27% senior age 62 or older (Table 5). Visitors in the senior age group comprised a larger percentage of visits at Norfork and Bull Shoals Lakes (27%) than at Table Rock Lake (14%). The senior age group also comprised a larger percentage of visits during the low-use months of October through March (24-44%) than during the high-use months of April through September (12-21%). Age distributions suggest that Table Rock Lake was relatively more family-oriented (adults and children), while Norfork and Bull Shoals Lakes were relatively more senior-oriented, especially during low-use months of the year.
The number of visitors per recreation vehicle encountered during the exit survey varied from 1 to 50. Only nine departures had more than eight visitors in a vehicle. Most of these were tour or fishing groups at Table

ERDC/EL TR-10-18 37
Rock Lake or diving groups at Bull Shoals Lake that traveled to the lake by van or bus. The mean number of visitors per recreation vehicle was 2.1 at Bull Shoals and Norfork Lakes and 2.6 at Table Rock Lake (Table 5). At Bull Shoals and Norfork Lakes, 30-32% of day-use departures and 22-24% of camping departures had one visitor in the vehicle (Table 13). Inspection of the activities associated with the day-use visitors suggests that many were engaged in sightseeing or wildlife viewing. A smaller percentage of day-use (23%) and camping (6%) visitors at Table Rock Lake had one visitor per departing recreation vehicle.
Table 13. Number of people in departing recreation vehicles.
No. Occupants
Bull Shoals Norfork Table Rock Day Use Camping Day Use Camping Day Use Camping
1 31.8 23.6 30.0 21.6 22.9 5.8 2 43.9 51.1 48.8 41.5 44.6 46.2 3 11.2 11.8 11.1 14.5 9.6 15.2 4 8.0 6.2 6.8 15.4 14.7 15.3 5 3.3 5.4 2.2 3.0 3.7 5.7 6+ 1.8 1.8 1.1 4.0 4.5 11.8 Total 100% 100% 100% 100% 100% 100% N 1,743 131 1,214 118 1,946 171
In the mail survey, approximately half of respondents (41-58%) indicated that the lake where they were surveyed was the primary destination on their trip away from home (Table 14). Including respondents who described ‘other’ purposes that matched this category, approximately three-fourths of visits were destination recreation visits to the lake. Another 13-16% of visits included stays in the area with relatives, on business, or in seasonal homes. The largest difference among the lakes was at Table Rock Lake, where 17% of respondents were engaged in a recreation trip in which Table Rock Lake was not the primary destination.
About half (45-63%) of the visits at each lake were associated with visitors who were not familiar with the other two lakes in the study, and even more (61-82%) were not familiar with other Corps of Engineers lakes in the region (Table 15).

ERDC/EL TR-10-18 38
Table 14. Primary purpose of trip in which lake visit occurred.
Primary Purpose of Trip
Percent of Responses Bull Shoals Norfork
Table Rock
Recreation trip to this lake 46 58 41 Recreation trip, but not primarily to this lake 5 5 17 Seasonal home stay 9 8 9 Visit while passing through area 3 3 6 Visit with relatives, business, etc. 7 5 6 Other1 30 21 21 Total 100 100 100 N 690 406 723 1 Includes 47% living nearby (47%), recreation (34%), passing through area (11%), and
marina use (6%).
Table 15. Respondent familiarity with other Corps of
Engineer lakes in the region.
Lake
Percent of Responses Very Familiar
Somewhat Familiar
Not Familiar
Bull Shoals1 14 41 45 Norfork1 12 25 63 Table Rock1 17 38 45 Beaver Lake 6 21 72 Harry S Truman 5 14 81 Lake of Ozarks 10 28 61 Pomme de Terre 4 13 82 1 Excludes visitors who were surveyed at that lake.
More than half of the visits at each lake (51–56%) were associated with visitors who had been coming to the lake for more than 10 years (Table 16). First-time visitors to the lake comprised 6-20% of visits. In general, Table Rock Lake had at least twice the frequency of first-time and inferquent visitors (1 or 2 trips per year) as the other two lakes. The higher incidence of new and infrequent visitors to Table Rock Lake may reflect the closer proximity of Table Rock to major highway arteries, its greater availability of sightseeing opportunities, and close proximity to the tourist destination of Branson, Missouri.
Proximity to home was the most frequently cited reason for selecting the lake visited (Table 17). It accounted for 31-47% of responses to the ques-

ERDC/EL TR-10-18 39
tion asking visitors why they chose to visit the lake where they were surveyed rather than another lake. In addition, reasons closely related to proximity to home accounted for approximately a third of the 12-26% of respondents describing ‘other’ reasons for visiting the lake. Some of the response options tended to be lake-specific. Noteworthy were the 18% of survey respondents from Bull Shoals that selected this lake because it was less crowded than other lake options, the 9% of Table Rock Lake respond-ents citing the superior scenery at this lake, and the 11-13% of respondents from Norfork and Table Rock Lakes that cited their familiarity with these lakes as a principal reason for going there. Nearly half of the large number of write-in responses from Table Rock visitors indicated that their lake visit was associated with other travel or their visit to Branson, Missouri.
Table 16. Previous history of visiting lake where surveyed.
Previous Lake Visits
Percent of Lake Visits Bull Shoals Norfork Table Rock
Years Visiting This Lake First trip 10 6 20 Less than 1 yr 6 4 4 Past 1-5 yrs 19 18 15 Past 6-10 yrs 12 16 10 More than 10 yrs 54 56 51
No. trips to this lake in last 12 months 1 19 14 35 2 10 8 11 3 5 6 9 4 6 4 4 5 5 2 3 6 6 9 5 7 1 1 1 8 2 6 1 9 1 1 0 10 5 7 6 11-20 14 12 11 21-30 8 9 7 31-40 3 3 2 41-50 5 5 2 51-99 3 4 1 ≥100 8 9 4
N 617 368 656
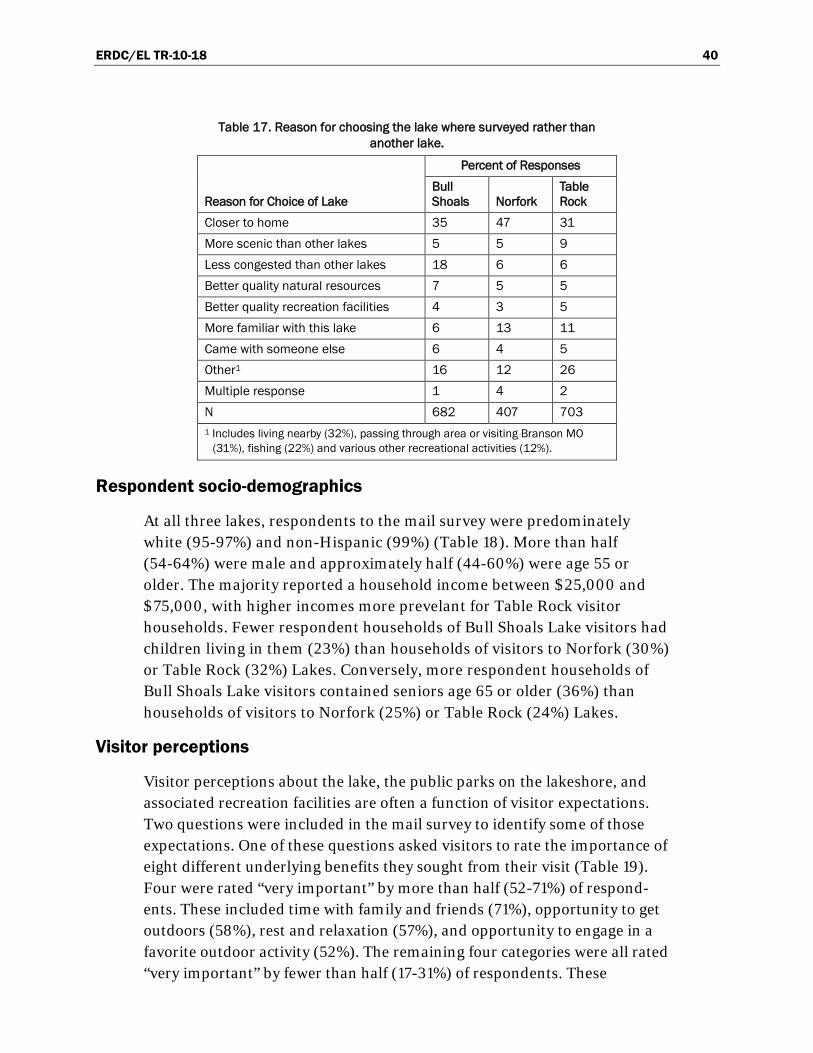
ERDC/EL TR-10-18 40
Table 17. Reason for choosing the lake where surveyed rather than another lake.
Reason for Choice of Lake
Percent of Responses Bull Shoals Norfork
Table Rock
Closer to home 35 47 31 More scenic than other lakes 5 5 9 Less congested than other lakes 18 6 6 Better quality natural resources 7 5 5 Better quality recreation facilities 4 3 5 More familiar with this lake 6 13 11 Came with someone else 6 4 5 Other1 16 12 26 Multiple response 1 4 2 N 682 407 703 1 Includes living nearby (32%), passing through area or visiting Branson MO
(31%), fishing (22%) and various other recreational activities (12%).
Respondent socio-demographics
At all three lakes, respondents to the mail survey were predominately white (95-97%) and non-Hispanic (99%) (Table 18). More than half (54-64%) were male and approximately half (44-60%) were age 55 or older. The majority reported a household income between $25,000 and $75,000, with higher incomes more prevelant for Table Rock visitor households. Fewer respondent households of Bull Shoals Lake visitors had children living in them (23%) than households of visitors to Norfork (30%) or Table Rock (32%) Lakes. Conversely, more respondent households of Bull Shoals Lake visitors contained seniors age 65 or older (36%) than households of visitors to Norfork (25%) or Table Rock (24%) Lakes.
Visitor perceptions
Visitor perceptions about the lake, the public parks on the lakeshore, and associated recreation facilities are often a function of visitor expectations. Two questions were included in the mail survey to identify some of those expectations. One of these questions asked visitors to rate the importance of eight different underlying benefits they sought from their visit (Table 19). Four were rated “very important” by more than half (52-71%) of respond-ents. These included time with family and friends (71%), opportunity to get outdoors (58%), rest and relaxation (57%), and opportunity to engage in a favorite outdoor activity (52%). The remaining four categories were all rated “very important” by fewer than half (17-31%) of respondents. These
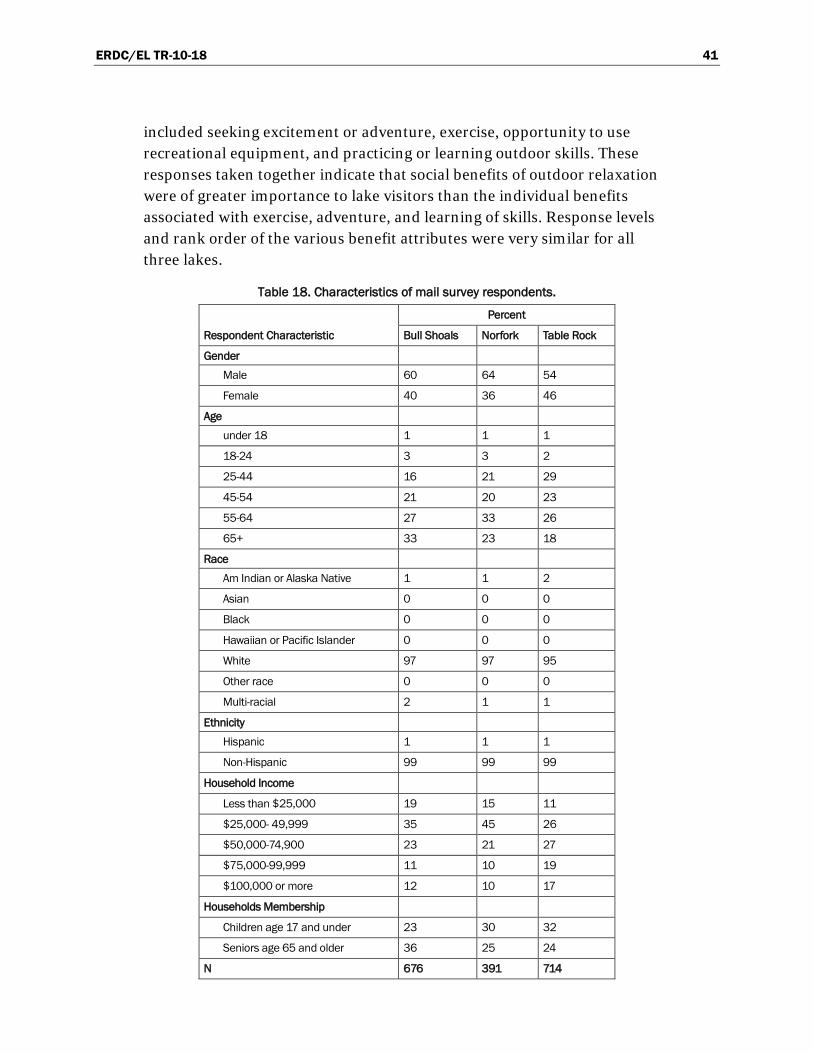
ERDC/EL TR-10-18 41
included seeking excitement or adventure, exercise, opportunity to use recreational equipment, and practicing or learning outdoor skills. These responses taken together indicate that social benefits of outdoor relaxation were of greater importance to lake visitors than the individual benefits associated with exercise, adventure, and learning of skills. Response levels and rank order of the various benefit attributes were very similar for all three lakes.
Table 18. Characteristics of mail survey respondents.
Respondent Characteristic
Percent
Bull Shoals Norfork Table Rock
Gender Male 60 64 54
Female 40 36 46
Age under 18 1 1 1
18-24 3 3 2
25-44 16 21 29
45-54 21 20 23
55-64 27 33 26
65+ 33 23 18
Race Am Indian or Alaska Native 1 1 2
Asian 0 0 0
Black 0 0 0
Hawaiian or Pacific Islander 0 0 0
White 97 97 95
Other race 0 0 0
Multi-racial 2 1 1
Ethnicity Hispanic 1 1 1
Non-Hispanic 99 99 99
Household Income
Less than $25,000 19 15 11
$25,000- 49,999 35 45 26
$50,000-74,900 23 21 27
$75,000-99,999 11 10 19
$100,000 or more 12 10 17
Households Membership
Children age 17 and under 23 30 32
Seniors age 65 and older 36 25 24
N 676 391 714
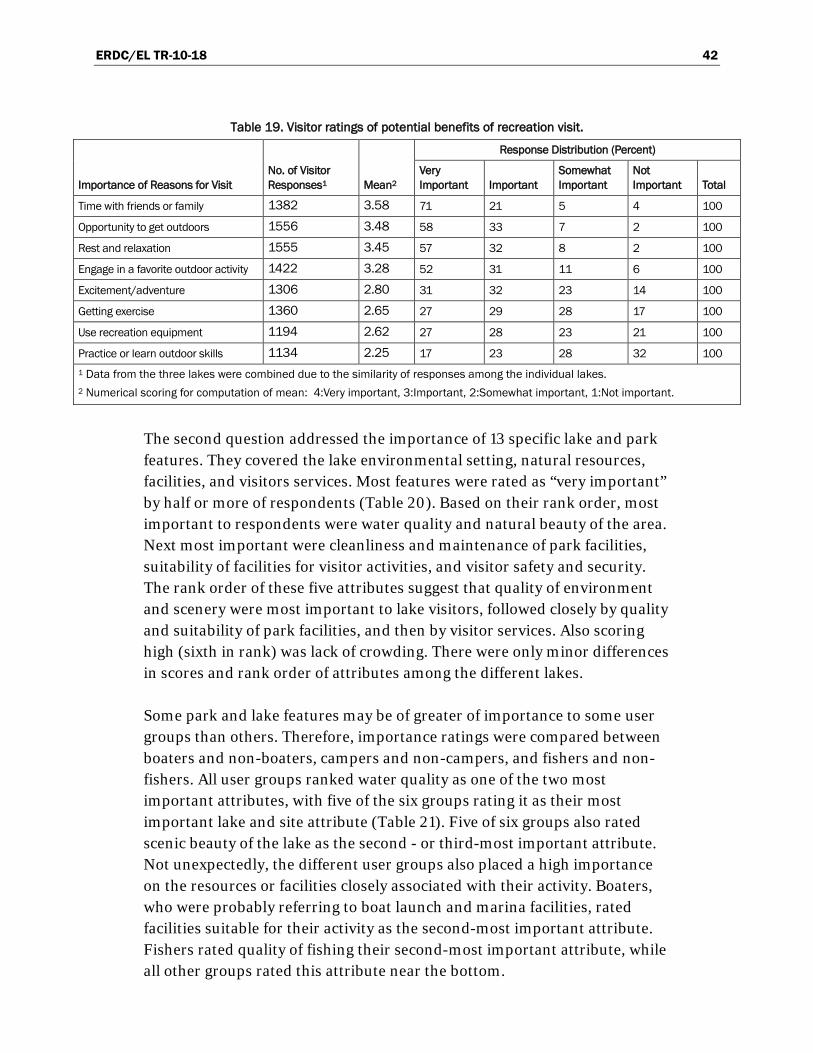
ERDC/EL TR-10-18 42
Table 19. Visitor ratings of potential benefits of recreation visit.
Importance of Reasons for Visit No. of Visitor Responses1 Mean2
Response Distribution (Percent)
Very Important Important
Somewhat Important
Not Important Total
Time with friends or family 1382 3.58 71 21 5 4 100
Opportunity to get outdoors 1556 3.48 58 33 7 2 100
Rest and relaxation 1555 3.45 57 32 8 2 100
Engage in a favorite outdoor activity 1422 3.28 52 31 11 6 100
Excitement/adventure 1306 2.80 31 32 23 14 100
Getting exercise 1360 2.65 27 29 28 17 100
Use recreation equipment 1194 2.62 27 28 23 21 100
Practice or learn outdoor skills 1134 2.25 17 23 28 32 100 1 Data from the three lakes were combined due to the similarity of responses among the individual lakes. 2 Numerical scoring for computation of mean: 4:Very important, 3:Important, 2:Somewhat important, 1:Not important.
The second question addressed the importance of 13 specific lake and park features. They covered the lake environmental setting, natural resources, facilities, and visitors services. Most features were rated as “very important” by half or more of respondents (Table 20). Based on their rank order, most important to respondents were water quality and natural beauty of the area. Next most important were cleanliness and maintenance of park facilities, suitability of facilities for visitor activities, and visitor safety and security. The rank order of these five attributes suggest that quality of environment and scenery were most important to lake visitors, followed closely by quality and suitability of park facilities, and then by visitor services. Also scoring high (sixth in rank) was lack of crowding. There were only minor differences in scores and rank order of attributes among the different lakes.
Some park and lake features may be of greater of importance to some user groups than others. Therefore, importance ratings were compared between boaters and non-boaters, campers and non-campers, and fishers and non-fishers. All user groups ranked water quality as one of the two most important attributes, with five of the six groups rating it as their most important lake and site attribute (Table 21). Five of six groups also rated scenic beauty of the lake as the second - or third-most important attribute. Not unexpectedly, the different user groups also placed a high importance on the resources or facilities closely associated with their activity. Boaters, who were probably referring to boat launch and marina facilities, rated facilities suitable for their activity as the second-most important attribute. Fishers rated quality of fishing their second-most important attribute, while all other groups rated this attribute near the bottom.

ERDC/EL TR-10-18 43
Most of the lake and park attributes rated for their importance to visitors were also rated for visitor satisfaction. The attributes rated for satisfaction all received positive ratings of “excellent,” “very good,” or “good’ by 73-99% of respondents (Table 22). The rank order of satisfaction attrib-utes was due primarily to how positively respondents rated satisfaction of each attribute. Overall, respondents expressed the greatest satisfaction with natural beauty of the lake, friendliness and courtesy of park staff, suitability of facilities for visitor activities, and water quality. And while still positive in their assessment, respondents were less satisfied with the quality of fishing, lake water levels, and encounters with other lake visitors. Rank order of satisfaction attributes was similar between the lakes, with the two highest ranked and two lowest ranked features the same for each lake (Table 23). The greatest difference among the individual lakes appeared to be satisfaction with crowding levels. In this measure, Bull Shoals Lake both scored (4.2) and ranked (5th) more favorably in satisfaction with crowding levels than either Norfork (3.8 and 9th) or Table Rock (3.9 and 8th) Lakes.
Table 20. Importance of lake and site attributes for all lake visitors.
Lake or Site Attribute No. of Visitor Responses1 Mean2
Response Distribution (Percent)
Very Important Important
Somewhat Important
Not Important Total
Water quality 1,577 3.66 73 22 4 1 100
Natural beauty of the area 1,662 3.59 66 28 6 1 100
Cleanliness & maintenance of facilities 1,591 3.54 63 30 6 1 100
Suitable facilities for my activities 1,550 3.48 59 32 7 2 100
Safety and security 1,519 3.46 59 30 9 2 100
Lack of crowding 1,547 3.36 54 32 12 3 100
Friendliness & courtesy of park staff 1,513 3.34 50 36 11 3 100
Lakeside setting 1,503 3.30 52 31 12 5 100
Reasonable user fees 1,366 3.26 49 33 13 5 100
Close to home 1,502 3.26 58 19 14 9 100
Fishing quality 1,372 3.17 51 25 13 10 100
Water level of lake 1,472 2.97 36 34 21 9 100
Restaurants, shopping, or other attractions nearby or on the way 1,394 2.50 25 24 27 24 100 1 Data from the three lakes were combined due to the similarity of responses among the individual lakes. 2 Numerical scoring for computation of mean: 4: Very important, 3: Important, 2: Somewhat important 1: Not important.

ERDC/EL TR-10-18 44
Table 21. Importance of lake and site attributes for different user groups.
Site or Lake Attribute
Boater Non-Boater Fisher Non-Fisher Camper Non-Camper
Mean Rank Mean Rank Mean Rank Mean Rank Mean Rank Mean Rank
Water quality 3.75 1 3.63 1 3.66 1 3.66 1 3.62 2 3.66 1
Natural beauty of the area 3.52 3 3.61 2 3.44 5 3.62 2 3.58 3 3.59 2
Cleanliness & maintenance of facilities 3.49 4 3.56 3 3.47 4 3.56 3 3.66 1 3.53 3
Safety and security 3.46 5 3.45 4 3.35 7 3.48 4 3.53 5 3.45 5
Suitable facilities for my activities 3.55 2 3.45 5 3.48 3 3.48 5 3.57 4 3.47 4
Lack of crowding 3.44 6 3.34 7 3.36 6 3.36 6 3.44 7 3.36 6
Lakeside setting 3.33 7 3.3 8 3.12 11 3.35 7 3.43 8 3.29 9
Friendliness & courtesy of park staff 3.27 9 3.35 6 3.28 8 3.35 8 3.47 6 3.32 7
Reasonable user fees 3.24 10 3.27 9 3.2 10 3.28 9 3.39 9 3.25 10
Close to home 3.28 8 3.25 10 3.2 9 3.28 10 2.76 11 3.3 8
Fishing quality 3.16 11 3.17 11 3.55 2 3.04 11 2.9 10 3.19 11
Water level of lake 3.11 12 2.92 12 3.07 12 2.94 12 2.71 12 2.99 12
Restaurants, shopping, or other attractions nearby or on the way 2.27 13 2.57 13 2.21 13 2.57 13 2.39 13 2.51 13
Range of sample sizes 329-392 1026-1280 227-337 1037 - 1322 110-138 1237-1526
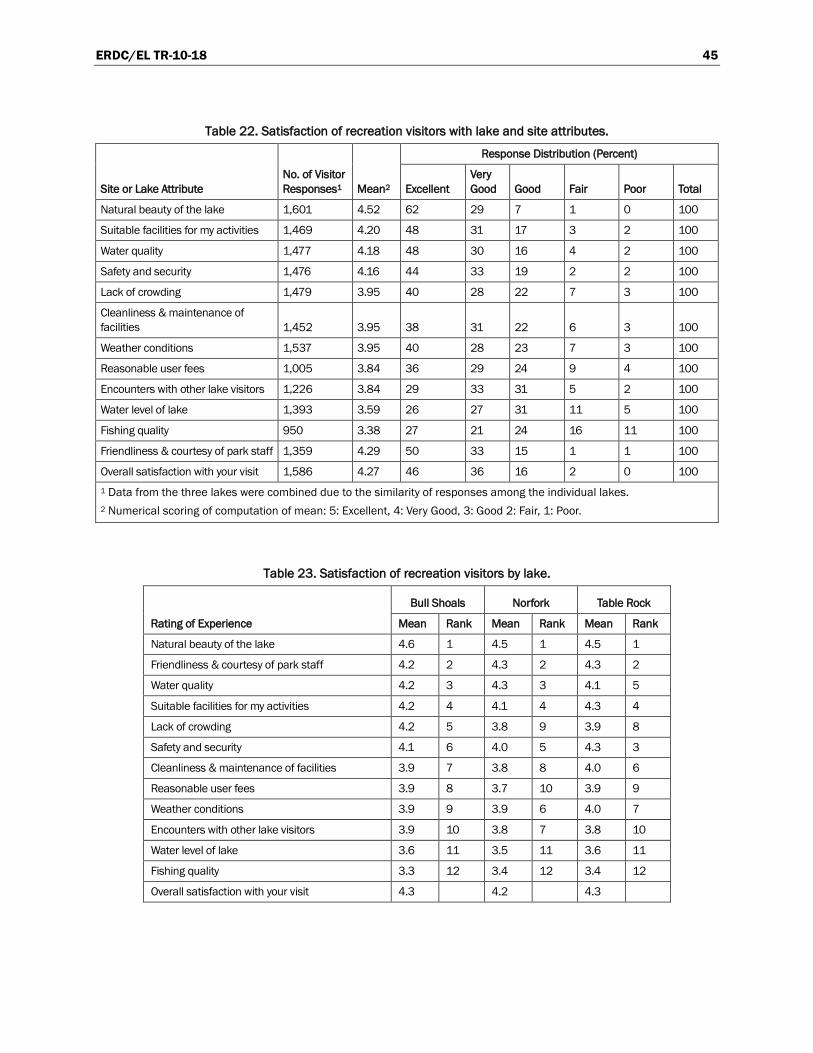
ERDC/EL TR-10-18 45
Table 22. Satisfaction of recreation visitors with lake and site attributes.
Site or Lake Attribute No. of Visitor Responses1 Mean2
Response Distribution (Percent)
Excellent Very Good Good Fair Poor Total
Natural beauty of the lake 1,601 4.52 62 29 7 1 0 100
Suitable facilities for my activities 1,469 4.20 48 31 17 3 2 100
Water quality 1,477 4.18 48 30 16 4 2 100
Safety and security 1,476 4.16 44 33 19 2 2 100
Lack of crowding 1,479 3.95 40 28 22 7 3 100
Cleanliness & maintenance of facilities 1,452 3.95 38 31 22 6 3 100
Weather conditions 1,537 3.95 40 28 23 7 3 100
Reasonable user fees 1,005 3.84 36 29 24 9 4 100
Encounters with other lake visitors 1,226 3.84 29 33 31 5 2 100
Water level of lake 1,393 3.59 26 27 31 11 5 100
Fishing quality 950 3.38 27 21 24 16 11 100
Friendliness & courtesy of park staff 1,359 4.29 50 33 15 1 1 100
Overall satisfaction with your visit 1,586 4.27 46 36 16 2 0 100 1 Data from the three lakes were combined due to the similarity of responses among the individual lakes. 2 Numerical scoring of computation of mean: 5: Excellent, 4: Very Good, 3: Good 2: Fair, 1: Poor.
Table 23. Satisfaction of recreation visitors by lake.
Rating of Experience
Bull Shoals Norfork Table Rock
Mean Rank Mean Rank Mean Rank
Natural beauty of the lake 4.6 1 4.5 1 4.5 1
Friendliness & courtesy of park staff 4.2 2 4.3 2 4.3 2
Water quality 4.2 3 4.3 3 4.1 5
Suitable facilities for my activities 4.2 4 4.1 4 4.3 4
Lack of crowding 4.2 5 3.8 9 3.9 8
Safety and security 4.1 6 4.0 5 4.3 3
Cleanliness & maintenance of facilities 3.9 7 3.8 8 4.0 6
Reasonable user fees 3.9 8 3.7 10 3.9 9
Weather conditions 3.9 9 3.9 6 4.0 7
Encounters with other lake visitors 3.9 10 3.8 7 3.8 10
Water level of lake 3.6 11 3.5 11 3.6 11
Fishing quality 3.3 12 3.4 12 3.4 12
Overall satisfaction with your visit 4.3 4.2 4.3
ERDC/EL TR-10-18 46
One way to assess visitor-perceived management needs is to examine the level of agreement between importance and satisfaction scores for the same or similar rating features. This was done separately for campers, boaters, and fishers using the 10 features respondents rated both for importance and satisfaction. Natural beauty of the area was the highest rated satisfaction feature of all three user groups. It also tended to be among the most impor-tant. Water quality was also rated high in both importance and satisfaction among all three user groups. Generally, mean importance and satisfaction scores tracked together for most attributes, with those attributes rated low-est in importance also scoring lowest in satisfaction and those rated med-ium or highest in importance also scoring higher satisfaction (Figure 5). Small inconsistencies between importance and satisfaction scores were evident for two attributes. In one, all three user groups rated cleanliness and maintenance of recreation facilities highly important and slightly below average in satisfaction. In the other, campers rated lack of crowding slightly above average in importance and slightly below average in satisfaction. Among fishers, a larger disparity was evident for quality of fishing. Fishers rated quality of fishing their second-most important attribute and the one with which they were least satisfied.
Visitor-Perceived Trends
Visitors were given the opportunity to describe up to three trends they have observed in the years they have been visiting the lake and to assess the impact of each observed trend as having a positive, negative, or neutral effect on their recreation experience. This question produced approxi-mately 1400 total comments that were summarized by lake and subject matter using a key-word-based content analysis.
Many different trends were noted by visitors, some having a predominately positive and others a predominately negative effect on recreation exper-ience. Some of the most frequently mentioned trends noted by respondents involved improvements in the parks that generally produced a positive im-pact on visitor recreation experience (Table 24). Respondents at all of the lakes noted improvements in restrooms, campgrounds, launch ramps, and park facilities and maintenance generally. Respondents from Bull Shoals and Norfork Lakes noted generally positive changes in park grounds and the lakeshore. Respondents from Norfork and Table Rock Lakes described improvements in roads and parking. Respondents for Table Rock Lake complimented the opening of Moonshine Beach and improvements in trails.

ERDC/EL TR-10-18 47
In general, visitors tended to notice facility improvements in the parks and the positive effect of facility improvements on their recreation experience.
Several trends negatively affecting recreation experience were also noted by respondents (Table 24). Deterioration in water quality and/or condition of the lake, an increase in perceived visitor crowding on the lake, more encounters with boats, larger and more powerful boats, adverse lake levels, and greater lake level fluctuations were among the most frequently mentioned negative trends at these lakes. At Table Rock Lake, the deterioration of water quality and increased crowding were the two most frequently noted trends on that lake. A concern expressed by a moderate number of respondents at Table Rock Lake was the increase in private development observable from the lake. Less frequently mentioned at all of the lakes were predominately negative trends associated with fees, park closures, and changes in regulations and policies.
Figure 5. Importance and satisfaction with park and lake attributes by boaters, fishers, and
campers.

ERD
C/EL TR-10-18
48
Table 24. Summary of trends identified by lake visitors.
Trend Issues
Bull Shoals Norfork Table Rock
No. Comments
Impact on Recreation Experience
No. Comments
Impact on Recreation Experience
No. Comments
Impact on Recreation Experience
Positive Negative Neutral Positive Negative Neutral Positive Negative Neutral
Park grounds / lakeshore 61 37 19 3 42 27 13 1 29 14 12 0
Lake condition / water quality 48 9 37 1 18 7 11 0 74 21 52 1
Lake level 48 13 27 6 28 6 19 2 19 4 9 5
Launch ramps / courtesy docks 48 37 8 2 43 30 13 0 22 16 4 1
Fishing 47 18 26 1 20 10 7 2 18 4 12 0
Park facilities / maintenance 26 15 9 1 16 11 4 1 29 20 7 0
Restrooms 26 22 4 0 25 21 3 1 18 15 2 0
Visitation levels/ crowding 25 2 20 3 25 1 22 1 55 5 46 2
Campground facilities 24 13 7 3 34 20 12 2 34 29 3 0
Marinas 23 16 3 3 6 4 2 0 10 7 2 1
Boating equipment 20 1 15 3 6 0 6 0 11 1 10 0
Roads / parking 20 7 9 3 13 13 0 0 22 19 1 1
Fees 15 1 12 2 10 2 8 0 6 0 5 1
Onsite/offsite amenities 14 8 5 1 4 3 1 0 6 4 1 1
Safety and security 12 6 6 0 3 0 3 0 11 8 3 0
Swimming beach 12 4 8 0 7 4 3 0 13 11 1 1
Park closures 11 1 9 1 13 2 11 0 9 0 8 0
Playground 8 8 0 0 1 1 0 0 2 1 1 0
Rangers / staff 7 6 0 0 3 3 0 0 5 3 2 0
Regulations / policies 7 0 7 0 4 1 3 0 3 2 0 1

ERD
C/EL TR-10-18
49
Trend Issues
Bull Shoals Norfork Table Rock
No. Comments
Impact on Recreation Experience
No. Comments
Impact on Recreation Experience
No. Comments
Impact on Recreation Experience
Positive Negative Neutral Positive Negative Neutral Positive Negative Neutral
Development 6 1 4 1 4 1 3 0 26 4 16 5
Access to lake or sites 4 2 2 0 16 11 4 1 12 9 2 1
Jet skiing 3 0 3 0 4 0 3 1 5 0 5 0
Private docks 3 0 3 0 5 1 4 0 3 1 0 2
Reservations 3 0 2 1 3 0 2 1 4 2 1 1
Signage 2 1 1 0 0 0 0 0 1 1 0 0
Trails 2 1 1 0 2 0 2 0 25 23 0 2
Dam / power generation 0 0 0 0 0 0 0 0 11 5 3 3
Miscellaneous 13 7 3 0 13 9 4 0 18 12 5 1
Total comments 538 368 501

ERDC/EL TR-10-18 50
Trends related to fishing or condition of the fishery resource were also noted at all of the lakes (Table 24). Changes in fishing were generally perceived as more positive than negative at Norfork Lake, and more negative than positive at Bull Shoals and Table Rock Lakes. Respondents identifying fishing trends were generally positive about the effect of the fish stocking program, but at Table Rock and Bull Shoals Lakes in partic-ular, were more negative than positive about fishing trends overall.
Visitors who noted lake or park trends were also asked to provide up to three suggestions for improving recreation opportunity on the lakes. Respondents provided nearly 1,000 suggestions that were categorized by lake and subject using key-word-based content analysis (Table 25). The top six to eight categories of suggestions accounted for about 50% of all suggestions, but differed somewhat by lake. Of more than 400 suggestions offered by respondents from Bull Shoals Lake, more favorable lake levels (14%), additional fishery or fish habitat management (9%), improvements to boat launch areas (7%), increased fish stocking (7%), campground improvements (6%), and park or lakeshore cleanup (5%) were suggested most often. At Norfork Lake, 275 suggestions included improvements at campgrounds (12%), boat launch areas (10%), and restrooms and showers (9%); more favorable lake levels (8%); and additional fishery or fish habitat management (5%). At Table Rock Lake, about 50% of approx-imately 300 suggestions were for additional regulation of boats (8%), improvements in boat launch areas (8%), better park cleanup or mainte-nance (8%), improvements in campgrounds (6%), more environmental or park regulation or enforcement, (listed as miscellaneous regulation or enforcement, 5%), additional or extended trails (5%), and improved water quality (5%).
Trip spending
Total trip spending for individual recreation parties varied widely and was affected by party size, length of stay at the lake, and other factors. Mean trip spending within 30 miles of a lake by day-use visitors was $30 for local visitor parties and $40 for non-local visitor parties (Table 26). Trip spending by overnight parties within 30 miles of a lake varied from $279 per trip for campers to $670 per trip for parties using motel lodging during the trip. Lake visitors on pass-through visits spent an average of $117 per trip within 30 miles of the lake. Trip spending by non-local visitors was similar at Norfork and Table Rock Lakes, but was lower at Bull Shoals Lake for each of the non-local visitor segments (Table 26).
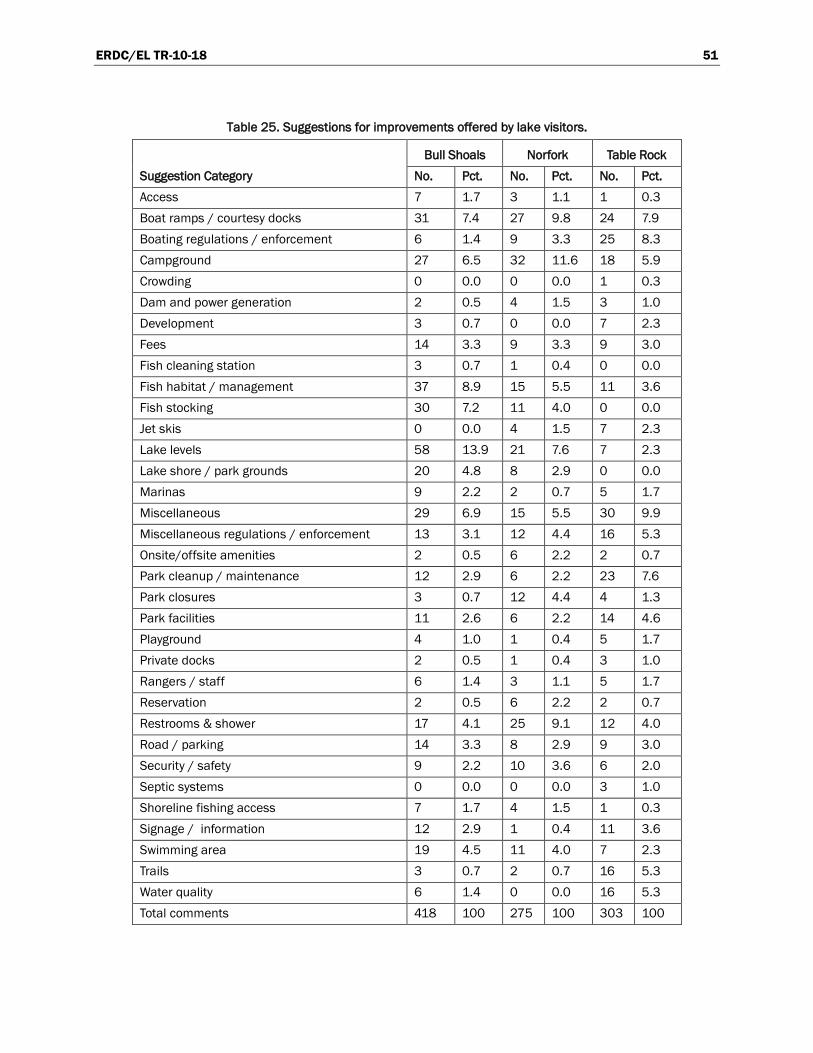
ERDC/EL TR-10-18 51
Table 25. Suggestions for improvements offered by lake visitors.
Suggestion Category Bull Shoals Norfork Table Rock
No. Pct. No. Pct. No. Pct. Access 7 1.7 3 1.1 1 0.3 Boat ramps / courtesy docks 31 7.4 27 9.8 24 7.9 Boating regulations / enforcement 6 1.4 9 3.3 25 8.3 Campground 27 6.5 32 11.6 18 5.9 Crowding 0 0.0 0 0.0 1 0.3 Dam and power generation 2 0.5 4 1.5 3 1.0 Development 3 0.7 0 0.0 7 2.3 Fees 14 3.3 9 3.3 9 3.0 Fish cleaning station 3 0.7 1 0.4 0 0.0 Fish habitat / management 37 8.9 15 5.5 11 3.6 Fish stocking 30 7.2 11 4.0 0 0.0 Jet skis 0 0.0 4 1.5 7 2.3 Lake levels 58 13.9 21 7.6 7 2.3 Lake shore / park grounds 20 4.8 8 2.9 0 0.0 Marinas 9 2.2 2 0.7 5 1.7 Miscellaneous 29 6.9 15 5.5 30 9.9 Miscellaneous regulations / enforcement 13 3.1 12 4.4 16 5.3 Onsite/offsite amenities 2 0.5 6 2.2 2 0.7 Park cleanup / maintenance 12 2.9 6 2.2 23 7.6 Park closures 3 0.7 12 4.4 4 1.3 Park facilities 11 2.6 6 2.2 14 4.6 Playground 4 1.0 1 0.4 5 1.7 Private docks 2 0.5 1 0.4 3 1.0 Rangers / staff 6 1.4 3 1.1 5 1.7 Reservation 2 0.5 6 2.2 2 0.7 Restrooms & shower 17 4.1 25 9.1 12 4.0 Road / parking 14 3.3 8 2.9 9 3.0 Security / safety 9 2.2 10 3.6 6 2.0 Septic systems 0 0.0 0 0.0 3 1.0 Shoreline fishing access 7 1.7 4 1.5 1 0.3 Signage / information 12 2.9 1 0.4 11 3.6 Swimming area 19 4.5 11 4.0 7 2.3 Trails 3 0.7 2 0.7 16 5.3 Water quality 6 1.4 0 0.0 16 5.3 Total comments 418 100 275 100 303 100

ERDC/EL TR-10-18 52
Table 26. Mean trip spending by visitor segment
Trip Characteristics
Non-Local Visitor Segments Local Visitor Segments
Total Day Trips
Pass Thru Motel Camp
Other OVN
Day Trip
Over- night
Nights within 30 miles Bull Shoals - - 3.29 2.44 3.14 - 2.7 1.35 Norfork - - 2.72 2.84 2.76 - 2.31 1.39 Table Rock - - 3.27 2.53 4.2 - 2.37 2.13 Total - - 3.21 2.63 3.58 - 2.44 1.74
Spending party size Bull Shoals 2.19 2.06 2.16 2.85 2.94 2.05 3.17 2.41 Norfork 2.34 2.87 3.97 3.24 3.34 2.07 3.18 2.76 Table Rock 2.38 2.57 2.86 3.51 3.22 2.41 3.13 2.87 Total 2.34 2.47 2.90 3.31 3.19 2.17 3.16 2.73
Spending within 30 miles ($ per party per trip) Bull Shoals 17 36 468 159 178 32 282 109 Norfork 44 184 754 291 311 23 299 144 Table Rock 47 146 691 309 412 40 284 297 Total 40 117 670 279 335 30 289 202
Approximately 90% of day-trip spending within 30 miles of a lake was for gas and oil, groceries, restaurants and bars, boat expenses, and sporting goods, with the largest portion (30-35%) spent on gas and oil. Parties on overnight trips spent considerably more in all of these categories than parties on day trips, and in addition, many had lodging expenses for hotels or camping (Table 27).
Trip spending differed between lakes in some spending categories. Some of these differences are no doubt affected by the highly variable nature of spending combined with the small sample sizes associated with some visitor segments. One consistent difference between the lakes was spending on attractions by non-local visitors. At Table Rock Lake, with its proximity to the entertainment destination of Branson, Missouri, attractions was a major spending category, with spending on attractions averaging $108 for motel users, $53 for campers, and $92 for other overnight visitors (Table 28). These amounts are 3 -10 times higher than mean trip spending on local attractions by the same visitor segments at Norfork Lake (Table 29) and 10-50 times greater than spending on attractions by the same visitor segments at Bull Shoals Lake (Table 30).

ERDC/EL TR-10-18 53
Total trip spending by overnight visitors typically increased with increasing length of trip. Normalizing the expenditures of overnight trips produces mean trip spending of $16 per night for campers, $74 per night for motel users, $16 per night for campers, and $0 per night for other categories of overnight visitors (Table 31). Per- night spending for gas and oil, groceries, boat expenses, sporting goods, and smaller spending items was similar for most overnight visitor segments. However, mean lodging expenses varied greatly, from none for other overnight visitors staying with friends or family in the area, to approximately $75 per night for parties using motel lodging.
Table 27. Mean trip spending by visitor segment combining data from all lakes.
Spending Category
Non-local Visitors Local Visitors
Total Day Trips Pass Thru Motel Camp
Other OVN Day trips
Over night
Spending within 30 miles Hotel 0.00 0.00 238.70 11.02 0.00 0.00 41.99 38.43 Camping 0.00 0.00 1.83 43.16 0.00 0.00 13.87 6.51 Restaurants and bars 6.78 28.43 122.82 43.87 85.35 4.87 47.10 37.71 Groceries 4.03 30.00 50.43 53.98 62.74 5.61 71.89 28.39 Gas and oil 12.22 25.23 62.96 53.65 69.13 10.59 56.02 32.61 Other auto 0.25 0.13 3.65 5.47 2.18 0.16 2.62 1.68 Other boat 7.05 11.47 24.20 9.21 18.94 1.95 11.48 9.18 Attractions 0.40 4.19 87.11 30.30 50.38 0.92 8.97 21.88 Sporting goods 6.13 6.05 16.75 9.44 10.81 4.27 21.51 8.89 Other 3.58 11.04 61.50 18.56 34.99 1.81 13.44 16.68 Total within 30 miles 40.44 116.53 669.95 278.65 334.53 30.18 288.88 201.96
Spending beyond 30 miles Hotel 0.00 81.98 18.47 0.80 37.41 0.00 11.09 8.50 Camping 0.00 6.63 0.05 6.10 0.00 0.00 0.97 0.93 Restaurants and bars 1.84 36.36 23.51 9.86 30.67 0.10 8.56 8.98 Groceries 2.77 11.98 6.77 17.68 16.53 0.26 13.28 6.35 Gas and oil 0.02 0.08 2.17 1.08 0.21 0.01 0.50 0.51 Other auto 10.61 39.74 34.62 39.45 26.92 0.30 16.98 15.79 Other boat 0.44 3.75 0.54 2.49 0.64 0.07 1.76 0.73 Attractions 0.28 14.85 6.30 4.80 4.83 0.07 1.71 2.38 Sporting goods 2.95 4.82 4.90 5.82 18.39 0.68 1.74 4.02 Other 0.56 22.58 34.09 3.91 2.87 0.02 1.71 6.20 Total beyond 30 miles 19.48 222.76 131.43 92.00 138.48 1.51 58.30 54.38 N 226 39 282 178 150 728 122 1,725
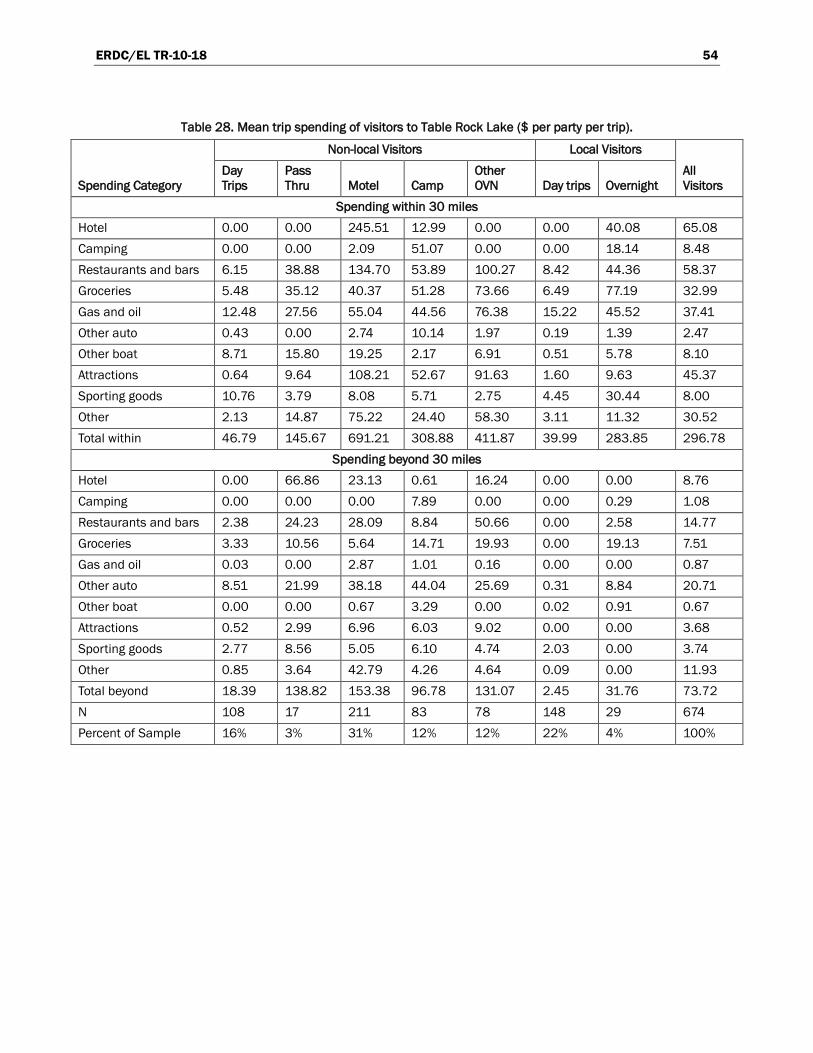
ERDC/EL TR-10-18 54
Table 28. Mean trip spending of visitors to Table Rock Lake ($ per party per trip).
Spending Category
Non-local Visitors Local Visitors All Visitors
Day Trips
Pass Thru Motel Camp
Other OVN Day trips Overnight
Spending within 30 miles Hotel 0.00 0.00 245.51 12.99 0.00 0.00 40.08 65.08 Camping 0.00 0.00 2.09 51.07 0.00 0.00 18.14 8.48 Restaurants and bars 6.15 38.88 134.70 53.89 100.27 8.42 44.36 58.37 Groceries 5.48 35.12 40.37 51.28 73.66 6.49 77.19 32.99 Gas and oil 12.48 27.56 55.04 44.56 76.38 15.22 45.52 37.41 Other auto 0.43 0.00 2.74 10.14 1.97 0.19 1.39 2.47 Other boat 8.71 15.80 19.25 2.17 6.91 0.51 5.78 8.10 Attractions 0.64 9.64 108.21 52.67 91.63 1.60 9.63 45.37 Sporting goods 10.76 3.79 8.08 5.71 2.75 4.45 30.44 8.00 Other 2.13 14.87 75.22 24.40 58.30 3.11 11.32 30.52 Total within 46.79 145.67 691.21 308.88 411.87 39.99 283.85 296.78
Spending beyond 30 miles Hotel 0.00 66.86 23.13 0.61 16.24 0.00 0.00 8.76 Camping 0.00 0.00 0.00 7.89 0.00 0.00 0.29 1.08 Restaurants and bars 2.38 24.23 28.09 8.84 50.66 0.00 2.58 14.77 Groceries 3.33 10.56 5.64 14.71 19.93 0.00 19.13 7.51 Gas and oil 0.03 0.00 2.87 1.01 0.16 0.00 0.00 0.87 Other auto 8.51 21.99 38.18 44.04 25.69 0.31 8.84 20.71 Other boat 0.00 0.00 0.67 3.29 0.00 0.02 0.91 0.67 Attractions 0.52 2.99 6.96 6.03 9.02 0.00 0.00 3.68 Sporting goods 2.77 8.56 5.05 6.10 4.74 2.03 0.00 3.74 Other 0.85 3.64 42.79 4.26 4.64 0.09 0.00 11.93 Total beyond 18.39 138.82 153.38 96.78 131.07 2.45 31.76 73.72 N 108 17 211 83 78 148 29 674 Percent of Sample 16% 3% 31% 12% 12% 22% 4% 100%

ERDC/EL TR-10-18 55
Table 29. Mean trip spending of visitors to Norfork Lake ($ per party per trip).
Spending Category
Non-local Visitors Local Visitors All Visitors
Day Trips
Pass Thru Motel Camp Other OVN
Day trips Overnight
Spending Within 30 miles Hotel 0.00 0.00 242.61 13.25 0.00 0.00 50.30 18.15 Camp 0.00 0.00 0.00 37.96 0.00 0.00 9.25 5.72 Restaurants and Bars 8.76 40.63 99.32 37.12 87.89 2.60 44.11 23.10 Groceries 2.77 54.88 121.76 69.98 60.81 3.66 74.63 29.13 Gas and oil 15.27 36.92 101.05 70.58 68.90 9.16 60.16 31.68 Other auto 0.07 0.52 1.64 1.07 3.90 0.14 2.95 0.86 Other boat 8.29 13.12 59.53 16.31 41.29 1.32 13.84 11.22 Attractions 0.00 0.87 39.63 10.75 8.94 0.72 12.38 5.50 Sporting goods 0.79 16.25 63.88 17.40 28.79 4.79 19.17 12.08 Other 7.81 20.59 24.39 16.33 10.39 0.25 12.01 Total within
6.48 43.78 183.79 753.81 290.76 310.91 22.65 298.80 143.91
Spending beyond 30 miles Hotel 0.00 2.62 3.40 0.00 104.86 0.00 20.38 9.82 Camp 0.00 0.87 0.00 2.09 0.00 0.00 1.60 0.42 Restaurants and Bars 0.72 0.00 9.00 9.76 3.39 0.05 5.56 2.56 Groceries 2.71 0.00 10.67 18.54 9.87 0.00 10.11 4.87 Gas and oil 0.00 0.00 0.00 0.00 0.07 0.03 1.19 0.12 Other auto 11.01 13.30 20.66 31.97 13.57 0.06 19.33 9.39 Other boat 1.37 0.00 0.00 0.00 0.56 0.12 3.84 0.60 Attractions 0.00 0.00 3.37 4.67 0.00 0.00 2.24 0.97 Sporting goods 4.71 0.00 0.00 4.32 1.68 0.00 3.52 1.55 Other 0.00 0.00 0.29 0.58 0.93 0.00 0.96 Total beyond
0.24 20.52 16.80 47.38 71.93 134.93 0.26 68.72 30.56
N 50 7 19 49 23 209 35 392 Percent of Sample 13% 2% 5% 13% 6% 53% 9% 100%

ERDC/EL TR-10-18 56
Table 30. Mean trip spending by visitors to Bull Shoals Lake ($ per party per trip).
Spending Category
Non-local Visitors Local Visitors
All Visitors
Day Trips
Pass Thru Motel Camp
Other OVN
Day trips Overnight
Spending within 30 miles Hotel 0.00 0.00 194.80 0.00 0.00 0.00 33.18 17.97 Camping 0.00 0.00 1.97 30.71 0.00 0.00 14.85 3.99 Restaurants and bars 5.64 7.74 73.72 28.45 46.36 4.89 54.44 20.27 Groceries 1.79 6.96 45.39 26.35 38.90 7.57 61.74 18.92 Gas and oil 6.91 14.49 75.38 43.33 52.02 8.48 63.34 25.11 Other auto 0.00 0.00 10.88 1.13 0.58 0.15 3.67 1.39 Other boat 0.47 5.22 21.59 14.72 20.26 4.08 15.32 8.31 Attractions 0.32 0.00 5.02 6.00 2.45 0.62 3.59 1.77 Sporting goods 0.93 1.74 25.45 2.97 7.98 3.39 13.70 6.06 Other 1.38 0.00 13.79 5.77 9.36 2.84 17.94 5.61 Total within 30 miles 17.44 36.14 468.00 159.44 177.91 32.03 281.76 109.39
Spending beyond 30 miles Hotel 0.00 154.08 4.47 3.21 4.99 0.00 12.22 6.19 Camping 0.00 18.39 0.40 9.68 0.00 0.00 0.95 1.38 Restaurants and bars 1.98 75.55 9.53 13.22 16.34 0.25 19.91 7.35 Groceries 1.28 21.84 9.97 24.78 16.57 0.85 10.37 6.28 Gas and oil 0.04 0.21 0.00 3.70 0.52 0.00 0.21 0.37 Other auto 16.01 78.77 26.20 42.23 46.36 0.63 23.78 15.73 Other boat 0.32 10.75 0.20 5.66 2.26 0.04 0.00 1.00 Attractions 0.00 39.00 5.07 1.36 0.75 0.22 3.07 1.98 Sporting goods 0.84 3.68 8.44 8.30 71.84 0.43 1.51 7.97 Other 0.55 60.39 13.18 10.32 1.03 0.00 4.79 4.02 Total beyond 30 miles 21.01 462.67 77.45 122.46 160.66 2.42 76.81 52.29 N 68 15 52 46 49 371 58 659 Percent of Sample 10% 2% 8% 7% 7% 56% 9% 100%
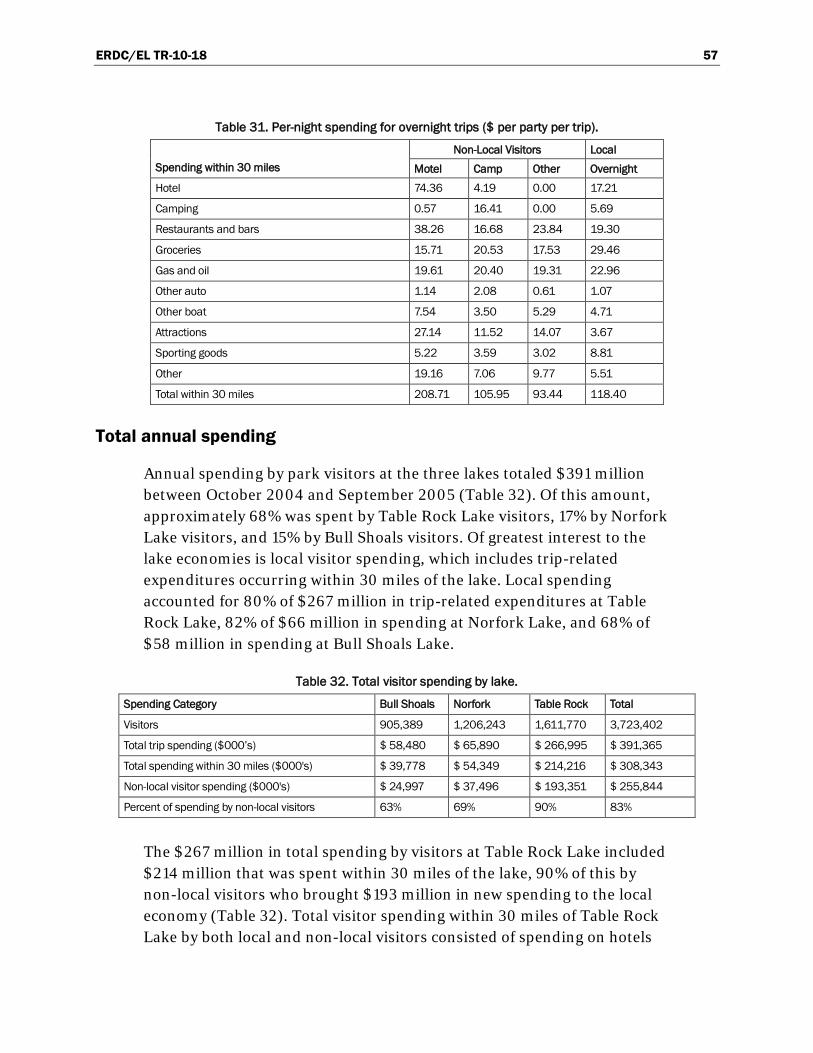
ERDC/EL TR-10-18 57
Table 31. Per-night spending for overnight trips ($ per party per trip).
Spending within 30 miles Non-Local Visitors Local
Motel Camp Other
Overnight Hotel 74.36 4.19 0.00 17.21
Camping 0.57 16.41 0.00 5.69
Restaurants and bars 38.26 16.68 23.84 19.30
Groceries 15.71 20.53 17.53 29.46
Gas and oil 19.61 20.40 19.31 22.96
Other auto 1.14 2.08 0.61 1.07
Other boat 7.54 3.50 5.29 4.71
Attractions 27.14 11.52 14.07 3.67
Sporting goods 5.22 3.59 3.02 8.81
Other 19.16 7.06 9.77 5.51
Total within 30 miles 208.71 105.95 93.44 118.40
Total annual spending
Annual spending by park visitors at the three lakes totaled $391 million between October 2004 and September 2005 (Table 32). Of this amount, approximately 68% was spent by Table Rock Lake visitors, 17% by Norfork Lake visitors, and 15% by Bull Shoals visitors. Of greatest interest to the lake economies is local visitor spending, which includes trip-related expenditures occurring within 30 miles of the lake. Local spending accounted for 80% of $267 million in trip-related expenditures at Table Rock Lake, 82% of $66 million in spending at Norfork Lake, and 68% of $58 million in spending at Bull Shoals Lake.
Table 32. Total visitor spending by lake.
Spending Category Bull Shoals Norfork Table Rock Total
Visitors 905,389 1,206,243 1,611,770 3,723,402
Total trip spending ($000’s) $ 58,480 $ 65,890 $ 266,995 $ 391,365
Total spending within 30 miles ($000's) $ 39,778 $ 54,349 $ 214,216 $ 308,343
Non-local visitor spending ($000's) $ 24,997 $ 37,496 $ 193,351 $ 255,844
Percent of spending by non-local visitors 63% 69% 90% 83%
The $267 million in total spending by visitors at Table Rock Lake included $214 million that was spent within 30 miles of the lake, 90% of this by non-local visitors who brought $193 million in new spending to the local economy (Table 32). Total visitor spending within 30 miles of Table Rock Lake by both local and non-local visitors consisted of spending on hotels

ERDC/EL TR-10-18 58
(23%), restaurants and bars (20%), attractions (15%), gas and oil (13%), groceries (11%), and several other spending categories (19%) (Table 33).
The $66 million in total spending by Norfork Lake visitors included $54 million that was spent locally ( ≤30 miles of the lake). Sixty-nine percent ($37 million) of this was new money brought in to the local economy by non-local visitors. The total spending occurring within 30 miles of Norfork Lake consisted of spending on gas and oil (23%), groceries (20%), restau-rants and bars (16%), hotels (11%), sporting goods (9%), boating expenses (8%), and several other spending categories (13%) (Table 34).
Table 33. Total spending by visitors to Table Rock Lake ($000's).
Spending Category
Non-local Visitors Local Visitors
Total Day Trips Pass Thru Motel Camp Other OVN Day trips Overnight
Spending within 30 miles
Hotel 0 0 45,563 1,064 0 0 1,668 48,294
Camp 0 0 388 4,182 0 0 755 5,325
Restaurants and bars 962 550 24,999 4,413 7,400 1,907 1,846 42,076
Groceries 858 496 7,493 4,199 5,436 1,469 3,211 23,163
Gas and oil 1,953 390 10,215 3,650 5,637 3,447 1,894 27,185
Other auto 68 0 508 830 146 43 58 1,652
Other boat 1,362 223 3,572 178 510 117 240 6,202
Attractions 101 136 20,083 4,313 6,762 362 400 32,158
Sporting goods 1,684 54 1,500 468 203 1,007 1,267 6,182
Other 334 210 13,959 1,998 4,302 704 471 21,978
Total within 7,322 2,059 128,279 25,295 30,395 9,055 11,809 214,216
Spending beyond 30 miles
Hotel 0 945 4,293 50 1,198 0 0 6,487
Camp 0 0 0 646 0 0 12 658
Restaurants and bars 372 342 5,214 724 3,739 0 107 10,498
Groceries 522 149 1,047 1,205 1,471 1 796 5,190
Gas and oil 4 0 532 83 12 0 0 631
Other auto 1,332 311 7,085 3,607 1,896 69 368 14,667
Other boat 0 0 125 269 0 5 38 437
Attractions 81 42 1,292 494 665 0 0 2,574
Sporting goods 434 121 937 499 350 459 0 2,800
Other 134 52 7,940 349 342 20 0 8,837
Total beyond 2,878 1,963 28,465 7,926 9,673 554 1,321 52,779
Grand total 10,200 4,022 156,744 33,221 40,068 9,609 13,131 266,995

ERDC/EL TR-10-18 59
Table 34. Total spending by visitors Norfork Lake ($000's).
Spending Category
Non-local Visitors Local Visitors
Total Day Trips
Pass Thru Motel Camp
Other OVN Day trips Overnight
Spending within 30 miles Hotel 0 0 3,662 639 0 0 1,666 5,967 Camping 0 0 0 1,831 0 0 306 2,138 Restaurants and bars 539 220 1,499 1,791 2,376 799 1,461 8,685 Groceries 171 297 1,838 3,377 1,643 1,124 2,472 10,921 Gas and oil 940 200 1,525 3,405 1,862 2,813 1,993 12,738 Other auto 4 3 25 52 105 44 98 331 Other boat 510 71 898 787 1,116 407 458 4,247 Attractions 0 5 598 519 241 220 410 1,993 Sporting goods 49 88 964 840 778 1,471 635 4,824 Other 481 111 368 788 281 77 398 2,504 Total within 2,694 995 11,377 14,028 8,403 6,956 9,896 54,349
Spending beyond 30 miles Hotel 0 14 51 0 2,834 0 675 3,575 Camping 0 5 0 101 0 0 53 158 Restaurants and bars 44 0 136 471 92 16 184 943 Groceries 167 0 161 894 267 0 335 1,823 Gas and oil 0 0 0 0 2 8 39 49 Other auto 678 72 312 1,543 367 19 640 3,630 Other boat 84 0 0 0 15 36 127 263 Attractions 0 0 51 225 0 0 74 350 Sporting goods 289 0 0 209 45 0 116 660 Other 0 0 4 28 25 0 32 89 Total beyond 1,263 91 715 3,470 3,647 79 2,276 11,541 Grand total 3,956 1,086 12,092 17,498 12,050 7,035 12,173 65,890
The $58 million in total visitor spending by Bull Shoals Lake visitors included $40 million spent within 30 miles of the lake, 63% of this by non-local visitors bringing $25 million in new money into the local economy. Total visitor spending within 30 miles of Bull Shoals Lake included expenditures for gas and oil (23%), restaurants and bars (18%), hotels (18%), groceries (17 percent), boating expenses (8%), sporting goods (6%), and several other spending categories (10%) (Table 35).

ERDC/EL TR-10-18 60
Table 35. Total spending by visitors to Bull Shoals Lake ($000's).
Spending Category
Non-local Visitors Local Visitors
Total Day Trips
Pass Thru Motel Camp
Other OVN
Day trips
Over- night
Spending within 30 miles Hotel 0 0 6,259 0 0 0 862 7,122 Camping 0 0 63 788 0 0 386 1,238 Restaurants and bars 262 89 2,369 730 1,209 1,139 1,415 7,213 Groceries 83 80 1,459 676 1,015 1,763 1,605 6,680 Gas and oil 321 167 2,422 1,112 1,357 1,975 1,646 9,000 Other auto 0 0 350 29 15 35 95 524 Other boat 22 60 694 378 528 951 398 3,031 Attractions 15 0 161 154 64 144 93 631 Sporting goods 43 20 818 76 208 789 356 2,311 Other 64 0 443 148 244 661 466 2,027 Total within 30 miles 809 417 15,038 4,092 4,640 7,457 7,324 39,778
Spending beyond 30 miles Hotel 0 1,780 144 82 130 0 318 2,453 Camping 0 212 13 249 0 0 25 499 Restaurants and bars 92 873 306 339 426 59 518 2,613 Groceries 59 252 320 636 432 197 269 2,166 Gas and oil 2 2 0 95 14 1 5 119 Other auto 743 910 842 1,084 1,209 147 618 5,552 Other boat 15 124 6 145 59 9 0 359 Attractions 0 450 163 35 20 50 80 798 Sporting goods 39 43 271 213 1,874 101 39 2,580 Other 25 697 423 265 27 0 125 1,563 Total beyond 30 miles 975 5,344 2,489 3,143 4,190 564 1,997 18,702 Grand total 1,784 5,761 17,527 7,236 8,830 8,022 9,321 58,480
Local economic significance and impacts of visitor spending
Local spending by all lake visitors creates local economic significance in the form of jobs, labor income, and value added with the local economy. The total local spending of $308 million by 3.7 million visitors to the three lakes had a local economic significance consisting of approximately 5,000 jobs, $116 million in labor income, and $186 million in value added to the economies of the three lakes (Table 36). Of these amounts, the $256 million was spent locally by non-local visitors, creating approximately 4,300 jobs, $101 million in labor income, and $162 million in value added. The latter amounts describe the local economic impacts resulting from the money

ERDC/EL TR-10-18 61
brought into the local economy by non-local visitors. The local economic impacts are 86-87% of the local economic significance.
Table Rock Lake had the largest economic significance of the three lakes, accounting for 3,645 jobs, $88 million in labor income, and $142 million in value added. Local spending by non-local visitors accounted for 90% of the total economic significance. This spending produced an economic impact of 3,346 jobs, $81 million in labor
Table 36. Local economic significance and effects, by lake.
Effect Bull Shoals Norfork Table Rock Total Local Economic Significance1
Direct Effects Sales ($000's) 25302 31063 163053 219419 Jobs 460 602 2788 3850 Labor Income ($000's) 9183 10886 59531 79600 Value Added ($000's) 13389 15988 88058 117435
Total Effects Sales ($000's) 34931 41111 233286 309328 Jobs 573 733 3645 4950 Labor Income ($000's) 13126 14528 87916 115571 Value Added ($000's) 20525 22503 142493 185521
Local Economic Impact2 Direct Effects
Sales ($000's) 17229 22328 149749 189306 Jobs 319 424 2564 3308 Labor Income ($000's) 6343 7720 55066 69129 Value Added ($000's) 9478 11500 82697 103675
Total Effects Sales ($000's) 23727 29455 213282 266464 Jobs 396 518 3346 4260 Labor Income ($000's) 9076 10333 81095 100503 Value Added ($000's) 14261 16096 131705 162062
Visitor Spending Sales Multiplier 1.38 1.32 1.42 1.41 1 Includes spending of local visitors. 2 Excludes spending of local visitors.

ERDC/EL TR-10-18 62
income, and $132 million in value added in the area extending 30 miles from the lake (Table 36). The region benefiting from this economic impact approximately corresponds to Benton, Boon, Carroll, and Marion Counties in Arkansas and Barry, Christian, Stone, and Taney Counties in Missouri.
The direct effects of the $214 million in local spending at Table Rock Lake was approximately $163 million in retail sales, 2,788 jobs, $60 million in labor income, and $90 million in value added (Table 36). These are the impacts accruing to businesses that sell goods and services directly to visitors. The direct effects primarily benefited eating and drinking establishments (1,060 jobs), lodging (971 jobs), recreation and entertainment (336 jobs), and retail sales (a total of 290 jobs) (Table 37). Every $1 in direct sales generated another $0.42 in secondary sales due to indirect and induced effects. This produced an additional $70 million in retail sales, 857 jobs, $28 million in labor income, and $54 million in value added. The retail sales multiplier for Table Rock Lake (1.42) was the largest of the three lakes (Table 36).
With fewer visitors, lower spending per visitor, and a smaller sales multi-plier, the economic significance of spending by Norfork Lake visitors was 16-22% that of Table Rock Lake visitors (Table 36). The $54 million in local spending by Norfork Lake visitors produced 733 jobs, $15 million in labor income, and $23 million in value added to the 30-mile area surrounding the lake. This area is approximately composed of Baxter, Fulton, Isard, and Marion counties in Arkansas and Stone and Ozark Counties in Missouri. The total economic significance of spending in this region included the impacts of non-local visitors, whose $37-million contribution to local visitor spending (69% of total local spending) produced 518 jobs, $10 million in labor income, and $16 million in value added.
The direct effects of local spending at Norfork Lake were approximately 602 jobs, $11 million in income, and $16 million in value added (Table 36). The direct effects were primarily in eating and drinking establishments (214 jobs), lodging (155 jobs), and retail sales (162 jobs) (Table 38). The retail sales multiplier of 1.32 indicates that another $0.32 in secondary sales were generated for every $1 spent locally by visitors, producing an additional 131 jobs, $3.6 million in labor income, and $6.5 million in value added (Table 36).
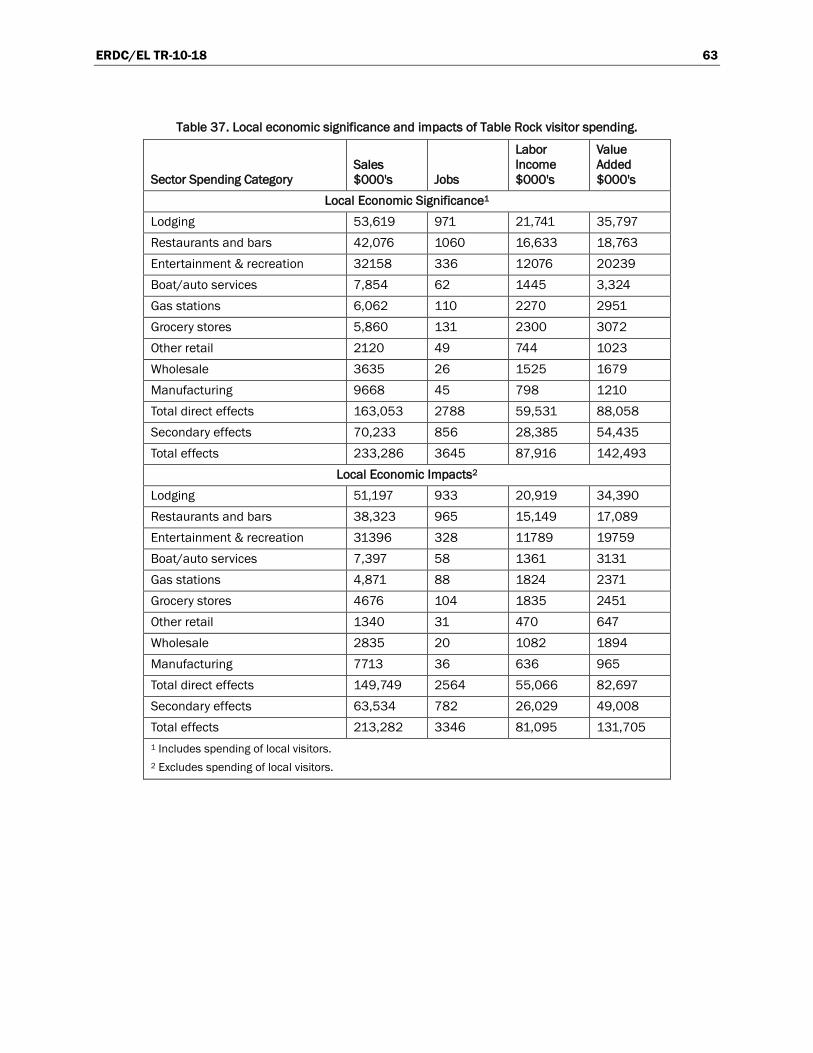
ERDC/EL TR-10-18 63
Table 37. Local economic significance and impacts of Table Rock visitor spending.
Sector Spending Category Sales $000's Jobs
Labor Income $000's
Value Added $000's
Local Economic Significance1 Lodging 53,619 971 21,741 35,797 Restaurants and bars 42,076 1060 16,633 18,763 Entertainment & recreation 32158 336 12076 20239 Boat/auto services 7,854 62 1445 3,324 Gas stations 6,062 110 2270 2951 Grocery stores 5,860 131 2300 3072 Other retail 2120 49 744 1023 Wholesale 3635 26 1525 1679 Manufacturing 9668 45 798 1210 Total direct effects 163,053 2788 59,531 88,058 Secondary effects 70,233 856 28,385 54,435 Total effects 233,286 3645 87,916 142,493
Local Economic Impacts2 Lodging 51,197 933 20,919 34,390 Restaurants and bars 38,323 965 15,149 17,089 Entertainment & recreation 31396 328 11789 19759 Boat/auto services 7,397 58 1361 3131 Gas stations 4,871 88 1824 2371 Grocery stores 4676 104 1835 2451 Other retail 1340 31 470 647 Wholesale 2835 20 1082 1894 Manufacturing 7713 36 636 965 Total direct effects 149,749 2564 55,066 82,697 Secondary effects 63,534 782 26,029 49,008 Total effects 213,282 3346 81,095 131,705 1 Includes spending of local visitors. 2 Excludes spending of local visitors.
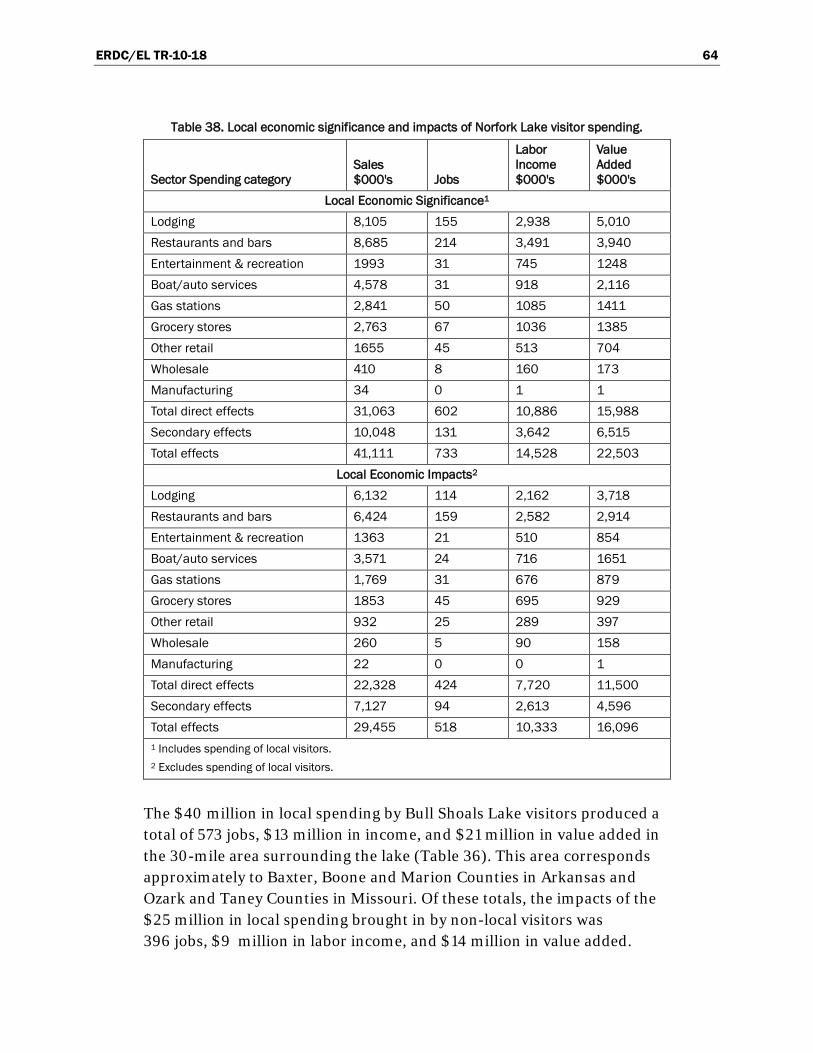
ERDC/EL TR-10-18 64
Table 38. Local economic significance and impacts of Norfork Lake visitor spending.
Sector Spending category Sales $000's Jobs
Labor Income $000's
Value Added $000's
Local Economic Significance1 Lodging 8,105 155 2,938 5,010 Restaurants and bars 8,685 214 3,491 3,940 Entertainment & recreation 1993 31 745 1248 Boat/auto services 4,578 31 918 2,116 Gas stations 2,841 50 1085 1411 Grocery stores 2,763 67 1036 1385 Other retail 1655 45 513 704 Wholesale 410 8 160 173 Manufacturing 34 0 1 1 Total direct effects 31,063 602 10,886 15,988 Secondary effects 10,048 131 3,642 6,515 Total effects 41,111 733 14,528 22,503
Local Economic Impacts2 Lodging 6,132 114 2,162 3,718 Restaurants and bars 6,424 159 2,582 2,914 Entertainment & recreation 1363 21 510 854 Boat/auto services 3,571 24 716 1651 Gas stations 1,769 31 676 879 Grocery stores 1853 45 695 929 Other retail 932 25 289 397 Wholesale 260 5 90 158 Manufacturing 22 0 0 1 Total direct effects 22,328 424 7,720 11,500 Secondary effects 7,127 94 2,613 4,596 Total effects 29,455 518 10,333 16,096 1 Includes spending of local visitors. 2 Excludes spending of local visitors.
The $40 million in local spending by Bull Shoals Lake visitors produced a total of 573 jobs, $13 million in income, and $21 million in value added in the 30-mile area surrounding the lake (Table 36). This area corresponds approximately to Baxter, Boone and Marion Counties in Arkansas and Ozark and Taney Counties in Missouri. Of these totals, the impacts of the $25 million in local spending brought in by non-local visitors was 396 jobs, $9 million in labor income, and $14 million in value added.

ERDC/EL TR-10-18 65
The direct effects of local spending at Bull Shoals Lake included about 460 jobs, $9 million in labor income and $13 million in value added. These were primarily in eating and drinking establishments (178 jobs), lodging (155 jobs), and retail sales (92 jobs) (Table 39). The retail sales multiplier of 1.38 indicated that another $0.38 in retail sales is generated for every $1 in local visitor sales. This produced an additional 113 jobs, $4 million in labor income, and $7 million in value added.
Table 39. Local economic significance and impacts of Bull Shoals visitor spending.
Sector Spending category Sales $000's Jobs
Labor Income $000's
Value Added $000's
Local Economic Significance1 Lodging 8,359 155 3,246 5,375 Restaurants and bars 7,213 178 2,904 3,275 Entertainment & recreation 631 5 239 401 Boat/auto services 3,556 23 729 1,679 Gas stations 2,007 36 759 987 Grocery stores 1,690 37 674 901 Other retail 793 19 277 380 Wholesale 696 8 355 391 Manufacturing 357 0 0 0 Total direct effects 25,302 460 9,183 13,389 Secondary effects 9,628 113 3,943 7,136 Total effects 34,931 573 13,126 20,525
Local Economic Impacts2 Lodging 7,111 134 2,826 4,661 Restaurants and bars 4,659 115 1,876 2,116 Entertainment & recreation 394 3 149 250 Boat/auto services 2,076 13 426 980 Gas stations 1,200 21 454 590 Grocery stores 838 18 334 447 Other retail 400 9 139 192 Wholesale 375 5 139 242 Manufacturing 177 0 0 0 Total direct effects 17,229 319 6,343 9,478 Secondary effects 6,498 76 2,733 4,783 Total effects 23,727 396 9,076 14,261 1 Includes spending of local visitors. 2 Excludes spending of local visitors.

ERDC/EL TR-10-18 66
Combining spending data for the three lakes produced $391 million in total visitor spending, of which 79 percent occurred within 30 miles of one of the lakes. The direct economic significance of local spending on the combined economies of Arkansas and Missouri was estimated to be 3,850 jobs, $80 million in labor income, and $117 million in value added (Table 36). These occurred primarily in eating and drinking establish-ments (1,770), lodging (1,379 jobs), retail sales (587 jobs), and entertain-ment and recreation (488 jobs) (Table 40). A retail sales multiplier of 1.59 for the two-state region indicated that $0.59 in additional sales was generated within the two states for every $1 spent by visitors. Total effects, including secondary effects, were 6,641 jobs, $158 million in labor income, and $292 million in value added.
Table 40. Economic impacts of visitor spending on two-state region.
Sector Spending category Sales $000's Jobs
Labor Income $000's
Value Added $000's
Lodging 83,913 1,379 33,591 55,547 Restaurants and Bars 72,028 1,770 29,096 32,815 Entertainment & recreation 38,505 488 14,341 24,037 Boat/auto services 40,896 288 8,040 18,466 Gas stations 11,088 189 4,312 5,603 Grocery stores 12,636 250 5,264 7,029 Other retail 6,639 148 2,410 3,315 Wholesale 10,324 73 3,940 6,896 Manufacturing 26,721 90 3,040 4,583 Total direct effects 302,751 4,675 104,034 158,291 Secondary effects 178,582 1,966 79,413 133,367 Total effects 481,334 6,641 183,447 291,658

ERDC/EL TR-10-18 67
5 Discussion
Comparison of lakes
A total of 4.2 million park visits occurred during the 1-year period of study, including 2.1 million at Table Rock (1.6 million excluding the Port of Lights holiday tour), 1.2 million at Norfork Lake, and 0.9 million at Bull Shoals Lake. Spending associated with 3.7 million of these visits produced a local economic significance totaling 4,950 jobs, $116 million in labor income, and $186 million in value added. About 83 percent of these amounts represent economic impacts arising from local spending by visitors who do not live in the area. Measured in terms of jobs, the local economic impacts were 92 percent of the local economic significance associated with visitor spending at Table Rock Lake, 71 percent at Norfork Lake, and 69 percent at Bull Shoals Lake. These impacts indicate that the recreation economies of all the lakes are heavily dependent on non-local visitors.
While all three of the lakes occurred in a primarily rural setting and offered many of the same types of recreation facilities and amenities, differences in their proximity to major highways, towns and small cities, and tourist attractions likely influenced the numbers and types of visitors each lake received. Of the three lakes, Norfork Lake was the most rural. Bull Shoals Lake, though less than 10 miles from Norfolk Lake at their closest point, had a greater number of towns and recreation amenities located near the lake. Table Rock had a still greater level of development near its shores, plus the tourist destination city of Branson, MO and a multi-lane U.S. highway capable of bringing large numbers of potential lake visitors within 2-5 miles of the lakeshore.
Park visitors were most similar at Norfork and Bull Shoals Lakes. At these lakes, recreation trips comprised about two-thirds of local visits ( ≤30 miles) and one-third of non-local (>30 miles) visits. For most visits, the lake was the primary trip destination and recreation at the lake the primary purpose of the trip. Sightseeing and wildlife viewing (42-43 percent) , boating (23-25 percent), swimming (21-25 percent), and fishing (18-22 percent) were the most popular activities of visitors to these lakes, with wildlife viewing and sightseeing (39-42 percent), fishing (16 percent), or boating

ERDC/EL TR-10-18 68
(12 percent) considered the primary activity by more than two-thirds of visitors. Visitors comprised a mix of youngsters, adults, and seniors, with seniors being more prevalent during the non-peak (Oct-March) recreation season at these lakes.
The greater availability of small towns and visitor amenities near Bull Shoals Lake was reflected in the higher per-visitor spending at Bull Shoals Lake than at Norfork Lake. Much of this was due to greater spending by Bull Shoals visitors for hotel lodging and attractions. The greater hotel spending is explained by two statistics. One is the greater percentage of overnight trips taken to Bull Shoals Lake (27%) than Norfork Lake (19%). The other is the greater percentage of overnight trips involving a stay somewhere other than at a recreation area on the lake, about two-thirds of overnight trips to Bull Shoals Lake and about half of overnight trips to Norfork Lake.
Visitor composition was quite different at Table Rock Lake, where 38 percent of recreation trips to the lake were made by local (≤30 miles) visitors and 62 percent were made by non-local (>30 miles) visitors, the reverse of what was observed at Bull Shoals and Norfork Lakes. The non-local visitors to Table Rock Lake also consisted of many more visits by people passing through the area or on trips for which the lake was not their primary destination.
The proximity of Table Rock Lake to the interstate highway system and the entertainment and resort destination of Branson, Missouri no doubt contributed to the higher percentage of non-local visitors as well as the larger number of visitors engaged in trips for which the primary desti-nation was not the lake. This is apparent in visitor spending, which was highest in the categories of hotel lodging (22%), eating and drinking establishments (20%), and attractions (15%). It appears that many Table Rock Lake visitors purchased services and entertainment available near Branson, and conversely, some visitors to Branson included side visits to Table Rock Lake during their trip.
Fewer than 17% of visitors were very familiar with Corps of Engineer lakes in the region, apart from the one where they were surveyed. Most visitors, including those who were frequent lake visitors, appeared to use only one lake. For one third to one half of visitors, their choice was determined by proximity of the lake to their home. Another 18% of visitors at Bull Shoals
ERDC/EL TR-10-18 69
Lake and 6% at Table Rock and Norfork Lakes indicated they came to the lake because it was less crowded than others available to them. While the survey did not specifically address crowding at the lakes, narrative responses from Table Rock Lake visitors to other survey questions indi-cated a trend toward increased crowding on that lake and noted its negative impact on recreation there. These responses suggest that those Table Rock visitors who were most affected by crowding may have been attracted to what they perceived to be the less crowded conditions at nearby Bull Shoals Lake.
Visitor feedback for managers
Determining where to place scarce management resources is a challenge facing all of the agencies managing recreation and associated parks and natural resources in the upper White River Basin. The survey examined which park and lake attributes were most important to park visitors and their level of satisfaction. Responses indicated that the natural environ-ment, particularly water quality and the natural beauty of the area, were most important to visitors, and on average, visitors were satisfied with them. The results were similar for all of the lakes.
While visitors gave high satisfaction ratings to water quality and natural beauty of the area, in response to another question they also noted trends in these resources that suggest emerging concerns. Deteriorating water quality was the most often described concern noted by Table Rock and Bull Shoals visitors. Also, Table Rock visitors noted the increasing development visible around that lake and its negative effect on their recreation experience. While the development is taking place on private property, often well beyond the lakeshore, it appears to be adversely affecting the recreation experience of visitors able to observe this develop-ment from the lake or lakeshore parks.
Importance and satisfaction were congruent for most lake and park attri-butes, suggesting that the relative amount of effort being directly or indirectly placed on managing the measured lake and park features is generally appropriate. But, if there were any single feature that might benefit from additional management effort, the importance-satisfaction results suggest it would probably be facility cleanliness and maintenance. Nowhere was this more evident than in the unsolicited comments to open-ended questions in which visitors noted and expressed appreciation for the new facilities that have been constructed at some of the parks in recent
ERDC/EL TR-10-18 70
years to replace older, existing infrastructure. Overall, the ranking of attributes by importance and satisfaction was surprisingly similar and congruent for different user groups, with one major exception. Fishers not surprisingly rated quality of fishing as one of their two most important lake attributes (behind water quality), but were less satisfied with the quality of fishing than most other lake and park attributes. This seems to be a common result of importance-satisfaction surveys of fishers, many of whom appear to base their satisfaction with fishing on the number of consumable fish they catch (Finn and Loomis 2001, Arlinghaus 2006). So these results probably say more about the high expectations of fishers, than about the condition of fishery of these lakes.
ERDC/EL TR-10-18 71
References Arlinghaus, R. 2006. On the apparently striking disconnect between motivation and
satisfaction in recreational fishing: The case of catch orientation of German anglers. North American Journal of Fisheries Management 26:529-605.
Finn, K. L., and D. K Loomis. 2001. The importance of catch motives to recreation anglers: The effects of catch satiation and deprivation. Human Dimensions of Wildlife 6:173-187.
Minnesota IMPLAN Group. 2000. IMPLAN professional software, analysis and data guide. 2nd ed. Stillwater, MN: Minnesota IMPLAN Group, Inc.
SAS Institute Inc. SAS Online Documentation 9.1.3. Cary, NC: SAS Institute Inc., 2000-2004. http://support.sas.com/onlinedoc/913/docMainpage.jsp (Accessed 09 September 2008).
U.S. Army Corps of Engineers. 2008. Recreation Economic Assessment System. http://corpslakes.usace.army.mil/employees/economic/reas.html (accessed 09 September 2008).

ERDC/EL TR-10-18 72
Appendix A. Recreation Survey
Mail survey used in the study. The example shown is formatted for use at Table Rock Lake.
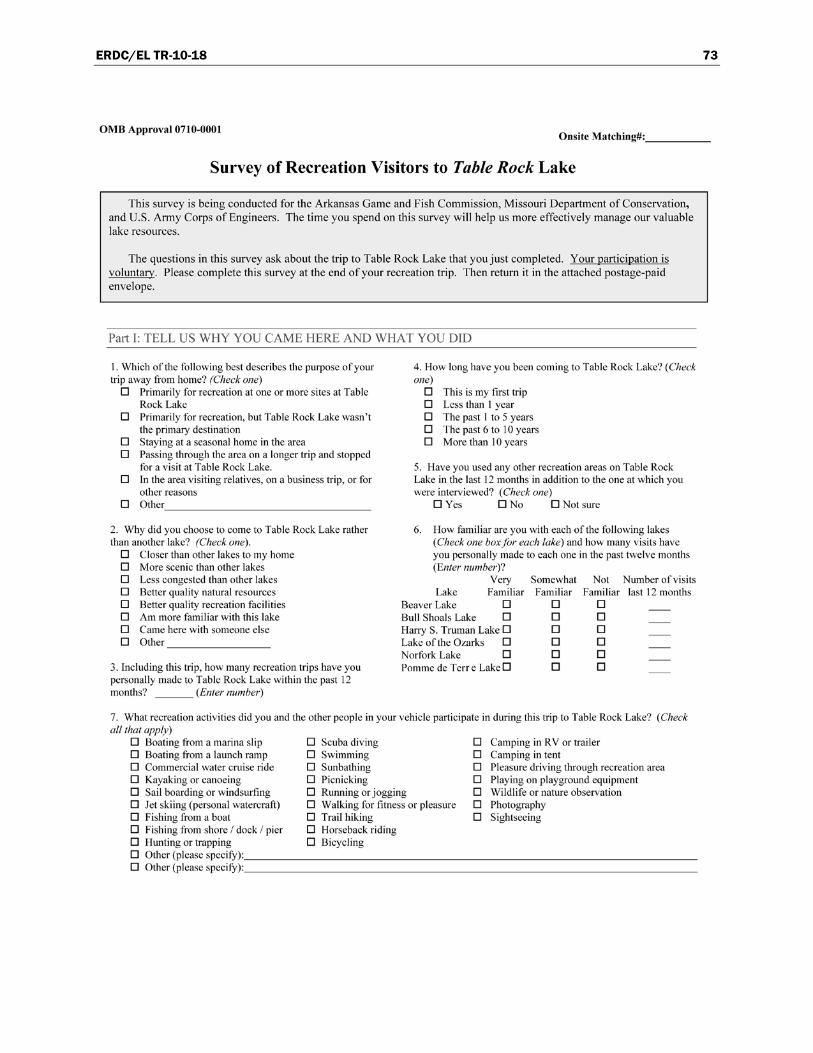
ERDC/EL TR-10-18 73

ERDC/EL TR-10-18 74

ERDC/EL TR-10-18 75

ERDC/EL TR-10-18 76

ERDC/EL TR-10-18 77

REPORT DOCUMENTATION PAGE Form Approved
OMB No. 0704-0188 Public reporting burden for this collection of information is estimated to average 1 hour per response, including the time for reviewing instructions, searching existing data sources, gathering and maintaining the data needed, and completing and reviewing this collection of information. Send comments regarding this burden estimate or any other aspect of this collection of information, including suggestions for reducing this burden to Department of Defense, Washington Headquarters Services, Directorate for Information Operations and Reports (0704-0188), 1215 Jefferson Davis Highway, Suite 1204, Arlington, VA 22202-4302. Respondents should be aware that notwithstanding any other provision of law, no person shall be subject to any penalty for failing to comply with a collection of information if it does not display a currently valid OMB control number. PLEASE DO NOT RETURN YOUR FORM TO THE ABOVE ADDRESS.
1. REPORT DATE (DD-MM-YYYY) November 2010
2. REPORT TYPE Final Report
3. DATES COVERED (From - To)
4. TITLE AND SUBTITLE
Characterization of Park Visitors, Visitation Levels, and Associated Economic Impacts of Recreation at Bull Shoals, Norfork, and Table Rock Lakes
5a. CONTRACT NUMBER
5b. GRANT NUMBER
5c. PROGRAM ELEMENT NUMBER
6. AUTHOR(S)
Richard Kasul, Daniel Stynes, Lichu Lee, Wen-Huei Chang, R. Scott Jackson, Christine Wibowo, Sam Franco, and Kathleen Perales
5d. PROJECT NUMBER
5e. TASK NUMBER
5f. WORK UNIT NUMBER
7. PERFORMING ORGANIZATION NAME(S) AND ADDRESS(ES) 8. PERFORMING ORGANIZATION REPORT NUMBER
U.S. Army Engineer Research and Development Center 3909 Halls Ferry Road Vicksburg, MS 39180-6199; Michigan State University East Lansing, MI 48824-1222
ERDC/EL TR-10-18
9. SPONSORING / MONITORING AGENCY NAME(S) AND ADDRESS(ES) 10. SPONSOR/MONITOR’S ACRONYM(S) U.S. Army Corps of Engineers Washington, DC 20314-1000
11. SPONSOR/MONITOR’S REPORT NUMBER(S)
12. DISTRIBUTION / AVAILABILITY STATEMENT Approved for public release; distribution is unlimited.
13. SUPPLEMENTARY NOTES
14. ABSTRACT Planning for future needs of recreation visitors presents many challenges at federal lakes that have a mix of public (federal, state, and local) and private recreation providers, and where ongoing regional growth and other trends are influencing visitor number and activities. Under these circumstances, a periodic assessment of lake recreation is often used to document current recreational patterns and identify ongoing and emerging trends that could or should influence recreation planning and investment decisions. This study provides a broadly scoped examination of park-based recreation at Bull Shoals, Norfork, and Table Rock Lakes, so that present and emerging recreation needs can be included in the broader planning efforts for the upper White River watershed of Arkansas and Missouri. This study was based on survey data collected from recreation visitors and other current data collected by lake managers as part of their visitor monitoring programs. This report provides estimates of annual visitor use levels, profiles of visitor spending, and the economic impact of visitor spending on the region surrounding the lakes. The report also examines visitor recreation patterns, visitor perceptions of lake and park attributes that affect the recreational experience, and visitor-perceived trends on the lakes and in the parks, and the impact of these trends on the park visitors who recreate on these lakes.
15. SUBJECT TERMS Bull Shoals Lake Economic impact
Norfork Lake Recreation planning Recreation visitors
Table Rock Lake Visitation levels
16. SECURITY CLASSIFICATION OF: 17. LIMITATION OF ABSTRACT
18. NUMBER OF PAGES
19a. NAME OF RESPONSIBLE PERSON:
a. REPORT
UNCLASSIFIED
b. ABSTRACT
UNCLASSIFIED
c. THIS PAGE
UNCLASSIFIED 86 19b. TELEPHONE NUMBER (include area code)
Standard Form 298 (Rev. 8-98) Prescribed by ANSI Std. 239.18