erdc/chl tr-14-3 'vertical ship motion study for ambrose
TRANSCRIPT

ERD
C/CH
L TR
-14-
3
Vertical Ship Motion Study for Ambrose Entrance Channel, New York
Coas
tal a
nd H
ydra
ulic
s La
bora
tory
Michael J. Briggs, Zeki Demirbilek, and Lihwa Lin May 2014
Approved for public release; distribution is unlimited.

The US Army Engineer Research and Development Center (ERDC) solves the nation’s toughest engineering and environmental challenges. ERDC develops innovative solutions in civil and military engineering, geospatial sciences, water resources, and environmental sciences for the Army, the Department of Defense, civilian agencies, and our nation’s public good. Find out more at www.erdc.usace.army.mil.
To search for other technical reports published by ERDC, visit the ERDC online library at http://acwc.sdp.sirsi.net/client/default.
ERDC/CHL TR-14-3 May 2014
Vertical Ship Motion Study for Ambrose Entrance Channel, New York
Michael J. Briggs, Zeki Demirbilek, and Lihwa Lin Coastal and Hydraulics Laboratory US Army Engineer Research and Development Center 3909 Halls Ferry Road Vicksburg, MS 39180-6199
Final report Approved for public release; distribution is unlimited.
Prepared for Commander, US Army Engineer District, New York (CENAN-EN-H)
Under Unit 108976-NY & NJ Harbor (50’) NY&NJ
Monitored by US Army Engineer Research and Development Center 3909 Halls Ferry Road, Vicksburg, MS 39180-6199

ERDC/CHL TR-14-3 ii
Abstract
New York Harbor Pilots have expressed a concern to the New York District (NAN) about a mound that is approximately 1.5 miles seaward of the new limit of the Ambrose Channel. This mound is probably construction rubble that was placed there when the original Light Tower isolated and protected it somewhat from the main channel. The mound’s diameter and depth are similar to the width and depth of the Ambrose Channel offshore reach. Now that the Light Tower is no longer marking this mound, the Pilots are concerned about whether a ship might experience larger or more dramatic ship motions due to possible amplification across the mound relative to similar transits in the offshore reach. The US Army Engineer Research and Development Center (ERDC), Coastal and Hydraulics Laboratory (CHL), used the numerical models STWAVE and CMS-Wave to evaluate possible amplification effects of a range of wave conditions. The Channel Analysis and Design Evaluation Tool (CADET) was used to predict vertical ship motions due to wave-induced heave, pitch, and roll. Ship squat estimates calculated with the PIANC and Ankudinov empirical formulas were compared with the Beck, Newman, Tuck (BNT) squat predictions used in CADET. The net underkeel clearance based on these vertical ship motion components was used in a risk-based method of evaluating transits over the mound compared to similar transits in the main channel. These results were used to select a minimum dredge depth over the mound to insure that inadvertent transits over the mound would not incur any significant differences in ship response and potential grounding relative to similar transits in the offshore reach of the Ambrose Channel.
DISCLAIMER: The contents of this report are not to be used for advertising, publication, or promotional purposes. Citation of trade names does not constitute an official endorsement or approval of the use of such commercial products. All product names and trademarks cited are the property of their respective owners. The findings of this report are not to be construed as an official Department of the Army position unless so designated by other authorized documents. DESTROY THIS REPORT WHEN NO LONGER NEEDED. DO NOT RETURN IT TO THE ORIGINATOR.
ERDC/CHL TR-14-3 iii
Contents Abstract .......................................................................................................................................................... ii
Figures and Tables ........................................................................................................................................ vi
Preface ........................................................................................................................................................... ix
Unit Conversion Factors ...............................................................................................................................x
1 Introduction ............................................................................................................................................ 1 Background .............................................................................................................................. 1 Design ship ............................................................................................................................... 3 Purpose ..................................................................................................................................... 3 Study approach ........................................................................................................................ 4 Report organization .................................................................................................................. 6
2 CADET Numerical Model ..................................................................................................................... 7 Background .............................................................................................................................. 7 Dynamic or Net UKC calculation .............................................................................................. 8 Uncertainty and risk analysis ................................................................................................ 11 CADET organization ................................................................................................................ 12
Ship module................................................................................................................................ 12 Project module ........................................................................................................................... 17 Empirical directional wave spectrum ........................................................................................ 20
3 Numerical Wave Models .................................................................................................................... 23 STWAVE ................................................................................................................................... 23
Model description....................................................................................................................... 23 Capabilities and assumptions ................................................................................................... 24
CMS-Wave ............................................................................................................................... 25 Model description....................................................................................................................... 25 Capability and features .............................................................................................................. 26
Governing equations .............................................................................................................. 26 Model setup and parameters ................................................................................................ 27
Summary .................................................................................................................................... 29
4 Ship Squat Theory ............................................................................................................................... 31 PIANC squat formulas ............................................................................................................ 31 Ankudinov squat formula ....................................................................................................... 31 CADET sinkage and trim ........................................................................................................ 32
5 Waves .................................................................................................................................................... 35 Phase 1 waves ........................................................................................................................ 35
Deepwater hindcast waves........................................................................................................ 35

ERDC/CHL TR-14-3 iv
Joint probability distributions .................................................................................................... 37 Directional wave spectra ........................................................................................................... 39
Phase 2 waves ........................................................................................................................ 40 Preliminary STWAVE and CMS-Wave comparisons .................................................................. 40 Final STWAVE and CMS-Wave comparisons ............................................................................. 41 Directional wave spectra ........................................................................................................... 42 Summary .................................................................................................................................... 44
6 Ship Squat Results .............................................................................................................................. 45 Light-loaded ship .................................................................................................................... 45
Entrance channel transit ........................................................................................................... 45 Mound transit ............................................................................................................................. 47 Comparison of transits ............................................................................................................... 50
Fully loaded ship ..................................................................................................................... 53 Entrance channel transit ........................................................................................................... 53 Mound transit ............................................................................................................................. 55 Comparison of transits ............................................................................................................... 58
Summary ................................................................................................................................ 58
7 Ship Motions and Underkeel Clearance ......................................................................................... 62 Maximum ship displacements ............................................................................................... 62
Light-loaded ship ........................................................................................................................ 63 Fully loaded ship ........................................................................................................................ 64
Phase 1 waves – fully loaded ship ........................................................................................ 66 Typical and extreme examples .................................................................................................. 66 Average and maximum statistics .............................................................................................. 69
Phase 2 waves ........................................................................................................................ 72 Light-loaded ship ........................................................................................................................ 73 Fully loaded ship ........................................................................................................................ 75
Summary ................................................................................................................................ 78
8 Summary and Conclusions ............................................................................................................... 82
References ................................................................................................................................................... 88
Appendix A: CMS-Wave Numerical Model Capabilities for Navigation Projects ........................... 95
Appendix B: WIS126 Tp vs. Hs Percent Occurrence Tables for Each Direction Band in Phase 1 Waves ................................................................................................................................. 109
Appendix C: Phase 1 and Phase 2 Wave Climatology in the Ambrose Channel Reaches ........ 117
Appendix D: Wave-induced Vertical Motion Allowances (ft) for Phase 1, Reach 1 Channel (h = 53 ft) and Reach 2 Mound (h = 55 ft), Fully loaded (T = 47.5 ft) Susan Maersk ............................................................................................................................................... 131
Appendix E: Net UKC for Phase 1, Reach 1 Channel (h = 53 ft) and Reach 2 Mound (h = 55 ft), Fully loaded (T = 47.5 ft) Susan Maersk ....................................................................... 159

ERDC/CHL TR-14-3 v
Appendix F: Wave-induced Vertical Motion Allowances (ft) for Phase 2, Reach 1 Channel (h = 53 ft) and Reach 2 Mound (h = 55 ft), Lightly (T = 46.0 ft) and Fully loaded (T = 47.5 ft) Susan Maersk ............................................................................................... 187
Appendix G: Net UKC for Phase 2, Reach 1 Channel (h = 53 ft) and Reach 2 Mound (h = 55 ft), Lightly (T = 46.0 ft) and Fully loaded (T = 47.5 ft) Susan Maersk ........................... 195
Report Documentation Page
ERDC/CHL TR-14-3 vi
Figures and Tables
Figures
Figure 1. Project study area of Ambrose Channel, New York, showing offshore reach and mound (see “This is problematic” caption). ............................................................................................... 1 Figure 2. Susan Maersk design ship for Ambrose Channel. .................................................................... 4 Figure 3. Cross-section of a ship in a channel. .......................................................................................... 9 Figure 4. Wave transformation modeling domain for Ambrose Channel and mound (a) Google image and (b) STWAVE and CMS-Wave grid. ............................................................................... 28 Figure 5. Mound reach bathymetry. .......................................................................................................... 29 Figure 6. BNT channel geometry variables. .............................................................................................. 33 Figure 7. Locations of WIS126 WIS station and ALSN6 Ambrose Light Station in study area. ............. 35 Figure 8. WIS126 percent occurrence histogram of wave direction, period, and height, 1980 to 1999. .............................................................................................................................................. 36 Figure 9. WIS126 wave roses for 1980 to 1999 (a) wave height and (b) peak wave period. ........... 38 Figure 10. Ship squat for light-loaded (T = 46 ft) Susan Maersk containership during channel transit for Ankudinov, CADET, Barrass, Eryuzlu, Huuska, Römisch, and Yoshimura predictions (a) no tide (h = 53 ft) and (b) high tide (h = 58 ft). ............................................................. 46 Figure 11. Ship squat for light-loaded (T = 46 ft) Susan Maersk containership during mound transit for Ankudinov, CADET, Barrass, Eryuzlu, Huuska, Römisch, and Yoshimura predictions (a) no tide (h = 55 ft) and (b) high tide (h = 60 ft). ............................................................. 48 Figure 12. Ship squat differences for mound vs. channel transits with Susan Maersk containership (T = 46.0 ft) (a) no tide predictions, (b) +5 ft tide advantage predictions. ................. 51 Figure 13. Ship squat for fully loaded (T = 47.5 ft) Susan Maersk containership during channel transit for Ankudinov, CADET, Barrass, Eryuzlu, Huuska, Römisch, and Yoshimura predictions (a) no tide (h = 53 ft) and (b) high tide (h = 58 ft). ............................................................. 54 Figure 14. Ship squat for fully loaded (T = 47.5 ft) Susan Maersk containership during mound transit for Ankudinov, CADET, Barrass, Eryuzlu, Huuska, Römisch, and Yoshimura predictions (a) no tide (h = 55 ft) and (b) high tide (h = 60 ft). ............................................................. 56 Figure 15. Ship squat differences for mound vs. channel transits with Susan Maersk containership (T = 47.5 ft) (a) no tide predictions, (b) +5 ft tide advantage predictions. .................. 59 Figure B1. WIS126 Tp vs. Hs percent occurrence table for direction band centered at θp =67.5 deg (a) percent and (b) number of observations. ..................................................................... 110 Figure B2. WIS126 Tp vs. Hs percent occurrence table for direction band centered at θp =90 deg (a) percent and (b) number of observations. ........................................................................ 111 Figure B3. WIS126 Tp vs. Hs percent occurrence table for direction band centered at θp =112.5 deg (a) percent and (b) number of observations. ................................................................... 112 Figure B4. WIS126 Tp vs. Hs percent occurrence table for direction band centered at θp =135 deg (a) percent and (b) number of observations. ...................................................................... 113 Figure B5. WIS126 Tp vs. Hs percent occurrence table for direction band centered at θp =157.5 deg (a) percent and (b) number of observations. ................................................................... 114 Figure B6. WIS126 Tp vs. Hs percent occurrence table for direction band centered at θp =180 deg (a) percent and (b) number of observations. ...................................................................... 115
ERDC/CHL TR-14-3 vii
Figure B7. WIS126 Tp vs. Hs percent occurrence table for direction band centered at θp =202.5 deg (a) percent and (b) number of observations. .................................................................. 116
Tables
Table 1. Susan Maersk containership parameters. .................................................................................. 4 Table 2. Input and derived parameters for Susan Maersk containership, CADET ship module. .......................................................................................................................................................... 13 Table 3. Ambrose Channel parameters. ................................................................................................... 18 Table 4. TMA spectral peakedness γ and directional spreading n parameters. ................................. 22 Table 5. Summary of half-plane and full-plane features ........................................................................ 24 Table 6. Wave climate information. ............................................................................................................ 36 Table 7. Band limits on wave direction. ..................................................................................................... 39 Table 8. Subset of 10 preliminary wave cases, Phase 2. ....................................................................... 41 Table 9. Final set of 21 numerical model wave cases, Phase 2. ........................................................... 42 Table 10. Wave cases in Phase 2. ............................................................................................................. 43 Table 11. Ship squat predictions for light-loaded Susan Maersk in Ambrose Channel. .................... 47 Table 12. Ship squat predictions for light-loaded Susan Maersk during mound transit. .................. 49 Table 13. Effect of tides on squat differences (SDif) and ratios (SR) for mound and channel transits for light-loaded Susan Maersk containership. ........................................................................... 52 Table 14. Ship squat predictions for fully loaded Susan Maersk during channel transit. ................. 55 Table 15. Ship squat predictions for fully loaded Susan Maersk during mound transit. ................... 57 Table 16. Effect of tides on squat differences (SDif) and ratios (SR) for mound and channel transits for fully loaded Susan Maersk containership. ........................................................................... 60 Table 17. Maximum ship displacements DMax for light-loaded ship. ...................................................... 63 Table 18. Maximum ship displacements DMax for fully loaded ship. ..................................................... 65 Table 19. Maximum vertical motion allowance AMax (ft), Phase 1, fully loaded ship. ......................... 67 Table 20. Net underkeel clearance UKCNet (ft), Phase 1, fully loaded ship. ......................................... 69 Table 21. Vertical motion allowance statistics AMax (ft), Phase 1, fully loaded ship. ........................... 70 Table 22. Net underkeel clearance UKCNet statistics (ft), Phase 1, fully loaded ship. ........................ 72 Table 23. Wave motion allowances AMax (ft), Phase 2, light-loaded ship, 12 kt inbound transits. .......................................................................................................................................................... 74 Table 24. Net underkeel clearance UKCNet (ft), Phase 2, light-loaded ship, 12 kt inbound transits. .......................................................................................................................................................... 76 Table 25. Wave motion allowances AMax (ft), Phase 2, fully loaded ship, 12 kt inbound transits. .......................................................................................................................................................... 77 Table 26. Net underkeel clearance UKCNet (ft), Phase 2, fully loaded ship, 12 kt inbound transits. .......................................................................................................................................................... 79 Table C1. Wave climatology in Ambrose Channel, Phase 1, Channel Reach 1. ................................117 Table C2. Wave climatology in Ambrose Mound, Phase 1, Mound Reach 2. ................................... 123 Table C3. Wave climatology in Ambrose Channel, Phase 2, Channel Reach 1. ............................... 129 Table C4. Wave climatology in Ambrose Mound, Phase 2, Mound Reach 2. ................................... 130
ERDC/CHL TR-14-3 viii
Table D1. Wave-induced vertical motion allowances (ft), Phase 1, Channel Reach 1, h = 53 ft, fully loaded Susan Maersk, inbound and outbound transits. .................................................. 131 Table D2. Wave-induced vertical motion allowances (ft), Phase 1, Mound Reach 2, h = 55 ft, fully loaded Susan Maersk, inbound and outbound transits. ........................................................ 138 Table D3. Wave-induced vertical motion allowances (ft), Phase 1, Channel Reach 1, h = 58 ft, fully loaded Susan Maersk, inbound and outbound transits. .................................................. 145 Table D4. Wave-induced vertical motion allowances (ft), Phase 1, Mound Reach 2, h=60 ft, fully loaded Susan Maersk, inbound and outbound transits. ........................................................ 152 Table E1. Net UKC (ft), Phase 1, Channel Reach 1, h = 53 ft, fully loaded Susan Maersk, inbound and outbound transits............................................................................................................... 159 Table E2. Net UKC (ft), Phase 1, Mound Reach 2, h = 55 ft, fully loaded Susan Maersk, inbound and outbound transits............................................................................................................... 166 Table E3. Net UKC (ft), Phase 1, Channel Reach 1, h = 58 ft, fully loaded Susan Maersk, inbound and outbound transits............................................................................................................... 173 Table E4. Net UKC (ft), Phase 1, Mound Reach 2, h = 60 ft, fully loaded Susan Maersk, inbound and outbound transits............................................................................................................... 180 Table F1. Wave-induced vertical motion allowances (ft), Phase 2, Channel Reach 1, h = 53 ft, light-loaded Susan Maersk, inbound and outbound transits. .................................................. 187 Table F2. Wave-induced vertical motion allowances (ft), Phase 2, Mound Reach 2, h = 55, 56, and 57 ft, light-loaded Susan Maersk, inbound and outbound transits. ................................... 188 Table F3. Wave-induced vertical motion allowances (ft), Phase 2, Channel Reach 1, h = 53 ft, fully loaded Susan Maersk, inbound and outbound transits. .................................................. 191 Table F4. Wave-induced vertical motion allowances (ft), Phase 2, Mound Reach 2, h = 55, 56, and 57 ft, fully loaded Susan Maersk, inbound and outbound transits..................................... 192 Table G1. Net UKC (ft), Phase 2, Channel Reach 1, h = 53 ft, light-loaded Susan Maersk, inbound and outbound transits............................................................................................................... 195 Table G2. Net UKC (ft), Phase 2, Mound Reach 2, h = 55, 56, and 57 ft, light-loaded Susan Maersk, inbound and outbound transits. .................................................................................. 196 Table G3. Net UKC (ft), Phase 2, Channel Reach 1, h = 53 ft, fully loaded Susan Maersk, inbound and outbound transits............................................................................................................... 199 Table G4. Net UKC (ft), Phase 2, Mound Reach 2, h = 55, 56, and 57 ft, fully loaded Susan Maersk, inbound and outbound transits. .................................................................................. 200

ERDC/CHL TR-14-3 ix
Preface
This report describes numerical modeling procedures and results of a vertical ship motion study for the Ambrose Channel, New York. The study was performed in support of the New York Pilots’ request to investigate the possible effect of a “mound” located near the old Light Tower on wave amplification and ship response if a ship should inadvertently sail over it. The study was performed by the US Army Engineer Research and Development Center (ERDC), Coastal and Hydraulics Laboratory (CHL), for the US Army Engineer District, New York (NAN). The study was conducted during the period April 2010 through August 2011. Frank Santangelo, US Army Engineer District, New York, was the study manager and point of contact.
The investigation reported herein was conducted by Drs. Michael J. Briggs and Zeki Demirbilek of the Harbors, Entrances, and Structures Branch, CHL. The final report was written by Dr. Briggs with sections on the two wave models written by Drs. Lihwa Lin and Demirbilek. We gratefully acknowledge the support of Andrew Silver and Paul Kopp of the Naval Surface Warfare Center, Carderock Division, for discussion and review.
This study was performed under the general supervision of Dr. William Martin, Director, CHL. Direct supervision of this project was provided by Dr. Jackie Pettway, Chief, Harbors, Entrances, and Structures Branch. At the time of publication of this report, Dr. Jeffery P. Holland was Director of ERDC, and COL Jeffrey Eckstein, EN, was Commander and Executive Director.

ERDC/CHL TR-14-3 x
Unit Conversion Factors
Multiply By To Obtain
acres 4,046.873 square meters
cubic feet 0.02831685 cubic meters
cubic inches 1.6387064 E-05 cubic meters
cubic yards 0.7645549 cubic meters
degrees (angle) 0.01745329 radians
fathoms 1.8288 meters
feet 0.3048 meters
hectares 1.0 E+04 square meters
inches 0.0254 meters
knots 0.5144444 meters per second
miles (nautical) 1,852 meters
miles (US statute) 1,609.347 meters
miles per hour 0.44704 meters per second
pounds (force) per square foot 47.88026 pascals
pounds (force) per square inch 6.894757 kilopascals
pounds (mass) 0.45359237 kilograms
pounds (mass) per cubic foot 16.01846 kilograms per cubic meter
pounds (mass) per cubic inch 2.757990 E+04 kilograms per cubic meter
pounds (mass) per square foot 4.882428 kilograms per square meter
pounds (mass) per square yard 0.542492 kilograms per square meter
square feet 0.09290304 square meters
square inches 6.4516 E-04 square meters
square miles 2.589998 E+06 square meters
square yards 0.8361274 square meters
tons (force) 8,896.443 newtons
tons (force) per square foot 95.76052 kilopascals
tons (long) per cubic yard 1,328.939 kilograms per cubic meter
tons (2,000 pounds, mass) 907.1847 kilograms
tons (2,000 pounds, mass) per square foot 9,764.856 kilograms per square meter
yards 0.9144 meters

ERDC/CHL TR-14-3 1
1 Introduction
Background
New York Harbor Pilots have expressed a concern about a “high spot” mound that is about 1.5 miles seaward of the new limit of the Ambrose Channel (Figure 1). The end of the existing Ambrose Channel is at the “G1” and “R2” navigation markers. The existing Sea Buoy is just south of the mound, where the old Ambrose Light Tower was located. This mound is probably construction rubble (i.e., hard material) that was placed here when the Light Tower isolated and protected it somewhat from the main channel. The size is approximately 1,500 to 2,000 ft in diameter with a depth of 53 ft Mean Lower Low Water (MLLW). The mound’s diameter and depth are similar to the width and depth of the Ambrose Channel offshore reach. Now that the Tower is no longer marking this mound, the pilots are concerned about whether a ship might experience larger or more dramatic ship motions due to possible amplification across the mound, relative to channel transits.
Figure 1. Project study area of Ambrose Channel, New York, showing offshore reach and mound (see “This is problematic” caption).
The static or gross underkeel clearance (UKC) is defined as the clearance under the ship after subtracting the draft from the depth that includes
ERDC/CHL TR-14-3 2
project depth and tides. The UKC must be adjusted to account for the effects of ship squat and wave-induced vertical ship motions. The resulting net UKC (UKCNet) is considered a “safety factor” or “maneuvering margin” representing the adjusted clearance after subtracting squat and ship motions from the UKC. In a deterministic design, Corps guidelines recommend an UKCNet of 2 ft for soft-bottom and 4 ft for hard-bottom channels. However, in a risk-based or probabilistic design, it is possible to relax these requirements for UKCNet as sufficient maneuverability clearance is included in the predicted ship motion allowances.
Port designers have historically relied on deterministic channel design approaches with large safety factors. Risk-based models are now recommended to define a useful lifetime with an acceptable level of risk of accidents or groundings. CADET (Channel Analysis and Design Evaluation Tool) is a program to aid in determining the ‘optimum’ dredge depth for the offshore portions of entrance channels that are exposed to waves. This ‘optimum’ dredge depth is defined as the depth that provides the maximum accessibility for the minimum amount of dredging and is determined by predicting ship UKC for different wave, ship, and channel combinations. A probabilistic risk analysis technique is used in CADET to evaluate the accessibility of a series of channel reaches for multiple vessel geometries, loading, and wave conditions.
Briggs et al. (2010, 2012, and 2013) performed a validation study with CADET for six ships during inbound and outbound transits in Ambrose Channel, NY. Comparisons between field measurements and CADET predictions agreed reasonably well in the three reaches. Additional validation comparisons between field and laboratory measurements and CADET predictions for the World Utility bulk carrier were performed for Barbers Pt, HI (Briggs et al. 2006, 2012, and 2013). The agreement between CADET predictions and field and laboratory measurements was reasonable.
The main concern is about amplification over the submerged mound due to refraction, diffraction, and shoaling of wind waves. Vincent and Briggs (1989) describe the effect of frequency and directional spreading of waves caused by a submerged elliptical shoal. They found amplification factors of over 2 for unbroken monochromatic and unidirectional waves for a laboratory model shoal. Their measured breaking wave heights usually were less than the incident wave heights. The shoal geometry tested in the laboratory had minor X- and major Y- axes normalized by the wavelength L

ERDC/CHL TR-14-3 3
of X/L = 1.35 and Y/L = 1.75. The crest of the shoal was hmound = 0.5 ft below the mean water level in h = 1.5 ft of water at laboratory scales. The normalized depth of the shoal was hmound/h = 0.33. In comparison, the Ambrose Channel mound is relatively deeper than the laboratory shoal with crest elevation of hmound = 53 ft in an approximate water depth h = 80 ft, or hmound/h = 0.66. For the mound size of 1,500 to 2,000 ft, a comparable wave period of T = 18 to 22 sec would be required to match the laboratory mound horizontal setup.
Since the laboratory experiment results do not match the Ambrose Channel mound very well in scaling and mound elliptical shape, it was necessary to examine the significance of wave amplification using two spectral (phase-averaged) wave models: STWAVE (Smith et al. 2001a) and CMS-Wave ( Lin and Demirbilek 2005; Demirbilek et al. 2007; Lin et al. 2006; Lin et al. 2008). Both of these models can provide locally generated wave estimates at the project site given incident wave conditions. These models are computationally efficient and can be used to model large areas since fine grid resolution is not necessary. However, this class of model has limitations for modeling wave diffraction, reflection, transmission, nonlinear waves, and bathymetric effects caused by submerged mounds, shoals, or navigation channels. For these reasons, two wave models were used because each has its own strengths and limitations.
Design ship
The Susan Maersk Post-Panamax containership (Figure 2) is the design ship for this study. It was completed in 1997 with a TEU (Twenty-feet Equivalent Units) capacity of 8,680 and a length overall, LOA, of 1,138 ft. Typical ship speeds Vk range from 8 kt to 16 kt, with common ship speeds as fast as 15 kt in this area. In addition to the fully loaded draft of T = 47.5 ft, a light-loaded draft of T = 46 ft was also investigated in this study. This was necessary because a lighter ship (with less draft) will respond to waves differently than a fully loaded ship. Table 1 lists ship particulars for these two design drafts of the Susan Maersk.
Purpose
The New York District (NAN) has requested a study to evaluate the waves across this mound and determine if they will have a significant effect on ship response. If there is a significant effect, then how does this response compare to a similar transit through the Ambrose Channel offshore reach that is adjacent to the mound?

ERDC/CHL TR-14-3 4
Figure 2. Susan Maersk design ship for Ambrose Channel.
Table 1. Susan Maersk containership parameters.
Description Symbol Units Light-loaded Fully loaded
Length between perpendiculars LPP ft 1087.9 1087.9
Beam B ft 140.4 140.4
Draft T ft 46.0 47.5
Block coefficient CB --- 0.65 0.65
Longitudinal center of gravity LCG ft 563.0 563.7
Vertical center of gravity (from keel) VCG ft 62.8 62.2
Metacentric height GM ft 1.97 2.48
Roll damping factor, fractional percent β44 --- 0.04 0.08
Roll Gyradius k4 ft 57.6 57.6
Pitch Gyradius k6 ft 272.0 272.0
Because the mound consists of hard material, it is proposed to dredge it to a minimum depth of 55 ft so that there is an additional clearance of +2 ft relative to similar transits in the soft bottom of the Ambrose Channel. Additional dredging beyond a depth of 55 ft will be recommended if the mound transits indicate a greater potential for groundings than the similar channel transits.
Study approach
The study described in this report was performed by the US Army Engineer Research and Development Center (ERDC), Coastal and Hydraulics Laboratory (CHL), in support of NAN planning and design for the Ambrose Channel. The CADET probabilistic model was used to predict vertical ship motions due to a range of wave conditions. Wave transformation was

ERDC/CHL TR-14-3 5
evaluated between the incident offshore site and the Ambrose Channel and over the mound using the STWAVE and CMS-Wave numerical models. Ship squat, ship motions, and UKCNet were compared between the channel and mound reaches. Significant differences were noted, and a dredge depth was recommended that would accommodate the UKCNet requirements.
The first step was to define the offshore and mound reaches for the Ambrose Channel. The existing offshore reach has a width of 2,000 ft and a project depth of 53 ft. The mound reach was defined to have a similar width of 2,000 ft to match the existing diameter of the mound, but the depth will be 55 ft as it was assumed that it would be dredged at least an additional 2 ft to compensate for the hard-bottom guidelines within the Corps. The Ambrose Channel experiences a 5 ft tidal increase; therefore, channel and mound depths included the effect of the 5 ft tide. Depths ranged from 53 to 58 ft in the channel and 55 to 60 ft over the mound.
The study approach consisted of two phases. In Phase 1, relatively deepwater hindcast waves were used to examine vertical ship motions between the two reaches. For simplicity, it was assumed that the effect of wave transformation was negligible between locations and over the mound. Phase 1 consisted of the following tasks:
• Characterize incident wave climate in the Ambrose Channel area from WIS hindcast and National Oceanic and Atmospheric Administration (NOAA) buoy measurements.
• Simulate directional wave spectra based on the 20 yr hindcast wave dataset along offshore and mound channel reaches. These wave conditions are identical for both reaches.
• Predict ship squat using Ankudinov, Beck-Newman-Tuck (BNT), and five of the PIANC (The World Association for Waterborne Transport Infrastructure, formerly Permanent International Association of Navigation Congresses) empirical formulas (1997 and 2013).
• Predict wave-induced vertical ship motions for both the lightly and fully loaded Susan Maersk design ship in the channel and mound reaches using the CADET model.
• Compare squat, ship motions, and UKCNet between channel and mound reaches.

ERDC/CHL TR-14-3 6
The results from the Phase 1 comparisons were used to select a limited wave dataset to investigate the effects of wave transformation using STWAVE and CMS-Wave in Phase 2. Phase 2 consisted of the following tasks:
• Select subset of wave conditions for wave transformation evaluation. • Create STWAVE and CMS-Wave numerical models to evaluate
transformation and potential for amplification of this reduced wave dataset.
• Create new wave dataset of directional wave spectra based on numerical model results.
• Re-run CADET with new dataset. • Compare squat, ship motions, and UKCNet between channel and mound
reaches for this reduced wave dataset. Investigate effect of increased water depths over the mound.
• Recommend optimum dredge depth for mound based on comparisons between the channel and mound reaches.
Report organization
In this report, the CADET numerical model is briefly described in Chapter 2. A brief description of the STWAVE and CMS-Wave wave transformation models is presented in Chapter 3. Chapter 4 contains a description of the PIANC, Ankudinov, and CADET/BNT ship squat predictions. The characterization of the waves in the two phases for the CADET, STWAVE, and CMS-Wave numerical model simulations is described in Chapter 5. Results from the ship squat calculations are presented and discussed in Chapter 6. The vertical ship motions and corresponding UKCNet are discussed and presented in Chapter 7. These results compare UKCNet over the mound relative to similar transits though the channel. Based on these comparisons, an optimum dredge depth for the mound is recommended. Finally, a summary and conclusions is presented in Chapter 8.

ERDC/CHL TR-14-3 7
2 CADET Numerical Model
Background
CADET (Kopp and Silver 2005) was developed by the Naval Surface Warfare Center, Carderock Division (NSWCCD), under contract to ERDC-CHL. CADET is an expansion of the technology developed to determine the depth of entrance channels to new homeports for Nimitz-class Aircraft Carriers (CVN 68). The technology used in CADET (Silver 1992; Silver and Dalzell 1997) was initially developed for the Environmental Monitoring and Guidance System (EMOGS). EMOGS provides operational guidance on the expected UKC of a vessel given real-time wave and water level measure-ments or observed conditions at a particular port. For each UKC prediction, it also calculates the uncertainty and risk of touching the channel bottom under those conditions. EMOGS evaluates clearance and risk for a single specified ship at one channel depth, using a single wave spectrum, for a transit in one direction at a specific date and time. Astronomical tide effects on the water level are included and take into account the duration of transit for a given ship speed and entrance channel configuration. Meteorological effects on water level due to barometric pressure are also included. EMOGS is installed at naval stations in the United States and has been in operation for over 20 yrs. During this time, no known incident of bottom touching or grounding has occurred, and the users have not complained that the results are too restrictive.
CADET differs from EMOGS in several respects. It is more of a design tool as it evaluates clearance and risk for a range of possible water depths. In addition, it evaluates the entrance channel depths for any channel cross-section. Annual local wave statistics are used to determine the accessibility of the transit channels, expressed in days per year. Astronomical and meteorological tide effects are not explicitly included since, for design purposes, a transit could occur in either direction at any time. Water level changes can be included by varying the project depth relative to ship draft. A tide calculator is a post-processor option that can be used to indicate additional days of accessibility due to hindcast of 20 yr tidal cycles for a particular location. CADET also assumes an equal probability of a transit in either inbound or outbound directions at any time of day or night.
ERDC/CHL TR-14-3 8
Dynamic or Net UKC calculation
CADET calculates the dynamic or net UKC, UKCNet, of a specific ship, commercial or naval, at a specified channel location, and provides information to aid in determining the optimum dredge depth (Briggs et al. 2004 and 2012). This optimum depth is defined as the shallowest depth that allows the maximum days of access for any given year at that location. The accessibility of the channel is determined by calculating the vertical UKCNet and the risk of the vessel touching the channel bottom under all wave conditions that are present. The general rule is that if the risk, α, of the ship touching a flat channel bottom is less than 1 in 100 (i.e., α = 0.01) for each wave in a climatology during a given transit, then the channel is considered accessible for that depth. The Navy is comfortable with this level of risk and corresponding accessibility. The number of days per year the channel is accessible is dependent on the persistence of the local wave conditions obtained from the local wave climatology.
The UKCNet of the vessel is influenced by five major parameters that include the following:
• Static draft and trim of the ship at rest • Underway sinkage and trim or ship squat • Wave-induced vertical motions • Hydrologic factors of channel depth at (MLLW) project depth • Change in water level due to the astronomical tides
Because CADET is primarily a channel-depth design tool, ephemeral parameters such as meteorological tides are not factored into the calculation. As mentioned previously, CADET does have a post-processing option for tidal effects. Otherwise, the user can input equivalent tides in the range of water depths used for the predictions. CADET does not explicitly include channel width or bank effects.
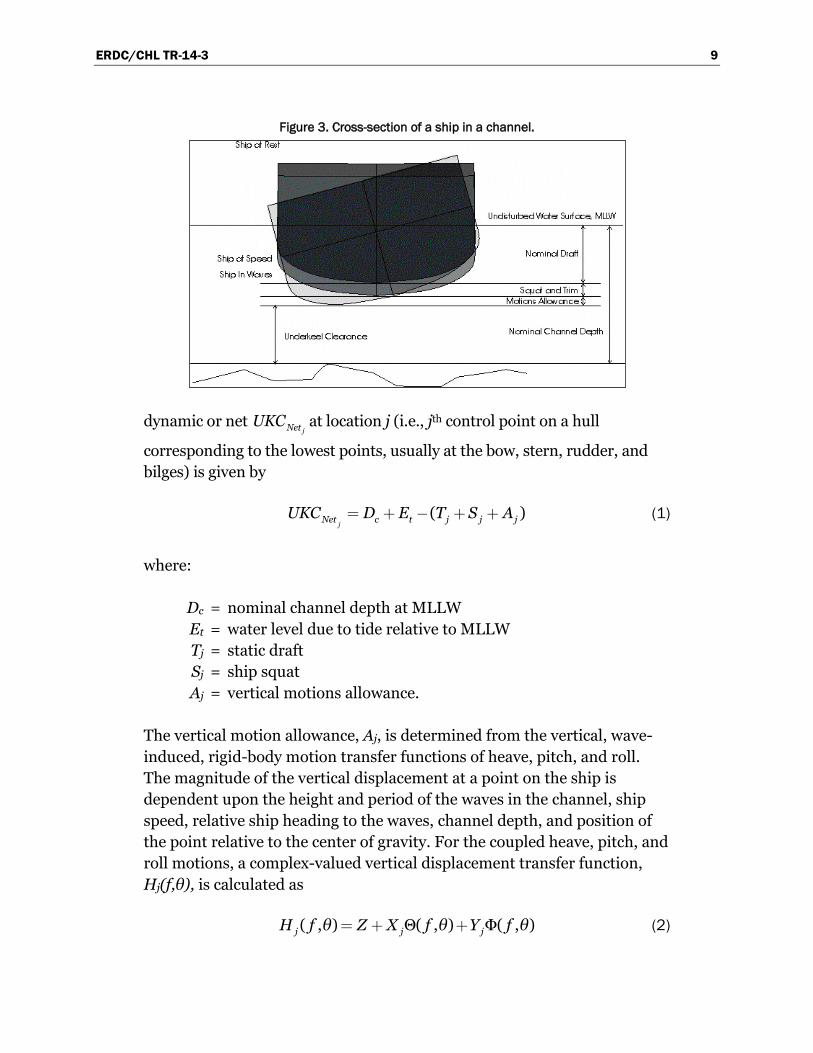
Figure 3 shows the major parameters considered when calculating the vertical underkeel clearance of the ship in a channel. The static or gross UKC (UKC) is the difference between the nominal channel depth and the static at-rest draft of the vessel. Static trim must also be taken into account. As the ship travels at speed along the channel, the ship both sinks and trims (i.e., squat or midship sinkage and trim by the bow or stern) due to a pressure field between the hull of the vessel and the channel bottom. The
ERDC/CHL TR-14-3 9
Figure 3. Cross-section of a ship in a channel.
dynamic or net jNetUKC at location j (i.e., jth control point on a hull
corresponding to the lowest points, usually at the bow, stern, rudder, and bilges) is given by
( )j
Net c t j j jUKC D E T S A (1)
where:
Dc = nominal channel depth at MLLW Et = water level due to tide relative to MLLW Tj = static draft Sj = ship squat Aj = vertical motions allowance.
The vertical motion allowance, Aj, is determined from the vertical, wave-induced, rigid-body motion transfer functions of heave, pitch, and roll. The magnitude of the vertical displacement at a point on the ship is dependent upon the height and period of the waves in the channel, ship speed, relative ship heading to the waves, channel depth, and position of the point relative to the center of gravity. For the coupled heave, pitch, and roll motions, a complex-valued vertical displacement transfer function, Hj(f,θ), is calculated as
( , ) Θ( , ) Φ( , )j j jH f θ Z X f θ Y f θ (2)

ERDC/CHL TR-14-3 10
where:
j = corresponds to the jth control point location Z = complex vertical heave motion transfer function Xj = longitudinal distance from the ship’s center of gravity to the jth
control point Yj = transverse distance from the ship’s center of gravity to the jth
control point Q(f,θ) = complex pitch transfer function
Φ (f,θ) = complex roll transfer function.
These transfer functions are then used in the calculation of the RMS (root mean square) displacement, σj, given by
( , ) ( , )j j jf θ
σ σ S f θ H f θ f θ 22 (3)
where:
σj = RMS displacement at jth control point location, ft S(f,θ) = directional wave spectrum, ft2/Hz/deg
2( , )jH f θ = square of the modulus of the transfer function, known as the
Response Amplitude Operator (RAO) ∆f = increment in frequency, Hz ∆θ = increment in direction, deg.
Because of phase differences, σj calculated from individual wave conditions may not provide the largest vertical excursion the ship can experience during a transit. Therefore, higher order extremal statistics (Ochi 1973) are used to define an expected extreme motion allowance, Aj, during a given transit as
ln d vjj j
j
T σA σ
πασ
22
(4)
where:
Td = exposure time in the channel (i.e., reach length/ship speed), sec
ERDC/CHL TR-14-3 11
σvj = vertical velocity of the vertical motion (i.e., time derivative of σj) at location j, ft/sec
α = risk parameter, normally taken to be 0.01 (i.e., 1/100) in CADET. If α = 0.01, then the ship has a risk of 1 in 100 that the predicted motions allowance, Aj, will be exceeded for the given set of wave conditions.
Uncertainty and risk analysis
Each of the parameters in Equation 1 has inherent uncertainties. These uncertainties are quantified by their bias and variability. The shallow water motions calculation for Navy ships was based on a software program that was a hybrid of the Navy Standard Ship Motion Program (SMP). This hybrid was validated by both model tests and comparisons of predicted motions with full-scale measurements (Silver and Dalzell 1997). The motions of the commercial ships used in CADET were computed through the shallow-water version of SCORES which calculates ship motions due to waves (Kaplan 1996a, 1996b). As more experience using CADET is attained for commercial ships, the bias and variability could change. However, since a large component of the uncertainty and bias in the motions calculation comes from the uncertainty in the wave measurement, the difference in the uncertainty of the motions between commercial and Navy ships may be small.
The primary objective for calculating uncertainty is to provide a measure of risk of the vessel touching the various project depths being considered. Risk is defined as that proportion of all possible transits under statistically constant conditions in which the minimum channel clearance would be zero or negative. The risk model takes into account the uncertainty in each parameter by assuming a Gaussian distribution for static ship draft, underway sinkage and trim, and a Rayleigh distribution for the vertical motion and velocity variances. The Rayleigh distribution reflects the most likely probability distribution of the waves. Using these distributions, the probability density of the largest motion excursion or the minimum
jNetUKC
is determined, and its area up to a minimum clearance of zero is calculated.
Under this definition of risk, it is necessary to compute the probability density of the net effective clearance and determine the area up to zero net effective clearance. The net effective clearance, therefore, is defined as the difference between the random variables that make up the effective
ERDC/CHL TR-14-3 12
channel depth and the effective vertical displacement of the ship. These random variables are a function of the uncertainty in each of the major parameters that make up the net effective clearance.
Thus, a risk analysis is performed to determine the probability of any one of the critical points of the deep draft vessel touching the channel bottom for inbound and outbound transits. The critical locations on the vessel usually are the bow at the keel, the rudder(s), and the port and starboard bilges at amidships. The risk analysis is performed for each of the wave conditions in wave climatology for the port. The significant wave height, the peak or modal period, primary wave direction, and distribution of energy in frequency and direction (i.e., directional wave spectrum) define the wave condition. The result of the risk analysis provides a probability of the vessel touching the channel bottom under each of the wave conditions for a specified project depth. It is assumed that if the risk is greater than some threshold value (normally 1 in 100) then the channel is inaccessible by the vessel. The days of accessibility of the channel are calculated by determining the persistence of the wave condition that produces the risk of 1 in 100 or greater. The risk calculation is performed for each wave condition and a range of project depths. When complete, the optimum channel depth is the one with the greatest number of days of accessibility per year and the least amount of dredging.
CADET organization
CADET is the interface to a set of computer programs that calculates UKCNet and bottom touching risk probability for any number of ships and loading conditions over a range of multiple project depths. CADET manages the necessary internal data flow among the component programs and provides an interface structured in four basic modules for defining and performing calculations and actions relative to (a) Ship, (b) Project, (c) Analyses, and (d) Results. The two input modules for Ship and Project are explained in the following sections (Briggs and Henderson 2011; Briggs et al. 2012).
Ship module
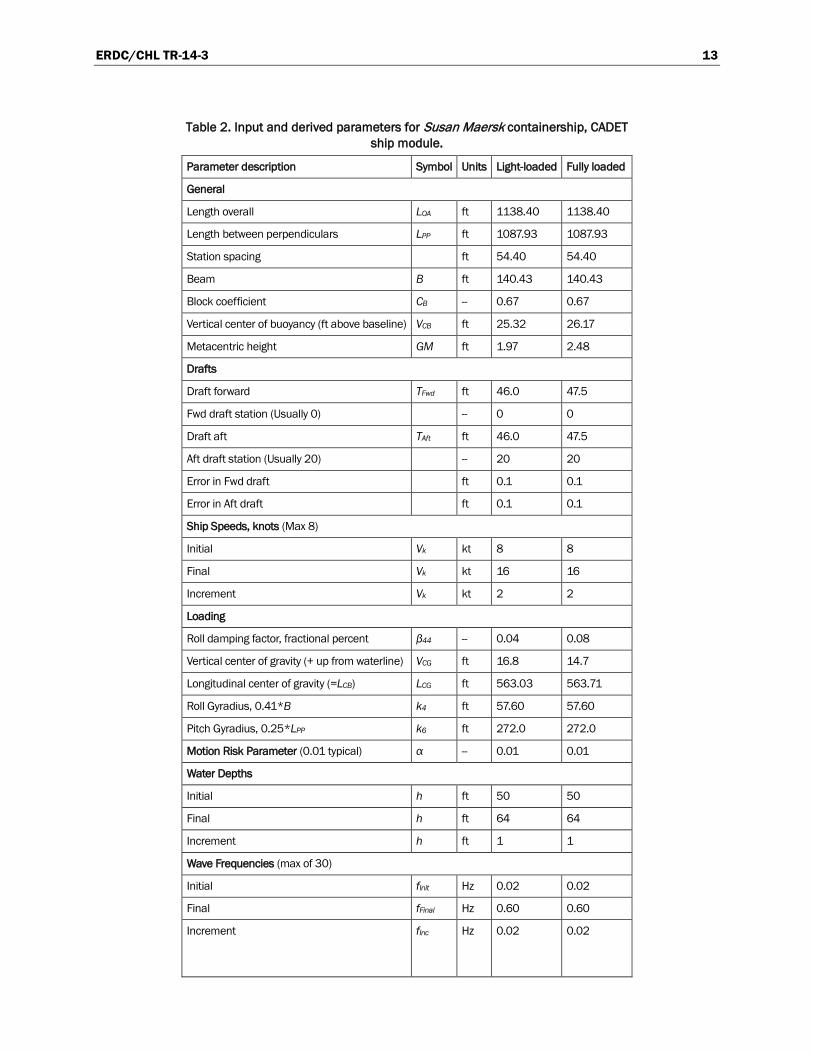
The first module contains all of the ship parameters to define a ship relative to geometry and loading. Table 2 lists the values used in CADET for the nine categories defining the lightly and fully loaded Susan Maersk ship including (a) static draft and trim, (b) ship speeds, (c) loading parameters,
ERDC/CHL TR-14-3 13
Table 2. Input and derived parameters for Susan Maersk containership, CADET ship module.
Parameter description Symbol Units Light-loaded Fully loaded
General
Length overall LOA ft 1138.40 1138.40
Length between perpendiculars LPP ft 1087.93 1087.93
Station spacing ft 54.40 54.40
Beam B ft 140.43 140.43
Block coefficient CB -- 0.67 0.67
Vertical center of buoyancy (ft above baseline) VCB ft 25.32 26.17
Metacentric height GM ft 1.97 2.48
Drafts
Draft forward TFwd ft 46.0 47.5
Fwd draft station (Usually 0) -- 0 0
Draft aft TAft ft 46.0 47.5
Aft draft station (Usually 20) -- 20 20
Error in Fwd draft ft 0.1 0.1
Error in Aft draft ft 0.1 0.1
Ship Speeds, knots (Max 8)
Initial Vk kt 8 8
Final Vk kt 16 16
Increment Vk kt 2 2
Loading
Roll damping factor, fractional percent β44 -- 0.04 0.08
Vertical center of gravity (+ up from waterline) VCG ft 16.8 14.7
Longitudinal center of gravity (=LCB) LCG ft 563.03 563.71
Roll Gyradius, 0.41*B k4 ft 57.60 57.60
Pitch Gyradius, 0.25*LPP k6 ft 272.0 272.0
Motion Risk Parameter (0.01 typical) α -- 0.01 0.01
Water Depths
Initial h ft 50 50
Final h ft 64 64
Increment h ft 1 1
Wave Frequencies (max of 30)
Initial fInit Hz 0.02 0.02
Final fFinal Hz 0.60 0.60
Increment
fInc
Hz
0.02
0.02

ERDC/CHL TR-14-3 14
Parameter description Symbol Units Light-loaded Fully loaded
Sinkage and trim (Squat)
Filename: Squat-BNT_ -- 33744S.dat 48W6L3.dat
Channel width W ft 600 600
Outer water depth (-1=uniform depth) HOut ft -1 -1
Error in underway sinkage ft 0.1 0.1
Error in underway trim angle deg 0.01 0.01
Critical Point Locations, Primary Points (bottom touching offset 0.0)
Point Bow
X (Station) X -- 0 0
Y (+ port) Y ft 0 0
Z (+ up from baseline) Z ft 0 0
Point Port Rudder
X (Station) X -- 20 20
Y (+ port) Y ft 0 0
Z (+ up from baseline) Z ft 0 0
Point Stbd Rudder (repeat above since only 1 rudder in center)
X (Station) X -- 20 20
Y (+ port) Y ft 0 0
Z (+ up from baseline) Z ft 0 0
Point Port Bilge
X (Station) X -- 10 10
Y (+ port) Y ft 69.8 70.2
Z (+ up from baseline) Z ft 0 0
Point Stbd Bilge
X (Station) X -- 10 10
Y (+ port) Y ft -69.8 -70.2
Z (+ up from baseline) Z ft 0 0
Alternate Points (User selects up to 4)
Point Alternate 1 (Center keel)
X (Station) X -- 10 10
Y (+ port) Y ft 0 0
Z (+ up from baseline) Z ft 0 0
(d) motion risk parameter, (e) water depths, (f) wave frequencies, (g) sinkage and trim, (h) critical point locations, and (i) ship motion transfer functions.
ERDC/CHL TR-14-3 15
The most critical input is the ship geometry file that is represented by the “ship lines” drawing. Ships are defined by a hull geometry file that is independent of loading conditions. The geometry file represents the ship in terms of hull offsets, from the keel to the deck-at-edge, at 21 equally spaced stations between the forward and aft perpendicular. These geometry data files can be prepared externally and imported into CADET, or they can be created using a built-in graphical geometry editor. The spacing between these 21 stations is determined by the ship’s waterline length or the length between the forward and aft perpendiculars, Lpp. The ship’s beam, B, represents the width at the waterline. It is a deterministic geometric parameter that is used to document the ship and to calculate some hydrostatic properties. The offsets do not necessarily have to correspond to B exactly as CADET calculates beam at the waterline using the offsets in the ship lines.
Draft and Ship Speed
The static draft and trim are defined at either (a) the forward, TFP, and aft, TAP, perpendiculars or (b) draft at some longitudinal position and a trim angle in degrees. Up to eight ship speeds in knots can be entered. These speed values must be whole integers.
Loading
Multiple loading conditions can be defined for each ship in CADET. The ship loading parameters that affect the three vertical motions of heave, pitch, and roll include (a) longitudinal center of gravity, LCG, (b) vertical center of gravity, KG, (c) roll damping factor, β44 (fraction of critical damping), (d) roll mass radius of gyration, k4, and (e) pitch mass radius of gyration, k6.
Static equilibrium is based on Archimedes Principle where the weight, Ws, of the ship and cargo is balanced by the weight, WB, of the water displaced by the ship. The longitudinal center of gravity, LCG, is usually located midway along the longitudinal axis of the ship. The center of buoyancy is the center of gravity of the fluid displaced by the ship. In the static condition, the longitudinal center of buoyancy, LCB, is coincident with the LCG. The vertical center of gravity, KG, is located along the vertical axis of the ship, approximately midway, as measured from the keel.

ERDC/CHL TR-14-3 16
In CADET the vertical center of gravity, VCG, is defined differently and is entered as a vertical location relative to the waterline (positive up) that varies with the type of ship. Containerships have positive values of approximately 5 to 15 ft since their cargo is stacked on top of the deck as well as in the holds.
CADET requires the roll damping factor, β44, to account for the ship’s dynamic roll characteristics. This factor is the fraction of critical damping and is typically equal to 0.08 to as large as 0.4 for containerships. The mass distribution properties of the ship are defined by the roll and pitch gyradii, k4 and k6, approximations given by
.. pp
k Bk L
4
6
0 410 25
(5)
Motion risk parameter α
As previously described, the motion risk parameter, α, typically has a value of 0.01 for most design applications.
CADET sinkage and trim
The CADET sinkage and trim or squat module is discussed in Chapter 4 with the PIANC and Ankudinov ship squat formulas.
Critical point locations
The critical point locations (j) previously discussed correspond with the five primary control points. They are located on the centerline at the TFP
and TAP to examine the effects of pitch at the bow and rudder(s) and along the port and starboard bilge to include the effects of roll.
Wave frequencies
A total of 30 wave frequencies are input to define the range of frequencies containing significant wave energy that will be used to calculate the ship motion transfer functions or Response Amplitude Operators (RAOs) for heave, pitch, and roll. The user should input initial, final, and increment values of frequency in Hz. Although the RAOs at a particular frequency can be interpolated to match the specific wave frequency in the project module, it is important that the final frequency value matches the highest

ERDC/CHL TR-14-3 17
frequency with significant wave energy to insure highest accuracy in the RAOs. These RAOs are used in Equation 3 to determine the CADET predictions.
Ship motion transfer functions
Finally, ship motion heave, pitch, and roll RAOs are calculated using a frequency-domain, shallow water, strip-theory program SCORES (Kaplan 1996a and b). In a manner similar to that used to calculate sinkage and trim, CADET generates SCORES input files from the defined hull geometry, draft and trim, ship speeds, water depths, roll damping coefficient, and wave frequencies. SCORES is run in the background by CADET, and the motion transfer functions are extracted from the SCORES output files. The extracted transfer functions are written to compressed binary files for later use in determining the Aj from Equation 4. Plotting of the transfer functions can be performed with different representations as needed (real/imaginary or amplitude/phase versus frequency, frequency of encounter, or non-dimensional wave length).
Project module
A project in CADET includes channel reaches, waves, ships, tides, and comments. While CADET keeps track of all of these direct and logical associations between projects, channel reaches, wave spectra, ships, loading conditions, and sinkage and trim data, the user is responsible for ensuring that these associations are coherent.
Reaches
Reaches should be defined whenever the depth, width, cross-section, or alignment of the channel changes significantly. Reach input includes (a) reach number, (b) description, (c) length, (d) direction, (e) width, (f) bottom type, (g) begin depth, (h) terminal depth, (i) increment depth, (j) outer water depth, (k) over-dredge, (l) dredge variability, and (m) wave coefficient of variation. Table 3 lists the channel particulars for Ambrose Channel. Included are group ID, reach number, wave ID, reach ID, length, and alignment angle. Additional parameters required by CADET are also listed.
Reach numbers are automatically increased as new reaches are added. The description, bottom type (i.e., sandy, rock, etc.) and width (feet) are purely for documentation. The length input is in nautical miles. The reach
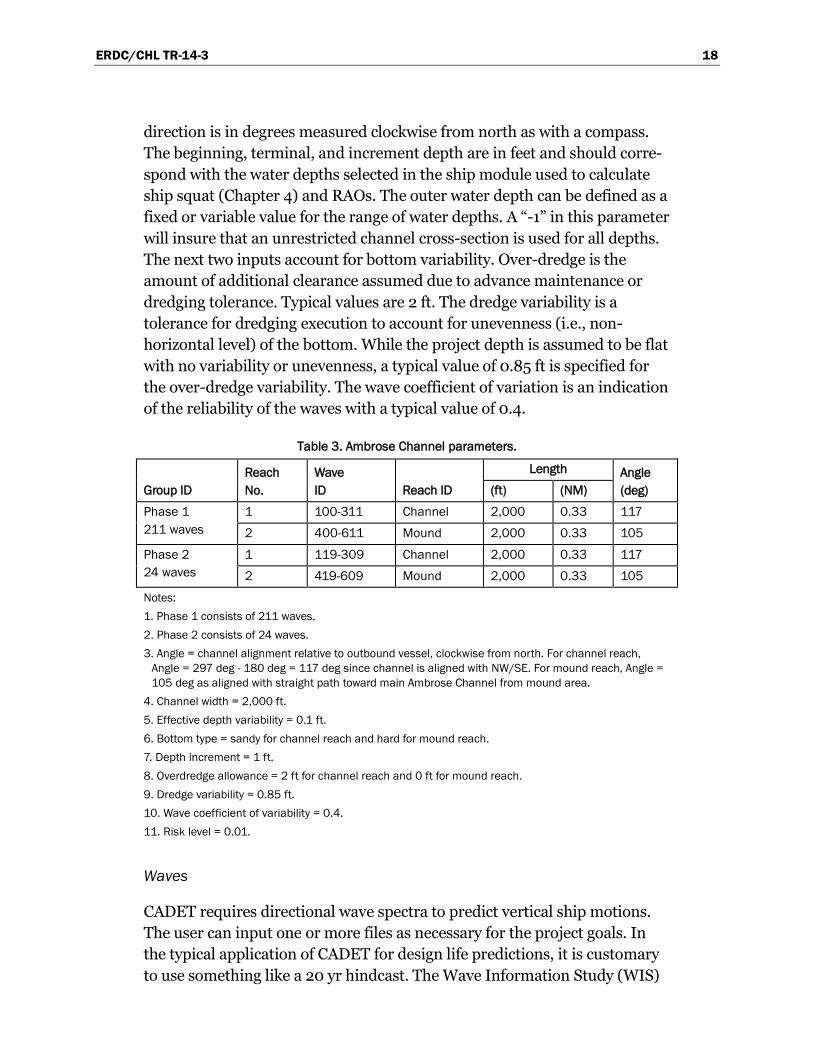
ERDC/CHL TR-14-3 18
direction is in degrees measured clockwise from north as with a compass. The beginning, terminal, and increment depth are in feet and should corre-spond with the water depths selected in the ship module used to calculate ship squat (Chapter 4) and RAOs. The outer water depth can be defined as a fixed or variable value for the range of water depths. A “-1” in this parameter will insure that an unrestricted channel cross-section is used for all depths. The next two inputs account for bottom variability. Over-dredge is the amount of additional clearance assumed due to advance maintenance or dredging tolerance. Typical values are 2 ft. The dredge variability is a tolerance for dredging execution to account for unevenness (i.e., non-horizontal level) of the bottom. While the project depth is assumed to be flat with no variability or unevenness, a typical value of 0.85 ft is specified for the over-dredge variability. The wave coefficient of variation is an indication of the reliability of the waves with a typical value of 0.4.
Table 3. Ambrose Channel parameters.
Group ID Reach No.
Wave ID Reach ID
Length Angle (deg) (ft) (NM)
Phase 1 211 waves
1 100-311 Channel 2,000 0.33 117
2 400-611 Mound 2,000 0.33 105
Phase 2 24 waves
1 119-309 Channel 2,000 0.33 117
2 419-609 Mound 2,000 0.33 105
Notes: 1. Phase 1 consists of 211 waves. 2. Phase 2 consists of 24 waves. 3. Angle = channel alignment relative to outbound vessel, clockwise from north. For channel reach,
Angle = 297 deg - 180 deg = 117 deg since channel is aligned with NW/SE. For mound reach, Angle = 105 deg as aligned with straight path toward main Ambrose Channel from mound area.
4. Channel width = 2,000 ft. 5. Effective depth variability = 0.1 ft. 6. Bottom type = sandy for channel reach and hard for mound reach. 7. Depth increment = 1 ft. 8. Overdredge allowance = 2 ft for channel reach and 0 ft for mound reach. 9. Dredge variability = 0.85 ft. 10. Wave coefficient of variability = 0.4. 11. Risk level = 0.01.
Waves
CADET requires directional wave spectra to predict vertical ship motions. The user can input one or more files as necessary for the project goals. In the typical application of CADET for design life predictions, it is customary to use something like a 20 yr hindcast. The Wave Information Study (WIS)

ERDC/CHL TR-14-3 19
is a good source of data for coasts around the US (http://chl.erdc.usace.army. mil/wis). The user selects the WIS station that is closest to the project site and sorts it into joint distribution tables of wave height and period for fixed wave directions. The WIS outputs data in 22.5 deg bins, so this is a good directional increment to use in CADET (although other values can be used). If the WIS station is greater than approximately 5 nm from the project site, the data should be transformed to the site. Also, if the channel is long, waves may transform from one end to the other, so the STWAVE type of program can be used to predict ratios relating incident wave conditions to output stations along the reaches of the channel (Stauble et al. 2001, Thompson 2002). Except for reflections, waves do not travel offshore from land. Therefore, the user can reduce the number of waves in this database by eliminating waves that are not possible due to blockage from land features. Wave directions should cover the full directional exposure of the channel.
Once the 20 yr hindcast database has been transformed to the project site, a final post-processing step is performed to compute statistical information. In this case, the user will want to minimize the number of individual cases according to combinations of wave height, period, and direction that are representative of the site and would significantly influence ship motions. Since deep-draft ships are relatively large, one might want to limit the number of waves to those with longer wave periods and larger wave heights that would actually affect the vertical ship motions. One might think that since the largest vertical ship motions occur for wave periods that coincide with the natural oscillation periods in heave, pitch, and roll that are typically of the order of 8 sec or larger, it is reasonable to ignore wave spectra with peak wave periods below 5 or 6 sec. Similarly, one might think that it is reasonable to ignore the insignificant ship motions due to waves with heights less than 2 to 3 ft. Of course, this would be dependent on the size of the ship(s) in the study.
However, a better procedure is to retain all of the data, but set up “bins” for the sorting that tend to isolate the “tails” data on the low and high ends of wave period and height. The CEDAS (Coastal Engineering Design and Analysis System) has a NEMOS (Nearshore Evolution Modeling System) program that does sorting for joint distributions of wave period and height for fixed wave directions (NEMOS 2000). For instance, since the bins do not have to be evenly spaced, one can set up the lower and upper wave period and wave height bins to include relatively extreme or rare events in period and height. For instance, the lower wave period bin could include all
ERDC/CHL TR-14-3 20
wave periods from 0 to 5 sec. The upper wave period bin might include all periods between 17 and 23 sec, or whatever high period limit is contained in the dataset. Similarly for wave heights, bin size can be 2 ft for the smaller waves with an upper bin to include all waves between 20 and 30 ft. Again, the number and increments for the bins should be based on the minimum and maximum values for the entire dataset. The NEMOS reports the distributions in percent and number of occurrences. The program has the option to report the mean values for each bin, so these should be used in building the wave parameter statistics for generating the empirical directional wave spectra. The number of occurrences relative to the total provides the wave probabilities for CADET. A good rule of thumb is to ignore bins that have less than 0.05 percent of the total number of occurrences as these represent very rare events on both low and high ends of the dataset. As mentioned previously, wave direction can be limited by the land features to include lower and upper directions that are possible. A fixed increment like 22.5 deg is a reasonable value although other values are also acceptable.
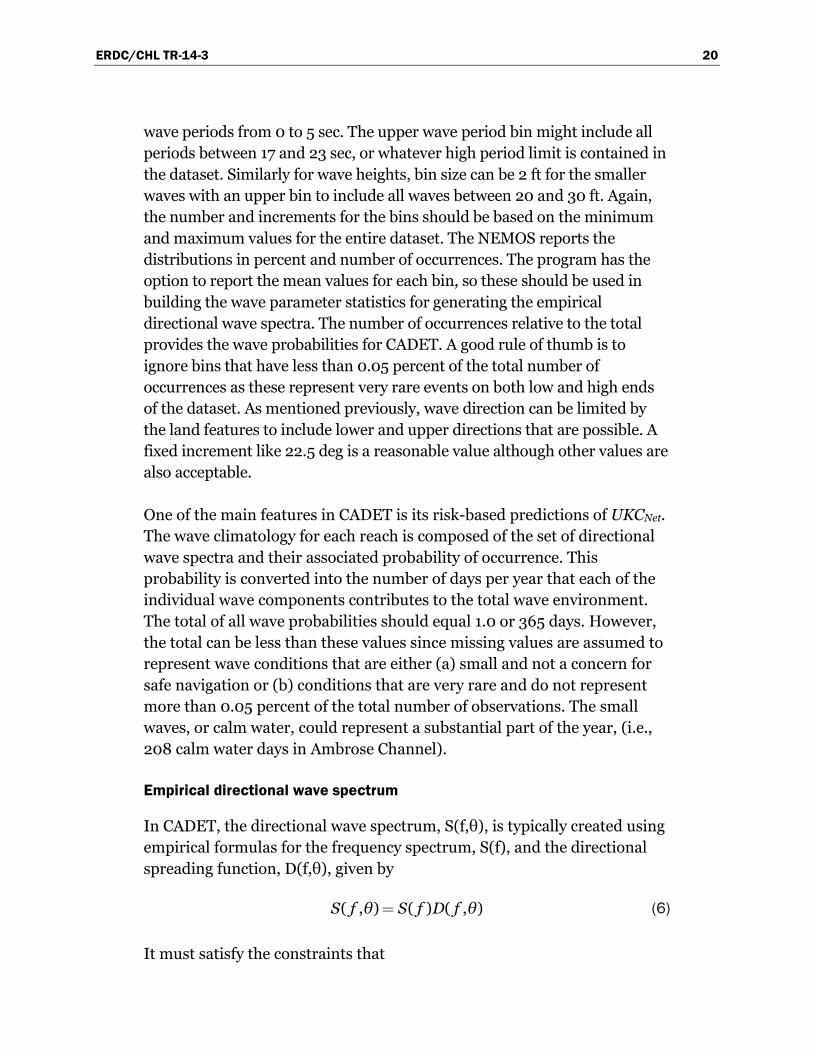
One of the main features in CADET is its risk-based predictions of UKCNet. The wave climatology for each reach is composed of the set of directional wave spectra and their associated probability of occurrence. This probability is converted into the number of days per year that each of the individual wave components contributes to the total wave environment. The total of all wave probabilities should equal 1.0 or 365 days. However, the total can be less than these values since missing values are assumed to represent wave conditions that are either (a) small and not a concern for safe navigation or (b) conditions that are very rare and do not represent more than 0.05 percent of the total number of observations. The small waves, or calm water, could represent a substantial part of the year, (i.e., 208 calm water days in Ambrose Channel).
Empirical directional wave spectrum
In CADET, the directional wave spectrum, S(f,θ), is typically created using empirical formulas for the frequency spectrum, S(f), and the directional spreading function, D(f,θ), given by
( , ) ( ) ( , )S f θ S f D f θ (6)
It must satisfy the constraints that

ERDC/CHL TR-14-3 21
( ) ( , ) ; ( , )π π
S f S f θ θ D f θ θ 2 2
0 0
1 (7)
The TMA (Texel, MARSEN, ARSLOE) is a shallow-water spectral form (Bouws et al. 1985) for S(f) that characterizes waves generated in deepwater which have propagated into shallow water. The TMA spectral parameters are the same as those in the more widely known JONSWAP (Joint North Sea Wave Program) deepwater spectrum. The TMA spectrum reduces to the JONSWAP spectrum in the deepwater limit. The TMA is defined as
( ) Φ( , )( )
a bαgS f πf h e γπ f
2
4 5 22
(8)
where:
α = Phillip's constant (defined below) g = gravitational acceleration f = frequency fp = peak spectral frequency h = water depth Φ(2πf,h) = function of frequency and depth γ = peak enhancement factor a,b = functions of frequency and peak spectral frequency.
Procedures for estimating α and γ are discussed by Hughes (1984), Briggs (1988), and Briggs et al. (1987). The value for the Phillips constant α (1957) is calculated using an iterative procedure that compares the target wave height to the calculated value for a required tolerance. The parameter γ controls the width of the frequency spectrum (small values give broad frequency peaks and large values give narrow peaks). Comparing sea and swell wave components, swell tends to have longer wave periods and correspondingly narrower frequency-space spectra. Table 4 provides some guidance in the selection of γ based on wave period (Thompson et al. 1996).
The directional spreading function, D(f,θ), can be approximated using several different empirical formulas. One of the simplest is a cosnθ directional distribution (Borgman 1990; Smith et al. 2001a). It is given by
1( , ) cos
Cn mθ θ
D f θ 2
(9)
ERDC/CHL TR-14-3 22
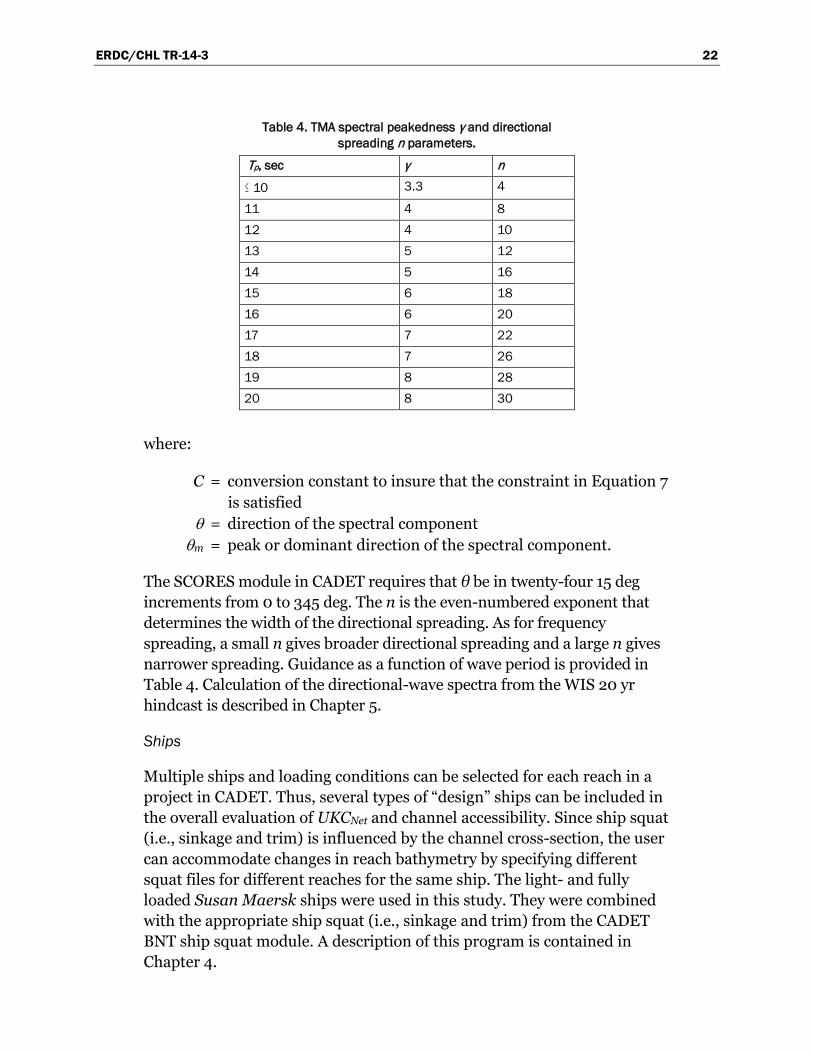
Table 4. TMA spectral peakedness γ and directional spreading n parameters.
Tp, sec γ n ≤ 10 3.3 4
11 4 8 12 4 10 13 5 12 14 5 16 15 6 18 16 6 20 17 7 22 18 7 26 19 8 28 20 8 30
where:
C = conversion constant to insure that the constraint in Equation 7 is satisfied
θ = direction of the spectral component θm = peak or dominant direction of the spectral component.
The SCORES module in CADET requires that θ be in twenty-four 15 deg increments from 0 to 345 deg. The n is the even-numbered exponent that determines the width of the directional spreading. As for frequency spreading, a small n gives broader directional spreading and a large n gives narrower spreading. Guidance as a function of wave period is provided in Table 4. Calculation of the directional-wave spectra from the WIS 20 yr hindcast is described in Chapter 5.
Ships
Multiple ships and loading conditions can be selected for each reach in a project in CADET. Thus, several types of “design” ships can be included in the overall evaluation of UKCNet and channel accessibility. Since ship squat (i.e., sinkage and trim) is influenced by the channel cross-section, the user can accommodate changes in reach bathymetry by specifying different squat files for different reaches for the same ship. The light- and fully loaded Susan Maersk ships were used in this study. They were combined with the appropriate ship squat (i.e., sinkage and trim) from the CADET BNT ship squat module. A description of this program is contained in Chapter 4.
ERDC/CHL TR-14-3 23
3 Numerical Wave Models
This chapter describes two numerical wave models that were used to examine wave transformation between offshore locations and Ambrose Channel and over the mound. The coastal wave transformation numerical models, STWAVE and CMS-Wave, were applied on a rectangular grid to provide a reliable representation of wave conditions at the entrance to the channel and the mound as well as waves in and along the channel and outside the channel. STWAVE runs on the HPC platforms with parallel processing while CMS-Wave runs more efficiently on a PC with multiple processors. In terms of wave transformation from deepwater to nearshore, both models have similar capabilities (e.g., wind input, wave generation and growth, wave transformation over long fetches, wave shoaling, refraction, breaking, and dissipation).
STWAVE
Model description
The purpose of STWAVE (STeady-state spectral WAVE model) is to provide a simple, robust numerical model for simulating nearshore wind-wave growth, propagation, and transformation (Smith 2001; Smith 2007; Smith and Zundel 2006; Smith et al. 1999; and Smith et al. 2001a). It is a finite-difference, phase-averaged spectral wave model based on the wave action balance equation. This directional spectral wave transformation model solves for the spatial variation of steady-state wave energy without the calculation of wave phase. It computes nearshore wave transformation including refraction, shoaling, and breaking as well as wind-wave generation.
STWAVE can operate in two wave transformation modes: half-plane and full-plane. The half-plane mode allows wave energy to propagate only from the offshore towards the nearshore (±87.5 deg from the x-axis of the grid, which is typically the approximate shore-normal direction). All waves traveling in the negative x-direction, such as those reflected from the shore-line, steep bottom features, and structures as well as those generated by offshore-blowing winds, are neglected in half-plane simulations. The full-plane mode allows wave transformation and generation on the full 360 deg plane. Table 5 summarizes the features for each mode. Previously mentioned features that are not listed in this table are available in both modes.

ERDC/CHL TR-14-3 24
Table 5. Summary of half-plane and full-plane features
Feature Half Plane Full Plane
Wave transformation and generation on full 360 deg plane x
Option for wave-current interaction x
Option for direct input of wave parameters to create TMA spectrum x
Direction bins restricted to 5 deg x
DX and DY grid cell spacing must be the same x
Requires iterative criteria x
The full-plane option of STWAVE is not intended to be a replacement for the half-plane version, but an addition. The half-plane version requires considerably lower memory requirements, executes faster, and is generally appropriate for most nearshore coastal applications with the exception of semi-enclosed bays and lakes where there is no obvious offshore direction. For these cases, the full-plane version should be applied since it allows wave transformation and generation in all directions. Some STWAVE model options are unique to either half-plane or full-plane mode. The primary output parameters from STWAVE are wave height, period, and direction. The calculated directional wave spectra, radiation stresses, and wave breaking index information may also be output for circulation modeling.
Capabilities and assumptions
STWAVE simulates depth-induced wave refraction and shoaling, current-induced refraction and shoaling, depth- and steepness-induced wave breaking, wind-wave growth, and wave-wave interaction and white-capping that redistributes and dissipates energy in a growing wave field. The governing equations are similar between the half-plane and full-plane modes and also similar to equations used in the CMS-Wave. These will be described in the CMS-Wave section. Additional information about STWAVE and its application is available from related publications (Smith 2001; Smith 2007; Smith and Zundel 2006; Smith et al. 1998 and 1999; Smith et al. 2001a and 2001b; and Thompson 2002).
The basic assumptions made in STWAVE are the following:
1. Phase-averaged. STWAVE is based on the assumption that relative phases of the spectral components are random, and phase information is not tracked. A phase-resolving model should be applied to resolve detailed near-field reflection and diffraction patterns near coastal structures.
ERDC/CHL TR-14-3 25
2. Mild-bottom slope and negligible wave reflection. Waves reflected from the shoreline or from steep-bottom features are neglected.
3. Steady-state waves, currents, and winds. STWAVE is formulated as a steady-state model, which reduces computation time and is appropriate for wave conditions that vary slower than the time it takes for waves to transit the domain. For wave generation, the steady-state assumption means that the winds have remained steady sufficiently long for the waves to attain fetch-limited or fully developed conditions (waves are not limited by the duration of the winds).
4. Linear refraction and shoaling. STWAVE incorporates linear wave refraction, shoaling, and propagation, and, thus, does not represent wave asymmetry or other nonlinear wave features. Model accuracy is reduced (e.g., underestimated wave heights) at large Ursell numbers (e.g., nonlinear waves in shallow water).
5. Depth-uniform current. The wave-current interaction in the model is based on a current that is constant throughout the water column; the modification of refraction and shoaling due to strong vertical gradients is not represented.
6. Linear radiation stress. Radiation stress is calculated based on linear wave theory. Contributions of wave roller effects to radiation stresses in the surf zone are neglected.
CMS-Wave
Model description
CMS-Wave is similar to STWAVE in some ways and different in other areas because it includes several additional capabilities which are specific to coastal inlets and wave-structure interaction problems. It is a phase-averaged, half- or full-plane spectral wave model for propagation of directional irregular waves over complicated coastal bathymetry where wave refraction, diffraction, reflection, shoaling, and breaking over currents occur simultaneously (Lin et al. 2008 and 2011). The model, previously called WABED (Wave-Action Balance Equation Diffraction), is part of the Coastal Modeling System (CMS) developed in the Coastal Inlets Research Program (CIRP), US Army Engineer Research and Development Center (ERDC). It solves for the Wave-Action Balance Equation using a forward-marching numerical scheme. The diffraction term is formulated from a parabolic approximation equation (Demirbilek et al. 2009 and Mase et al. 2005a).
ERDC/CHL TR-14-3 26
Capability and features
Because CMS-Wave is designed for coastal inlet applications, it has many special features for waves interacting with coastal inlet structures and adjacent beaches. These include wave reflection, various intensity of diffraction, floating breakwater, caisson, semi-permeable and non-permeable rubble mound breakwaters, which are in addition to the general features such as wind-wave generation, bottom friction, and grid nesting capabilities. Another important feature of CMS-Wave is its coupling with CMS-Flow, a circulation and sediment transport model in the CMS package, designed to simulate the morphology evolution at inlets, channels, and along beaches. For this reason, additional features such as wave run-up and overtopping on beach face and structures, wave energy damping over muddy beds, nonlinear wave-wave interactions, and spatially varying cell sizes have recently been incorporated into the model. CMS-Wave also has a rapid mode that can reduce the computational runtime when doing long term simulations. Not all of these features were used in this study. Details of these CMS-Wave-specific features are discussed in Appendix A.
Governing equations
The governing equation for both STWAVE and CMS-Wave is the wave-action balance equation. For CMS-Wave it is defined as
θ
θ(κ,σ,θ) εyx
b
C NC N C ND N S
x y
(10)
where x and y are the horizontal coordinates; Cx, Cy, and Cθ are the characteristic velocity with respect to x, y, and θ, respectively; εb is the parameterization of wave breaking energy dissipation; and S denotes additional source, Sin, and sink, Sds (e.g., wind forcing, bottom friction loss, etc.) and a nonlinear wave-wave interaction term, Snl.
The wave-action density, N, a function of frequency,σ , direction, θ , and spectral wave energy density, (σ,θ)E , is defined as
(σ,θ)σ
EN (11)
where E(σ,θ) represents the wave energy per unit water-surface area per frequency and direction interval. In the presence of an ambient current,

ERDC/CHL TR-14-3 27
the wave-action density is conserved whereas the spectral wave density is not (Bretherton and Garrett 1968; Whitham 1974).
The first term D(κ,σ,θ) on the right side of Equation (10) is the wave diffraction term developed by Mase (2001). It takes into account the effect of an ambient horizontal current on waves. In CMS-Wave it is defined as
θ θκ
(κ,σ,θ) cos cosσ
gg y yyy
CCD CC N N
2 2
2 2 (12)
where κ is an empirical parameter representing the intensity of diffraction; C and Cg are wave celerity and group velocity, respectively; and Ny and Nyy denote the first and second derivatives of N with respect to y, respectively. Wave diffraction is not modeled but simply approximated in STWAVE by a diffusion term (e.g., an arithmetically smoothed function of the wave heights at the three cells closest to the structure).
Thus, both wave diffraction and energy dissipation are included in the governing equation. Implementation of the numerical scheme in CMS-Wave is described by Mase (2001), Mase et al. (2005a), and Lin et al. (2008). Additional details on the wave theory in CMS-Wave are presented in Appendix A.
Model setup and parameters
Both STWAVE and CMS-Wave were run on the same rectangular grid using the half-plane versions of models to reduce the computational time. The same grid files and input files were used in both models. Figure 4 shows the model domain and bathymetry contours for Ambrose Channel and the mound. The model grid covers a rectangular area of 25 km × 40 km with the long axis along the Ambrose Channel. It consists of 1000 × 1600 cells with constant cell spacing of 25 m × 25 m. The Ambrose Channel Entrance is located approximately in the center of the domain with the main channel running toward the northwest corner of the grid that leads to Port of New York/New Jersey. The submerged mound is located 1 km east of the Ambrose Channel Entrance.
Figure 5 shows the bathymetry contours of the submerged mound. Wind and water level input were not included in the present modeling so the local wave generation and tides are not simulated. The vertical datum is specified as Mean Sea Level (MSL).
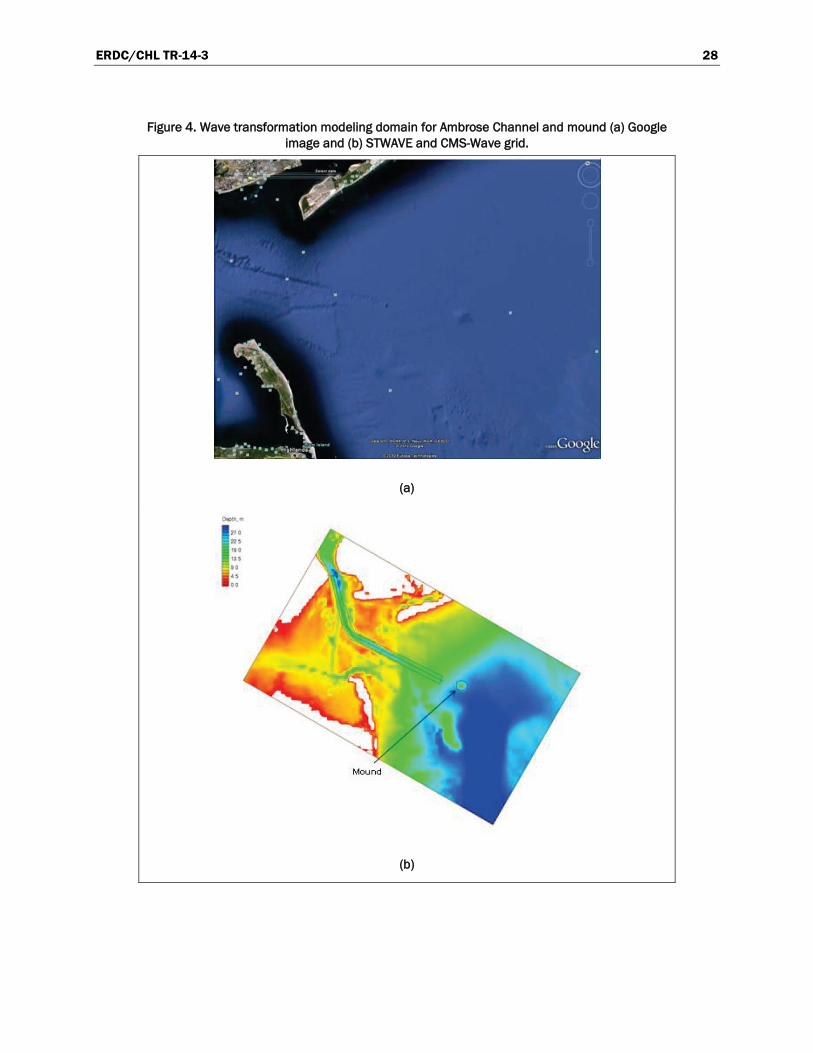
ERDC/CHL TR-14-3 28
Figure 4. Wave transformation modeling domain for Ambrose Channel and mound (a) Google image and (b) STWAVE and CMS-Wave grid.
(a)
(b)

ERDC/CHL TR-14-3 29
Figure 5. Mound reach bathymetry.
The default parameters were used (Appendix A) with the Extended Goda wave-breaking formula and a diffraction intensity of = 4. A constant Darcy-Weisbach type friction coefficient of cf = 0.005 (default value) was specified to calculate the bottom friction. Wave propagation and transformation were computed on a spectral grid of 30 frequency bins (0.04 to 0.33 Hz with 0.01 Hz increment) and 35 direction bins (covering a half-plane with 5 deg spacing). Incident wave information is provided along the sea boundary based on design wave conditions as the half-plane TMA directional spectrum. The Surface-water Modeling System (SMS) provides the interface for creating CMS-Wave and STWAVE grid which allows preparing model input parameters and generating the incident wave spectrum (Zundel 2006).
Summary
Two coastal wave transformation numerical models, STWAVE and CMS-Wave, were used to calculate wave parameters (height, period, and direction) at the entrance of the Ambrose Channel and over the mound in the vicinity. These directional spectral wave models were applied in the half-plane wave transformation mode, meaning that wave energy transformation was limited from offshore toward the coastline in a 0 to 180 deg sector of the primary incident wave direction in deep water. The reason for using two
κ
ERDC/CHL TR-14-3 30
wave models is because STWAVE is adequate for the nearshore wave transformation outside the surf zone while CMS-Wave is designed specifically for navigation channels, and inlet and bay applications involving processes where waves interact with tides, currents, navigation channels, muddy bottoms, and coastal structures such as breakwaters, jetties, spurs, and groins. The results from both models were very similar. The main purpose of the wave modeling was to evaluate the wave refraction deformation, shoaling, and wave focusing at and in the lee of a submerged mound just east of the Ambrose Channel Entrance. Wave input information was based on design wave conditions and prepared by SMS to generate directional spectrum as input at the model grid sea boundary. Results obtained from these wave models are described in Chapter 5.

ERDC/CHL TR-14-3 31
4 Ship Squat Theory
Ship squat for the lightly and fully loaded Susan Maersk containership in the Ambrose Channel and Mound ranges are compared for PIANC, Ankudinov, and CADET/BNT predictions. Because of the width of both channels, they are modeled as an “open” or unrestricted channel cross-section in this study as it is assumed that the effect of the trench will be minimal on the predicted squat, and any variability is included by using the average of all the squat predictors.
PIANC squat formulas
PIANC has many empirical formulas for predicting ship squat in entrance channels. Each formula has certain constraints based on the ship and channel conditions for which they were developed. No one formula works best for all channel and ship types. Thus, it is necessary to examine the squat predictions with more than one formula and compare the results based on the type of ship, channel, and formula constraints.
Five of the most “user friendly” and “popular” PIANC squat formulas include those of Barrass (2009), Eryuzlu et al. (1994), Huuska (1976), Römisch (1989), and Yoshimura (1986). Briggs (2006) programmed these formulas in a FORTRAN program, and PIANC (2013) provided updates. All of these formulas give predictions of bow squat (Sb), but only the Römisch method explicitly gives predictions for stern squat (Ss) for all channel types. Barrass gives Ss for unrestricted channels (U), and for canals (C), and restricted (R) channels depending on the value of CB. Of course, for channel design, maximum squat is the most important, and location at the bow or stern is not necessarily significant.
Ankudinov squat formula
The Ankudinov squat formulas are much more complicated than the PIANC squat formulas and were originally used in the Ship Tow Simulator (STS). The older versions in the STS tended to overpredict ship squat (Briggs 2009). However, recent modifications have given more realistic predictions that are comparable with the PIANC predictions (Briggs and Daggett 2009). Ankudinov squat predictions account for the effects of both ship and channel. Initial ship trim has recently been shown by

ERDC/CHL TR-14-3 32
German researchers (Härting et al. 2009) to be an important consideration in dynamic trim and resulting ship squat. Ankudinov includes mid-point sinkage and initial trim in his predictions.
Ankudinov and Jakobsen (1996) and Ankudinov et al. (1996 and 2000) proposed the MARSIM 2000 formula for maximum squat based on a midpoint sinkage Sm and vessel trim Tr in shallow water. The Ankudinov method has undergone considerable revision as new data was collected and compared. The most recent modifications from a study of ship squat in the St. Lawrence Seaway (Stocks et al. 2002) and emails and telecons in April 2009 (Ankudinov 20091) are contained in the FORTRAN programs.
The Ankudinov prediction is one of the most thorough but also the most complicated formulas for predicting ship squat. These components include factors to account for the effects of the ship and channel. The restriction on Depth Froude Number, Fnh, is for values less than or equal to 0.6. The maximum ship squat, SMax, is a function of two main components: the midpoint sinkage, Sm, and the vessel trim, Tr, given by
.Max pp m rS L S T 0 5 (13)
The SMax can be at the bow or stern depending on the value of Tr. The negative sign in the equation above is used for bow squat, Sb, and the positive sign for stern squat, Ss.
CADET sinkage and trim
Underway sinkage and trim may be provided externally by calculations or model test data and imported into CADET. Alternatively, it can be calcu-lated within CADET using the BNT (Beck, Newman, and Tuck) potential flow program by Beck et al. (1975). Although included in CADET, BNT is completely independent and stand-alone. The user has the option to import squat data from other programs as long as the input format is the same. Since channel geometry can vary from reach to reach, CADET supports the ability to define multiple sets of sinkage and trim data sets for the same ship and loading condition.
1 Per discussion via telecoms and emails with Briggs.

ERDC/CHL TR-14-3 33
The BNT sinkage and trim prediction program is based on early work by Tuck (1966), investigating the dynamics of a slender ship in shallow water at various speeds for an infinitely wide channel and for a finite width channel such as a canal (Tuck 1967). This work was expanded to include a typically dredged channel with a finite-width inner channel of a certain depth and an infinitely wide outside channel of shallower depth (Beck et al. 1975).
Figure 6 is a schematic of the simplified channel cross-section used in BNT. In addition to the automatically specified inside-channel depth, H, the user has the option to include the channel width, W, and outside channel depth, Hout (i.e., similar to PIANC hT trench height for restricted channels but measured from the water surface to the top of the trench). For unrestricted channel applications, the user can input “-1” in the Hout input space to automatically ensure that the outer depths are equivalent to the inner channel depths regardless of depth increment.
Figure 6. BNT channel geometry variables.
In his early work, Tuck (1966) calculated the dynamic pressure of slender ships in finite-water depth and infinite- and finite-water width by modeling the underwater area of the hull. This underwater area was defined by the 21 equally spaced stations along the ship’s length. Therefore, the ship’s geometry file, draft, speeds, and water depths are used in the BNT squat calculations. Within this analysis, the fluid is assumed to be inviscid and irrotational and the hull long and slender. Input hull definition is provided in terms of the waterline beam and sectional area at 20 stations along the hull. The dynamic pressure is obtained for each Depth Froude Number Fnh by differentiating the velocity potential along the length of the hull. The sinkage and trim predictions are obtained from the dynamic pressure by calculating the vertical force and pitching moment which are translated to vertical sinkage and trim angle. The proper use of this BNT program
ERDC/CHL TR-14-3 34
requires that channel depths be of the same order as the draft of the ship, therefore satisfying the shallow-water approximations assumed in Tuck (1966).
The BNT program produces tabular listings and plots of midship sinkage, SMid, and trim, TR, as a function of Fnh. Sinkage is measured in ft, positive for downward movement. Trim in ft is the difference between sinkage at the bow and stern, positive for bow down. The equivalent bow, Sb, and stern, Ss, squat are given by
. ( ). ( )
b Mid R
s Mid R
S S TS S T
0 50 5
(14)
This is a simplistic representation of the squat at the bow and stern as it assumes they are equally distant from the midpoint of the ship. In CADET, the squat is calculated for the actual distances to individual control points.
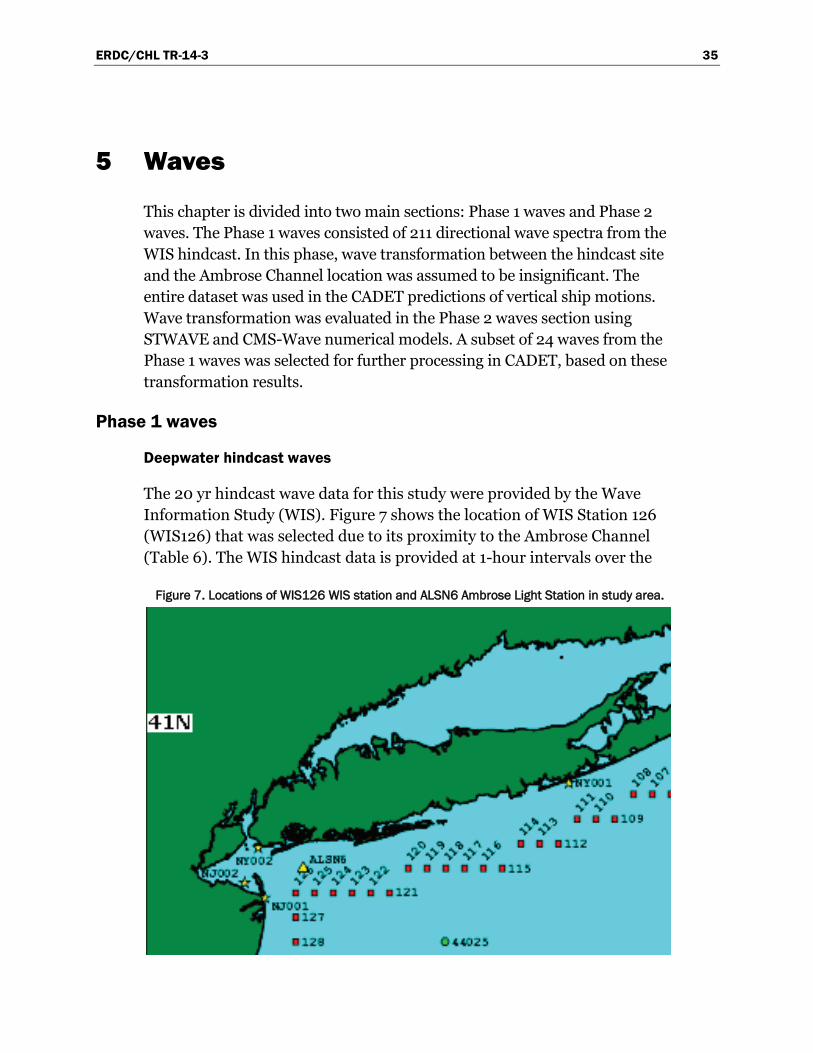
ERDC/CHL TR-14-3 35
5 Waves
This chapter is divided into two main sections: Phase 1 waves and Phase 2 waves. The Phase 1 waves consisted of 211 directional wave spectra from the WIS hindcast. In this phase, wave transformation between the hindcast site and the Ambrose Channel location was assumed to be insignificant. The entire dataset was used in the CADET predictions of vertical ship motions. Wave transformation was evaluated in the Phase 2 waves section using STWAVE and CMS-Wave numerical models. A subset of 24 waves from the Phase 1 waves was selected for further processing in CADET, based on these transformation results.
Phase 1 waves
Deepwater hindcast waves
The 20 yr hindcast wave data for this study were provided by the Wave Information Study (WIS). Figure 7 shows the location of WIS Station 126 (WIS126) that was selected due to its proximity to the Ambrose Channel (Table 6). The WIS hindcast data is provided at 1-hour intervals over the
Figure 7. Locations of WIS126 WIS station and ALSN6 Ambrose Light Station in study area.

ERDC/CHL TR-14-3 36
Table 6. Wave climate information.
Source Years Depth (ft)
Latitude (deg N)
Longitude (deg W)
WIS126 1980-1999 68.9 40.42 -73.83
20 yr time period. It includes significant wave height, Hs, peak period, Tp, and peak direction, θp. The θp represents the dominant wave direction for wave energy within the frequency band of peak energy. Wave directions in degrees are directions from which the waves are traveling, the same as meteorological conventions.
Figure 8 is a percent occurrence histogram of wave direction, period, and height. Direction bands are in 22.5 deg increments from 0 to 360 deg. The numbers on top of the bars are the percentages or number of occurrences, and the numbers on the bottom of the bars are the mean values. The total number of points for this dataset is 175,310. The most common wave direc-tion, with 21.3 percent (37,347) of the cases, is between 168.8 and 191.3 deg with a mean of 178.4 deg. The overall mean-wave direction is 164.1 deg.
Figure 8. WIS126 percent occurrence histogram of wave direction, period, and height, 1980 to 1999.
1.4
2.8
4.7
6.8
8.7
10.7
12.9
14.8
17.6
20.8
0.0
2.0
4.0
6.0
8.0
10.0
12.0
14.0
16.0
20.0
30.0
Wav
e H
eigh
t (ft
) 39.545.3
11.62.5 0.7 0.2 0.1 0.0 0.0 0.0
4.0
6.0
7.7
9.5
11.7
14.3
16.7
18.8
0.0
5.0
7.0
9.0
11.0
13.0
15.0
17.0
23.0W
ave
Peri
od (s
ec)
75.9
10.5 6.6 4.2 2.6 0.2 0.0 0.0
359
9
22.3
46.2
69.3
91.4
112.
8
135.
0
158.
5
178.
4
199.
8
224.
2
247.
6
270.
7
293.
2
314.
9
336.
6
348.
8
11.3
33.8
56.3
78.8
101.
3
123.
8
146.
3
168.
8
191.
3
213.
8
236.
3
258.
8
281.
3
303.
8
326.
3
348.
8
Wav
e D
irec
tion
(deg
)
1.5 1.4 1.9 3.69.7 11.6 11.6
16.121.3
5.32.0 1.7 2.4 3.4 3.3 3.0
Percent Occurrence
ERDC/CHL TR-14-3 37
Wave periods range from 1 to 23 sec with variable band limits. The most commonly occurring wave-period band, with 75.9 percent (132,976) of the cases, is from 1 to 5 sec with a mean of 4.0 sec. The overall mean wave period is 4.9 sec. Significant wave heights range from 0 to 22 ft with variable band limits. The most common wave height, with 45.3 percent (79,439) of the cases, is from 2 to 4 ft with a mean of 2.8 ft. The overall mean-wave height is 2.6 ft. The largest significant wave height is 21.3 ft with corresponding peak period of 12.5 sec and wave direction of 91.4 deg. However, this is a very rare occurrence.
Figure 9a is a rose of Hs that illustrates the percentage of waves coming from different directions. Figure 9b is a similar rose for Tp. The length of the radial bars indicates the percentage from that particular wave direction. Thicker bars represent smaller Hs or Tp bands. The lowest bands are shown nearest the center of the rose. The radial bars become narrower toward the outer end of each bar indicating increasing wave heights or periods.
Joint probability distributions
The next step in the Phase 1 wave processing was to separate the data into joint probability or percent occurrence tables of Tp vs. Hs for a realistic set of direction bands. Because of the angle of the shore, wave directions outside the range of 56.25 to 213.75 deg would not impact the Ambrose Channel, so the set of direction bands was reduced. The total number of observations for the entire 20 yr hindcast dataset is 175,310. The limited dataset has 79.3 percent of these observations, or 139,071 observations. Table 7 summarizes the lower, upper, and mid-point direction band limits for the seven 22.5 deg direction bands. The number of observations and the percent of the limited and total dataset are also listed for each band.
The Tp vs. Hs percent occurrence tables for each of the ten direction bands are contained in Appendix B (top table is the percent occurrence in the band, and the bottom table lists the corresponding number of occurrences). From these joint probability distributions of wave period and wave height, wave parameter statistics were gathered for generating empirical directional wave spectra representative of the WIS126 deepwater data.
A total of 211 different combinations of Tp, Hs, and θp were obtained. The ranges for these parameters were as follows:
• 3.7 sec ≤ Tp ≤ 16.7 sec • 2.7 ft ≤ Hs ≤ 20.8 ft • 67.5 deg ≤ θp ≤ 202.5 deg
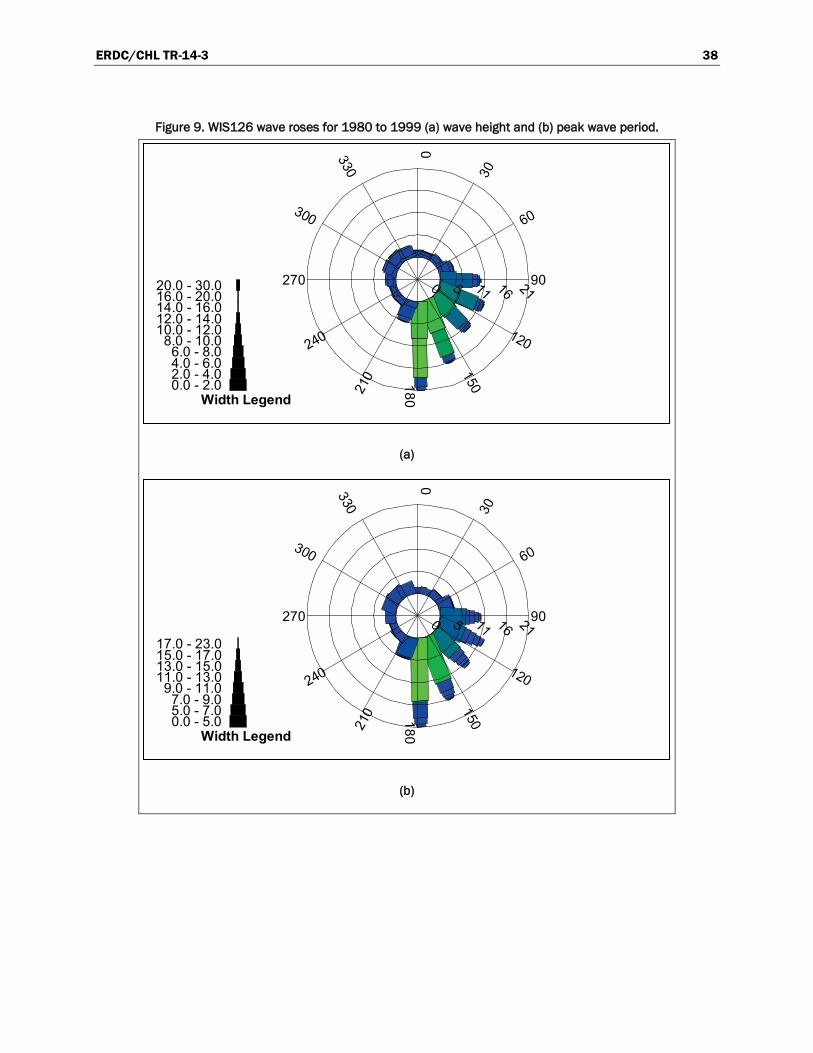
ERDC/CHL TR-14-3 38
Figure 9. WIS126 wave roses for 1980 to 1999 (a) wave height and (b) peak wave period.
(a)
(b)
0.0 - 2.02.0 - 4.04.0 - 6.06.0 - 8.0
8.0 - 10.010.0 - 12.012.0 - 14.014.0 - 16.016.0 - 20.020.0 - 30.0
Width Legend
90
60
30
0330
300
270
24021
0 180
150120
0 5 11 16 21
0.0 - 5.05.0 - 7.07.0 - 9.0
9.0 - 11.011.0 - 13.013.0 - 15.015.0 - 17.017.0 - 23.0
Width Legend
90
60
30
0330
300
270
240
210 180
150
120
0 5 11 16 21

ERDC/CHL TR-14-3 39
Table 7. Band limits on wave direction.
Band No.
Direction band limits, deg No. Observations
Percent
Lower Upper Middle Limited Total
1 56.25 78.74 67.5 6,324 4.5% 3.6%
2 78.75 101.24 90.0 17,044 12.3% 9.7%
3 101.25 123.74 112.5 20,398 14.7% 11.6%
4 123.75 146.24 135.0 20,324 14.6% 11.6%
5 146.25 168.74 157.5 28,310 20.4% 16.1%
6 168.75 191.24 180.0 37,347 26.9% 21.3%
7 191.25 213.74 202.5 9,324 6.7% 5.3%
Notes: 1. Direction bands were 22.5 deg wide. 2. Total number of observations = 175,310. 3. Total number of observations within direction band limits = 139,071 or 79.3 percent of total. 4. Did not include observations if less than 0.05 percent (i.e., 0.0005) of total. 5. Minimum number of occurrences to keep based on total observations = 88 (70 for direction-limited).
Wave bins that had less than 0.05 percent (i.e., 0.0005) of the total number of occurrences were eliminated as these represent very rare events on both low and high ends of the dataset. With the elimination of these rare occurrences and including all the very low wave energy days, a total of 208 days per year (57 percent of a year) are considered “calm” days. During these days, wave-induced vertical ship motions are insignificant and will not impact the available UKCNet in the Ambrose Entrance Channel.
Directional wave spectra
The final step in the process for the Phase 1 waves was to generate a directional wave spectra using a TMA frequency spectrum and a cosn spreading function. Spectral frequencies ranged from 0.01 Hz to 0.50 Hz in 0.01 Hz intervals to cover frequencies corresponding to one half to three times the peak frequency. Because of directional spreading and CADET requirements, the full circle of 360 deg was modeled in 15 deg increments. Spectral wave parameters were selected for each wave based on wave period, a standard approach for CHL studies. For the TMA spectrum, frequency spreading is a function of the γ parameter that varied between 3.3 (broad) to 8 (narrow). For the directional cosn spreading function, the n parameter ranged from 4 (broad) to 30 (narrow). These spectra formed the incident wave input at the beginning of the Entrance Reach 1 and the mound Reach 2 in the Ambrose Channel.

ERDC/CHL TR-14-3 40
Since the wave cases in Phase 1 were assumed to experience no transforma-tion between the WIS126 buoy and the beginning of the channel and mound reaches, wave heights in both reaches had the same values for each wave case. Appendix C contains tables of the wave parameters, probabilities, and corresponding days per year for each of the 211 wave conditions in Phase 1.
Phase 2 waves
The main purpose of the Phase 2 waves was to evaluate the significance of wave transformation from the WIS126 hindcast site on the incident wave properties at the entrance and mound reaches. A secondary concern in Phase 2 was to evaluate any potential differences in incident wave condi-tions between the hindcast WIS126 waves and the measured NOAA Buoy 44025 waves (Figure 7). In other words, was there any reason to suspect one site represented a more realistic source of actual wave conditions in Ambrose Channel? Finally, many of the waves in Phase 1 were very small or extremely large. The small waves would not have any effect on wave-induced ship motions and the large waves represent very rare extreme events that would be avoided by the pilots. Therefore, both of these wave types could be eliminated from further investigation. Based on these reasons, it was decided to reduce the number of waves in Phase 1 and examine the magnitude of wave transformation, especially the relative differences between the channel and mound reaches.
Preliminary STWAVE and CMS-Wave comparisons
Wave transformation was evaluated using two different numerical models to make sure no significant transformation between the offshore sites was overlooked due to resolution issues. Both STWAVE and CMS-Wave grids (Chapter 3) were constructed to compare WIS126 and NOAA 44025 wave conditions and wave transformation to the channel and mound reaches.
Initially, 39 wave conditions from Phase 1 were selected for further study based on cases that indicated grounding in either the channel or mound reaches. Grounding was defined for the fully loaded, inbound ship at a speed of 12 kt due to vertical, wave-induced ship motions without ship squat or any requirement to maintain a minimum net underkeel clearance, UKCMin, of 2 ft in the channel and 4 ft in the mound reach.
Since many of these cases fall into groups with the same wave period and direction, it was decided to further reduce this set of 39 waves to a subset
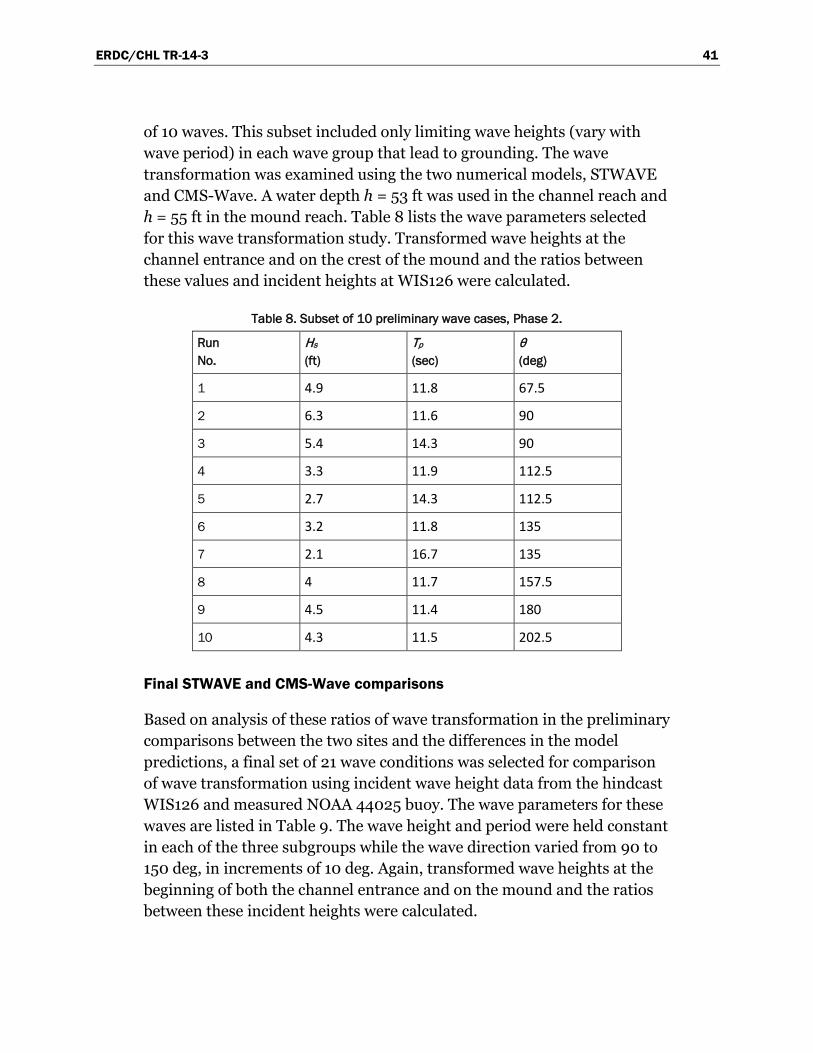
ERDC/CHL TR-14-3 41
of 10 waves. This subset included only limiting wave heights (vary with wave period) in each wave group that lead to grounding. The wave transformation was examined using the two numerical models, STWAVE and CMS-Wave. A water depth h = 53 ft was used in the channel reach and h = 55 ft in the mound reach. Table 8 lists the wave parameters selected for this wave transformation study. Transformed wave heights at the channel entrance and on the crest of the mound and the ratios between these values and incident heights at WIS126 were calculated.
Table 8. Subset of 10 preliminary wave cases, Phase 2.
Run No.
Hs (ft)
Tp (sec)
θ (deg)
1 4.9 11.8 67.5
2 6.3 11.6 90
3 5.4 14.3 90
4 3.3 11.9 112.5
5 2.7 14.3 112.5
6 3.2 11.8 135
7 2.1 16.7 135
8 4 11.7 157.5
9 4.5 11.4 180
10 4.3 11.5 202.5
Final STWAVE and CMS-Wave comparisons
Based on analysis of these ratios of wave transformation in the preliminary comparisons between the two sites and the differences in the model predictions, a final set of 21 wave conditions was selected for comparison of wave transformation using incident wave height data from the hindcast WIS126 and measured NOAA 44025 buoy. The wave parameters for these waves are listed in Table 9. The wave height and period were held constant in each of the three subgroups while the wave direction varied from 90 to 150 deg, in increments of 10 deg. Again, transformed wave heights at the beginning of both the channel entrance and on the mound and the ratios between these incident heights were calculated.
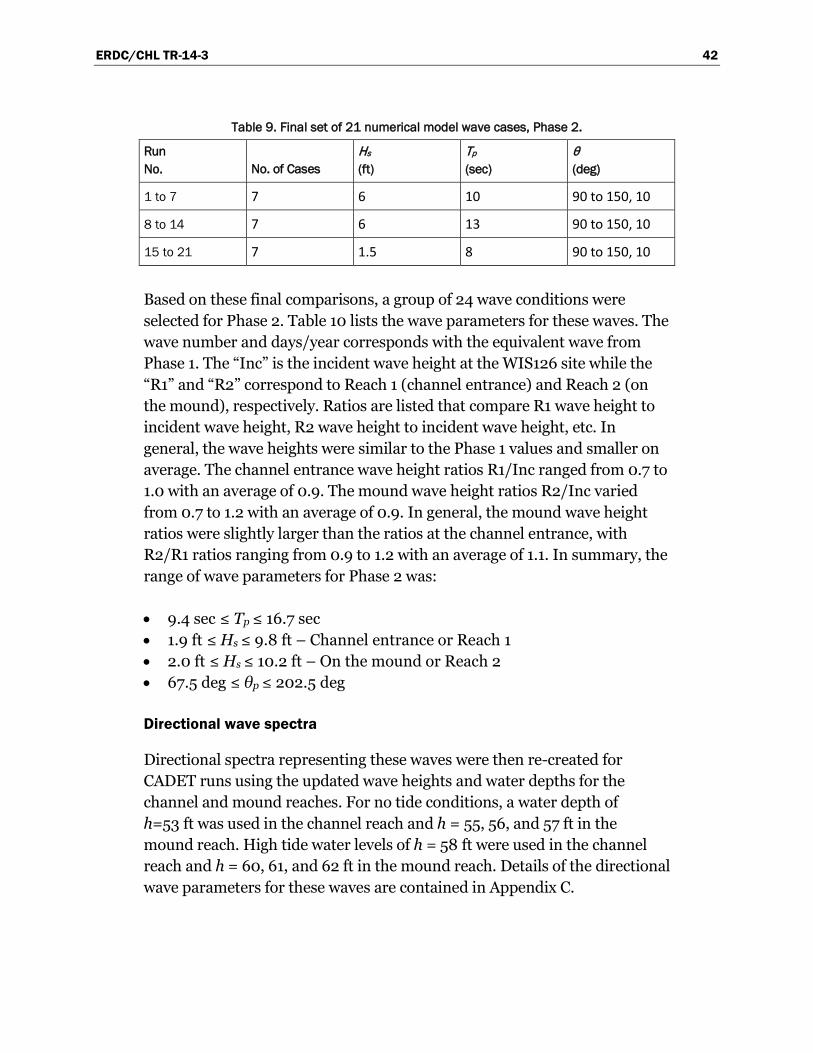
ERDC/CHL TR-14-3 42
Table 9. Final set of 21 numerical model wave cases, Phase 2.
Run No. No. of Cases
Hs (ft)
Tp (sec)
θ (deg)
1 to 7 7 6 10 90 to 150, 10
8 to 14 7 6 13 90 to 150, 10
15 to 21 7 1.5 8 90 to 150, 10
Based on these final comparisons, a group of 24 wave conditions were selected for Phase 2. Table 10 lists the wave parameters for these waves. The wave number and days/year corresponds with the equivalent wave from Phase 1. The “Inc” is the incident wave height at the WIS126 site while the “R1” and “R2” correspond to Reach 1 (channel entrance) and Reach 2 (on the mound), respectively. Ratios are listed that compare R1 wave height to incident wave height, R2 wave height to incident wave height, etc. In general, the wave heights were similar to the Phase 1 values and smaller on average. The channel entrance wave height ratios R1/Inc ranged from 0.7 to 1.0 with an average of 0.9. The mound wave height ratios R2/Inc varied from 0.7 to 1.2 with an average of 0.9. In general, the mound wave height ratios were slightly larger than the ratios at the channel entrance, with R2/R1 ratios ranging from 0.9 to 1.2 with an average of 1.1. In summary, the range of wave parameters for Phase 2 was:
• 9.4 sec ≤ Tp ≤ 16.7 sec • 1.9 ft ≤ Hs ≤ 9.8 ft – Channel entrance or Reach 1 • 2.0 ft ≤ Hs ≤ 10.2 ft – On the mound or Reach 2 • 67.5 deg ≤ θp ≤ 202.5 deg
Directional wave spectra
Directional spectra representing these waves were then re-created for CADET runs using the updated wave heights and water depths for the channel and mound reaches. For no tide conditions, a water depth of h=53 ft was used in the channel reach and h = 55, 56, and 57 ft in the mound reach. High tide water levels of h = 58 ft were used in the channel reach and h = 60, 61, and 62 ft in the mound reach. Details of the directional wave parameters for these waves are contained in Appendix C.
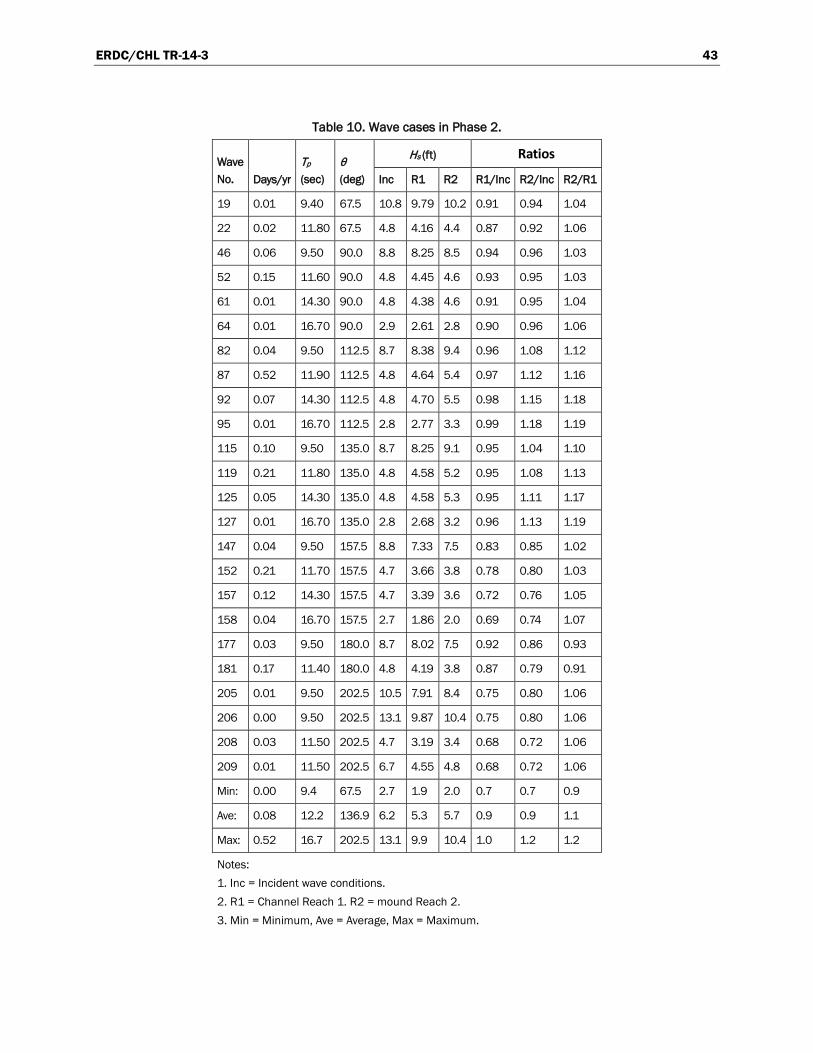
ERDC/CHL TR-14-3 43
Table 10. Wave cases in Phase 2.
Wave No. Days/yr
Tp (sec)
θ (deg)
Hs (ft) Ratios
Inc R1 R2 R1/Inc R2/Inc R2/R1
19 0.01 9.40 67.5 10.8 9.79 10.2 0.91 0.94 1.04
22 0.02 11.80 67.5 4.8 4.16 4.4 0.87 0.92 1.06
46 0.06 9.50 90.0 8.8 8.25 8.5 0.94 0.96 1.03
52 0.15 11.60 90.0 4.8 4.45 4.6 0.93 0.95 1.03
61 0.01 14.30 90.0 4.8 4.38 4.6 0.91 0.95 1.04
64 0.01 16.70 90.0 2.9 2.61 2.8 0.90 0.96 1.06
82 0.04 9.50 112.5 8.7 8.38 9.4 0.96 1.08 1.12
87 0.52 11.90 112.5 4.8 4.64 5.4 0.97 1.12 1.16
92 0.07 14.30 112.5 4.8 4.70 5.5 0.98 1.15 1.18
95 0.01 16.70 112.5 2.8 2.77 3.3 0.99 1.18 1.19
115 0.10 9.50 135.0 8.7 8.25 9.1 0.95 1.04 1.10
119 0.21 11.80 135.0 4.8 4.58 5.2 0.95 1.08 1.13
125 0.05 14.30 135.0 4.8 4.58 5.3 0.95 1.11 1.17
127 0.01 16.70 135.0 2.8 2.68 3.2 0.96 1.13 1.19
147 0.04 9.50 157.5 8.8 7.33 7.5 0.83 0.85 1.02
152 0.21 11.70 157.5 4.7 3.66 3.8 0.78 0.80 1.03
157 0.12 14.30 157.5 4.7 3.39 3.6 0.72 0.76 1.05
158 0.04 16.70 157.5 2.7 1.86 2.0 0.69 0.74 1.07
177 0.03 9.50 180.0 8.7 8.02 7.5 0.92 0.86 0.93
181 0.17 11.40 180.0 4.8 4.19 3.8 0.87 0.79 0.91
205 0.01 9.50 202.5 10.5 7.91 8.4 0.75 0.80 1.06
206 0.00 9.50 202.5 13.1 9.87 10.4 0.75 0.80 1.06
208 0.03 11.50 202.5 4.7 3.19 3.4 0.68 0.72 1.06
209 0.01 11.50 202.5 6.7 4.55 4.8 0.68 0.72 1.06
Min: 0.00 9.4 67.5 2.7 1.9 2.0 0.7 0.7 0.9
Ave: 0.08 12.2 136.9 6.2 5.3 5.7 0.9 0.9 1.1
Max: 0.52 16.7 202.5 13.1 9.9 10.4 1.0 1.2 1.2
Notes: 1. Inc = Incident wave conditions. 2. R1 = Channel Reach 1. R2 = mound Reach 2. 3. Min = Minimum, Ave = Average, Max = Maximum.

ERDC/CHL TR-14-3 44
Summary
In Phase 1, a joint probability distribution of wave height and period was created in seven 22.5-deg direction bands from 56.25 to 213.74 deg. It consisted of 139,071 observations representing 79.3 percent of the deepwater data from the WIS 20 yr hindcast buoy WIS126. A total of 211 empirical directional wave spectra were created from this joint probability distribution. Parameters for these directional spectra were based on wave period and height for a TMA frequency spectrum and cosn directional spreading function.
In Phase 2, a subset of 24 directional wave spectra were simulated from the Phase 1 dataset based on an analysis of wave transformation between the offshore WIS126 hindcast site and the beginning of the channel entrance and top of mound reaches. The wave transformation was performed using both STWAVE and CMS-Wave numerical models. Incident waves in this study were obtained from two sources: WIS126 station and NOAA Buoy 44025.
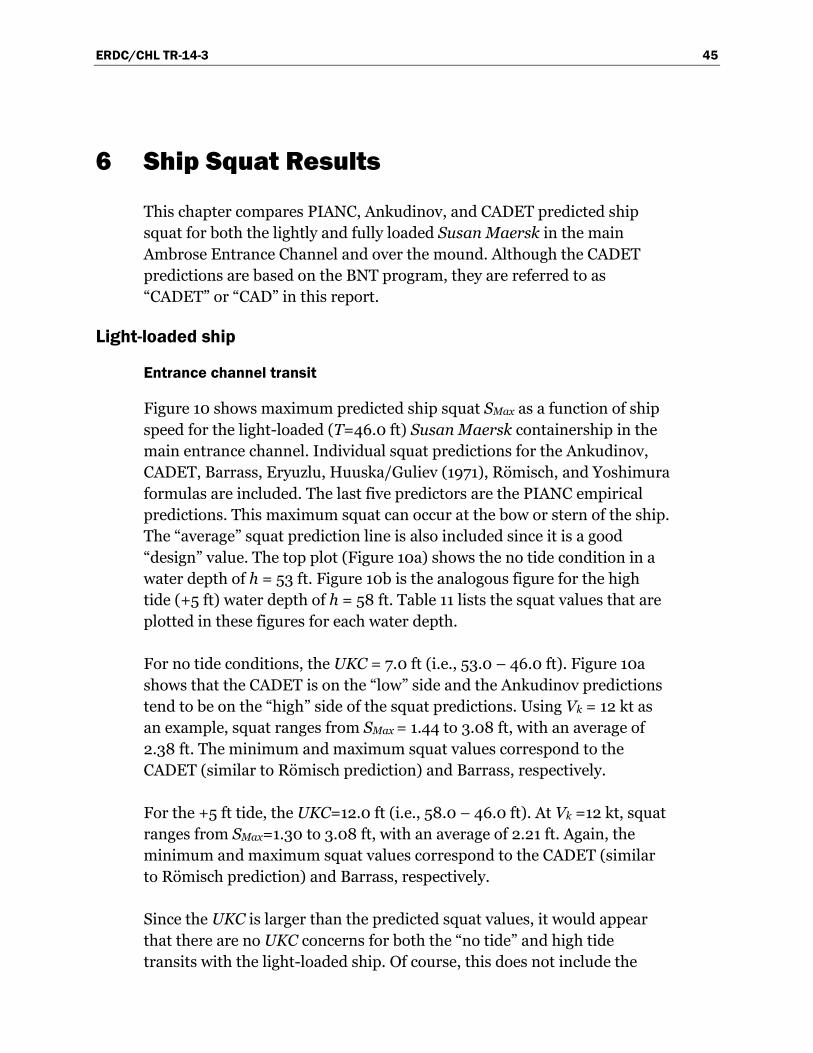
ERDC/CHL TR-14-3 45
6 Ship Squat Results
This chapter compares PIANC, Ankudinov, and CADET predicted ship squat for both the lightly and fully loaded Susan Maersk in the main Ambrose Entrance Channel and over the mound. Although the CADET predictions are based on the BNT program, they are referred to as “CADET” or “CAD” in this report.
Light-loaded ship
Entrance channel transit
Figure 10 shows maximum predicted ship squat SMax as a function of ship speed for the light-loaded (T=46.0 ft) Susan Maersk containership in the main entrance channel. Individual squat predictions for the Ankudinov, CADET, Barrass, Eryuzlu, Huuska/Guliev (1971), Römisch, and Yoshimura formulas are included. The last five predictors are the PIANC empirical predictions. This maximum squat can occur at the bow or stern of the ship. The “average” squat prediction line is also included since it is a good “design” value. The top plot (Figure 10a) shows the no tide condition in a water depth of h = 53 ft. Figure 10b is the analogous figure for the high tide (+5 ft) water depth of h = 58 ft. Table 11 lists the squat values that are plotted in these figures for each water depth.
For no tide conditions, the UKC = 7.0 ft (i.e., 53.0 – 46.0 ft). Figure 10a shows that the CADET is on the “low” side and the Ankudinov predictions tend to be on the “high” side of the squat predictions. Using Vk = 12 kt as an example, squat ranges from SMax = 1.44 to 3.08 ft, with an average of 2.38 ft. The minimum and maximum squat values correspond to the CADET (similar to Römisch prediction) and Barrass, respectively.
For the +5 ft tide, the UKC=12.0 ft (i.e., 58.0 – 46.0 ft). At Vk =12 kt, squat ranges from SMax=1.30 to 3.08 ft, with an average of 2.21 ft. Again, the minimum and maximum squat values correspond to the CADET (similar to Römisch prediction) and Barrass, respectively.
Since the UKC is larger than the predicted squat values, it would appear that there are no UKC concerns for both the “no tide” and high tide transits with the light-loaded ship. Of course, this does not include the
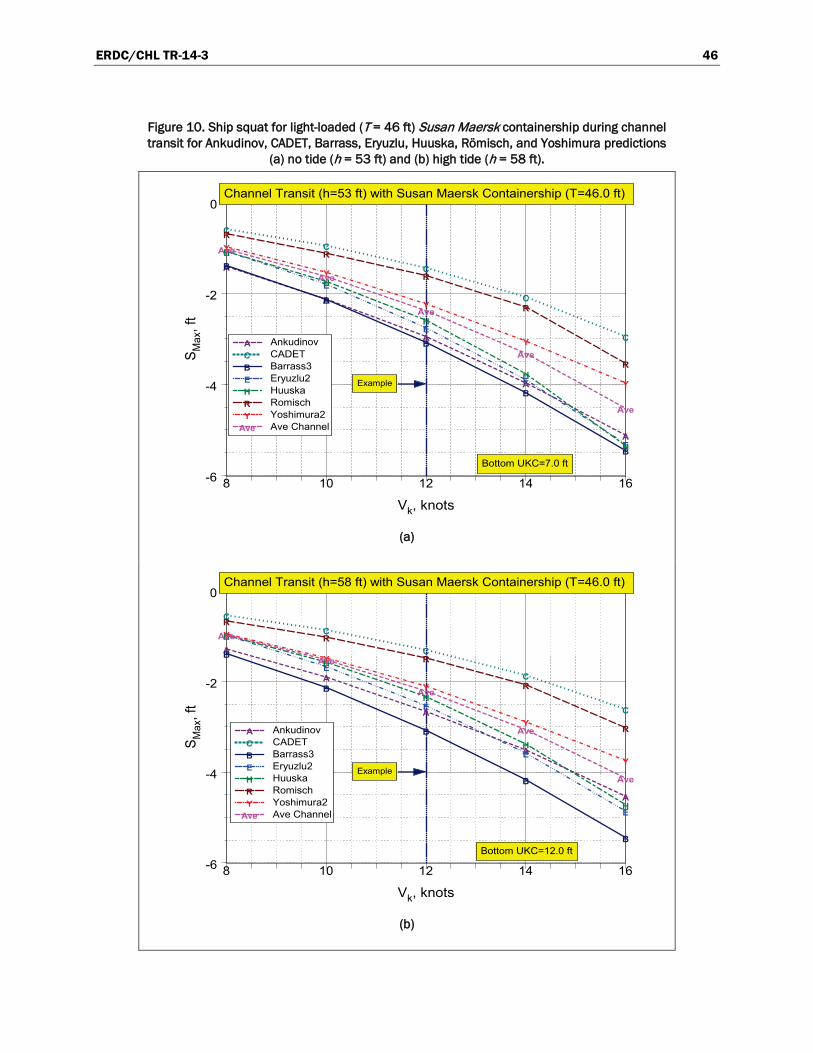
ERDC/CHL TR-14-3 46
Figure 10. Ship squat for light-loaded (T = 46 ft) Susan Maersk containership during channel transit for Ankudinov, CADET, Barrass, Eryuzlu, Huuska, Römisch, and Yoshimura predictions
(a) no tide (h = 53 ft) and (b) high tide (h = 58 ft).
(a)
(b)
8 10 12 14 16
Vk, knots
-6
-4
-2
0S M
ax, f
t
A AnkudinovC CADETB Barrass3E Eryuzlu2H HuuskaR RomischY Yoshimura2
Ave Ave Channel
Bottom UKC=7.0 ft
Example
Channel Transit (h=53 ft) with Susan Maersk Containership (T=46.0 ft)
A
A
A
A
A
C
C
C
C
C
B
B
B
B
B
E
E
E
E
E
H
H
H
H
H
R
R
R
R
R
Y
Y
Y
Y
Y
Ave
Ave
Ave
Ave
Ave
8 10 12 14 16
Vk, knots
-6
-4
-2
0
S Max
, ft
A AnkudinovC CADETB Barrass3E Eryuzlu2H HuuskaR RomischY Yoshimura2
Ave Ave Channel
Bottom UKC=12.0 ft
Example
Channel Transit (h=58 ft) with Susan Maersk Containership (T=46.0 ft)
A
A
A
A
A
CC
C
C
C
B
B
B
B
B
E
E
E
E
E
H
H
H
H
H
R
R
R
R
R
Y
Y
Y
Y
Y
Ave
Ave
Ave
Ave
Ave

ERDC/CHL TR-14-3 47
Table 11. Ship squat predictions for light-loaded Susan Maersk in Ambrose Channel.
Spd (kt)
Ank (ft)
CAD (ft)
B3 (ft)
E2 (ft)
Hus (ft)
Röm (ft)
Yosh (ft)
SAve (ft)
SMin (ft)
SMax (ft)
h=53 ft
8 1.41 0.59 1.38 1.08 1.08 0.69 0.98 1.03 0.59 1.41
10 2.13 0.95 2.13 1.80 1.74 1.12 1.54 1.63 0.95 2.13
12 2.95 1.44 3.08 2.76 2.59 1.61 2.23 2.38 1.44 3.08
14 3.97 2.08 4.17 3.90 3.77 2.30 3.05 3.32 2.08 4.17
16 5.12 2.95 5.45 5.31 5.35 3.54 3.97 4.53 2.95 5.45
h=58 ft
8 1.28 0.54 1.38 0.98 0.98 0.66 0.95 0.97 0.54 1.38
10 1.90 0.86 2.13 1.67 1.57 1.02 1.48 1.52 0.86 2.13
12 2.66 1.30 3.08 2.53 2.33 1.48 2.10 2.21 1.30 3.08
14 3.51 1.86 4.17 3.58 3.38 2.07 2.89 3.06 1.86 4.17
16 4.53 2.61 5.45 4.86 4.72 3.02 3.74 4.13 2.61 5.45
Notes: Ank = Ankudinov CAD = CADET B3 = Barrass version 3 E2 = Eryuzlu version 2 Hus = Huuska/Guliev Röm = Römisch Yosh = Yoshimura SAve, SMin, SMax = Average, minimum, and maximum of all 7 squat predictions
required UKCMin and wave-induced vertical motions for heave, pitch, and roll. These will be discussed in the next chapter and, of course, will reduce the final UKCNet. Also, note that the Barrass predictions do not change as the tide level changes (i.e., fixed 3.08 ft prediction) since this predictor does not incorporate water depth as a parameter in an open or unrestricted channel.
Mound transit
Figure 11 is the analogous figure for mound transits with no tide and +5 ft high tide water depths of h = 55 and 60 ft, respectively. Table 12 lists the corresponding squat values for the light-loaded Susan Maersk at these two water depths over the mound. In general, one can expect the ship squat to be slightly smaller for the mound transits because of the deeper water depths required to accommodate the additional 2 ft underkeel clearance for hard bottom compared to the channel with soft bottom.

ERDC/CHL TR-14-3 48
Figure 11. Ship squat for light-loaded (T = 46 ft) Susan Maersk containership during mound transit for Ankudinov, CADET, Barrass, Eryuzlu, Huuska, Römisch, and Yoshimura predictions
(a) no tide (h = 55 ft) and (b) high tide (h = 60 ft).
(a)
(b)
8 10 12 14 16
Vk, knots
-6
-4
-2
0S
Max
, ft
A AnkudinovC CADETB Barrass3E Eryuzlu2H HuuskaR RomischY Yoshimura2
Ave Ave Mound
Bottom UKC=9.0 ft
Example
Mound Transit (h=55 ft) with Susan Maersk Containership (T=46.0 ft)
A
A
A
A
A
C
C
C
C
C
B
B
B
B
B
E
E
E
E
E
H
H
H
H
H
R
R
R
R
R
Y
Y
Y
Y
Y
Ave
Ave
Ave
Ave
Ave
8 10 12 14 16
Vk, knots
-6
-4
-2
0
SM
ax, f
t
A AnkudinovC CADETB Barrass3E Eryuzlu2H HuuskaR RomischY Yoshimura2
Ave Ave Mound
Bottom UKC=14.0 ft
Example
Mound Transit (h=60 ft) with Susan Maersk Containership (T=46.0 ft)
A
A
A
A
A
CC
C
C
C
B
B
B
B
B
E
E
E
E
E
H
H
H
H
H
R
R
R
R
R
Y
Y
Y
Y
Y
Ave
Ave
Ave
Ave
Ave
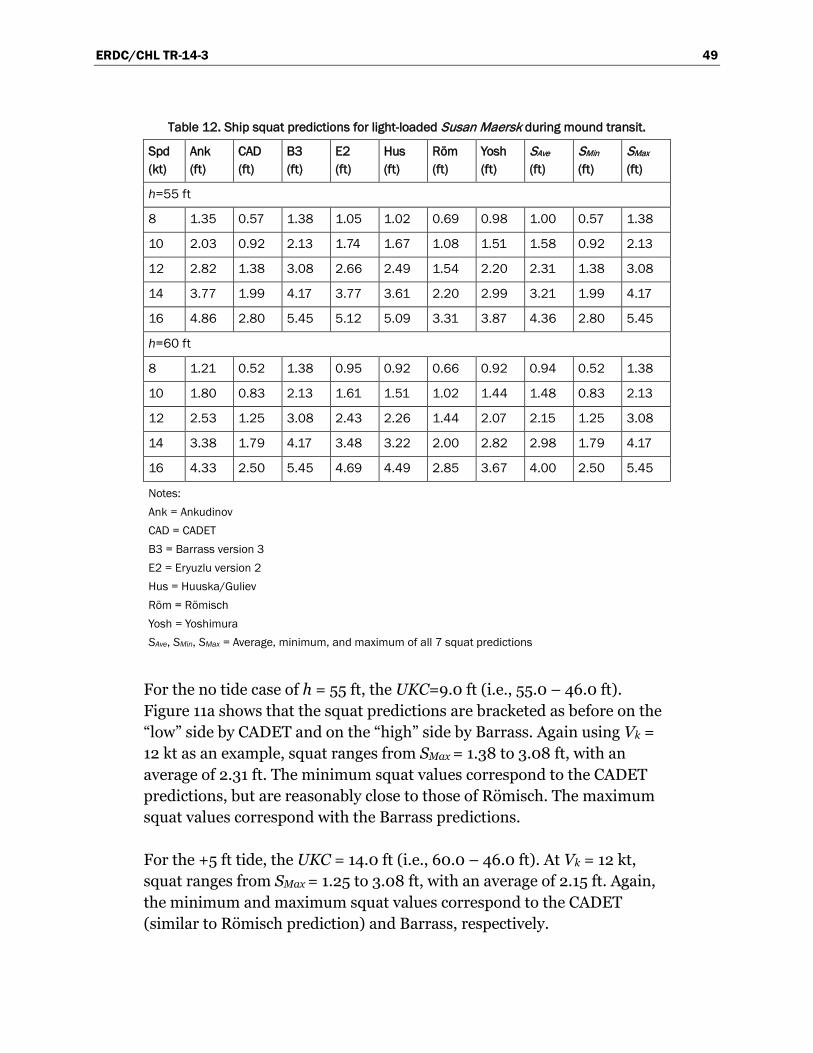
ERDC/CHL TR-14-3 49
Table 12. Ship squat predictions for light-loaded Susan Maersk during mound transit.
Spd (kt)
Ank (ft)
CAD (ft)
B3 (ft)
E2 (ft)
Hus (ft)
Röm (ft)
Yosh (ft)
SAve (ft)
SMin (ft)
SMax (ft)
h=55 ft
8 1.35 0.57 1.38 1.05 1.02 0.69 0.98 1.00 0.57 1.38
10 2.03 0.92 2.13 1.74 1.67 1.08 1.51 1.58 0.92 2.13
12 2.82 1.38 3.08 2.66 2.49 1.54 2.20 2.31 1.38 3.08
14 3.77 1.99 4.17 3.77 3.61 2.20 2.99 3.21 1.99 4.17
16 4.86 2.80 5.45 5.12 5.09 3.31 3.87 4.36 2.80 5.45
h=60 ft
8 1.21 0.52 1.38 0.95 0.92 0.66 0.92 0.94 0.52 1.38
10 1.80 0.83 2.13 1.61 1.51 1.02 1.44 1.48 0.83 2.13
12 2.53 1.25 3.08 2.43 2.26 1.44 2.07 2.15 1.25 3.08
14 3.38 1.79 4.17 3.48 3.22 2.00 2.82 2.98 1.79 4.17
16 4.33 2.50 5.45 4.69 4.49 2.85 3.67 4.00 2.50 5.45
Notes: Ank = Ankudinov CAD = CADET B3 = Barrass version 3 E2 = Eryuzlu version 2 Hus = Huuska/Guliev Röm = Römisch Yosh = Yoshimura SAve, SMin, SMax = Average, minimum, and maximum of all 7 squat predictions
For the no tide case of h = 55 ft, the UKC=9.0 ft (i.e., 55.0 – 46.0 ft). Figure 11a shows that the squat predictions are bracketed as before on the “low” side by CADET and on the “high” side by Barrass. Again using Vk = 12 kt as an example, squat ranges from SMax = 1.38 to 3.08 ft, with an average of 2.31 ft. The minimum squat values correspond to the CADET predictions, but are reasonably close to those of Römisch. The maximum squat values correspond with the Barrass predictions.
For the +5 ft tide, the UKC = 14.0 ft (i.e., 60.0 – 46.0 ft). At Vk = 12 kt, squat ranges from SMax = 1.25 to 3.08 ft, with an average of 2.15 ft. Again, the minimum and maximum squat values correspond to the CADET (similar to Römisch prediction) and Barrass, respectively.
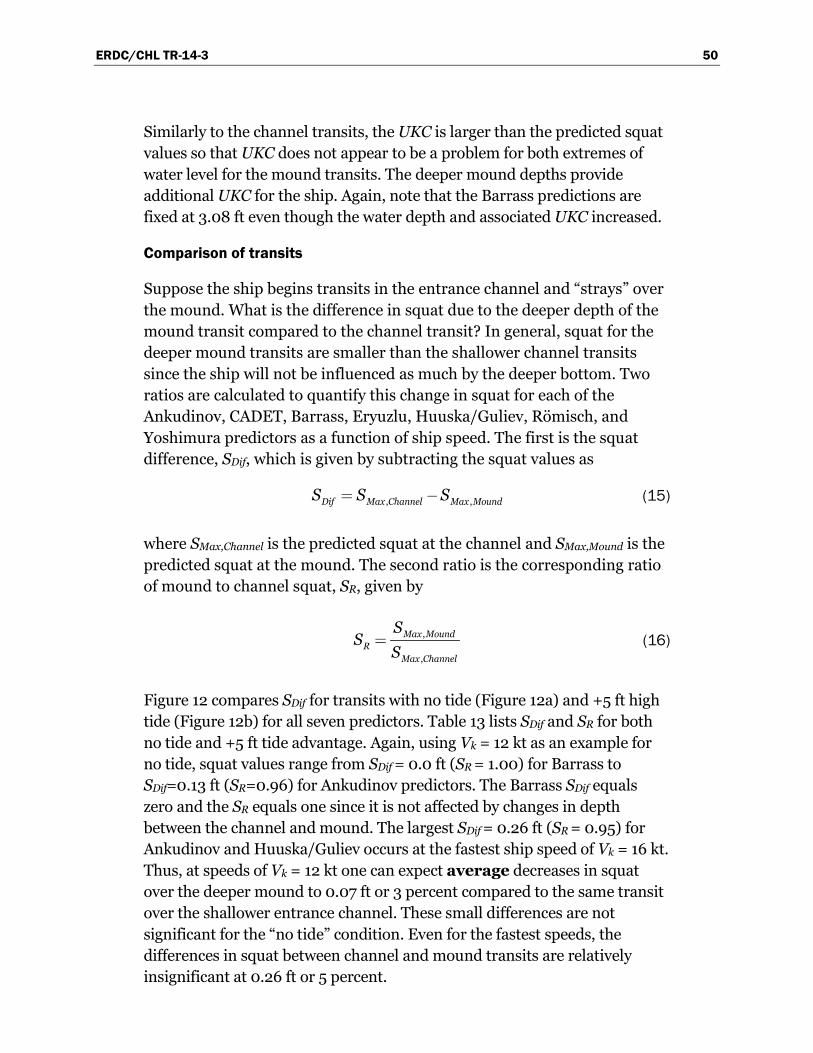
ERDC/CHL TR-14-3 50
Similarly to the channel transits, the UKC is larger than the predicted squat values so that UKC does not appear to be a problem for both extremes of water level for the mound transits. The deeper mound depths provide additional UKC for the ship. Again, note that the Barrass predictions are fixed at 3.08 ft even though the water depth and associated UKC increased.
Comparison of transits
Suppose the ship begins transits in the entrance channel and “strays” over the mound. What is the difference in squat due to the deeper depth of the mound transit compared to the channel transit? In general, squat for the deeper mound transits are smaller than the shallower channel transits since the ship will not be influenced as much by the deeper bottom. Two ratios are calculated to quantify this change in squat for each of the Ankudinov, CADET, Barrass, Eryuzlu, Huuska/Guliev, Römisch, and Yoshimura predictors as a function of ship speed. The first is the squat difference, SDif, which is given by subtracting the squat values as
, ,Dif Max Channel Max MoundS S S (15)
where SMax,Channel is the predicted squat at the channel and SMax,Mound is the predicted squat at the mound. The second ratio is the corresponding ratio of mound to channel squat, SR, given by
,
,
Max MoundR
Max Channel
SS
S (16)
Figure 12 compares SDif for transits with no tide (Figure 12a) and +5 ft high tide (Figure 12b) for all seven predictors. Table 13 lists SDif and SR for both no tide and +5 ft tide advantage. Again, using Vk = 12 kt as an example for no tide, squat values range from SDif = 0.0 ft (SR = 1.00) for Barrass to SDif=0.13 ft (SR=0.96) for Ankudinov predictors. The Barrass SDif equals zero and the SR equals one since it is not affected by changes in depth between the channel and mound. The largest SDif = 0.26 ft (SR = 0.95) for Ankudinov and Huuska/Guliev occurs at the fastest ship speed of Vk = 16 kt. Thus, at speeds of Vk = 12 kt one can expect average decreases in squat over the deeper mound to 0.07 ft or 3 percent compared to the same transit over the shallower entrance channel. These small differences are not significant for the “no tide” condition. Even for the fastest speeds, the differences in squat between channel and mound transits are relatively insignificant at 0.26 ft or 5 percent.
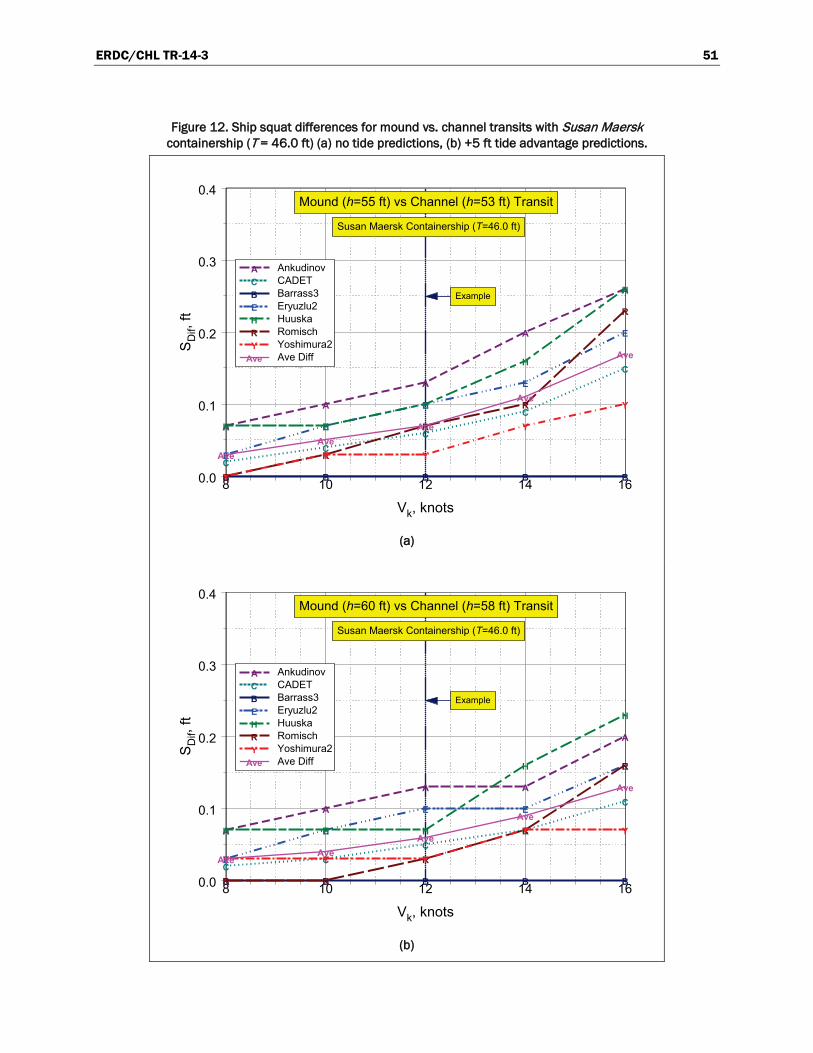
ERDC/CHL TR-14-3 51
Figure 12. Ship squat differences for mound vs. channel transits with Susan Maersk containership (T = 46.0 ft) (a) no tide predictions, (b) +5 ft tide advantage predictions.
(a)
(b)
8 10 12 14 16
Vk, knots
0.0
0.1
0.2
0.3
0.4S
Dif,
ft
A AnkudinovC CADETB Barrass3E Eryuzlu2H HuuskaR RomischY Yoshimura2
Ave Ave Diff
Example
Mound (h=55 ft) vs Channel (h=53 ft) Transit
A
A
A
A
A
CC
C
C
C
B B B B B
E
E
E
E
E
H H
H
H
H
R
R
R
R
R
Y
Y Y
Y
Y
AveAve
Ave
Ave
Ave
Susan Maersk Containership (T=46.0 ft)
8 10 12 14 16
Vk, knots
0.0
0.1
0.2
0.3
0.4
SD
if, ft
A AnkudinovC CADETB Barrass3E Eryuzlu2H HuuskaR RomischY Yoshimura2
Ave Ave Diff
Example
Mound (h=60 ft) vs Channel (h=58 ft) Transit
A
A
A A
A
CC
CC
C
B B B B B
E
E
E E
E
H H H
H
H
R R
R
R
R
Y Y Y
Y Y
AveAve
Ave
Ave
Ave
Susan Maersk Containership (T=46.0 ft)

ERDC/CHL TR-14-3 52
Table 13. Effect of tides on squat differences SDif and ratios SR for mound and channel transits for light-loaded Susan Maersk containership.
Spd (kt)
Ank (ft)
CAD (ft)
B3 (ft)
E2 (ft)
Hus (ft)
Röm (ft)
Yosh (ft)
SAve (ft)
SMin (ft)
SMax (ft)
No tide SDif
8 0.07 0.02 0.00 0.03 0.07 0.00 0.00 0.03 0.00 0.07
10 0.10 0.04 0.00 0.07 0.07 0.03 0.03 0.05 0.00 0.10
12 0.13 0.06 0.00 0.10 0.10 0.07 0.03 0.07 0.00 0.13
14 0.20 0.09 0.00 0.13 0.16 0.10 0.07 0.11 0.00 0.20
16 0.26 0.15 0.00 0.20 0.26 0.23 0.10 0.17 0.00 0.26
No tide SR
8 0.95 0.96 1.00 0.97 0.94 1.00 1.00 0.97 0.94 1.00
10 0.95 0.96 1.00 0.96 0.96 0.97 0.98 0.97 0.95 1.00
12 0.96 0.96 1.00 0.96 0.96 0.96 0.99 0.97 0.96 1.00
14 0.95 0.96 1.00 0.97 0.96 0.96 0.98 0.97 0.95 1.00
16 0.95 0.95 1.00 0.96 0.95 0.94 0.98 0.96 0.94 1.00
+5 ft tide SDif
8 0.07 0.02 0.00 0.03 0.07 0.00 0.03 0.03 0.00 0.07
10 0.10 0.03 0.00 0.07 0.07 0.00 0.03 0.04 0.00 0.10
12 0.13 0.05 0.00 0.10 0.07 0.03 0.03 0.06 0.00 0.13
14 0.13 0.07 0.00 0.10 0.16 0.07 0.07 0.09 0.00 0.16
16 0.20 0.11 0.00 0.16 0.23 0.16 0.07 0.13 0.00 0.23
+5 ft tide SR
8 0.95 0.96 1.00 0.97 0.93 1.00 0.97 0.97 0.93 1.00
10 0.95 0.96 1.00 0.96 0.96 1.00 0.98 0.97 0.95 1.00
12 0.95 0.96 1.00 0.96 0.97 0.98 0.98 0.97 0.95 1.00
14 0.96 0.96 1.00 0.97 0.95 0.97 0.98 0.97 0.95 1.00
16 0.96 0.96 1.00 0.97 0.95 0.95 0.98 0.97 0.95 1.00
Notes: Ank = Ankudinov CAD = CADET B3 = Barrass version 3 E2 = Eryuzlu version 2 Hus = Huuska/Guliev Röm = Römisch Yosh = Yoshimura SAve, SMin, SMax = Average, minimum, and maximum of all 7 squat predictions

ERDC/CHL TR-14-3 53
Figure 12b is the corresponding comparison of SDif for the case with +5 ft high tide. In general, the squat differences are smaller for this deeper depth scenario. Again, using Vk =12 kt as an example, increases in squat range from SDif=0.0 ft (SR=1.00) for Barrass to SDif=0.13 ft (SR=0.96) for Ankudinov predictors. The largest SDif=0.23 ft (SR=0.95) for Huuska/Guliev occurs at Vk =16 kt. Therefore, at speeds of Vk =12 kt in this deeper scenario with high tide, one can expect average decreases in squat over the deeper mound up to 0.06 ft or 3 percent compared to the same transit over the shallower entrance channel. Again, these small differences are not significant for the high tide condition.
Fully loaded ship
Entrance channel transit
Figure 13 shows maximum predicted ship squat, SMax, as a function of ship speed for the fully loaded (T = 47.5 ft) Susan Maersk containership in the main entrance channel. This figure is similar to Figure 10 for the light-loaded ship. Figure 13a is for the no tide condition at a depth of h = 53 ft and Figure 13b is the analogous figure for the high tide (+5 ft) water depth of h = 58 ft. Table 14 lists the squat values that are plotted in these figures for each water depth as a function of ship speed and predictor.
For the no tide condition, the UKC = 5.5 ft (i.e., 53 – 47.5 ft). Figure 13a shows that the CADET and Römisch are on the “low” side and the Ankudinov and Barrass predictions are on the “high” side of the squat predictions. In this case, the Ankudinov and Barrass predictions overlap each other. Again using Vk = 12 kt as an example, squat ranges from SMax = 1.46 to 3.08 ft, with an average of 2.44 ft. The minimum and maximum squat values correspond to the CADET and Barrass predictions, respectively.
For the high tide condition shown in Figure 14b, the UKC=10.5 ft (i.e., 58.0 – 47.5 ft). The CADET and Barrass bracket the squat predictions. With Vk = 12 kt as an example, squat ranges from SMax =1.32 to 3.08 ft, with an average of 2.26 ft. The minimum and maximum squat values correspond to the CADET and Barrass, respectively. The Barrass prediction is unchanged from the light-loaded ship as it is not affected by changes in the water depth and the ship draft is sufficient even as the light-loaded condition to produce the maximum squat. Also, the Barrass squat prediction is the maximum of all the predictions, the same as with the shallower depth of h=53 ft.

ERDC/CHL TR-14-3 54
Figure 13. Ship squat for fully loaded (T = 47.5 ft) Susan Maersk containership during channel transit for Ankudinov, CADET, Barrass, Eryuzlu, Huuska, Römisch, and Yoshimura
predictions (a) no tide (h = 53 ft) and (b) high tide (h = 58 ft).
(a)
(b)
8 10 12 14 16
Vk, knots
-6
-4
-2
0S
Max
, ft
A AnkudinovC CADETB Barrass3E Eryuzlu2H HuuskaR RomischY Yoshimura2
Ave Ave Channel
Bottom UKC=5.5 ft
Example
Channel Transit (h=53 ft) with Susan Maersk Containership (T=47.5 ft)
A
A
A
A
A
C
C
C
C
C
B
B
B
B
B
E
E
E
E
E
H
H
H
H
H
R
R
R
R
R
Y
Y
Y
Y
Y
Ave
Ave
Ave
Ave
Ave
8 10 12 14 16
Vk, knots
-6
-4
-2
0
SM
ax, f
t
A AnkudinovC CADETB Barrass3E Eryuzlu2H HuuskaR RomischY Yoshimura2
Ave Ave Channel
Bottom UKC=10.5 ft
Example
Channel Transit (h=58 ft) with Susan Maersk Containership (T=47.5 ft)
A
A
A
A
A
C
C
C
C
C
B
B
B
B
B
E
E
E
E
E
H
H
H
H
H
R
R
R
R
R
Y
Y
Y
Y
Y
Ave
Ave
Ave
Ave
Ave

ERDC/CHL TR-14-3 55
Table 14. Ship squat predictions for fully loaded Susan Maersk during channel transit.
Spd (kt)
Ank (ft)
CAD (ft)
B3 (ft)
E2 (ft)
Hus (ft)
Röm (ft)
Yosh (ft)
SAve (ft)
SMin (ft)
SMax (ft)
h=53 ft
8 1.48 0.60 1.38 1.12 1.12 0.72 1.02 1.06 0.60 1.48
10 2.20 0.97 2.13 1.87 1.77 1.12 1.57 1.66 0.97 2.20
12 3.08 1.46 3.08 2.82 2.69 1.64 2.30 2.44 1.46 3.08
14 4.10 2.11 4.17 4.04 3.90 2.36 3.12 3.40 2.11 4.17
16 5.31 2.99 5.45 5.45 5.51 3.67 4.07 4.64 2.99 5.51
h=58 ft
8 1.31 0.54 1.38 1.02 1.02 0.69 0.95 0.99 0.54 1.38
10 1.97 0.88 2.13 1.71 1.61 1.05 1.51 1.55 0.88 2.13
12 2.76 1.32 3.08 2.59 2.43 1.51 2.17 2.26 1.32 3.08
14 3.64 1.89 4.17 3.67 3.48 2.13 2.92 3.13 1.89 4.17
16 4.69 2.65 5.45 4.99 4.89 3.12 3.84 4.23 2.65 5.45
Notes: Ank = Ankudinov CAD = CADET B3 = Barrass version 3 E2 = Eryuzlu version 2 Hus = Huuska/Guliev Röm = Römisch Yosh = Yoshimura SAve, SMin, SMax = Average, minimum, and maximum of all 7 squat predictions
For the fully loaded ship with no tide, the UKC is not much larger than the predicted squat. Therefore, this will be the worst case scenario for transits when one includes vertical ship motions and required UKCMin. Again, these values will be discussed in the next Chapter.
Mound transit
Figure 14 is the analogous figure for mound transits and the fully loaded Susan Maersk with no tide (Figure 14a) and +5 ft high tide (Figure 14b) in water depths of h = 55 and 60 ft, respectively. Table 15 lists the corresponding squat values at these two water depths.

ERDC/CHL TR-14-3 56
Figure 14. Ship squat for fully loaded (T = 47.5 ft) Susan Maersk containership during mound transit for Ankudinov, CADET, Barrass, Eryuzlu, Huuska, Römisch, and Yoshimura predictions
(a) no tide (h = 55 ft) and (b) high tide (h = 60 ft).
(a)
(b)
8 10 12 14 16
Vk, knots
-6
-4
-2
0S
Max
, ft
A AnkudinovC CADETB Barrass3E Eryuzlu2H HuuskaR RomischY Yoshimura2
Ave Ave Mound
Bottom UKC=7.5 ft
Example
Mound Transit (h=55 ft) with Susan Maersk Containership (T=47.5 ft)
A
A
A
A
A
C
C
C
C
C
B
B
B
B
B
E
E
E
E
E
H
H
H
H
H
R
R
R
R
R
Y
Y
Y
Y
Y
Ave
Ave
Ave
Ave
Ave
8 10 12 14 16
Vk, knots
-6
-4
-2
0
SM
ax, f
t
A AnkudinovC CADETB Barrass3E Eryuzlu2H HuuskaR RomischY Yoshimura2
Ave Ave Mound
Bottom UKC=12.5 ft
Example
Mound Transit (h=60 ft) with Susan Maersk Containership (T=47.5 ft)
A
A
A
A
A
CC
C
C
C
B
B
B
B
B
E
E
E
E
E
H
H
H
H
H
R
R
R
R
R
Y
Y
Y
Y
Y
Ave
Ave
Ave
Ave
Ave
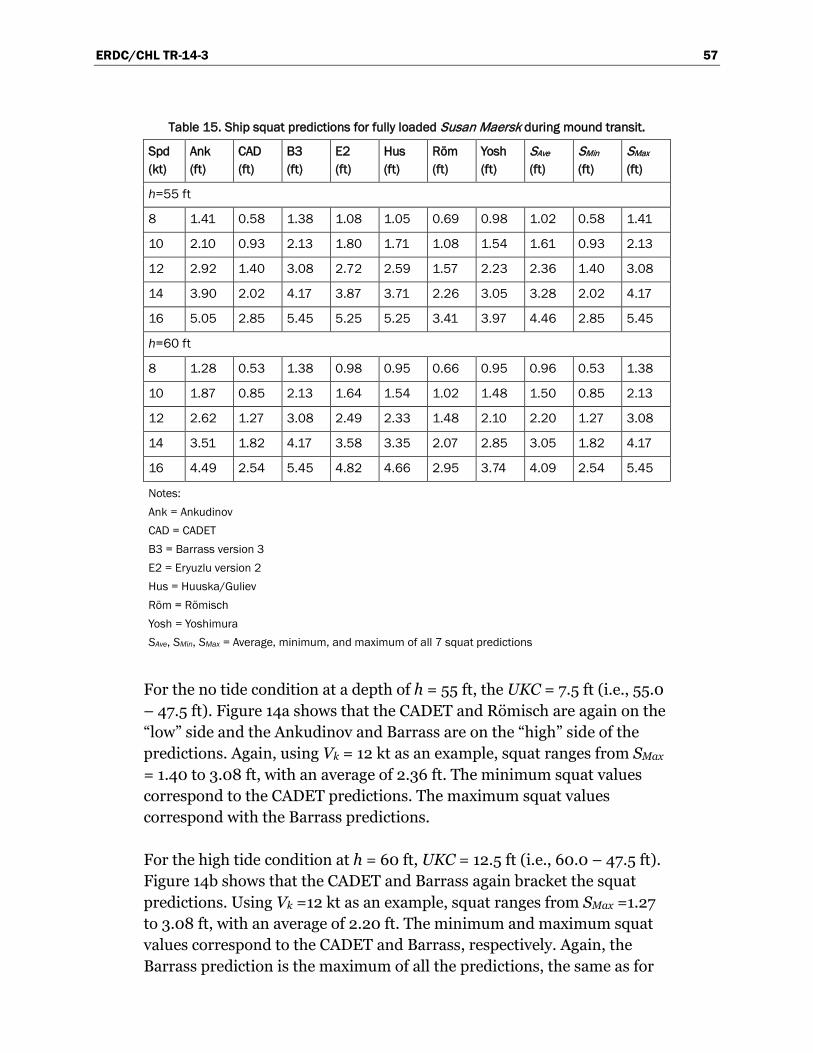
ERDC/CHL TR-14-3 57
Table 15. Ship squat predictions for fully loaded Susan Maersk during mound transit.
Spd (kt)
Ank (ft)
CAD (ft)
B3 (ft)
E2 (ft)
Hus (ft)
Röm (ft)
Yosh (ft)
SAve (ft)
SMin (ft)
SMax (ft)
h=55 ft
8 1.41 0.58 1.38 1.08 1.05 0.69 0.98 1.02 0.58 1.41
10 2.10 0.93 2.13 1.80 1.71 1.08 1.54 1.61 0.93 2.13
12 2.92 1.40 3.08 2.72 2.59 1.57 2.23 2.36 1.40 3.08
14 3.90 2.02 4.17 3.87 3.71 2.26 3.05 3.28 2.02 4.17
16 5.05 2.85 5.45 5.25 5.25 3.41 3.97 4.46 2.85 5.45
h=60 ft
8 1.28 0.53 1.38 0.98 0.95 0.66 0.95 0.96 0.53 1.38
10 1.87 0.85 2.13 1.64 1.54 1.02 1.48 1.50 0.85 2.13
12 2.62 1.27 3.08 2.49 2.33 1.48 2.10 2.20 1.27 3.08
14 3.51 1.82 4.17 3.58 3.35 2.07 2.85 3.05 1.82 4.17
16 4.49 2.54 5.45 4.82 4.66 2.95 3.74 4.09 2.54 5.45
Notes: Ank = Ankudinov CAD = CADET B3 = Barrass version 3 E2 = Eryuzlu version 2 Hus = Huuska/Guliev Röm = Römisch Yosh = Yoshimura SAve, SMin, SMax = Average, minimum, and maximum of all 7 squat predictions
For the no tide condition at a depth of h = 55 ft, the UKC = 7.5 ft (i.e., 55.0 – 47.5 ft). Figure 14a shows that the CADET and Römisch are again on the “low” side and the Ankudinov and Barrass are on the “high” side of the predictions. Again, using Vk = 12 kt as an example, squat ranges from SMax
= 1.40 to 3.08 ft, with an average of 2.36 ft. The minimum squat values correspond to the CADET predictions. The maximum squat values correspond with the Barrass predictions.
For the high tide condition at h = 60 ft, UKC = 12.5 ft (i.e., 60.0 – 47.5 ft). Figure 14b shows that the CADET and Barrass again bracket the squat predictions. Using Vk =12 kt as an example, squat ranges from SMax =1.27 to 3.08 ft, with an average of 2.20 ft. The minimum and maximum squat values correspond to the CADET and Barrass, respectively. Again, the Barrass prediction is the maximum of all the predictions, the same as for
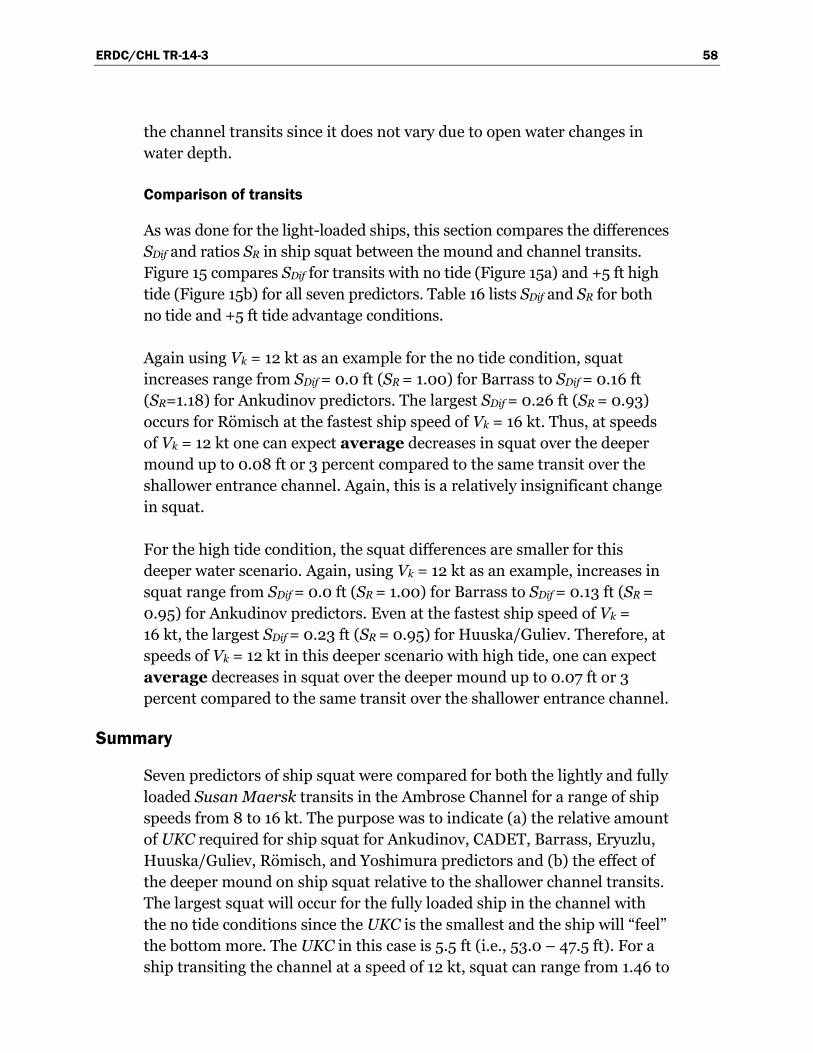
ERDC/CHL TR-14-3 58
the channel transits since it does not vary due to open water changes in water depth.
Comparison of transits
As was done for the light-loaded ships, this section compares the differences SDif and ratios SR in ship squat between the mound and channel transits. Figure 15 compares SDif for transits with no tide (Figure 15a) and +5 ft high tide (Figure 15b) for all seven predictors. Table 16 lists SDif and SR for both no tide and +5 ft tide advantage conditions.
Again using Vk = 12 kt as an example for the no tide condition, squat increases range from SDif = 0.0 ft (SR = 1.00) for Barrass to SDif = 0.16 ft (SR=1.18) for Ankudinov predictors. The largest SDif = 0.26 ft (SR = 0.93) occurs for Römisch at the fastest ship speed of Vk = 16 kt. Thus, at speeds of Vk = 12 kt one can expect average decreases in squat over the deeper mound up to 0.08 ft or 3 percent compared to the same transit over the shallower entrance channel. Again, this is a relatively insignificant change in squat.
For the high tide condition, the squat differences are smaller for this deeper water scenario. Again, using Vk = 12 kt as an example, increases in squat range from SDif = 0.0 ft (SR = 1.00) for Barrass to SDif = 0.13 ft (SR = 0.95) for Ankudinov predictors. Even at the fastest ship speed of Vk = 16 kt, the largest SDif = 0.23 ft (SR = 0.95) for Huuska/Guliev. Therefore, at speeds of Vk = 12 kt in this deeper scenario with high tide, one can expect average decreases in squat over the deeper mound up to 0.07 ft or 3 percent compared to the same transit over the shallower entrance channel.
Summary
Seven predictors of ship squat were compared for both the lightly and fully loaded Susan Maersk transits in the Ambrose Channel for a range of ship speeds from 8 to 16 kt. The purpose was to indicate (a) the relative amount of UKC required for ship squat for Ankudinov, CADET, Barrass, Eryuzlu, Huuska/Guliev, Römisch, and Yoshimura predictors and (b) the effect of the deeper mound on ship squat relative to the shallower channel transits. The largest squat will occur for the fully loaded ship in the channel with the no tide conditions since the UKC is the smallest and the ship will “feel” the bottom more. The UKC in this case is 5.5 ft (i.e., 53.0 – 47.5 ft). For a ship transiting the channel at a speed of 12 kt, squat can range from 1.46 to

ERDC/CHL TR-14-3 59
Figure 15. Ship squat differences for mound vs. channel transits with Susan Maersk containership (T = 47.5 ft) (a) no tide predictions, (b) +5 ft tide advantage predictions.
(a)
(b)
8 10 12 14 16
Vk, knots
0.0
0.1
0.2
0.3
0.4S
Dif,
ft
A AnkudinovC CADETB Barrass3E Eryuzlu2H HuuskaR RomischY Yoshimura2
Ave Ave Diff
Example
Mound (h=55 ft) vs Channel (h=53 ft) Transit
A
A
A
A
A
CC
C
C
C
B B B B B
E
E
E
E
E
H H
H
H
H
R R
R
R
R
Y Y
Y Y
Y
AveAve
Ave
Ave
Ave
Susan Maersk Containership (T=47.5 ft)
8 10 12 14 16
Vk, knots
0.0
0.1
0.2
0.3
0.4
SD
if, ft
A AnkudinovC CADETB Barrass3E Eryuzlu2H HuuskaR RomischY Yoshimura2
Ave Ave Diff
Example
Mound (h=60 ft) vs Channel (h=58 ft) Transit
A
A
A A
A
CC
C
C
C
B B B B B
E
E
E E
E
H H
H
H
H
R R R
R
R
Y
Y
Y Y
Y
AveAve
AveAve
Ave
Susan Maersk Containership (T=47.5 ft)
ERDC/CHL TR-14-3 60
Table 16. Effect of tides on squat differences SDif and ratios SR for mound and channel transits for fully loaded Susan Maersk containership.
Spd (kt)
Ank (ft)
CAD (ft)
B3 (ft)
E2 (ft)
Hus (ft)
Röm (ft)
Yosh (ft)
SAve (ft)
SMin (ft)
SMax (ft)
No tide SDif
8 0.07 0.02 0.00 0.03 0.07 0.03 0.03 0.04 0.00 0.07
10 0.10 0.04 0.00 0.07 0.07 0.03 0.03 0.05 0.00 0.10
12 0.16 0.06 0.00 0.10 0.10 0.07 0.07 0.08 0.00 0.16
14 0.20 0.09 0.00 0.16 0.20 0.10 0.07 0.12 0.00 0.20
16 0.26 0.15 0.00 0.20 0.26 0.26 0.10 0.18 0.00 0.26
No tide SR
8 0.96 0.96 1.00 0.97 0.94 0.95 0.97 0.96 0.94 1.00
10 0.96 0.96 1.00 0.96 0.96 0.97 0.98 0.97 0.96 1.00
12 0.95 0.96 1.00 0.97 0.96 0.96 0.97 0.97 0.95 1.00
14 0.95 0.96 1.00 0.96 0.95 0.96 0.98 0.96 0.95 1.00
16 0.95 0.95 1.00 0.96 0.95 0.93 0.98 0.96 0.93 1.00
+5 ft tide SDif
8 0.03 0.02 0.00 0.03 0.07 0.03 0.00 0.03 0.00 0.07
10 0.10 0.03 0.00 0.07 0.07 0.03 0.03 0.05 0.00 0.10
12 0.13 0.05 0.00 0.10 0.10 0.03 0.07 0.07 0.00 0.13
14 0.13 0.08 0.00 0.10 0.13 0.07 0.07 0.08 0.00 0.13
16 0.20 0.12 0.00 0.16 0.23 0.16 0.10 0.14 0.00 0.23
+5 ft tide SR
8 0.98 0.96 1.00 0.97 0.94 0.95 1.00 0.97 0.94 1.00
10 0.95 0.96 1.00 0.96 0.96 0.97 0.98 0.97 0.95 1.00
12 0.95 0.96 1.00 0.96 0.96 0.98 0.97 0.97 0.95 1.00
14 0.96 0.96 1.00 0.97 0.96 0.97 0.98 0.97 0.96 1.00
16 0.96 0.96 1.00 0.97 0.95 0.95 0.97 0.97 0.95 1.00
Notes: Ank = Ankudinov CAD = CADET B3 = Barrass version 3 E2 = Eryuzlu version 2 Hus = Huuska/Guliev Röm = Römisch Yosh = Yoshimura SAve, SMin, SMax = Average, minimum, and maximum of all 7 squat predictions
ERDC/CHL TR-14-3 61
3.08 ft, with an average of 2.44 ft. Even at a ship speed of 16 kt, the squat increases from a low of 2.99 to a high of 5.51 ft, with an average of 4.64 ft. Therefore, during transits where wave activity is relatively insignificant, ship squat should not be a problem, even at the fastest ship speeds. Of course, one will still want to maintain the required UKCMin of 2 to 4 ft in the channel and mound reaches, respectively.
For the mound transits with the same fully loaded and no tide conditions, the UKC is 7.5 ft (i.e., 55.0 – 47.5 ft). For a ship transiting the channel at a speed of 12 kt, squat can range from 1.40 to 3.08 ft, with an average of 2.36 ft. Even at a ship speed of 16 kt, the squat increases from a low of 2.85 to a high of 5.45 ft, with an average of 4.46 ft. Again, during transits where wave activity is relatively insignificant, ship squat should not be a problem, even at the fastest ship speeds.
For the light-loaded ship, the predicted ship squat is slightly less, plus the shallower draft of 46 ft provides an additional 1.5 ft of UKC. Ship squat is not a problem for the high tide condition as the predicted squat is slightly lower and an additional UKC of 5 ft is available.

ERDC/CHL TR-14-3 62
7 Ship Motions and Underkeel Clearance
As noted in Chapter 2, CADET outputs the wave-induced vertical motion allowances, Aj, for each ship loading condition, channel reach, and water depth. These Aj are based on Equation 4 and are output for each wave condition, transit direction, ship speed, and five critical points. They are composed of the combined effects of heave, pitch, and roll on each of the five critical points. Therefore, the CADET “vertical motion allowances” are equivalent to the generic term “wave-induced vertical ship motions” term.
The FORTRAN program ReadIn_CADET_Allow2 reads in these files and calculates the largest or maximum allowance over all five control points for each wave condition, transit direction, and ship speed. These “maximum values,” AMax, are the vertical motion allowances that are used in this report. As previously discussed, UKC is the project depth minus the static draft of the ship. The UKCNet is obtained by subtracting dynamic squat and these AMax from the UKC.
The first section in this chapter discusses maximum ship displacements which are an indication of the total clearance that is available for vertical ship motions and UKCNet. Both lightly and fully loaded ships are discussed. The next section presents the Phase 1 wave results for the fully loaded ship. The final section describes the Phase 2 wave results for both the lightly and fully loaded ship.
Maximum ship displacements
The purpose of the maximum ship displacement, DMax, is to indicate the “space” in the water column above the bottom that is available to accommo-date wave-induced vertical ship motions after average ship squat, SAve, is subtracted from the UKC. As long as the ship motions do not exceed DMax, the ship will be able to safely transit a particular reach without grounding. It is defined as
Max AveD UKC S (17)
For safety and maneuverability concerns in this study, the sponsor requested a minimum UKCNet, UKCMin, be maintained as follows:

ERDC/CHL TR-14-3 63
Channel transit, reach 1, soft bottom: UKCMin=2 ft Mound transit, reach 2, hard bottom: UKCMin=4 ft
These values of UKCMin will add to the clearances required in this study.
Light-loaded ship
Table 17 lists maximum ship displacement DMax for the channel and mound reaches as a function of ship speed, water depth, and tide level for the light-loaded ship. The mound reach includes a range of water depths up to 2 ft deeper (i.e., h = 56 and 57 ft for no tide and h = 61 and 62 ft for high tide) as results indicate that these are reasonable values to dredge this reach to insure safe transits. The SAve squat predictions from Chapter 5 are repeated in this table for reference. Although not listed in Chapter 5, the SAve predictions for the two additional depths over the mound in Reach 2 were calculated and are shown in this table.
Table 17. Maximum ship displacements DMax for light-loaded ship.
Speed (kt)
Ship squat SAve (ft) Maximum ship displacements DMax (ft)
Channel Mound Channel Mound
h=53 ft h =55 ft h=56 ft h=57 ft h=53 ft h=55 ft h=56 ft h=57 ft
No tide
8 1.03 1.00 0.99 0.98 5.97 8.00 9.01 10.02
10 1.63 1.58 1.56 1.54 5.37 7.42 8.44 9.46
12 2.38 2.31 2.27 2.24 4.62 6.69 7.73 8.76
14 3.32 3.21 3.16 3.11 3.68 5.79 6.84 7.89
16 4.53 4.36 4.28 4.21 2.47 4.64 5.72 6.79
High tide (+5 ft)
h=58 ft h=60 ft h=61 ft h=62 ft h=58 ft h=60 ft h=61 ft h=62 ft
8 0.97 0.94 0.93 0.91 11.03 13.06 14.07 15.09
10 1.52 1.48 1.45 1.44 10.48 12.52 13.55 14.56
12 2.21 2.15 2.12 2.10 9.79 11.85 12.88 13.90
14 3.06 2.98 2.94 2.89 8.94 11.02 12.06 13.11
16 4.13 4.00 3.94 3.89 7.87 10.00 11.06 12.11
Notes: 1. UKCMin = 2 ft for channel with soft bottom. 2. UKCMin = 4 ft for mound with hard bottom.
ERDC/CHL TR-14-3 64
For channel transits with a project depth of h = 53 ft (no tide), SAve ranges from 1.03 to 4.53 ft with a corresponding DMax of 5.97 to 2.47 ft at ship speeds from Vk = 8 to 16 kt. At Vk = 12 kt, DMax = 4.62 ft which still leaves 2.62 ft for ship motions after allowing for the UKCMin of 2 ft. This should be sufficient to prevent grounding at this ship speed. The faster ship speeds would probably require the use of some or all of the UKCMin to prevent grounding as the DMax are smaller.
For mound transits with a project depth of h = 55 ft (no tide), SAve ranges from 1.00 to 4.36 ft with corresponding DMax of 8.00 to 4.64 ft for the same range of ship speeds. Although these values are larger than the channel transit values, the mound transit requires UKCMin of 4 ft. At Vk = 12 kt, the DMax = 6.69 ft which leaves 2.69 ft available for ship motions, about the same as the channel transit. The DMax are reduced for faster ship speeds similarly to channel transits. The deeper mound depths of h = 56 and 57 ft will provide approximately 1 to 2 ft additional DMax due to the increased dredging. These deeper depths should provide sufficient DMax to accommo-date ship motions and prevent grounding for the light-loaded ship.
Finally, for high tide transits in both channel and mound, ship squat values are reduced as expected due to the deeper water depths. The corresponding maximum ship displacement is also increased due to the tide. For light-loaded transits in the channel at Vk=12 kt, the DMax=9.79 ft which leaves 7.79 ft to accommodate ship motions after allowing for the UKCMin=2 ft. For mound transits at Vk=12 kt, the DMax=11.85 ft which leaves 7.85 ft to accommodate ship motions after allowing for the UKCMin=4 ft. These values should easily accommodate increased values of wave-induced ship motions without grounding.
Fully loaded ship
Table 18 lists maximum ship displacement DMax for the channel and mound reaches as a function of ship speed, water depth, and tide level for the fully loaded ship. It is organized similarly to Table 17 for the light-loaded ship.
For channel transits (h = 53 ft and no tide) with the fully loaded ship, SAve ranges from 1.06 to 4.64 ft with a corresponding DMax of 4.44 to 0.86 ft at ship speeds from Vk = 8 to 16 kt. At Vk = 12 kt, DMax = 3.06 ft which only leaves 1.06 ft for ship motions after allowing for the UKCMin of 2 ft. This should be sufficient to prevent grounding at this ship speed, but will

ERDC/CHL TR-14-3 65
Table 18. Maximum ship displacements DMax for fully loaded ship.
Speed (kt)
Ship squat SAve (ft) Maximum ship displacements DMax (ft)
Channel Mound Channel Mound
h=53 ft h =55 ft h=56 ft h=57 ft h=53 ft h=55 ft h=56 ft h=57 ft
No tide
8 1.06 1.02 1.01 1.00 4.44 6.48 7.49 8.50
10 1.66 1.61 1.60 1.57 3.84 5.89 6.90 7.93
12 2.44 2.36 2.33 2.29 3.06 5.14 6.17 7.21
14 3.40 3.28 3.23 3.18 2.10 4.22 5.27 6.32
16 4.64 4.46 4.38 4.31 0.86 3.04 4.12 5.19
High tide (+5 ft)
h=58 ft h=60 ft h=61 ft h=62 ft h=58 ft h=60 ft h=61 ft h=62 ft
8 0.99 0.96 0.95 0.93 9.51 11.54 12.55 13.57
10 1.55 1.50 1.49 1.48 8.95 11.00 12.01 13.02
12 2.26 2.20 2.17 2.14 8.24 10.30 11.33 12.36
14 3.13 3.05 3.01 2.96 7.37 9.45 10.49 11.54
16 4.23 4.09 4.03 3.98 6.27 8.41 9.47 10.52
Notes: 1. UKCMin = 2 ft for channel with soft bottom. 2. UKCMin = 4 ft for mound with hard bottom.
probably require the use of some of the UKCMin for most wave conditions. Faster ship speeds would show similar trends, with DMax continuing to
decrease as speed increases. In Table 18 the value of DMax=0.86 ft at Vk=16 kt is highlighted in yellow to indicate that there is insufficient clearance to provide for the full UKCMin (i.e., 2 ft channel and 4 ft mound reach) at this speed.
For mound transits with a project depth of h = 55 ft (no tide), SAve ranges from 1.02 to 4.46 ft with corresponding DMax of 6.48 to 3.04 ft for the same range of ship speeds. At Vk = 12 kt, the DMax = 5.14 ft which leaves 1.14 ft available for ship motions after allowing for the UKCMin of 4 ft, about the same as the channel transit. In Table 18 the DMax are reduced for faster ship speeds similarly to channel transits. The value of DMax = 3.04 ft at Vk = 16 kt is highlighted in yellow to indicate that there is insufficient clearance to provide for the full UKCMin at this speed.

ERDC/CHL TR-14-3 66
As before, the deeper mound depths of h = 56 and 57 ft will provide approximately 1 to 2 ft additional DMax due to the increased dredging. This is especially important for the fully loaded ship due its increased draft. At Vk = 12 kt, the DMax = 6.17 to 7.21 ft which leaves 2.17 to 3.21 ft available for ship motions for project depths of h=56 and 57 ft, respectively. Of course, there is still the UKCMin = 4 ft available if necessary. These deeper depths should provide sufficient DMax to accommodate ship motions and prevent grounding for the fully loaded ship.
Finally, for high tide transits in both channel and mound, maximum ship displacement is increased due to the tide. For fully loaded transits in the channel at Vk = 12 kt, the DMax = 8.24 ft which leaves 6.24 ft to accommodate ship motions after allowing for the UKCMin = 2 ft. For mound transits at Vk = 12 kt, the DMax = 10.30 ft which leaves 6.30 ft to accommodate ship motions after allowing for the UKCMin = 4 ft. These values should easily accommo-date increased values of wave-induced ship motions without grounding.
Phase 1 waves – fully loaded ship
The Phase 1 waves consisted of all 211 wave cases from the WIS hindcast. Only the fully loaded ship was tested in Phase 1 as this was the worst case scenario for UKC. In general, outbound transits are much less of a problem than inbound transits as their motions are much smaller. Therefore, most of the discussion will focus on the inbound transits since they produce the largest vertical ship motions.
In the first section, typical and extreme examples of CADET maximum allowances AMax and corresponding net underkeel clearance UKCNet are presented. The second section presents average and maximum AMax and UKCNet statistics for all 211 waves in Phase 1. Appendix D contains full listings of Phase 1 AMax for the fully loaded ship for inbound and outbound transits for all ship speeds at depths corresponding to no tide and high tide water levels. Appendix E contains corresponding listings of Phase 1 UKCNet.
Typical and extreme examples
An example of a typical wave, ID 160, occurs 27.1 days/yr with a wave period of 4.3 s and wave height of 2.8 ft. The extreme wave example, ID 177, occurs only 0.03 days/yr with a wave period of 9.5 s and height of 8.7 ft. Both waves are from 180.0 deg (south), which is the most frequently
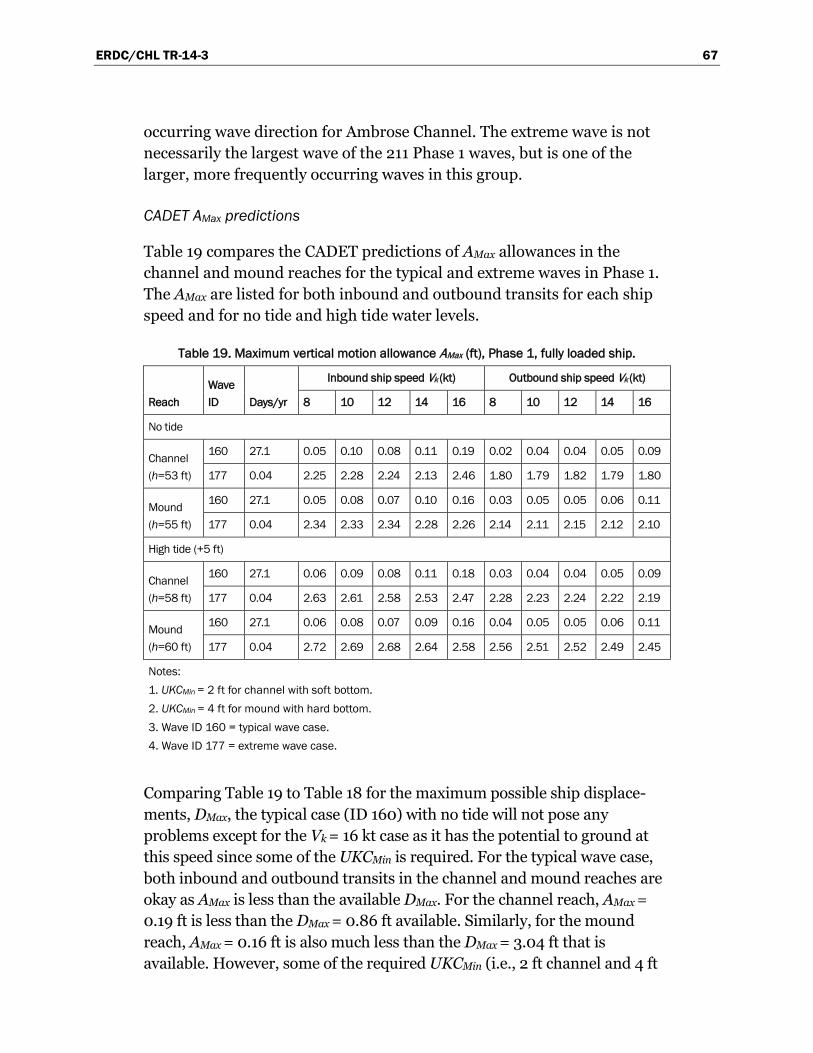
ERDC/CHL TR-14-3 67
occurring wave direction for Ambrose Channel. The extreme wave is not necessarily the largest wave of the 211 Phase 1 waves, but is one of the larger, more frequently occurring waves in this group.
CADET AMax predictions
Table 19 compares the CADET predictions of AMax allowances in the channel and mound reaches for the typical and extreme waves in Phase 1. The AMax are listed for both inbound and outbound transits for each ship speed and for no tide and high tide water levels.
Table 19. Maximum vertical motion allowance AMax (ft), Phase 1, fully loaded ship.
Reach Wave ID Days/yr
Inbound ship speed Vk (kt) Outbound ship speed Vk (kt)
8 10 12 14 16 8 10 12 14 16
No tide
Channel (h=53 ft)
160 27.1 0.05 0.10 0.08 0.11 0.19 0.02 0.04 0.04 0.05 0.09
177 0.04 2.25 2.28 2.24 2.13 2.46 1.80 1.79 1.82 1.79 1.80
Mound (h=55 ft)
160 27.1 0.05 0.08 0.07 0.10 0.16 0.03 0.05 0.05 0.06 0.11
177 0.04 2.34 2.33 2.34 2.28 2.26 2.14 2.11 2.15 2.12 2.10
High tide (+5 ft)
Channel (h=58 ft)
160 27.1 0.06 0.09 0.08 0.11 0.18 0.03 0.04 0.04 0.05 0.09
177 0.04 2.63 2.61 2.58 2.53 2.47 2.28 2.23 2.24 2.22 2.19
Mound (h=60 ft)
160 27.1 0.06 0.08 0.07 0.09 0.16 0.04 0.05 0.05 0.06 0.11
177 0.04 2.72 2.69 2.68 2.64 2.58 2.56 2.51 2.52 2.49 2.45
Notes: 1. UKCMin = 2 ft for channel with soft bottom. 2. UKCMin = 4 ft for mound with hard bottom. 3. Wave ID 160 = typical wave case. 4. Wave ID 177 = extreme wave case.
Comparing Table 19 to Table 18 for the maximum possible ship displace-ments, DMax, the typical case (ID 160) with no tide will not pose any problems except for the Vk = 16 kt case as it has the potential to ground at this speed since some of the UKCMin is required. For the typical wave case, both inbound and outbound transits in the channel and mound reaches are okay as AMax is less than the available DMax. For the channel reach, AMax = 0.19 ft is less than the DMax = 0.86 ft available. Similarly, for the mound reach, AMax = 0.16 ft is also much less than the DMax = 3.04 ft that is available. However, some of the required UKCMin (i.e., 2 ft channel and 4 ft
ERDC/CHL TR-14-3 68
mound) is used to prevent grounding. For the extreme wave case (ID 177), however, the channel reach during inbound transits would indicate grounding as AMax = 2.46 ft is greater than the available DMax = 0.86 ft. All of the UKCMin is used, but it is not enough to prevent grounding. The mound reach does not indicate grounding during inbound transits for the extreme wave case since the AMax = 2.26 ft is less than the available DMax = 3.04 ft. In this case, the UKCMin is used to prevent grounding.
In general for the extreme case and other larger wave cases, one should realize that the ship is not going to actually experience AMax as large as predicted in most cases if the available UKC is less than the predicted ship motion. The CADET program does not cut off the vertical motion prediction based on available UKC. Of course, once the ship is grounded, it cannot experience any greater vertical motion.
For inbound transits at the slower design speeds of Vk = 12 kt, the DMax is 3.06 ft in the channel at low tide. This is more than satisfactory to prevent grounding for the typical case AMax of o.08 ft, but not large enough to prevent incursion into the UKCMin for the extreme case with AMax of 2.24 ft. For the inbound mound transits with similar conditions, the DMax = 5.14 ft from Table 18. As before, this is more than adequate to prevent grounding for the typical case with AMax = 0.07 ft, but not large enough for the extreme case with AMax = 2.34 ft. Again, grounding does not occur, just that there is incursion into the UKCMin.
None of the high tide ship motions will pose any problems due to the additional 5 ft of UKC.
CADET UKCNet predictions
Table 20 lists the corresponding UKCNet for the Phase 1 channel and mound reaches for the same typical and extreme wave conditions. The format is similar to the previous table for the AMax in Table 19. Negative values are highlighted in red since they indicate the possibility of grounding. Caution should be exercised for values highlighted with yellow background. Although the ship has not grounded for these cases, it is within the required UKCMin values of 2 ft for the channel and 4 ft for the mound reaches.
Grounding is not a problem for the high tide water levels due to the additional 5 ft of UKC. Therefore, only the no tide water level cases are discussed. Also, the extreme wave (ID 177) with the longer period and larger wave height produces significantly larger vertical motions than the typical wave case (ID 160).
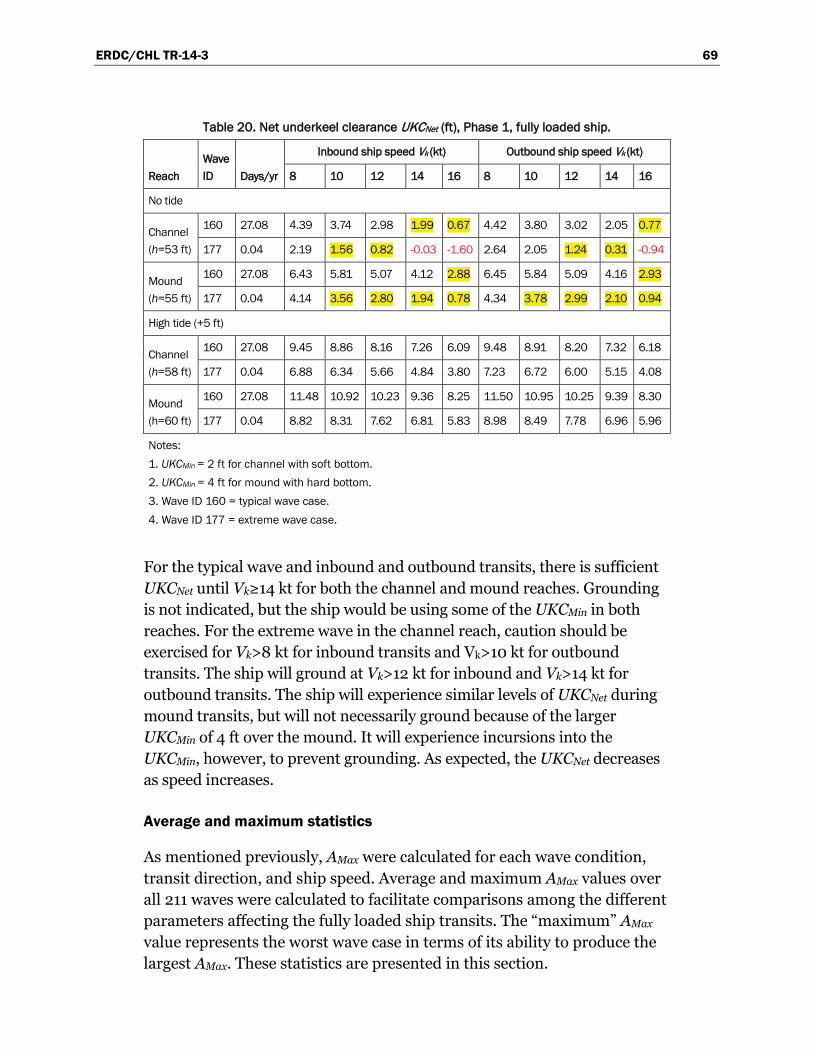
ERDC/CHL TR-14-3 69
Table 20. Net underkeel clearance UKCNet (ft), Phase 1, fully loaded ship.
Reach Wave ID Days/yr
Inbound ship speed Vk (kt) Outbound ship speed Vk (kt)
8 10 12 14 16 8 10 12 14 16
No tide
Channel (h=53 ft)
160 27.08 4.39 3.74 2.98 1.99 0.67 4.42 3.80 3.02 2.05 0.77
177 0.04 2.19 1.56 0.82 -0.03 -1.60 2.64 2.05 1.24 0.31 -0.94
Mound (h=55 ft)
160 27.08 6.43 5.81 5.07 4.12 2.88 6.45 5.84 5.09 4.16 2.93
177 0.04 4.14 3.56 2.80 1.94 0.78 4.34 3.78 2.99 2.10 0.94
High tide (+5 ft)
Channel (h=58 ft)
160 27.08 9.45 8.86 8.16 7.26 6.09 9.48 8.91 8.20 7.32 6.18
177 0.04 6.88 6.34 5.66 4.84 3.80 7.23 6.72 6.00 5.15 4.08
Mound (h=60 ft)
160 27.08 11.48 10.92 10.23 9.36 8.25 11.50 10.95 10.25 9.39 8.30
177 0.04 8.82 8.31 7.62 6.81 5.83 8.98 8.49 7.78 6.96 5.96
Notes: 1. UKCMin = 2 ft for channel with soft bottom. 2. UKCMin = 4 ft for mound with hard bottom. 3. Wave ID 160 = typical wave case. 4. Wave ID 177 = extreme wave case.
For the typical wave and inbound and outbound transits, there is sufficient UKCNet until Vk≥14 kt for both the channel and mound reaches. Grounding is not indicated, but the ship would be using some of the UKCMin in both reaches. For the extreme wave in the channel reach, caution should be exercised for Vk>8 kt for inbound transits and Vk>10 kt for outbound transits. The ship will ground at Vk>12 kt for inbound and Vk>14 kt for outbound transits. The ship will experience similar levels of UKCNet during mound transits, but will not necessarily ground because of the larger UKCMin of 4 ft over the mound. It will experience incursions into the UKCMin, however, to prevent grounding. As expected, the UKCNet decreases as speed increases.
Average and maximum statistics
As mentioned previously, AMax were calculated for each wave condition, transit direction, and ship speed. Average and maximum AMax values over all 211 waves were calculated to facilitate comparisons among the different parameters affecting the fully loaded ship transits. The “maximum” AMax value represents the worst wave case in terms of its ability to produce the largest AMax. These statistics are presented in this section.
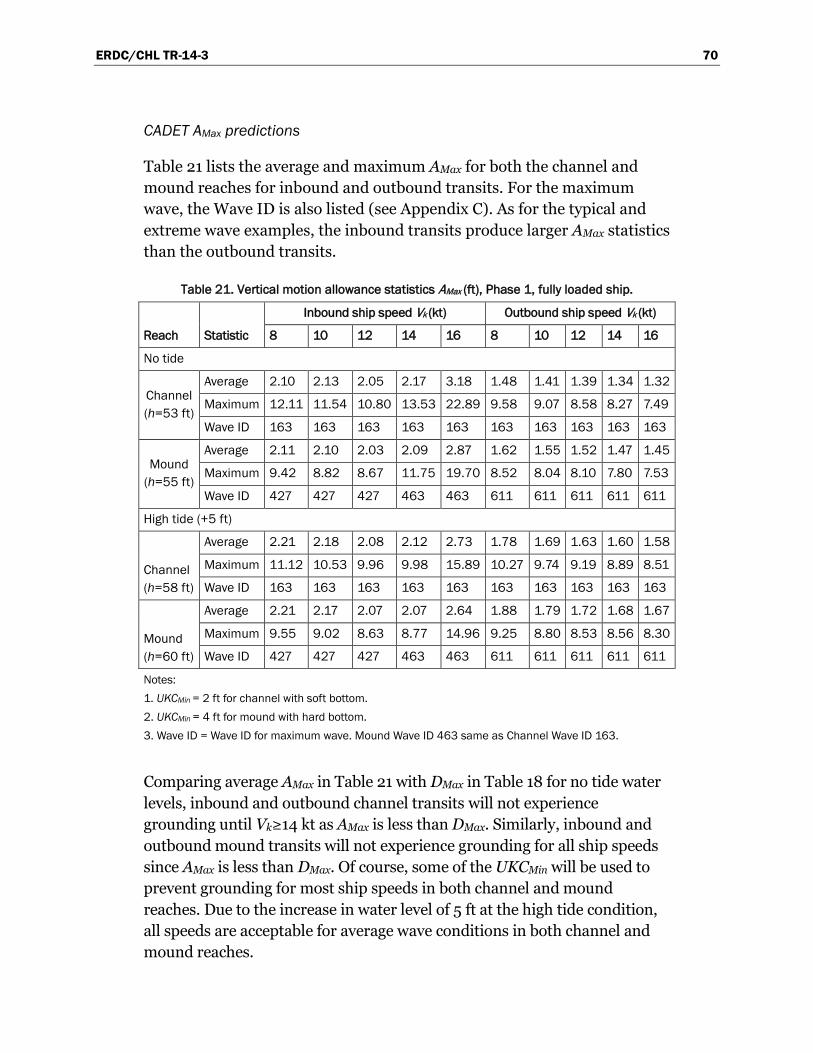
ERDC/CHL TR-14-3 70
CADET AMax predictions
Table 21 lists the average and maximum AMax for both the channel and mound reaches for inbound and outbound transits. For the maximum wave, the Wave ID is also listed (see Appendix C). As for the typical and extreme wave examples, the inbound transits produce larger AMax statistics than the outbound transits.
Table 21. Vertical motion allowance statistics AMax (ft), Phase 1, fully loaded ship.
Reach Statistic
Inbound ship speed Vk (kt) Outbound ship speed Vk (kt)
8 10 12 14 16 8 10 12 14 16
No tide
Channel (h=53 ft)
Average 2.10 2.13 2.05 2.17 3.18 1.48 1.41 1.39 1.34 1.32
Maximum 12.11 11.54 10.80 13.53 22.89 9.58 9.07 8.58 8.27 7.49
Wave ID 163 163 163 163 163 163 163 163 163 163
Mound (h=55 ft)
Average 2.11 2.10 2.03 2.09 2.87 1.62 1.55 1.52 1.47 1.45
Maximum 9.42 8.82 8.67 11.75 19.70 8.52 8.04 8.10 7.80 7.53
Wave ID 427 427 427 463 463 611 611 611 611 611
High tide (+5 ft)
Channel (h=58 ft)
Average 2.21 2.18 2.08 2.12 2.73 1.78 1.69 1.63 1.60 1.58
Maximum 11.12 10.53 9.96 9.98 15.89 10.27 9.74 9.19 8.89 8.51
Wave ID 163 163 163 163 163 163 163 163 163 163
Mound (h=60 ft)
Average 2.21 2.17 2.07 2.07 2.64 1.88 1.79 1.72 1.68 1.67
Maximum 9.55 9.02 8.63 8.77 14.96 9.25 8.80 8.53 8.56 8.30
Wave ID 427 427 427 463 463 611 611 611 611 611
Notes: 1. UKCMin = 2 ft for channel with soft bottom. 2. UKCMin = 4 ft for mound with hard bottom. 3. Wave ID = Wave ID for maximum wave. Mound Wave ID 463 same as Channel Wave ID 163.
Comparing average AMax in Table 21 with DMax in Table 18 for no tide water levels, inbound and outbound channel transits will not experience grounding until Vk≥14 kt as AMax is less than DMax. Similarly, inbound and outbound mound transits will not experience grounding for all ship speeds since AMax is less than DMax. Of course, some of the UKCMin will be used to prevent grounding for most ship speeds in both channel and mound reaches. Due to the increase in water level of 5 ft at the high tide condition, all speeds are acceptable for average wave conditions in both channel and mound reaches.
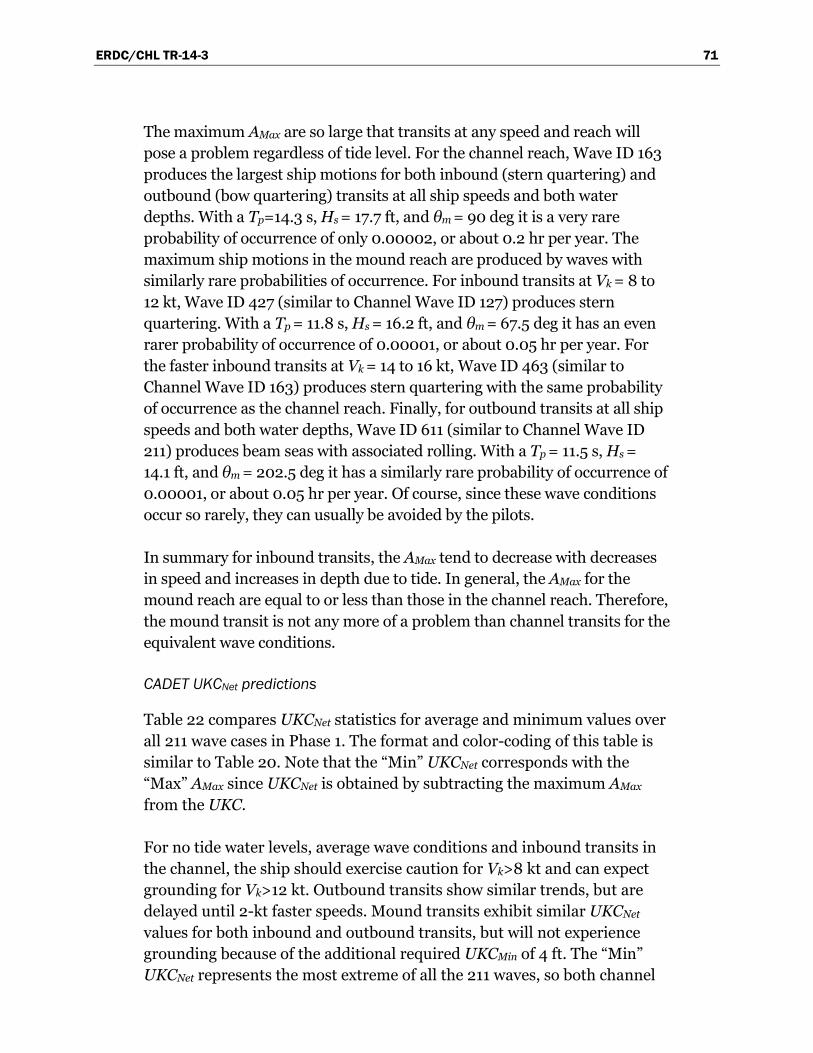
ERDC/CHL TR-14-3 71
The maximum AMax are so large that transits at any speed and reach will pose a problem regardless of tide level. For the channel reach, Wave ID 163 produces the largest ship motions for both inbound (stern quartering) and outbound (bow quartering) transits at all ship speeds and both water depths. With a Tp=14.3 s, Hs = 17.7 ft, and θm = 90 deg it is a very rare probability of occurrence of only 0.00002, or about 0.2 hr per year. The maximum ship motions in the mound reach are produced by waves with similarly rare probabilities of occurrence. For inbound transits at Vk = 8 to 12 kt, Wave ID 427 (similar to Channel Wave ID 127) produces stern quartering. With a Tp = 11.8 s, Hs = 16.2 ft, and θm = 67.5 deg it has an even rarer probability of occurrence of 0.00001, or about 0.05 hr per year. For the faster inbound transits at Vk = 14 to 16 kt, Wave ID 463 (similar to Channel Wave ID 163) produces stern quartering with the same probability of occurrence as the channel reach. Finally, for outbound transits at all ship speeds and both water depths, Wave ID 611 (similar to Channel Wave ID 211) produces beam seas with associated rolling. With a Tp = 11.5 s, Hs = 14.1 ft, and θm = 202.5 deg it has a similarly rare probability of occurrence of 0.00001, or about 0.05 hr per year. Of course, since these wave conditions occur so rarely, they can usually be avoided by the pilots.
In summary for inbound transits, the AMax tend to decrease with decreases in speed and increases in depth due to tide. In general, the AMax for the mound reach are equal to or less than those in the channel reach. Therefore, the mound transit is not any more of a problem than channel transits for the equivalent wave conditions.
CADET UKCNet predictions
Table 22 compares UKCNet statistics for average and minimum values over all 211 wave cases in Phase 1. The format and color-coding of this table is similar to Table 20. Note that the “Min” UKCNet corresponds with the “Max” AMax since UKCNet is obtained by subtracting the maximum AMax from the UKC.
For no tide water levels, average wave conditions and inbound transits in the channel, the ship should exercise caution for Vk>8 kt and can expect grounding for Vk>12 kt. Outbound transits show similar trends, but are delayed until 2-kt faster speeds. Mound transits exhibit similar UKCNet values for both inbound and outbound transits, but will not experience grounding because of the additional required UKCMin of 4 ft. The “Min” UKCNet represents the most extreme of all the 211 waves, so both channel
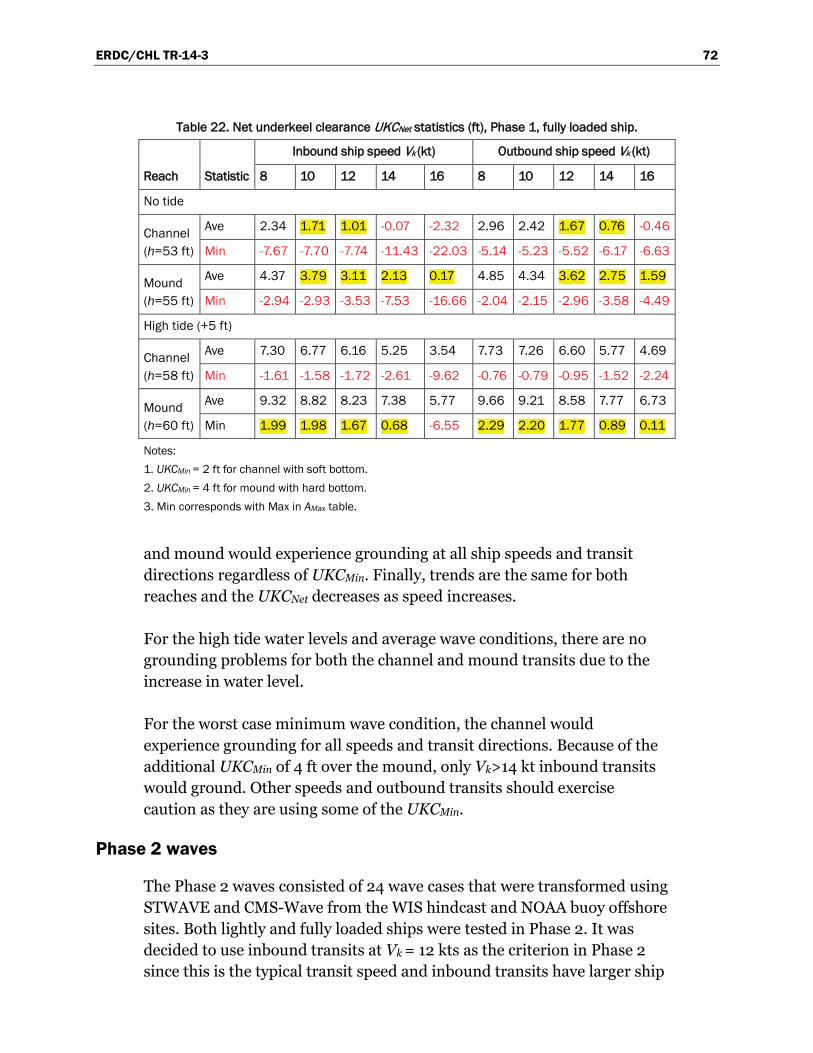
ERDC/CHL TR-14-3 72
Table 22. Net underkeel clearance UKCNet statistics (ft), Phase 1, fully loaded ship.
Reach Statistic
Inbound ship speed Vk (kt) Outbound ship speed Vk (kt)
8 10 12 14 16 8 10 12 14 16
No tide
Channel (h=53 ft)
Ave 2.34 1.71 1.01 -0.07 -2.32 2.96 2.42 1.67 0.76 -0.46
Min -7.67 -7.70 -7.74 -11.43 -22.03 -5.14 -5.23 -5.52 -6.17 -6.63
Mound (h=55 ft)
Ave 4.37 3.79 3.11 2.13 0.17 4.85 4.34 3.62 2.75 1.59
Min -2.94 -2.93 -3.53 -7.53 -16.66 -2.04 -2.15 -2.96 -3.58 -4.49
High tide (+5 ft)
Channel (h=58 ft)
Ave 7.30 6.77 6.16 5.25 3.54 7.73 7.26 6.60 5.77 4.69
Min -1.61 -1.58 -1.72 -2.61 -9.62 -0.76 -0.79 -0.95 -1.52 -2.24
Mound (h=60 ft)
Ave 9.32 8.82 8.23 7.38 5.77 9.66 9.21 8.58 7.77 6.73
Min 1.99 1.98 1.67 0.68 -6.55 2.29 2.20 1.77 0.89 0.11
Notes: 1. UKCMin = 2 ft for channel with soft bottom. 2. UKCMin = 4 ft for mound with hard bottom. 3. Min corresponds with Max in AMax table.
and mound would experience grounding at all ship speeds and transit directions regardless of UKCMin. Finally, trends are the same for both reaches and the UKCNet decreases as speed increases.
For the high tide water levels and average wave conditions, there are no grounding problems for both the channel and mound transits due to the increase in water level.
For the worst case minimum wave condition, the channel would experience grounding for all speeds and transit directions. Because of the additional UKCMin of 4 ft over the mound, only Vk>14 kt inbound transits would ground. Other speeds and outbound transits should exercise caution as they are using some of the UKCMin.
Phase 2 waves
The Phase 2 waves consisted of 24 wave cases that were transformed using STWAVE and CMS-Wave from the WIS hindcast and NOAA buoy offshore sites. Both lightly and fully loaded ships were tested in Phase 2. It was decided to use inbound transits at Vk = 12 kts as the criterion in Phase 2 since this is the typical transit speed and inbound transits have larger ship
ERDC/CHL TR-14-3 73
motions than outbound transits. Dredge depths of h = 53 ft in the channel reach and h = 55, 56, and 57 ft in the mound reach were selected for comparisons. The high tide level is not a problem because of the additional 5 ft of water level. Therefore, only the “no tide” water level is discussed.
In the first section, CADET AMax and corresponding UKCNet for all 24 waves are presented for the light-loaded ship. The next section presents similar results for the fully loaded ship. Since only the inbound transits at Vk = 12 kts are discussed in the text, full listings of inbound and outbound Phase 2 AMax at all ship speeds are contained in Appendix F. Appendix G contains corresponding listings of Phase 2 UKCNet.
Light-loaded ship
CADET AMax predictions
Table 23 lists vertical motion allowances, AMax, due to the Phase 2 waves for the light-loaded ship transiting channel and mound reaches at Vk = 12 kt. The mound reach includes the three optional water depths of h = 55, 56, and 57 ft. At the bottom of the table, some values are included for reference. These include the maximum ship displacement, DMax, values at Vk = 12 kt from Table 18 and statistics showing the minimum, average, and maximum AMax.
As a first comparison, all of the AMax in both the channel and mound reaches are less than the DMax values in Table 17. This indicates that there is “room” to accommodate the ship motions without grounding. However, some of the UKCMin will be required in some wave cases.
The next comparison involves a discussion of the relative magnitudes between the channel and mound AMax. Yellow highlights in Table 23 indicate those mound AMax which are at least 0.3 ft larger than the corresponding channel reach value. This value corresponds to approxi-mately 10 percent of the maximum channel AMax. This value was selected as it seems statistically significant when comparing channel and mound values. If the mound AMax is not at least 0.3 ft larger than the channel AMax, one can conclude that there is no significant difference between transits in the two reaches. Only 6 wave cases are highlighted for the light-loaded ship.

ERDC/CHL TR-14-3 74
Table 23. Wave motion allowances AMax (ft), Phase 2, light-loaded ship, 12 kt inbound transits.
Wave ID Days/yr
Channel AMax Mound AMax
h = 53 ft h = 55 ft h = 56 ft h = 57 ft
19 0.01 2.68 2.07 2.17 2.25
22 0.02 2.49 1.88 1.95 2.01
46 0.06 2.36 1.58 1.65 1.73
52 0.15 2.27 1.31 1.36 1.42
61 0.01 3.23 1.96 2.01 2.05
64 0.01 3.34 2.08 2.11 2.15
82 0.04 2.38 1.70 1.78 1.86
87 0.52 2.37 1.64 1.71 1.78
92 0.07 2.92 2.12 2.18 2.24
95 0.01 3.06 2.08 2.13 2.18
115 0.10 2.34 1.84 1.93 2.01
119 0.21 2.38 2.00 2.07 2.14
125 0.05 3.00 2.94 2.99 3.03
127 0.01 3.07 3.37 3.39 3.40
147 0.04 2.10 1.77 1.85 1.92
152 0.21 2.04 1.90 1.95 2.01
157 0.12 2.64 2.85 2.83 2.81
158 0.04 2.62 3.23 3.16 3.08
177 0.03 2.24 2.00 2.07 2.15
181 0.17 2.18 2.02 2.08 2.13
205 0.01 2.06 2.40 2.47 2.55
206 0.00 2.56 2.79 2.89 2.98
208 0.03 1.80 2.06 2.10 2.13
209 0.01 2.59 2.78 2.84 2.89
Reference values
DMax, Vk=12 kt 4.62 6.69 7.73 8.76
Minimum 1.80 1.31 1.36 1.42
Average 2.53 2.18 2.24 2.29
Maximum 3.34 3.37 3.39 3.40
Notes: 1. Yellow highlight = AMax,Mound ≥ AMax,Channel + 0.3 ft.
ERDC/CHL TR-14-3 75
CADET UKCNet predictions
Table 24 is the corresponding table for the UKCNet for the light-loaded transits in the channel and mound reaches at Vk = 12 kt. Values highlighted in yellow indicate UKCNet values less than the required UKCMin 2 ft for the channel reach and 4 ft for the mound reach. Grounding is not indicated for any of the Phase 2 waves. Thus, the highlighted values just indicate where some of the UKCMin is used in a reach.
Only 10 of the Phase 2 wave cases are highlighted for channel reach only, mound reach only, or both channel and mound reaches. All of the highlighted waves in the mound reach occur for the shallower depth of h = 55 ft. The worst case for incursion into the UKCMin for the channel reach is UKCNet = 1.28 ft for Wave ID 64. The worst incursion for the mound reach is UKCNet = 2.97 ft at h = 55 ft for Wave ID 127. The average UKCNet for both channel and mound reaches is slightly above the UKCMin. Only Wave ID 87, 119, and 158 show incursions into the UKCMin for the mound and not the channel reach. In general, transits in the mound reach do not experience significantly smaller UKCNet than similar transits in the channel reach. However, the mound UKCMin incursions can be avoided by dredging the mound reach an additional 1 ft to h = 56 ft.
Fully loaded ship
CADET AMax predictions
Table 25 lists the AMax due to the Phase 2 waves for the fully loaded ship transiting channel and mound reaches at Vk = 12 kt. The table is organized similarly to Table 23 for the light-loaded ship.
Again, as a first comparison, all of the AMax in both the channel and mound reaches are less than the DMax values in Table 18. This indicates that there is “room” to accommodate the ship motions without grounding. However, more of the UKCMin will be required in most cases relative to the light-loaded ship. As for the light-loaded ship, the second comparison involves a discussion of the relative magnitudes between the channel and mound AMax. Yellow highlights in the table indicate those mound AMax which are at least 0.3 ft larger than the corresponding channel reach value (i.e., approximately 10 percent). Eleven wave cases are highlighted for the fully loaded ship since it has more draft than the light-loaded ship.
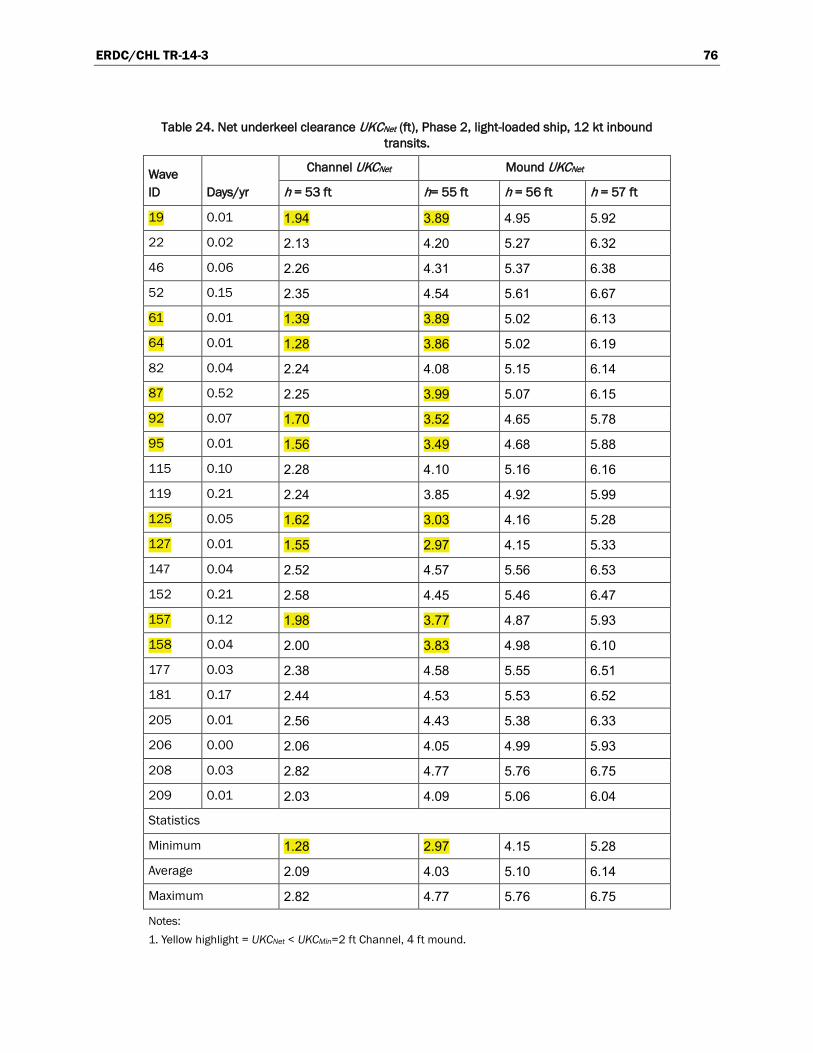
ERDC/CHL TR-14-3 76
Table 24. Net underkeel clearance UKCNet (ft), Phase 2, light-loaded ship, 12 kt inbound transits.
Wave ID Days/yr
Channel UKCNet Mound UKCNet
h = 53 ft h= 55 ft h = 56 ft h = 57 ft
19 0.01 1.94 3.89 4.95 5.92
22 0.02 2.13 4.20 5.27 6.32
46 0.06 2.26 4.31 5.37 6.38
52 0.15 2.35 4.54 5.61 6.67
61 0.01 1.39 3.89 5.02 6.13
64 0.01 1.28 3.86 5.02 6.19
82 0.04 2.24 4.08 5.15 6.14
87 0.52 2.25 3.99 5.07 6.15
92 0.07 1.70 3.52 4.65 5.78
95 0.01 1.56 3.49 4.68 5.88
115 0.10 2.28 4.10 5.16 6.16
119 0.21 2.24 3.85 4.92 5.99
125 0.05 1.62 3.03 4.16 5.28
127 0.01 1.55 2.97 4.15 5.33
147 0.04 2.52 4.57 5.56 6.53
152 0.21 2.58 4.45 5.46 6.47
157 0.12 1.98 3.77 4.87 5.93
158 0.04 2.00 3.83 4.98 6.10
177 0.03 2.38 4.58 5.55 6.51
181 0.17 2.44 4.53 5.53 6.52
205 0.01 2.56 4.43 5.38 6.33
206 0.00 2.06 4.05 4.99 5.93
208 0.03 2.82 4.77 5.76 6.75
209 0.01 2.03 4.09 5.06 6.04
Statistics
Minimum 1.28 2.97 4.15 5.28
Average 2.09 4.03 5.10 6.14
Maximum 2.82 4.77 5.76 6.75
Notes: 1. Yellow highlight = UKCNet < UKCMin=2 ft Channel, 4 ft mound.
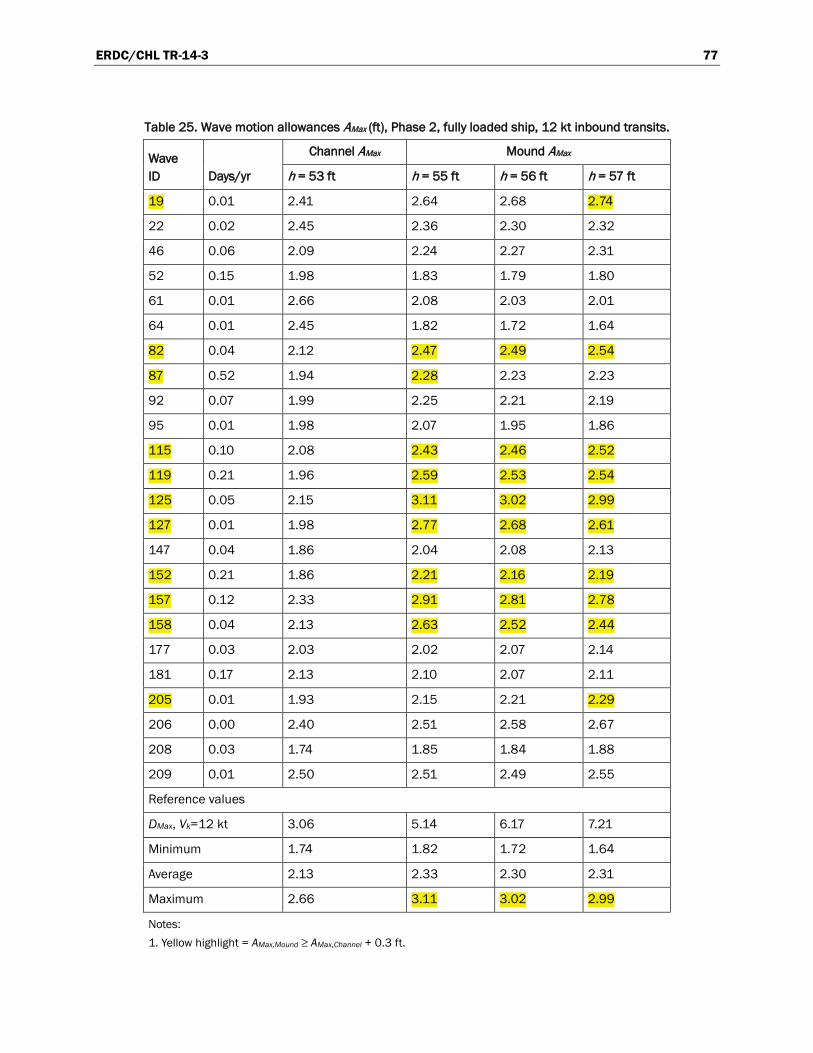
ERDC/CHL TR-14-3 77
Table 25. Wave motion allowances AMax (ft), Phase 2, fully loaded ship, 12 kt inbound transits.
Wave ID Days/yr
Channel AMax Mound AMax
h = 53 ft h = 55 ft h = 56 ft h = 57 ft
19 0.01 2.41 2.64 2.68 2.74
22 0.02 2.45 2.36 2.30 2.32
46 0.06 2.09 2.24 2.27 2.31
52 0.15 1.98 1.83 1.79 1.80
61 0.01 2.66 2.08 2.03 2.01
64 0.01 2.45 1.82 1.72 1.64
82 0.04 2.12 2.47 2.49 2.54
87 0.52 1.94 2.28 2.23 2.23
92 0.07 1.99 2.25 2.21 2.19
95 0.01 1.98 2.07 1.95 1.86
115 0.10 2.08 2.43 2.46 2.52
119 0.21 1.96 2.59 2.53 2.54
125 0.05 2.15 3.11 3.02 2.99
127 0.01 1.98 2.77 2.68 2.61
147 0.04 1.86 2.04 2.08 2.13
152 0.21 1.86 2.21 2.16 2.19
157 0.12 2.33 2.91 2.81 2.78
158 0.04 2.13 2.63 2.52 2.44
177 0.03 2.03 2.02 2.07 2.14
181 0.17 2.13 2.10 2.07 2.11
205 0.01 1.93 2.15 2.21 2.29
206 0.00 2.40 2.51 2.58 2.67
208 0.03 1.74 1.85 1.84 1.88
209 0.01 2.50 2.51 2.49 2.55
Reference values
DMax, Vk=12 kt 3.06 5.14 6.17 7.21
Minimum 1.74 1.82 1.72 1.64
Average 2.13 2.33 2.30 2.31
Maximum 2.66 3.11 3.02 2.99
Notes: 1. Yellow highlight = AMax,Mound ≥ AMax,Channel + 0.3 ft.

ERDC/CHL TR-14-3 78
CADET UKCNet predictions
Table 26 is the corresponding table for the UKCNet for the fully loaded transits in the channel and mound reaches at Vk = 12 kt. Values highlighted in yellow indicate UKCNet values less than the required UKCMin
= 2 ft for the channel reach and 4 ft for the mound reaches. Similarly to the light-loaded ships in Table 24, grounding is not indicated for any of the Phase 2 waves. Thus, the highlighted values just indicate where some of the UKCMin is required in a reach.
All of the channel and mound reach optional depth at h = 55 ft are highlighted. Fifteen of the mound reach with a depth of h = 56 ft are highlighted. However, none of the mound reaches with depths of h = 57 ft are highlighted. The worst case for incursion into the UKCMin for the channel reach is UKCNet = 0.40 ft for Wave ID 61. The worst incursion for the mound reach is UKCNet = 2.03 ft at h = 55 ft for Wave ID 125. The average UKCNet for both channel and mound reaches is less than the UKCMin until h = 57 ft. In general, transits in the mound reach do not cause significantly smaller UKCNet than similar transits in the channel reach. However, the mound incursions can be avoided by dredging the mound reach an additional 2 ft to h = 57 ft.
Summary
Maximum wave-induced vertical ship motions, AMax, and corresponding net underkeel clearance, UKCNet, for Phase 1 and Phase 2 waves were discussed and compared with the maximum ship displacement, DMax. The AMax represent the maximum ship motion at any of the five critical points along the bottom of the ship due to the combined effects of heave, pitch, and roll. The DMax indicates the “space” above the bottom in the water column that is available to accommodate, AMax, after subtracting average ship squat, SAve. The UKCNet is the remaining clearance between the ship and the channel bottom after subtracting SAve and AMax from the UKC. For safety and maneuverability concerns in this study, the sponsor requested a UKCMin of 2 ft for channel transits and 4 ft for mound transits.
The Phase 1 waves consisted of all 211 wave cases from the WIS hindcast. Only the fully loaded ship was tested in Phase 1 as this was the worst case scenario for UKC. In general, outbound transits are much less of a problem than inbound transits as their motions are much smaller. Examples of AMax and corresponding UKCNet for a typical and extreme wave case were
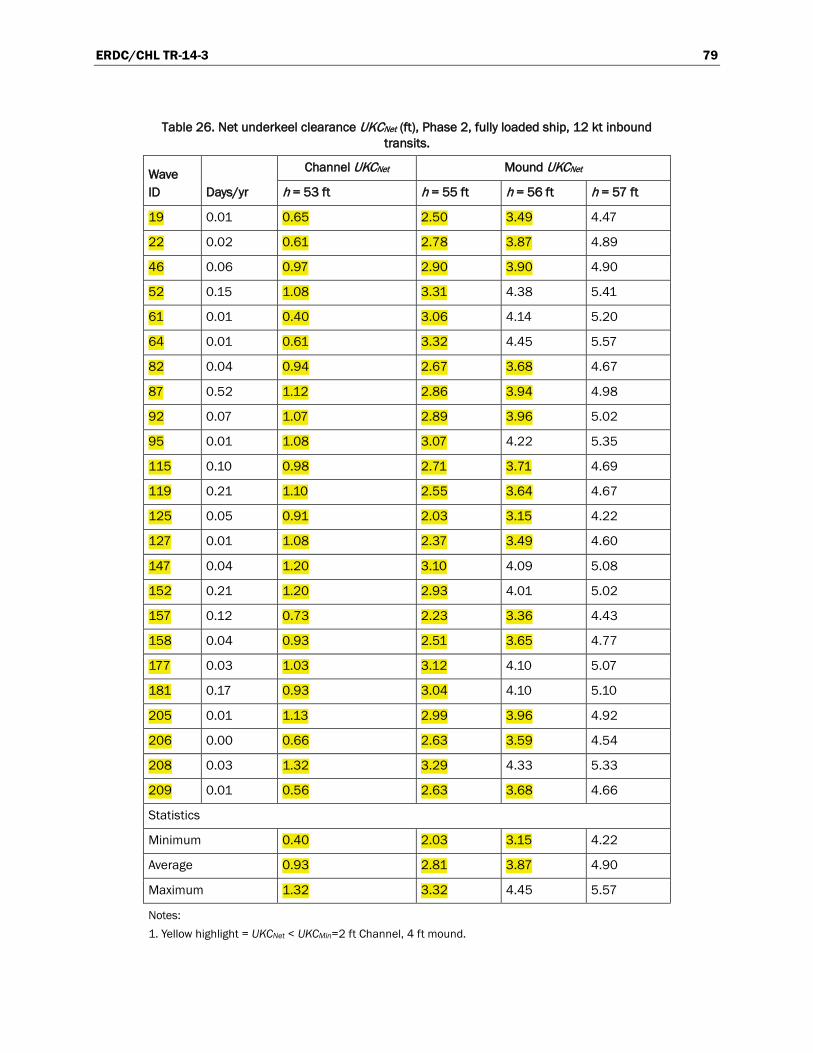
ERDC/CHL TR-14-3 79
Table 26. Net underkeel clearance UKCNet (ft), Phase 2, fully loaded ship, 12 kt inbound transits.
Wave ID Days/yr
Channel UKCNet Mound UKCNet
h = 53 ft h = 55 ft h = 56 ft h = 57 ft
19 0.01 0.65 2.50 3.49 4.47
22 0.02 0.61 2.78 3.87 4.89
46 0.06 0.97 2.90 3.90 4.90
52 0.15 1.08 3.31 4.38 5.41
61 0.01 0.40 3.06 4.14 5.20
64 0.01 0.61 3.32 4.45 5.57
82 0.04 0.94 2.67 3.68 4.67
87 0.52 1.12 2.86 3.94 4.98
92 0.07 1.07 2.89 3.96 5.02
95 0.01 1.08 3.07 4.22 5.35
115 0.10 0.98 2.71 3.71 4.69
119 0.21 1.10 2.55 3.64 4.67
125 0.05 0.91 2.03 3.15 4.22
127 0.01 1.08 2.37 3.49 4.60
147 0.04 1.20 3.10 4.09 5.08
152 0.21 1.20 2.93 4.01 5.02
157 0.12 0.73 2.23 3.36 4.43
158 0.04 0.93 2.51 3.65 4.77
177 0.03 1.03 3.12 4.10 5.07
181 0.17 0.93 3.04 4.10 5.10
205 0.01 1.13 2.99 3.96 4.92
206 0.00 0.66 2.63 3.59 4.54
208 0.03 1.32 3.29 4.33 5.33
209 0.01 0.56 2.63 3.68 4.66
Statistics
Minimum 0.40 2.03 3.15 4.22
Average 0.93 2.81 3.87 4.90
Maximum 1.32 3.32 4.45 5.57
Notes: 1. Yellow highlight = UKCNet < UKCMin=2 ft Channel, 4 ft mound.

ERDC/CHL TR-14-3 80
discussed and compared with DMax. An example of a typical wave, ID 160, occurs 27.1 days/yr with a wave period of 4.3 sec and wave height of 2.8 ft. The extreme wave example, ID 177, occurs only 0.03 days/yr with a wave period of 9.5 sec and height of 8.7 ft. Both waves are from 180.0 deg (south), which is the most frequently occurring wave direction for Ambrose Channel. Average and maximum AMax and UKCNet statistics for all 211 waves were also presented and discussed.
For the typical wave case, both inbound and outbound transits in the channel and mound reaches at the design speed of 12 kt do not pose a problem for grounding as the AMax is less than the DMax and UKCNet is larger than UKCMin. Faster speeds are possible, but will require incursion into the UKCMin. There is no problem of grounding for the high tide level of +5 ft due to the additional water level.
The extreme wave case represents the worst combination of waves and ship squat and occurs very infrequently, a situation that the pilots can usually avoid. Because of the large AMax produced by these waves, pilots should exercise caution for inbound channel transits greater than 8 kt and out-bound greater than 10 kt due to incursion into the UKCMin. Grounding is indicated for speeds greater than 14 kt for inbound and 16 kt for outbound. Mound transits show similar trends, but no grounding due to the larger UKCMin. Again, there is no problem of grounding for the high tide level of +5 ft due to the additional water level.
The results for the average wave cases are between those of the typical and extreme wave cases. The pilots should exercise caution during inbound channel transits for speeds greater than 8 kt and can expect grounding for speeds greater than 12 kt. Outbound transits show similar trends, but are delayed by 2 kt to speeds greater than 14 kt. Mound transits show similar trends for both inbound and outbound transits, but will not experience grounding due to the larger UKCMin. As before, there are no grounding problems at the high tide level.
Finally, for the maximum wave case in Phase 1 with no tide, grounding is indicated for all ship speeds for both inbound and outbound transits in channel and mound reaches. This is an extremely large wave which the pilots will usually be able to avoid. For high tide conditions, grounding is still indicated in the channel reach for all speeds in both transit directions. The mound reach, however, only indicates grounding for speeds greater

ERDC/CHL TR-14-3 81
than 14 kt for inbound transits. The pilots should exercise caution for the other transit directions and slower speeds due to incursion in the UKCMin.
The Phase 2 waves consisted of 24 wave cases that were transformed using STWAVE and CMS-Wave from the WIS hindcast and NOAA buoy offshore sites. Both lightly and fully loaded ships were tested in Phase 2. It was decided to use inbound transits at Vk = 12 kts as the criterion in Phase 2 since this is the typical transit speed and inbound transits have larger ship motions than outbound transits. Dredge depths of h = 53 ft in the channel reach and h = 55, 56, and 57 ft in the mound reach were selected for comparisons. The high tide level is not a problem because of the additional 5 ft of water level. Therefore, only the “no tide” water level is discussed.
For the light-loaded ship at 12 kt, only 10 of the 24 Phase 2 wave cases indicated incursion into the UKCMin. Grounding was not indicated for any of the Phase 2 waves. Values of AMax in the mound transits were flagged if they exceeded 0.3 ft of the corresponding value in the channel transit. This was approximately 10 percent of the maximum channel, AMax, for Phase 2 wave cases. In general, transits in the mound reach did not experience signifi-cantly smaller UKCNet than similar transits in the channel reach. Moreover, the mound UKCMin incursions can be avoided by dredging the mound reach an additional 1 ft to h = 56 ft.
For the fully loaded ship at 12 kt, all of the Phase 2 waves indicated incursion into the UKCMin for the channel reach and the mound reach with a depth of 55 ft. This was due to the deeper draft of the fully loaded ship; however, as for the light-loaded ship, there was no grounding indicated. As the mound reach was deepened, the number of incursions decreased so that at h = 56 ft there were only 15 incursions. The optimal depth for the mound reach is h = 57 ft since this depth indicated no incursions into the UKCMin. As before for the light-loaded ship, transits in the mound reach did not experience significantly smaller UKCNet than similar transits in the channel reach.

ERDC/CHL TR-14-3 82
8 Summary and Conclusions
New York Harbor Pilots have expressed concern about a high spot about 1.5 miles seaward of the new limit of the Ambrose Channel. This “mound” is immediately adjacent to the Sea Buoy, where the old Ambrose Light Tower was located. It is approximately 2,000 ft in diameter with a depth of 53 ft MLLW and is probably construction rubble (i.e., hard material). Now that the Tower is no longer marking this mound, the pilots are concerned about navigation safety should a ship stray across this mound from the normal confines of Ambrose Channel.
The New York District (NAN) asked the US Army Engineer Research and Development Center (ERDC), Coastal and Hydraulics Laboratory (CHL), to evaluate the relative safety between transits over the mound to those in the main entrance channel. The static underkeel clearance (UKC) is the vertical “room” under the ship after subtracting the draft from the project depth. The UKC is composed of six factors, the most significant of which are the wave response allowance due to wave-induced ship motions and ship squat. The net underkeel clearance (UKCNet) is the minimum margin between the channel bed and the keel of the ship in the most unfavorable conditions that should be maintained to insure additional safety against grounding and maintain ship maneuverability.
The design ship for this study was the Susan Maersk Post-Panamax containership. It was completed in 1997 with a capacity of 8,680 TEU (twenty foot equivalents) and a length overall of 1,138 ft. Ship speeds range from 8 kt to 16 kt, with typical ship speeds of 12 kt. In addition to the fully loaded draft of 47.5 ft, a light-loaded draft of 46 ft was also investigated since the lighter ship will respond to waves differently than the fully loaded ship.
The Channel Analysis and Design Evaluation Tool (CADET) is a risk-based method that was used to predict vertical ship motions due to heave, pitch, and roll in each transit scenario. Ship squat was predicted and compared among PIANC, Ankudinov, and CADET ship squat predictors. The CADET vertical motion allowances along with average ship squat predictions were subtracted from UKC to provide a risk-based method of evaluating the UKCNet for the two transit scenarios.
ERDC/CHL TR-14-3 83
The first step in the analysis was to define the wave climate in the Ambrose Channel. Because of the angle of the shore, wave directions outside the range of 56.25 to 213.75 deg will not impact the Ambrose Channel. Therefore, a joint probability distribution of wave height and period was created in seven 22.5-deg direction bands within this direction-limited range. It consisted of 139,071 observations representing 79.3 percent of the 175,310 deepwater data from the WIS 20 yr hindcast buoy WIS126. From these joint probability distributions of wave period and wave height, wave parameter statistics were gathered for generating empirical directional wave spectra representative of the WIS126 deepwater data. A total of 211 directional spectra were simulated based on a TMA frequency spectrum and cosn directional spreading function. In this Phase 1 wave dataset, it was assumed that wave transformation between the WIS126 buoy and the Ambrose Channel was not significant.
A Phase 2 wave dataset was created after preliminary analysis of the ship motion allowances from Phase 1. Only waves that produced a significant effect on transit safety in the main channel were retained in the Phase 2 dataset. These waves were then examined in detail in the numerical models STWAVE and CMS-Wave to determine wave transformation in both main channel and mound locations. The transformed wave parameters were used to create 24 new directional wave spectra in Phase 2 for input to CADET.
Two coastal wave transformation numerical models, STWAVE and CMS-Wave, were used to calculate wave parameters (height, period, and direction) at the entrance of the Ambrose Channel and over the mound in the vicinity. These directional spectral wave models were applied in the half-plane wave transformation mode, meaning that wave energy transformation was limited from offshore toward the coastline in a 0 to 180 deg sector of the primary incident wave direction in deep water. The reason for using two wave models was because STWAVE is adequate for the nearshore wave transformation outside the surf zone while CMS-Wave is designed specifically for inlet and bay applications involving processes where waves interact with tides, currents, navigation channels, muddy bottoms, and coastal structures such as breakwaters, jetties, spurs, and groins. The results from both models were very similar. The main purpose of the wave modeling was to evaluate the wave refraction deformation, shoaling, and wave focusing at and in the lee of a submerged mound, just east of the Ambrose Channel Entrance. Wave input information was based
ERDC/CHL TR-14-3 84
on design wave conditions and prepared by SMS to generate directional spectrum as input at the model grid sea boundary.
Ship squat was compared for PIANC, Ankudinov, and CADET predictions. The five PIANC empirical squat formulas included those of Barrass, Eryuzlu, Huuska, Römisch, and Yoshimura. The Ankudinov formula was originally used in the Ship-Tow Simulator. The CADET squat formula is based on the work of Beck, Newman, and Tuck.
Seven predictors of ship squat were compared for both the lightly and fully loaded Susan Maersk transits in the Ambrose Channel for a range of ship speeds from 8 to 16 kt. The purpose was to indicate (a) the relative amount of UKC required for ship squat for Ankudinov, CADET, Barrass, Eryuzlu, Huuska/Guliev, Römisch, and Yoshimura predictors and (b) the effect of the deeper mound on ship squat relative to the shallower channel transits. The largest squat will occur for the fully loaded ship in the channel with the no tide conditions since the UKC is the smallest and the ship will “feel” the bottom more. The UKC in this case is 5.5 ft (i.e., 53.0 – 47.5 ft). For a ship transiting the channel at a speed of 12 kt, squat can range from 1.46 to 3.08 ft, with an average of 2.44 ft. Even at a ship speed of 16 kt, the squat increases from a low of 2.99 to a high of 5.51 ft, with an average of 4.64 ft. Therefore, during transits where wave activity is relatively insignificant, ship squat should not be a problem, even at the fastest ship speeds. Of course, one will still want to maintain the UKCMin of 2 to 4 ft in the channel and mound reaches, respectively.
For the mound transits with the same fully loaded and no tide conditions, the UKC is 7.5 ft (i.e., 55.0 – 47.5 ft). For a ship transiting the channel at a speed of 12 kt, squat can range from 1.40 to 3.08 ft, with an average of 2.36 ft. Even at a ship speed of 16 kt, the squat increases from a low of 2.85 to a high of 5.45 ft, with an average of 4.46 ft. Again, during transits where wave activity is relatively insignificant, ship squat should not be a problem, even at the fastest ship speeds.
For the light-loaded ship, the predicted ship squat is slightly less, plus the shallower draft of 46 ft provides an additional 1.5 ft of UKC. Ship squat is not a problem for the high tide condition as the predicted squat is slightly lower and an additional UKC of 5 ft is available.
ERDC/CHL TR-14-3 85
Wave-induced vertical ship motions are composed of the combined effects of heave, pitch, and roll at the five critical points on the bottom of the ship. CADET calculates these vertical motion allowances for each ship loading condition, channel reach, and water depth. The allowances are output for each wave condition, transit direction, ship speed, and critical or alternative points. The FORTRAN program ReadIn_CADET_Allow2 reads in these files and calculates the largest allowance over all five critical points for each wave condition, ship speed, and transit direction. These “maximum” values are used for comparisons in this report.
Maximum wave-induced vertical ship motions, AMax, and corresponding UKCNet for Phase 1 and Phase 2 waves were discussed and compared with the maximum ship displacement, DMax. The AMax represents the maximum ship motion at any of the five critical points along the bottom of the ship due to the combined effects of heave, pitch, and roll. The DMax indicates the “space” above the bottom in the water column that is available to accommodate AMax after subtracting average ship squat, SAve. The UKCNet is the remaining clearance between the ship and the channel bottom after subtracting SAve and AMax from the UKC. For safety and maneuverability concerns in this study, the sponsor requested a minimum UKCMin of 2 ft for channel transits and 4 ft for mound transits.
The Phase 1 waves consisted of all 211 wave cases from the WIS hindcast. Only the fully loaded ship was tested in Phase 1 as this was the worst case scenario for UKC. In general, outbound transits are much less of a problem than inbound transits as their motions are much smaller. Examples of AMax and corresponding UKCNet for a typical and extreme wave case were discussed and compared with DMax. An example of a typical wave, ID 160, occurs 27.1 days/yr with a wave period of 4.3 s and wave height of 2.8 ft. The extreme wave example, ID 177, occurs only 0.03 days/yr with a wave period of 9.5 s and height of 8.7 ft. Both waves are from 180.0 deg (south), which is the most frequently occurring wave direction for Ambrose Channel. Average and maximum AMax and UKCNet statistics for all 211 waves were also presented and discussed.
For the typical wave case, both inbound and outbound transits in the channel and mound reaches at the design speed of 12 kt do not pose a problem for grounding as the AMax is less than the DMax and UKCNet is larger than UKCMin. Faster speeds are possible, but will require incursion
ERDC/CHL TR-14-3 86
into the UKCMin. There is no problem of grounding for the high tide level of +5 ft due to the additional water level.
The extreme wave case represents the worst combination of waves and ship squat and occurs very infrequently, a situation that the pilots can usually avoid. Because of the large AMax produced by these waves, pilots should exercise caution for inbound channel transits greater than 8 kt and outbound greater than 10 kt due to incursion into the UKCMin. Grounding is indicated for speeds greater than 14 kt for inbound and 16 kt for outbound. Mound transits show similar trends, but no grounding due to the larger UKCMin. Again, there is no problem of grounding for the high tide level of +5 ft due to the additional water level.
The results for the average wave cases are between those of the typical and extreme wave cases. The pilots should exercise caution during inbound channel transits for speeds greater than 8 kt and can expect grounding for speeds greater than 12 kt. Outbound transits show similar trends, but are delayed by 2 kt to speeds greater than 14 kt. Mound transits show similar trends for both inbound and outbound transits, but will not experience grounding due to the larger UKCMin. As before, there are no grounding problems at the high tide level.
Finally, for the maximum wave case in Phase 1 with no tide, grounding is indicated for all ship speeds for both inbound and outbound transits in channel and mound reaches. This is an extremely large wave which the pilots will usually be able to avoid. For high tide conditions, grounding is still indicated in the channel reach for all speeds in both transit directions. The mound reach, however, only indicates grounding for speeds greater than 14 kt for inbound transits. The pilots should exercise caution for the other transit directions and slower speeds due to incursion in the UKCMin.
The Phase 2 waves consisted of 24 wave cases that were transformed using STWAVE and CMS-Wave from the WIS hindcast and NOAA buoy offshore sites. Both lightly and fully loaded ships were tested in Phase 2. It was decided to use inbound transits at Vk = 12 kts as the criterion in Phase 2 since this is the typical transit speed and inbound transits have larger ship motions than outbound transits. Dredge depths of h = 53 ft in the channel reach and h = 55, 56, and 57 ft in the mound reach were selected for comparisons. The high tide level is not a problem because of the additional 5 ft of water level. Therefore, only the “no tide” water level is discussed.

ERDC/CHL TR-14-3 87
For the light-loaded ship at 12 kt, only 10 of the 24 Phase 2 wave cases indicated incursion into the UKCMin. Grounding was not indicated for any of the Phase 2 waves. Values of AMax in the mound transits were flagged if they exceeded 0.3 ft of the corresponding value in the channel transit. This was approximately 10 percent of the maximum channel AMax for Phase 2 wave cases. In general, transits in the mound reach did not experience signifi-cantly smaller UKCNet than similar transits in the channel reach. Moreover, the mound UKCMin incursions can be avoided by dredging the mound reach an additional 1 ft to h = 56 ft.
For the fully loaded ship at 12 kt, all of the Phase 2 waves indicated incursion into the UKCMin for the channel reach and the mound reach with a depth of 55 ft. This was due to the deeper draft of the fully loaded ship; however, as for the light-loaded ship, there was no grounding indicated. As the mound reach was deepened, the number of incursions decreased so that at h = 56 ft there were only 15 incursions. The optimal depth for the mound reach is h = 57 ft since this depth indicated no incursions into the UKCMin. As before, for the light-loaded ship transits in the mound reach did not experience significantly smaller UKCNet, than similar transits in the channel reach.

ERDC/CHL TR-14-3 88
References Ankudinov, V. K., and B. K. Jakobsen. 1996. Squat predictions at an early stage of design,
Workshop on Ship Squat in Restricted Waters (October 4, Washington), SNAME, Jersey City, NJ, pp. 48-69.
Ankudinov, V., L. Daggett, C. Huval, and C. Hewlett. 1996. Squat predictions for maneuvering applications, International Conference on Marine Simulation and Ship Maneuverability, MARSIM ’96, Balkema, Rotterdam, The Netherlands: Copenhagen, Denmark, pp. 467-495, September 9-13, 1996.
Ankudinov, V., L. L. Daggett, J. C, Hewlett, and B. K. Jakobsen. 2000. Prototype measurement of ship sinkage in confined water, International Conference on Marine Simulation and Ship Maneuverability (MARSIM 2000), Orlando, FL, May 8-12.
Barrass, C. B. 2009. Ship Squat and Interaction, Witherby Seamanship International Ltd Publishing, Edinburgh, Scotland, UK, 182 pp.
Battjes, J. A. 1972. Set-up due to irregular waves, In Proceedings 13th International Conference on Coastal Engineering, ASCE, 1993-2004.
Battjes, J. A., and J. Janssen. 1978. Energy loss and set-up due to breaking of random waves, In Proceedings 16th International Conference Coastal Engineering, ASCE, 569-587.
Beck, R. F., J. N. Newman, and E. O. Tuck. 1975. Hydrodynamic forces on ships in dredged channels, Journal of Ship Research, 9(3).
Borgman, L. E. 1990. Irregular ocean waves: kinematics and forces, Chapter 4, The Sea. B. Le Mehaute and D. Hanes (ed.). New York, NY: John Wiley and Sons, 121-168.
Bouws, E., and G. J. Komen. 1983. On the balance between growth and dissipation in extreme, depth limited wind-sea in the southern North Sea, Journal of Physical Oceanography 13(1): 653-1,658.
Bouws, E., H. Gunther, W. Rosenthal, and C. Vincent. 1985. Similarity of the wind wave spectrum in finite depth water, J. Geophys. Res., 90(C1): 975-986.
Bretherton, F. P., and C. J. R. Garrett. 1968. Wave trains in inhomogeneous moving media, In Proceedings Royal Society of London A(302):529-554.
Briggs, M. J. 2006. Ship squat predictions for Ship/Tow Simulator. ERDC/CHL CHETN-I-72, Vicksburg, MS: US Army Engineer Research and Development Center.
Briggs, M. J. 1988. Unidirectional spectral wave generation and analysis in wave basins. Tech. Rept. CERC 88-11. Vicksburg, MS: USACE, Waterways Experiment Station.
ERDC/CHL TR-14-3 89
Briggs, M. J. 2009. Ankudinov ship squat predictions – Part I: Theory and FORTRAN programs, ERDC/CHL CHETN-IX-19, Vicksburg, MS: US Army Engineer Research and Development Center.
Briggs, M. J. and L. Daggett. 2009. Ankudinov ship squat predictions – Part II: Laboratory and field comparisons and validations, ERDC/CHL CHETN-IX-20, Vicksburg, MS: US Army Engineer Research and Development Center.
Briggs, M. J. and W. G. Henderson. 2011. Vertical ship motion study for Savannah, GA Entrance Channel, ERDC/CHL TR-11-5, Vicksburg, MS: US Army Engineer Research and Development Center,pp. 221.
Briggs, M. J., L. E. Borgman, and D. G. Outlaw. 1987. Generation and analysis of directional spectral waves in a laboratory basin. In Proc. Offshore Tech. Conf., Houston, TX, 495-502.
Briggs, M.J., Silver, A.L, and Kopp, P.J. 2004. CADET: A tool for predicting underkeel clearance in deep-draft entrance channels, CEO6, Baltimore, MD, Oct.
Briggs, M. J., A. L. Silver, and L. E. Borgman. 2006. Risk-based predictions for ship underkeel clearance, ICCE 2006, San Diego, CA.
Briggs, M. J., A. L. Silver, and P. J. Kopp. 2012. Chapter 6: Risk-Based channel depth design Using CADET, Series on Coastal and Ocean Engineering Practice, Editor: Y. Kim, Vol. 1, World Scientific Press, Singapore,319-366.
Briggs, M. J., P. J. Kopp, F. A. Santangelo, and A. L. Silver. 2010. Comparison of CADET vertical ship motions with DGPS in Ambrose Channel, PORTS 2010, Jacksonville, FL, April, 689-698.
Briggs, M. J., A. L. Silver, P. J. Kopp, F. A. Santangelo, and I. A. Mathis. 2013. Validation of a risk-based numerical model for predicting deep-draft underkeel clearance, ASCE, Journal of Waterway, Port, Coastal, and Ocean Engineering, 139(4): 267-276.
Buttolph, A. M., C. W. Reed, N. C. Kraus, N. Ono, M. Larson, B. Camenen, H. Hanson, T. Wamsley, and A. Zundel. 2006. Two-dimensional depth-averaged circulation model CMS-M2D: Version 3.0: Report 2, sediment transport and morphology change. ERDC/CHL TR-06-9. Vicksburg, MS: US Army Engineer Research and Development Center.
Chawla, A., and J. T. Kirby. 2002. Monochromatic and random wave breaking at blocking points, Journal of Geophysical Research 107(C7), 10.1029/2001JC001042.
Collins, J. I. 1972. Prediction of shallow water spectra, Journal of Geophysical Research 77(15):2693-2707.
d'Angremond, K., J. W. Van der Meer, and R. J. de Jong.1996. Wave transmission at low-crested structures, In Proceedings 25th International Conference on Coastal Engineering, Orlando, FL. USA, ASCE, 2418-2427.
Dean, R. G., and R. A. Dalrymple. 1984. Water wave mechanics for engineers and scientists. Englewood Cliffs, NJ: Prentice-Hall, Inc.

ERDC/CHL TR-14-3 90
Demirbilek, Z., and V. Panchang. 1998. CGWAVE: A coastal surface-water wave model of the mild-slope equation. CHL-98-26. Vicksburg, MS: US Army Engineer Waterways Experiment Station.
Demirbilek, Z., L. Lin, and A. Zundel. 2007. WABED model in the SMS: Part 2. Graphical interface. ERDC/CHL CHETN-I-74. Vicksburg, MS: US Army Engineer Research and Development Center.
Demirbilek, Z., L. Lin, and O. G. Nwogu. 2008. Wave modeling for jetty rehabilitation at the Mouth of the Columbia River, Washington/Oregon, USA. ERDC/CHL TR-08-3. Vicksburg, MS: US Army Engineer Research and Development Center.
Demirbilek, Z., M. Mohr, and S. Chader. 2010. Phase 1 study final letter report: Wave modeling for Cleveland Harbor, Ohio, Letter Report, Jul 2010, p.77.
Demirbilek, Z., L. Lin, W.C. Seabergh, H. Mase, and J. Zheng. 2009. Laboratory and numerical studies of hydrodynamics near jetties, Coastal Engineering 51(2): 143-175.
Eryuzlu, N.E., Y. L. Cao, F. D’Agnolo. 1994. Underkeel requirements for large vessels in shallow waterways, 28th International Navigation Congress, PIANC, Paper S II-2, Sevilla, Spain, 17-25.
Goda, Y. 1985. Random seas and design of maritime structures. University of Tokyo Press.
Guliev, U. M. 1971. On squat calculations for vessels going in shallow water and through channels, PIANC Bulletin 1971, Vol. 1, No. 7, 17-20.
Hardy, T. A. 1993. The attenuation of spectral transformation of wind waves on a coral reef. Queensland, Australia: James Cook University of North Queensland, Townsville, 336 p.
Härting, A., A. Laupichler, and J. Reinking. 2009. Consideration on the squat of unevenly trimmed ships, Ocean Engineering, 36, Elsevier, February, 193-201.
Hasselmann, K., T. P. Barnett, E. Bouws, H. Carlson, D. E. Cartwright, K. Enke, J. A. Ewing, H. Gienapp, D. E. Hasselmann, P. Kruseman, A. Meerbrug, P. Muller, D. J. Olbers, K. Richter, W. Sell, and H. Walden. 1973. Measurements of wind-wave growth and swell decay during the Joint North Sea Wave Project (JONSWAP), Deutsche Hydrographische Zeitschrift A80(12): 95 p.
Hearn, C. J. 1999. Wave-breaking hydrodynamics within coral reef systems and the effect of changing relative sea level, Journal of Geophysical Research 104(C12):30,007-30,019.
Hughes, S. A. 1984. The TMA Shallow-Water Spectrum Description and Applications. Tech. Rept. CERC-84-7. Vicksburg, MS: U.S. Army Engr. Waterways Experiment Station.
Huuska, O. 1976. On the evaluation of underkeel clearances in finnish waterways, Helsinki University of Technology, Ship Hydrodynamics Laboratory, Otaniemi, Report No. 9.

ERDC/CHL TR-14-3 91
Iwagaki, Y., T. Asano, Y. Yamanaka, and F. Nagai. 1980. Wave breaking due to currents, Annual Journal of Coastal Engineering 27:30-34, JSCE (in Japanese).
Jenkins, A. D., and O. M. Phillips. 2001. A simple formula for nonlinear wave-wave interaction, Journal of Offshore and Polar Engineering 11(2):81-86.
Jonsson, I. G. 1990. Wave-current interactions, Chapter 7, The Sea. B. Le Mehaute and D. Hanes (ed.). New York, NY: John Wiley and Sons, 65-120.
Kaplan, P. 1996a. Technical manual for SCORES II program – Finite Depth Version, Hydrodynamics, Inc., Report No. 96-101A, Jun.
Kaplan, P. 1996b. Sample Calculations and Verification of SCORES II – Finite Depth Program, Hydrodynamics, Inc., Report No. 96-101B, June.
Komar, P. D. 1998. Beach processes and sedimentation. 2nd ed. Upper Saddle River, NJ: Prentice-Hall, Inc.
Kopp, P. J., and A. L. Silver. 2005. Program documentation for the channel analysis and design evaluation tool (CADET), David Taylor Model Basin, Carderock Division, Naval Surface Warfare Center NSWCCD-50-TR-2005/004, May.
Lamb, H., 1932. Hydrodynamics. 6th ed. New York: Dover Publications.
Larson, M., and N. C. Kraus. 2002. NMLONG: Numerical model for simulating longshore current. ERDC/CHL TR-02-22. Vicksburg, MS: US Army Engineer Research and Development Center.
Lin, L., and R.-Q. Lin. 2004a. Wave Breaking Function, Proceedings 8th International Workshop on Wave Hindcasting and Prediction. Oahu, Hawaii: North Shore. November 14-19.
Lin, R.-Q., and L. Lin. 2004b. Wind input function, In Proceedings 8th International Workshop on Wave Hindcasting and Prediction. North Shore, Oahu, Hawaii. November 14-19.
Lin, L., and Z. Demirbilek. 2005. Evaluation of two numerical wave models with inlet physical model, J. Waterway, Port, Coastal, and Ocean Engineering, 131(4): 149-161.
Lin, L., Z. Demirbilek, and F. Yamada. 2008. CMS-Wave: A nearshore spectral wave processes model for coastal inlets and navigation projects. ERDC/CHL TR-08-13, Vicksburg, MS: US Army Engineer Research and Development Center.
Lin, L., Z. Demirbilek, J. Zheng, and H. Mase. 2010. Rapid calculation of nonlinear wave-wave interactions in wave-action balance equation, In Proceedings of the International Conference on Coastal Engineering, No. 32. Shanghai, China. Retrieved from http://journals.tdl.org/ICCE/
Lin, L., H. Mase, F. Yamada, and Z. Demirbilek. 2006. Wave-action balance equation diffraction (WABED) model: Test of wave diffraction and reflection at inlets, ERDC/CHL CHETN-III-73, Vicksburg, MS: US Army Engineer Research and Development Center.
ERDC/CHL TR-14-3 92
Lin, L., Z. Demirbilek, and H. Mase. 2011. Recent capabilities of CMS-Wave: A coastal wave model for inlets and navigation projects, In Proceedings, Symposium to honor Dr. Nicholas Kraus. Journal of Coastal Research, Special Issue 59: 7-14.
Lowe, R. J., J. L. Falter, M. D. Bandet, G. Pawlak, M. J. Atkinson, S. G. Monismith, and J. R. Koseff. 2005. Spectral wave dissipation over a barrier reef, Journal of Geophysical Research 110(C04001), doi:10.1029/2004JC002711, 16 p.
Macagno, E. O. 1953. Houle dans un can presentent un passage en charge, La Houille Blanche 9(1):10–37.
Mase, H. 2001. Multidirectional random wave transformation model based on energy balance equation, Coastal Engineering Journal 43(4):317-337 JSCE.
Mase, H., H. Amamori, and T. Takayama. 2005a. Wave prediction model in wave-current coexisting field, In Proceedings 12th Canadian Coastal Conference (CD-ROM).
Mase, H., K. Oki, T. S. Hedges, and H. J. Li. 2005b. Extended energy-balance-equation wave model for multidirectional random wave transformation, Ocean Engineering 32(8-9):961-985.
Miche, M. 1951. Le pouvoir reflechissant des ouvrages maritimes exposes a 1’action de la houle. Annals des Ponts et Chau.ssess. 121e Annee: 285-319 (translated by Lincoln and Chevron, University of California, Berkeley, Wave Research Laboratory, Series 3, Issue 363, June 1954).
NEMOS. 2000. Nearshore evolution modeling system, Version 1.01C. Vicksburg, MS, VeriTech, Inc.
Ochi, M.K. 1973. On prediction of extreme values, Journal of Ship Research, 17.
Phillips, O. M. 1957. On the generation of waves by turbulent wind. Journal of Fluid Mechanics 2:417-445.
PIANC. 1997. Approach Channels: A Guide for Design, Final Report of the Joint PIANC-IAPH Working Group II-30 in cooperation with IMPA and IALA, Supplement to Bulletin No. 95, June.
PIANC. 2013. Approach Channels: A Guide for Design, Final Report of the Joint PIANC-IAPH Working Group 49 in cooperation with IMPA and IALA, (In publication).
Römisch, K. 1989. Empfehlungen zur Bemessung von Hafeneinfahrten, Wasserbauliche Mitteilungen der Technischen Universität Dresden, Heft 1, 39-63.
Sakai, S., N. Kobayashi, and K. Koike. 1989. Wave breaking criterion with opposing current on sloping bottom: an extension of Goda’s breaker index, Annual Journal of Coastal Engineering 36:56-59, JSCE (in Japanese).
Silver, A. L. 1992. Environmental monitoring and operator guidance system (EMOGS) for Shallow Water Ports, Ports ’92, ASCE, Seattle, WA, Jul, 535-547.
Silver, A.L. and Dalzell, J. F. 1997. Risk-based Decisions for Entrance Channel Operation and Design, 7th ISOPE Conference, May, 815-822.

ERDC/CHL TR-14-3 93
Smith, J. M. 2001. Modeling nearshore transformation with STWAVE. ERDC/CHL CHETN I-64. Vicksburg, MS: US Army Engineer Research and Development Center. http://chl.erdc.usace.army.mil/chetn.
Smith, J. M. 2007. Full-plane STWAVE with Bottom Friction: II. Model overview. CHETN-I-75. Vicksburg, MS: US Army Engineer Research and Development Center. http://chl.erdc.usace.army.mil/chetn.
Smith J. M. and A. Zundel. 2006. Full Plane STWAVE: SMS graphical interface. ERDC/CHL CHETN-I-71. Vicksburg, MS: US Army Engineer Research and Development Center.
Smith, J. M., D. T. Resio, and C. L. Vincent. 1997. Current-induced breaking at an idealized inlet, In Proc. Coastal Dynamics ’97. ASCE. 993-1002.
Smith, J. M., D. T. Resio, and A. Zundel. 1999. STWAVE: Steady-state spectral wave model, Report 1: User’s manual for STWAVE Version 2.0. Instruction Report CHL-99-1. Vicksburg, MS: US Army Engineer Waterways Experiment Station.
Smith, J. M., A. R. Sherlock, and D. T. Resio. 2001a. STWAVE: Steady-state spectral wave model user’s manual for STWAVE, Version 3.0, Special Report ERDC/CHL SR-01-1,Vicksburg, MS: US Army Engineer Research and Development Center, Coastal and Hydraulics Laboratory.
Smith, J. M., D. K. Stauble, B. P. Williams, and M. J. Wutkowski. 2001b. Impact of Savannah Harbor deep draft navigation project on Tybee Island Shelf and shoreline, Special Report ERDC/CHL TR-08-5, Vicksburg, MS: US Army Engineer Research and Development Center.
Smith, J. M., W. C. Seabergh, G. S. Harkins, and M. J. Briggs. 1998. Wave breaking on a current at an idealized inlet. CHL-98-31. Vicksburg, MS: US Army Engineer Waterways Experiment Station.
Stauble, D. K., J. E. Davis, J. Z. Gailani, L. Lin, E. F. Thompson, H. Benson, T. C. Pratt, and M. P. Rollings. 2001. Construction, Monitoring and Data Analysis of a Nearshore Mixed-Sediment Mound, Mobile Bay Entrance, Alabama. Technical Report ERDC/CHL-01-xx (Draft), Vicksburg, MS: US Army Engineer Research and Development Center.
Stocks, D. T., L. L. Daggett, and Y. Page. 2002. Maximization of Ship Draft in the St. Lawrence Seaway Volume I: Squat Study. Prepared for Transportation Development Centre, Transport Canada, June.
Thompson, E. F., L. L. Hadley, W. A. Brandon, D. D. McGeehee, and J. M. Hubertz. 1996. Wave Response of Kahului Harbor, Maui, Hawaii. Technical Report ERDC/CHL-96-11. Vicksburg, MS: US Army Engineer Research and Development Center.
Thompson, E. F. 2002. Wave Modeling, Navigation Study for Savannah Harbor, Georgia, ERDC/CHL TR-02-xx (DRAFT), Vicksburg, MS: US Army Engineer Research and Development Center. August, 24 pages.
Tuck, E. O. 1966. Shallow-Water Flows Past Slender Bodies. Journal of Fluid Mechanics, 26(1): pp. 81-95.
ERDC/CHL TR-14-3 94
Tuck, E. O. 1967. Sinkage and Trim in Shallow water of Finite Width, Schiffstechnik, 14(73): pp. 92-94.
Yoshimura, Y. 1986. Mathematical model for the maneuvering ship motion in shallow water, Journal of the Kansai Society of Naval Architects, Japan, No. 200.
Vincent, C. L.,and M. J. Briggs. 1989. Refraction-Diffraction of Irregular Waves over A Mound, ASCE WPCOE, 115(2), Mar.
Whitham, G. B. 1974. Linear and nonlinear waves. New York, NY: John Wiley.
Zheng, J., H. Mase, Z. Demirbilek, and L. Lin. 2008. Implementation and evaluation of alternative wave breaking formulas in a coastal spectral wave model, Ocean Engineering, 35: 1090- 1101.
Zundel, A. 2006. Surface-water modeling system reference manual – Version 9.2. Provo, UT: Brigham Young University Environmental Modeling Research Laboratory.
ERDC/CHL TR-14-3 95
Appendix A: CMS-Wave Numerical Model Capabilities for Navigation Projects
Two numerical wave models were used in this study to predict wave parameters at the Ambrose Channel Entrance and on the nearby mound. These models were described in Chapter 3 and estimates were discussed in Chapter 5. Because CMS-Wave has several additional features geared for navigation projects, this appendix contains descriptions of several of the CMS-Wave capabilities and a listing of the input control parameters used in the code. The capabilities include (a) wave diffraction, (b) wave-current interaction, (c) wave reflection, (d) wave breaking, (e) wind forcing and whitecapping dissipation, (f) wave generation with arbitrary wind direction, (g) bottom friction loss, (h) wave runup, (i) wave transmission and overtopping, (j) grid nesting, (k) variable rectangular-cell grid, (l) nonlinear wave-wave interaction, (m) wave dissipation over muddy bottom, (n) full-plane and wind field input capabilities, and (o) fast-mode calculations.
A summary of the control parameters used in CMS-Wave are presented at the end of this appendix. A discussion of the default values is also provided.
Interested readers may consult publications listed in the References section which specifically deal with these features and their applications to practical problems (Lin and Lin 2004a and 2004b; Lin et al. 2008; Lin et al. 2010; Lin et al. 2011; Demirbilek et al. 2007; Demirbilek et al. 2008; Demirbilek et al. 2009; Demirbilek et al. 2010; and Zheng at al. 2008).
Capability descriptions
Wave diffraction
In applications, the diffraction intensity parameter κ (see Equations 10 and 12 in Chapter 3) needs to be calibrated and optimized for structures. The model omits the diffraction effect for κ = 0 and calculates diffraction for κ>0. Large κ (>15) should be avoided as it can cause artificial wave energy losses. In practice, values of κ between 0 (no diffraction) and 4 (strong diffraction) have been determined in comparison to measurements. A default value of κ = 2.5 was used by Mase (2001) and Mase et al. (2005a) to

ERDC/CHL TR-14-3 96
simulate wave diffraction for both narrow and wide gaps between breakwaters. In CMS-Wave, the default value of κ is 4 corresponding to strong diffraction. This default (κ) is recommended for wave diffraction at a semi-infinite long breakwater or at a narrow gap (e.g., harbor entrance or jettied inlet), with the opening equal or less than one wavelength (Demirbilek and Panchang 1998). For a relatively wider gap, with an opening greater than one wavelength, κ = 3 is recommended. The exact value of κ in an application is dependent on the structure geometry and adjacent bathymetry, and it may need to be verified with measurements.
Wave-current interaction
The characteristic velocties Cx, Cy, and Cθ in Equation (10) are expressed as follows:
cosθx gC C U (A1)
sinθy gC C V (A2)
θ
σsinθ cosθ
sinh
cosθsinθ cos θ sin θ sinθcosθ
h hCkh x y
U U V Vx y x y
2 2
2 (A3)
where U and V are the depth-averaged horizontal current velocity components along the x and y axes, k is wave number, and h is water depth. The dispersion relationships between the relative angular frequency, σ, the absolute angular frequency, ω, the wave number vector,
k
, and the current velocity vector, U U V 2 2
are
σ ω k U
(A4)
and
σ tanh( )gk kh2 (A5)
where k U
is the Doppler-shifting term (e.g., Jonsson 1990; Chawla and Kirby 2002; Demirbilek and Panchang 1998; Sakai et al. 1989; and Smith et

ERDC/CHL TR-14-3 97
al. 1997), and g is the gravitational acceleration. The main difference between the wave transformation models with and without ambient currents lies in the solution of the intrinsic frequency. In treatment of the dispersion relation with the Doppler shift, there is no solution corre-sponding to wave blocking, if intrinsic group velocity, Cg, is weaker than an opposing current (; Larson and Kraus 2002 and Smith et al. 1998):
σ
/gdC U k kdk
(A6)
Under the wave blocking condition, waves cannot propagate into a strong opposing current. The wave energy is most likely to dissipate through breaking with a small portion of energy either reflected or transformed to lower frequency components in the wave blocking condition. In CMS-Wave, the wave-action corresponding to the wave blocking is set to zero for the corresponding frequency and direction bin.
Wave reflection
The wave energy reflected at a beach or upon the surface of a structure is calculated under assumptions that the incident and reflected wave angles are equal and that the reflected energy is a given fraction of the incident wave energy. The reflected wave action, Nr, is assumed linearly proportional to the incident wave action Ni:
r r iN K N 2 (A7)
where Kr is a reflection coefficient (Kr = 0 for no reflection and Kr = 1 for full reflection) defined as the ratio of reflected to incident wave height (Dean and Dalrymple 1984).
CMS-Wave calculates the wave energy reflection at a sidewall or a lateral solid boundary within the wave transformation routine. It can also calculate wave reflection off the beach or detached breakwater using a backward marching calculation routine (Mase et al. 2005a). Users should be aware that, while the computer run time with the forward reflection can be efficient, the time is almost double for the backward reflection routine.

ERDC/CHL TR-14-3 98
Wave breaking
The simplest wave breaking criterion in finite depth is a linear function of the ratio of wave height to depth. For random waves, the criterion is the same as the one used in STWAVE (Smith et al. 1999)
.bHh
0 64 (A8)
where Hb denotes the significant breaking wave height. CMS-Wave applies a revised limiting steepness criterion originally proposed by Miche (1951) for random waves as
.
tanh( )b pp
H k hk
0 64
(A9)
where kp is the wave number corresponding to the spectral peak. In the shallow water condition (kph small), Equation (A9) reduces asymptotically to Equation (A8). Iwagaki et al. (1980) verified that Miche’s breaker criterion could replicate laboratory measurements over a sloping beach with a current present provided that the wavelength was calculated with the current included in the dispersion equation.
In CMS-Wave, the depth-limited spectral energy dissipation can be selected from four different formulas: (a) Extended Goda formulation (Sakai et al. 1989), (b) Extended Miche (Battjes 1972; Mase et al. 2005b), (c) Battjes and Janssen (1978), and (d) Chawla and Kirby (2002). These formulas are considered more accurate for wave breaking on a current and can be divided into two generic categories (Zheng et al. 2008). The first class of formula-tions attempt to simulate the energy dissipation due to wave breaking by truncating the tail of the Rayleigh distribution of wave height on the basis of some breaker criterion. The Extended Goda and Extended Miche formulas belong to this class. The second category of wave breaking formulas uses a bore model analogy (Battjes and Janssen 1978) to estimate the total energy dissipation. The Battjes and Janssen formula and Chawla and Kirby formula are in this class. The spectral energy dissipation is calculated based on one of these four wave breaking formulas, while the computed wave height is further limited by Equations (A8) and (A9).
ERDC/CHL TR-14-3 99
Wind forcing and white-capping dissipation
The evolution of waves in the large-scale, open coast is more affected by wind-ocean-wave interactions than the nearshore wave-current-bottom processes. The result is a nonlinear wave field that is balanced between wind forcing, whitecapping, and wave growth. The surface wind can feed energy into the existing waves and also generate new waves. On the other hand, the energy can dissipate through whitecapping from turbulence-wave interactions and air-wave-water interactions. In CMS-Wave, these wind forcing and whitecapping processes are modeled as separate sink and source terms (Lin and Lin 2004a and b).
Wave generation with arbitrary wind direction
In the case of wind forcing only and with zero wave energy input at the sea boundary, CMS-Wave can simulate full-plane wave generation. The model will execute an internal grid rotation based on the given wind direction to calculate the wave field and map the result back to the original grid. This feature is convenient for local wave generation by wind in a lake, bay, or estuary, neglecting swell from the ocean.
Bottom friction loss
Bottom friction loss (sink), Sds, is calculated by a drag law model (Collins 1972)
⟨ ⟩= −
σsinh
bfds
uS c N
g kh
2
2 (A10)
with
⟨ ⟩ =b totalgu Eh
12
(A11)
where ⟨ub⟩ presents the ensemble mean of horizontal wave orbital velocity at the sea bed, Etotal is the total energy density at a grid cell, and cf is the Darcy-Weisbach type friction coefficient. The relationship between cf and the Darcy-Weisbach friction factor fDW is cf=fDW/8.
Typical values of cf for a sandy-bottom range from 0.004 to 0.007 based on the JONSWAP experiment and North Sea measurements (Bouws and
ERDC/CHL TR-14-3 100
Komen 1983 and Hasselmann et al. 1973). Values of cf applied for coral reefs range from 0.05 to 0.40 (Hardy 1993; Hearn 1999 and Lowe et al. 2005). CMS-Wave uses a default value of cf =0.005.
If the Manning’s friction coefficient n is used instead of the Darcy-Weisbach type coefficient, the relationship between the two drag coefficients (in the SI system) is defined as
/fgnch
2
1 3 (A12)
Estimates of the Manning’s coefficient, n, are available in most fluid mechanics reference books (e.g., 0.01 to 0.05 for smooth to rocky/weedy channels).
Wave run-up
Wave run-up is the maximum shoreward wave swash on the beach face for engineering structures such as jetties and breakwaters by wave breaking at the shore. Wave run-up is significant for beach erosion as well as wave overtopping of seawalls and jetties. The total wave run-up consists of two components: (a) rise of the mean water level by wave breaking at the shore known as the wave setup, and (b) swash of incident waves. In CMS-Wave, the wave setup is computed based on the wave radiation stresses in the horizontal momentum equations by neglecting current, surface wind drag, and bottom stresses as
∂ ∂∂
= − + ∂ ∂ ∂
ηρ
xyxxSS
x gh x y1 (A13)
ηρ
xy yyS Sy gh x y
1 (A14)
where ρ is the water density, and Sxx, Sxy, and Sxy are radiation components from the excess momentum flux due to waves. By using linear wave theory (Dean and Dalrymple 1984), Sxx, Sxy, and Sxy are expressed as
θ) θ θ(σ, (cos )xx kS E n d
2 112
(A15)

ERDC/CHL TR-14-3 101
θ θ θ(σ, ) (sin )xx kS E n d
2 112
(A16)
θsinyy kES n 22
(A17)
where sinhk
khnkh
2
12
. Equations (A13) and (A14) also calculate the
water level depression from the still-water level due to waves known as wave setdown outside the breaker zone. Equation (A13) mainly controls wave setup and setdown calculations, whereas Equation (A14) predominantly acts to smooth the water level alongshore.
The swash oscillation of incident natural waves on the beach face is a random process. The most landward swash excursion corresponds to the maximum wave run-up. In the engineering application, a 2% exceedance of all vertical levels, denoted as R2%, from the swash is usually estimated for the wave run-up (Komar 1998). This quantity is approximately equal to the local wave setup on the beach or at structures such as seawalls and jetties. The total wave run-up is estimated as
% 2|η|R 2 (A18)
In CMS-Wave, R2% is calculated at the land-water interface and averaged with the local depth to determine if the water can flood the proceeding dry cell. If the wave run-up level is higher than the adjacent land cell elevation, CMS-Wave can flood the dry cells and simulate wave overtopping and overwash. This feature is useful in coupling CMS-Wave to CMS-Flow (Buttolph et al. 2006) for calculating beach erosion or breaching. Calculated quantities of ∂Sxx/∂x, ∂Sxy/∂x, ∂Sxy/∂y, and ∂Syy/∂y are saved as input to CMS-Flow. CMS-Wave reports the calculated fields of wave setup and maximum water level defined as
Maximum water level = Max (R2%, η + Hs/2) (A19)
where Hs=4 totalE is the significant wave height.

ERDC/CHL TR-14-3 102
Wave transmission and overtopping
CMS-Wave applies a simple analytical formula to compute the wave transmission coefficient (Kt) of a rigidly moored rectangular breakwater of width, Bc, and draft, Dc (Macagno 1953)
sinh
πcosh ( )
c
tc
khkBK
k h D
12 2
212
(A20)
Wave transmission over a structure or breakwater is mainly caused by the fall of the overtopping water mass. Therefore, the ratio of the structure crest elevation to the incident wave height is the prime parameter governing the wave transmission. CMS-Wave calculates the rate of overtopping of a vertical breakwater based on the simple expression (Goda 1985) as
. ( . ), for .c ct
i i
h hK
H H 0 3 1 5 0 1 25 (A21)
where hc is the crest elevation of the breakwater above the still-water level, and Hi is the incident wave height. For a composite breakwater which is protected by armor units along its front, Equation (A21) is modified as
. ( . ), for .c ct
i i
h hK
H H 0 3 1 1 0 0 75 (A22)
For rubble-mound breakwaters, the calculation of wave transmission is more complicated because the overtopping rate also depends on the specific design of the breakwater (e. g., toe apron protection, front slope, armor unit shape and size, thickness of armor layers). In practice, Equation (A22) still can be applied using a finer spatial resolution with the proper bathymetry and adequate bottom friction coefficients to represent the breakwater.
For permeable rubble-mound breakwaters, the transmission is calculated from d’Angremond et al. (1996) formula:
.. ( ) exp( ) . , for ct i
i i
hB ξK B HH H
0 310 64 1 0 4 102
(A23)

ERDC/CHL TR-14-3 103
where B is the crest width, and ξ is the Iribarren parameter defined as the fore-slope of the breakwater divided by the square-root of deepwater incident wave steepness. In practice, Equations (A21) to (A23) are applicable for both monochromatic and random waves.
Grid nesting
Grid nesting is applied by saving wave spectra at selected locations from a coarse grid (parent grid) and inputting them along the offshore boundary of the smaller fine grid (child grid). For simple and quick applications, a single-location spectrum saved from the parent grid can be used as the wave forcing for the entire sea boundary of the child grid. If multi-location spectra were saved from the parent grid, they are then interpolated and extrapolated for more realistic wave forcing along the sea boundary of the child grid.
Multiple grid nesting (e.g., several co-existing child grids and grand-child grids) is supported by CMS-Wave. The parent and child grids can have different orientations, but need to reside in the same horizontal coordinate system. Because CMS-Wave is a half-plane model, the difference between grid orientations between parent and child grids should be small (no greater than 45 deg) for passing sufficient wave energy from the parent to child grids.
Variable rectangular-cell grid
CMS-Wave can run on a grid with variable rectangular cells. This feature is suited to large-domain applications in which wider spacing cells can be specified in the offshore where wave property variation is small and away from the area of interest to save computational time. A limit on the shore-normal to shore-parallel spacing ratio in a cell is not required as long as the calculated shoreward waves are found to be numerically stable.
Nonlinear wave-wave interaction
Nonlinear wave-wave interaction is a conserved energy transfer from higher to lower frequencies. The mechanism can produce transverse waves and energy diffusion in the frequency and direction domains. The effect is more pronounced in the intermediate to shallow water depth. Directional spreading of the wave spectrum tends to increase as the wavelength decreases (Jenkins and Phillips 2001).

ERDC/CHL TR-14-3 104
The exact computation of the nonlinear energy transfer involves six-dimensional integrations. This is computationally too taxing in practical engineering nearshore wave transformation models. Mase et al. (2005a) have shown that calculated wave fields differ with and without nonlinear energy transfer. CMS-Wave uses a theoretically-based formula proposed by Jenkins and Phillips (2001) to calculate the nonlinear wave-wave interaction.
In finite water depth, the nonlinear wave-wave interaction function can be expressed as (Lin et al. 2010)
nlF FS a bσ θ
2
2 (A24)
where [ ( ) cosh ]a n khn
22
1 1 2 1 2 12
is a function of kh, ab
nσ , and
( )( )
mσnF k σ Eπ g σ
343 5 4
22 (A25)
Wave dissipation over muddy bed
The calculation of wave dissipation over muddy beds in CMS-Wave is based on the assumption that the turbulent eddy viscosity is several orders of magnitude greater than the kinematic viscosity of sea water. By neglecting the kinematic viscous effect, the wave dissipation over a muddy bed can be expressed as (Lamb 1932)
dp tS ν k E 24 (A26)
where the turbulent eddy viscosity, ν t , is equal to a maximum viscosity,
,maxtν , representing the wave breaking condition times the ratio of wave
height over depth.
Full-plane and wind field input capabilities
The full-plane capability of CMS-Wave is ideal for calculating waves in a bay or estuary connected to a major water body. This capability is also essential to simulate storm waves in the open coast or around an island. In the case of strong wind-wave interactions, especially under a hurricane,

ERDC/CHL TR-14-3 105
CMS-Wave can read wind field information for more realistic calculation of wave generation, dissipation, and growth.
Fast mode calculations
CMS-Wave can run in a fast mode for simple and quick applications. The fast mode calculates the half-plane spectral transformation on either five directional bins (each 30-deg angle for a broad-band input spectrum) or seven directional bins (each 5-deg angle for a narrow-band input spectrum or 25-deg angle with wind input) to minimize simulation time. It runs at least five times faster than the normal mode, which operates with 35 directional bins. The fast-mode option is suited for a long or time-pressing simulation if users are seeking preliminary solutions. The wave direction estimated in the fast mode is expected to be less accurate than the standard mode because the directional calculation is based on fewer bins.
Summary of CMS-Wave control parameters with default values
This section describes the control parameters and associated default values for input parameters used in CMS-Wave. The full-plane CMS-Wave has 25 model control parameters in the *.std file. The first 15 parameters are the same as in the CMS-Wave TR (Lin et al. 2008). The remaining 10 parameters are new.
1st 2nd 3rd 4th 5th 6th iprp icur ibk irs kout ibnd
7th 8th 9th 10th 11th 12th 13th 14th 15th iwet ibf iark iarkr akap bf ark arkr iwvbk
16th 17th 18th 19th 20th 21st 22nd 23rd 24th 25th nonln igrav irunup imud iwnd isolv ixmdf iproc iview iroll
The first 6 parameters are required in the *.std and the remaining parameters starting any parameter after the 6th will be assigned to default values if not specified in *.std. The description of the 1st to 25th parameters is given below.
iprp = 0 (wave propagation with wind input in *.eng) 1 (wave propagation only, neglect wind input in *.eng) -1 (fast mode)
ERDC/CHL TR-14-3 106
2 (forced grid internal rotation) 3 (without lateral energy flux)
icur = 0 (no current input) 1 (with current input *.cur) 2 (with *.cur, use only the 1st set current data)
ibk = 0 (no wave break info output) 1 (output breaking indices *.brk) 2 (output energy dissipation rate *.brk)
irs = 0 (no wave radiation stress calc) 1 (output radiation stress *.rad) 2 (calculate/output setup/max-water-level + *.rad)
kout = number of special wave output location, output spectrum in *.obs and parameters in selhts.out
ibnd = 0 (no input a parent spectrum *.nst) 1 (read *.nst, averaging input spectrum) 2 (read *.nst, spatially variable spectrum input)
iwet = 0 (allow wet/dry, default) 1 (without wet/dry) -1 (allow wet/dry, output swell and local sea files) -2 (output combined steering wav files) -3 (output swell, local sea, and combined wav files)
ibf = 0 (no bottom friction calc) 1 (constant Darcy-Weisbach coefficient, Cf) 2 (read variable Cf file, *.fric) 3 (constant Manning n) 4 (read variable Manning n file, *.fric)
iark = 0 (without forward reflection) 1 (with forward reflection)
iarkr = 0 (without backward reflection) 1 (with backward reflection)

ERDC/CHL TR-14-3 107
akap = 0 to 4 (diffraction intensity) 0 for zero diffraction 4 for strong diffraction, default
bf = constant bottom friction coefficient, Cf or n (typical value is 0.005 for Cf and 0.025 for Manning n)
ark = 0 to 1 (constant forward reflection coefficient, global specification) 0 for zero reflection 1 for 100 percent or fully reflection
arkr = 0 to 1 (constant backward reflection coefficient, global specification)
0 for zero reflection 1 for 100 percent or fully reflection iwvbk = 0 to 3 (option for the primary wave breaking formula: 0 for Goda-extended 1 for Miche-extended 2 for Battjes and Janssen 3 for Chawla and Kirby
nonln = 0 (none, default) 1 (nonlinear wave-wave interaction)
igrav = 0 (none, default) 1 (infra-gravity wave enter inlets)
irunup = 0 (none, default) 1 (automatic, run-up relative to absolute datum) 2 (automatic, run-up relative to updated MWL)
imud = 0 (mud.dat, default) 1 (none) --- need for users who may not want to include mud effect as the
mud.dat exists (typical max kinematic viscosity in mud.dat is 0.04 m*m/sec)
iwnd = 0 (wind.dat, default) 1 (none) --- need in steering if users decide not to use the wind field input
when the wind file exists
ERDC/CHL TR-14-3 108
isolv = 0 (GSR solver, default) 1 (ADI)
ixmdf = 0 (output ASCII, default) 1 (output xmdf) 2 (input & output xmdf)
iproc = 0 (same as 1, default) n (n processors for isolv = 0) --- approx. processor = (total row)/300
iview = 0 (half-plane, default) 1 (full-plane with wave input *.eng) 2 (full-plane with *.eng and additional wave.spc) --- for the full plane,
users can provide additional input wave spectrum file wave.spc (same format as the *.eng) along the opposite side boundary (an imaginary origin for this wave.spc at the opposite corner; users can use SMS to rotate the CMS-Wave grid 180 deg to generate this wave.spc)
iroll = 0 to 4 (wave roller effect) 0 for no effect, default 4 for strong effect (more effective for finer resolution in the surf zone, say,
for cross-shore spacing < 10 m)

ERDC/CHL TR-14-3 109
Appendix B: WIS126 Tp vs. Hs Percent Occurrence Tables for Each Direction Band in Phase 1 Waves

ERDC/CHL TR-14-3 110
Figure B1. WIS126 Tp vs. Hs percent occurrence table for direction band centered at θp =67.5 deg (a) percent and (b) number of observations.
(a)
(b)
26.3
0.3
0.3
0.3
0.5
46.2
0.1
0.2
0.1
0.3
20.9
0.5
0.1
0.1
2.0
0.6
0.3
0.4
0.1
0.2
0.1
2.9 4.8 6.8 8.6 10.8 12.1 15.416.2 22.0
0.0 2.0 4.0 6.0 8.0 10.0 12.0 14.0 16.0 20.0 24.0
Wave Height (ft)
3.7 3.7
6.0 6.0
7.6 7.6
9.4 9.4
11.8 11.8
14.0 14.0
16.0 16.0
20.0 20.0
0.0
5.0
7.0
9.0
11.0
13.0
15.0
17.0
23.0
(
) Percent Occurrence
1666
18
17
19
34
2919
8
12
7
16
1321
29
5
1
8
124
39
17
3
3
25
5
12
1
1
1
3
5 1
1 2 1
2.9 4.8 6.8 8.6 10.8 12.1 15.416.2 22.0
0.0 2.0 4.0 6.0 8.0 10.0 12.0 14.0 16.0 20.0 24.0
Wave Height (ft)
3.7 3.7
6.0 6.0
7.6 7.6
9.4 9.4
11.8 11.8
14.0 14.0
16.0 16.0
20.0 20.0
0.0
5.0
7.0
9.0
11.0
13.0
15.0
17.0
23.0
(
)
Number of Occurrences

ERDC/CHL TR-14-3 111
Figure B2. WIS126 Tp vs. Hs percent occurrence table for direction band centered at θp =90 deg (a) percent and (b) number of observations.
(a)
(b)
20.2
3.4
5.9
6.1
3.5
0.1
31.6
3.2
3.4
2.5
0.5
10.7
0.5
0.6
0.3
0.4
1.8
1.9
0.2
0.2
0.3
0.1
0.4
0.6
0.2
0.2
0.4
0.1
0.1
0.1
0.1
0.1
0.1
2.9 4.8 6.8 8.8 10.8 12.9 14.9 17.7 20.8
0.0 2.0 4.0 6.0 8.0 10.0 12.0 14.0 16.0 20.0 24.0
Wave Height (ft)
4.1 4.1
6.1 6.1
7.8 7.8
9.5 9.5
11.6 11.6
14.3 14.3
16.7 16.7
20.0 20.0
0.0
5.0
7.0
9.0
11.0
13.0
15.0
17.0
23.0
(
)
Percent Occurrence
3446
583
1009
1039
591
16
8
5393
539
583
419
86
5
3
1825
85
105
45
73
6
315
324
41
26
51
17
66
101
27
28
1
64
25
21
16
15
9
14
2
1
5
7
4
5
2.9 4.8 6.8 8.8 10.8 12.9 14.9 17.7 20.8
0.0 2.0 4.0 6.0 8.0 10.0 12.0 14.0 16.0 20.0 24.0
Wave Height (ft)
4.1 4.1
6.1 6.1
7.8 7.8
9.5 9.5
11.6 11.6
14.3 14.3
16.7 16.7
20.0 20.0
0.0
5.0
7.0
9.0
11.0
13.0
15.0
17.0
23.0
(
)
Number of Occurrences
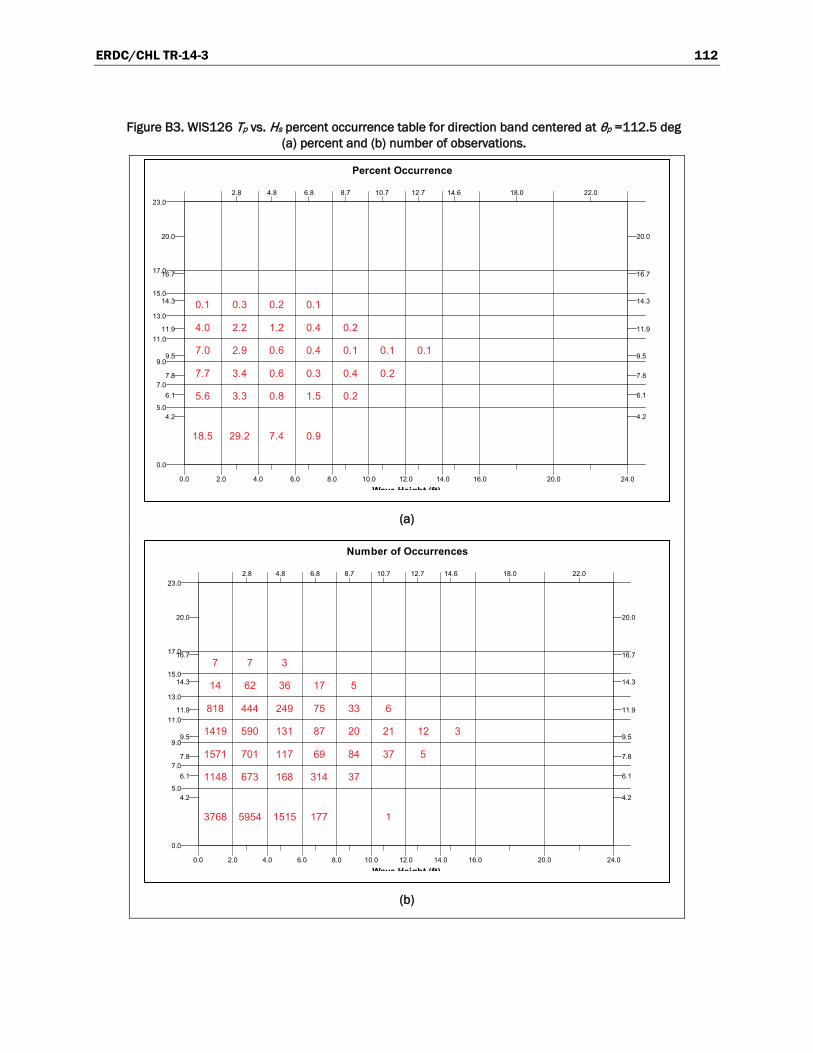
ERDC/CHL TR-14-3 112
Figure B3. WIS126 Tp vs. Hs percent occurrence table for direction band centered at θp =112.5 deg (a) percent and (b) number of observations.
(a)
(b)
18.5
5.6
7.7
7.0
4.0
0.1
29.2
3.3
3.4
2.9
2.2
0.3
7.4
0.8
0.6
0.6
1.2
0.2
0.9
1.5
0.3
0.4
0.4
0.1
0.2
0.4
0.1
0.2
0.2
0.1 0.1
2.8 4.8 6.8 8.7 10.7 12.7 14.6 18.0 22.0
0.0 2.0 4.0 6.0 8.0 10.0 12.0 14.0 16.0 20.0 24.0
Wave Height (ft)
4.2 4.2
6.1 6.1
7.8 7.8
9.5 9.5
11.9 11.9
14.3 14.3
16.7 16.7
20.0 20.0
0.0
5.0
7.0
9.0
11.0
13.0
15.0
17.0
23.0
(
)
Percent Occurrence
3768
1148
1571
1419
818
14
7
5954
673
701
590
444
62
7
1515
168
117
131
249
36
3
177
314
69
87
75
17
37
84
20
33
5
1
37
21
6
5
12 3
2.8 4.8 6.8 8.7 10.7 12.7 14.6 18.0 22.0
0.0 2.0 4.0 6.0 8.0 10.0 12.0 14.0 16.0 20.0 24.0
Wave Height (ft)
4.2 4.2
6.1 6.1
7.8 7.8
9.5 9.5
11.9 11.9
14.3 14.3
16.7 16.7
20.0 20.0
0.0
5.0
7.0
9.0
11.0
13.0
15.0
17.0
23.0
(
)
Number of Occurrences
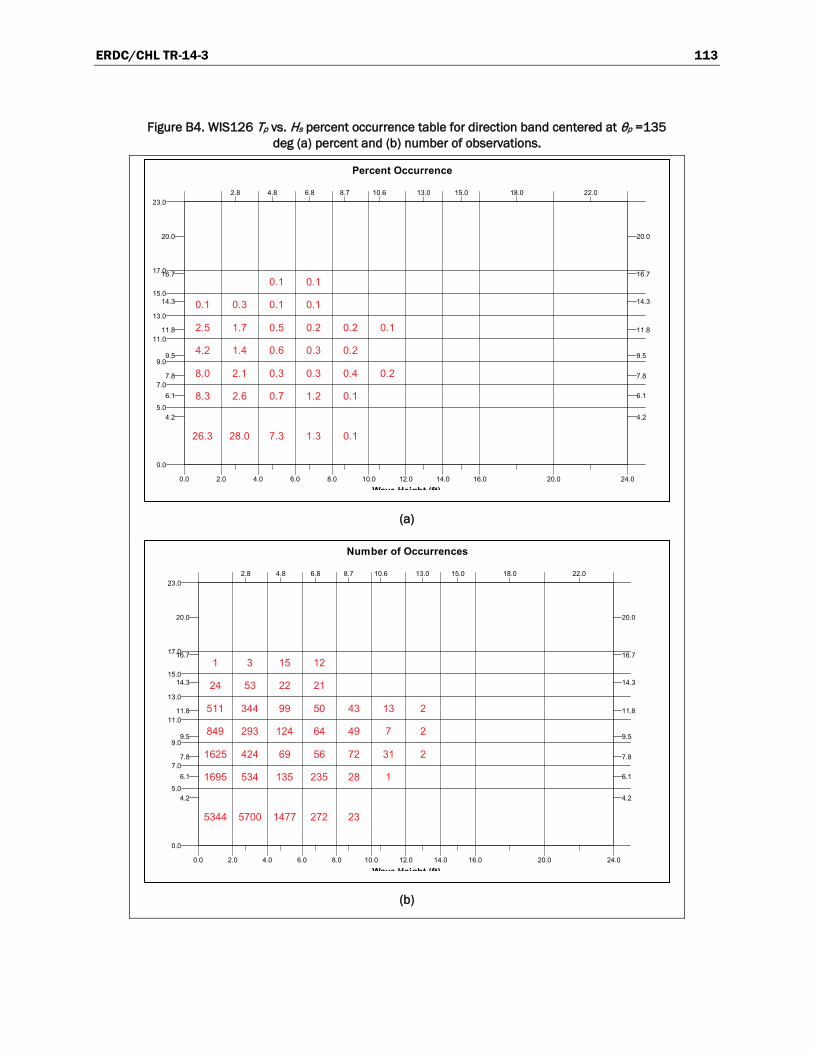
ERDC/CHL TR-14-3 113
Figure B4. WIS126 Tp vs. Hs percent occurrence table for direction band centered at θp =135 deg (a) percent and (b) number of observations.
(a)
(b)
26.3
8.3
8.0
4.2
2.5
0.1
28.0
2.6
2.1
1.4
1.7
0.3
7.3
0.7
0.3
0.6
0.5
0.1
0.1
1.3
1.2
0.3
0.3
0.2
0.1
0.1
0.1
0.1
0.4
0.2
0.2
0.2
0.1
2.8 4.8 6.8 8.7 10.6 13.0 15.0 18.0 22.0
0.0 2.0 4.0 6.0 8.0 10.0 12.0 14.0 16.0 20.0 24.0
Wave Height (ft)
4.2 4.2
6.1 6.1
7.8 7.8
9.5 9.5
11.8 11.8
14.3 14.3
16.7 16.7
20.0 20.0
0.0
5.0
7.0
9.0
11.0
13.0
15.0
17.0
23.0
(
)
Percent Occurrence
5344
1695
1625
849
511
24
1
5700
534
424
293
344
53
3
1477
135
69
124
99
22
15
272
235
56
64
50
21
12
23
28
72
49
43
1
31
7
13
2
2
2
2.8 4.8 6.8 8.7 10.6 13.0 15.0 18.0 22.0
0.0 2.0 4.0 6.0 8.0 10.0 12.0 14.0 16.0 20.0 24.0
Wave Height (ft)
4.2 4.2
6.1 6.1
7.8 7.8
9.5 9.5
11.8 11.8
14.3 14.3
16.7 16.7
20.0 20.0
0.0
5.0
7.0
9.0
11.0
13.0
15.0
17.0
23.0
(
)
Number of Occurrences

ERDC/CHL TR-14-3 114
Figure B5. WIS126 Tp vs. Hs percent occurrence table for direction band centered at θp =157.5 deg (a) percent and (b) number of observations.
(a)
(b)
33.4
9.2
4.0
1.7
0.5
30.6
3.8
1.8
1.2
1.1
0.2
0.1
6.5
1.0
0.5
0.5
0.4
0.2
0.6
1.0
0.2
0.3
0.2
0.1
0.4
0.1
0.2
0.1 0.1
2.7 4.7 6.8 8.8 10.8 13.0 14.7 18.0 22.0
0.0 2.0 4.0 6.0 8.0 10.0 12.0 14.0 16.0 20.0 24.0
Wave Height (ft)
4.2 4.2
6.0 6.0
7.7 7.7
9.5 9.5
11.7 11.7
14.3 14.3
16.7 16.7
18.8 18.8
0.0
5.0
7.0
9.0
11.0
13.0
15.0
17.0
23.0
(
)
Percent Occurrence
9469
2608
1146
489
135
11
1
3
8659
1062
509
339
306
67
18
1827
276
137
143
103
57
2
184
277
52
91
50
36
115
18
7
1
52
27
8
16
2
7
2.7 4.7 6.8 8.8 10.8 13.0 14.7 18.0 22.0
0.0 2.0 4.0 6.0 8.0 10.0 12.0 14.0 16.0 20.0 24.0
Wave Height (ft)
4.2 4.2
6.0 6.0
7.7 7.7
9.5 9.5
11.7 11.7
14.3 14.3
16.7 16.7
18.8 18.8
0.0
5.0
7.0
9.0
11.0
13.0
15.0
17.0
23.0
(
)
Number of Occurrences
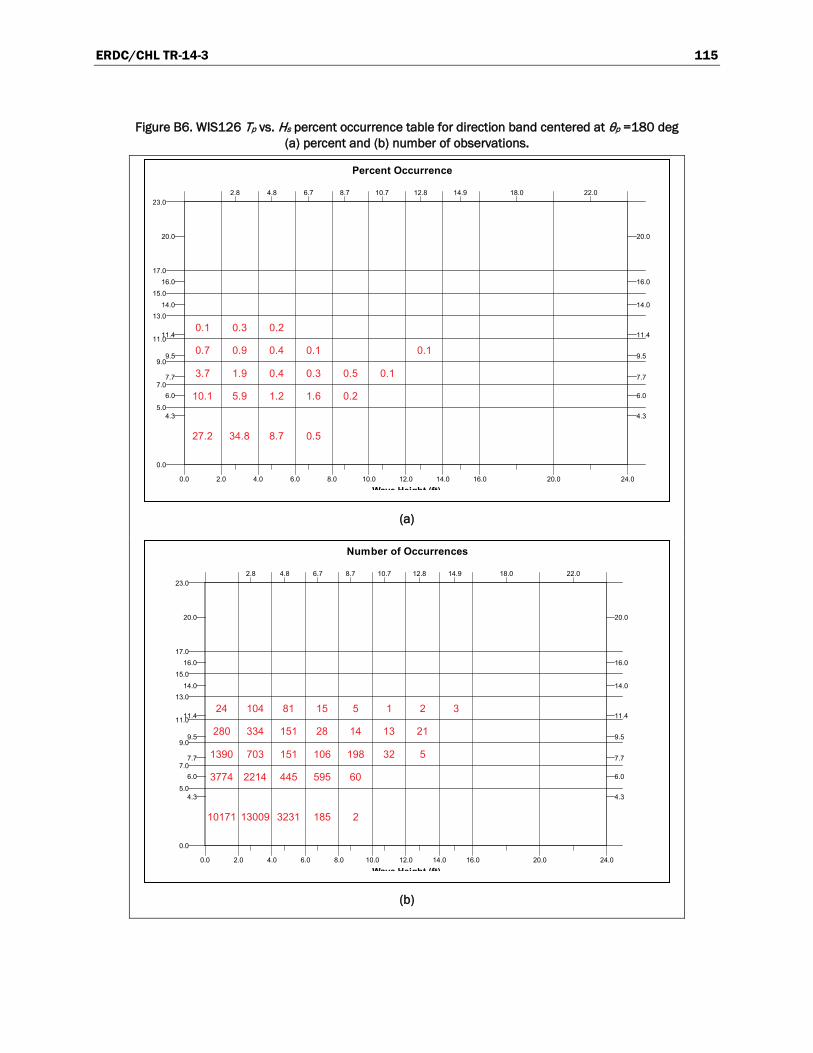
ERDC/CHL TR-14-3 115
Figure B6. WIS126 Tp vs. Hs percent occurrence table for direction band centered at θp =180 deg (a) percent and (b) number of observations.
(a)
(b)
27.2
10.1
3.7
0.7
0.1
34.8
5.9
1.9
0.9
0.3
8.7
1.2
0.4
0.4
0.2
0.5
1.6
0.3
0.1
0.2
0.5 0.1
0.1
2.8 4.8 6.7 8.7 10.7 12.8 14.9 18.0 22.0
0.0 2.0 4.0 6.0 8.0 10.0 12.0 14.0 16.0 20.0 24.0
Wave Height (ft)
4.3 4.3
6.0 6.0
7.7 7.7
9.5 9.5
11.4 11.4
14.0 14.0
16.0 16.0
20.0 20.0
0.0
5.0
7.0
9.0
11.0
13.0
15.0
17.0
23.0
(
)
Percent Occurrence
10171
3774
1390
280
24
13009
2214
703
334
104
3231
445
151
151
81
185
595
106
28
15
2
60
198
14
5
32
13
1
5
21
2 3
2.8 4.8 6.7 8.7 10.7 12.8 14.9 18.0 22.0
0.0 2.0 4.0 6.0 8.0 10.0 12.0 14.0 16.0 20.0 24.0
Wave Height (ft)
4.3 4.3
6.0 6.0
7.7 7.7
9.5 9.5
11.4 11.4
14.0 14.0
16.0 16.0
20.0 20.0
0.0
5.0
7.0
9.0
11.0
13.0
15.0
17.0
23.0
(
)
Number of Occurrences

ERDC/CHL TR-14-3 116
Figure B7. WIS126 Tp vs. Hs percent occurrence table for direction band centered at θp =202.5 deg (a) percent and (b) number of observations.
(a)
(b)
25.6
0.6
0.2
0.1
52.7
1.0
0.2
0.1
0.1
14.5
0.8
0.3
0.1
0.1
1.2
1.5
0.2
0.1
0.1
0.3
0.1
0.1
2.9 4.7 6.7 8.8 10.5 13.1 14.1 18.0 22.0
0.0 2.0 4.0 6.0 8.0 10.0 12.0 14.0 16.0 20.0 24.0
Wave Height (ft)
3.7 3.7
6.0 6.0
7.7 7.7
9.5 9.5
11.5 11.5
14.0 14.0
16.0 16.0
20.0 20.0
0.0
5.0
7.0
9.0
11.0
13.0
15.0
17.0
23.0
(
)
Percent Occurrence
2383
52
18
6
1
4911
93
19
6
9
1355
79
25
13
13
108
143
17
3
7
4
6
31
2
7
1
4
5 2
1
2.9 4.7 6.7 8.8 10.5 13.1 14.1 18.0 22.0
0.0 2.0 4.0 6.0 8.0 10.0 12.0 14.0 16.0 20.0 24.0
Wave Height (ft)
3.7 3.7
6.0 6.0
7.7 7.7
9.5 9.5
11.5 11.5
14.0 14.0
16.0 16.0
20.0 20.0
0.0
5.0
7.0
9.0
11.0
13.0
15.0
17.0
23.0
(
)
Number of Occurrences

ERDC/CHL TR-14-3 117
Appendix C: Phase 1 and Phase 2 Wave Climatology in the Ambrose Channel Reaches
Table C1. Wave climatology in Ambrose Channel, Phase 1, Channel Reach 1.
No. ID Hs (ft) Tp (sec) Direction (deg) α γ n Probability Days/yr
1 101 2.9 3.7 67.5 0.014273 3.3 4 0.01665 6.10
2 102 4.8 3.7 67.5 0.039145 3.3 4 0.00754 2.74
3 103 6.8 3.7 67.5 0.078601 3.3 4 0.00071 0.26
4 104 8.6 3.7 67.5 0.125751 3.3 4 0.00014 0.04
5 105 10.8 3.7 67.5 0.198356 3.3 4 0.00001 0.00
6 106 2.9 6 67.5 0.002402 3.3 4 0.00005 0.00
7 107 4.8 6 67.5 0.006588 3.3 4 0.00017 0.07
8 108 6.8 6 67.5 0.013227 3.3 4 0.00022 0.07
9 109 8.6 6 67.5 0.021162 3.3 4 0.00003 0.00
10 110 10.8 6 67.5 0.033380 3.3 4 0.00002 0.00
11 111 2.9 7.6 67.5 0.001213 3.3 4 0.00007 0.04
12 112 4.8 7.6 67.5 0.003326 3.3 4 0.00003 0.00
13 113 6.8 7.6 67.5 0.006678 3.3 4 0.00010 0.04
14 114 8.6 7.6 67.5 0.010684 3.3 4 0.00007 0.04
15 115 2.9 9.4 67.5 0.000712 3.3 4 0.00004 0.00
16 116 4.8 9.4 67.5 0.001952 3.3 4 0.00001 0.00
17 117 6.8 9.4 67.5 0.003920 3.3 4 0.00002 0.00
18 118 8.6 9.4 67.5 0.006272 3.3 4 0.00001 0.00
19 119 10.8 9.4 67.5 0.009893 3.3 4 0.00003 0.00
20 120 12.1 9.4 67.5 0.012420 3.3 4 0.00001 0.00
21 121 2.9 11.8 67.5 0.000391 4 10 0.00009 0.04
22 122 4.8 11.8 67.5 0.001073 4 10 0.00005 0.00
23 123 6.8 11.8 67.5 0.002154 4 10 0.00002 0.00
24 124 8.6 11.8 67.5 0.003446 4 10 0.00001 0.00
25 125 12.1 11.8 67.5 0.006824 4 10 0.00001 0.00
26 126 15.4 11.8 67.5 0.011055 4 10 0.00001 0.00
27 127 16.2 11.8 67.5 0.012234 4 10 0.00001 0.00
28 128 2.9 4.1 90 0.009410 3.3 4 0.03076 11.24
29 129 4.8 4.1 90 0.025809 3.3 4 0.01041 3.80
30 130 6.8 4.1 90 0.051822 3.3 4 0.00180 0.66
31 131 8.8 4.1 90 0.086812 3.3 4 0.00010 0.04
32 132 2.9 6.1 90 0.002255 3.3 4 0.00307 1.13
33 133 4.8 6.1 90 0.006184 3.3 4 0.00048 0.18
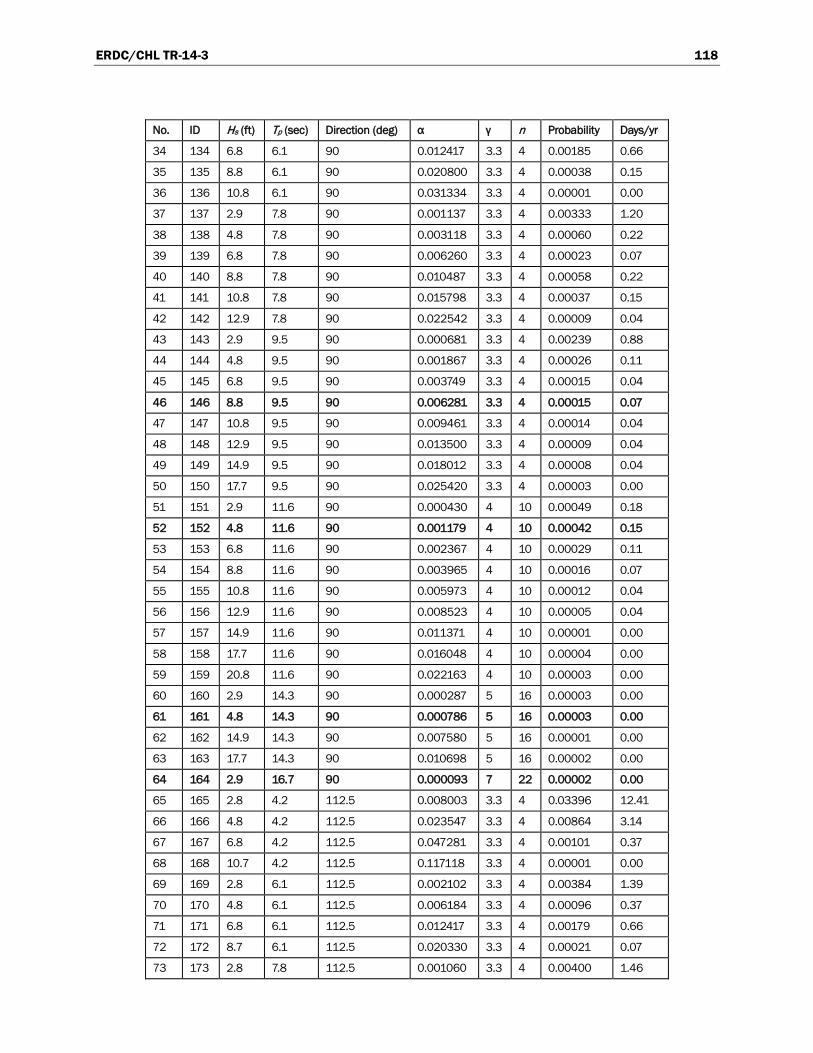
ERDC/CHL TR-14-3 118
No. ID Hs (ft) Tp (sec) Direction (deg) α γ n Probability Days/yr
34 134 6.8 6.1 90 0.012417 3.3 4 0.00185 0.66
35 135 8.8 6.1 90 0.020800 3.3 4 0.00038 0.15
36 136 10.8 6.1 90 0.031334 3.3 4 0.00001 0.00
37 137 2.9 7.8 90 0.001137 3.3 4 0.00333 1.20
38 138 4.8 7.8 90 0.003118 3.3 4 0.00060 0.22
39 139 6.8 7.8 90 0.006260 3.3 4 0.00023 0.07
40 140 8.8 7.8 90 0.010487 3.3 4 0.00058 0.22
41 141 10.8 7.8 90 0.015798 3.3 4 0.00037 0.15
42 142 12.9 7.8 90 0.022542 3.3 4 0.00009 0.04
43 143 2.9 9.5 90 0.000681 3.3 4 0.00239 0.88
44 144 4.8 9.5 90 0.001867 3.3 4 0.00026 0.11
45 145 6.8 9.5 90 0.003749 3.3 4 0.00015 0.04
46 146 8.8 9.5 90 0.006281 3.3 4 0.00015 0.07
47 147 10.8 9.5 90 0.009461 3.3 4 0.00014 0.04
48 148 12.9 9.5 90 0.013500 3.3 4 0.00009 0.04
49 149 14.9 9.5 90 0.018012 3.3 4 0.00008 0.04
50 150 17.7 9.5 90 0.025420 3.3 4 0.00003 0.00
51 151 2.9 11.6 90 0.000430 4 10 0.00049 0.18
52 152 4.8 11.6 90 0.001179 4 10 0.00042 0.15
53 153 6.8 11.6 90 0.002367 4 10 0.00029 0.11
54 154 8.8 11.6 90 0.003965 4 10 0.00016 0.07
55 155 10.8 11.6 90 0.005973 4 10 0.00012 0.04
56 156 12.9 11.6 90 0.008523 4 10 0.00005 0.04
57 157 14.9 11.6 90 0.011371 4 10 0.00001 0.00
58 158 17.7 11.6 90 0.016048 4 10 0.00004 0.00
59 159 20.8 11.6 90 0.022163 4 10 0.00003 0.00
60 160 2.9 14.3 90 0.000287 5 16 0.00003 0.00
61 161 4.8 14.3 90 0.000786 5 16 0.00003 0.00
62 162 14.9 14.3 90 0.007580 5 16 0.00001 0.00
63 163 17.7 14.3 90 0.010698 5 16 0.00002 0.00
64 164 2.9 16.7 90 0.000093 7 22 0.00002 0.00
65 165 2.8 4.2 112.5 0.008003 3.3 4 0.03396 12.41
66 166 4.8 4.2 112.5 0.023547 3.3 4 0.00864 3.14
67 167 6.8 4.2 112.5 0.047281 3.3 4 0.00101 0.37
68 168 10.7 4.2 112.5 0.117118 3.3 4 0.00001 0.00
69 169 2.8 6.1 112.5 0.002102 3.3 4 0.00384 1.39
70 170 4.8 6.1 112.5 0.006184 3.3 4 0.00096 0.37
71 171 6.8 6.1 112.5 0.012417 3.3 4 0.00179 0.66
72 172 8.7 6.1 112.5 0.020330 3.3 4 0.00021 0.07
73 173 2.8 7.8 112.5 0.001060 3.3 4 0.00400 1.46

ERDC/CHL TR-14-3 119
No. ID Hs (ft) Tp (sec) Direction (deg) α γ n Probability Days/yr
74 174 4.8 7.8 112.5 0.003118 3.3 4 0.00067 0.26
75 175 6.8 7.8 112.5 0.006260 3.3 4 0.00039 0.15
76 176 8.7 7.8 112.5 0.010250 3.3 4 0.00048 0.18
77 177 10.7 7.8 112.5 0.015507 3.3 4 0.00021 0.07
78 178 12.7 7.8 112.5 0.021848 3.3 4 0.00003 0.00
79 179 2.8 9.5 112.5 0.000635 3.3 4 0.00337 1.24
80 180 4.8 9.5 112.5 0.001867 3.3 4 0.00075 0.26
81 181 6.8 9.5 112.5 0.003749 3.3 4 0.00050 0.18
82 182 8.7 9.5 112.5 0.006139 3.3 4 0.00011 0.04
83 183 10.7 9.5 112.5 0.009287 3.3 4 0.00012 0.04
84 184 12.7 9.5 112.5 0.013085 3.3 4 0.00007 0.04
85 185 14.6 9.5 112.5 0.017294 3.3 4 0.00002 0.00
86 186 2.8 11.9 112.5 0.000346 4 10 0.00253 0.91
87 187 4.8 11.9 112.5 0.001017 4 10 0.00142 0.51
88 188 6.8 11.9 112.5 0.002042 4 10 0.00043 0.15
89 189 8.7 11.9 112.5 0.003343 4 10 0.00019 0.07
90 190 10.7 11.9 112.5 0.005057 4 10 0.00003 0.00
91 191 2.8 14.3 112.5 0.000267 5 16 0.00035 0.15
92 192 4.8 14.3 112.5 0.000786 5 16 0.00021 0.07
93 193 6.8 14.3 112.5 0.001578 5 16 0.00010 0.04
94 194 8.7 14.3 112.5 0.002583 5 16 0.00003 0.00
95 195 2.8 16.7 112.5 0.000087 7 22 0.00004 0.00
96 196 4.8 16.7 112.5 0.000254 7 22 0.00002 0.00
97 197 2.8 4.2 135 0.008003 3.3 4 0.03251 11.86
98 198 4.8 4.2 135 0.023547 3.3 4 0.00843 3.07
99 199 6.8 4.2 135 0.047281 3.3 4 0.00155 0.58
100 200 8.7 4.2 135 0.077414 3.3 4 0.00013 0.04
101 201 2.8 6.1 135 0.002102 3.3 4 0.00305 1.10
102 202 4.8 6.1 135 0.006184 3.3 4 0.00077 0.29
103 203 6.8 6.1 135 0.012417 3.3 4 0.00134 0.47
104 204 8.7 6.1 135 0.020330 3.3 4 0.00016 0.07
105 205 10.6 6.1 135 0.030184 3.3 4 0.00001 0.00
106 206 2.8 7.8 135 0.001060 3.3 4 0.00242 0.88
107 207 4.8 7.8 135 0.003118 3.3 4 0.00039 0.15
108 208 6.8 7.8 135 0.006260 3.3 4 0.00032 0.11
109 209 8.7 7.8 135 0.010250 3.3 4 0.00041 0.15
110 210 10.6 7.8 135 0.015218 3.3 4 0.00018 0.07
111 211 13 7.8 135 0.022892 3.3 4 0.00001 0.00
112 212 2.8 9.5 135 0.000635 3.3 4 0.00167 0.62
113 213 4.8 9.5 135 0.001867 3.3 4 0.00071 0.26

ERDC/CHL TR-14-3 120
No. ID Hs (ft) Tp (sec) Direction (deg) α γ n Probability Days/yr
114 214 6.8 9.5 135 0.003749 3.3 4 0.00037 0.15
115 215 8.7 9.5 135 0.006139 3.3 4 0.00028 0.11
116 216 10.6 9.5 135 0.009114 3.3 4 0.00004 0.00
117 217 13 9.5 135 0.013710 3.3 4 0.00001 0.00
118 218 2.8 11.8 135 0.000365 4 10 0.00196 0.73
119 219 4.8 11.8 135 0.001073 4 10 0.00056 0.22
120 220 6.8 11.8 135 0.002154 4 10 0.00029 0.11
121 221 8.7 11.8 135 0.003527 4 10 0.00025 0.07
122 222 10.6 11.8 135 0.005236 4 10 0.00007 0.04
123 223 13 11.8 135 0.007877 4 10 0.00001 0.00
124 224 2.8 14.3 135 0.000267 5 16 0.00030 0.11
125 225 4.8 14.3 135 0.000786 5 16 0.00013 0.04
126 226 6.8 14.3 135 0.001578 5 16 0.00012 0.04
127 227 2.8 16.7 135 0.000087 7 22 0.00002 0.00
128 228 4.8 16.7 135 0.000254 7 22 0.00009 0.04
129 229 6.8 16.7 135 0.000511 7 22 0.00007 0.04
130 230 2.7 4.2 157.5 0.007441 3.3 4 0.04939 18.03
131 231 4.7 4.2 157.5 0.022576 3.3 4 0.01042 3.80
132 232 6.8 4.2 157.5 0.047281 3.3 4 0.00105 0.37
133 233 10.8 4.2 157.5 0.119318 3.3 4 0.00001 0.00
134 234 2.7 6 157.5 0.002082 3.3 4 0.00606 2.23
135 235 4.7 6 157.5 0.006316 3.3 4 0.00157 0.58
136 236 6.8 6 157.5 0.013227 3.3 4 0.00158 0.58
137 237 8.8 6 157.5 0.022158 3.3 4 0.00021 0.07
138 238 2.7 7.7 157.5 0.001021 3.3 4 0.00290 1.06
139 239 4.7 7.7 157.5 0.003098 3.3 4 0.00078 0.29
140 240 6.8 7.7 157.5 0.006489 3.3 4 0.00030 0.11
141 241 8.8 7.7 157.5 0.010870 3.3 4 0.00066 0.26
142 242 10.8 7.7 157.5 0.016376 3.3 4 0.00030 0.11
143 243 13 7.7 157.5 0.023730 3.3 4 0.00005 0.00
144 244 2.7 9.5 157.5 0.000590 3.3 4 0.00193 0.69
145 245 4.7 9.5 157.5 0.001790 3.3 4 0.00082 0.29
146 246 6.8 9.5 157.5 0.003749 3.3 4 0.00052 0.18
147 247 8.8 9.5 157.5 0.006281 3.3 4 0.00010 0.04
148 248 10.8 9.5 157.5 0.009461 3.3 4 0.00015 0.07
149 249 13 9.5 157.5 0.013710 3.3 4 0.00009 0.04
150 250 14.7 9.5 157.5 0.017532 3.3 4 0.00004 0.00
151 251 2.7 11.7 157.5 0.000356 4 10 0.00175 0.62
152 252 4.7 11.7 157.5 0.001081 4 10 0.00059 0.22
153 253 6.8 11.7 157.5 0.002264 4 10 0.00029 0.11
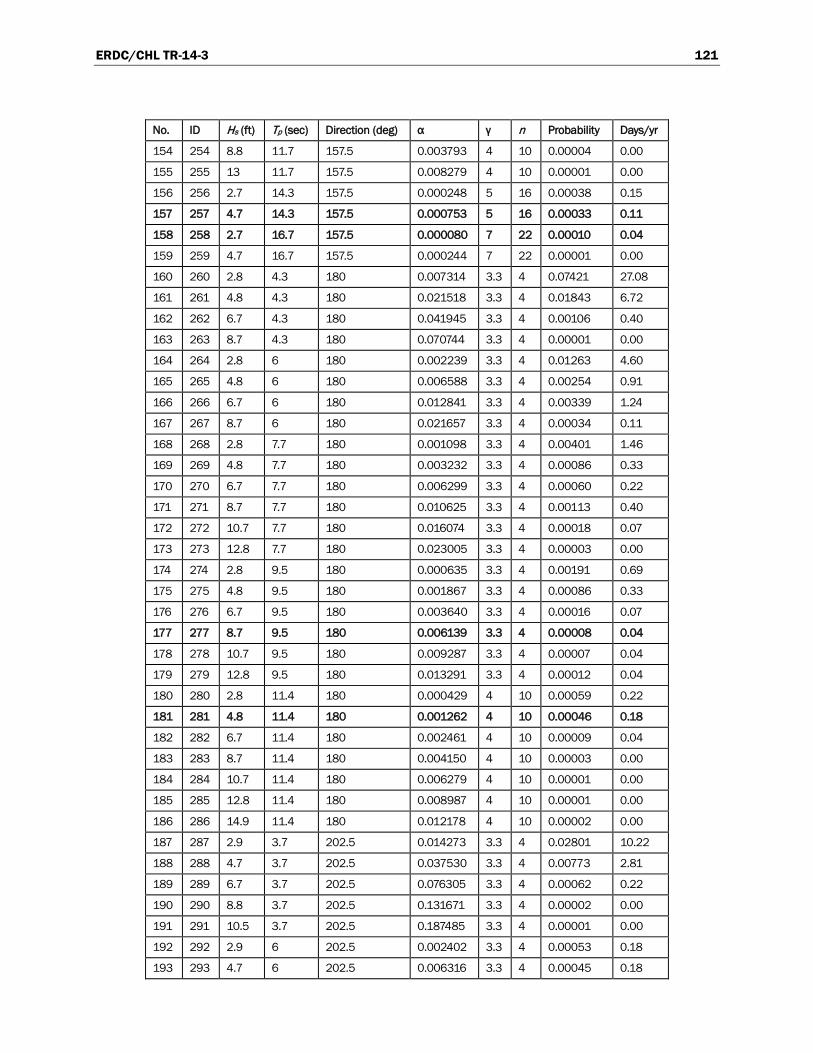
ERDC/CHL TR-14-3 121
No. ID Hs (ft) Tp (sec) Direction (deg) α γ n Probability Days/yr
154 254 8.8 11.7 157.5 0.003793 4 10 0.00004 0.00
155 255 13 11.7 157.5 0.008279 4 10 0.00001 0.00
156 256 2.7 14.3 157.5 0.000248 5 16 0.00038 0.15
157 257 4.7 14.3 157.5 0.000753 5 16 0.00033 0.11
158 258 2.7 16.7 157.5 0.000080 7 22 0.00010 0.04
159 259 4.7 16.7 157.5 0.000244 7 22 0.00001 0.00
160 260 2.8 4.3 180 0.007314 3.3 4 0.07421 27.08
161 261 4.8 4.3 180 0.021518 3.3 4 0.01843 6.72
162 262 6.7 4.3 180 0.041945 3.3 4 0.00106 0.40
163 263 8.7 4.3 180 0.070744 3.3 4 0.00001 0.00
164 264 2.8 6 180 0.002239 3.3 4 0.01263 4.60
165 265 4.8 6 180 0.006588 3.3 4 0.00254 0.91
166 266 6.7 6 180 0.012841 3.3 4 0.00339 1.24
167 267 8.7 6 180 0.021657 3.3 4 0.00034 0.11
168 268 2.8 7.7 180 0.001098 3.3 4 0.00401 1.46
169 269 4.8 7.7 180 0.003232 3.3 4 0.00086 0.33
170 270 6.7 7.7 180 0.006299 3.3 4 0.00060 0.22
171 271 8.7 7.7 180 0.010625 3.3 4 0.00113 0.40
172 272 10.7 7.7 180 0.016074 3.3 4 0.00018 0.07
173 273 12.8 7.7 180 0.023005 3.3 4 0.00003 0.00
174 274 2.8 9.5 180 0.000635 3.3 4 0.00191 0.69
175 275 4.8 9.5 180 0.001867 3.3 4 0.00086 0.33
176 276 6.7 9.5 180 0.003640 3.3 4 0.00016 0.07
177 277 8.7 9.5 180 0.006139 3.3 4 0.00008 0.04
178 278 10.7 9.5 180 0.009287 3.3 4 0.00007 0.04
179 279 12.8 9.5 180 0.013291 3.3 4 0.00012 0.04
180 280 2.8 11.4 180 0.000429 4 10 0.00059 0.22
181 281 4.8 11.4 180 0.001262 4 10 0.00046 0.18
182 282 6.7 11.4 180 0.002461 4 10 0.00009 0.04
183 283 8.7 11.4 180 0.004150 4 10 0.00003 0.00
184 284 10.7 11.4 180 0.006279 4 10 0.00001 0.00
185 285 12.8 11.4 180 0.008987 4 10 0.00001 0.00
186 286 14.9 11.4 180 0.012178 4 10 0.00002 0.00
187 287 2.9 3.7 202.5 0.014273 3.3 4 0.02801 10.22
188 288 4.7 3.7 202.5 0.037530 3.3 4 0.00773 2.81
189 289 6.7 3.7 202.5 0.076305 3.3 4 0.00062 0.22
190 290 8.8 3.7 202.5 0.131671 3.3 4 0.00002 0.00
191 291 10.5 3.7 202.5 0.187485 3.3 4 0.00001 0.00
192 292 2.9 6 202.5 0.002402 3.3 4 0.00053 0.18
193 293 4.7 6 202.5 0.006316 3.3 4 0.00045 0.18

ERDC/CHL TR-14-3 122
No. ID Hs (ft) Tp (sec) Direction (deg) α γ n Probability Days/yr
194 294 6.7 6 202.5 0.012841 3.3 4 0.00082 0.29
195 295 8.8 6 202.5 0.022158 3.3 4 0.00003 0.00
196 296 2.9 7.7 202.5 0.001178 3.3 4 0.00011 0.04
197 297 4.7 7.7 202.5 0.003098 3.3 4 0.00014 0.04
198 298 6.7 7.7 202.5 0.006299 3.3 4 0.00010 0.04
199 299 8.8 7.7 202.5 0.010870 3.3 4 0.00018 0.07
200 300 10.5 7.7 202.5 0.015478 3.3 4 0.00002 0.00
201 301 2.9 9.5 202.5 0.000681 3.3 4 0.00003 0.00
202 302 4.7 9.5 202.5 0.001790 3.3 4 0.00007 0.04
203 303 6.7 9.5 202.5 0.003640 3.3 4 0.00002 0.00
204 304 8.8 9.5 202.5 0.006281 3.3 4 0.00001 0.00
205 305 10.5 9.5 202.5 0.008943 3.3 4 0.00003 0.00
206 306 13.1 9.5 202.5 0.013922 3.3 4 0.00001 0.00
207 307 2.9 11.5 202.5 0.000446 4 10 0.00005 0.04
208 308 4.7 11.5 202.5 0.001174 4 10 0.00007 0.04
209 309 6.7 11.5 202.5 0.002386 4 10 0.00004 0.00
210 310 8.8 11.5 202.5 0.004118 4 10 0.00004 0.00
211 311 14.1 11.5 202.5 0.010576 4 10 0.00001 0.00
Min: 2.7 3.7 67.5 Total Days: 157.0
Ave: 7.4 8.9 132.0 Calm Days: 208.0
Maxi: 20.8 16.7 202.5
Notes: BOLD = 24 waves in Phase 2, but different wave heights. Min = minimum value in Phase 1, Ave = average value in Phase 1, Max = maximum value in Phase 1.
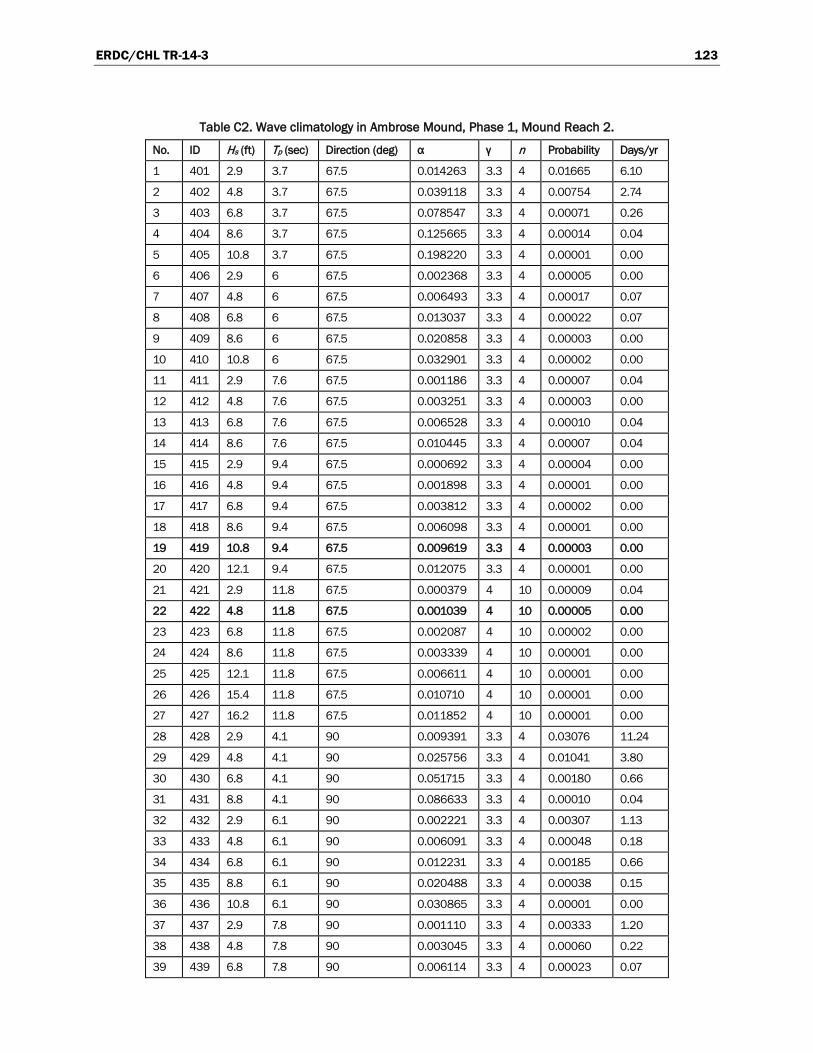
ERDC/CHL TR-14-3 123
Table C2. Wave climatology in Ambrose Mound, Phase 1, Mound Reach 2.
No. ID Hs (ft) Tp (sec) Direction (deg) α γ n Probability Days/yr
1 401 2.9 3.7 67.5 0.014263 3.3 4 0.01665 6.10
2 402 4.8 3.7 67.5 0.039118 3.3 4 0.00754 2.74
3 403 6.8 3.7 67.5 0.078547 3.3 4 0.00071 0.26
4 404 8.6 3.7 67.5 0.125665 3.3 4 0.00014 0.04
5 405 10.8 3.7 67.5 0.198220 3.3 4 0.00001 0.00
6 406 2.9 6 67.5 0.002368 3.3 4 0.00005 0.00
7 407 4.8 6 67.5 0.006493 3.3 4 0.00017 0.07
8 408 6.8 6 67.5 0.013037 3.3 4 0.00022 0.07
9 409 8.6 6 67.5 0.020858 3.3 4 0.00003 0.00
10 410 10.8 6 67.5 0.032901 3.3 4 0.00002 0.00
11 411 2.9 7.6 67.5 0.001186 3.3 4 0.00007 0.04
12 412 4.8 7.6 67.5 0.003251 3.3 4 0.00003 0.00
13 413 6.8 7.6 67.5 0.006528 3.3 4 0.00010 0.04
14 414 8.6 7.6 67.5 0.010445 3.3 4 0.00007 0.04
15 415 2.9 9.4 67.5 0.000692 3.3 4 0.00004 0.00
16 416 4.8 9.4 67.5 0.001898 3.3 4 0.00001 0.00
17 417 6.8 9.4 67.5 0.003812 3.3 4 0.00002 0.00
18 418 8.6 9.4 67.5 0.006098 3.3 4 0.00001 0.00
19 419 10.8 9.4 67.5 0.009619 3.3 4 0.00003 0.00
20 420 12.1 9.4 67.5 0.012075 3.3 4 0.00001 0.00
21 421 2.9 11.8 67.5 0.000379 4 10 0.00009 0.04
22 422 4.8 11.8 67.5 0.001039 4 10 0.00005 0.00
23 423 6.8 11.8 67.5 0.002087 4 10 0.00002 0.00
24 424 8.6 11.8 67.5 0.003339 4 10 0.00001 0.00
25 425 12.1 11.8 67.5 0.006611 4 10 0.00001 0.00
26 426 15.4 11.8 67.5 0.010710 4 10 0.00001 0.00
27 427 16.2 11.8 67.5 0.011852 4 10 0.00001 0.00
28 428 2.9 4.1 90 0.009391 3.3 4 0.03076 11.24
29 429 4.8 4.1 90 0.025756 3.3 4 0.01041 3.80
30 430 6.8 4.1 90 0.051715 3.3 4 0.00180 0.66
31 431 8.8 4.1 90 0.086633 3.3 4 0.00010 0.04
32 432 2.9 6.1 90 0.002221 3.3 4 0.00307 1.13
33 433 4.8 6.1 90 0.006091 3.3 4 0.00048 0.18
34 434 6.8 6.1 90 0.012231 3.3 4 0.00185 0.66
35 435 8.8 6.1 90 0.020488 3.3 4 0.00038 0.15
36 436 10.8 6.1 90 0.030865 3.3 4 0.00001 0.00
37 437 2.9 7.8 90 0.001110 3.3 4 0.00333 1.20
38 438 4.8 7.8 90 0.003045 3.3 4 0.00060 0.22
39 439 6.8 7.8 90 0.006114 3.3 4 0.00023 0.07

ERDC/CHL TR-14-3 124
No. ID Hs (ft) Tp (sec) Direction (deg) α γ n Probability Days/yr
40 440 8.8 7.8 90 0.010242 3.3 4 0.00058 0.22
41 441 10.8 7.8 90 0.015429 3.3 4 0.00037 0.15
42 442 12.9 7.8 90 0.022015 3.3 4 0.00009 0.04
43 443 2.9 9.5 90 0.000662 3.3 4 0.00239 0.88
44 444 4.8 9.5 90 0.001815 3.3 4 0.00026 0.11
45 445 6.8 9.5 90 0.003644 3.3 4 0.00015 0.04
46 446 8.8 9.5 90 0.006104 3.3 4 0.00015 0.07
47 447 10.8 9.5 90 0.009195 3.3 4 0.00014 0.04
48 448 12.9 9.5 90 0.013121 3.3 4 0.00009 0.04
49 449 14.9 9.5 90 0.017506 3.3 4 0.00008 0.04
50 450 17.7 9.5 90 0.024706 3.3 4 0.00003 0.00
51 451 2.9 11.6 90 0.000417 4 10 0.00049 0.18
52 452 4.8 11.6 90 0.001143 4 10 0.00042 0.15
53 453 6.8 11.6 90 0.002294 4 10 0.00029 0.11
54 454 8.8 11.6 90 0.003843 4 10 0.00016 0.07
55 455 10.8 11.6 90 0.005789 4 10 0.00012 0.04
56 456 12.9 11.6 90 0.008261 4 10 0.00005 0.04
57 457 14.9 11.6 90 0.011022 4 10 0.00001 0.00
58 458 17.7 11.6 90 0.015555 4 10 0.00004 0.00
59 459 20.8 11.6 90 0.021482 4 10 0.00003 0.00
60 460 2.9 14.3 90 0.000277 5 16 0.00003 0.00
61 461 4.8 14.3 90 0.000760 5 16 0.00003 0.00
62 462 14.9 14.3 90 0.007334 5 16 0.00001 0.00
63 463 17.7 14.3 90 0.010350 5 16 0.00002 0.00
64 464 2.9 16.7 90 0.000089 7 22 0.00002 0.00
65 465 2.8 4.2 112.5 0.007982 3.3 4 0.03396 12.41
66 466 4.8 4.2 112.5 0.023486 3.3 4 0.00864 3.14
67 467 6.8 4.2 112.5 0.047158 3.3 4 0.00101 0.37
68 468 10.7 4.2 112.5 0.116814 3.3 4 0.00001 0.00
69 469 2.8 6.1 112.5 0.002070 3.3 4 0.00384 1.39
70 470 4.8 6.1 112.5 0.006091 3.3 4 0.00096 0.37
71 471 6.8 6.1 112.5 0.012231 3.3 4 0.00179 0.66
72 472 8.7 6.1 112.5 0.020025 3.3 4 0.00021 0.07
73 473 2.8 7.8 112.5 0.001035 3.3 4 0.00400 1.46
74 474 4.8 7.8 112.5 0.003045 3.3 4 0.00067 0.26
75 475 6.8 7.8 112.5 0.006114 3.3 4 0.00039 0.15
76 476 8.7 7.8 112.5 0.010010 3.3 4 0.00048 0.18
77 477 10.7 7.8 112.5 0.015144 3.3 4 0.00021 0.07
78 478 12.7 7.8 112.5 0.021337 3.3 4 0.00003 0.00
79 479 2.8 9.5 112.5 0.000617 3.3 4 0.00337 1.24
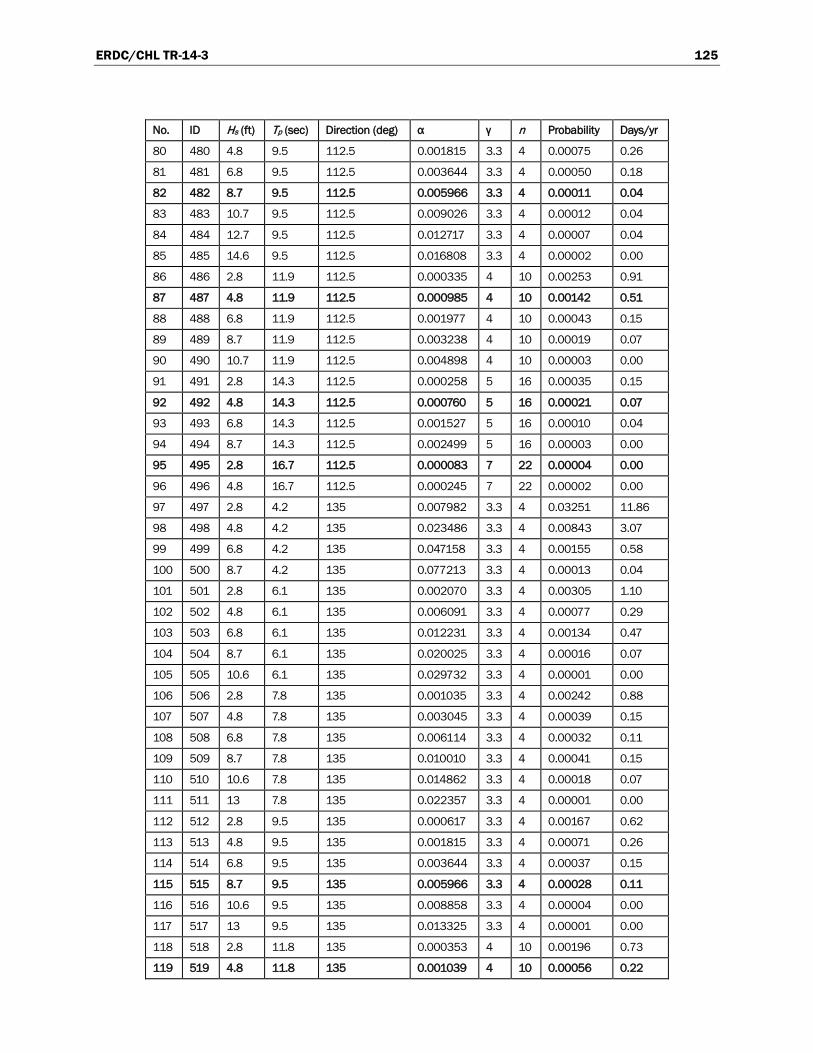
ERDC/CHL TR-14-3 125
No. ID Hs (ft) Tp (sec) Direction (deg) α γ n Probability Days/yr
80 480 4.8 9.5 112.5 0.001815 3.3 4 0.00075 0.26
81 481 6.8 9.5 112.5 0.003644 3.3 4 0.00050 0.18
82 482 8.7 9.5 112.5 0.005966 3.3 4 0.00011 0.04
83 483 10.7 9.5 112.5 0.009026 3.3 4 0.00012 0.04
84 484 12.7 9.5 112.5 0.012717 3.3 4 0.00007 0.04
85 485 14.6 9.5 112.5 0.016808 3.3 4 0.00002 0.00
86 486 2.8 11.9 112.5 0.000335 4 10 0.00253 0.91
87 487 4.8 11.9 112.5 0.000985 4 10 0.00142 0.51
88 488 6.8 11.9 112.5 0.001977 4 10 0.00043 0.15
89 489 8.7 11.9 112.5 0.003238 4 10 0.00019 0.07
90 490 10.7 11.9 112.5 0.004898 4 10 0.00003 0.00
91 491 2.8 14.3 112.5 0.000258 5 16 0.00035 0.15
92 492 4.8 14.3 112.5 0.000760 5 16 0.00021 0.07
93 493 6.8 14.3 112.5 0.001527 5 16 0.00010 0.04
94 494 8.7 14.3 112.5 0.002499 5 16 0.00003 0.00
95 495 2.8 16.7 112.5 0.000083 7 22 0.00004 0.00
96 496 4.8 16.7 112.5 0.000245 7 22 0.00002 0.00
97 497 2.8 4.2 135 0.007982 3.3 4 0.03251 11.86
98 498 4.8 4.2 135 0.023486 3.3 4 0.00843 3.07
99 499 6.8 4.2 135 0.047158 3.3 4 0.00155 0.58
100 500 8.7 4.2 135 0.077213 3.3 4 0.00013 0.04
101 501 2.8 6.1 135 0.002070 3.3 4 0.00305 1.10
102 502 4.8 6.1 135 0.006091 3.3 4 0.00077 0.29
103 503 6.8 6.1 135 0.012231 3.3 4 0.00134 0.47
104 504 8.7 6.1 135 0.020025 3.3 4 0.00016 0.07
105 505 10.6 6.1 135 0.029732 3.3 4 0.00001 0.00
106 506 2.8 7.8 135 0.001035 3.3 4 0.00242 0.88
107 507 4.8 7.8 135 0.003045 3.3 4 0.00039 0.15
108 508 6.8 7.8 135 0.006114 3.3 4 0.00032 0.11
109 509 8.7 7.8 135 0.010010 3.3 4 0.00041 0.15
110 510 10.6 7.8 135 0.014862 3.3 4 0.00018 0.07
111 511 13 7.8 135 0.022357 3.3 4 0.00001 0.00
112 512 2.8 9.5 135 0.000617 3.3 4 0.00167 0.62
113 513 4.8 9.5 135 0.001815 3.3 4 0.00071 0.26
114 514 6.8 9.5 135 0.003644 3.3 4 0.00037 0.15
115 515 8.7 9.5 135 0.005966 3.3 4 0.00028 0.11
116 516 10.6 9.5 135 0.008858 3.3 4 0.00004 0.00
117 517 13 9.5 135 0.013325 3.3 4 0.00001 0.00
118 518 2.8 11.8 135 0.000353 4 10 0.00196 0.73
119 519 4.8 11.8 135 0.001039 4 10 0.00056 0.22

ERDC/CHL TR-14-3 126
No. ID Hs (ft) Tp (sec) Direction (deg) α γ n Probability Days/yr
120 520 6.8 11.8 135 0.002087 4 10 0.00029 0.11
121 521 8.7 11.8 135 0.003417 4 10 0.00025 0.07
122 522 10.6 11.8 135 0.005073 4 10 0.00007 0.04
123 523 13 11.8 135 0.007631 4 10 0.00001 0.00
124 524 2.8 14.3 135 0.000258 5 16 0.00030 0.11
125 525 4.8 14.3 135 0.000760 5 16 0.00013 0.04
126 526 6.8 14.3 135 0.001527 5 16 0.00012 0.04
127 527 2.8 16.7 135 0.000083 7 22 0.00002 0.00
128 528 4.8 16.7 135 0.000245 7 22 0.00009 0.04
129 529 6.8 16.7 135 0.000493 7 22 0.00007 0.04
130 530 2.7 4.2 157.5 0.007422 3.3 4 0.04939 18.03
131 531 4.7 4.2 157.5 0.022517 3.3 4 0.01042 3.80
132 532 6.8 4.2 157.5 0.047158 3.3 4 0.00105 0.37
133 533 10.8 4.2 157.5 0.119008 3.3 4 0.00001 0.00
134 534 2.7 6 157.5 0.002052 3.3 4 0.00606 2.23
135 535 4.7 6 157.5 0.006225 3.3 4 0.00157 0.58
136 536 6.8 6 157.5 0.013037 3.3 4 0.00158 0.58
137 537 8.8 6 157.5 0.021840 3.3 4 0.00021 0.07
138 538 2.7 7.7 157.5 0.000998 3.3 4 0.00290 1.06
139 539 4.7 7.7 157.5 0.003028 3.3 4 0.00078 0.29
140 540 6.8 7.7 157.5 0.006341 3.3 4 0.00030 0.11
141 541 8.8 7.7 157.5 0.010622 3.3 4 0.00066 0.26
142 542 10.8 7.7 157.5 0.016002 3.3 4 0.00030 0.11
143 543 13 7.7 157.5 0.023188 3.3 4 0.00005 0.00
144 544 2.7 9.5 157.5 0.000573 3.3 4 0.00193 0.69
145 545 4.7 9.5 157.5 0.001740 3.3 4 0.00082 0.29
146 546 6.8 9.5 157.5 0.003644 3.3 4 0.00052 0.18
147 547 8.8 9.5 157.5 0.006104 3.3 4 0.00010 0.04
148 548 10.8 9.5 157.5 0.009195 3.3 4 0.00015 0.07
149 549 13 9.5 157.5 0.013325 3.3 4 0.00009 0.04
150 550 14.7 9.5 157.5 0.017039 3.3 4 0.00004 0.00
151 551 2.7 11.7 157.5 0.000345 4 10 0.00175 0.62
152 552 4.7 11.7 157.5 0.001048 4 10 0.00059 0.22
153 553 6.8 11.7 157.5 0.002194 4 10 0.00029 0.11
154 554 8.8 11.7 157.5 0.003675 4 10 0.00004 0.00
155 555 13 11.7 157.5 0.008023 4 10 0.00001 0.00
156 556 2.7 14.3 157.5 0.000240 5 16 0.00038 0.15
157 557 4.7 14.3 157.5 0.000729 5 16 0.00033 0.11
158 558 2.7 16.7 157.5 0.000078 7 22 0.00010 0.04
159 559 4.7 16.7 157.5 0.000235 7 22 0.00001 0.00
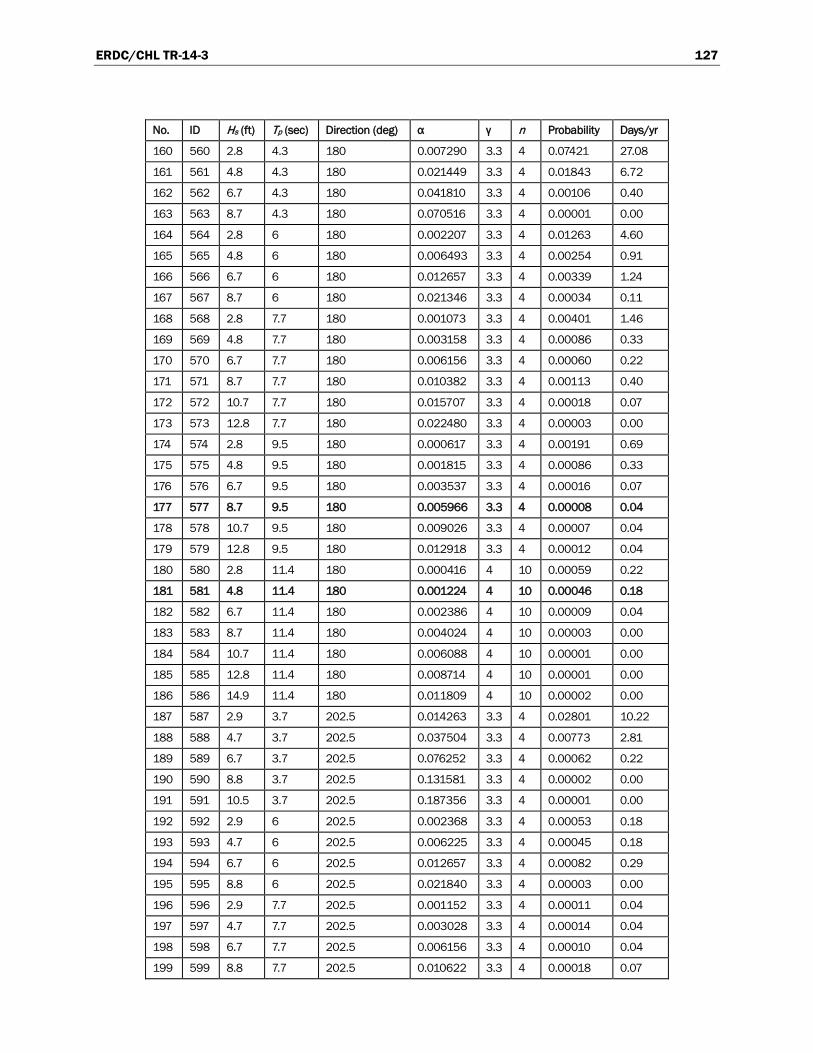
ERDC/CHL TR-14-3 127
No. ID Hs (ft) Tp (sec) Direction (deg) α γ n Probability Days/yr
160 560 2.8 4.3 180 0.007290 3.3 4 0.07421 27.08
161 561 4.8 4.3 180 0.021449 3.3 4 0.01843 6.72
162 562 6.7 4.3 180 0.041810 3.3 4 0.00106 0.40
163 563 8.7 4.3 180 0.070516 3.3 4 0.00001 0.00
164 564 2.8 6 180 0.002207 3.3 4 0.01263 4.60
165 565 4.8 6 180 0.006493 3.3 4 0.00254 0.91
166 566 6.7 6 180 0.012657 3.3 4 0.00339 1.24
167 567 8.7 6 180 0.021346 3.3 4 0.00034 0.11
168 568 2.8 7.7 180 0.001073 3.3 4 0.00401 1.46
169 569 4.8 7.7 180 0.003158 3.3 4 0.00086 0.33
170 570 6.7 7.7 180 0.006156 3.3 4 0.00060 0.22
171 571 8.7 7.7 180 0.010382 3.3 4 0.00113 0.40
172 572 10.7 7.7 180 0.015707 3.3 4 0.00018 0.07
173 573 12.8 7.7 180 0.022480 3.3 4 0.00003 0.00
174 574 2.8 9.5 180 0.000617 3.3 4 0.00191 0.69
175 575 4.8 9.5 180 0.001815 3.3 4 0.00086 0.33
176 576 6.7 9.5 180 0.003537 3.3 4 0.00016 0.07
177 577 8.7 9.5 180 0.005966 3.3 4 0.00008 0.04
178 578 10.7 9.5 180 0.009026 3.3 4 0.00007 0.04
179 579 12.8 9.5 180 0.012918 3.3 4 0.00012 0.04
180 580 2.8 11.4 180 0.000416 4 10 0.00059 0.22
181 581 4.8 11.4 180 0.001224 4 10 0.00046 0.18
182 582 6.7 11.4 180 0.002386 4 10 0.00009 0.04
183 583 8.7 11.4 180 0.004024 4 10 0.00003 0.00
184 584 10.7 11.4 180 0.006088 4 10 0.00001 0.00
185 585 12.8 11.4 180 0.008714 4 10 0.00001 0.00
186 586 14.9 11.4 180 0.011809 4 10 0.00002 0.00
187 587 2.9 3.7 202.5 0.014263 3.3 4 0.02801 10.22
188 588 4.7 3.7 202.5 0.037504 3.3 4 0.00773 2.81
189 589 6.7 3.7 202.5 0.076252 3.3 4 0.00062 0.22
190 590 8.8 3.7 202.5 0.131581 3.3 4 0.00002 0.00
191 591 10.5 3.7 202.5 0.187356 3.3 4 0.00001 0.00
192 592 2.9 6 202.5 0.002368 3.3 4 0.00053 0.18
193 593 4.7 6 202.5 0.006225 3.3 4 0.00045 0.18
194 594 6.7 6 202.5 0.012657 3.3 4 0.00082 0.29
195 595 8.8 6 202.5 0.021840 3.3 4 0.00003 0.00
196 596 2.9 7.7 202.5 0.001152 3.3 4 0.00011 0.04
197 597 4.7 7.7 202.5 0.003028 3.3 4 0.00014 0.04
198 598 6.7 7.7 202.5 0.006156 3.3 4 0.00010 0.04
199 599 8.8 7.7 202.5 0.010622 3.3 4 0.00018 0.07
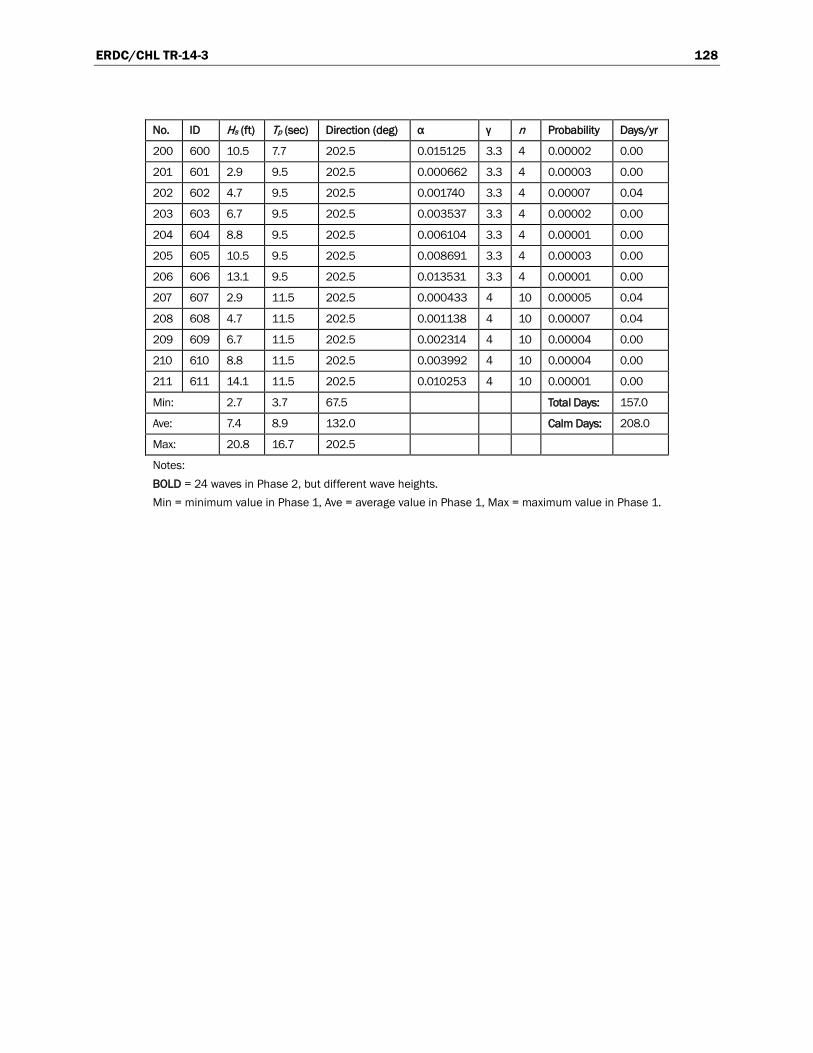
ERDC/CHL TR-14-3 128
No. ID Hs (ft) Tp (sec) Direction (deg) α γ n Probability Days/yr
200 600 10.5 7.7 202.5 0.015125 3.3 4 0.00002 0.00
201 601 2.9 9.5 202.5 0.000662 3.3 4 0.00003 0.00
202 602 4.7 9.5 202.5 0.001740 3.3 4 0.00007 0.04
203 603 6.7 9.5 202.5 0.003537 3.3 4 0.00002 0.00
204 604 8.8 9.5 202.5 0.006104 3.3 4 0.00001 0.00
205 605 10.5 9.5 202.5 0.008691 3.3 4 0.00003 0.00
206 606 13.1 9.5 202.5 0.013531 3.3 4 0.00001 0.00
207 607 2.9 11.5 202.5 0.000433 4 10 0.00005 0.04
208 608 4.7 11.5 202.5 0.001138 4 10 0.00007 0.04
209 609 6.7 11.5 202.5 0.002314 4 10 0.00004 0.00
210 610 8.8 11.5 202.5 0.003992 4 10 0.00004 0.00
211 611 14.1 11.5 202.5 0.010253 4 10 0.00001 0.00
Min: 2.7 3.7 67.5 Total Days: 157.0
Ave: 7.4 8.9 132.0 Calm Days: 208.0
Max: 20.8 16.7 202.5
Notes: BOLD = 24 waves in Phase 2, but different wave heights. Min = minimum value in Phase 1, Ave = average value in Phase 1, Max = maximum value in Phase 1.
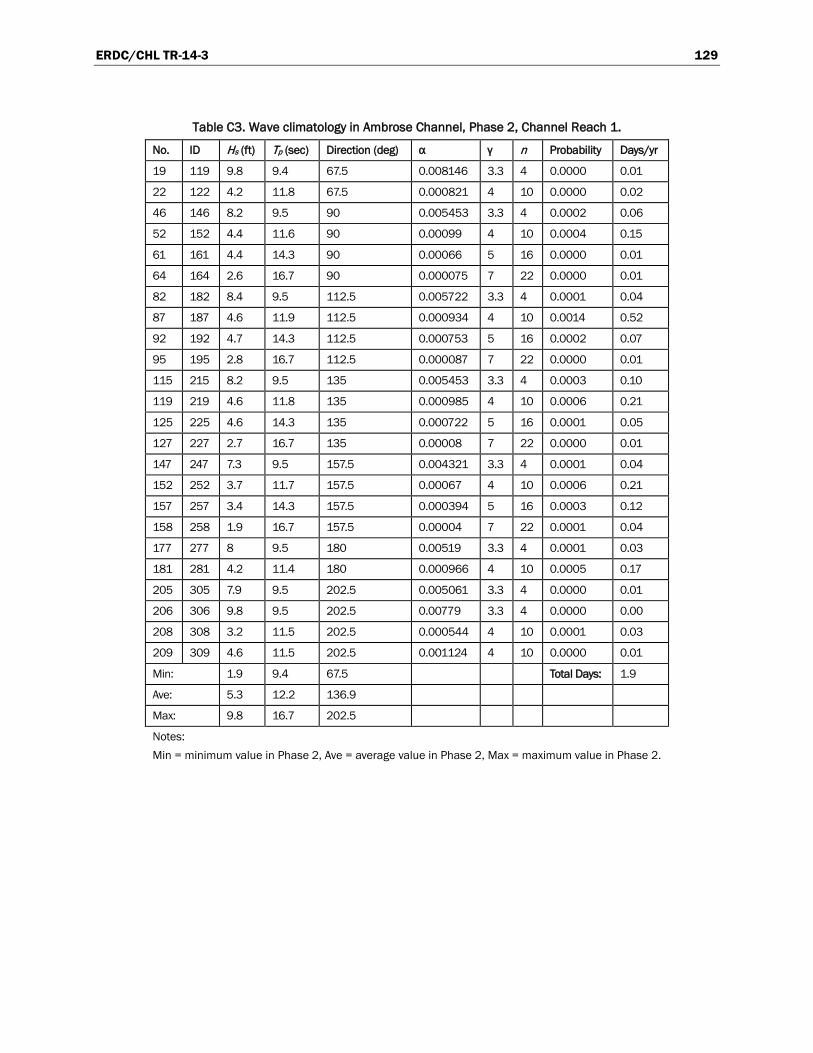
ERDC/CHL TR-14-3 129
Table C3. Wave climatology in Ambrose Channel, Phase 2, Channel Reach 1.
No. ID Hs (ft) Tp (sec) Direction (deg) α γ n Probability Days/yr
19 119 9.8 9.4 67.5 0.008146 3.3 4 0.0000 0.01
22 122 4.2 11.8 67.5 0.000821 4 10 0.0000 0.02
46 146 8.2 9.5 90 0.005453 3.3 4 0.0002 0.06
52 152 4.4 11.6 90 0.00099 4 10 0.0004 0.15
61 161 4.4 14.3 90 0.00066 5 16 0.0000 0.01
64 164 2.6 16.7 90 0.000075 7 22 0.0000 0.01
82 182 8.4 9.5 112.5 0.005722 3.3 4 0.0001 0.04
87 187 4.6 11.9 112.5 0.000934 4 10 0.0014 0.52
92 192 4.7 14.3 112.5 0.000753 5 16 0.0002 0.07
95 195 2.8 16.7 112.5 0.000087 7 22 0.0000 0.01
115 215 8.2 9.5 135 0.005453 3.3 4 0.0003 0.10
119 219 4.6 11.8 135 0.000985 4 10 0.0006 0.21
125 225 4.6 14.3 135 0.000722 5 16 0.0001 0.05
127 227 2.7 16.7 135 0.00008 7 22 0.0000 0.01
147 247 7.3 9.5 157.5 0.004321 3.3 4 0.0001 0.04
152 252 3.7 11.7 157.5 0.00067 4 10 0.0006 0.21
157 257 3.4 14.3 157.5 0.000394 5 16 0.0003 0.12
158 258 1.9 16.7 157.5 0.00004 7 22 0.0001 0.04
177 277 8 9.5 180 0.00519 3.3 4 0.0001 0.03
181 281 4.2 11.4 180 0.000966 4 10 0.0005 0.17
205 305 7.9 9.5 202.5 0.005061 3.3 4 0.0000 0.01
206 306 9.8 9.5 202.5 0.00779 3.3 4 0.0000 0.00
208 308 3.2 11.5 202.5 0.000544 4 10 0.0001 0.03
209 309 4.6 11.5 202.5 0.001124 4 10 0.0000 0.01
Min: 1.9 9.4 67.5 Total Days: 1.9 Ave: 5.3 12.2 136.9
Max: 9.8 16.7 202.5
Notes: Min = minimum value in Phase 2, Ave = average value in Phase 2, Max = maximum value in Phase 2.

ERDC/CHL TR-14-3 130
Table C4. Wave climatology in Ambrose Mound, Phase 2, Mound Reach 2.
No. ID Hs (ft) Tp (sec) Direction (deg) α γ n Probability Days/yr
19 419 10.2 9.4 67.5 0.008579 3.3 4 0.0000 0.01
22 422 4.4 11.8 67.5 0.000873 4.0 10 0.0000 0.02
46 446 8.5 9.5 90.0 0.005695 3.3 4 0.0002 0.06
52 452 4.6 11.6 90.0 0.001049 4.0 10 0.0004 0.15
61 461 4.6 14.3 90.0 0.000698 5.0 16 0.0000 0.01
64 464 2.8 16.7 90.0 0.000083 7.0 22 0.0000 0.01
82 482 9.4 9.5 112.5 0.006965 3.3 4 0.0001 0.04
87 487 5.4 11.9 112.5 0.001247 4.0 10 0.0014 0.52
92 492 5.5 14.3 112.5 0.000998 5.0 16 0.0002 0.07
95 495 3.3 16.7 112.5 0.000116 7.0 22 0.0000 0.01
115 515 9.1 9.5 135.0 0.006527 3.3 4 0.0003 0.10
119 519 5.2 11.8 135.0 0.001220 4.0 10 0.0006 0.21
125 525 5.3 14.3 135.0 0.000927 5.0 16 0.0001 0.05
127 527 3.2 16.7 135.0 0.000109 7.0 22 0.0000 0.01
147 547 7.5 9.5 157.5 0.004433 3.3 4 0.0001 0.04
152 552 3.8 11.7 157.5 0.000685 4.0 10 0.0006 0.21
157 557 3.6 14.3 157.5 0.000427 5.0 16 0.0003 0.12
158 558 2.0 16.7 157.5 0.000043 7.0 22 0.0001 0.04
177 577 7.5 9.5 180.0 0.004433 3.3 4 0.0001 0.03
181 581 3.8 11.4 180.0 0.000767 4.0 10 0.0005 0.17
205 605 8.4 9.5 202.5 0.005562 3.3 4 0.0000 0.01
206 606 9.8 9.5 202.5 0.007571 3.3 4 0.0000 0.00
208 608 3.4 11.5 202.5 0.000595 4.0 10 0.0001 0.03
209 609 4.6 11.5 202.5 0.001090 4.0 10 0.0000 0.01
Min: 2.0 9.4 67.5 Total Days: 1.9 Ave: 5.7 12.2 136.9
Max: 10.2 16.7 202.5
Notes: 1. Min = minimum value in Phase 2, Ave = average value in Phase 2, Max = maximum value in Phase 2.
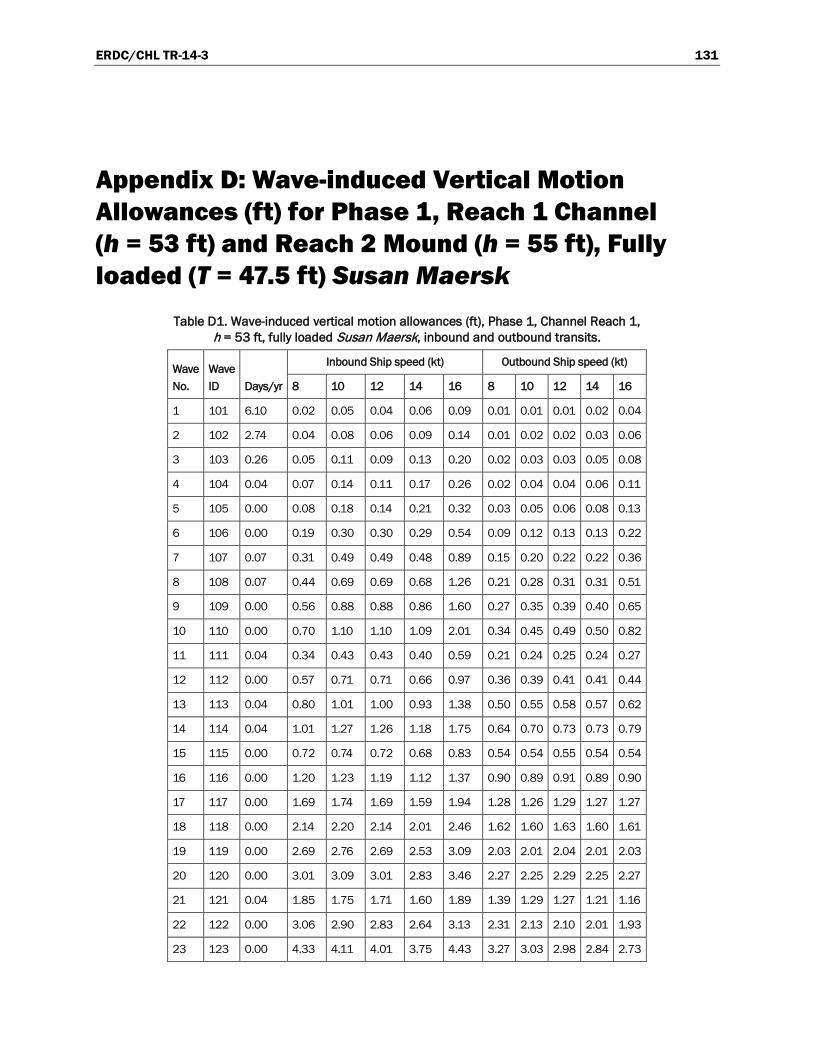
ERDC/CHL TR-14-3 131
Appendix D: Wave-induced Vertical Motion Allowances (ft) for Phase 1, Reach 1 Channel (h = 53 ft) and Reach 2 Mound (h = 55 ft), Fully loaded (T = 47.5 ft) Susan Maersk
Table D1. Wave-induced vertical motion allowances (ft), Phase 1, Channel Reach 1, h = 53 ft, fully loaded Susan Maersk, inbound and outbound transits.
Wave No.
Wave ID Days/yr
Inbound Ship speed (kt) Outbound Ship speed (kt)
8 10 12 14 16 8 10 12 14 16
1 101 6.10 0.02 0.05 0.04 0.06 0.09 0.01 0.01 0.01 0.02 0.04
2 102 2.74 0.04 0.08 0.06 0.09 0.14 0.01 0.02 0.02 0.03 0.06
3 103 0.26 0.05 0.11 0.09 0.13 0.20 0.02 0.03 0.03 0.05 0.08
4 104 0.04 0.07 0.14 0.11 0.17 0.26 0.02 0.04 0.04 0.06 0.11
5 105 0.00 0.08 0.18 0.14 0.21 0.32 0.03 0.05 0.06 0.08 0.13
6 106 0.00 0.19 0.30 0.30 0.29 0.54 0.09 0.12 0.13 0.13 0.22
7 107 0.07 0.31 0.49 0.49 0.48 0.89 0.15 0.20 0.22 0.22 0.36
8 108 0.07 0.44 0.69 0.69 0.68 1.26 0.21 0.28 0.31 0.31 0.51
9 109 0.00 0.56 0.88 0.88 0.86 1.60 0.27 0.35 0.39 0.40 0.65
10 110 0.00 0.70 1.10 1.10 1.09 2.01 0.34 0.45 0.49 0.50 0.82
11 111 0.04 0.34 0.43 0.43 0.40 0.59 0.21 0.24 0.25 0.24 0.27
12 112 0.00 0.57 0.71 0.71 0.66 0.97 0.36 0.39 0.41 0.41 0.44
13 113 0.04 0.80 1.01 1.00 0.93 1.38 0.50 0.55 0.58 0.57 0.62
14 114 0.04 1.01 1.27 1.26 1.18 1.75 0.64 0.70 0.73 0.73 0.79
15 115 0.00 0.72 0.74 0.72 0.68 0.83 0.54 0.54 0.55 0.54 0.54
16 116 0.00 1.20 1.23 1.19 1.12 1.37 0.90 0.89 0.91 0.89 0.90
17 117 0.00 1.69 1.74 1.69 1.59 1.94 1.28 1.26 1.29 1.27 1.27
18 118 0.00 2.14 2.20 2.14 2.01 2.46 1.62 1.60 1.63 1.60 1.61
19 119 0.00 2.69 2.76 2.69 2.53 3.09 2.03 2.01 2.04 2.01 2.03
20 120 0.00 3.01 3.09 3.01 2.83 3.46 2.27 2.25 2.29 2.25 2.27
21 121 0.04 1.85 1.75 1.71 1.60 1.89 1.39 1.29 1.27 1.21 1.16
22 122 0.00 3.06 2.90 2.83 2.64 3.13 2.31 2.13 2.10 2.01 1.93
23 123 0.00 4.33 4.11 4.01 3.75 4.43 3.27 3.03 2.98 2.84 2.73

ERDC/CHL TR-14-3 132
Wave No.
Wave ID Days/yr
Inbound Ship speed (kt) Outbound Ship speed (kt)
8 10 12 14 16 8 10 12 14 16
24 124 0.00 5.48 5.20 5.07 4.74 5.61 4.13 3.83 3.77 3.60 3.46
25 125 0.00 7.71 7.31 7.14 6.67 7.89 5.82 5.38 5.30 5.06 4.86
26 126 0.00 9.82 9.31 9.08 8.49 10.04 7.40 6.85 6.74 6.44 6.19
27 127 0.00 10.33 9.79 9.55 8.93 10.56 7.79 7.21 7.09 6.78 6.51
28 128 11.24 0.05 0.10 0.08 0.11 0.18 0.01 0.01 0.02 0.02 0.04
29 129 3.80 0.08 0.16 0.13 0.18 0.29 0.02 0.02 0.03 0.04 0.06
30 130 0.66 0.11 0.23 0.19 0.26 0.42 0.02 0.03 0.04 0.05 0.09
31 131 0.04 0.14 0.30 0.25 0.33 0.54 0.03 0.04 0.05 0.06 0.12
32 132 1.13 0.22 0.34 0.34 0.33 0.61 0.08 0.09 0.10 0.10 0.14
33 133 0.18 0.36 0.56 0.56 0.54 1.00 0.12 0.14 0.16 0.16 0.22
34 134 0.66 0.51 0.80 0.79 0.77 1.42 0.18 0.20 0.22 0.23 0.32
35 135 0.15 0.66 1.03 1.02 0.99 1.84 0.23 0.26 0.29 0.30 0.41
36 136 0.00 0.81 1.27 1.25 1.22 2.26 0.28 0.32 0.36 0.36 0.51
37 137 1.20 0.40 0.49 0.48 0.44 0.66 0.20 0.21 0.21 0.22 0.22
38 138 0.22 0.66 0.81 0.79 0.73 1.10 0.33 0.34 0.35 0.36 0.36
39 139 0.07 0.93 1.15 1.12 1.04 1.56 0.47 0.48 0.50 0.51 0.51
40 140 0.22 1.21 1.48 1.45 1.35 2.01 0.61 0.62 0.65 0.66 0.66
41 141 0.15 1.48 1.82 1.78 1.65 2.47 0.75 0.77 0.80 0.81 0.82
42 142 0.04 1.77 2.18 2.13 1.98 2.95 0.89 0.92 0.95 0.96 0.97
43 143 0.88 0.76 0.78 0.75 0.69 0.92 0.49 0.47 0.48 0.47 0.47
44 144 0.11 1.26 1.30 1.24 1.15 1.53 0.81 0.78 0.79 0.78 0.78
45 145 0.04 1.79 1.84 1.75 1.62 2.16 1.14 1.11 1.12 1.11 1.11
46 146 0.07 2.32 2.38 2.27 2.10 2.80 1.48 1.44 1.46 1.44 1.44
47 147 0.04 2.84 2.92 2.78 2.58 3.44 1.82 1.76 1.79 1.76 1.76
48 148 0.04 3.40 3.48 3.33 3.08 4.11 2.17 2.10 2.13 2.11 2.11
49 149 0.04 3.92 4.03 3.84 3.56 4.75 2.51 2.43 2.47 2.43 2.43
50 150 0.00 4.66 4.78 4.56 4.23 5.64 2.98 2.89 2.93 2.89 2.89
51 151 0.18 1.46 1.39 1.32 1.21 1.98 0.92 0.83 0.80 0.77 0.73
52 152 0.15 2.42 2.31 2.18 2.00 3.28 1.52 1.38 1.33 1.27 1.21
53 153 0.11 3.43 3.27 3.09 2.83 4.64 2.15 1.96 1.89 1.80 1.71
54 154 0.07 4.45 4.23 4.00 3.66 6.01 2.79 2.53 2.44 2.33 2.21
55 155 0.04 5.46 5.19 4.91 4.50 7.38 3.42 3.11 3.00 2.85 2.71
56 156 0.04 6.52 6.20 5.86 5.37 8.81 4.09 3.72 3.58 3.41 3.24

ERDC/CHL TR-14-3 133
Wave No.
Wave ID Days/yr
Inbound Ship speed (kt) Outbound Ship speed (kt)
8 10 12 14 16 8 10 12 14 16
57 157 0.00 7.53 7.16 6.77 6.20 10.18 4.72 4.29 4.13 3.94 3.74
58 158 0.00 8.94 8.51 8.04 7.37 12.09 5.61 5.10 4.91 4.68 4.45
59 159 0.00 10.51 10.00 9.45 8.66 14.22 6.59 5.99 5.77 5.50 5.23
60 160 0.00 1.98 1.89 1.77 2.21 3.75 1.57 1.48 1.40 1.35 1.23
61 161 0.00 3.28 3.13 2.93 3.67 6.20 2.60 2.46 2.33 2.24 2.03
62 162 0.00 10.19 9.71 9.09 11.39 19.27 8.07 7.63 7.23 6.96 6.30
63 163 0.00 12.11 11.54 10.80 13.53 22.89 9.58 9.07 8.58 8.27 7.49
64 164 0.00 3.06 2.95 2.74 4.43 7.64 3.05 2.91 2.71 2.60 2.31
65 165 12.41 0.05 0.11 0.09 0.13 0.20 0.01 0.01 0.01 0.01 0.02
66 166 3.14 0.09 0.19 0.16 0.22 0.35 0.01 0.02 0.02 0.02 0.04
67 167 0.37 0.13 0.27 0.23 0.30 0.49 0.02 0.02 0.03 0.03 0.05
68 168 0.00 0.21 0.43 0.36 0.48 0.77 0.03 0.03 0.04 0.05 0.09
69 169 1.39 0.22 0.35 0.34 0.33 0.61 0.06 0.06 0.07 0.07 0.08
70 170 0.37 0.38 0.59 0.58 0.56 1.05 0.11 0.11 0.12 0.12 0.13
71 171 0.66 0.53 0.84 0.83 0.80 1.49 0.15 0.15 0.16 0.17 0.18
72 172 0.07 0.68 1.07 1.06 1.02 1.91 0.19 0.20 0.21 0.22 0.23
73 173 1.46 0.39 0.49 0.47 0.44 0.67 0.17 0.17 0.17 0.18 0.18
74 174 0.26 0.67 0.84 0.81 0.76 1.14 0.29 0.29 0.30 0.30 0.31
75 175 0.15 0.96 1.19 1.15 1.07 1.62 0.42 0.41 0.42 0.43 0.43
76 176 0.18 1.22 1.52 1.47 1.37 2.07 0.53 0.53 0.54 0.55 0.56
77 177 0.07 1.50 1.87 1.81 1.69 2.55 0.66 0.65 0.66 0.67 0.68
78 178 0.00 1.79 2.22 2.15 2.01 3.02 0.78 0.77 0.79 0.80 0.81
79 179 1.24 0.74 0.76 0.72 0.66 0.91 0.42 0.40 0.40 0.40 0.39
80 180 0.26 1.26 1.30 1.23 1.12 1.57 0.72 0.69 0.69 0.68 0.68
81 181 0.18 1.79 1.84 1.74 1.59 2.22 1.02 0.97 0.98 0.97 0.96
82 182 0.04 2.29 2.36 2.23 2.04 2.84 1.31 1.25 1.26 1.24 1.23
83 183 0.04 2.82 2.90 2.74 2.51 3.49 1.61 1.53 1.54 1.52 1.51
84 184 0.04 3.35 3.45 3.25 2.98 4.15 1.91 1.82 1.83 1.80 1.79
85 185 0.00 3.85 3.96 3.74 3.42 4.77 2.19 2.09 2.11 2.07 2.06
86 186 0.91 1.38 1.30 1.19 1.20 2.25 0.77 0.68 0.63 0.59 0.55
87 187 0.51 2.37 2.23 2.04 2.06 3.86 1.32 1.17 1.08 1.02 0.94
88 188 0.15 3.36 3.16 2.89 2.92 5.47 1.87 1.66 1.54 1.44 1.34
89 189 0.07 4.30 4.05 3.69 3.73 7.00 2.39 2.12 1.97 1.84 1.71

ERDC/CHL TR-14-3 134
Wave No.
Wave ID Days/yr
Inbound Ship speed (kt) Outbound Ship speed (kt)
8 10 12 14 16 8 10 12 14 16
90 190 0.00 5.29 4.98 4.54 4.59 8.61 2.94 2.61 2.42 2.27 2.10
91 191 0.15 1.42 1.34 1.19 2.19 3.67 1.04 0.95 0.86 0.80 0.70
92 192 0.07 2.44 2.30 2.04 3.76 6.30 1.78 1.63 1.47 1.38 1.21
93 193 0.04 3.46 3.25 2.90 5.32 8.93 2.52 2.31 2.08 1.95 1.71
94 194 0.00 4.43 4.16 3.71 6.81 11.42 3.22 2.95 2.66 2.49 2.19
95 195 0.00 1.68 1.59 1.99 4.63 7.06 1.71 1.59 1.41 1.32 1.14
96 196 0.00 2.88 2.73 3.41 7.94 12.11 2.94 2.72 2.41 2.26 1.96
97 197 11.86 0.05 0.11 0.09 0.12 0.20 0.01 0.01 0.01 0.02 0.03
98 198 3.07 0.09 0.19 0.16 0.21 0.34 0.01 0.02 0.02 0.03 0.05
99 199 0.58 0.13 0.27 0.22 0.30 0.49 0.02 0.03 0.03 0.04 0.07
100 200 0.04 0.17 0.35 0.29 0.39 0.62 0.03 0.03 0.04 0.05 0.09
101 201 1.10 0.22 0.34 0.34 0.33 0.61 0.06 0.07 0.07 0.08 0.09
102 202 0.29 0.37 0.59 0.58 0.56 1.04 0.11 0.12 0.13 0.13 0.15
103 203 0.47 0.53 0.83 0.82 0.79 1.48 0.15 0.16 0.18 0.19 0.22
104 204 0.07 0.68 1.06 1.05 1.01 1.89 0.20 0.21 0.23 0.24 0.28
105 205 0.00 0.83 1.29 1.27 1.23 2.31 0.24 0.26 0.28 0.29 0.34
106 206 0.88 0.39 0.48 0.47 0.44 0.66 0.18 0.18 0.18 0.18 0.19
107 207 0.15 0.67 0.83 0.81 0.75 1.13 0.30 0.30 0.31 0.31 0.32
108 208 0.11 0.95 1.18 1.15 1.07 1.61 0.43 0.43 0.44 0.45 0.45
109 209 0.15 1.22 1.51 1.47 1.37 2.06 0.55 0.55 0.56 0.57 0.58
110 210 0.07 1.48 1.84 1.79 1.67 2.51 0.67 0.67 0.68 0.69 0.70
111 211 0.00 1.82 2.25 2.19 2.04 3.07 0.82 0.82 0.84 0.85 0.86
112 212 0.62 0.74 0.76 0.72 0.66 0.91 0.43 0.41 0.42 0.41 0.41
113 213 0.26 1.26 1.30 1.23 1.13 1.56 0.74 0.71 0.71 0.70 0.70
114 214 0.15 1.79 1.84 1.74 1.60 2.21 1.05 1.00 1.01 1.00 0.99
115 215 0.11 2.29 2.36 2.23 2.05 2.83 1.34 1.28 1.30 1.28 1.27
116 216 0.00 2.79 2.87 2.72 2.50 3.45 1.64 1.56 1.58 1.56 1.55
117 217 0.00 3.43 3.52 3.33 3.06 4.23 2.01 1.92 1.94 1.91 1.90
118 218 0.73 1.38 1.30 1.20 1.18 2.16 0.79 0.71 0.66 0.62 0.58
119 219 0.22 2.37 2.24 2.06 2.02 3.70 1.35 1.21 1.14 1.07 1.00
120 220 0.11 3.36 3.17 2.92 2.87 5.24 1.92 1.71 1.61 1.52 1.42
121 221 0.07 4.30 4.06 3.74 3.67 6.71 2.46 2.19 2.06 1.94 1.81
122 222 0.04 5.24 4.94 4.55 4.47 8.17 2.99 2.67 2.51 2.36 2.21
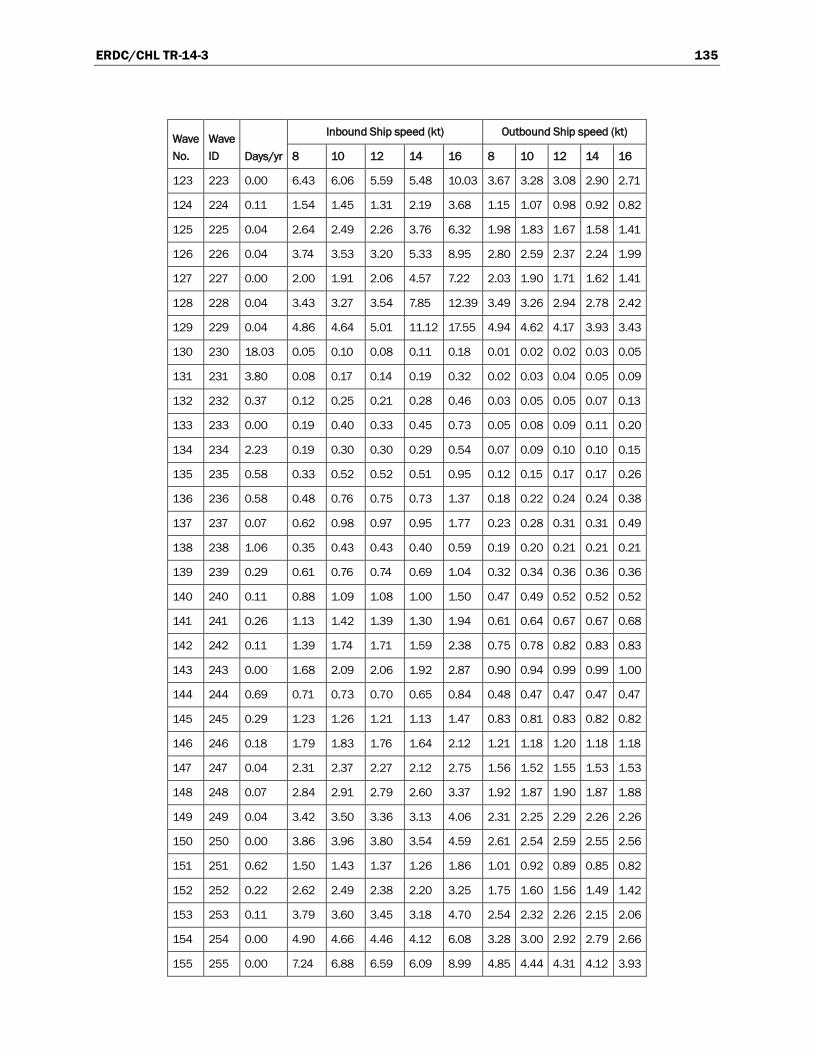
ERDC/CHL TR-14-3 135
Wave No.
Wave ID Days/yr
Inbound Ship speed (kt) Outbound Ship speed (kt)
8 10 12 14 16 8 10 12 14 16
123 223 0.00 6.43 6.06 5.59 5.48 10.03 3.67 3.28 3.08 2.90 2.71
124 224 0.11 1.54 1.45 1.31 2.19 3.68 1.15 1.07 0.98 0.92 0.82
125 225 0.04 2.64 2.49 2.26 3.76 6.32 1.98 1.83 1.67 1.58 1.41
126 226 0.04 3.74 3.53 3.20 5.33 8.95 2.80 2.59 2.37 2.24 1.99
127 227 0.00 2.00 1.91 2.06 4.57 7.22 2.03 1.90 1.71 1.62 1.41
128 228 0.04 3.43 3.27 3.54 7.85 12.39 3.49 3.26 2.94 2.78 2.42
129 229 0.04 4.86 4.64 5.01 11.12 17.55 4.94 4.62 4.17 3.93 3.43
130 230 18.03 0.05 0.10 0.08 0.11 0.18 0.01 0.02 0.02 0.03 0.05
131 231 3.80 0.08 0.17 0.14 0.19 0.32 0.02 0.03 0.04 0.05 0.09
132 232 0.37 0.12 0.25 0.21 0.28 0.46 0.03 0.05 0.05 0.07 0.13
133 233 0.00 0.19 0.40 0.33 0.45 0.73 0.05 0.08 0.09 0.11 0.20
134 234 2.23 0.19 0.30 0.30 0.29 0.54 0.07 0.09 0.10 0.10 0.15
135 235 0.58 0.33 0.52 0.52 0.51 0.95 0.12 0.15 0.17 0.17 0.26
136 236 0.58 0.48 0.76 0.75 0.73 1.37 0.18 0.22 0.24 0.24 0.38
137 237 0.07 0.62 0.98 0.97 0.95 1.77 0.23 0.28 0.31 0.31 0.49
138 238 1.06 0.35 0.43 0.43 0.40 0.59 0.19 0.20 0.21 0.21 0.21
139 239 0.29 0.61 0.76 0.74 0.69 1.04 0.32 0.34 0.36 0.36 0.36
140 240 0.11 0.88 1.09 1.08 1.00 1.50 0.47 0.49 0.52 0.52 0.52
141 241 0.26 1.13 1.42 1.39 1.30 1.94 0.61 0.64 0.67 0.67 0.68
142 242 0.11 1.39 1.74 1.71 1.59 2.38 0.75 0.78 0.82 0.83 0.83
143 243 0.00 1.68 2.09 2.06 1.92 2.87 0.90 0.94 0.99 0.99 1.00
144 244 0.69 0.71 0.73 0.70 0.65 0.84 0.48 0.47 0.47 0.47 0.47
145 245 0.29 1.23 1.26 1.21 1.13 1.47 0.83 0.81 0.83 0.82 0.82
146 246 0.18 1.79 1.83 1.76 1.64 2.12 1.21 1.18 1.20 1.18 1.18
147 247 0.04 2.31 2.37 2.27 2.12 2.75 1.56 1.52 1.55 1.53 1.53
148 248 0.07 2.84 2.91 2.79 2.60 3.37 1.92 1.87 1.90 1.87 1.88
149 249 0.04 3.42 3.50 3.36 3.13 4.06 2.31 2.25 2.29 2.26 2.26
150 250 0.00 3.86 3.96 3.80 3.54 4.59 2.61 2.54 2.59 2.55 2.56
151 251 0.62 1.50 1.43 1.37 1.26 1.86 1.01 0.92 0.89 0.85 0.82
152 252 0.22 2.62 2.49 2.38 2.20 3.25 1.75 1.60 1.56 1.49 1.42
153 253 0.11 3.79 3.60 3.45 3.18 4.70 2.54 2.32 2.26 2.15 2.06
154 254 0.00 4.90 4.66 4.46 4.12 6.08 3.28 3.00 2.92 2.79 2.66
155 255 0.00 7.24 6.88 6.59 6.09 8.99 4.85 4.44 4.31 4.12 3.93

ERDC/CHL TR-14-3 136
Wave No.
Wave ID Days/yr
Inbound Ship speed (kt) Outbound Ship speed (kt)
8 10 12 14 16 8 10 12 14 16
156 256 0.15 2.05 1.96 1.86 2.01 3.38 1.69 1.61 1.54 1.49 1.37
157 257 0.11 3.58 3.42 3.24 3.50 5.89 2.95 2.81 2.69 2.60 2.38
158 258 0.04 3.36 3.24 3.04 3.91 6.93 3.40 3.27 3.11 3.00 2.68
159 259 0.00 5.86 5.65 5.29 6.82 12.07 5.92 5.70 5.41 5.23 4.67
160 260 27.08 0.05 0.10 0.08 0.11 0.19 0.02 0.04 0.04 0.05 0.09
161 261 6.72 0.08 0.17 0.15 0.19 0.32 0.04 0.07 0.07 0.09 0.16
162 262 0.40 0.12 0.24 0.20 0.27 0.45 0.05 0.10 0.10 0.12 0.22
163 263 0.00 0.15 0.31 0.26 0.35 0.58 0.07 0.12 0.13 0.16 0.29
164 264 4.60 0.17 0.27 0.27 0.27 0.49 0.10 0.13 0.14 0.15 0.24
165 265 0.91 0.30 0.46 0.47 0.46 0.85 0.16 0.22 0.25 0.25 0.42
166 266 1.24 0.42 0.65 0.65 0.64 1.18 0.23 0.31 0.34 0.35 0.58
167 267 0.11 0.54 0.84 0.84 0.84 1.54 0.30 0.41 0.44 0.45 0.75
168 268 1.46 0.34 0.41 0.41 0.38 0.55 0.23 0.26 0.27 0.26 0.29
169 269 0.33 0.58 0.70 0.70 0.64 0.94 0.40 0.44 0.46 0.45 0.50
170 270 0.22 0.80 0.98 0.98 0.90 1.32 0.56 0.62 0.65 0.63 0.70
171 271 0.40 1.04 1.27 1.27 1.17 1.71 0.73 0.80 0.84 0.82 0.92
172 272 0.07 1.28 1.57 1.57 1.44 2.10 0.89 0.98 1.03 1.01 1.13
173 273 0.00 1.54 1.88 1.87 1.72 2.52 1.07 1.18 1.23 1.21 1.35
174 274 0.69 0.72 0.73 0.72 0.68 0.79 0.58 0.57 0.58 0.57 0.58
175 275 0.33 1.24 1.26 1.23 1.17 1.36 0.99 0.99 1.00 0.98 0.99
176 276 0.07 1.73 1.76 1.72 1.64 1.90 1.39 1.38 1.40 1.38 1.39
177 277 0.04 2.25 2.28 2.24 2.13 2.46 1.80 1.79 1.82 1.79 1.80
178 278 0.04 2.76 2.81 2.75 2.61 3.03 2.22 2.20 2.23 2.20 2.21
179 279 0.04 3.30 3.36 3.29 3.13 3.63 2.65 2.63 2.67 2.63 2.65
180 280 0.22 1.53 1.46 1.44 1.35 1.43 1.20 1.13 1.12 1.07 1.04
181 281 0.18 2.62 2.50 2.46 2.32 2.45 2.07 1.93 1.92 1.84 1.78
182 282 0.04 3.65 3.49 3.44 3.24 3.42 2.88 2.70 2.68 2.57 2.48
183 283 0.00 4.74 4.54 4.47 4.21 4.45 3.75 3.50 3.48 3.33 3.23
184 284 0.00 5.84 5.58 5.49 5.18 5.47 4.61 4.31 4.28 4.10 3.97
185 285 0.00 6.98 6.67 6.57 6.20 6.55 5.51 5.15 5.12 4.91 4.75
186 286 0.00 8.13 7.77 7.65 7.21 7.62 6.42 6.00 5.95 5.71 5.53
187 287 10.22 0.02 0.03 0.03 0.04 0.07 0.01 0.03 0.02 0.03 0.06
188 288 2.81 0.03 0.06 0.05 0.07 0.11 0.02 0.04 0.04 0.06 0.09
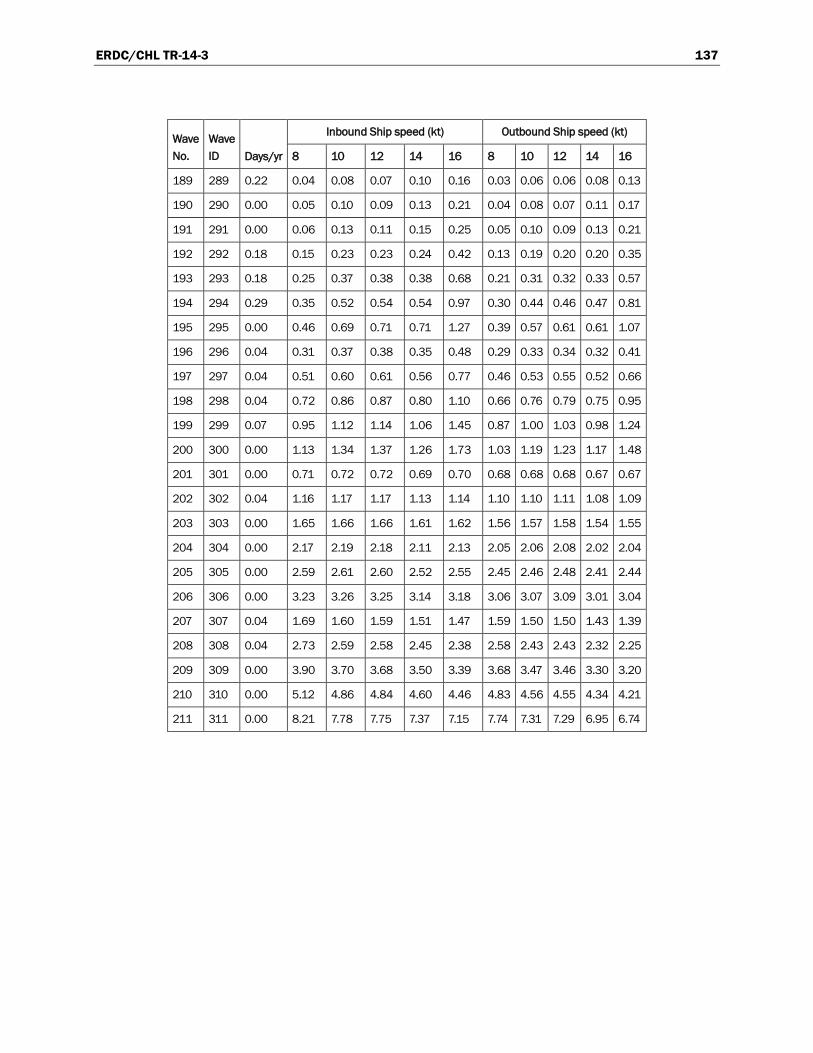
ERDC/CHL TR-14-3 137
Wave No.
Wave ID Days/yr
Inbound Ship speed (kt) Outbound Ship speed (kt)
8 10 12 14 16 8 10 12 14 16
189 289 0.22 0.04 0.08 0.07 0.10 0.16 0.03 0.06 0.06 0.08 0.13
190 290 0.00 0.05 0.10 0.09 0.13 0.21 0.04 0.08 0.07 0.11 0.17
191 291 0.00 0.06 0.13 0.11 0.15 0.25 0.05 0.10 0.09 0.13 0.21
192 292 0.18 0.15 0.23 0.23 0.24 0.42 0.13 0.19 0.20 0.20 0.35
193 293 0.18 0.25 0.37 0.38 0.38 0.68 0.21 0.31 0.32 0.33 0.57
194 294 0.29 0.35 0.52 0.54 0.54 0.97 0.30 0.44 0.46 0.47 0.81
195 295 0.00 0.46 0.69 0.71 0.71 1.27 0.39 0.57 0.61 0.61 1.07
196 296 0.04 0.31 0.37 0.38 0.35 0.48 0.29 0.33 0.34 0.32 0.41
197 297 0.04 0.51 0.60 0.61 0.56 0.77 0.46 0.53 0.55 0.52 0.66
198 298 0.04 0.72 0.86 0.87 0.80 1.10 0.66 0.76 0.79 0.75 0.95
199 299 0.07 0.95 1.12 1.14 1.06 1.45 0.87 1.00 1.03 0.98 1.24
200 300 0.00 1.13 1.34 1.37 1.26 1.73 1.03 1.19 1.23 1.17 1.48
201 301 0.00 0.71 0.72 0.72 0.69 0.70 0.68 0.68 0.68 0.67 0.67
202 302 0.04 1.16 1.17 1.17 1.13 1.14 1.10 1.10 1.11 1.08 1.09
203 303 0.00 1.65 1.66 1.66 1.61 1.62 1.56 1.57 1.58 1.54 1.55
204 304 0.00 2.17 2.19 2.18 2.11 2.13 2.05 2.06 2.08 2.02 2.04
205 305 0.00 2.59 2.61 2.60 2.52 2.55 2.45 2.46 2.48 2.41 2.44
206 306 0.00 3.23 3.26 3.25 3.14 3.18 3.06 3.07 3.09 3.01 3.04
207 307 0.04 1.69 1.60 1.59 1.51 1.47 1.59 1.50 1.50 1.43 1.39
208 308 0.04 2.73 2.59 2.58 2.45 2.38 2.58 2.43 2.43 2.32 2.25
209 309 0.00 3.90 3.70 3.68 3.50 3.39 3.68 3.47 3.46 3.30 3.20
210 310 0.00 5.12 4.86 4.84 4.60 4.46 4.83 4.56 4.55 4.34 4.21
211 311 0.00 8.21 7.78 7.75 7.37 7.15 7.74 7.31 7.29 6.95 6.74

ERDC/CHL TR-14-3 138
Table D2. Wave-induced vertical motion allowances (ft), Phase 1, Mound Reach 2, h = 55 ft, fully loaded Susan Maersk, inbound and outbound transits.
Wave No.
Wave ID Days/yr
Inbound Ship speed (kt) Outbound Ship speed (kt)
8 10 12 14 16 8 10 12 14 16
1 401 6.10 0.03 0.05 0.04 0.06 0.09 0.01 0.01 0.01 0.01 0.02
2 402 2.74 0.04 0.08 0.06 0.10 0.15 0.01 0.02 0.02 0.02 0.04
3 403 0.26 0.06 0.12 0.09 0.14 0.21 0.01 0.02 0.02 0.03 0.06
4 404 0.04 0.08 0.15 0.11 0.18 0.27 0.02 0.03 0.03 0.04 0.07
5 405 0.00 0.10 0.19 0.14 0.22 0.34 0.02 0.04 0.04 0.05 0.09
6 406 0.00 0.23 0.32 0.30 0.29 0.60 0.08 0.10 0.11 0.10 0.15
7 407 0.07 0.37 0.54 0.49 0.48 0.99 0.14 0.16 0.17 0.17 0.26
8 408 0.07 0.53 0.76 0.69 0.68 1.40 0.20 0.23 0.25 0.24 0.36
9 409 0.00 0.67 0.96 0.88 0.86 1.77 0.25 0.29 0.31 0.31 0.46
10 410 0.00 0.84 1.20 1.10 1.08 2.23 0.31 0.37 0.39 0.39 0.57
11 411 0.04 0.38 0.46 0.43 0.40 0.61 0.21 0.22 0.23 0.23 0.23
12 412 0.00 0.63 0.76 0.72 0.66 1.01 0.35 0.36 0.37 0.38 0.37
13 413 0.04 0.90 1.08 1.02 0.93 1.43 0.50 0.51 0.53 0.53 0.53
14 414 0.04 1.14 1.37 1.29 1.18 1.81 0.63 0.65 0.67 0.67 0.67
15 415 0.00 0.76 0.77 0.75 0.71 0.81 0.54 0.53 0.54 0.53 0.52
16 416 0.00 1.26 1.28 1.24 1.18 1.35 0.90 0.87 0.89 0.88 0.87
17 417 0.00 1.79 1.81 1.75 1.68 1.91 1.27 1.24 1.26 1.24 1.23
18 418 0.00 2.26 2.29 2.22 2.12 2.42 1.61 1.56 1.59 1.57 1.55
19 419 0.00 2.84 2.87 2.78 2.66 3.04 2.02 1.96 2.00 1.97 1.95
20 420 0.00 3.18 3.22 3.12 2.99 3.40 2.27 2.20 2.24 2.21 2.19
21 421 0.04 1.68 1.58 1.55 1.47 1.85 1.23 1.12 1.08 1.04 0.99
22 422 0.00 2.79 2.61 2.57 2.43 3.06 2.03 1.85 1.79 1.72 1.64
23 423 0.00 3.95 3.70 3.64 3.44 4.34 2.88 2.62 2.54 2.44 2.33
24 424 0.00 5.00 4.68 4.60 4.35 5.49 3.64 3.31 3.22 3.08 2.94
25 425 0.00 7.03 6.59 6.48 6.12 7.72 5.12 4.66 4.52 4.33 4.14
26 426 0.00 8.95 8.39 8.24 7.79 9.82 6.52 5.93 5.76 5.52 5.27
27 427 0.00 9.42 8.82 8.67 8.20 10.34 6.86 6.24 6.06 5.80 5.54
28 428 11.24 0.05 0.10 0.08 0.11 0.18 0.01 0.01 0.01 0.01 0.02
29 429 3.80 0.09 0.16 0.13 0.19 0.30 0.01 0.02 0.02 0.02 0.04
30 430 0.66 0.13 0.23 0.18 0.26 0.42 0.02 0.02 0.03 0.03 0.06
31 431 0.04 0.16 0.30 0.23 0.34 0.54 0.02 0.03 0.03 0.04 0.07

ERDC/CHL TR-14-3 139
Wave No.
Wave ID Days/yr
Inbound Ship speed (kt) Outbound Ship speed (kt)
8 10 12 14 16 8 10 12 14 16
32 432 1.13 0.25 0.36 0.32 0.31 0.66 0.07 0.08 0.08 0.08 0.09
33 433 0.18 0.41 0.59 0.54 0.52 1.09 0.12 0.13 0.13 0.14 0.14
34 434 0.66 0.59 0.83 0.76 0.73 1.54 0.17 0.18 0.19 0.19 0.20
35 435 0.15 0.76 1.08 0.98 0.95 1.99 0.22 0.23 0.25 0.25 0.26
36 436 0.00 0.93 1.32 1.21 1.16 2.45 0.27 0.28 0.30 0.31 0.33
37 437 1.20 0.43 0.51 0.47 0.43 0.66 0.21 0.20 0.21 0.21 0.21
38 438 0.22 0.71 0.84 0.78 0.71 1.09 0.34 0.34 0.34 0.35 0.35
39 439 0.07 1.01 1.19 1.10 1.01 1.55 0.48 0.48 0.49 0.49 0.49
40 440 0.22 1.30 1.54 1.43 1.31 2.01 0.62 0.62 0.63 0.63 0.64
41 441 0.15 1.60 1.88 1.75 1.60 2.46 0.77 0.76 0.77 0.78 0.78
42 442 0.04 1.91 2.25 2.09 1.91 2.94 0.92 0.91 0.92 0.93 0.94
43 443 0.88 0.79 0.80 0.76 0.72 0.87 0.50 0.48 0.48 0.47 0.47
44 444 0.11 1.31 1.32 1.26 1.20 1.44 0.83 0.79 0.80 0.78 0.77
45 445 0.04 1.85 1.87 1.79 1.70 2.03 1.17 1.12 1.13 1.11 1.09
46 446 0.07 2.40 2.42 2.31 2.20 2.63 1.52 1.45 1.46 1.44 1.41
47 447 0.04 2.94 2.96 2.84 2.70 3.23 1.87 1.78 1.79 1.76 1.73
48 448 0.04 3.52 3.54 3.39 3.22 3.86 2.23 2.12 2.14 2.11 2.07
49 449 0.04 4.06 4.09 3.91 3.72 4.46 2.58 2.45 2.47 2.43 2.39
50 450 0.00 4.83 4.86 4.65 4.42 5.30 3.06 2.92 2.94 2.89 2.84
51 451 0.18 1.30 1.21 1.15 1.07 1.79 0.82 0.73 0.69 0.65 0.61
52 452 0.15 2.16 2.01 1.91 1.77 2.96 1.36 1.21 1.14 1.07 1.01
53 453 0.11 3.06 2.85 2.70 2.50 4.19 1.93 1.72 1.61 1.52 1.43
54 454 0.07 3.96 3.69 3.49 3.24 5.43 2.50 2.23 2.09 1.97 1.85
55 455 0.04 4.86 4.52 4.29 3.98 6.66 3.07 2.73 2.56 2.42 2.27
56 456 0.04 5.81 5.40 5.12 4.75 7.96 3.67 3.26 3.06 2.89 2.71
57 457 0.00 6.71 6.24 5.92 5.49 9.19 4.23 3.77 3.53 3.34 3.13
58 458 0.00 7.97 7.41 7.03 6.52 10.92 5.03 4.48 4.20 3.96 3.72
59 459 0.00 9.37 8.71 8.26 7.66 12.83 5.91 5.26 4.93 4.66 4.37
60 460 0.00 1.51 1.40 1.31 1.92 3.22 1.25 1.16 1.06 1.01 0.91
61 461 0.00 2.51 2.33 2.16 3.18 5.34 2.06 1.92 1.76 1.67 1.51
62 462 0.00 7.79 7.22 6.71 9.89 16.58 6.41 5.95 5.48 5.19 4.69
63 463 0.00 9.25 8.58 7.97 11.75 19.70 7.62 7.07 6.51 6.17 5.57
64 464 0.00 1.91 1.82 1.89 3.90 6.28 2.17 2.05 1.87 1.77 1.58
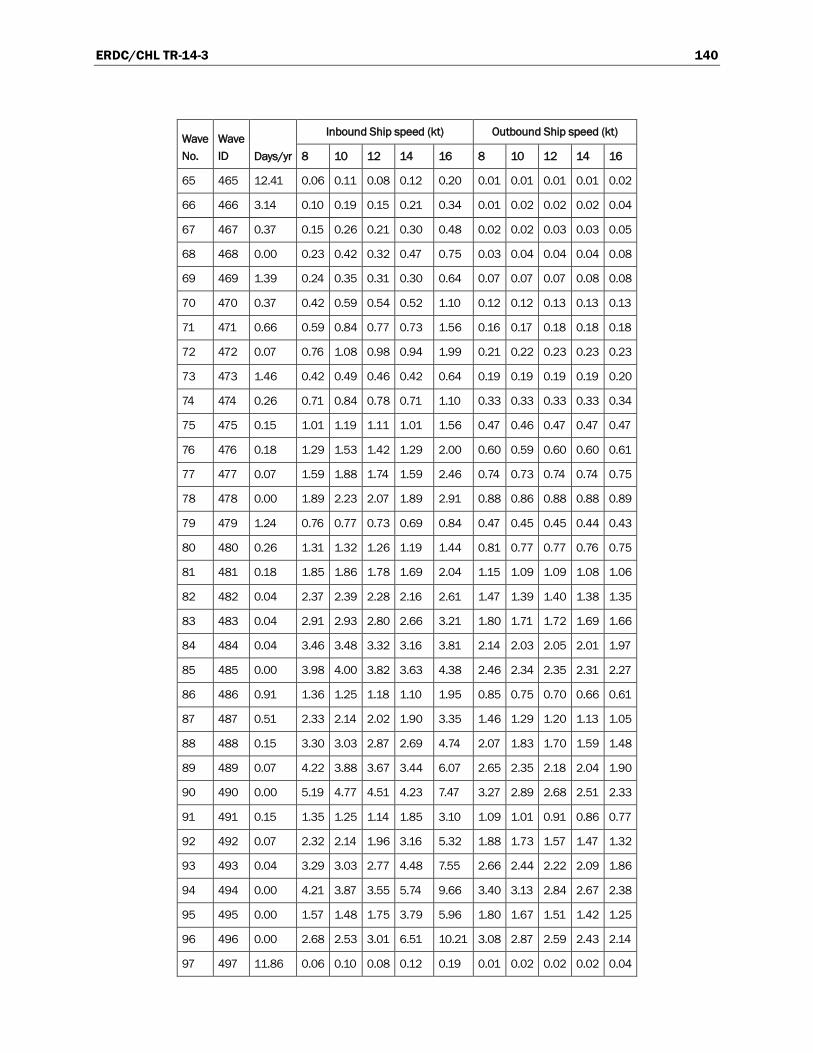
ERDC/CHL TR-14-3 140
Wave No.
Wave ID Days/yr
Inbound Ship speed (kt) Outbound Ship speed (kt)
8 10 12 14 16 8 10 12 14 16
65 465 12.41 0.06 0.11 0.08 0.12 0.20 0.01 0.01 0.01 0.01 0.02
66 466 3.14 0.10 0.19 0.15 0.21 0.34 0.01 0.02 0.02 0.02 0.04
67 467 0.37 0.15 0.26 0.21 0.30 0.48 0.02 0.02 0.03 0.03 0.05
68 468 0.00 0.23 0.42 0.32 0.47 0.75 0.03 0.04 0.04 0.04 0.08
69 469 1.39 0.24 0.35 0.31 0.30 0.64 0.07 0.07 0.07 0.08 0.08
70 470 0.37 0.42 0.59 0.54 0.52 1.10 0.12 0.12 0.13 0.13 0.13
71 471 0.66 0.59 0.84 0.77 0.73 1.56 0.16 0.17 0.18 0.18 0.18
72 472 0.07 0.76 1.08 0.98 0.94 1.99 0.21 0.22 0.23 0.23 0.23
73 473 1.46 0.42 0.49 0.46 0.42 0.64 0.19 0.19 0.19 0.19 0.20
74 474 0.26 0.71 0.84 0.78 0.71 1.10 0.33 0.33 0.33 0.33 0.34
75 475 0.15 1.01 1.19 1.11 1.01 1.56 0.47 0.46 0.47 0.47 0.47
76 476 0.18 1.29 1.53 1.42 1.29 2.00 0.60 0.59 0.60 0.60 0.61
77 477 0.07 1.59 1.88 1.74 1.59 2.46 0.74 0.73 0.74 0.74 0.75
78 478 0.00 1.89 2.23 2.07 1.89 2.91 0.88 0.86 0.88 0.88 0.89
79 479 1.24 0.76 0.77 0.73 0.69 0.84 0.47 0.45 0.45 0.44 0.43
80 480 0.26 1.31 1.32 1.26 1.19 1.44 0.81 0.77 0.77 0.76 0.75
81 481 0.18 1.85 1.86 1.78 1.69 2.04 1.15 1.09 1.09 1.08 1.06
82 482 0.04 2.37 2.39 2.28 2.16 2.61 1.47 1.39 1.40 1.38 1.35
83 483 0.04 2.91 2.93 2.80 2.66 3.21 1.80 1.71 1.72 1.69 1.66
84 484 0.04 3.46 3.48 3.32 3.16 3.81 2.14 2.03 2.05 2.01 1.97
85 485 0.00 3.98 4.00 3.82 3.63 4.38 2.46 2.34 2.35 2.31 2.27
86 486 0.91 1.36 1.25 1.18 1.10 1.95 0.85 0.75 0.70 0.66 0.61
87 487 0.51 2.33 2.14 2.02 1.90 3.35 1.46 1.29 1.20 1.13 1.05
88 488 0.15 3.30 3.03 2.87 2.69 4.74 2.07 1.83 1.70 1.59 1.48
89 489 0.07 4.22 3.88 3.67 3.44 6.07 2.65 2.35 2.18 2.04 1.90
90 490 0.00 5.19 4.77 4.51 4.23 7.47 3.27 2.89 2.68 2.51 2.33
91 491 0.15 1.35 1.25 1.14 1.85 3.10 1.09 1.01 0.91 0.86 0.77
92 492 0.07 2.32 2.14 1.96 3.16 5.32 1.88 1.73 1.57 1.47 1.32
93 493 0.04 3.29 3.03 2.77 4.48 7.55 2.66 2.44 2.22 2.09 1.86
94 494 0.00 4.21 3.87 3.55 5.74 9.66 3.40 3.13 2.84 2.67 2.38
95 495 0.00 1.57 1.48 1.75 3.79 5.96 1.80 1.67 1.51 1.42 1.25
96 496 0.00 2.68 2.53 3.01 6.51 10.21 3.08 2.87 2.59 2.43 2.14
97 497 11.86 0.06 0.10 0.08 0.12 0.19 0.01 0.02 0.02 0.02 0.04
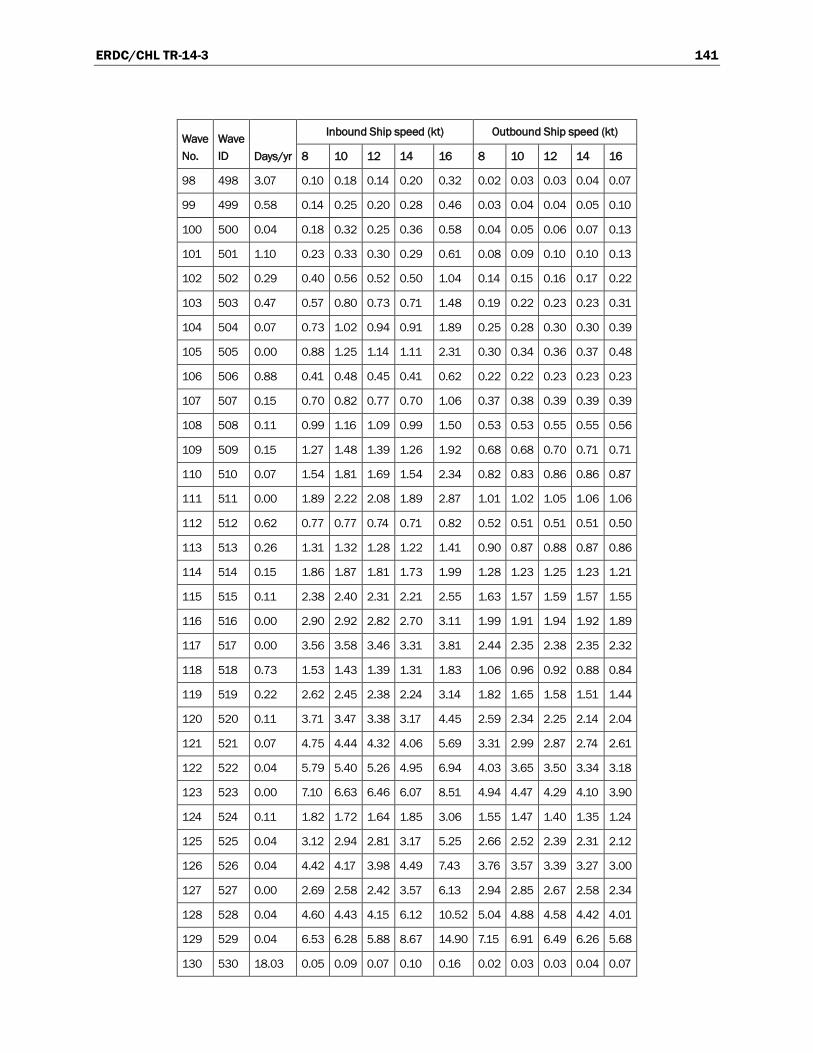
ERDC/CHL TR-14-3 141
Wave No.
Wave ID Days/yr
Inbound Ship speed (kt) Outbound Ship speed (kt)
8 10 12 14 16 8 10 12 14 16
98 498 3.07 0.10 0.18 0.14 0.20 0.32 0.02 0.03 0.03 0.04 0.07
99 499 0.58 0.14 0.25 0.20 0.28 0.46 0.03 0.04 0.04 0.05 0.10
100 500 0.04 0.18 0.32 0.25 0.36 0.58 0.04 0.05 0.06 0.07 0.13
101 501 1.10 0.23 0.33 0.30 0.29 0.61 0.08 0.09 0.10 0.10 0.13
102 502 0.29 0.40 0.56 0.52 0.50 1.04 0.14 0.15 0.16 0.17 0.22
103 503 0.47 0.57 0.80 0.73 0.71 1.48 0.19 0.22 0.23 0.23 0.31
104 504 0.07 0.73 1.02 0.94 0.91 1.89 0.25 0.28 0.30 0.30 0.39
105 505 0.00 0.88 1.25 1.14 1.11 2.31 0.30 0.34 0.36 0.37 0.48
106 506 0.88 0.41 0.48 0.45 0.41 0.62 0.22 0.22 0.23 0.23 0.23
107 507 0.15 0.70 0.82 0.77 0.70 1.06 0.37 0.38 0.39 0.39 0.39
108 508 0.11 0.99 1.16 1.09 0.99 1.50 0.53 0.53 0.55 0.55 0.56
109 509 0.15 1.27 1.48 1.39 1.26 1.92 0.68 0.68 0.70 0.71 0.71
110 510 0.07 1.54 1.81 1.69 1.54 2.34 0.82 0.83 0.86 0.86 0.87
111 511 0.00 1.89 2.22 2.08 1.89 2.87 1.01 1.02 1.05 1.06 1.06
112 512 0.62 0.77 0.77 0.74 0.71 0.82 0.52 0.51 0.51 0.51 0.50
113 513 0.26 1.31 1.32 1.28 1.22 1.41 0.90 0.87 0.88 0.87 0.86
114 514 0.15 1.86 1.87 1.81 1.73 1.99 1.28 1.23 1.25 1.23 1.21
115 515 0.11 2.38 2.40 2.31 2.21 2.55 1.63 1.57 1.59 1.57 1.55
116 516 0.00 2.90 2.92 2.82 2.70 3.11 1.99 1.91 1.94 1.92 1.89
117 517 0.00 3.56 3.58 3.46 3.31 3.81 2.44 2.35 2.38 2.35 2.32
118 518 0.73 1.53 1.43 1.39 1.31 1.83 1.06 0.96 0.92 0.88 0.84
119 519 0.22 2.62 2.45 2.38 2.24 3.14 1.82 1.65 1.58 1.51 1.44
120 520 0.11 3.71 3.47 3.38 3.17 4.45 2.59 2.34 2.25 2.14 2.04
121 521 0.07 4.75 4.44 4.32 4.06 5.69 3.31 2.99 2.87 2.74 2.61
122 522 0.04 5.79 5.40 5.26 4.95 6.94 4.03 3.65 3.50 3.34 3.18
123 523 0.00 7.10 6.63 6.46 6.07 8.51 4.94 4.47 4.29 4.10 3.90
124 524 0.11 1.82 1.72 1.64 1.85 3.06 1.55 1.47 1.40 1.35 1.24
125 525 0.04 3.12 2.94 2.81 3.17 5.25 2.66 2.52 2.39 2.31 2.12
126 526 0.04 4.42 4.17 3.98 4.49 7.43 3.76 3.57 3.39 3.27 3.00
127 527 0.00 2.69 2.58 2.42 3.57 6.13 2.94 2.85 2.67 2.58 2.34
128 528 0.04 4.60 4.43 4.15 6.12 10.52 5.04 4.88 4.58 4.42 4.01
129 529 0.04 6.53 6.28 5.88 8.67 14.90 7.15 6.91 6.49 6.26 5.68
130 530 18.03 0.05 0.09 0.07 0.10 0.16 0.02 0.03 0.03 0.04 0.07
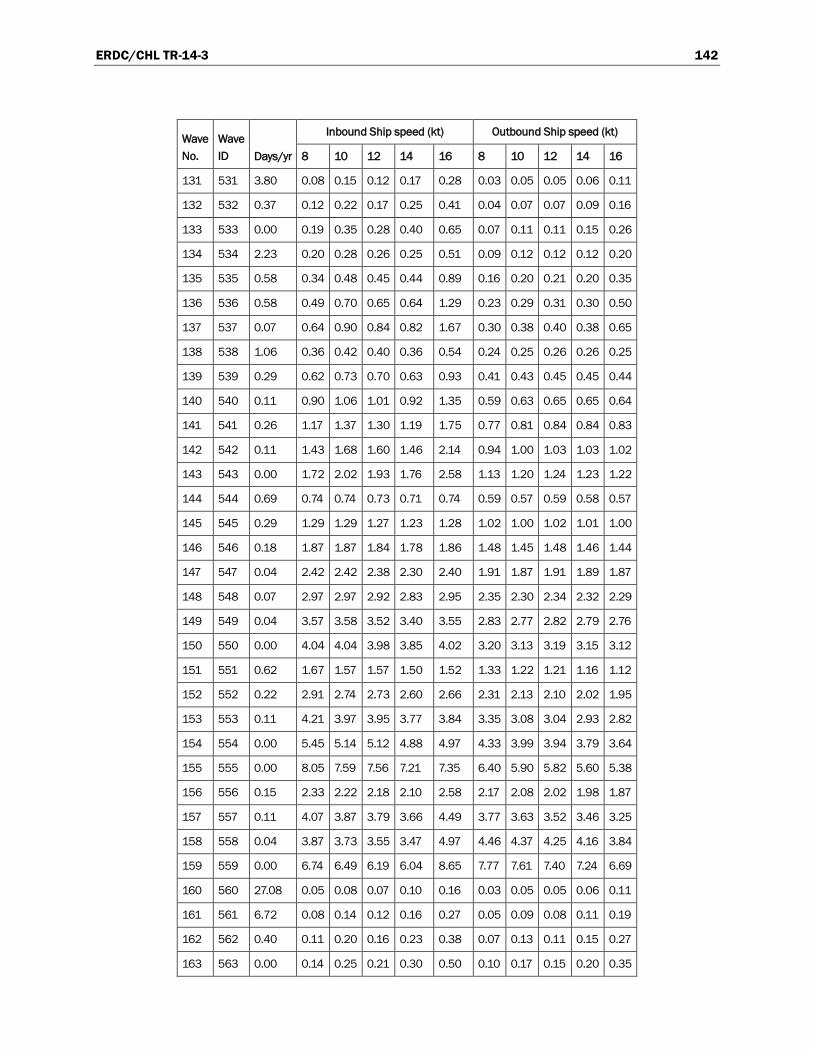
ERDC/CHL TR-14-3 142
Wave No.
Wave ID Days/yr
Inbound Ship speed (kt) Outbound Ship speed (kt)
8 10 12 14 16 8 10 12 14 16
131 531 3.80 0.08 0.15 0.12 0.17 0.28 0.03 0.05 0.05 0.06 0.11
132 532 0.37 0.12 0.22 0.17 0.25 0.41 0.04 0.07 0.07 0.09 0.16
133 533 0.00 0.19 0.35 0.28 0.40 0.65 0.07 0.11 0.11 0.15 0.26
134 534 2.23 0.20 0.28 0.26 0.25 0.51 0.09 0.12 0.12 0.12 0.20
135 535 0.58 0.34 0.48 0.45 0.44 0.89 0.16 0.20 0.21 0.20 0.35
136 536 0.58 0.49 0.70 0.65 0.64 1.29 0.23 0.29 0.31 0.30 0.50
137 537 0.07 0.64 0.90 0.84 0.82 1.67 0.30 0.38 0.40 0.38 0.65
138 538 1.06 0.36 0.42 0.40 0.36 0.54 0.24 0.25 0.26 0.26 0.25
139 539 0.29 0.62 0.73 0.70 0.63 0.93 0.41 0.43 0.45 0.45 0.44
140 540 0.11 0.90 1.06 1.01 0.92 1.35 0.59 0.63 0.65 0.65 0.64
141 541 0.26 1.17 1.37 1.30 1.19 1.75 0.77 0.81 0.84 0.84 0.83
142 542 0.11 1.43 1.68 1.60 1.46 2.14 0.94 1.00 1.03 1.03 1.02
143 543 0.00 1.72 2.02 1.93 1.76 2.58 1.13 1.20 1.24 1.23 1.22
144 544 0.69 0.74 0.74 0.73 0.71 0.74 0.59 0.57 0.59 0.58 0.57
145 545 0.29 1.29 1.29 1.27 1.23 1.28 1.02 1.00 1.02 1.01 1.00
146 546 0.18 1.87 1.87 1.84 1.78 1.86 1.48 1.45 1.48 1.46 1.44
147 547 0.04 2.42 2.42 2.38 2.30 2.40 1.91 1.87 1.91 1.89 1.87
148 548 0.07 2.97 2.97 2.92 2.83 2.95 2.35 2.30 2.34 2.32 2.29
149 549 0.04 3.57 3.58 3.52 3.40 3.55 2.83 2.77 2.82 2.79 2.76
150 550 0.00 4.04 4.04 3.98 3.85 4.02 3.20 3.13 3.19 3.15 3.12
151 551 0.62 1.67 1.57 1.57 1.50 1.52 1.33 1.22 1.21 1.16 1.12
152 552 0.22 2.91 2.74 2.73 2.60 2.66 2.31 2.13 2.10 2.02 1.95
153 553 0.11 4.21 3.97 3.95 3.77 3.84 3.35 3.08 3.04 2.93 2.82
154 554 0.00 5.45 5.14 5.12 4.88 4.97 4.33 3.99 3.94 3.79 3.64
155 555 0.00 8.05 7.59 7.56 7.21 7.35 6.40 5.90 5.82 5.60 5.38
156 556 0.15 2.33 2.22 2.18 2.10 2.58 2.17 2.08 2.02 1.98 1.87
157 557 0.11 4.07 3.87 3.79 3.66 4.49 3.77 3.63 3.52 3.46 3.25
158 558 0.04 3.87 3.73 3.55 3.47 4.97 4.46 4.37 4.25 4.16 3.84
159 559 0.00 6.74 6.49 6.19 6.04 8.65 7.77 7.61 7.40 7.24 6.69
160 560 27.08 0.05 0.08 0.07 0.10 0.16 0.03 0.05 0.05 0.06 0.11
161 561 6.72 0.08 0.14 0.12 0.16 0.27 0.05 0.09 0.08 0.11 0.19
162 562 0.40 0.11 0.20 0.16 0.23 0.38 0.07 0.13 0.11 0.15 0.27
163 563 0.00 0.14 0.25 0.21 0.30 0.50 0.10 0.17 0.15 0.20 0.35
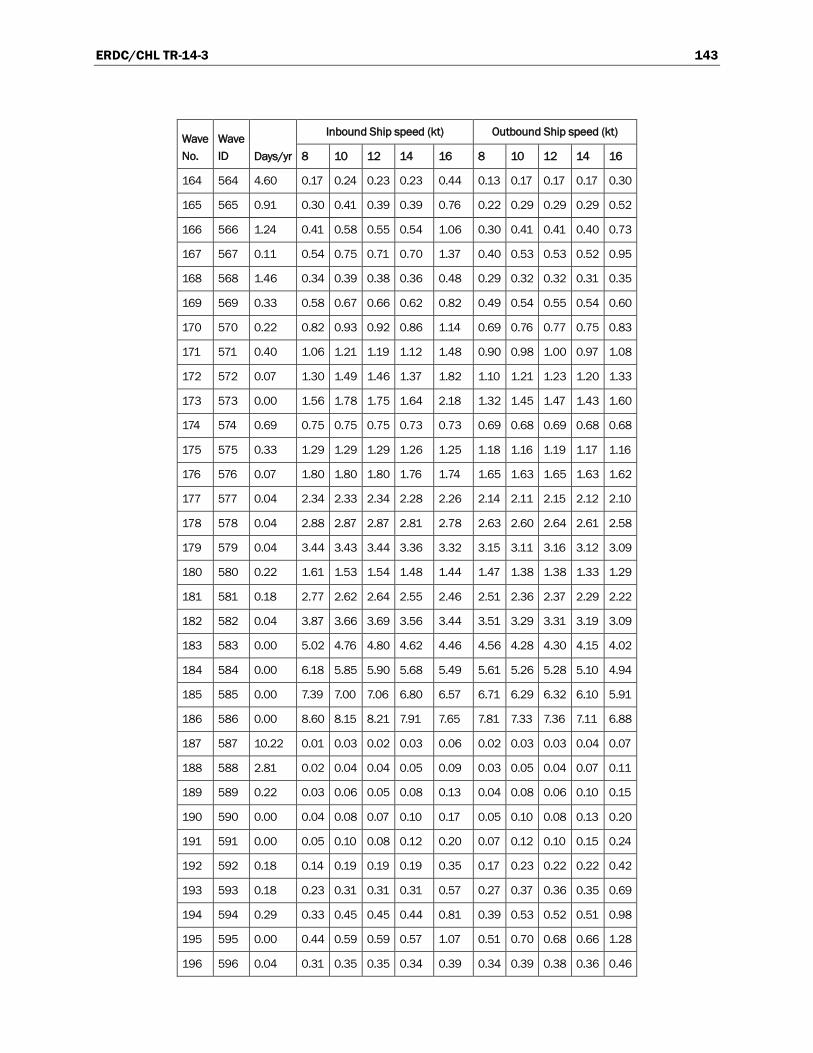
ERDC/CHL TR-14-3 143
Wave No.
Wave ID Days/yr
Inbound Ship speed (kt) Outbound Ship speed (kt)
8 10 12 14 16 8 10 12 14 16
164 564 4.60 0.17 0.24 0.23 0.23 0.44 0.13 0.17 0.17 0.17 0.30
165 565 0.91 0.30 0.41 0.39 0.39 0.76 0.22 0.29 0.29 0.29 0.52
166 566 1.24 0.41 0.58 0.55 0.54 1.06 0.30 0.41 0.41 0.40 0.73
167 567 0.11 0.54 0.75 0.71 0.70 1.37 0.40 0.53 0.53 0.52 0.95
168 568 1.46 0.34 0.39 0.38 0.36 0.48 0.29 0.32 0.32 0.31 0.35
169 569 0.33 0.58 0.67 0.66 0.62 0.82 0.49 0.54 0.55 0.54 0.60
170 570 0.22 0.82 0.93 0.92 0.86 1.14 0.69 0.76 0.77 0.75 0.83
171 571 0.40 1.06 1.21 1.19 1.12 1.48 0.90 0.98 1.00 0.97 1.08
172 572 0.07 1.30 1.49 1.46 1.37 1.82 1.10 1.21 1.23 1.20 1.33
173 573 0.00 1.56 1.78 1.75 1.64 2.18 1.32 1.45 1.47 1.43 1.60
174 574 0.69 0.75 0.75 0.75 0.73 0.73 0.69 0.68 0.69 0.68 0.68
175 575 0.33 1.29 1.29 1.29 1.26 1.25 1.18 1.16 1.19 1.17 1.16
176 576 0.07 1.80 1.80 1.80 1.76 1.74 1.65 1.63 1.65 1.63 1.62
177 577 0.04 2.34 2.33 2.34 2.28 2.26 2.14 2.11 2.15 2.12 2.10
178 578 0.04 2.88 2.87 2.87 2.81 2.78 2.63 2.60 2.64 2.61 2.58
179 579 0.04 3.44 3.43 3.44 3.36 3.32 3.15 3.11 3.16 3.12 3.09
180 580 0.22 1.61 1.53 1.54 1.48 1.44 1.47 1.38 1.38 1.33 1.29
181 581 0.18 2.77 2.62 2.64 2.55 2.46 2.51 2.36 2.37 2.29 2.22
182 582 0.04 3.87 3.66 3.69 3.56 3.44 3.51 3.29 3.31 3.19 3.09
183 583 0.00 5.02 4.76 4.80 4.62 4.46 4.56 4.28 4.30 4.15 4.02
184 584 0.00 6.18 5.85 5.90 5.68 5.49 5.61 5.26 5.28 5.10 4.94
185 585 0.00 7.39 7.00 7.06 6.80 6.57 6.71 6.29 6.32 6.10 5.91
186 586 0.00 8.60 8.15 8.21 7.91 7.65 7.81 7.33 7.36 7.11 6.88
187 587 10.22 0.01 0.03 0.02 0.03 0.06 0.02 0.03 0.03 0.04 0.07
188 588 2.81 0.02 0.04 0.04 0.05 0.09 0.03 0.05 0.04 0.07 0.11
189 589 0.22 0.03 0.06 0.05 0.08 0.13 0.04 0.08 0.06 0.10 0.15
190 590 0.00 0.04 0.08 0.07 0.10 0.17 0.05 0.10 0.08 0.13 0.20
191 591 0.00 0.05 0.10 0.08 0.12 0.20 0.07 0.12 0.10 0.15 0.24
192 592 0.18 0.14 0.19 0.19 0.19 0.35 0.17 0.23 0.22 0.22 0.42
193 593 0.18 0.23 0.31 0.31 0.31 0.57 0.27 0.37 0.36 0.35 0.69
194 594 0.29 0.33 0.45 0.45 0.44 0.81 0.39 0.53 0.52 0.51 0.98
195 595 0.00 0.44 0.59 0.59 0.57 1.07 0.51 0.70 0.68 0.66 1.28
196 596 0.04 0.31 0.35 0.35 0.34 0.39 0.34 0.39 0.38 0.36 0.46

ERDC/CHL TR-14-3 144
Wave No.
Wave ID Days/yr
Inbound Ship speed (kt) Outbound Ship speed (kt)
8 10 12 14 16 8 10 12 14 16
197 597 0.04 0.51 0.56 0.57 0.55 0.64 0.55 0.63 0.62 0.59 0.75
198 598 0.04 0.72 0.80 0.81 0.78 0.91 0.79 0.89 0.88 0.84 1.07
199 599 0.07 0.95 1.06 1.06 1.03 1.20 1.03 1.17 1.16 1.10 1.40
200 600 0.00 1.13 1.26 1.27 1.23 1.43 1.23 1.40 1.38 1.31 1.67
201 601 0.00 0.73 0.73 0.74 0.73 0.72 0.77 0.76 0.77 0.75 0.75
202 602 0.04 1.19 1.18 1.20 1.18 1.17 1.24 1.24 1.25 1.22 1.21
203 603 0.00 1.70 1.68 1.71 1.68 1.66 1.77 1.77 1.78 1.74 1.72
204 604 0.00 2.23 2.21 2.24 2.21 2.19 2.33 2.32 2.34 2.29 2.26
205 605 0.00 2.66 2.63 2.67 2.63 2.61 2.78 2.77 2.79 2.73 2.70
206 606 0.00 3.32 3.29 3.34 3.28 3.25 3.47 3.45 3.48 3.41 3.37
207 607 0.04 1.67 1.57 1.58 1.52 1.47 1.75 1.65 1.66 1.60 1.55
208 608 0.04 2.71 2.54 2.56 2.46 2.38 2.84 2.68 2.70 2.60 2.51
209 609 0.00 3.86 3.63 3.65 3.51 3.40 4.05 3.82 3.85 3.70 3.58
210 610 0.00 5.07 4.76 4.79 4.62 4.46 5.32 5.02 5.06 4.87 4.70
211 611 0.00 8.13 7.64 7.67 7.40 7.16 8.52 8.04 8.10 7.80 7.53

ERDC/CHL TR-14-3 145
Table D3. Wave-induced vertical motion allowances (ft), Phase 1, Channel Reach 1, h = 58 ft, fully loaded Susan Maersk, inbound and outbound transits.
Wave No.
Wave ID Days/yr
Inbound Ship speed (kt) Outbound Ship speed (kt)
8 10 12 14 16 8 10 12 14 16
1 101 6.10 0.03 0.04 0.04 0.06 0.09 0.01 0.02 0.01 0.02 0.03
2 102 2.74 0.05 0.07 0.06 0.09 0.14 0.02 0.02 0.02 0.03 0.06
3 103 0.26 0.07 0.11 0.08 0.13 0.2 0.02 0.04 0.03 0.05 0.08
4 104 0.04 0.08 0.13 0.11 0.17 0.25 0.03 0.04 0.04 0.06 0.1
5 105 0.00 0.11 0.17 0.13 0.21 0.32 0.04 0.06 0.05 0.07 0.13
6 106 0.00 0.24 0.3 0.27 0.26 0.61 0.12 0.14 0.14 0.13 0.22
7 107 0.07 0.4 0.5 0.45 0.42 1.01 0.19 0.23 0.23 0.22 0.37
8 108 0.07 0.56 0.71 0.64 0.6 1.44 0.27 0.32 0.33 0.31 0.52
9 109 0.00 0.71 0.9 0.81 0.76 1.82 0.34 0.4 0.41 0.39 0.66
10 110 0.00 0.9 1.13 1.01 0.96 2.28 0.43 0.51 0.52 0.49 0.82
11 111 0.04 0.41 0.46 0.43 0.4 0.6 0.28 0.29 0.3 0.29 0.29
12 112 0.00 0.68 0.76 0.72 0.66 1 0.47 0.48 0.49 0.49 0.48
13 113 0.04 0.97 1.08 1.02 0.93 1.42 0.66 0.69 0.7 0.69 0.68
14 114 0.04 1.22 1.36 1.29 1.18 1.79 0.83 0.87 0.88 0.87 0.86
15 115 0.00 0.84 0.83 0.82 0.8 0.78 0.69 0.68 0.68 0.67 0.66
16 116 0.00 1.38 1.38 1.36 1.32 1.29 1.15 1.12 1.13 1.12 1.1
17 117 0.00 1.96 1.95 1.92 1.87 1.83 1.63 1.59 1.6 1.58 1.56
18 118 0.00 2.48 2.47 2.43 2.37 2.32 2.06 2.01 2.02 2 1.97
19 119 0.00 3.12 3.1 3.05 2.98 2.91 2.58 2.53 2.54 2.52 2.48
20 120 0.00 3.49 3.48 3.42 3.34 3.26 2.89 2.83 2.84 2.82 2.78
21 121 0.04 1.93 1.83 1.76 1.75 1.68 1.64 1.52 1.45 1.44 1.39
22 122 0.00 3.2 3.03 2.91 2.9 2.78 2.71 2.52 2.41 2.38 2.3
23 123 0.00 4.53 4.29 4.12 4.11 3.94 3.84 3.57 3.41 3.37 3.26
24 124 0.00 5.73 5.43 5.21 5.2 4.98 4.86 4.52 4.31 4.27 4.13
25 125 0.00 8.07 7.64 7.33 7.32 7.01 6.84 6.36 6.07 6 5.81
26 126 0.00 10.27 9.72 9.33 9.32 8.93 8.71 8.1 7.73 7.64 7.4
27 127 0.00 10.8 10.22 9.82 9.81 9.39 9.16 8.52 8.13 8.04 7.78
28 128 11.24 0.06 0.09 0.07 0.11 0.17 0.01 0.02 0.02 0.02 0.04
29 129 3.80 0.1 0.15 0.12 0.18 0.29 0.02 0.03 0.03 0.03 0.06
30 130 0.66 0.14 0.22 0.17 0.26 0.41 0.03 0.04 0.04 0.04 0.08
31 131 0.04 0.18 0.28 0.23 0.33 0.53 0.03 0.05 0.05 0.06 0.11
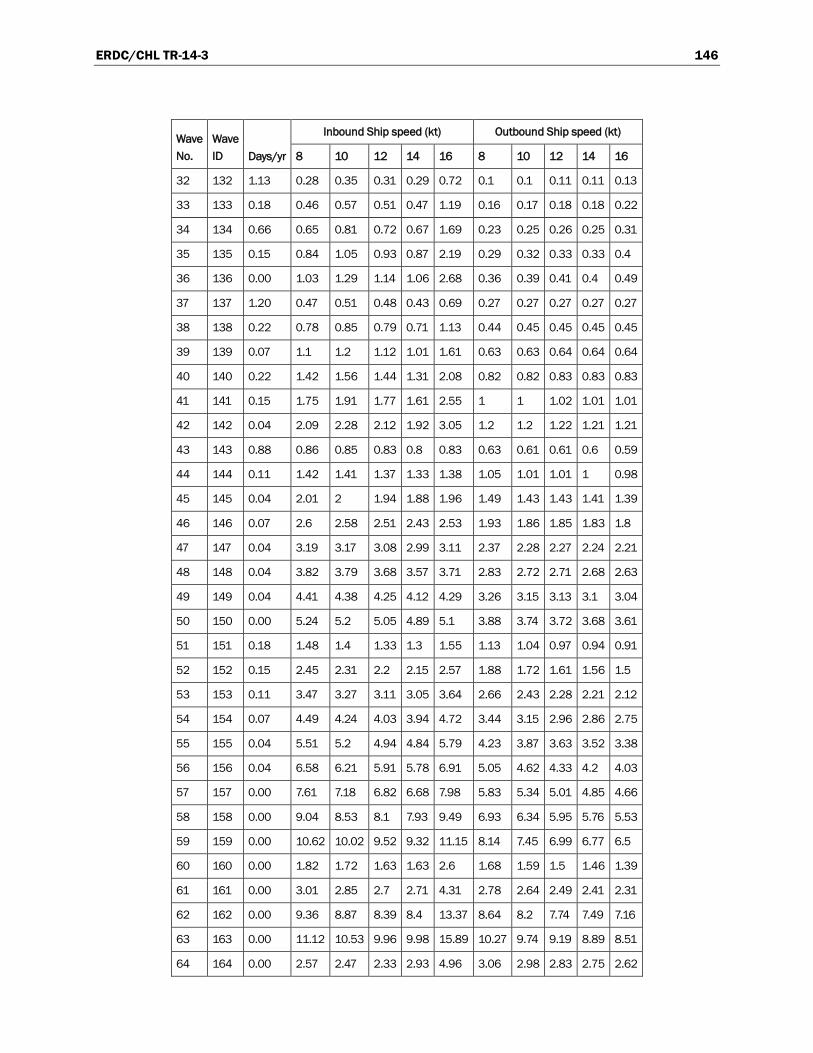
ERDC/CHL TR-14-3 146
Wave No.
Wave ID Days/yr
Inbound Ship speed (kt) Outbound Ship speed (kt)
8 10 12 14 16 8 10 12 14 16
32 132 1.13 0.28 0.35 0.31 0.29 0.72 0.1 0.1 0.11 0.11 0.13
33 133 0.18 0.46 0.57 0.51 0.47 1.19 0.16 0.17 0.18 0.18 0.22
34 134 0.66 0.65 0.81 0.72 0.67 1.69 0.23 0.25 0.26 0.25 0.31
35 135 0.15 0.84 1.05 0.93 0.87 2.19 0.29 0.32 0.33 0.33 0.4
36 136 0.00 1.03 1.29 1.14 1.06 2.68 0.36 0.39 0.41 0.4 0.49
37 137 1.20 0.47 0.51 0.48 0.43 0.69 0.27 0.27 0.27 0.27 0.27
38 138 0.22 0.78 0.85 0.79 0.71 1.13 0.44 0.45 0.45 0.45 0.45
39 139 0.07 1.1 1.2 1.12 1.01 1.61 0.63 0.63 0.64 0.64 0.64
40 140 0.22 1.42 1.56 1.44 1.31 2.08 0.82 0.82 0.83 0.83 0.83
41 141 0.15 1.75 1.91 1.77 1.61 2.55 1 1 1.02 1.01 1.01
42 142 0.04 2.09 2.28 2.12 1.92 3.05 1.2 1.2 1.22 1.21 1.21
43 143 0.88 0.86 0.85 0.83 0.8 0.83 0.63 0.61 0.61 0.6 0.59
44 144 0.11 1.42 1.41 1.37 1.33 1.38 1.05 1.01 1.01 1 0.98
45 145 0.04 2.01 2 1.94 1.88 1.96 1.49 1.43 1.43 1.41 1.39
46 146 0.07 2.6 2.58 2.51 2.43 2.53 1.93 1.86 1.85 1.83 1.8
47 147 0.04 3.19 3.17 3.08 2.99 3.11 2.37 2.28 2.27 2.24 2.21
48 148 0.04 3.82 3.79 3.68 3.57 3.71 2.83 2.72 2.71 2.68 2.63
49 149 0.04 4.41 4.38 4.25 4.12 4.29 3.26 3.15 3.13 3.1 3.04
50 150 0.00 5.24 5.2 5.05 4.89 5.1 3.88 3.74 3.72 3.68 3.61
51 151 0.18 1.48 1.4 1.33 1.3 1.55 1.13 1.04 0.97 0.94 0.91
52 152 0.15 2.45 2.31 2.2 2.15 2.57 1.88 1.72 1.61 1.56 1.5
53 153 0.11 3.47 3.27 3.11 3.05 3.64 2.66 2.43 2.28 2.21 2.12
54 154 0.07 4.49 4.24 4.03 3.94 4.72 3.44 3.15 2.96 2.86 2.75
55 155 0.04 5.51 5.2 4.94 4.84 5.79 4.23 3.87 3.63 3.52 3.38
56 156 0.04 6.58 6.21 5.91 5.78 6.91 5.05 4.62 4.33 4.2 4.03
57 157 0.00 7.61 7.18 6.82 6.68 7.98 5.83 5.34 5.01 4.85 4.66
58 158 0.00 9.04 8.53 8.1 7.93 9.49 6.93 6.34 5.95 5.76 5.53
59 159 0.00 10.62 10.02 9.52 9.32 11.15 8.14 7.45 6.99 6.77 6.5
60 160 0.00 1.82 1.72 1.63 1.63 2.6 1.68 1.59 1.5 1.46 1.39
61 161 0.00 3.01 2.85 2.7 2.71 4.31 2.78 2.64 2.49 2.41 2.31
62 162 0.00 9.36 8.87 8.39 8.4 13.37 8.64 8.2 7.74 7.49 7.16
63 163 0.00 11.12 10.53 9.96 9.98 15.89 10.27 9.74 9.19 8.89 8.51
64 164 0.00 2.57 2.47 2.33 2.93 4.96 3.06 2.98 2.83 2.75 2.62

ERDC/CHL TR-14-3 147
Wave No.
Wave ID Days/yr
Inbound Ship speed (kt) Outbound Ship speed (kt)
8 10 12 14 16 8 10 12 14 16
65 165 12.41 0.07 0.11 0.09 0.12 0.2 0.01 0.01 0.01 0.01 0.02
66 166 3.14 0.12 0.18 0.15 0.21 0.34 0.02 0.02 0.02 0.02 0.03
67 167 0.37 0.17 0.26 0.21 0.3 0.48 0.02 0.03 0.03 0.03 0.05
68 168 0.00 0.27 0.41 0.33 0.47 0.76 0.03 0.04 0.04 0.04 0.07
69 169 1.39 0.28 0.35 0.31 0.28 0.73 0.08 0.08 0.08 0.08 0.08
70 170 0.37 0.48 0.6 0.53 0.49 1.26 0.14 0.14 0.14 0.14 0.14
71 171 0.66 0.68 0.85 0.75 0.69 1.78 0.19 0.2 0.2 0.21 0.21
72 172 0.07 0.87 1.09 0.96 0.88 2.28 0.25 0.25 0.26 0.26 0.26
73 173 1.46 0.47 0.51 0.46 0.41 0.69 0.23 0.23 0.23 0.23 0.23
74 174 0.26 0.8 0.87 0.79 0.71 1.18 0.4 0.39 0.39 0.39 0.39
75 175 0.15 1.13 1.23 1.12 1.01 1.67 0.56 0.55 0.55 0.55 0.55
76 176 0.18 1.45 1.57 1.44 1.29 2.14 0.72 0.71 0.71 0.71 0.71
77 177 0.07 1.79 1.93 1.77 1.58 2.63 0.89 0.87 0.87 0.87 0.87
78 178 0.00 2.12 2.29 2.1 1.88 3.13 1.05 1.03 1.04 1.03 1.03
79 179 1.24 0.81 0.81 0.78 0.75 0.82 0.56 0.53 0.52 0.51 0.5
80 180 0.26 1.4 1.39 1.33 1.29 1.41 0.95 0.91 0.9 0.88 0.86
81 181 0.18 1.98 1.97 1.89 1.82 2 1.35 1.29 1.27 1.25 1.22
82 182 0.04 2.53 2.52 2.42 2.33 2.55 1.73 1.65 1.62 1.6 1.57
83 183 0.04 3.11 3.09 2.98 2.87 3.14 2.13 2.02 2 1.97 1.93
84 184 0.04 3.7 3.67 3.53 3.4 3.73 2.52 2.4 2.37 2.33 2.29
85 185 0.00 4.25 4.22 4.06 3.91 4.29 2.9 2.76 2.73 2.68 2.63
86 186 0.91 1.34 1.24 1.16 1.11 1.69 0.98 0.88 0.8 0.76 0.71
87 187 0.51 2.3 2.13 2 1.9 2.91 1.69 1.51 1.38 1.3 1.22
88 188 0.15 3.25 3.02 2.83 2.7 4.12 2.39 2.14 1.95 1.84 1.73
89 189 0.07 4.16 3.86 3.62 3.45 5.27 3.06 2.74 2.49 2.35 2.21
90 190 0.00 5.12 4.75 4.45 4.24 6.48 3.76 3.36 3.07 2.89 2.72
91 191 0.15 1.3 1.2 1.12 1.52 2.57 1.2 1.1 1.01 0.95 0.88
92 192 0.07 2.23 2.06 1.91 2.6 4.4 2.05 1.89 1.73 1.62 1.51
93 193 0.04 3.16 2.93 2.71 3.69 6.24 2.91 2.68 2.45 2.3 2.14
94 194 0.00 4.05 3.74 3.47 4.72 7.98 3.72 3.43 3.13 2.94 2.74
95 195 0.00 1.52 1.44 1.5 2.93 4.83 1.92 1.8 1.65 1.55 1.44
96 196 0.00 2.6 2.46 2.57 5.03 8.29 3.29 3.08 2.82 2.65 2.48
97 197 11.86 0.07 0.11 0.08 0.12 0.2 0.01 0.01 0.01 0.01 0.02
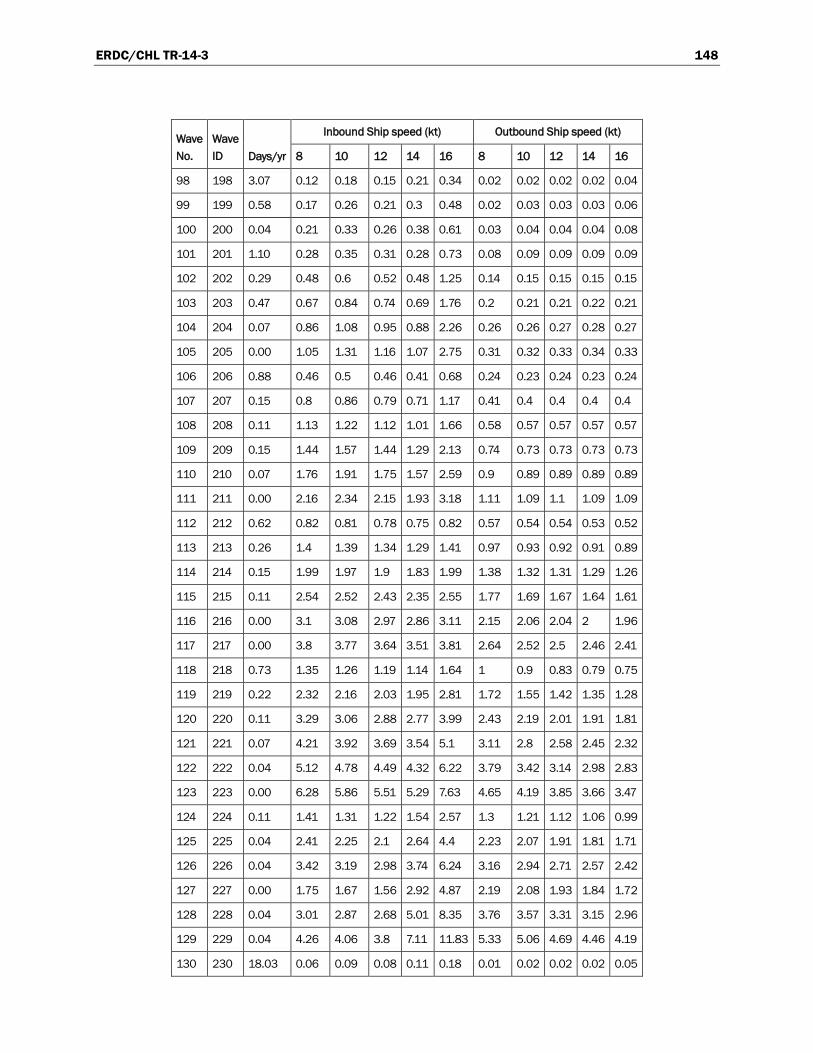
ERDC/CHL TR-14-3 148
Wave No.
Wave ID Days/yr
Inbound Ship speed (kt) Outbound Ship speed (kt)
8 10 12 14 16 8 10 12 14 16
98 198 3.07 0.12 0.18 0.15 0.21 0.34 0.02 0.02 0.02 0.02 0.04
99 199 0.58 0.17 0.26 0.21 0.3 0.48 0.02 0.03 0.03 0.03 0.06
100 200 0.04 0.21 0.33 0.26 0.38 0.61 0.03 0.04 0.04 0.04 0.08
101 201 1.10 0.28 0.35 0.31 0.28 0.73 0.08 0.09 0.09 0.09 0.09
102 202 0.29 0.48 0.6 0.52 0.48 1.25 0.14 0.15 0.15 0.15 0.15
103 203 0.47 0.67 0.84 0.74 0.69 1.76 0.2 0.21 0.21 0.22 0.21
104 204 0.07 0.86 1.08 0.95 0.88 2.26 0.26 0.26 0.27 0.28 0.27
105 205 0.00 1.05 1.31 1.16 1.07 2.75 0.31 0.32 0.33 0.34 0.33
106 206 0.88 0.46 0.5 0.46 0.41 0.68 0.24 0.23 0.24 0.23 0.24
107 207 0.15 0.8 0.86 0.79 0.71 1.17 0.41 0.4 0.4 0.4 0.4
108 208 0.11 1.13 1.22 1.12 1.01 1.66 0.58 0.57 0.57 0.57 0.57
109 209 0.15 1.44 1.57 1.44 1.29 2.13 0.74 0.73 0.73 0.73 0.73
110 210 0.07 1.76 1.91 1.75 1.57 2.59 0.9 0.89 0.89 0.89 0.89
111 211 0.00 2.16 2.34 2.15 1.93 3.18 1.11 1.09 1.1 1.09 1.09
112 212 0.62 0.82 0.81 0.78 0.75 0.82 0.57 0.54 0.54 0.53 0.52
113 213 0.26 1.4 1.39 1.34 1.29 1.41 0.97 0.93 0.92 0.91 0.89
114 214 0.15 1.99 1.97 1.9 1.83 1.99 1.38 1.32 1.31 1.29 1.26
115 215 0.11 2.54 2.52 2.43 2.35 2.55 1.77 1.69 1.67 1.64 1.61
116 216 0.00 3.1 3.08 2.97 2.86 3.11 2.15 2.06 2.04 2 1.96
117 217 0.00 3.8 3.77 3.64 3.51 3.81 2.64 2.52 2.5 2.46 2.41
118 218 0.73 1.35 1.26 1.19 1.14 1.64 1 0.9 0.83 0.79 0.75
119 219 0.22 2.32 2.16 2.03 1.95 2.81 1.72 1.55 1.42 1.35 1.28
120 220 0.11 3.29 3.06 2.88 2.77 3.99 2.43 2.19 2.01 1.91 1.81
121 221 0.07 4.21 3.92 3.69 3.54 5.1 3.11 2.8 2.58 2.45 2.32
122 222 0.04 5.12 4.78 4.49 4.32 6.22 3.79 3.42 3.14 2.98 2.83
123 223 0.00 6.28 5.86 5.51 5.29 7.63 4.65 4.19 3.85 3.66 3.47
124 224 0.11 1.41 1.31 1.22 1.54 2.57 1.3 1.21 1.12 1.06 0.99
125 225 0.04 2.41 2.25 2.1 2.64 4.4 2.23 2.07 1.91 1.81 1.71
126 226 0.04 3.42 3.19 2.98 3.74 6.24 3.16 2.94 2.71 2.57 2.42
127 227 0.00 1.75 1.67 1.56 2.92 4.87 2.19 2.08 1.93 1.84 1.72
128 228 0.04 3.01 2.87 2.68 5.01 8.35 3.76 3.57 3.31 3.15 2.96
129 229 0.04 4.26 4.06 3.8 7.11 11.83 5.33 5.06 4.69 4.46 4.19
130 230 18.03 0.06 0.09 0.08 0.11 0.18 0.01 0.02 0.02 0.02 0.05

ERDC/CHL TR-14-3 149
Wave No.
Wave ID Days/yr
Inbound Ship speed (kt) Outbound Ship speed (kt)
8 10 12 14 16 8 10 12 14 16
131 231 3.80 0.11 0.16 0.13 0.19 0.31 0.03 0.04 0.04 0.04 0.08
132 232 0.37 0.15 0.24 0.19 0.28 0.45 0.04 0.05 0.05 0.06 0.12
133 233 0.00 0.25 0.38 0.31 0.44 0.71 0.06 0.08 0.09 0.1 0.18
134 234 2.23 0.24 0.3 0.27 0.25 0.62 0.09 0.1 0.11 0.1 0.14
135 235 0.58 0.42 0.53 0.47 0.44 1.09 0.16 0.18 0.18 0.18 0.25
136 236 0.58 0.61 0.77 0.68 0.64 1.57 0.23 0.26 0.27 0.26 0.36
137 237 0.07 0.79 0.99 0.88 0.83 2.03 0.29 0.33 0.35 0.34 0.47
138 238 1.06 0.42 0.46 0.43 0.39 0.61 0.25 0.25 0.26 0.25 0.25
139 239 0.29 0.72 0.8 0.74 0.67 1.07 0.43 0.44 0.45 0.44 0.44
140 240 0.11 1.05 1.16 1.07 0.98 1.55 0.63 0.63 0.65 0.64 0.64
141 241 0.26 1.36 1.49 1.39 1.26 2 0.81 0.82 0.84 0.83 0.83
142 242 0.11 1.66 1.83 1.71 1.55 2.46 0.99 1.01 1.03 1.02 1.02
143 243 0.00 2 2.21 2.06 1.87 2.96 1.2 1.21 1.24 1.23 1.23
144 244 0.69 0.8 0.8 0.78 0.76 0.76 0.62 0.6 0.6 0.59 0.58
145 245 0.29 1.4 1.39 1.36 1.32 1.33 1.08 1.04 1.04 1.03 1.01
146 246 0.18 2.03 2.01 1.96 1.91 1.92 1.56 1.51 1.51 1.49 1.47
147 247 0.04 2.62 2.6 2.54 2.47 2.49 2.02 1.95 1.95 1.93 1.9
148 248 0.07 3.22 3.19 3.12 3.03 3.06 2.48 2.4 2.4 2.37 2.33
149 249 0.04 3.87 3.85 3.75 3.65 3.68 2.98 2.89 2.89 2.85 2.81
150 250 0.00 4.38 4.35 4.24 4.12 4.16 3.37 3.26 3.26 3.23 3.18
151 251 0.62 1.54 1.45 1.39 1.37 1.48 1.22 1.12 1.06 1.04 1
152 252 0.22 2.68 2.53 2.41 2.38 2.58 2.13 1.96 1.85 1.81 1.74
153 253 0.11 3.87 3.66 3.49 3.45 3.73 3.08 2.83 2.68 2.61 2.52
154 254 0.00 5.01 4.73 4.52 4.47 4.83 3.98 3.67 3.46 3.38 3.26
155 255 0.00 7.4 6.99 6.68 6.6 7.13 5.88 5.42 5.12 5 4.82
156 256 0.15 1.89 1.8 1.71 1.69 2.35 1.74 1.66 1.59 1.55 1.49
157 257 0.11 3.3 3.14 2.98 2.94 4.1 3.04 2.9 2.76 2.69 2.59
158 258 0.04 2.78 2.69 2.54 2.66 4.44 3.23 3.16 3.05 2.97 2.84
159 259 0.00 4.84 4.68 4.42 4.64 7.73 5.62 5.5 5.31 5.18 4.95
160 260 27.08 0.06 0.09 0.08 0.11 0.18 0.03 0.04 0.04 0.05 0.09
161 261 6.72 0.11 0.16 0.13 0.19 0.31 0.05 0.07 0.07 0.08 0.15
162 262 0.40 0.15 0.23 0.19 0.26 0.44 0.07 0.1 0.09 0.12 0.21
163 263 0.00 0.19 0.29 0.24 0.34 0.57 0.09 0.13 0.12 0.15 0.27

ERDC/CHL TR-14-3 150
Wave No.
Wave ID Days/yr
Inbound Ship speed (kt) Outbound Ship speed (kt)
8 10 12 14 16 8 10 12 14 16
164 264 4.60 0.22 0.28 0.25 0.24 0.56 0.12 0.15 0.15 0.14 0.25
165 265 0.91 0.38 0.48 0.43 0.41 0.96 0.21 0.25 0.25 0.24 0.43
166 266 1.24 0.53 0.67 0.6 0.57 1.34 0.29 0.35 0.35 0.33 0.6
167 267 0.11 0.69 0.86 0.78 0.74 1.74 0.38 0.46 0.46 0.43 0.78
168 268 1.46 0.41 0.45 0.43 0.4 0.56 0.3 0.32 0.32 0.32 0.31
169 269 0.33 0.7 0.77 0.73 0.68 0.97 0.52 0.54 0.55 0.54 0.54
170 270 0.22 0.98 1.07 1.02 0.95 1.35 0.73 0.76 0.77 0.76 0.75
171 271 0.40 1.27 1.39 1.33 1.24 1.75 0.94 0.99 1 0.99 0.97
172 272 0.07 1.56 1.71 1.63 1.52 2.16 1.16 1.21 1.23 1.21 1.2
173 273 0.00 1.86 2.05 1.95 1.82 2.58 1.39 1.45 1.47 1.45 1.43
174 274 0.69 0.85 0.84 0.83 0.81 0.8 0.73 0.72 0.72 0.71 0.7
175 275 0.33 1.45 1.44 1.42 1.39 1.36 1.26 1.23 1.24 1.23 1.21
176 276 0.07 2.02 2.01 1.99 1.95 1.91 1.75 1.72 1.73 1.71 1.69
177 277 0.04 2.63 2.61 2.58 2.53 2.47 2.28 2.23 2.24 2.22 2.19
178 278 0.04 3.23 3.21 3.17 3.11 3.04 2.8 2.74 2.76 2.73 2.69
179 279 0.04 3.87 3.84 3.8 3.72 3.64 3.35 3.28 3.3 3.27 3.22
180 280 0.22 1.64 1.57 1.52 1.52 1.46 1.42 1.33 1.28 1.28 1.24
181 281 0.18 2.82 2.69 2.61 2.61 2.51 2.44 2.28 2.2 2.19 2.13
182 282 0.04 3.93 3.75 3.64 3.64 3.51 3.4 3.19 3.08 3.06 2.97
183 283 0.00 5.11 4.87 4.73 4.72 4.56 4.42 4.14 4 3.97 3.86
184 284 0.00 6.28 5.99 5.81 5.81 5.6 5.43 5.09 4.91 4.88 4.74
185 285 0.00 7.51 7.17 6.95 6.95 6.7 6.5 6.09 5.88 5.84 5.67
186 286 0.00 8.75 8.35 8.09 8.09 7.8 7.56 7.09 6.84 6.8 6.6
187 287 10.22 0.02 0.03 0.03 0.04 0.07 0.02 0.03 0.02 0.03 0.06
188 288 2.81 0.03 0.05 0.04 0.07 0.11 0.03 0.04 0.04 0.06 0.09
189 289 0.22 0.05 0.08 0.06 0.1 0.15 0.04 0.06 0.05 0.08 0.13
190 290 0.00 0.06 0.1 0.08 0.13 0.2 0.05 0.08 0.07 0.1 0.17
191 291 0.00 0.08 0.12 0.1 0.15 0.24 0.06 0.1 0.08 0.12 0.2
192 292 0.18 0.19 0.24 0.22 0.21 0.46 0.17 0.2 0.19 0.18 0.38
193 293 0.18 0.31 0.39 0.36 0.34 0.75 0.27 0.33 0.31 0.29 0.61
194 294 0.29 0.44 0.55 0.51 0.48 1.07 0.38 0.47 0.45 0.41 0.88
195 295 0.00 0.58 0.72 0.67 0.63 1.4 0.5 0.61 0.59 0.54 1.15
196 296 0.04 0.39 0.42 0.41 0.39 0.49 0.36 0.39 0.39 0.37 0.41
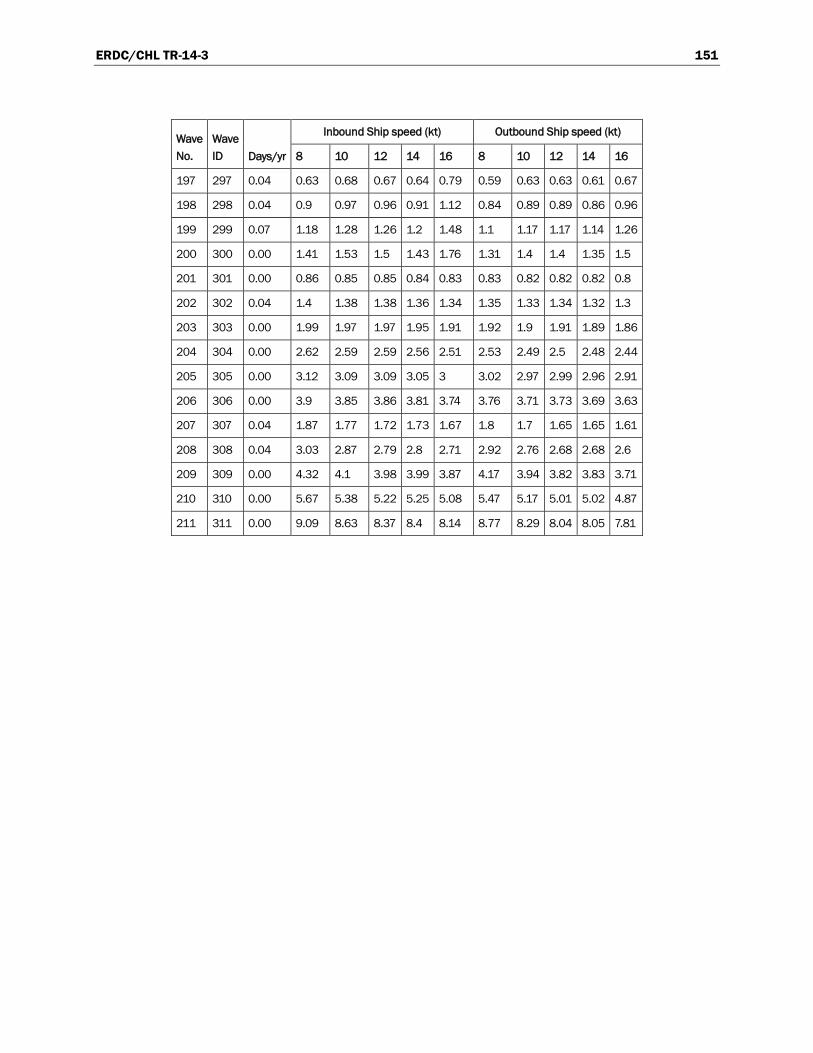
ERDC/CHL TR-14-3 151
Wave No.
Wave ID Days/yr
Inbound Ship speed (kt) Outbound Ship speed (kt)
8 10 12 14 16 8 10 12 14 16
197 297 0.04 0.63 0.68 0.67 0.64 0.79 0.59 0.63 0.63 0.61 0.67
198 298 0.04 0.9 0.97 0.96 0.91 1.12 0.84 0.89 0.89 0.86 0.96
199 299 0.07 1.18 1.28 1.26 1.2 1.48 1.1 1.17 1.17 1.14 1.26
200 300 0.00 1.41 1.53 1.5 1.43 1.76 1.31 1.4 1.4 1.35 1.5
201 301 0.00 0.86 0.85 0.85 0.84 0.83 0.83 0.82 0.82 0.82 0.8
202 302 0.04 1.4 1.38 1.38 1.36 1.34 1.35 1.33 1.34 1.32 1.3
203 303 0.00 1.99 1.97 1.97 1.95 1.91 1.92 1.9 1.91 1.89 1.86
204 304 0.00 2.62 2.59 2.59 2.56 2.51 2.53 2.49 2.5 2.48 2.44
205 305 0.00 3.12 3.09 3.09 3.05 3 3.02 2.97 2.99 2.96 2.91
206 306 0.00 3.9 3.85 3.86 3.81 3.74 3.76 3.71 3.73 3.69 3.63
207 307 0.04 1.87 1.77 1.72 1.73 1.67 1.8 1.7 1.65 1.65 1.61
208 308 0.04 3.03 2.87 2.79 2.8 2.71 2.92 2.76 2.68 2.68 2.6
209 309 0.00 4.32 4.1 3.98 3.99 3.87 4.17 3.94 3.82 3.83 3.71
210 310 0.00 5.67 5.38 5.22 5.25 5.08 5.47 5.17 5.01 5.02 4.87
211 311 0.00 9.09 8.63 8.37 8.4 8.14 8.77 8.29 8.04 8.05 7.81
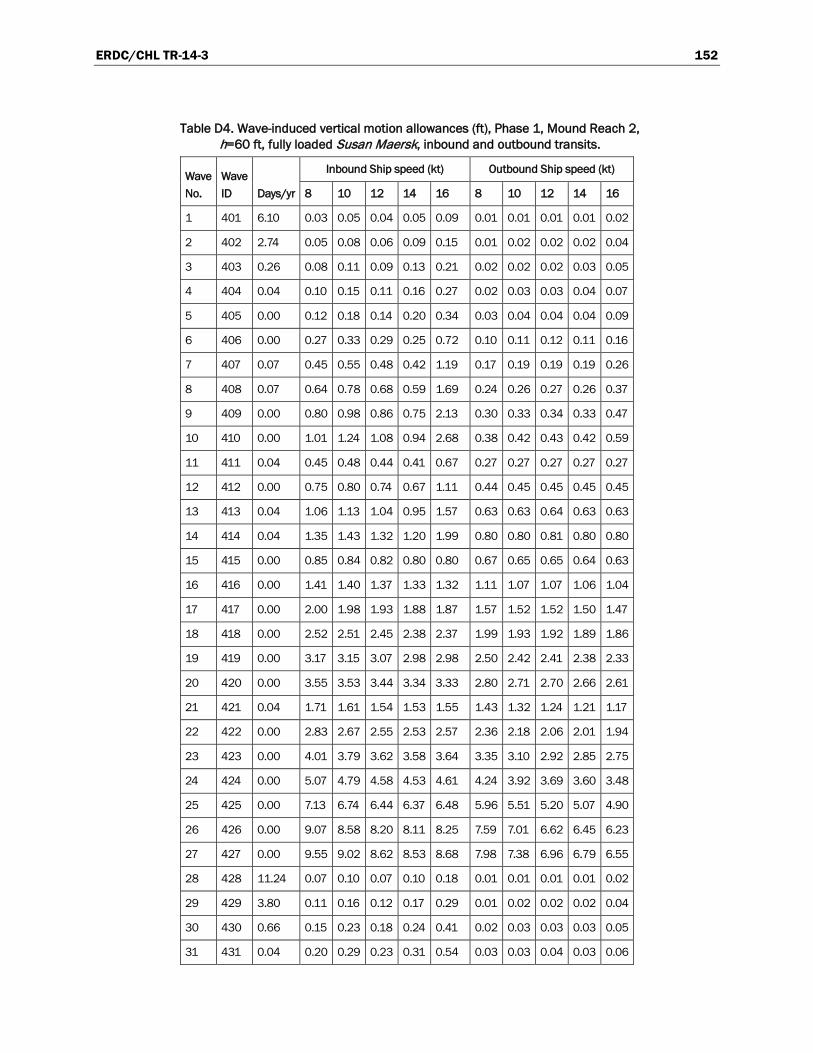
ERDC/CHL TR-14-3 152
Table D4. Wave-induced vertical motion allowances (ft), Phase 1, Mound Reach 2, h=60 ft, fully loaded Susan Maersk, inbound and outbound transits.
Wave No.
Wave ID Days/yr
Inbound Ship speed (kt) Outbound Ship speed (kt)
8 10 12 14 16 8 10 12 14 16
1 401 6.10 0.03 0.05 0.04 0.05 0.09 0.01 0.01 0.01 0.01 0.02
2 402 2.74 0.05 0.08 0.06 0.09 0.15 0.01 0.02 0.02 0.02 0.04
3 403 0.26 0.08 0.11 0.09 0.13 0.21 0.02 0.02 0.02 0.03 0.05
4 404 0.04 0.10 0.15 0.11 0.16 0.27 0.02 0.03 0.03 0.04 0.07
5 405 0.00 0.12 0.18 0.14 0.20 0.34 0.03 0.04 0.04 0.04 0.09
6 406 0.00 0.27 0.33 0.29 0.25 0.72 0.10 0.11 0.12 0.11 0.16
7 407 0.07 0.45 0.55 0.48 0.42 1.19 0.17 0.19 0.19 0.19 0.26
8 408 0.07 0.64 0.78 0.68 0.59 1.69 0.24 0.26 0.27 0.26 0.37
9 409 0.00 0.80 0.98 0.86 0.75 2.13 0.30 0.33 0.34 0.33 0.47
10 410 0.00 1.01 1.24 1.08 0.94 2.68 0.38 0.42 0.43 0.42 0.59
11 411 0.04 0.45 0.48 0.44 0.41 0.67 0.27 0.27 0.27 0.27 0.27
12 412 0.00 0.75 0.80 0.74 0.67 1.11 0.44 0.45 0.45 0.45 0.45
13 413 0.04 1.06 1.13 1.04 0.95 1.57 0.63 0.63 0.64 0.63 0.63
14 414 0.04 1.35 1.43 1.32 1.20 1.99 0.80 0.80 0.81 0.80 0.80
15 415 0.00 0.85 0.84 0.82 0.80 0.80 0.67 0.65 0.65 0.64 0.63
16 416 0.00 1.41 1.40 1.37 1.33 1.32 1.11 1.07 1.07 1.06 1.04
17 417 0.00 2.00 1.98 1.93 1.88 1.87 1.57 1.52 1.52 1.50 1.47
18 418 0.00 2.52 2.51 2.45 2.38 2.37 1.99 1.93 1.92 1.89 1.86
19 419 0.00 3.17 3.15 3.07 2.98 2.98 2.50 2.42 2.41 2.38 2.33
20 420 0.00 3.55 3.53 3.44 3.34 3.33 2.80 2.71 2.70 2.66 2.61
21 421 0.04 1.71 1.61 1.54 1.53 1.55 1.43 1.32 1.24 1.21 1.17
22 422 0.00 2.83 2.67 2.55 2.53 2.57 2.36 2.18 2.06 2.01 1.94
23 423 0.00 4.01 3.79 3.62 3.58 3.64 3.35 3.10 2.92 2.85 2.75
24 424 0.00 5.07 4.79 4.58 4.53 4.61 4.24 3.92 3.69 3.60 3.48
25 425 0.00 7.13 6.74 6.44 6.37 6.48 5.96 5.51 5.20 5.07 4.90
26 426 0.00 9.07 8.58 8.20 8.11 8.25 7.59 7.01 6.62 6.45 6.23
27 427 0.00 9.55 9.02 8.62 8.53 8.68 7.98 7.38 6.96 6.79 6.55
28 428 11.24 0.07 0.10 0.07 0.10 0.18 0.01 0.01 0.01 0.01 0.02
29 429 3.80 0.11 0.16 0.12 0.17 0.29 0.01 0.02 0.02 0.02 0.04
30 430 0.66 0.15 0.23 0.18 0.24 0.41 0.02 0.03 0.03 0.03 0.05
31 431 0.04 0.20 0.29 0.23 0.31 0.54 0.03 0.03 0.04 0.03 0.06
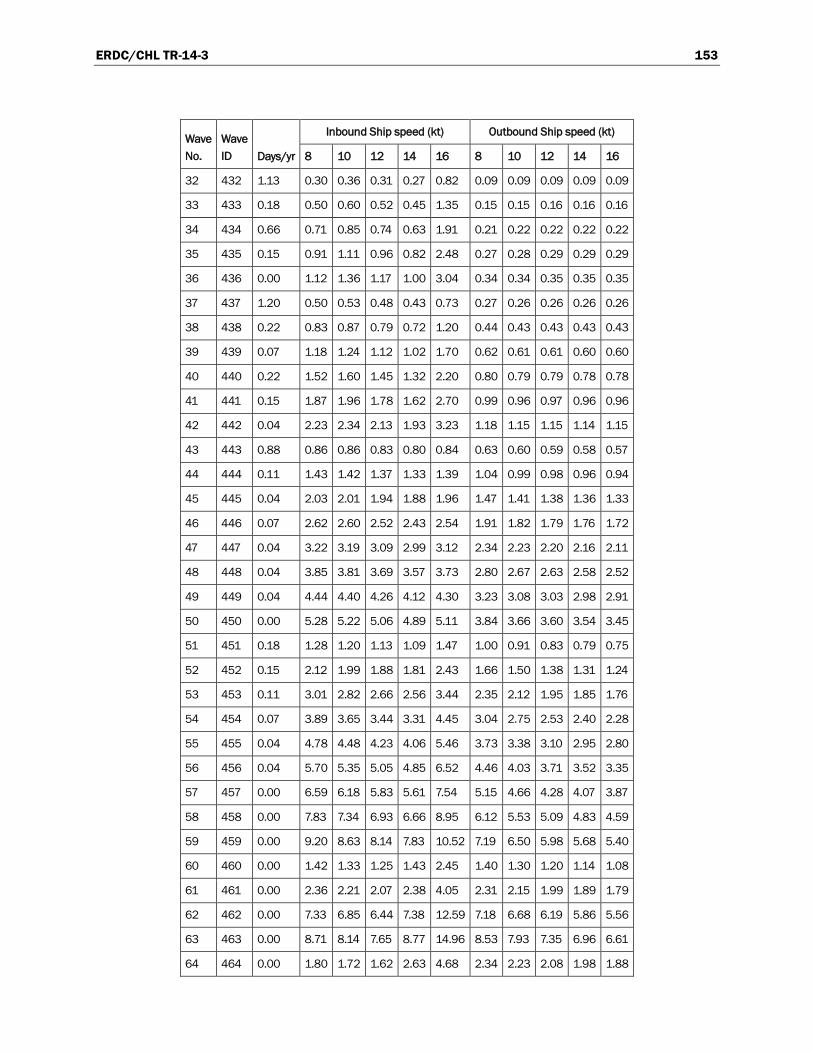
ERDC/CHL TR-14-3 153
Wave No.
Wave ID Days/yr
Inbound Ship speed (kt) Outbound Ship speed (kt)
8 10 12 14 16 8 10 12 14 16
32 432 1.13 0.30 0.36 0.31 0.27 0.82 0.09 0.09 0.09 0.09 0.09
33 433 0.18 0.50 0.60 0.52 0.45 1.35 0.15 0.15 0.16 0.16 0.16
34 434 0.66 0.71 0.85 0.74 0.63 1.91 0.21 0.22 0.22 0.22 0.22
35 435 0.15 0.91 1.11 0.96 0.82 2.48 0.27 0.28 0.29 0.29 0.29
36 436 0.00 1.12 1.36 1.17 1.00 3.04 0.34 0.34 0.35 0.35 0.35
37 437 1.20 0.50 0.53 0.48 0.43 0.73 0.27 0.26 0.26 0.26 0.26
38 438 0.22 0.83 0.87 0.79 0.72 1.20 0.44 0.43 0.43 0.43 0.43
39 439 0.07 1.18 1.24 1.12 1.02 1.70 0.62 0.61 0.61 0.60 0.60
40 440 0.22 1.52 1.60 1.45 1.32 2.20 0.80 0.79 0.79 0.78 0.78
41 441 0.15 1.87 1.96 1.78 1.62 2.70 0.99 0.96 0.97 0.96 0.96
42 442 0.04 2.23 2.34 2.13 1.93 3.23 1.18 1.15 1.15 1.14 1.15
43 443 0.88 0.86 0.86 0.83 0.80 0.84 0.63 0.60 0.59 0.58 0.57
44 444 0.11 1.43 1.42 1.37 1.33 1.39 1.04 0.99 0.98 0.96 0.94
45 445 0.04 2.03 2.01 1.94 1.88 1.96 1.47 1.41 1.38 1.36 1.33
46 446 0.07 2.62 2.60 2.52 2.43 2.54 1.91 1.82 1.79 1.76 1.72
47 447 0.04 3.22 3.19 3.09 2.99 3.12 2.34 2.23 2.20 2.16 2.11
48 448 0.04 3.85 3.81 3.69 3.57 3.73 2.80 2.67 2.63 2.58 2.52
49 449 0.04 4.44 4.40 4.26 4.12 4.30 3.23 3.08 3.03 2.98 2.91
50 450 0.00 5.28 5.22 5.06 4.89 5.11 3.84 3.66 3.60 3.54 3.45
51 451 0.18 1.28 1.20 1.13 1.09 1.47 1.00 0.91 0.83 0.79 0.75
52 452 0.15 2.12 1.99 1.88 1.81 2.43 1.66 1.50 1.38 1.31 1.24
53 453 0.11 3.01 2.82 2.66 2.56 3.44 2.35 2.12 1.95 1.85 1.76
54 454 0.07 3.89 3.65 3.44 3.31 4.45 3.04 2.75 2.53 2.40 2.28
55 455 0.04 4.78 4.48 4.23 4.06 5.46 3.73 3.38 3.10 2.95 2.80
56 456 0.04 5.70 5.35 5.05 4.85 6.52 4.46 4.03 3.71 3.52 3.35
57 457 0.00 6.59 6.18 5.83 5.61 7.54 5.15 4.66 4.28 4.07 3.87
58 458 0.00 7.83 7.34 6.93 6.66 8.95 6.12 5.53 5.09 4.83 4.59
59 459 0.00 9.20 8.63 8.14 7.83 10.52 7.19 6.50 5.98 5.68 5.40
60 460 0.00 1.42 1.33 1.25 1.43 2.45 1.40 1.30 1.20 1.14 1.08
61 461 0.00 2.36 2.21 2.07 2.38 4.05 2.31 2.15 1.99 1.89 1.79
62 462 0.00 7.33 6.85 6.44 7.38 12.59 7.18 6.68 6.19 5.86 5.56
63 463 0.00 8.71 8.14 7.65 8.77 14.96 8.53 7.93 7.35 6.96 6.61
64 464 0.00 1.80 1.72 1.62 2.63 4.68 2.34 2.23 2.08 1.98 1.88

ERDC/CHL TR-14-3 154
Wave No.
Wave ID Days/yr
Inbound Ship speed (kt) Outbound Ship speed (kt)
8 10 12 14 16 8 10 12 14 16
65 465 12.41 0.07 0.11 0.08 0.11 0.20 0.01 0.01 0.01 0.01 0.02
66 466 3.14 0.12 0.18 0.14 0.19 0.34 0.02 0.02 0.02 0.02 0.03
67 467 0.37 0.18 0.26 0.20 0.27 0.48 0.02 0.03 0.03 0.03 0.05
68 468 0.00 0.28 0.41 0.32 0.42 0.75 0.04 0.04 0.04 0.04 0.07
69 469 1.39 0.29 0.35 0.31 0.26 0.80 0.08 0.08 0.09 0.09 0.09
70 470 0.37 0.50 0.61 0.53 0.45 1.37 0.14 0.15 0.15 0.15 0.15
71 471 0.66 0.71 0.86 0.74 0.63 1.94 0.20 0.21 0.21 0.21 0.21
72 472 0.07 0.91 1.10 0.95 0.81 2.48 0.26 0.26 0.27 0.27 0.27
73 473 1.46 0.49 0.51 0.46 0.42 0.71 0.25 0.24 0.24 0.24 0.24
74 474 0.26 0.83 0.88 0.79 0.72 1.21 0.43 0.42 0.42 0.41 0.41
75 475 0.15 1.18 1.24 1.12 1.02 1.71 0.61 0.59 0.59 0.58 0.58
76 476 0.18 1.51 1.59 1.44 1.30 2.19 0.78 0.75 0.75 0.75 0.75
77 477 0.07 1.86 1.96 1.77 1.60 2.70 0.96 0.93 0.93 0.92 0.92
78 478 0.00 2.21 2.32 2.10 1.90 3.20 1.13 1.10 1.10 1.09 1.09
79 479 1.24 0.83 0.82 0.79 0.77 0.81 0.59 0.56 0.55 0.54 0.53
80 480 0.26 1.42 1.41 1.36 1.32 1.39 1.02 0.97 0.95 0.93 0.91
81 481 0.18 2.02 2.00 1.93 1.87 1.97 1.44 1.37 1.35 1.32 1.29
82 482 0.04 2.58 2.56 2.47 2.39 2.52 1.85 1.76 1.72 1.69 1.65
83 483 0.04 3.17 3.14 3.04 2.94 3.09 2.27 2.16 2.12 2.08 2.03
84 484 0.04 3.77 3.73 3.61 3.48 3.67 2.69 2.56 2.52 2.47 2.41
85 485 0.00 4.33 4.29 4.15 4.01 4.22 3.10 2.95 2.89 2.84 2.77
86 486 0.91 1.31 1.22 1.15 1.10 1.57 1.04 0.94 0.86 0.81 0.76
87 487 0.51 2.25 2.10 1.98 1.89 2.69 1.79 1.61 1.47 1.38 1.31
88 488 0.15 3.19 2.97 2.80 2.68 3.81 2.54 2.28 2.08 1.96 1.85
89 489 0.07 4.09 3.80 3.59 3.43 4.88 3.24 2.92 2.66 2.50 2.37
90 490 0.00 5.03 4.67 4.41 4.22 6.00 3.99 3.59 3.27 3.08 2.91
91 491 0.15 1.27 1.18 1.10 1.36 2.37 1.25 1.15 1.06 0.99 0.93
92 492 0.07 2.18 2.02 1.90 2.33 4.06 2.15 1.98 1.81 1.70 1.60
93 493 0.04 3.09 2.87 2.69 3.30 5.76 3.04 2.80 2.57 2.41 2.27
94 494 0.00 3.95 3.67 3.44 4.22 7.36 3.89 3.58 3.29 3.08 2.90
95 495 0.00 1.52 1.44 1.38 2.54 4.53 2.00 1.88 1.74 1.63 1.54
96 496 0.00 2.60 2.47 2.36 4.36 7.76 3.44 3.22 2.98 2.80 2.64
97 497 11.86 0.07 0.10 0.08 0.11 0.19 0.01 0.02 0.02 0.02 0.04
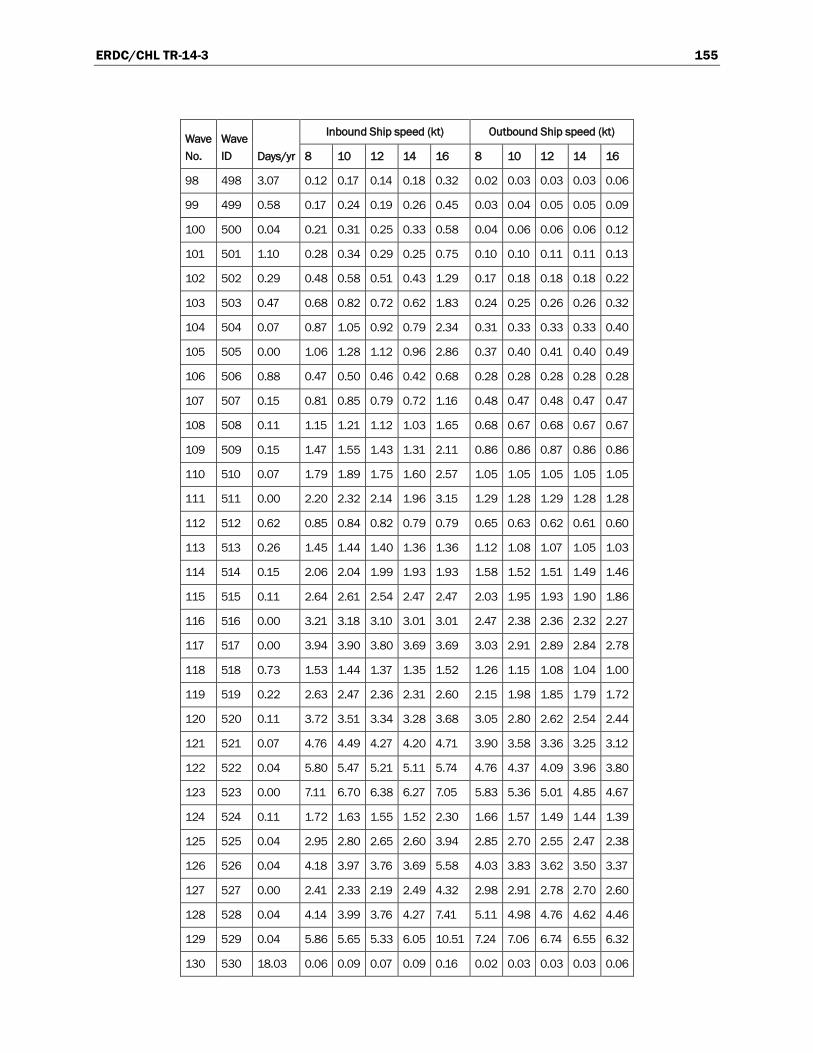
ERDC/CHL TR-14-3 155
Wave No.
Wave ID Days/yr
Inbound Ship speed (kt) Outbound Ship speed (kt)
8 10 12 14 16 8 10 12 14 16
98 498 3.07 0.12 0.17 0.14 0.18 0.32 0.02 0.03 0.03 0.03 0.06
99 499 0.58 0.17 0.24 0.19 0.26 0.45 0.03 0.04 0.05 0.05 0.09
100 500 0.04 0.21 0.31 0.25 0.33 0.58 0.04 0.06 0.06 0.06 0.12
101 501 1.10 0.28 0.34 0.29 0.25 0.75 0.10 0.10 0.11 0.11 0.13
102 502 0.29 0.48 0.58 0.51 0.43 1.29 0.17 0.18 0.18 0.18 0.22
103 503 0.47 0.68 0.82 0.72 0.62 1.83 0.24 0.25 0.26 0.26 0.32
104 504 0.07 0.87 1.05 0.92 0.79 2.34 0.31 0.33 0.33 0.33 0.40
105 505 0.00 1.06 1.28 1.12 0.96 2.86 0.37 0.40 0.41 0.40 0.49
106 506 0.88 0.47 0.50 0.46 0.42 0.68 0.28 0.28 0.28 0.28 0.28
107 507 0.15 0.81 0.85 0.79 0.72 1.16 0.48 0.47 0.48 0.47 0.47
108 508 0.11 1.15 1.21 1.12 1.03 1.65 0.68 0.67 0.68 0.67 0.67
109 509 0.15 1.47 1.55 1.43 1.31 2.11 0.86 0.86 0.87 0.86 0.86
110 510 0.07 1.79 1.89 1.75 1.60 2.57 1.05 1.05 1.05 1.05 1.05
111 511 0.00 2.20 2.32 2.14 1.96 3.15 1.29 1.28 1.29 1.28 1.28
112 512 0.62 0.85 0.84 0.82 0.79 0.79 0.65 0.63 0.62 0.61 0.60
113 513 0.26 1.45 1.44 1.40 1.36 1.36 1.12 1.08 1.07 1.05 1.03
114 514 0.15 2.06 2.04 1.99 1.93 1.93 1.58 1.52 1.51 1.49 1.46
115 515 0.11 2.64 2.61 2.54 2.47 2.47 2.03 1.95 1.93 1.90 1.86
116 516 0.00 3.21 3.18 3.10 3.01 3.01 2.47 2.38 2.36 2.32 2.27
117 517 0.00 3.94 3.90 3.80 3.69 3.69 3.03 2.91 2.89 2.84 2.78
118 518 0.73 1.53 1.44 1.37 1.35 1.52 1.26 1.15 1.08 1.04 1.00
119 519 0.22 2.63 2.47 2.36 2.31 2.60 2.15 1.98 1.85 1.79 1.72
120 520 0.11 3.72 3.51 3.34 3.28 3.68 3.05 2.80 2.62 2.54 2.44
121 521 0.07 4.76 4.49 4.27 4.20 4.71 3.90 3.58 3.36 3.25 3.12
122 522 0.04 5.80 5.47 5.21 5.11 5.74 4.76 4.37 4.09 3.96 3.80
123 523 0.00 7.11 6.70 6.38 6.27 7.05 5.83 5.36 5.01 4.85 4.67
124 524 0.11 1.72 1.63 1.55 1.52 2.30 1.66 1.57 1.49 1.44 1.39
125 525 0.04 2.95 2.80 2.65 2.60 3.94 2.85 2.70 2.55 2.47 2.38
126 526 0.04 4.18 3.97 3.76 3.69 5.58 4.03 3.83 3.62 3.50 3.37
127 527 0.00 2.41 2.33 2.19 2.49 4.32 2.98 2.91 2.78 2.70 2.60
128 528 0.04 4.14 3.99 3.76 4.27 7.41 5.11 4.98 4.76 4.62 4.46
129 529 0.04 5.86 5.65 5.33 6.05 10.51 7.24 7.06 6.74 6.55 6.32
130 530 18.03 0.06 0.09 0.07 0.09 0.16 0.02 0.03 0.03 0.03 0.06

ERDC/CHL TR-14-3 156
Wave No.
Wave ID Days/yr
Inbound Ship speed (kt) Outbound Ship speed (kt)
8 10 12 14 16 8 10 12 14 16
131 531 3.80 0.10 0.15 0.12 0.16 0.28 0.04 0.05 0.05 0.06 0.11
132 532 0.37 0.15 0.22 0.17 0.23 0.40 0.05 0.08 0.07 0.08 0.16
133 533 0.00 0.23 0.34 0.27 0.36 0.64 0.08 0.12 0.11 0.13 0.25
134 534 2.23 0.23 0.29 0.25 0.22 0.61 0.11 0.13 0.13 0.12 0.21
135 535 0.58 0.41 0.50 0.44 0.38 1.06 0.20 0.23 0.23 0.22 0.37
136 536 0.58 0.59 0.72 0.63 0.56 1.54 0.28 0.33 0.33 0.31 0.54
137 537 0.07 0.76 0.93 0.82 0.72 1.99 0.37 0.42 0.42 0.40 0.70
138 538 1.06 0.42 0.45 0.42 0.39 0.59 0.30 0.30 0.31 0.30 0.30
139 539 0.29 0.72 0.78 0.74 0.68 1.02 0.51 0.53 0.53 0.53 0.52
140 540 0.11 1.05 1.13 1.06 0.99 1.47 0.74 0.76 0.77 0.76 0.76
141 541 0.26 1.36 1.46 1.38 1.28 1.91 0.96 0.98 1.00 0.98 0.98
142 542 0.11 1.67 1.79 1.69 1.57 2.34 1.18 1.21 1.22 1.21 1.20
143 543 0.00 2.01 2.16 2.03 1.89 2.82 1.42 1.45 1.47 1.45 1.45
144 544 0.69 0.84 0.83 0.82 0.80 0.78 0.72 0.70 0.70 0.69 0.68
145 545 0.29 1.46 1.45 1.43 1.40 1.36 1.25 1.21 1.21 1.20 1.18
146 546 0.18 2.12 2.09 2.07 2.02 1.97 1.80 1.76 1.76 1.74 1.70
147 547 0.04 2.74 2.71 2.67 2.62 2.55 2.34 2.27 2.28 2.25 2.21
148 548 0.07 3.36 3.33 3.28 3.21 3.14 2.87 2.79 2.79 2.76 2.71
149 549 0.04 4.05 4.00 3.95 3.86 3.78 3.45 3.36 3.36 3.32 3.26
150 550 0.00 4.58 4.53 4.47 4.37 4.27 3.90 3.80 3.80 3.76 3.69
151 551 0.62 1.73 1.65 1.58 1.58 1.52 1.51 1.41 1.35 1.33 1.29
152 552 0.22 3.02 2.87 2.76 2.76 2.65 2.63 2.46 2.35 2.32 2.25
153 553 0.11 4.37 4.15 3.99 3.99 3.83 3.81 3.56 3.40 3.36 3.26
154 554 0.00 5.66 5.37 5.17 5.16 4.96 4.94 4.61 4.40 4.35 4.22
155 555 0.00 8.36 7.94 7.64 7.63 7.33 7.29 6.81 6.50 6.42 6.23
156 556 0.15 2.23 2.13 2.04 2.03 1.97 2.11 2.02 1.96 1.94 1.88
157 557 0.11 3.88 3.71 3.56 3.54 3.43 3.67 3.53 3.42 3.38 3.27
158 558 0.04 3.32 3.21 3.07 3.02 3.39 3.95 3.88 3.81 3.76 3.62
159 559 0.00 5.78 5.60 5.34 5.26 5.91 6.87 6.77 6.64 6.56 6.31
160 560 27.08 0.06 0.08 0.07 0.09 0.16 0.04 0.05 0.05 0.06 0.11
161 561 6.72 0.10 0.14 0.12 0.15 0.27 0.06 0.09 0.08 0.10 0.19
162 562 0.40 0.13 0.19 0.16 0.21 0.38 0.09 0.13 0.11 0.14 0.26
163 563 0.00 0.17 0.25 0.21 0.27 0.49 0.12 0.17 0.15 0.18 0.34
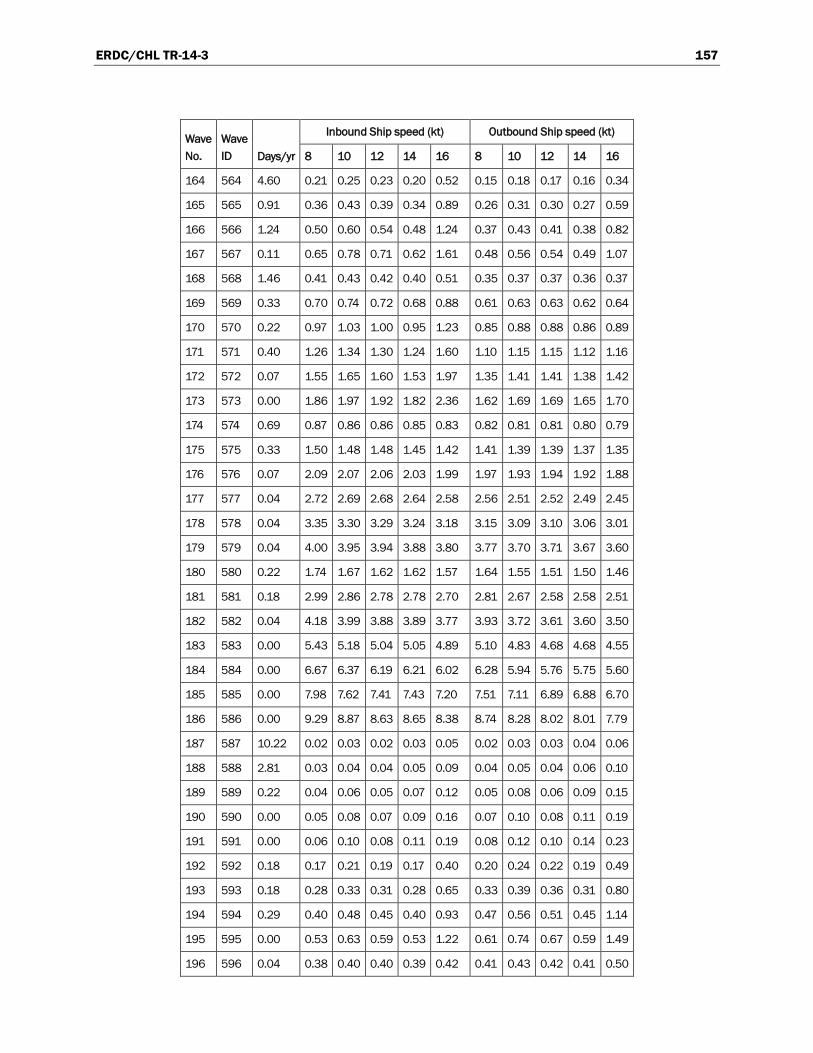
ERDC/CHL TR-14-3 157
Wave No.
Wave ID Days/yr
Inbound Ship speed (kt) Outbound Ship speed (kt)
8 10 12 14 16 8 10 12 14 16
164 564 4.60 0.21 0.25 0.23 0.20 0.52 0.15 0.18 0.17 0.16 0.34
165 565 0.91 0.36 0.43 0.39 0.34 0.89 0.26 0.31 0.30 0.27 0.59
166 566 1.24 0.50 0.60 0.54 0.48 1.24 0.37 0.43 0.41 0.38 0.82
167 567 0.11 0.65 0.78 0.71 0.62 1.61 0.48 0.56 0.54 0.49 1.07
168 568 1.46 0.41 0.43 0.42 0.40 0.51 0.35 0.37 0.37 0.36 0.37
169 569 0.33 0.70 0.74 0.72 0.68 0.88 0.61 0.63 0.63 0.62 0.64
170 570 0.22 0.97 1.03 1.00 0.95 1.23 0.85 0.88 0.88 0.86 0.89
171 571 0.40 1.26 1.34 1.30 1.24 1.60 1.10 1.15 1.15 1.12 1.16
172 572 0.07 1.55 1.65 1.60 1.53 1.97 1.35 1.41 1.41 1.38 1.42
173 573 0.00 1.86 1.97 1.92 1.82 2.36 1.62 1.69 1.69 1.65 1.70
174 574 0.69 0.87 0.86 0.86 0.85 0.83 0.82 0.81 0.81 0.80 0.79
175 575 0.33 1.50 1.48 1.48 1.45 1.42 1.41 1.39 1.39 1.37 1.35
176 576 0.07 2.09 2.07 2.06 2.03 1.99 1.97 1.93 1.94 1.92 1.88
177 577 0.04 2.72 2.69 2.68 2.64 2.58 2.56 2.51 2.52 2.49 2.45
178 578 0.04 3.35 3.30 3.29 3.24 3.18 3.15 3.09 3.10 3.06 3.01
179 579 0.04 4.00 3.95 3.94 3.88 3.80 3.77 3.70 3.71 3.67 3.60
180 580 0.22 1.74 1.67 1.62 1.62 1.57 1.64 1.55 1.51 1.50 1.46
181 581 0.18 2.99 2.86 2.78 2.78 2.70 2.81 2.67 2.58 2.58 2.51
182 582 0.04 4.18 3.99 3.88 3.89 3.77 3.93 3.72 3.61 3.60 3.50
183 583 0.00 5.43 5.18 5.04 5.05 4.89 5.10 4.83 4.68 4.68 4.55
184 584 0.00 6.67 6.37 6.19 6.21 6.02 6.28 5.94 5.76 5.75 5.60
185 585 0.00 7.98 7.62 7.41 7.43 7.20 7.51 7.11 6.89 6.88 6.70
186 586 0.00 9.29 8.87 8.63 8.65 8.38 8.74 8.28 8.02 8.01 7.79
187 587 10.22 0.02 0.03 0.02 0.03 0.05 0.02 0.03 0.03 0.04 0.06
188 588 2.81 0.03 0.04 0.04 0.05 0.09 0.04 0.05 0.04 0.06 0.10
189 589 0.22 0.04 0.06 0.05 0.07 0.12 0.05 0.08 0.06 0.09 0.15
190 590 0.00 0.05 0.08 0.07 0.09 0.16 0.07 0.10 0.08 0.11 0.19
191 591 0.00 0.06 0.10 0.08 0.11 0.19 0.08 0.12 0.10 0.14 0.23
192 592 0.18 0.17 0.21 0.19 0.17 0.40 0.20 0.24 0.22 0.19 0.49
193 593 0.18 0.28 0.33 0.31 0.28 0.65 0.33 0.39 0.36 0.31 0.80
194 594 0.29 0.40 0.48 0.45 0.40 0.93 0.47 0.56 0.51 0.45 1.14
195 595 0.00 0.53 0.63 0.59 0.53 1.22 0.61 0.74 0.67 0.59 1.49
196 596 0.04 0.38 0.40 0.40 0.39 0.42 0.41 0.43 0.42 0.41 0.50
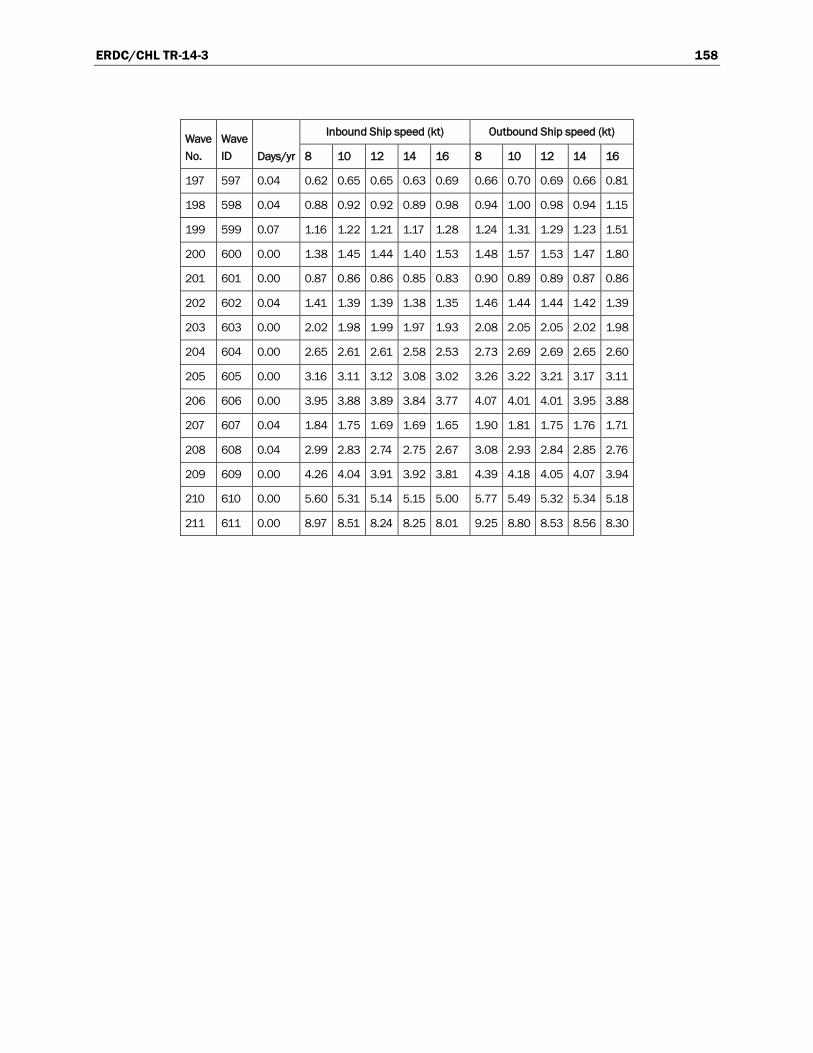
ERDC/CHL TR-14-3 158
Wave No.
Wave ID Days/yr
Inbound Ship speed (kt) Outbound Ship speed (kt)
8 10 12 14 16 8 10 12 14 16
197 597 0.04 0.62 0.65 0.65 0.63 0.69 0.66 0.70 0.69 0.66 0.81
198 598 0.04 0.88 0.92 0.92 0.89 0.98 0.94 1.00 0.98 0.94 1.15
199 599 0.07 1.16 1.22 1.21 1.17 1.28 1.24 1.31 1.29 1.23 1.51
200 600 0.00 1.38 1.45 1.44 1.40 1.53 1.48 1.57 1.53 1.47 1.80
201 601 0.00 0.87 0.86 0.86 0.85 0.83 0.90 0.89 0.89 0.87 0.86
202 602 0.04 1.41 1.39 1.39 1.38 1.35 1.46 1.44 1.44 1.42 1.39
203 603 0.00 2.02 1.98 1.99 1.97 1.93 2.08 2.05 2.05 2.02 1.98
204 604 0.00 2.65 2.61 2.61 2.58 2.53 2.73 2.69 2.69 2.65 2.60
205 605 0.00 3.16 3.11 3.12 3.08 3.02 3.26 3.22 3.21 3.17 3.11
206 606 0.00 3.95 3.88 3.89 3.84 3.77 4.07 4.01 4.01 3.95 3.88
207 607 0.04 1.84 1.75 1.69 1.69 1.65 1.90 1.81 1.75 1.76 1.71
208 608 0.04 2.99 2.83 2.74 2.75 2.67 3.08 2.93 2.84 2.85 2.76
209 609 0.00 4.26 4.04 3.91 3.92 3.81 4.39 4.18 4.05 4.07 3.94
210 610 0.00 5.60 5.31 5.14 5.15 5.00 5.77 5.49 5.32 5.34 5.18
211 611 0.00 8.97 8.51 8.24 8.25 8.01 9.25 8.80 8.53 8.56 8.30
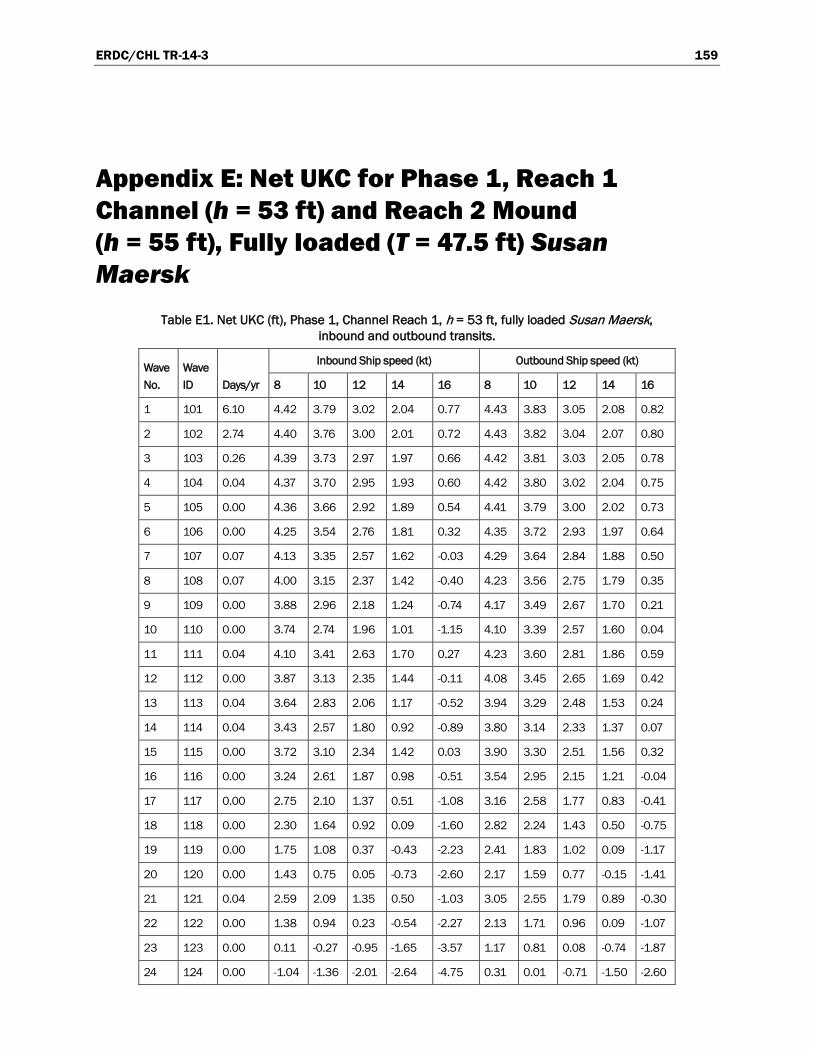
ERDC/CHL TR-14-3 159
Appendix E: Net UKC for Phase 1, Reach 1 Channel (h = 53 ft) and Reach 2 Mound (h = 55 ft), Fully loaded (T = 47.5 ft) Susan Maersk
Table E1. Net UKC (ft), Phase 1, Channel Reach 1, h = 53 ft, fully loaded Susan Maersk, inbound and outbound transits.
Wave No.
Wave ID Days/yr
Inbound Ship speed (kt) Outbound Ship speed (kt)
8 10 12 14 16 8 10 12 14 16
1 101 6.10 4.42 3.79 3.02 2.04 0.77 4.43 3.83 3.05 2.08 0.82
2 102 2.74 4.40 3.76 3.00 2.01 0.72 4.43 3.82 3.04 2.07 0.80
3 103 0.26 4.39 3.73 2.97 1.97 0.66 4.42 3.81 3.03 2.05 0.78
4 104 0.04 4.37 3.70 2.95 1.93 0.60 4.42 3.80 3.02 2.04 0.75
5 105 0.00 4.36 3.66 2.92 1.89 0.54 4.41 3.79 3.00 2.02 0.73
6 106 0.00 4.25 3.54 2.76 1.81 0.32 4.35 3.72 2.93 1.97 0.64
7 107 0.07 4.13 3.35 2.57 1.62 -0.03 4.29 3.64 2.84 1.88 0.50
8 108 0.07 4.00 3.15 2.37 1.42 -0.40 4.23 3.56 2.75 1.79 0.35
9 109 0.00 3.88 2.96 2.18 1.24 -0.74 4.17 3.49 2.67 1.70 0.21
10 110 0.00 3.74 2.74 1.96 1.01 -1.15 4.10 3.39 2.57 1.60 0.04
11 111 0.04 4.10 3.41 2.63 1.70 0.27 4.23 3.60 2.81 1.86 0.59
12 112 0.00 3.87 3.13 2.35 1.44 -0.11 4.08 3.45 2.65 1.69 0.42
13 113 0.04 3.64 2.83 2.06 1.17 -0.52 3.94 3.29 2.48 1.53 0.24
14 114 0.04 3.43 2.57 1.80 0.92 -0.89 3.80 3.14 2.33 1.37 0.07
15 115 0.00 3.72 3.10 2.34 1.42 0.03 3.90 3.30 2.51 1.56 0.32
16 116 0.00 3.24 2.61 1.87 0.98 -0.51 3.54 2.95 2.15 1.21 -0.04
17 117 0.00 2.75 2.10 1.37 0.51 -1.08 3.16 2.58 1.77 0.83 -0.41
18 118 0.00 2.30 1.64 0.92 0.09 -1.60 2.82 2.24 1.43 0.50 -0.75
19 119 0.00 1.75 1.08 0.37 -0.43 -2.23 2.41 1.83 1.02 0.09 -1.17
20 120 0.00 1.43 0.75 0.05 -0.73 -2.60 2.17 1.59 0.77 -0.15 -1.41
21 121 0.04 2.59 2.09 1.35 0.50 -1.03 3.05 2.55 1.79 0.89 -0.30
22 122 0.00 1.38 0.94 0.23 -0.54 -2.27 2.13 1.71 0.96 0.09 -1.07
23 123 0.00 0.11 -0.27 -0.95 -1.65 -3.57 1.17 0.81 0.08 -0.74 -1.87
24 124 0.00 -1.04 -1.36 -2.01 -2.64 -4.75 0.31 0.01 -0.71 -1.50 -2.60
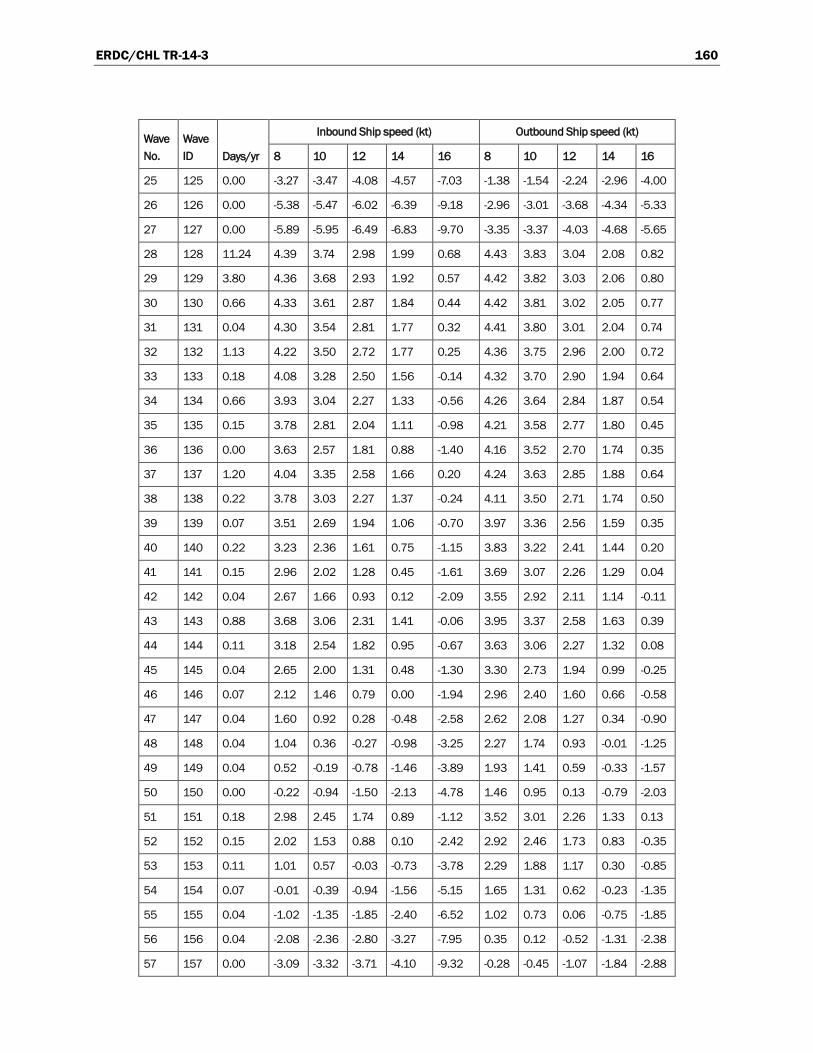
ERDC/CHL TR-14-3 160
Wave No.
Wave ID Days/yr
Inbound Ship speed (kt) Outbound Ship speed (kt)
8 10 12 14 16 8 10 12 14 16
25 125 0.00 -3.27 -3.47 -4.08 -4.57 -7.03 -1.38 -1.54 -2.24 -2.96 -4.00
26 126 0.00 -5.38 -5.47 -6.02 -6.39 -9.18 -2.96 -3.01 -3.68 -4.34 -5.33
27 127 0.00 -5.89 -5.95 -6.49 -6.83 -9.70 -3.35 -3.37 -4.03 -4.68 -5.65
28 128 11.24 4.39 3.74 2.98 1.99 0.68 4.43 3.83 3.04 2.08 0.82
29 129 3.80 4.36 3.68 2.93 1.92 0.57 4.42 3.82 3.03 2.06 0.80
30 130 0.66 4.33 3.61 2.87 1.84 0.44 4.42 3.81 3.02 2.05 0.77
31 131 0.04 4.30 3.54 2.81 1.77 0.32 4.41 3.80 3.01 2.04 0.74
32 132 1.13 4.22 3.50 2.72 1.77 0.25 4.36 3.75 2.96 2.00 0.72
33 133 0.18 4.08 3.28 2.50 1.56 -0.14 4.32 3.70 2.90 1.94 0.64
34 134 0.66 3.93 3.04 2.27 1.33 -0.56 4.26 3.64 2.84 1.87 0.54
35 135 0.15 3.78 2.81 2.04 1.11 -0.98 4.21 3.58 2.77 1.80 0.45
36 136 0.00 3.63 2.57 1.81 0.88 -1.40 4.16 3.52 2.70 1.74 0.35
37 137 1.20 4.04 3.35 2.58 1.66 0.20 4.24 3.63 2.85 1.88 0.64
38 138 0.22 3.78 3.03 2.27 1.37 -0.24 4.11 3.50 2.71 1.74 0.50
39 139 0.07 3.51 2.69 1.94 1.06 -0.70 3.97 3.36 2.56 1.59 0.35
40 140 0.22 3.23 2.36 1.61 0.75 -1.15 3.83 3.22 2.41 1.44 0.20
41 141 0.15 2.96 2.02 1.28 0.45 -1.61 3.69 3.07 2.26 1.29 0.04
42 142 0.04 2.67 1.66 0.93 0.12 -2.09 3.55 2.92 2.11 1.14 -0.11
43 143 0.88 3.68 3.06 2.31 1.41 -0.06 3.95 3.37 2.58 1.63 0.39
44 144 0.11 3.18 2.54 1.82 0.95 -0.67 3.63 3.06 2.27 1.32 0.08
45 145 0.04 2.65 2.00 1.31 0.48 -1.30 3.30 2.73 1.94 0.99 -0.25
46 146 0.07 2.12 1.46 0.79 0.00 -1.94 2.96 2.40 1.60 0.66 -0.58
47 147 0.04 1.60 0.92 0.28 -0.48 -2.58 2.62 2.08 1.27 0.34 -0.90
48 148 0.04 1.04 0.36 -0.27 -0.98 -3.25 2.27 1.74 0.93 -0.01 -1.25
49 149 0.04 0.52 -0.19 -0.78 -1.46 -3.89 1.93 1.41 0.59 -0.33 -1.57
50 150 0.00 -0.22 -0.94 -1.50 -2.13 -4.78 1.46 0.95 0.13 -0.79 -2.03
51 151 0.18 2.98 2.45 1.74 0.89 -1.12 3.52 3.01 2.26 1.33 0.13
52 152 0.15 2.02 1.53 0.88 0.10 -2.42 2.92 2.46 1.73 0.83 -0.35
53 153 0.11 1.01 0.57 -0.03 -0.73 -3.78 2.29 1.88 1.17 0.30 -0.85
54 154 0.07 -0.01 -0.39 -0.94 -1.56 -5.15 1.65 1.31 0.62 -0.23 -1.35
55 155 0.04 -1.02 -1.35 -1.85 -2.40 -6.52 1.02 0.73 0.06 -0.75 -1.85
56 156 0.04 -2.08 -2.36 -2.80 -3.27 -7.95 0.35 0.12 -0.52 -1.31 -2.38
57 157 0.00 -3.09 -3.32 -3.71 -4.10 -9.32 -0.28 -0.45 -1.07 -1.84 -2.88
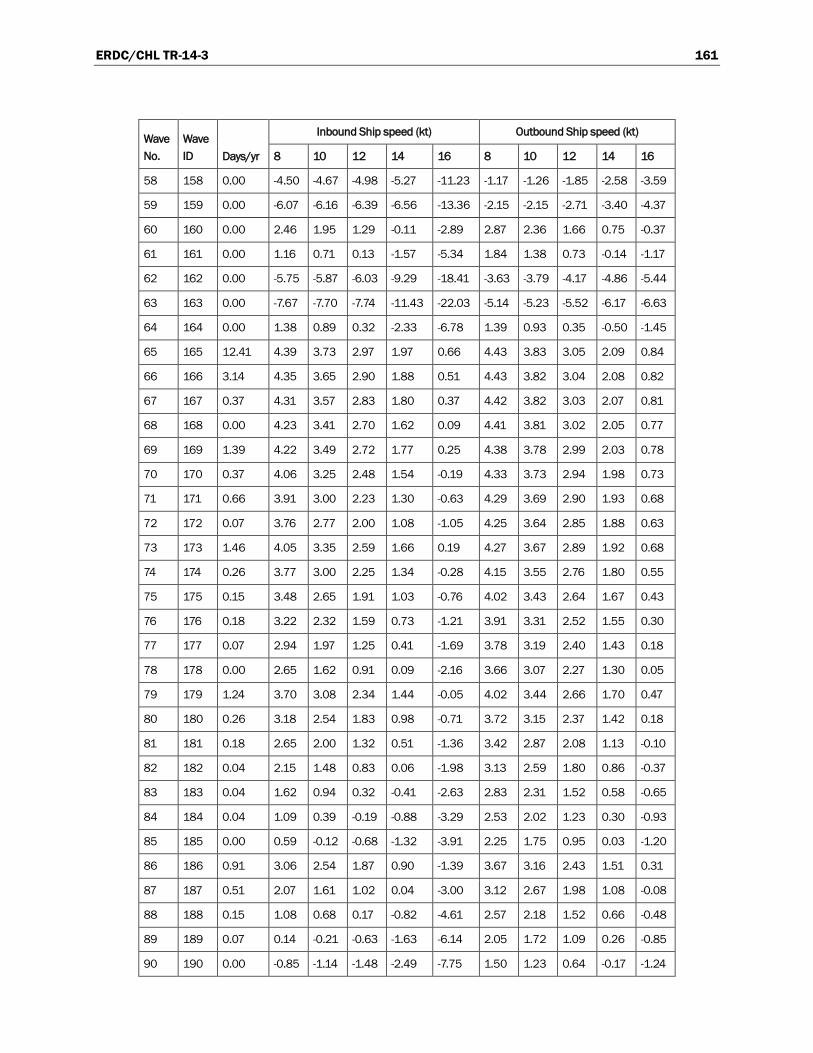
ERDC/CHL TR-14-3 161
Wave No.
Wave ID Days/yr
Inbound Ship speed (kt) Outbound Ship speed (kt)
8 10 12 14 16 8 10 12 14 16
58 158 0.00 -4.50 -4.67 -4.98 -5.27 -11.23 -1.17 -1.26 -1.85 -2.58 -3.59
59 159 0.00 -6.07 -6.16 -6.39 -6.56 -13.36 -2.15 -2.15 -2.71 -3.40 -4.37
60 160 0.00 2.46 1.95 1.29 -0.11 -2.89 2.87 2.36 1.66 0.75 -0.37
61 161 0.00 1.16 0.71 0.13 -1.57 -5.34 1.84 1.38 0.73 -0.14 -1.17
62 162 0.00 -5.75 -5.87 -6.03 -9.29 -18.41 -3.63 -3.79 -4.17 -4.86 -5.44
63 163 0.00 -7.67 -7.70 -7.74 -11.43 -22.03 -5.14 -5.23 -5.52 -6.17 -6.63
64 164 0.00 1.38 0.89 0.32 -2.33 -6.78 1.39 0.93 0.35 -0.50 -1.45
65 165 12.41 4.39 3.73 2.97 1.97 0.66 4.43 3.83 3.05 2.09 0.84
66 166 3.14 4.35 3.65 2.90 1.88 0.51 4.43 3.82 3.04 2.08 0.82
67 167 0.37 4.31 3.57 2.83 1.80 0.37 4.42 3.82 3.03 2.07 0.81
68 168 0.00 4.23 3.41 2.70 1.62 0.09 4.41 3.81 3.02 2.05 0.77
69 169 1.39 4.22 3.49 2.72 1.77 0.25 4.38 3.78 2.99 2.03 0.78
70 170 0.37 4.06 3.25 2.48 1.54 -0.19 4.33 3.73 2.94 1.98 0.73
71 171 0.66 3.91 3.00 2.23 1.30 -0.63 4.29 3.69 2.90 1.93 0.68
72 172 0.07 3.76 2.77 2.00 1.08 -1.05 4.25 3.64 2.85 1.88 0.63
73 173 1.46 4.05 3.35 2.59 1.66 0.19 4.27 3.67 2.89 1.92 0.68
74 174 0.26 3.77 3.00 2.25 1.34 -0.28 4.15 3.55 2.76 1.80 0.55
75 175 0.15 3.48 2.65 1.91 1.03 -0.76 4.02 3.43 2.64 1.67 0.43
76 176 0.18 3.22 2.32 1.59 0.73 -1.21 3.91 3.31 2.52 1.55 0.30
77 177 0.07 2.94 1.97 1.25 0.41 -1.69 3.78 3.19 2.40 1.43 0.18
78 178 0.00 2.65 1.62 0.91 0.09 -2.16 3.66 3.07 2.27 1.30 0.05
79 179 1.24 3.70 3.08 2.34 1.44 -0.05 4.02 3.44 2.66 1.70 0.47
80 180 0.26 3.18 2.54 1.83 0.98 -0.71 3.72 3.15 2.37 1.42 0.18
81 181 0.18 2.65 2.00 1.32 0.51 -1.36 3.42 2.87 2.08 1.13 -0.10
82 182 0.04 2.15 1.48 0.83 0.06 -1.98 3.13 2.59 1.80 0.86 -0.37
83 183 0.04 1.62 0.94 0.32 -0.41 -2.63 2.83 2.31 1.52 0.58 -0.65
84 184 0.04 1.09 0.39 -0.19 -0.88 -3.29 2.53 2.02 1.23 0.30 -0.93
85 185 0.00 0.59 -0.12 -0.68 -1.32 -3.91 2.25 1.75 0.95 0.03 -1.20
86 186 0.91 3.06 2.54 1.87 0.90 -1.39 3.67 3.16 2.43 1.51 0.31
87 187 0.51 2.07 1.61 1.02 0.04 -3.00 3.12 2.67 1.98 1.08 -0.08
88 188 0.15 1.08 0.68 0.17 -0.82 -4.61 2.57 2.18 1.52 0.66 -0.48
89 189 0.07 0.14 -0.21 -0.63 -1.63 -6.14 2.05 1.72 1.09 0.26 -0.85
90 190 0.00 -0.85 -1.14 -1.48 -2.49 -7.75 1.50 1.23 0.64 -0.17 -1.24

ERDC/CHL TR-14-3 162
Wave No.
Wave ID Days/yr
Inbound Ship speed (kt) Outbound Ship speed (kt)
8 10 12 14 16 8 10 12 14 16
91 191 0.15 3.02 2.50 1.87 -0.09 -2.81 3.40 2.89 2.20 1.30 0.16
92 192 0.07 2.00 1.54 1.02 -1.66 -5.44 2.66 2.21 1.59 0.72 -0.35
93 193 0.04 0.98 0.59 0.16 -3.22 -8.07 1.92 1.53 0.98 0.15 -0.85
94 194 0.00 0.01 -0.32 -0.65 -4.71 -10.56 1.22 0.89 0.40 -0.39 -1.33
95 195 0.00 2.76 2.25 1.07 -2.53 -6.20 2.73 2.25 1.65 0.78 -0.28
96 196 0.00 1.56 1.11 -0.35 -5.84 -11.25 1.50 1.12 0.65 -0.16 -1.10
97 197 11.86 4.39 3.73 2.97 1.98 0.66 4.43 3.83 3.05 2.08 0.83
98 198 3.07 4.35 3.65 2.90 1.89 0.52 4.43 3.82 3.04 2.07 0.81
99 199 0.58 4.31 3.57 2.84 1.80 0.37 4.42 3.81 3.03 2.06 0.79
100 200 0.04 4.27 3.49 2.77 1.71 0.24 4.41 3.81 3.02 2.05 0.77
101 201 1.10 4.22 3.50 2.72 1.77 0.25 4.38 3.77 2.99 2.02 0.77
102 202 0.29 4.07 3.25 2.48 1.54 -0.18 4.33 3.72 2.93 1.97 0.71
103 203 0.47 3.91 3.01 2.24 1.31 -0.62 4.29 3.68 2.88 1.91 0.64
104 204 0.07 3.76 2.78 2.01 1.09 -1.03 4.24 3.63 2.83 1.86 0.58
105 205 0.00 3.61 2.55 1.79 0.87 -1.45 4.20 3.58 2.78 1.81 0.52
106 206 0.88 4.05 3.36 2.59 1.66 0.20 4.26 3.66 2.88 1.92 0.67
107 207 0.15 3.77 3.01 2.25 1.35 -0.27 4.14 3.54 2.75 1.79 0.54
108 208 0.11 3.49 2.66 1.91 1.03 -0.75 4.01 3.41 2.62 1.65 0.41
109 209 0.15 3.22 2.33 1.59 0.73 -1.20 3.89 3.29 2.50 1.53 0.28
110 210 0.07 2.96 2.00 1.27 0.43 -1.65 3.77 3.17 2.38 1.41 0.16
111 211 0.00 2.62 1.59 0.87 0.06 -2.21 3.62 3.02 2.22 1.25 0.00
112 212 0.62 3.70 3.08 2.34 1.44 -0.05 4.01 3.43 2.64 1.69 0.45
113 213 0.26 3.18 2.54 1.83 0.97 -0.70 3.70 3.13 2.35 1.40 0.16
114 214 0.15 2.65 2.00 1.32 0.50 -1.35 3.39 2.84 2.05 1.10 -0.13
115 215 0.11 2.15 1.48 0.83 0.05 -1.97 3.10 2.56 1.76 0.82 -0.41
116 216 0.00 1.65 0.97 0.34 -0.40 -2.59 2.80 2.28 1.48 0.54 -0.69
117 217 0.00 1.01 0.32 -0.27 -0.96 -3.37 2.43 1.92 1.12 0.19 -1.04
118 218 0.73 3.06 2.54 1.86 0.92 -1.30 3.65 3.13 2.40 1.48 0.28
119 219 0.22 2.07 1.60 1.00 0.08 -2.84 3.09 2.63 1.92 1.03 -0.14
120 220 0.11 1.08 0.67 0.14 -0.77 -4.38 2.52 2.13 1.45 0.58 -0.56
121 221 0.07 0.14 -0.22 -0.68 -1.57 -5.85 1.98 1.65 1.00 0.16 -0.95
122 222 0.04 -0.80 -1.10 -1.49 -2.37 -7.31 1.45 1.17 0.55 -0.26 -1.35
123 223 0.00 -1.99 -2.22 -2.53 -3.38 -9.17 0.77 0.56 -0.02 -0.80 -1.85
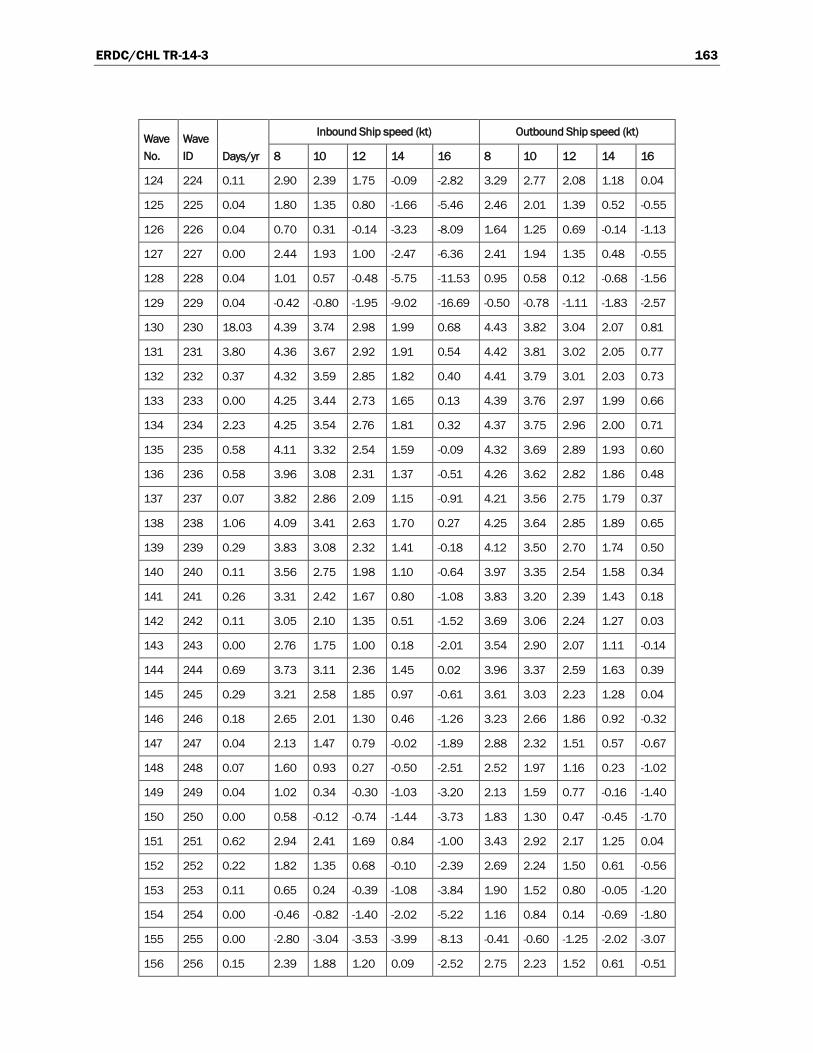
ERDC/CHL TR-14-3 163
Wave No.
Wave ID Days/yr
Inbound Ship speed (kt) Outbound Ship speed (kt)
8 10 12 14 16 8 10 12 14 16
124 224 0.11 2.90 2.39 1.75 -0.09 -2.82 3.29 2.77 2.08 1.18 0.04
125 225 0.04 1.80 1.35 0.80 -1.66 -5.46 2.46 2.01 1.39 0.52 -0.55
126 226 0.04 0.70 0.31 -0.14 -3.23 -8.09 1.64 1.25 0.69 -0.14 -1.13
127 227 0.00 2.44 1.93 1.00 -2.47 -6.36 2.41 1.94 1.35 0.48 -0.55
128 228 0.04 1.01 0.57 -0.48 -5.75 -11.53 0.95 0.58 0.12 -0.68 -1.56
129 229 0.04 -0.42 -0.80 -1.95 -9.02 -16.69 -0.50 -0.78 -1.11 -1.83 -2.57
130 230 18.03 4.39 3.74 2.98 1.99 0.68 4.43 3.82 3.04 2.07 0.81
131 231 3.80 4.36 3.67 2.92 1.91 0.54 4.42 3.81 3.02 2.05 0.77
132 232 0.37 4.32 3.59 2.85 1.82 0.40 4.41 3.79 3.01 2.03 0.73
133 233 0.00 4.25 3.44 2.73 1.65 0.13 4.39 3.76 2.97 1.99 0.66
134 234 2.23 4.25 3.54 2.76 1.81 0.32 4.37 3.75 2.96 2.00 0.71
135 235 0.58 4.11 3.32 2.54 1.59 -0.09 4.32 3.69 2.89 1.93 0.60
136 236 0.58 3.96 3.08 2.31 1.37 -0.51 4.26 3.62 2.82 1.86 0.48
137 237 0.07 3.82 2.86 2.09 1.15 -0.91 4.21 3.56 2.75 1.79 0.37
138 238 1.06 4.09 3.41 2.63 1.70 0.27 4.25 3.64 2.85 1.89 0.65
139 239 0.29 3.83 3.08 2.32 1.41 -0.18 4.12 3.50 2.70 1.74 0.50
140 240 0.11 3.56 2.75 1.98 1.10 -0.64 3.97 3.35 2.54 1.58 0.34
141 241 0.26 3.31 2.42 1.67 0.80 -1.08 3.83 3.20 2.39 1.43 0.18
142 242 0.11 3.05 2.10 1.35 0.51 -1.52 3.69 3.06 2.24 1.27 0.03
143 243 0.00 2.76 1.75 1.00 0.18 -2.01 3.54 2.90 2.07 1.11 -0.14
144 244 0.69 3.73 3.11 2.36 1.45 0.02 3.96 3.37 2.59 1.63 0.39
145 245 0.29 3.21 2.58 1.85 0.97 -0.61 3.61 3.03 2.23 1.28 0.04
146 246 0.18 2.65 2.01 1.30 0.46 -1.26 3.23 2.66 1.86 0.92 -0.32
147 247 0.04 2.13 1.47 0.79 -0.02 -1.89 2.88 2.32 1.51 0.57 -0.67
148 248 0.07 1.60 0.93 0.27 -0.50 -2.51 2.52 1.97 1.16 0.23 -1.02
149 249 0.04 1.02 0.34 -0.30 -1.03 -3.20 2.13 1.59 0.77 -0.16 -1.40
150 250 0.00 0.58 -0.12 -0.74 -1.44 -3.73 1.83 1.30 0.47 -0.45 -1.70
151 251 0.62 2.94 2.41 1.69 0.84 -1.00 3.43 2.92 2.17 1.25 0.04
152 252 0.22 1.82 1.35 0.68 -0.10 -2.39 2.69 2.24 1.50 0.61 -0.56
153 253 0.11 0.65 0.24 -0.39 -1.08 -3.84 1.90 1.52 0.80 -0.05 -1.20
154 254 0.00 -0.46 -0.82 -1.40 -2.02 -5.22 1.16 0.84 0.14 -0.69 -1.80
155 255 0.00 -2.80 -3.04 -3.53 -3.99 -8.13 -0.41 -0.60 -1.25 -2.02 -3.07
156 256 0.15 2.39 1.88 1.20 0.09 -2.52 2.75 2.23 1.52 0.61 -0.51
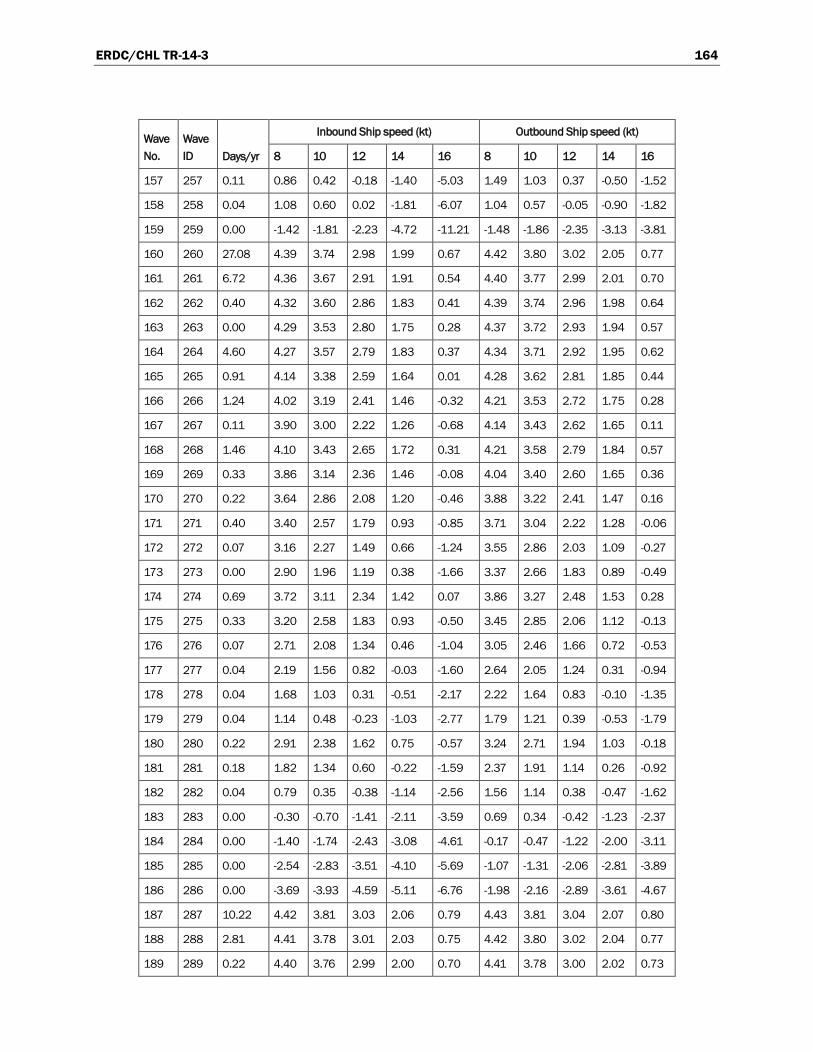
ERDC/CHL TR-14-3 164
Wave No.
Wave ID Days/yr
Inbound Ship speed (kt) Outbound Ship speed (kt)
8 10 12 14 16 8 10 12 14 16
157 257 0.11 0.86 0.42 -0.18 -1.40 -5.03 1.49 1.03 0.37 -0.50 -1.52
158 258 0.04 1.08 0.60 0.02 -1.81 -6.07 1.04 0.57 -0.05 -0.90 -1.82
159 259 0.00 -1.42 -1.81 -2.23 -4.72 -11.21 -1.48 -1.86 -2.35 -3.13 -3.81
160 260 27.08 4.39 3.74 2.98 1.99 0.67 4.42 3.80 3.02 2.05 0.77
161 261 6.72 4.36 3.67 2.91 1.91 0.54 4.40 3.77 2.99 2.01 0.70
162 262 0.40 4.32 3.60 2.86 1.83 0.41 4.39 3.74 2.96 1.98 0.64
163 263 0.00 4.29 3.53 2.80 1.75 0.28 4.37 3.72 2.93 1.94 0.57
164 264 4.60 4.27 3.57 2.79 1.83 0.37 4.34 3.71 2.92 1.95 0.62
165 265 0.91 4.14 3.38 2.59 1.64 0.01 4.28 3.62 2.81 1.85 0.44
166 266 1.24 4.02 3.19 2.41 1.46 -0.32 4.21 3.53 2.72 1.75 0.28
167 267 0.11 3.90 3.00 2.22 1.26 -0.68 4.14 3.43 2.62 1.65 0.11
168 268 1.46 4.10 3.43 2.65 1.72 0.31 4.21 3.58 2.79 1.84 0.57
169 269 0.33 3.86 3.14 2.36 1.46 -0.08 4.04 3.40 2.60 1.65 0.36
170 270 0.22 3.64 2.86 2.08 1.20 -0.46 3.88 3.22 2.41 1.47 0.16
171 271 0.40 3.40 2.57 1.79 0.93 -0.85 3.71 3.04 2.22 1.28 -0.06
172 272 0.07 3.16 2.27 1.49 0.66 -1.24 3.55 2.86 2.03 1.09 -0.27
173 273 0.00 2.90 1.96 1.19 0.38 -1.66 3.37 2.66 1.83 0.89 -0.49
174 274 0.69 3.72 3.11 2.34 1.42 0.07 3.86 3.27 2.48 1.53 0.28
175 275 0.33 3.20 2.58 1.83 0.93 -0.50 3.45 2.85 2.06 1.12 -0.13
176 276 0.07 2.71 2.08 1.34 0.46 -1.04 3.05 2.46 1.66 0.72 -0.53
177 277 0.04 2.19 1.56 0.82 -0.03 -1.60 2.64 2.05 1.24 0.31 -0.94
178 278 0.04 1.68 1.03 0.31 -0.51 -2.17 2.22 1.64 0.83 -0.10 -1.35
179 279 0.04 1.14 0.48 -0.23 -1.03 -2.77 1.79 1.21 0.39 -0.53 -1.79
180 280 0.22 2.91 2.38 1.62 0.75 -0.57 3.24 2.71 1.94 1.03 -0.18
181 281 0.18 1.82 1.34 0.60 -0.22 -1.59 2.37 1.91 1.14 0.26 -0.92
182 282 0.04 0.79 0.35 -0.38 -1.14 -2.56 1.56 1.14 0.38 -0.47 -1.62
183 283 0.00 -0.30 -0.70 -1.41 -2.11 -3.59 0.69 0.34 -0.42 -1.23 -2.37
184 284 0.00 -1.40 -1.74 -2.43 -3.08 -4.61 -0.17 -0.47 -1.22 -2.00 -3.11
185 285 0.00 -2.54 -2.83 -3.51 -4.10 -5.69 -1.07 -1.31 -2.06 -2.81 -3.89
186 286 0.00 -3.69 -3.93 -4.59 -5.11 -6.76 -1.98 -2.16 -2.89 -3.61 -4.67
187 287 10.22 4.42 3.81 3.03 2.06 0.79 4.43 3.81 3.04 2.07 0.80
188 288 2.81 4.41 3.78 3.01 2.03 0.75 4.42 3.80 3.02 2.04 0.77
189 289 0.22 4.40 3.76 2.99 2.00 0.70 4.41 3.78 3.00 2.02 0.73

ERDC/CHL TR-14-3 165
Wave No.
Wave ID Days/yr
Inbound Ship speed (kt) Outbound Ship speed (kt)
8 10 12 14 16 8 10 12 14 16
190 290 0.00 4.39 3.74 2.97 1.97 0.65 4.40 3.76 2.99 1.99 0.69
191 291 0.00 4.38 3.71 2.95 1.95 0.61 4.39 3.74 2.97 1.97 0.65
192 292 0.18 4.29 3.61 2.83 1.86 0.44 4.31 3.65 2.86 1.90 0.51
193 293 0.18 4.19 3.47 2.68 1.72 0.18 4.23 3.53 2.74 1.77 0.29
194 294 0.29 4.09 3.32 2.52 1.56 -0.11 4.14 3.40 2.60 1.63 0.05
195 295 0.00 3.98 3.15 2.35 1.39 -0.41 4.05 3.27 2.45 1.49 -0.21
196 296 0.04 4.13 3.47 2.68 1.75 0.38 4.15 3.51 2.72 1.78 0.45
197 297 0.04 3.93 3.24 2.45 1.54 0.09 3.98 3.31 2.51 1.58 0.20
198 298 0.04 3.72 2.98 2.19 1.30 -0.24 3.78 3.08 2.27 1.35 -0.09
199 299 0.07 3.49 2.72 1.92 1.04 -0.59 3.57 2.84 2.03 1.12 -0.38
200 300 0.00 3.31 2.50 1.69 0.84 -0.87 3.41 2.65 1.83 0.93 -0.62
201 301 0.00 3.73 3.12 2.34 1.41 0.16 3.76 3.16 2.38 1.43 0.19
202 302 0.04 3.28 2.67 1.89 0.97 -0.28 3.34 2.74 1.95 1.02 -0.23
203 303 0.00 2.79 2.18 1.40 0.49 -0.76 2.88 2.27 1.48 0.56 -0.69
204 304 0.00 2.27 1.65 0.88 -0.01 -1.27 2.39 1.78 0.98 0.08 -1.18
205 305 0.00 1.85 1.23 0.46 -0.42 -1.69 1.99 1.38 0.58 -0.31 -1.58
206 306 0.00 1.21 0.58 -0.19 -1.04 -2.32 1.38 0.77 -0.03 -0.91 -2.18
207 307 0.04 2.75 2.24 1.47 0.59 -0.61 2.85 2.34 1.56 0.67 -0.53
208 308 0.04 1.71 1.25 0.48 -0.35 -1.52 1.86 1.41 0.63 -0.22 -1.39
209 309 0.00 0.54 0.14 -0.62 -1.40 -2.53 0.76 0.37 -0.40 -1.20 -2.34
210 310 0.00 -0.68 -1.02 -1.78 -2.50 -3.60 -0.39 -0.72 -1.49 -2.24 -3.35
211 311 0.00 -3.77 -3.94 -4.69 -5.27 -6.29 -3.30 -3.47 -4.23 -4.85 -5.88
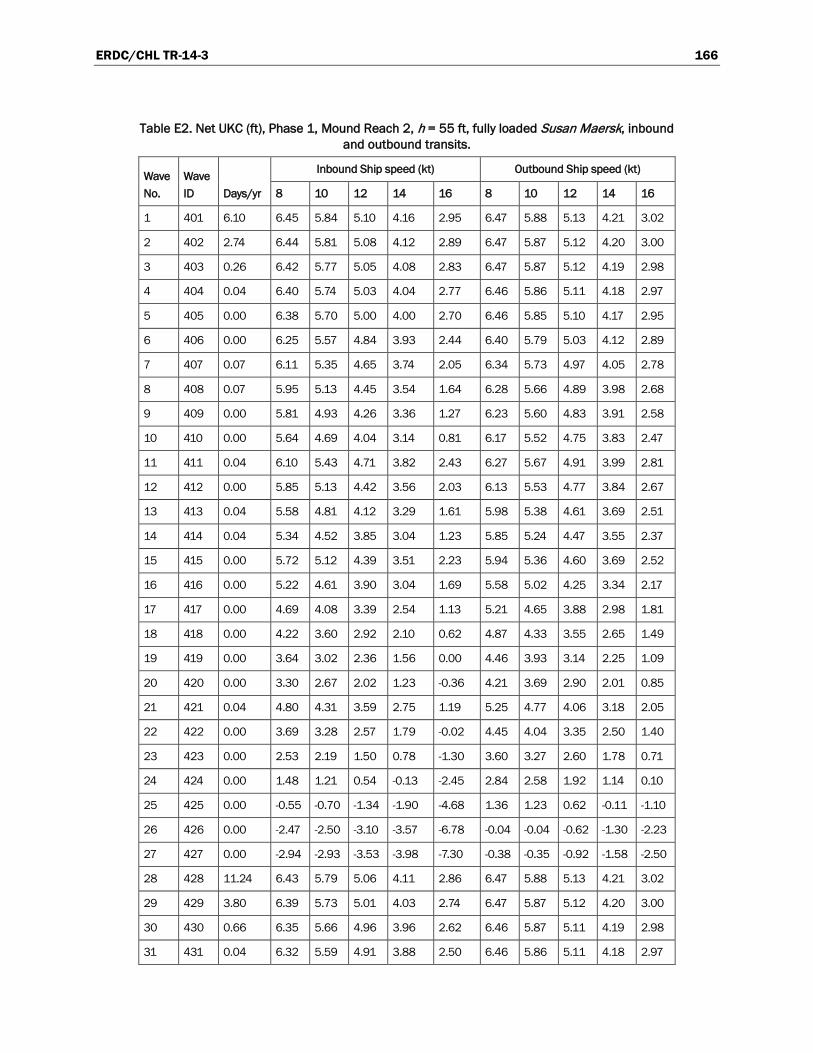
ERDC/CHL TR-14-3 166
Table E2. Net UKC (ft), Phase 1, Mound Reach 2, h = 55 ft, fully loaded Susan Maersk, inbound and outbound transits.
Wave No.
Wave ID Days/yr
Inbound Ship speed (kt) Outbound Ship speed (kt)
8 10 12 14 16 8 10 12 14 16
1 401 6.10 6.45 5.84 5.10 4.16 2.95 6.47 5.88 5.13 4.21 3.02
2 402 2.74 6.44 5.81 5.08 4.12 2.89 6.47 5.87 5.12 4.20 3.00
3 403 0.26 6.42 5.77 5.05 4.08 2.83 6.47 5.87 5.12 4.19 2.98
4 404 0.04 6.40 5.74 5.03 4.04 2.77 6.46 5.86 5.11 4.18 2.97
5 405 0.00 6.38 5.70 5.00 4.00 2.70 6.46 5.85 5.10 4.17 2.95
6 406 0.00 6.25 5.57 4.84 3.93 2.44 6.40 5.79 5.03 4.12 2.89
7 407 0.07 6.11 5.35 4.65 3.74 2.05 6.34 5.73 4.97 4.05 2.78
8 408 0.07 5.95 5.13 4.45 3.54 1.64 6.28 5.66 4.89 3.98 2.68
9 409 0.00 5.81 4.93 4.26 3.36 1.27 6.23 5.60 4.83 3.91 2.58
10 410 0.00 5.64 4.69 4.04 3.14 0.81 6.17 5.52 4.75 3.83 2.47
11 411 0.04 6.10 5.43 4.71 3.82 2.43 6.27 5.67 4.91 3.99 2.81
12 412 0.00 5.85 5.13 4.42 3.56 2.03 6.13 5.53 4.77 3.84 2.67
13 413 0.04 5.58 4.81 4.12 3.29 1.61 5.98 5.38 4.61 3.69 2.51
14 414 0.04 5.34 4.52 3.85 3.04 1.23 5.85 5.24 4.47 3.55 2.37
15 415 0.00 5.72 5.12 4.39 3.51 2.23 5.94 5.36 4.60 3.69 2.52
16 416 0.00 5.22 4.61 3.90 3.04 1.69 5.58 5.02 4.25 3.34 2.17
17 417 0.00 4.69 4.08 3.39 2.54 1.13 5.21 4.65 3.88 2.98 1.81
18 418 0.00 4.22 3.60 2.92 2.10 0.62 4.87 4.33 3.55 2.65 1.49
19 419 0.00 3.64 3.02 2.36 1.56 0.00 4.46 3.93 3.14 2.25 1.09
20 420 0.00 3.30 2.67 2.02 1.23 -0.36 4.21 3.69 2.90 2.01 0.85
21 421 0.04 4.80 4.31 3.59 2.75 1.19 5.25 4.77 4.06 3.18 2.05
22 422 0.00 3.69 3.28 2.57 1.79 -0.02 4.45 4.04 3.35 2.50 1.40
23 423 0.00 2.53 2.19 1.50 0.78 -1.30 3.60 3.27 2.60 1.78 0.71
24 424 0.00 1.48 1.21 0.54 -0.13 -2.45 2.84 2.58 1.92 1.14 0.10
25 425 0.00 -0.55 -0.70 -1.34 -1.90 -4.68 1.36 1.23 0.62 -0.11 -1.10
26 426 0.00 -2.47 -2.50 -3.10 -3.57 -6.78 -0.04 -0.04 -0.62 -1.30 -2.23
27 427 0.00 -2.94 -2.93 -3.53 -3.98 -7.30 -0.38 -0.35 -0.92 -1.58 -2.50
28 428 11.24 6.43 5.79 5.06 4.11 2.86 6.47 5.88 5.13 4.21 3.02
29 429 3.80 6.39 5.73 5.01 4.03 2.74 6.47 5.87 5.12 4.20 3.00
30 430 0.66 6.35 5.66 4.96 3.96 2.62 6.46 5.87 5.11 4.19 2.98
31 431 0.04 6.32 5.59 4.91 3.88 2.50 6.46 5.86 5.11 4.18 2.97

ERDC/CHL TR-14-3 167
Wave No.
Wave ID Days/yr
Inbound Ship speed (kt) Outbound Ship speed (kt)
8 10 12 14 16 8 10 12 14 16
32 432 1.13 6.23 5.53 4.82 3.91 2.38 6.41 5.81 5.06 4.14 2.95
33 433 0.18 6.07 5.30 4.60 3.70 1.95 6.36 5.76 5.01 4.08 2.90
34 434 0.66 5.89 5.06 4.38 3.49 1.50 6.31 5.71 4.95 4.03 2.84
35 435 0.15 5.72 4.81 4.16 3.27 1.05 6.26 5.66 4.89 3.97 2.78
36 436 0.00 5.55 4.57 3.93 3.06 0.59 6.21 5.61 4.84 3.91 2.71
37 437 1.20 6.05 5.38 4.67 3.79 2.38 6.27 5.69 4.93 4.01 2.83
38 438 0.22 5.77 5.05 4.36 3.51 1.95 6.14 5.55 4.80 3.87 2.69
39 439 0.07 5.47 4.70 4.04 3.21 1.49 6.00 5.41 4.65 3.73 2.55
40 440 0.22 5.18 4.35 3.71 2.91 1.03 5.86 5.27 4.51 3.59 2.40
41 441 0.15 4.88 4.01 3.39 2.62 0.58 5.71 5.13 4.37 3.44 2.26
42 442 0.04 4.57 3.64 3.05 2.31 0.10 5.56 4.98 4.22 3.29 2.10
43 443 0.88 5.69 5.09 4.38 3.50 2.17 5.98 5.41 4.66 3.75 2.57
44 444 0.11 5.17 4.57 3.88 3.02 1.60 5.65 5.10 4.34 3.44 2.27
45 445 0.04 4.63 4.02 3.35 2.52 1.01 5.31 4.77 4.01 3.11 1.95
46 446 0.07 4.08 3.47 2.83 2.02 0.41 4.96 4.44 3.68 2.78 1.63
47 447 0.04 3.54 2.93 2.30 1.52 -0.19 4.61 4.11 3.35 2.46 1.31
48 448 0.04 2.96 2.35 1.75 1.00 -0.82 4.25 3.77 3.00 2.11 0.97
49 449 0.04 2.42 1.80 1.23 0.50 -1.42 3.90 3.44 2.67 1.79 0.65
50 450 0.00 1.65 1.03 0.49 -0.20 -2.26 3.42 2.97 2.20 1.33 0.20
51 451 0.18 5.18 4.68 3.99 3.15 1.25 5.66 5.16 4.45 3.57 2.43
52 452 0.15 4.32 3.88 3.23 2.45 0.08 5.12 4.68 4.00 3.15 2.03
53 453 0.11 3.42 3.04 2.44 1.72 -1.15 4.55 4.17 3.53 2.70 1.61
54 454 0.07 2.52 2.20 1.65 0.98 -2.39 3.98 3.66 3.05 2.25 1.19
55 455 0.04 1.62 1.37 0.85 0.24 -3.62 3.41 3.16 2.58 1.80 0.77
56 456 0.04 0.67 0.49 0.02 -0.53 -4.92 2.81 2.63 2.08 1.33 0.33
57 457 0.00 -0.23 -0.35 -0.78 -1.27 -6.15 2.25 2.12 1.61 0.88 -0.09
58 458 0.00 -1.49 -1.52 -1.89 -2.30 -7.88 1.45 1.41 0.94 0.26 -0.68
59 459 0.00 -2.89 -2.82 -3.12 -3.44 -9.79 0.57 0.63 0.21 -0.44 -1.33
60 460 0.00 4.97 4.49 3.83 2.30 -0.18 5.23 4.73 4.08 3.21 2.13
61 461 0.00 3.97 3.56 2.98 1.04 -2.30 4.42 3.97 3.38 2.55 1.53
62 462 0.00 -1.31 -1.33 -1.57 -5.67 -13.54 0.07 -0.06 -0.34 -0.97 -1.65
63 463 0.00 -2.77 -2.69 -2.83 -7.53 -16.66 -1.14 -1.18 -1.37 -1.95 -2.53
64 464 0.00 4.57 4.07 3.25 0.32 -3.24 4.31 3.84 3.27 2.45 1.46

ERDC/CHL TR-14-3 168
Wave No.
Wave ID Days/yr
Inbound Ship speed (kt) Outbound Ship speed (kt)
8 10 12 14 16 8 10 12 14 16
65 465 12.41 6.42 5.78 5.06 4.10 2.84 6.47 5.88 5.13 4.21 3.02
66 466 3.14 6.38 5.70 4.99 4.01 2.70 6.47 5.87 5.12 4.20 3.00
67 467 0.37 6.33 5.63 4.93 3.92 2.56 6.46 5.87 5.11 4.19 2.99
68 468 0.00 6.25 5.47 4.82 3.75 2.29 6.45 5.85 5.10 4.18 2.96
69 469 1.39 6.24 5.54 4.83 3.92 2.40 6.41 5.82 5.07 4.14 2.96
70 470 0.37 6.06 5.30 4.60 3.70 1.94 6.36 5.77 5.01 4.09 2.91
71 471 0.66 5.89 5.05 4.37 3.49 1.48 6.32 5.72 4.96 4.04 2.86
72 472 0.07 5.72 4.81 4.16 3.28 1.05 6.27 5.67 4.91 3.99 2.81
73 473 1.46 6.06 5.40 4.68 3.80 2.40 6.29 5.70 4.95 4.03 2.84
74 474 0.26 5.77 5.05 4.36 3.51 1.94 6.15 5.56 4.81 3.89 2.70
75 475 0.15 5.47 4.70 4.03 3.21 1.48 6.01 5.43 4.67 3.75 2.57
76 476 0.18 5.19 4.36 3.72 2.93 1.04 5.88 5.30 4.54 3.62 2.43
77 477 0.07 4.89 4.01 3.40 2.63 0.58 5.74 5.16 4.40 3.48 2.29
78 478 0.00 4.59 3.66 3.07 2.33 0.13 5.60 5.03 4.26 3.34 2.15
79 479 1.24 5.72 5.12 4.41 3.53 2.20 6.01 5.44 4.69 3.78 2.61
80 480 0.26 5.17 4.57 3.88 3.03 1.60 5.67 5.12 4.37 3.46 2.29
81 481 0.18 4.63 4.03 3.36 2.53 1.00 5.33 4.80 4.05 3.14 1.98
82 482 0.04 4.11 3.50 2.86 2.06 0.43 5.01 4.50 3.74 2.84 1.69
83 483 0.04 3.57 2.96 2.34 1.56 -0.17 4.68 4.18 3.42 2.53 1.38
84 484 0.04 3.02 2.41 1.82 1.06 -0.77 4.34 3.86 3.09 2.21 1.07
85 485 0.00 2.50 1.89 1.32 0.59 -1.34 4.02 3.55 2.79 1.91 0.77
86 486 0.91 5.12 4.64 3.96 3.12 1.09 5.63 5.14 4.44 3.56 2.43
87 487 0.51 4.15 3.75 3.12 2.32 -0.31 5.02 4.60 3.94 3.09 1.99
88 488 0.15 3.18 2.86 2.27 1.53 -1.70 4.41 4.06 3.44 2.63 1.56
89 489 0.07 2.26 2.01 1.47 0.78 -3.03 3.83 3.54 2.96 2.18 1.14
90 490 0.00 1.29 1.12 0.63 -0.01 -4.43 3.21 3.00 2.46 1.71 0.71
91 491 0.15 5.13 4.64 4.00 2.37 -0.06 5.39 4.88 4.23 3.36 2.27
92 492 0.07 4.16 3.75 3.18 1.06 -2.28 4.60 4.16 3.57 2.75 1.72
93 493 0.04 3.19 2.86 2.37 -0.26 -4.51 3.82 3.45 2.92 2.13 1.18
94 494 0.00 2.27 2.02 1.59 -1.52 -6.62 3.08 2.76 2.30 1.55 0.66
95 495 0.00 4.91 4.41 3.39 0.43 -2.92 4.68 4.22 3.63 2.80 1.79
96 496 0.00 3.80 3.36 2.13 -2.29 -7.17 3.40 3.02 2.55 1.79 0.90
97 497 11.86 6.42 5.79 5.06 4.10 2.85 6.47 5.87 5.12 4.20 3.00
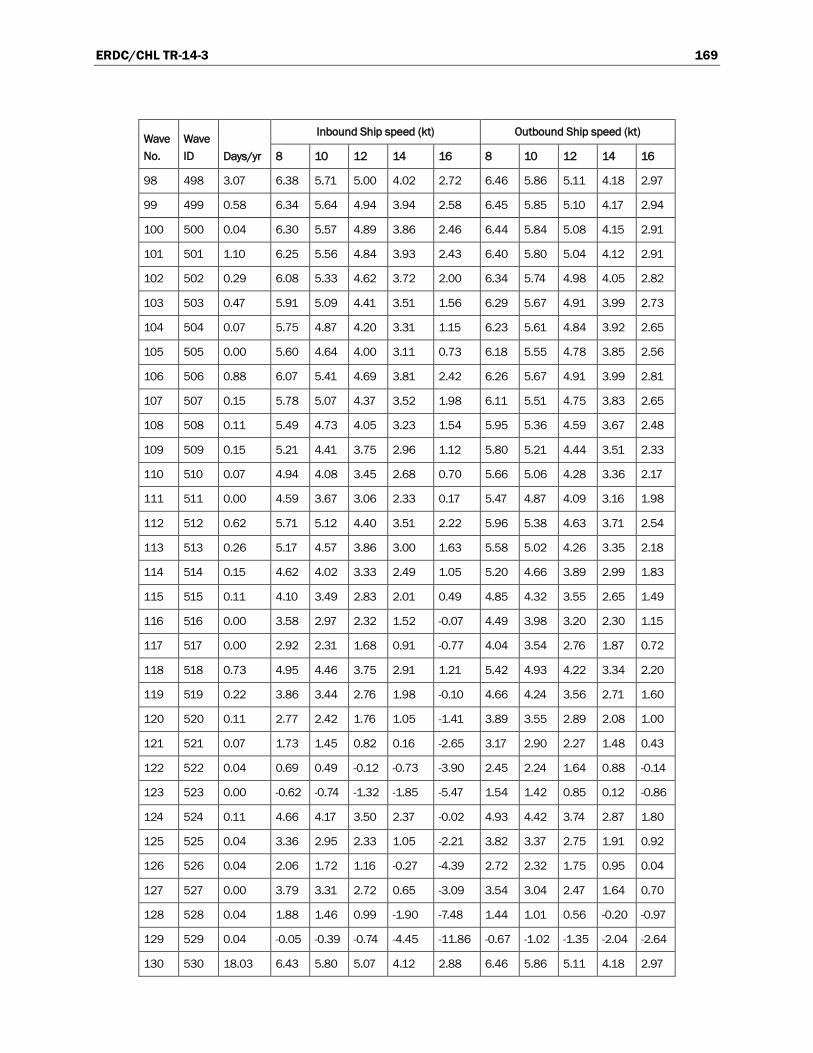
ERDC/CHL TR-14-3 169
Wave No.
Wave ID Days/yr
Inbound Ship speed (kt) Outbound Ship speed (kt)
8 10 12 14 16 8 10 12 14 16
98 498 3.07 6.38 5.71 5.00 4.02 2.72 6.46 5.86 5.11 4.18 2.97
99 499 0.58 6.34 5.64 4.94 3.94 2.58 6.45 5.85 5.10 4.17 2.94
100 500 0.04 6.30 5.57 4.89 3.86 2.46 6.44 5.84 5.08 4.15 2.91
101 501 1.10 6.25 5.56 4.84 3.93 2.43 6.40 5.80 5.04 4.12 2.91
102 502 0.29 6.08 5.33 4.62 3.72 2.00 6.34 5.74 4.98 4.05 2.82
103 503 0.47 5.91 5.09 4.41 3.51 1.56 6.29 5.67 4.91 3.99 2.73
104 504 0.07 5.75 4.87 4.20 3.31 1.15 6.23 5.61 4.84 3.92 2.65
105 505 0.00 5.60 4.64 4.00 3.11 0.73 6.18 5.55 4.78 3.85 2.56
106 506 0.88 6.07 5.41 4.69 3.81 2.42 6.26 5.67 4.91 3.99 2.81
107 507 0.15 5.78 5.07 4.37 3.52 1.98 6.11 5.51 4.75 3.83 2.65
108 508 0.11 5.49 4.73 4.05 3.23 1.54 5.95 5.36 4.59 3.67 2.48
109 509 0.15 5.21 4.41 3.75 2.96 1.12 5.80 5.21 4.44 3.51 2.33
110 510 0.07 4.94 4.08 3.45 2.68 0.70 5.66 5.06 4.28 3.36 2.17
111 511 0.00 4.59 3.67 3.06 2.33 0.17 5.47 4.87 4.09 3.16 1.98
112 512 0.62 5.71 5.12 4.40 3.51 2.22 5.96 5.38 4.63 3.71 2.54
113 513 0.26 5.17 4.57 3.86 3.00 1.63 5.58 5.02 4.26 3.35 2.18
114 514 0.15 4.62 4.02 3.33 2.49 1.05 5.20 4.66 3.89 2.99 1.83
115 515 0.11 4.10 3.49 2.83 2.01 0.49 4.85 4.32 3.55 2.65 1.49
116 516 0.00 3.58 2.97 2.32 1.52 -0.07 4.49 3.98 3.20 2.30 1.15
117 517 0.00 2.92 2.31 1.68 0.91 -0.77 4.04 3.54 2.76 1.87 0.72
118 518 0.73 4.95 4.46 3.75 2.91 1.21 5.42 4.93 4.22 3.34 2.20
119 519 0.22 3.86 3.44 2.76 1.98 -0.10 4.66 4.24 3.56 2.71 1.60
120 520 0.11 2.77 2.42 1.76 1.05 -1.41 3.89 3.55 2.89 2.08 1.00
121 521 0.07 1.73 1.45 0.82 0.16 -2.65 3.17 2.90 2.27 1.48 0.43
122 522 0.04 0.69 0.49 -0.12 -0.73 -3.90 2.45 2.24 1.64 0.88 -0.14
123 523 0.00 -0.62 -0.74 -1.32 -1.85 -5.47 1.54 1.42 0.85 0.12 -0.86
124 524 0.11 4.66 4.17 3.50 2.37 -0.02 4.93 4.42 3.74 2.87 1.80
125 525 0.04 3.36 2.95 2.33 1.05 -2.21 3.82 3.37 2.75 1.91 0.92
126 526 0.04 2.06 1.72 1.16 -0.27 -4.39 2.72 2.32 1.75 0.95 0.04
127 527 0.00 3.79 3.31 2.72 0.65 -3.09 3.54 3.04 2.47 1.64 0.70
128 528 0.04 1.88 1.46 0.99 -1.90 -7.48 1.44 1.01 0.56 -0.20 -0.97
129 529 0.04 -0.05 -0.39 -0.74 -4.45 -11.86 -0.67 -1.02 -1.35 -2.04 -2.64
130 530 18.03 6.43 5.80 5.07 4.12 2.88 6.46 5.86 5.11 4.18 2.97
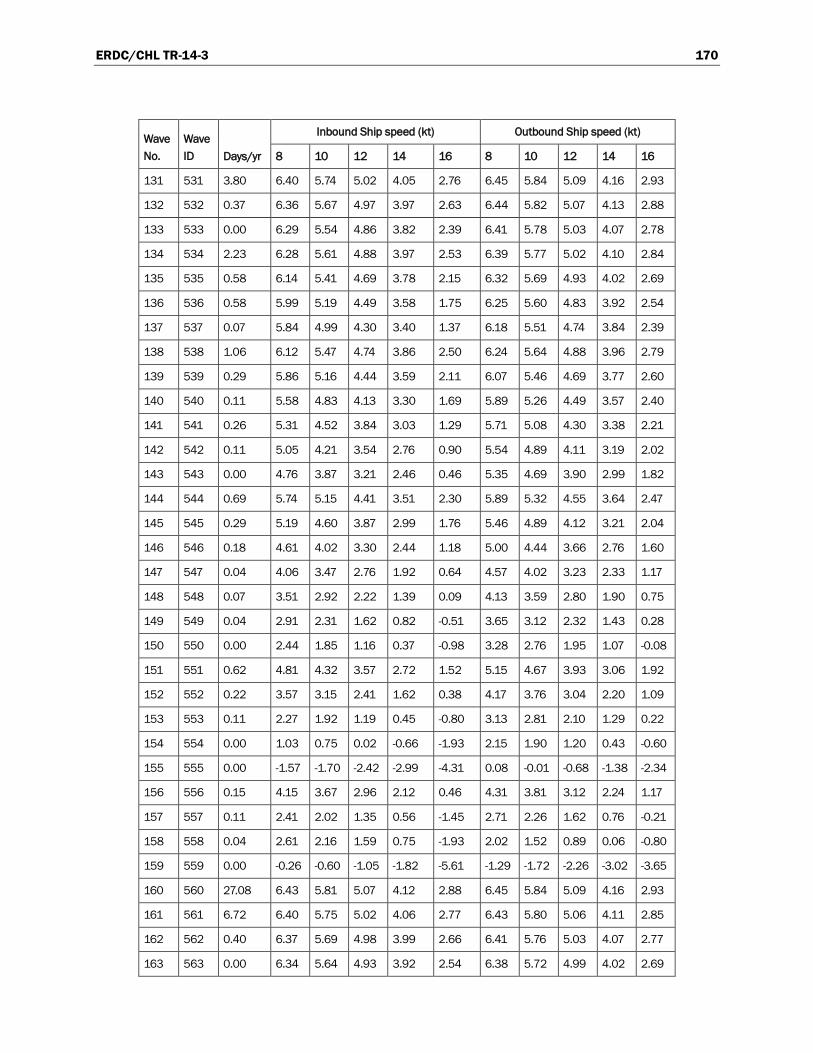
ERDC/CHL TR-14-3 170
Wave No.
Wave ID Days/yr
Inbound Ship speed (kt) Outbound Ship speed (kt)
8 10 12 14 16 8 10 12 14 16
131 531 3.80 6.40 5.74 5.02 4.05 2.76 6.45 5.84 5.09 4.16 2.93
132 532 0.37 6.36 5.67 4.97 3.97 2.63 6.44 5.82 5.07 4.13 2.88
133 533 0.00 6.29 5.54 4.86 3.82 2.39 6.41 5.78 5.03 4.07 2.78
134 534 2.23 6.28 5.61 4.88 3.97 2.53 6.39 5.77 5.02 4.10 2.84
135 535 0.58 6.14 5.41 4.69 3.78 2.15 6.32 5.69 4.93 4.02 2.69
136 536 0.58 5.99 5.19 4.49 3.58 1.75 6.25 5.60 4.83 3.92 2.54
137 537 0.07 5.84 4.99 4.30 3.40 1.37 6.18 5.51 4.74 3.84 2.39
138 538 1.06 6.12 5.47 4.74 3.86 2.50 6.24 5.64 4.88 3.96 2.79
139 539 0.29 5.86 5.16 4.44 3.59 2.11 6.07 5.46 4.69 3.77 2.60
140 540 0.11 5.58 4.83 4.13 3.30 1.69 5.89 5.26 4.49 3.57 2.40
141 541 0.26 5.31 4.52 3.84 3.03 1.29 5.71 5.08 4.30 3.38 2.21
142 542 0.11 5.05 4.21 3.54 2.76 0.90 5.54 4.89 4.11 3.19 2.02
143 543 0.00 4.76 3.87 3.21 2.46 0.46 5.35 4.69 3.90 2.99 1.82
144 544 0.69 5.74 5.15 4.41 3.51 2.30 5.89 5.32 4.55 3.64 2.47
145 545 0.29 5.19 4.60 3.87 2.99 1.76 5.46 4.89 4.12 3.21 2.04
146 546 0.18 4.61 4.02 3.30 2.44 1.18 5.00 4.44 3.66 2.76 1.60
147 547 0.04 4.06 3.47 2.76 1.92 0.64 4.57 4.02 3.23 2.33 1.17
148 548 0.07 3.51 2.92 2.22 1.39 0.09 4.13 3.59 2.80 1.90 0.75
149 549 0.04 2.91 2.31 1.62 0.82 -0.51 3.65 3.12 2.32 1.43 0.28
150 550 0.00 2.44 1.85 1.16 0.37 -0.98 3.28 2.76 1.95 1.07 -0.08
151 551 0.62 4.81 4.32 3.57 2.72 1.52 5.15 4.67 3.93 3.06 1.92
152 552 0.22 3.57 3.15 2.41 1.62 0.38 4.17 3.76 3.04 2.20 1.09
153 553 0.11 2.27 1.92 1.19 0.45 -0.80 3.13 2.81 2.10 1.29 0.22
154 554 0.00 1.03 0.75 0.02 -0.66 -1.93 2.15 1.90 1.20 0.43 -0.60
155 555 0.00 -1.57 -1.70 -2.42 -2.99 -4.31 0.08 -0.01 -0.68 -1.38 -2.34
156 556 0.15 4.15 3.67 2.96 2.12 0.46 4.31 3.81 3.12 2.24 1.17
157 557 0.11 2.41 2.02 1.35 0.56 -1.45 2.71 2.26 1.62 0.76 -0.21
158 558 0.04 2.61 2.16 1.59 0.75 -1.93 2.02 1.52 0.89 0.06 -0.80
159 559 0.00 -0.26 -0.60 -1.05 -1.82 -5.61 -1.29 -1.72 -2.26 -3.02 -3.65
160 560 27.08 6.43 5.81 5.07 4.12 2.88 6.45 5.84 5.09 4.16 2.93
161 561 6.72 6.40 5.75 5.02 4.06 2.77 6.43 5.80 5.06 4.11 2.85
162 562 0.40 6.37 5.69 4.98 3.99 2.66 6.41 5.76 5.03 4.07 2.77
163 563 0.00 6.34 5.64 4.93 3.92 2.54 6.38 5.72 4.99 4.02 2.69
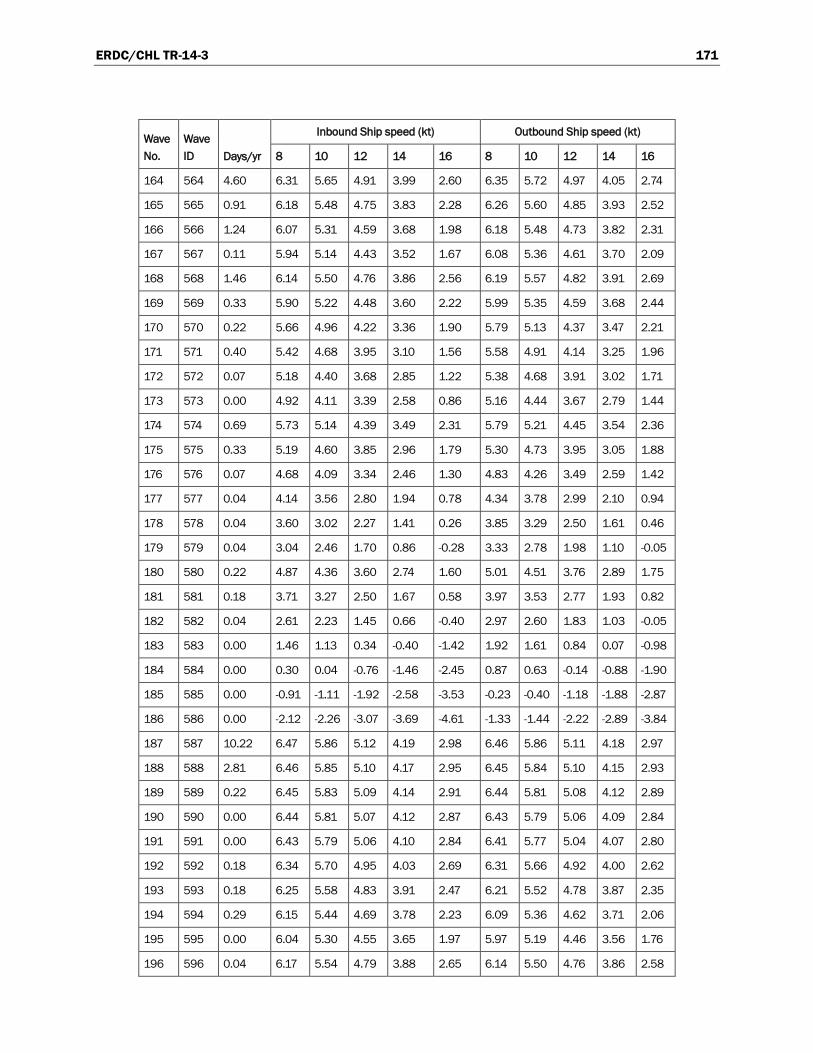
ERDC/CHL TR-14-3 171
Wave No.
Wave ID Days/yr
Inbound Ship speed (kt) Outbound Ship speed (kt)
8 10 12 14 16 8 10 12 14 16
164 564 4.60 6.31 5.65 4.91 3.99 2.60 6.35 5.72 4.97 4.05 2.74
165 565 0.91 6.18 5.48 4.75 3.83 2.28 6.26 5.60 4.85 3.93 2.52
166 566 1.24 6.07 5.31 4.59 3.68 1.98 6.18 5.48 4.73 3.82 2.31
167 567 0.11 5.94 5.14 4.43 3.52 1.67 6.08 5.36 4.61 3.70 2.09
168 568 1.46 6.14 5.50 4.76 3.86 2.56 6.19 5.57 4.82 3.91 2.69
169 569 0.33 5.90 5.22 4.48 3.60 2.22 5.99 5.35 4.59 3.68 2.44
170 570 0.22 5.66 4.96 4.22 3.36 1.90 5.79 5.13 4.37 3.47 2.21
171 571 0.40 5.42 4.68 3.95 3.10 1.56 5.58 4.91 4.14 3.25 1.96
172 572 0.07 5.18 4.40 3.68 2.85 1.22 5.38 4.68 3.91 3.02 1.71
173 573 0.00 4.92 4.11 3.39 2.58 0.86 5.16 4.44 3.67 2.79 1.44
174 574 0.69 5.73 5.14 4.39 3.49 2.31 5.79 5.21 4.45 3.54 2.36
175 575 0.33 5.19 4.60 3.85 2.96 1.79 5.30 4.73 3.95 3.05 1.88
176 576 0.07 4.68 4.09 3.34 2.46 1.30 4.83 4.26 3.49 2.59 1.42
177 577 0.04 4.14 3.56 2.80 1.94 0.78 4.34 3.78 2.99 2.10 0.94
178 578 0.04 3.60 3.02 2.27 1.41 0.26 3.85 3.29 2.50 1.61 0.46
179 579 0.04 3.04 2.46 1.70 0.86 -0.28 3.33 2.78 1.98 1.10 -0.05
180 580 0.22 4.87 4.36 3.60 2.74 1.60 5.01 4.51 3.76 2.89 1.75
181 581 0.18 3.71 3.27 2.50 1.67 0.58 3.97 3.53 2.77 1.93 0.82
182 582 0.04 2.61 2.23 1.45 0.66 -0.40 2.97 2.60 1.83 1.03 -0.05
183 583 0.00 1.46 1.13 0.34 -0.40 -1.42 1.92 1.61 0.84 0.07 -0.98
184 584 0.00 0.30 0.04 -0.76 -1.46 -2.45 0.87 0.63 -0.14 -0.88 -1.90
185 585 0.00 -0.91 -1.11 -1.92 -2.58 -3.53 -0.23 -0.40 -1.18 -1.88 -2.87
186 586 0.00 -2.12 -2.26 -3.07 -3.69 -4.61 -1.33 -1.44 -2.22 -2.89 -3.84
187 587 10.22 6.47 5.86 5.12 4.19 2.98 6.46 5.86 5.11 4.18 2.97
188 588 2.81 6.46 5.85 5.10 4.17 2.95 6.45 5.84 5.10 4.15 2.93
189 589 0.22 6.45 5.83 5.09 4.14 2.91 6.44 5.81 5.08 4.12 2.89
190 590 0.00 6.44 5.81 5.07 4.12 2.87 6.43 5.79 5.06 4.09 2.84
191 591 0.00 6.43 5.79 5.06 4.10 2.84 6.41 5.77 5.04 4.07 2.80
192 592 0.18 6.34 5.70 4.95 4.03 2.69 6.31 5.66 4.92 4.00 2.62
193 593 0.18 6.25 5.58 4.83 3.91 2.47 6.21 5.52 4.78 3.87 2.35
194 594 0.29 6.15 5.44 4.69 3.78 2.23 6.09 5.36 4.62 3.71 2.06
195 595 0.00 6.04 5.30 4.55 3.65 1.97 5.97 5.19 4.46 3.56 1.76
196 596 0.04 6.17 5.54 4.79 3.88 2.65 6.14 5.50 4.76 3.86 2.58
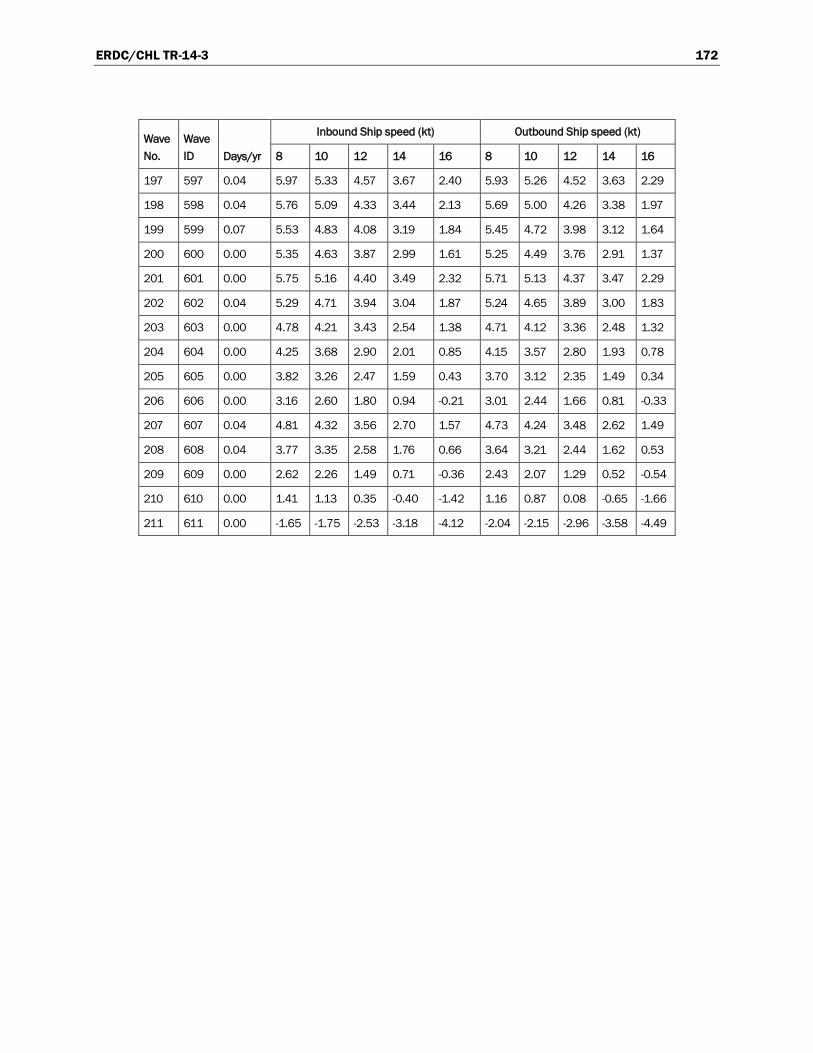
ERDC/CHL TR-14-3 172
Wave No.
Wave ID Days/yr
Inbound Ship speed (kt) Outbound Ship speed (kt)
8 10 12 14 16 8 10 12 14 16
197 597 0.04 5.97 5.33 4.57 3.67 2.40 5.93 5.26 4.52 3.63 2.29
198 598 0.04 5.76 5.09 4.33 3.44 2.13 5.69 5.00 4.26 3.38 1.97
199 599 0.07 5.53 4.83 4.08 3.19 1.84 5.45 4.72 3.98 3.12 1.64
200 600 0.00 5.35 4.63 3.87 2.99 1.61 5.25 4.49 3.76 2.91 1.37
201 601 0.00 5.75 5.16 4.40 3.49 2.32 5.71 5.13 4.37 3.47 2.29
202 602 0.04 5.29 4.71 3.94 3.04 1.87 5.24 4.65 3.89 3.00 1.83
203 603 0.00 4.78 4.21 3.43 2.54 1.38 4.71 4.12 3.36 2.48 1.32
204 604 0.00 4.25 3.68 2.90 2.01 0.85 4.15 3.57 2.80 1.93 0.78
205 605 0.00 3.82 3.26 2.47 1.59 0.43 3.70 3.12 2.35 1.49 0.34
206 606 0.00 3.16 2.60 1.80 0.94 -0.21 3.01 2.44 1.66 0.81 -0.33
207 607 0.04 4.81 4.32 3.56 2.70 1.57 4.73 4.24 3.48 2.62 1.49
208 608 0.04 3.77 3.35 2.58 1.76 0.66 3.64 3.21 2.44 1.62 0.53
209 609 0.00 2.62 2.26 1.49 0.71 -0.36 2.43 2.07 1.29 0.52 -0.54
210 610 0.00 1.41 1.13 0.35 -0.40 -1.42 1.16 0.87 0.08 -0.65 -1.66
211 611 0.00 -1.65 -1.75 -2.53 -3.18 -4.12 -2.04 -2.15 -2.96 -3.58 -4.49
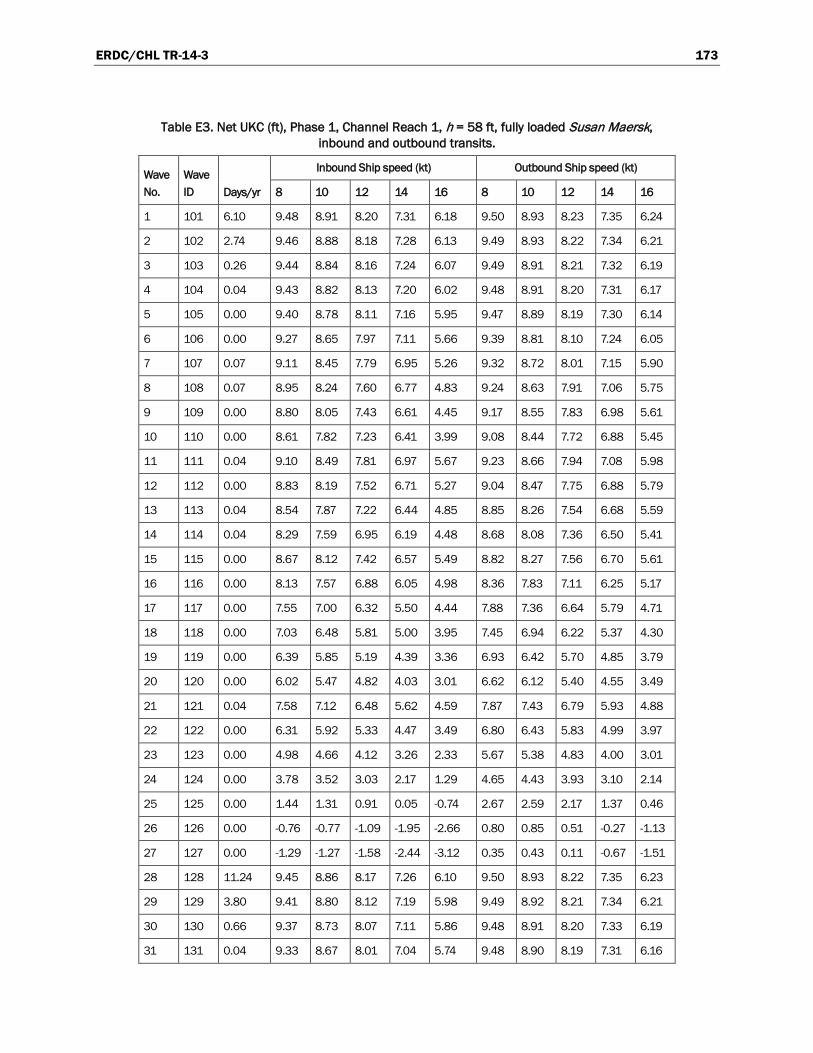
ERDC/CHL TR-14-3 173
Table E3. Net UKC (ft), Phase 1, Channel Reach 1, h = 58 ft, fully loaded Susan Maersk, inbound and outbound transits.
Wave No.
Wave ID Days/yr
Inbound Ship speed (kt) Outbound Ship speed (kt)
8 10 12 14 16 8 10 12 14 16
1 101 6.10 9.48 8.91 8.20 7.31 6.18 9.50 8.93 8.23 7.35 6.24
2 102 2.74 9.46 8.88 8.18 7.28 6.13 9.49 8.93 8.22 7.34 6.21
3 103 0.26 9.44 8.84 8.16 7.24 6.07 9.49 8.91 8.21 7.32 6.19
4 104 0.04 9.43 8.82 8.13 7.20 6.02 9.48 8.91 8.20 7.31 6.17
5 105 0.00 9.40 8.78 8.11 7.16 5.95 9.47 8.89 8.19 7.30 6.14
6 106 0.00 9.27 8.65 7.97 7.11 5.66 9.39 8.81 8.10 7.24 6.05
7 107 0.07 9.11 8.45 7.79 6.95 5.26 9.32 8.72 8.01 7.15 5.90
8 108 0.07 8.95 8.24 7.60 6.77 4.83 9.24 8.63 7.91 7.06 5.75
9 109 0.00 8.80 8.05 7.43 6.61 4.45 9.17 8.55 7.83 6.98 5.61
10 110 0.00 8.61 7.82 7.23 6.41 3.99 9.08 8.44 7.72 6.88 5.45
11 111 0.04 9.10 8.49 7.81 6.97 5.67 9.23 8.66 7.94 7.08 5.98
12 112 0.00 8.83 8.19 7.52 6.71 5.27 9.04 8.47 7.75 6.88 5.79
13 113 0.04 8.54 7.87 7.22 6.44 4.85 8.85 8.26 7.54 6.68 5.59
14 114 0.04 8.29 7.59 6.95 6.19 4.48 8.68 8.08 7.36 6.50 5.41
15 115 0.00 8.67 8.12 7.42 6.57 5.49 8.82 8.27 7.56 6.70 5.61
16 116 0.00 8.13 7.57 6.88 6.05 4.98 8.36 7.83 7.11 6.25 5.17
17 117 0.00 7.55 7.00 6.32 5.50 4.44 7.88 7.36 6.64 5.79 4.71
18 118 0.00 7.03 6.48 5.81 5.00 3.95 7.45 6.94 6.22 5.37 4.30
19 119 0.00 6.39 5.85 5.19 4.39 3.36 6.93 6.42 5.70 4.85 3.79
20 120 0.00 6.02 5.47 4.82 4.03 3.01 6.62 6.12 5.40 4.55 3.49
21 121 0.04 7.58 7.12 6.48 5.62 4.59 7.87 7.43 6.79 5.93 4.88
22 122 0.00 6.31 5.92 5.33 4.47 3.49 6.80 6.43 5.83 4.99 3.97
23 123 0.00 4.98 4.66 4.12 3.26 2.33 5.67 5.38 4.83 4.00 3.01
24 124 0.00 3.78 3.52 3.03 2.17 1.29 4.65 4.43 3.93 3.10 2.14
25 125 0.00 1.44 1.31 0.91 0.05 -0.74 2.67 2.59 2.17 1.37 0.46
26 126 0.00 -0.76 -0.77 -1.09 -1.95 -2.66 0.80 0.85 0.51 -0.27 -1.13
27 127 0.00 -1.29 -1.27 -1.58 -2.44 -3.12 0.35 0.43 0.11 -0.67 -1.51
28 128 11.24 9.45 8.86 8.17 7.26 6.10 9.50 8.93 8.22 7.35 6.23
29 129 3.80 9.41 8.80 8.12 7.19 5.98 9.49 8.92 8.21 7.34 6.21
30 130 0.66 9.37 8.73 8.07 7.11 5.86 9.48 8.91 8.20 7.33 6.19
31 131 0.04 9.33 8.67 8.01 7.04 5.74 9.48 8.90 8.19 7.31 6.16
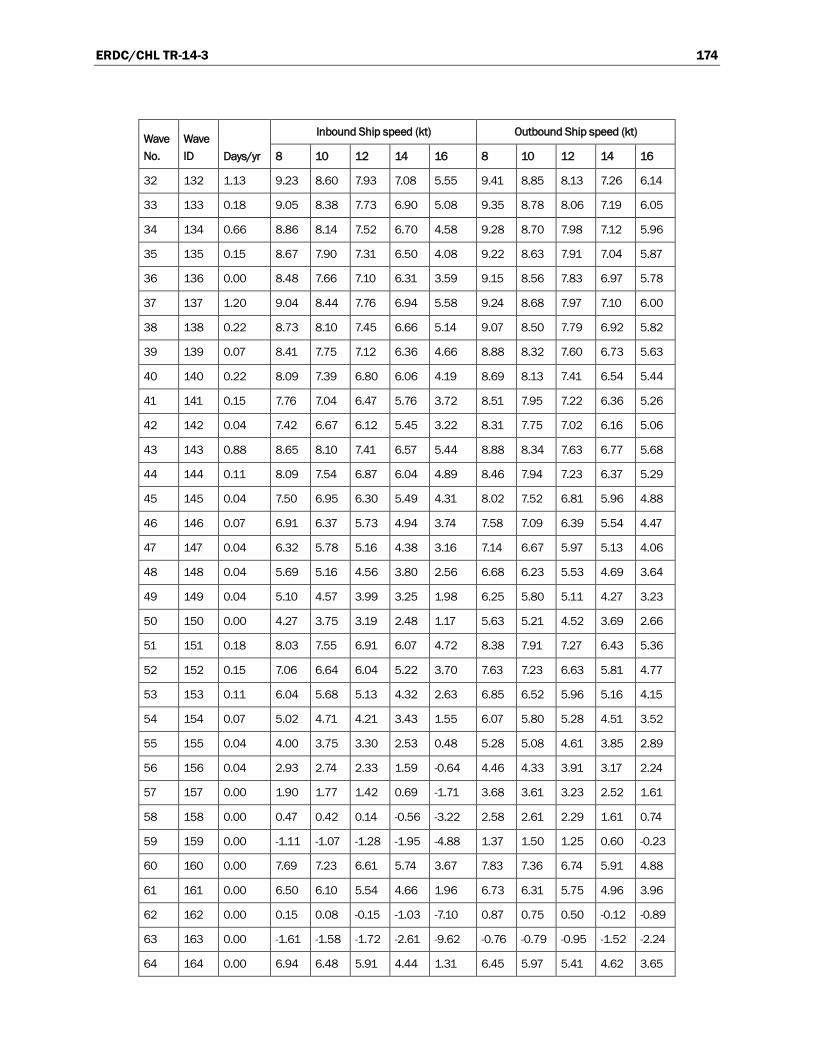
ERDC/CHL TR-14-3 174
Wave No.
Wave ID Days/yr
Inbound Ship speed (kt) Outbound Ship speed (kt)
8 10 12 14 16 8 10 12 14 16
32 132 1.13 9.23 8.60 7.93 7.08 5.55 9.41 8.85 8.13 7.26 6.14
33 133 0.18 9.05 8.38 7.73 6.90 5.08 9.35 8.78 8.06 7.19 6.05
34 134 0.66 8.86 8.14 7.52 6.70 4.58 9.28 8.70 7.98 7.12 5.96
35 135 0.15 8.67 7.90 7.31 6.50 4.08 9.22 8.63 7.91 7.04 5.87
36 136 0.00 8.48 7.66 7.10 6.31 3.59 9.15 8.56 7.83 6.97 5.78
37 137 1.20 9.04 8.44 7.76 6.94 5.58 9.24 8.68 7.97 7.10 6.00
38 138 0.22 8.73 8.10 7.45 6.66 5.14 9.07 8.50 7.79 6.92 5.82
39 139 0.07 8.41 7.75 7.12 6.36 4.66 8.88 8.32 7.60 6.73 5.63
40 140 0.22 8.09 7.39 6.80 6.06 4.19 8.69 8.13 7.41 6.54 5.44
41 141 0.15 7.76 7.04 6.47 5.76 3.72 8.51 7.95 7.22 6.36 5.26
42 142 0.04 7.42 6.67 6.12 5.45 3.22 8.31 7.75 7.02 6.16 5.06
43 143 0.88 8.65 8.10 7.41 6.57 5.44 8.88 8.34 7.63 6.77 5.68
44 144 0.11 8.09 7.54 6.87 6.04 4.89 8.46 7.94 7.23 6.37 5.29
45 145 0.04 7.50 6.95 6.30 5.49 4.31 8.02 7.52 6.81 5.96 4.88
46 146 0.07 6.91 6.37 5.73 4.94 3.74 7.58 7.09 6.39 5.54 4.47
47 147 0.04 6.32 5.78 5.16 4.38 3.16 7.14 6.67 5.97 5.13 4.06
48 148 0.04 5.69 5.16 4.56 3.80 2.56 6.68 6.23 5.53 4.69 3.64
49 149 0.04 5.10 4.57 3.99 3.25 1.98 6.25 5.80 5.11 4.27 3.23
50 150 0.00 4.27 3.75 3.19 2.48 1.17 5.63 5.21 4.52 3.69 2.66
51 151 0.18 8.03 7.55 6.91 6.07 4.72 8.38 7.91 7.27 6.43 5.36
52 152 0.15 7.06 6.64 6.04 5.22 3.70 7.63 7.23 6.63 5.81 4.77
53 153 0.11 6.04 5.68 5.13 4.32 2.63 6.85 6.52 5.96 5.16 4.15
54 154 0.07 5.02 4.71 4.21 3.43 1.55 6.07 5.80 5.28 4.51 3.52
55 155 0.04 4.00 3.75 3.30 2.53 0.48 5.28 5.08 4.61 3.85 2.89
56 156 0.04 2.93 2.74 2.33 1.59 -0.64 4.46 4.33 3.91 3.17 2.24
57 157 0.00 1.90 1.77 1.42 0.69 -1.71 3.68 3.61 3.23 2.52 1.61
58 158 0.00 0.47 0.42 0.14 -0.56 -3.22 2.58 2.61 2.29 1.61 0.74
59 159 0.00 -1.11 -1.07 -1.28 -1.95 -4.88 1.37 1.50 1.25 0.60 -0.23
60 160 0.00 7.69 7.23 6.61 5.74 3.67 7.83 7.36 6.74 5.91 4.88
61 161 0.00 6.50 6.10 5.54 4.66 1.96 6.73 6.31 5.75 4.96 3.96
62 162 0.00 0.15 0.08 -0.15 -1.03 -7.10 0.87 0.75 0.50 -0.12 -0.89
63 163 0.00 -1.61 -1.58 -1.72 -2.61 -9.62 -0.76 -0.79 -0.95 -1.52 -2.24
64 164 0.00 6.94 6.48 5.91 4.44 1.31 6.45 5.97 5.41 4.62 3.65

ERDC/CHL TR-14-3 175
Wave No.
Wave ID Days/yr
Inbound Ship speed (kt) Outbound Ship speed (kt)
8 10 12 14 16 8 10 12 14 16
65 165 12.41 9.44 8.84 8.15 7.25 6.07 9.50 8.94 8.23 7.36 6.25
66 166 3.14 9.39 8.77 8.09 7.16 5.93 9.49 8.93 8.22 7.35 6.24
67 167 0.37 9.34 8.69 8.03 7.07 5.79 9.49 8.92 8.21 7.34 6.22
68 168 0.00 9.24 8.54 7.91 6.90 5.51 9.48 8.91 8.20 7.33 6.20
69 169 1.39 9.23 8.60 7.93 7.09 5.54 9.43 8.87 8.16 7.29 6.19
70 170 0.37 9.03 8.35 7.71 6.88 5.01 9.37 8.81 8.10 7.23 6.13
71 171 0.66 8.83 8.10 7.49 6.68 4.49 9.32 8.75 8.04 7.16 6.06
72 172 0.07 8.64 7.86 7.28 6.49 3.99 9.26 8.70 7.98 7.11 6.01
73 173 1.46 9.04 8.44 7.78 6.96 5.58 9.28 8.72 8.01 7.14 6.04
74 174 0.26 8.71 8.08 7.45 6.66 5.09 9.11 8.56 7.85 6.98 5.88
75 175 0.15 8.38 7.72 7.12 6.36 4.60 8.95 8.40 7.69 6.82 5.72
76 176 0.18 8.06 7.38 6.80 6.08 4.13 8.79 8.24 7.53 6.66 5.56
77 177 0.07 7.72 7.02 6.47 5.79 3.64 8.62 8.08 7.37 6.50 5.40
78 178 0.00 7.39 6.66 6.14 5.49 3.14 8.46 7.92 7.20 6.34 5.24
79 179 1.24 8.70 8.14 7.46 6.62 5.45 8.95 8.42 7.72 6.86 5.77
80 180 0.26 8.11 7.56 6.91 6.08 4.86 8.56 8.04 7.34 6.49 5.41
81 181 0.18 7.53 6.98 6.35 5.55 4.27 8.16 7.66 6.97 6.12 5.05
82 182 0.04 6.98 6.43 5.82 5.04 3.72 7.78 7.30 6.62 5.77 4.70
83 183 0.04 6.40 5.86 5.26 4.50 3.13 7.38 6.93 6.24 5.40 4.34
84 184 0.04 5.81 5.28 4.71 3.97 2.54 6.99 6.55 5.87 5.04 3.98
85 185 0.00 5.26 4.73 4.18 3.46 1.98 6.61 6.19 5.51 4.69 3.64
86 186 0.91 8.17 7.71 7.08 6.26 4.58 8.53 8.07 7.44 6.61 5.56
87 187 0.51 7.21 6.82 6.24 5.47 3.36 7.82 7.44 6.86 6.07 5.05
88 188 0.15 6.26 5.93 5.41 4.67 2.15 7.12 6.81 6.29 5.53 4.54
89 189 0.07 5.35 5.09 4.62 3.92 1.00 6.45 6.21 5.75 5.02 4.06
90 190 0.00 4.39 4.20 3.79 3.13 -0.21 5.75 5.59 5.17 4.48 3.55
91 191 0.15 8.21 7.75 7.12 5.85 3.70 8.31 7.85 7.23 6.42 5.39
92 192 0.07 7.28 6.89 6.33 4.77 1.87 7.46 7.06 6.51 5.75 4.76
93 193 0.04 6.35 6.02 5.53 3.68 0.03 6.60 6.27 5.79 5.07 4.13
94 194 0.00 5.46 5.21 4.77 2.65 -1.71 5.79 5.52 5.11 4.43 3.53
95 195 0.00 7.99 7.51 6.74 4.44 1.44 7.59 7.15 6.59 5.82 4.83
96 196 0.00 6.91 6.49 5.67 2.34 -2.02 6.22 5.87 5.42 4.72 3.79
97 197 11.86 9.44 8.84 8.16 7.25 6.07 9.50 8.94 8.23 7.36 6.25

ERDC/CHL TR-14-3 176
Wave No.
Wave ID Days/yr
Inbound Ship speed (kt) Outbound Ship speed (kt)
8 10 12 14 16 8 10 12 14 16
98 198 3.07 9.39 8.77 8.09 7.16 5.93 9.49 8.93 8.22 7.35 6.23
99 199 0.58 9.34 8.69 8.03 7.07 5.79 9.49 8.92 8.21 7.34 6.21
100 200 0.04 9.30 8.62 7.98 6.99 5.66 9.48 8.91 8.20 7.33 6.19
101 201 1.10 9.23 8.60 7.93 7.09 5.54 9.43 8.86 8.15 7.28 6.18
102 202 0.29 9.03 8.35 7.72 6.89 5.02 9.37 8.80 8.09 7.22 6.12
103 203 0.47 8.84 8.11 7.50 6.68 4.51 9.31 8.74 8.03 7.15 6.06
104 204 0.07 8.65 7.87 7.29 6.49 4.01 9.25 8.69 7.97 7.09 6.00
105 205 0.00 8.46 7.64 7.08 6.30 3.52 9.20 8.63 7.91 7.03 5.94
106 206 0.88 9.05 8.45 7.78 6.96 5.59 9.27 8.72 8.00 7.14 6.03
107 207 0.15 8.71 8.09 7.45 6.66 5.10 9.10 8.55 7.84 6.97 5.87
108 208 0.11 8.38 7.73 7.12 6.36 4.61 8.93 8.38 7.67 6.80 5.70
109 209 0.15 8.07 7.38 6.80 6.08 4.14 8.77 8.22 7.51 6.64 5.54
110 210 0.07 7.75 7.04 6.49 5.80 3.68 8.61 8.06 7.35 6.48 5.38
111 211 0.00 7.35 6.61 6.09 5.44 3.09 8.40 7.86 7.14 6.28 5.18
112 212 0.62 8.69 8.14 7.46 6.62 5.45 8.94 8.41 7.70 6.84 5.75
113 213 0.26 8.11 7.56 6.90 6.08 4.86 8.54 8.02 7.32 6.46 5.38
114 214 0.15 7.52 6.98 6.34 5.54 4.28 8.13 7.63 6.93 6.08 5.01
115 215 0.11 6.97 6.43 5.81 5.02 3.72 7.74 7.26 6.57 5.73 4.66
116 216 0.00 6.41 5.87 5.27 4.51 3.16 7.36 6.89 6.20 5.37 4.31
117 217 0.00 5.71 5.18 4.60 3.86 2.46 6.87 6.43 5.74 4.91 3.86
118 218 0.73 8.16 7.69 7.05 6.23 4.63 8.51 8.05 7.41 6.58 5.52
119 219 0.22 7.19 6.79 6.21 5.42 3.46 7.79 7.40 6.82 6.02 4.99
120 220 0.11 6.22 5.89 5.36 4.60 2.28 7.08 6.76 6.23 5.46 4.46
121 221 0.07 5.30 5.03 4.55 3.83 1.17 6.40 6.15 5.66 4.92 3.95
122 222 0.04 4.39 4.17 3.75 3.05 0.05 5.72 5.53 5.10 4.39 3.44
123 223 0.00 3.23 3.09 2.73 2.08 -1.36 4.86 4.76 4.39 3.71 2.80
124 224 0.11 8.10 7.64 7.02 5.83 3.70 8.21 7.74 7.12 6.31 5.28
125 225 0.04 7.10 6.70 6.14 4.73 1.87 7.28 6.88 6.33 5.56 4.56
126 226 0.04 6.09 5.76 5.26 3.63 0.03 6.35 6.01 5.53 4.80 3.85
127 227 0.00 7.76 7.28 6.68 4.45 1.40 7.32 6.87 6.31 5.53 4.55
128 228 0.04 6.50 6.08 5.56 2.36 -2.08 5.75 5.38 4.93 4.22 3.31
129 229 0.04 5.25 4.89 4.44 0.26 -5.56 4.18 3.89 3.55 2.91 2.08
130 230 18.03 9.45 8.86 8.16 7.26 6.09 9.50 8.93 8.22 7.35 6.22
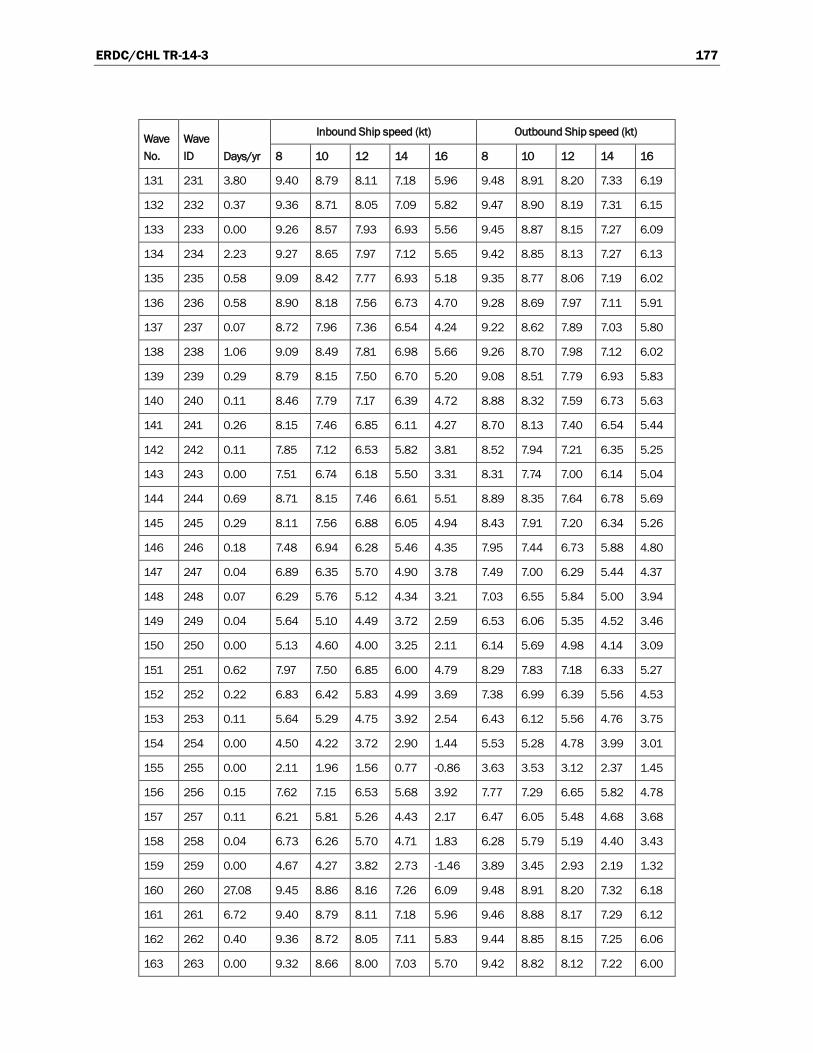
ERDC/CHL TR-14-3 177
Wave No.
Wave ID Days/yr
Inbound Ship speed (kt) Outbound Ship speed (kt)
8 10 12 14 16 8 10 12 14 16
131 231 3.80 9.40 8.79 8.11 7.18 5.96 9.48 8.91 8.20 7.33 6.19
132 232 0.37 9.36 8.71 8.05 7.09 5.82 9.47 8.90 8.19 7.31 6.15
133 233 0.00 9.26 8.57 7.93 6.93 5.56 9.45 8.87 8.15 7.27 6.09
134 234 2.23 9.27 8.65 7.97 7.12 5.65 9.42 8.85 8.13 7.27 6.13
135 235 0.58 9.09 8.42 7.77 6.93 5.18 9.35 8.77 8.06 7.19 6.02
136 236 0.58 8.90 8.18 7.56 6.73 4.70 9.28 8.69 7.97 7.11 5.91
137 237 0.07 8.72 7.96 7.36 6.54 4.24 9.22 8.62 7.89 7.03 5.80
138 238 1.06 9.09 8.49 7.81 6.98 5.66 9.26 8.70 7.98 7.12 6.02
139 239 0.29 8.79 8.15 7.50 6.70 5.20 9.08 8.51 7.79 6.93 5.83
140 240 0.11 8.46 7.79 7.17 6.39 4.72 8.88 8.32 7.59 6.73 5.63
141 241 0.26 8.15 7.46 6.85 6.11 4.27 8.70 8.13 7.40 6.54 5.44
142 242 0.11 7.85 7.12 6.53 5.82 3.81 8.52 7.94 7.21 6.35 5.25
143 243 0.00 7.51 6.74 6.18 5.50 3.31 8.31 7.74 7.00 6.14 5.04
144 244 0.69 8.71 8.15 7.46 6.61 5.51 8.89 8.35 7.64 6.78 5.69
145 245 0.29 8.11 7.56 6.88 6.05 4.94 8.43 7.91 7.20 6.34 5.26
146 246 0.18 7.48 6.94 6.28 5.46 4.35 7.95 7.44 6.73 5.88 4.80
147 247 0.04 6.89 6.35 5.70 4.90 3.78 7.49 7.00 6.29 5.44 4.37
148 248 0.07 6.29 5.76 5.12 4.34 3.21 7.03 6.55 5.84 5.00 3.94
149 249 0.04 5.64 5.10 4.49 3.72 2.59 6.53 6.06 5.35 4.52 3.46
150 250 0.00 5.13 4.60 4.00 3.25 2.11 6.14 5.69 4.98 4.14 3.09
151 251 0.62 7.97 7.50 6.85 6.00 4.79 8.29 7.83 7.18 6.33 5.27
152 252 0.22 6.83 6.42 5.83 4.99 3.69 7.38 6.99 6.39 5.56 4.53
153 253 0.11 5.64 5.29 4.75 3.92 2.54 6.43 6.12 5.56 4.76 3.75
154 254 0.00 4.50 4.22 3.72 2.90 1.44 5.53 5.28 4.78 3.99 3.01
155 255 0.00 2.11 1.96 1.56 0.77 -0.86 3.63 3.53 3.12 2.37 1.45
156 256 0.15 7.62 7.15 6.53 5.68 3.92 7.77 7.29 6.65 5.82 4.78
157 257 0.11 6.21 5.81 5.26 4.43 2.17 6.47 6.05 5.48 4.68 3.68
158 258 0.04 6.73 6.26 5.70 4.71 1.83 6.28 5.79 5.19 4.40 3.43
159 259 0.00 4.67 4.27 3.82 2.73 -1.46 3.89 3.45 2.93 2.19 1.32
160 260 27.08 9.45 8.86 8.16 7.26 6.09 9.48 8.91 8.20 7.32 6.18
161 261 6.72 9.40 8.79 8.11 7.18 5.96 9.46 8.88 8.17 7.29 6.12
162 262 0.40 9.36 8.72 8.05 7.11 5.83 9.44 8.85 8.15 7.25 6.06
163 263 0.00 9.32 8.66 8.00 7.03 5.70 9.42 8.82 8.12 7.22 6.00
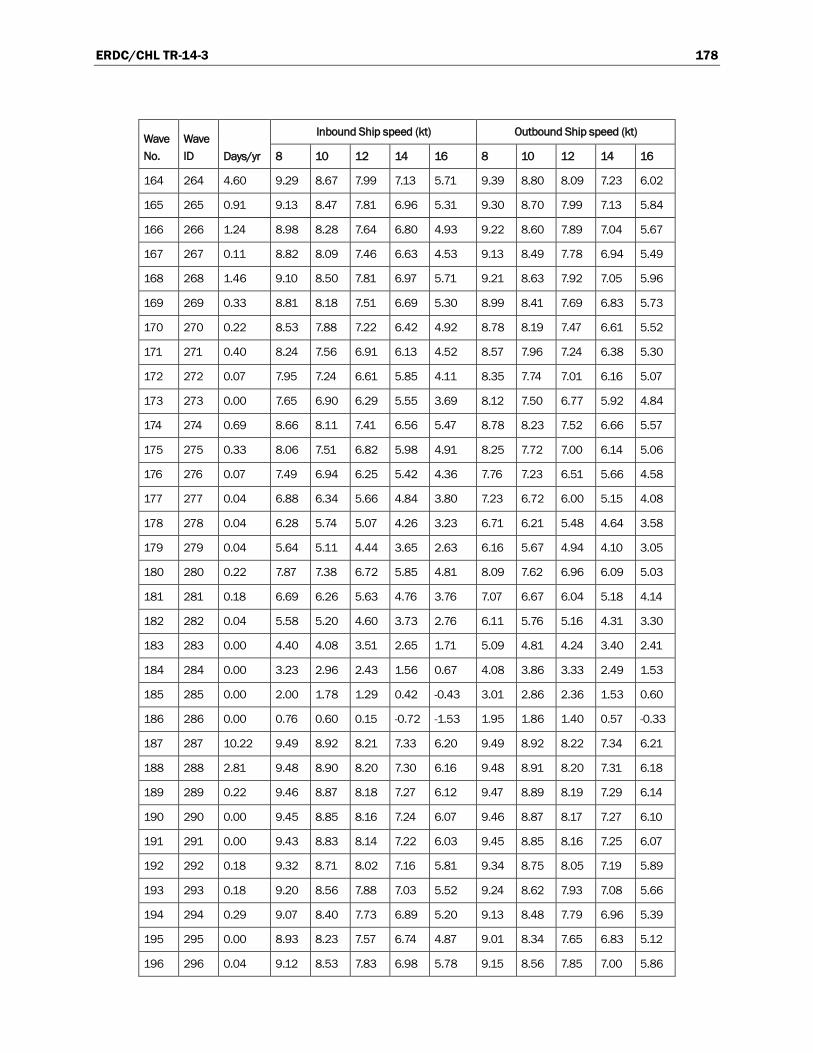
ERDC/CHL TR-14-3 178
Wave No.
Wave ID Days/yr
Inbound Ship speed (kt) Outbound Ship speed (kt)
8 10 12 14 16 8 10 12 14 16
164 264 4.60 9.29 8.67 7.99 7.13 5.71 9.39 8.80 8.09 7.23 6.02
165 265 0.91 9.13 8.47 7.81 6.96 5.31 9.30 8.70 7.99 7.13 5.84
166 266 1.24 8.98 8.28 7.64 6.80 4.93 9.22 8.60 7.89 7.04 5.67
167 267 0.11 8.82 8.09 7.46 6.63 4.53 9.13 8.49 7.78 6.94 5.49
168 268 1.46 9.10 8.50 7.81 6.97 5.71 9.21 8.63 7.92 7.05 5.96
169 269 0.33 8.81 8.18 7.51 6.69 5.30 8.99 8.41 7.69 6.83 5.73
170 270 0.22 8.53 7.88 7.22 6.42 4.92 8.78 8.19 7.47 6.61 5.52
171 271 0.40 8.24 7.56 6.91 6.13 4.52 8.57 7.96 7.24 6.38 5.30
172 272 0.07 7.95 7.24 6.61 5.85 4.11 8.35 7.74 7.01 6.16 5.07
173 273 0.00 7.65 6.90 6.29 5.55 3.69 8.12 7.50 6.77 5.92 4.84
174 274 0.69 8.66 8.11 7.41 6.56 5.47 8.78 8.23 7.52 6.66 5.57
175 275 0.33 8.06 7.51 6.82 5.98 4.91 8.25 7.72 7.00 6.14 5.06
176 276 0.07 7.49 6.94 6.25 5.42 4.36 7.76 7.23 6.51 5.66 4.58
177 277 0.04 6.88 6.34 5.66 4.84 3.80 7.23 6.72 6.00 5.15 4.08
178 278 0.04 6.28 5.74 5.07 4.26 3.23 6.71 6.21 5.48 4.64 3.58
179 279 0.04 5.64 5.11 4.44 3.65 2.63 6.16 5.67 4.94 4.10 3.05
180 280 0.22 7.87 7.38 6.72 5.85 4.81 8.09 7.62 6.96 6.09 5.03
181 281 0.18 6.69 6.26 5.63 4.76 3.76 7.07 6.67 6.04 5.18 4.14
182 282 0.04 5.58 5.20 4.60 3.73 2.76 6.11 5.76 5.16 4.31 3.30
183 283 0.00 4.40 4.08 3.51 2.65 1.71 5.09 4.81 4.24 3.40 2.41
184 284 0.00 3.23 2.96 2.43 1.56 0.67 4.08 3.86 3.33 2.49 1.53
185 285 0.00 2.00 1.78 1.29 0.42 -0.43 3.01 2.86 2.36 1.53 0.60
186 286 0.00 0.76 0.60 0.15 -0.72 -1.53 1.95 1.86 1.40 0.57 -0.33
187 287 10.22 9.49 8.92 8.21 7.33 6.20 9.49 8.92 8.22 7.34 6.21
188 288 2.81 9.48 8.90 8.20 7.30 6.16 9.48 8.91 8.20 7.31 6.18
189 289 0.22 9.46 8.87 8.18 7.27 6.12 9.47 8.89 8.19 7.29 6.14
190 290 0.00 9.45 8.85 8.16 7.24 6.07 9.46 8.87 8.17 7.27 6.10
191 291 0.00 9.43 8.83 8.14 7.22 6.03 9.45 8.85 8.16 7.25 6.07
192 292 0.18 9.32 8.71 8.02 7.16 5.81 9.34 8.75 8.05 7.19 5.89
193 293 0.18 9.20 8.56 7.88 7.03 5.52 9.24 8.62 7.93 7.08 5.66
194 294 0.29 9.07 8.40 7.73 6.89 5.20 9.13 8.48 7.79 6.96 5.39
195 295 0.00 8.93 8.23 7.57 6.74 4.87 9.01 8.34 7.65 6.83 5.12
196 296 0.04 9.12 8.53 7.83 6.98 5.78 9.15 8.56 7.85 7.00 5.86
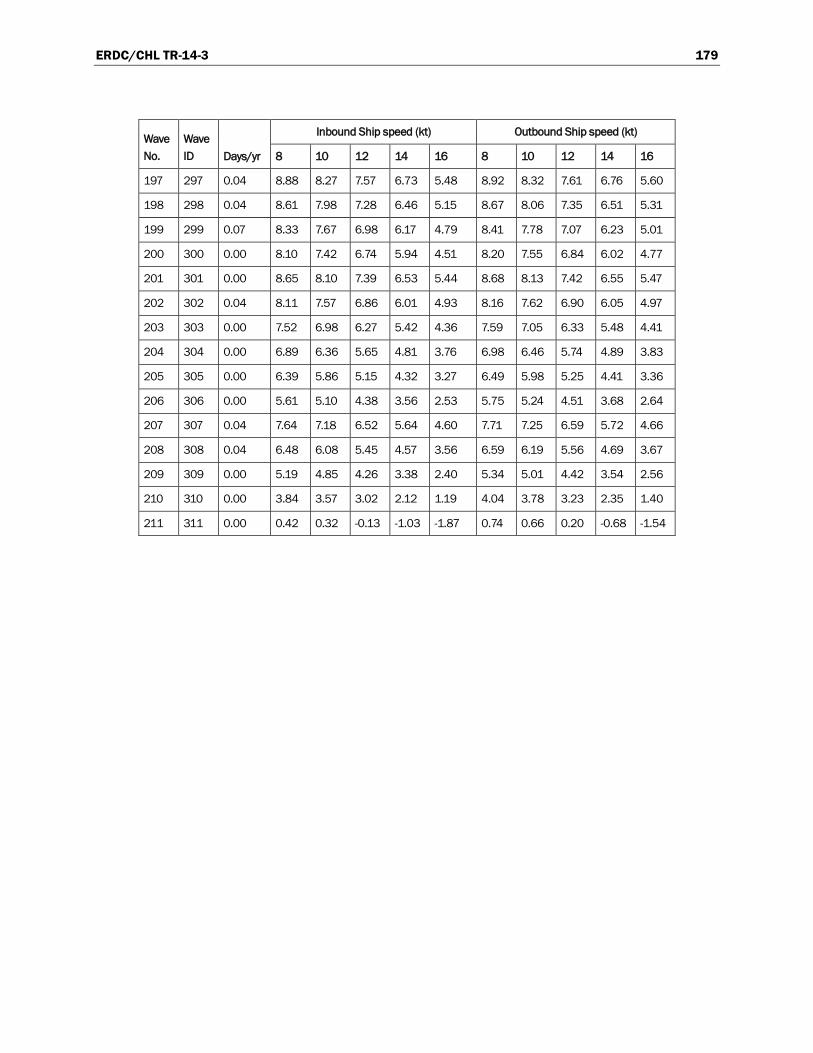
ERDC/CHL TR-14-3 179
Wave No.
Wave ID Days/yr
Inbound Ship speed (kt) Outbound Ship speed (kt)
8 10 12 14 16 8 10 12 14 16
197 297 0.04 8.88 8.27 7.57 6.73 5.48 8.92 8.32 7.61 6.76 5.60
198 298 0.04 8.61 7.98 7.28 6.46 5.15 8.67 8.06 7.35 6.51 5.31
199 299 0.07 8.33 7.67 6.98 6.17 4.79 8.41 7.78 7.07 6.23 5.01
200 300 0.00 8.10 7.42 6.74 5.94 4.51 8.20 7.55 6.84 6.02 4.77
201 301 0.00 8.65 8.10 7.39 6.53 5.44 8.68 8.13 7.42 6.55 5.47
202 302 0.04 8.11 7.57 6.86 6.01 4.93 8.16 7.62 6.90 6.05 4.97
203 303 0.00 7.52 6.98 6.27 5.42 4.36 7.59 7.05 6.33 5.48 4.41
204 304 0.00 6.89 6.36 5.65 4.81 3.76 6.98 6.46 5.74 4.89 3.83
205 305 0.00 6.39 5.86 5.15 4.32 3.27 6.49 5.98 5.25 4.41 3.36
206 306 0.00 5.61 5.10 4.38 3.56 2.53 5.75 5.24 4.51 3.68 2.64
207 307 0.04 7.64 7.18 6.52 5.64 4.60 7.71 7.25 6.59 5.72 4.66
208 308 0.04 6.48 6.08 5.45 4.57 3.56 6.59 6.19 5.56 4.69 3.67
209 309 0.00 5.19 4.85 4.26 3.38 2.40 5.34 5.01 4.42 3.54 2.56
210 310 0.00 3.84 3.57 3.02 2.12 1.19 4.04 3.78 3.23 2.35 1.40
211 311 0.00 0.42 0.32 -0.13 -1.03 -1.87 0.74 0.66 0.20 -0.68 -1.54

ERDC/CHL TR-14-3 180
Table E4. Net UKC (ft), Phase 1, Mound Reach 2, h = 60 ft, fully loaded Susan Maersk, inbound and outbound transits.
Wave No.
Wave ID Days/yr
Inbound Ship speed (kt) Outbound Ship speed (kt)
8 10 12 14 16 8 10 12 14 16
1 401 6.10 11.51 10.95 10.26 9.40 8.32 11.53 10.99 10.29 9.44 8.39
2 402 2.74 11.49 10.92 10.24 9.36 8.26 11.53 10.98 10.28 9.43 8.37
3 403 0.26 11.46 10.89 10.21 9.32 8.20 11.52 10.98 10.28 9.42 8.36
4 404 0.04 11.44 10.85 10.19 9.29 8.14 11.52 10.97 10.27 9.41 8.34
5 405 0.00 11.42 10.82 10.16 9.25 8.07 11.51 10.96 10.26 9.41 8.32
6 406 0.00 11.27 10.67 10.01 9.20 7.69 11.44 10.89 10.18 9.34 8.25
7 407 0.07 11.09 10.45 9.82 9.03 7.22 11.37 10.81 10.11 9.26 8.15
8 408 0.07 10.90 10.22 9.62 8.86 6.72 11.30 10.74 10.03 9.19 8.04
9 409 0.00 10.74 10.02 9.44 8.70 6.28 11.24 10.67 9.96 9.12 7.94
10 410 0.00 10.53 9.76 9.22 8.51 5.73 11.16 10.58 9.87 9.03 7.82
11 411 0.04 11.09 10.52 9.86 9.04 7.74 11.27 10.73 10.03 9.18 8.14
12 412 0.00 10.79 10.20 9.56 8.78 7.30 11.10 10.55 9.85 9.00 7.96
13 413 0.04 10.48 9.87 9.26 8.50 6.84 10.91 10.37 9.66 8.82 7.78
14 414 0.04 10.19 9.57 8.98 8.25 6.42 10.74 10.20 9.49 8.65 7.61
15 415 0.00 10.69 10.16 9.48 8.65 7.61 10.87 10.35 9.65 8.81 7.78
16 416 0.00 10.13 9.60 8.93 8.12 7.09 10.43 9.93 9.23 8.39 7.37
17 417 0.00 9.54 9.02 8.37 7.57 6.54 9.97 9.48 8.78 7.95 6.94
18 418 0.00 9.02 8.49 7.85 7.07 6.04 9.55 9.07 8.38 7.56 6.55
19 419 0.00 8.37 7.85 7.23 6.47 5.43 9.04 8.58 7.89 7.07 6.08
20 420 0.00 7.99 7.47 6.86 6.11 5.08 8.74 8.29 7.60 6.79 5.80
21 421 0.04 9.83 9.39 8.76 7.92 6.86 10.11 9.68 9.06 8.24 7.24
22 422 0.00 8.71 8.33 7.75 6.92 5.84 9.18 8.82 8.24 7.44 6.47
23 423 0.00 7.53 7.21 6.68 5.87 4.77 8.19 7.90 7.38 6.60 5.66
24 424 0.00 6.47 6.21 5.72 4.92 3.80 7.30 7.08 6.61 5.85 4.93
25 425 0.00 4.41 4.26 3.86 3.08 1.93 5.58 5.49 5.10 4.38 3.51
26 426 0.00 2.47 2.42 2.10 1.34 0.16 3.95 3.99 3.68 3.00 2.18
27 427 0.00 1.99 1.98 1.68 0.92 -0.27 3.56 3.62 3.34 2.66 1.86
28 428 11.24 11.47 10.90 10.23 9.35 8.23 11.53 10.99 10.29 9.44 8.39
29 429 3.80 11.43 10.84 10.18 9.28 8.12 11.53 10.98 10.28 9.43 8.37
30 430 0.66 11.39 10.77 10.12 9.21 8.00 11.52 10.97 10.27 9.42 8.36
31 431 0.04 11.34 10.71 10.07 9.14 7.87 11.51 10.97 10.26 9.42 8.35

ERDC/CHL TR-14-3 181
Wave No.
Wave ID Days/yr
Inbound Ship speed (kt) Outbound Ship speed (kt)
8 10 12 14 16 8 10 12 14 16
32 432 1.13 11.24 10.64 9.99 9.18 7.59 11.45 10.91 10.21 9.36 8.32
33 433 0.18 11.04 10.40 9.78 9.00 7.06 11.39 10.85 10.14 9.29 8.25
34 434 0.66 10.83 10.15 9.56 8.82 6.50 11.33 10.78 10.08 9.23 8.19
35 435 0.15 10.63 9.89 9.34 8.63 5.93 11.27 10.72 10.01 9.16 8.12
36 436 0.00 10.42 9.64 9.13 8.45 5.37 11.20 10.66 9.95 9.10 8.06
37 437 1.20 11.04 10.47 9.82 9.02 7.68 11.27 10.74 10.04 9.19 8.15
38 438 0.22 10.71 10.13 9.51 8.73 7.21 11.10 10.57 9.87 9.02 7.98
39 439 0.07 10.36 9.76 9.18 8.43 6.71 10.92 10.39 9.69 8.85 7.81
40 440 0.22 10.02 9.40 8.85 8.13 6.21 10.74 10.21 9.51 8.67 7.63
41 441 0.15 9.67 9.04 8.52 7.83 5.71 10.55 10.04 9.33 8.49 7.45
42 442 0.04 9.31 8.66 8.17 7.52 5.18 10.36 9.85 9.15 8.31 7.26
43 443 0.88 10.68 10.14 9.47 8.65 7.57 10.91 10.40 9.71 8.87 7.84
44 444 0.11 10.11 9.58 8.93 8.12 7.02 10.50 10.01 9.32 8.49 7.47
45 445 0.04 9.51 8.99 8.36 7.57 6.45 10.07 9.59 8.92 8.09 7.08
46 446 0.07 8.92 8.40 7.78 7.02 5.87 9.63 9.18 8.51 7.69 6.69
47 447 0.04 8.32 7.81 7.21 6.46 5.29 9.20 8.77 8.10 7.29 6.30
48 448 0.04 7.69 7.19 6.61 5.88 4.68 8.74 8.33 7.67 6.87 5.89
49 449 0.04 7.10 6.60 6.04 5.33 4.11 8.31 7.92 7.27 6.47 5.50
50 450 0.00 6.26 5.78 5.24 4.56 3.30 7.70 7.34 6.70 5.91 4.96
51 451 0.18 10.26 9.80 9.17 8.36 6.94 10.54 10.09 9.47 8.66 7.66
52 452 0.15 9.42 9.01 8.42 7.64 5.98 9.88 9.50 8.92 8.14 7.17
53 453 0.11 8.53 8.18 7.64 6.89 4.97 9.19 8.88 8.35 7.60 6.65
54 454 0.07 7.65 7.35 6.86 6.14 3.96 8.50 8.25 7.77 7.05 6.13
55 455 0.04 6.76 6.52 6.07 5.39 2.95 7.81 7.62 7.20 6.50 5.61
56 456 0.04 5.84 5.65 5.25 4.60 1.89 7.08 6.97 6.59 5.93 5.06
57 457 0.00 4.95 4.82 4.47 3.84 0.87 6.39 6.34 6.02 5.38 4.54
58 458 0.00 3.71 3.66 3.37 2.79 -0.54 5.42 5.47 5.21 4.62 3.82
59 459 0.00 2.34 2.37 2.16 1.62 -2.11 4.35 4.50 4.32 3.77 3.01
60 460 0.00 10.12 9.67 9.05 8.02 5.96 10.14 9.70 9.10 8.31 7.33
61 461 0.00 9.18 8.79 8.23 7.07 4.36 9.23 8.85 8.31 7.56 6.62
62 462 0.00 4.21 4.15 3.86 2.07 -4.18 4.36 4.32 4.11 3.59 2.85
63 463 0.00 2.83 2.86 2.65 0.68 -6.55 3.01 3.07 2.95 2.49 1.80
64 464 0.00 9.74 9.28 8.68 6.82 3.73 9.20 8.77 8.22 7.47 6.53
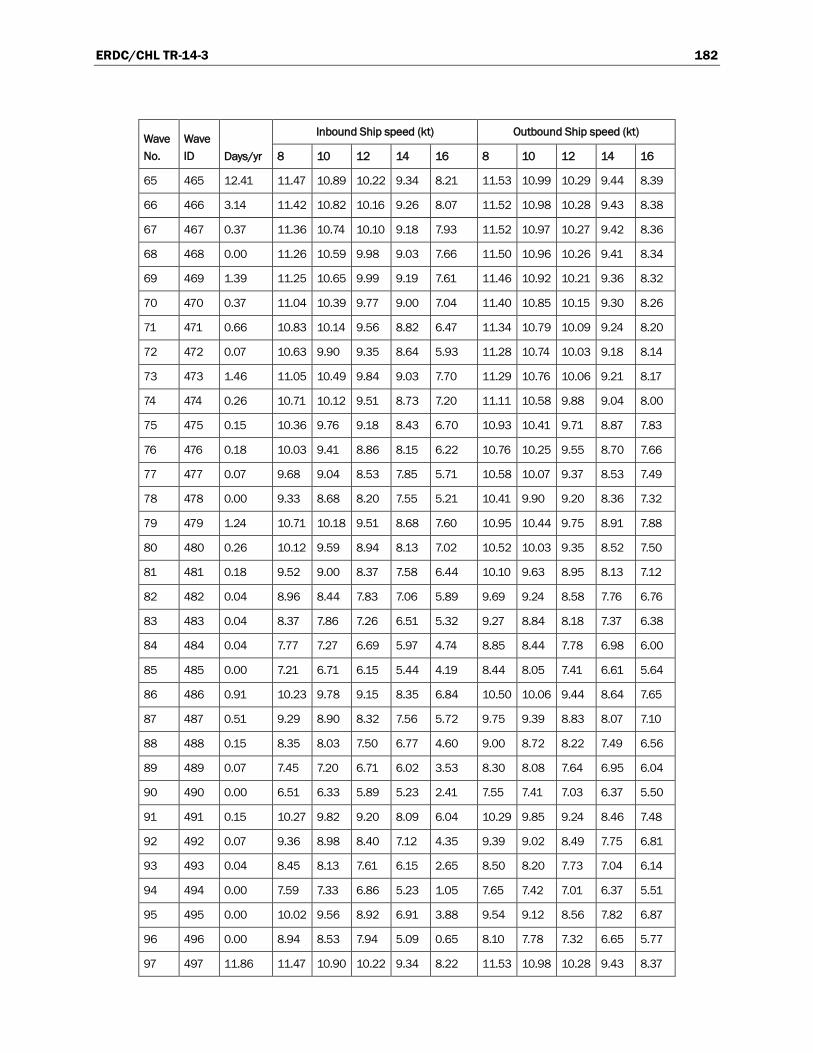
ERDC/CHL TR-14-3 182
Wave No.
Wave ID Days/yr
Inbound Ship speed (kt) Outbound Ship speed (kt)
8 10 12 14 16 8 10 12 14 16
65 465 12.41 11.47 10.89 10.22 9.34 8.21 11.53 10.99 10.29 9.44 8.39
66 466 3.14 11.42 10.82 10.16 9.26 8.07 11.52 10.98 10.28 9.43 8.38
67 467 0.37 11.36 10.74 10.10 9.18 7.93 11.52 10.97 10.27 9.42 8.36
68 468 0.00 11.26 10.59 9.98 9.03 7.66 11.50 10.96 10.26 9.41 8.34
69 469 1.39 11.25 10.65 9.99 9.19 7.61 11.46 10.92 10.21 9.36 8.32
70 470 0.37 11.04 10.39 9.77 9.00 7.04 11.40 10.85 10.15 9.30 8.26
71 471 0.66 10.83 10.14 9.56 8.82 6.47 11.34 10.79 10.09 9.24 8.20
72 472 0.07 10.63 9.90 9.35 8.64 5.93 11.28 10.74 10.03 9.18 8.14
73 473 1.46 11.05 10.49 9.84 9.03 7.70 11.29 10.76 10.06 9.21 8.17
74 474 0.26 10.71 10.12 9.51 8.73 7.20 11.11 10.58 9.88 9.04 8.00
75 475 0.15 10.36 9.76 9.18 8.43 6.70 10.93 10.41 9.71 8.87 7.83
76 476 0.18 10.03 9.41 8.86 8.15 6.22 10.76 10.25 9.55 8.70 7.66
77 477 0.07 9.68 9.04 8.53 7.85 5.71 10.58 10.07 9.37 8.53 7.49
78 478 0.00 9.33 8.68 8.20 7.55 5.21 10.41 9.90 9.20 8.36 7.32
79 479 1.24 10.71 10.18 9.51 8.68 7.60 10.95 10.44 9.75 8.91 7.88
80 480 0.26 10.12 9.59 8.94 8.13 7.02 10.52 10.03 9.35 8.52 7.50
81 481 0.18 9.52 9.00 8.37 7.58 6.44 10.10 9.63 8.95 8.13 7.12
82 482 0.04 8.96 8.44 7.83 7.06 5.89 9.69 9.24 8.58 7.76 6.76
83 483 0.04 8.37 7.86 7.26 6.51 5.32 9.27 8.84 8.18 7.37 6.38
84 484 0.04 7.77 7.27 6.69 5.97 4.74 8.85 8.44 7.78 6.98 6.00
85 485 0.00 7.21 6.71 6.15 5.44 4.19 8.44 8.05 7.41 6.61 5.64
86 486 0.91 10.23 9.78 9.15 8.35 6.84 10.50 10.06 9.44 8.64 7.65
87 487 0.51 9.29 8.90 8.32 7.56 5.72 9.75 9.39 8.83 8.07 7.10
88 488 0.15 8.35 8.03 7.50 6.77 4.60 9.00 8.72 8.22 7.49 6.56
89 489 0.07 7.45 7.20 6.71 6.02 3.53 8.30 8.08 7.64 6.95 6.04
90 490 0.00 6.51 6.33 5.89 5.23 2.41 7.55 7.41 7.03 6.37 5.50
91 491 0.15 10.27 9.82 9.20 8.09 6.04 10.29 9.85 9.24 8.46 7.48
92 492 0.07 9.36 8.98 8.40 7.12 4.35 9.39 9.02 8.49 7.75 6.81
93 493 0.04 8.45 8.13 7.61 6.15 2.65 8.50 8.20 7.73 7.04 6.14
94 494 0.00 7.59 7.33 6.86 5.23 1.05 7.65 7.42 7.01 6.37 5.51
95 495 0.00 10.02 9.56 8.92 6.91 3.88 9.54 9.12 8.56 7.82 6.87
96 496 0.00 8.94 8.53 7.94 5.09 0.65 8.10 7.78 7.32 6.65 5.77
97 497 11.86 11.47 10.90 10.22 9.34 8.22 11.53 10.98 10.28 9.43 8.37

ERDC/CHL TR-14-3 183
Wave No.
Wave ID Days/yr
Inbound Ship speed (kt) Outbound Ship speed (kt)
8 10 12 14 16 8 10 12 14 16
98 498 3.07 11.42 10.83 10.16 9.27 8.09 11.52 10.97 10.27 9.42 8.35
99 499 0.58 11.37 10.76 10.11 9.19 7.96 11.51 10.96 10.25 9.40 8.32
100 500 0.04 11.33 10.69 10.05 9.12 7.83 11.50 10.94 10.24 9.39 8.29
101 501 1.10 11.26 10.66 10.01 9.20 7.66 11.44 10.90 10.19 9.34 8.28
102 502 0.29 11.06 10.42 9.79 9.02 7.12 11.37 10.82 10.12 9.27 8.19
103 503 0.47 10.86 10.18 9.58 8.83 6.58 11.30 10.75 10.04 9.19 8.09
104 504 0.07 10.67 9.95 9.38 8.66 6.07 11.23 10.67 9.97 9.12 8.01
105 505 0.00 10.48 9.72 9.18 8.49 5.55 11.17 10.60 9.89 9.05 7.92
106 506 0.88 11.07 10.50 9.84 9.03 7.73 11.26 10.72 10.02 9.17 8.13
107 507 0.15 10.73 10.15 9.51 8.73 7.25 11.06 10.53 9.82 8.98 7.94
108 508 0.11 10.39 9.79 9.18 8.42 6.76 10.86 10.33 9.62 8.78 7.74
109 509 0.15 10.07 9.45 8.87 8.14 6.30 10.68 10.14 9.43 8.59 7.55
110 510 0.07 9.75 9.11 8.55 7.85 5.84 10.49 9.95 9.25 8.40 7.36
111 511 0.00 9.34 8.68 8.16 7.49 5.26 10.25 9.72 9.01 8.17 7.13
112 512 0.62 10.69 10.16 9.48 8.66 7.62 10.89 10.37 9.68 8.84 7.81
113 513 0.26 10.09 9.56 8.90 8.09 7.05 10.42 9.92 9.23 8.40 7.38
114 514 0.15 9.48 8.96 8.31 7.52 6.48 9.96 9.48 8.79 7.96 6.95
115 515 0.11 8.90 8.39 7.76 6.98 5.94 9.51 9.05 8.37 7.55 6.55
116 516 0.00 8.33 7.82 7.20 6.44 5.40 9.07 8.62 7.94 7.13 6.14
117 517 0.00 7.60 7.10 6.50 5.76 4.72 8.51 8.09 7.41 6.61 5.63
118 518 0.73 10.01 9.56 8.93 8.10 6.89 10.28 9.85 9.22 8.41 7.41
119 519 0.22 8.91 8.53 7.94 7.14 5.81 9.39 9.02 8.45 7.66 6.69
120 520 0.11 7.82 7.49 6.96 6.17 4.73 8.49 8.20 7.68 6.91 5.97
121 521 0.07 6.78 6.51 6.03 5.25 3.70 7.64 7.42 6.94 6.20 5.29
122 522 0.04 5.74 5.53 5.09 4.34 2.67 6.78 6.63 6.21 5.49 4.61
123 523 0.00 4.43 4.30 3.92 3.18 1.36 5.71 5.64 5.29 4.60 3.74
124 524 0.11 9.82 9.37 8.75 7.93 6.11 9.88 9.43 8.81 8.01 7.02
125 525 0.04 8.59 8.20 7.65 6.85 4.47 8.69 8.30 7.75 6.98 6.03
126 526 0.04 7.36 7.03 6.54 5.76 2.83 7.51 7.17 6.68 5.95 5.04
127 527 0.00 9.13 8.67 8.11 6.96 4.09 8.56 8.09 7.52 6.75 5.81
128 528 0.04 7.40 7.01 6.54 5.18 1.00 6.43 6.02 5.54 4.83 3.95
129 529 0.04 5.68 5.35 4.97 3.40 -2.10 4.30 3.94 3.56 2.90 2.09
130 530 18.03 11.48 10.91 10.23 9.36 8.25 11.52 10.97 10.27 9.42 8.35
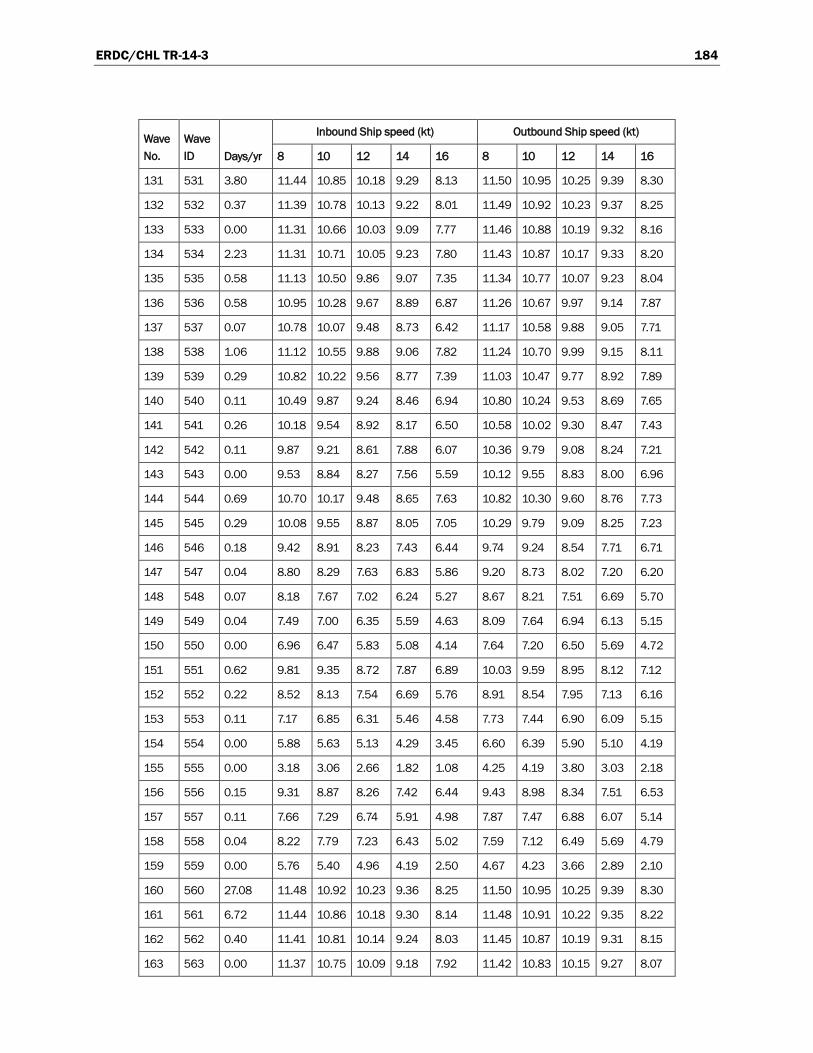
ERDC/CHL TR-14-3 184
Wave No.
Wave ID Days/yr
Inbound Ship speed (kt) Outbound Ship speed (kt)
8 10 12 14 16 8 10 12 14 16
131 531 3.80 11.44 10.85 10.18 9.29 8.13 11.50 10.95 10.25 9.39 8.30
132 532 0.37 11.39 10.78 10.13 9.22 8.01 11.49 10.92 10.23 9.37 8.25
133 533 0.00 11.31 10.66 10.03 9.09 7.77 11.46 10.88 10.19 9.32 8.16
134 534 2.23 11.31 10.71 10.05 9.23 7.80 11.43 10.87 10.17 9.33 8.20
135 535 0.58 11.13 10.50 9.86 9.07 7.35 11.34 10.77 10.07 9.23 8.04
136 536 0.58 10.95 10.28 9.67 8.89 6.87 11.26 10.67 9.97 9.14 7.87
137 537 0.07 10.78 10.07 9.48 8.73 6.42 11.17 10.58 9.88 9.05 7.71
138 538 1.06 11.12 10.55 9.88 9.06 7.82 11.24 10.70 9.99 9.15 8.11
139 539 0.29 10.82 10.22 9.56 8.77 7.39 11.03 10.47 9.77 8.92 7.89
140 540 0.11 10.49 9.87 9.24 8.46 6.94 10.80 10.24 9.53 8.69 7.65
141 541 0.26 10.18 9.54 8.92 8.17 6.50 10.58 10.02 9.30 8.47 7.43
142 542 0.11 9.87 9.21 8.61 7.88 6.07 10.36 9.79 9.08 8.24 7.21
143 543 0.00 9.53 8.84 8.27 7.56 5.59 10.12 9.55 8.83 8.00 6.96
144 544 0.69 10.70 10.17 9.48 8.65 7.63 10.82 10.30 9.60 8.76 7.73
145 545 0.29 10.08 9.55 8.87 8.05 7.05 10.29 9.79 9.09 8.25 7.23
146 546 0.18 9.42 8.91 8.23 7.43 6.44 9.74 9.24 8.54 7.71 6.71
147 547 0.04 8.80 8.29 7.63 6.83 5.86 9.20 8.73 8.02 7.20 6.20
148 548 0.07 8.18 7.67 7.02 6.24 5.27 8.67 8.21 7.51 6.69 5.70
149 549 0.04 7.49 7.00 6.35 5.59 4.63 8.09 7.64 6.94 6.13 5.15
150 550 0.00 6.96 6.47 5.83 5.08 4.14 7.64 7.20 6.50 5.69 4.72
151 551 0.62 9.81 9.35 8.72 7.87 6.89 10.03 9.59 8.95 8.12 7.12
152 552 0.22 8.52 8.13 7.54 6.69 5.76 8.91 8.54 7.95 7.13 6.16
153 553 0.11 7.17 6.85 6.31 5.46 4.58 7.73 7.44 6.90 6.09 5.15
154 554 0.00 5.88 5.63 5.13 4.29 3.45 6.60 6.39 5.90 5.10 4.19
155 555 0.00 3.18 3.06 2.66 1.82 1.08 4.25 4.19 3.80 3.03 2.18
156 556 0.15 9.31 8.87 8.26 7.42 6.44 9.43 8.98 8.34 7.51 6.53
157 557 0.11 7.66 7.29 6.74 5.91 4.98 7.87 7.47 6.88 6.07 5.14
158 558 0.04 8.22 7.79 7.23 6.43 5.02 7.59 7.12 6.49 5.69 4.79
159 559 0.00 5.76 5.40 4.96 4.19 2.50 4.67 4.23 3.66 2.89 2.10
160 560 27.08 11.48 10.92 10.23 9.36 8.25 11.50 10.95 10.25 9.39 8.30
161 561 6.72 11.44 10.86 10.18 9.30 8.14 11.48 10.91 10.22 9.35 8.22
162 562 0.40 11.41 10.81 10.14 9.24 8.03 11.45 10.87 10.19 9.31 8.15
163 563 0.00 11.37 10.75 10.09 9.18 7.92 11.42 10.83 10.15 9.27 8.07
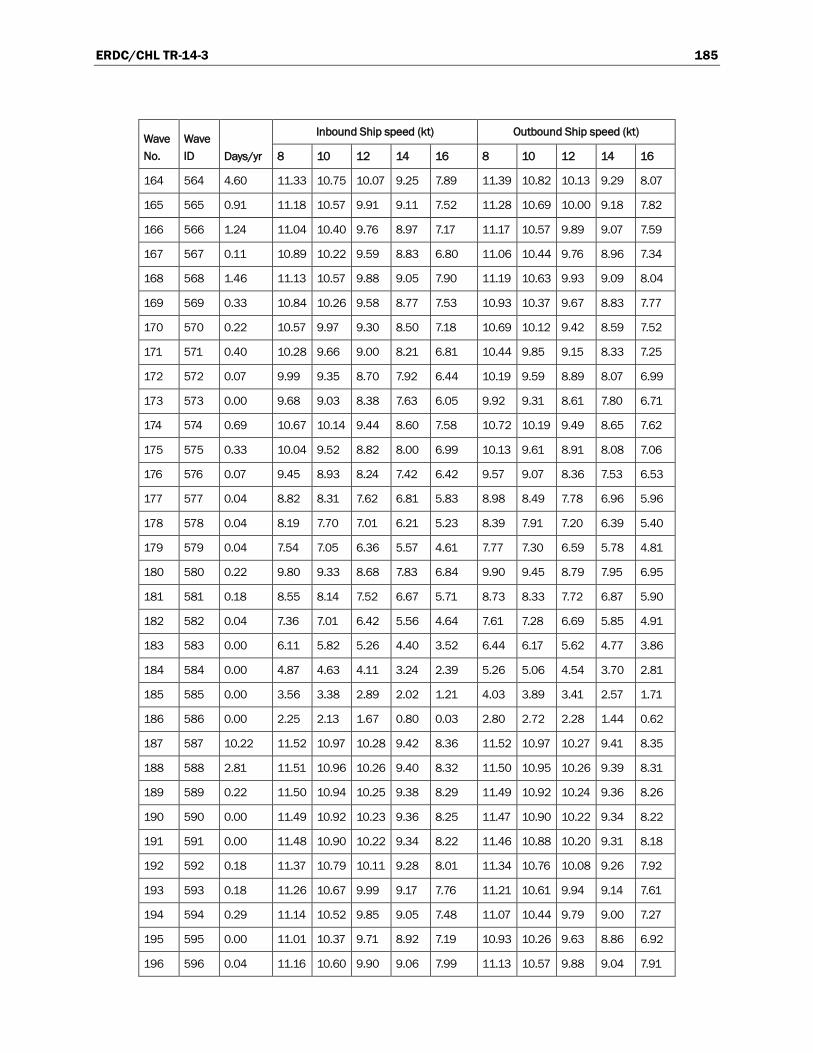
ERDC/CHL TR-14-3 185
Wave No.
Wave ID Days/yr
Inbound Ship speed (kt) Outbound Ship speed (kt)
8 10 12 14 16 8 10 12 14 16
164 564 4.60 11.33 10.75 10.07 9.25 7.89 11.39 10.82 10.13 9.29 8.07
165 565 0.91 11.18 10.57 9.91 9.11 7.52 11.28 10.69 10.00 9.18 7.82
166 566 1.24 11.04 10.40 9.76 8.97 7.17 11.17 10.57 9.89 9.07 7.59
167 567 0.11 10.89 10.22 9.59 8.83 6.80 11.06 10.44 9.76 8.96 7.34
168 568 1.46 11.13 10.57 9.88 9.05 7.90 11.19 10.63 9.93 9.09 8.04
169 569 0.33 10.84 10.26 9.58 8.77 7.53 10.93 10.37 9.67 8.83 7.77
170 570 0.22 10.57 9.97 9.30 8.50 7.18 10.69 10.12 9.42 8.59 7.52
171 571 0.40 10.28 9.66 9.00 8.21 6.81 10.44 9.85 9.15 8.33 7.25
172 572 0.07 9.99 9.35 8.70 7.92 6.44 10.19 9.59 8.89 8.07 6.99
173 573 0.00 9.68 9.03 8.38 7.63 6.05 9.92 9.31 8.61 7.80 6.71
174 574 0.69 10.67 10.14 9.44 8.60 7.58 10.72 10.19 9.49 8.65 7.62
175 575 0.33 10.04 9.52 8.82 8.00 6.99 10.13 9.61 8.91 8.08 7.06
176 576 0.07 9.45 8.93 8.24 7.42 6.42 9.57 9.07 8.36 7.53 6.53
177 577 0.04 8.82 8.31 7.62 6.81 5.83 8.98 8.49 7.78 6.96 5.96
178 578 0.04 8.19 7.70 7.01 6.21 5.23 8.39 7.91 7.20 6.39 5.40
179 579 0.04 7.54 7.05 6.36 5.57 4.61 7.77 7.30 6.59 5.78 4.81
180 580 0.22 9.80 9.33 8.68 7.83 6.84 9.90 9.45 8.79 7.95 6.95
181 581 0.18 8.55 8.14 7.52 6.67 5.71 8.73 8.33 7.72 6.87 5.90
182 582 0.04 7.36 7.01 6.42 5.56 4.64 7.61 7.28 6.69 5.85 4.91
183 583 0.00 6.11 5.82 5.26 4.40 3.52 6.44 6.17 5.62 4.77 3.86
184 584 0.00 4.87 4.63 4.11 3.24 2.39 5.26 5.06 4.54 3.70 2.81
185 585 0.00 3.56 3.38 2.89 2.02 1.21 4.03 3.89 3.41 2.57 1.71
186 586 0.00 2.25 2.13 1.67 0.80 0.03 2.80 2.72 2.28 1.44 0.62
187 587 10.22 11.52 10.97 10.28 9.42 8.36 11.52 10.97 10.27 9.41 8.35
188 588 2.81 11.51 10.96 10.26 9.40 8.32 11.50 10.95 10.26 9.39 8.31
189 589 0.22 11.50 10.94 10.25 9.38 8.29 11.49 10.92 10.24 9.36 8.26
190 590 0.00 11.49 10.92 10.23 9.36 8.25 11.47 10.90 10.22 9.34 8.22
191 591 0.00 11.48 10.90 10.22 9.34 8.22 11.46 10.88 10.20 9.31 8.18
192 592 0.18 11.37 10.79 10.11 9.28 8.01 11.34 10.76 10.08 9.26 7.92
193 593 0.18 11.26 10.67 9.99 9.17 7.76 11.21 10.61 9.94 9.14 7.61
194 594 0.29 11.14 10.52 9.85 9.05 7.48 11.07 10.44 9.79 9.00 7.27
195 595 0.00 11.01 10.37 9.71 8.92 7.19 10.93 10.26 9.63 8.86 6.92
196 596 0.04 11.16 10.60 9.90 9.06 7.99 11.13 10.57 9.88 9.04 7.91

ERDC/CHL TR-14-3 186
Wave No.
Wave ID Days/yr
Inbound Ship speed (kt) Outbound Ship speed (kt)
8 10 12 14 16 8 10 12 14 16
197 597 0.04 10.92 10.35 9.65 8.82 7.72 10.88 10.30 9.61 8.79 7.60
198 598 0.04 10.66 10.08 9.38 8.56 7.43 10.60 10.00 9.32 8.51 7.26
199 599 0.07 10.38 9.78 9.09 8.28 7.13 10.30 9.69 9.01 8.22 6.90
200 600 0.00 10.16 9.55 8.86 8.05 6.88 10.06 9.43 8.77 7.98 6.61
201 601 0.00 10.67 10.14 9.44 8.60 7.58 10.64 10.11 9.41 8.58 7.55
202 602 0.04 10.13 9.61 8.91 8.07 7.06 10.08 9.56 8.86 8.03 7.02
203 603 0.00 9.52 9.02 8.31 7.48 6.48 9.46 8.95 8.25 7.43 6.43
204 604 0.00 8.89 8.39 7.69 6.87 5.88 8.81 8.31 7.61 6.80 5.81
205 605 0.00 8.38 7.89 7.18 6.37 5.39 8.28 7.78 7.09 6.28 5.30
206 606 0.00 7.59 7.12 6.41 5.61 4.64 7.47 6.99 6.29 5.50 4.53
207 607 0.04 9.70 9.25 8.61 7.76 6.76 9.64 9.19 8.55 7.69 6.70
208 608 0.04 8.55 8.17 7.56 6.70 5.74 8.46 8.07 7.46 6.60 5.65
209 609 0.00 7.28 6.96 6.39 5.53 4.60 7.15 6.82 6.25 5.38 4.47
210 610 0.00 5.94 5.69 5.16 4.30 3.41 5.77 5.51 4.98 4.11 3.23
211 611 0.00 2.57 2.49 2.06 1.20 0.40 2.29 2.20 1.77 0.89 0.11
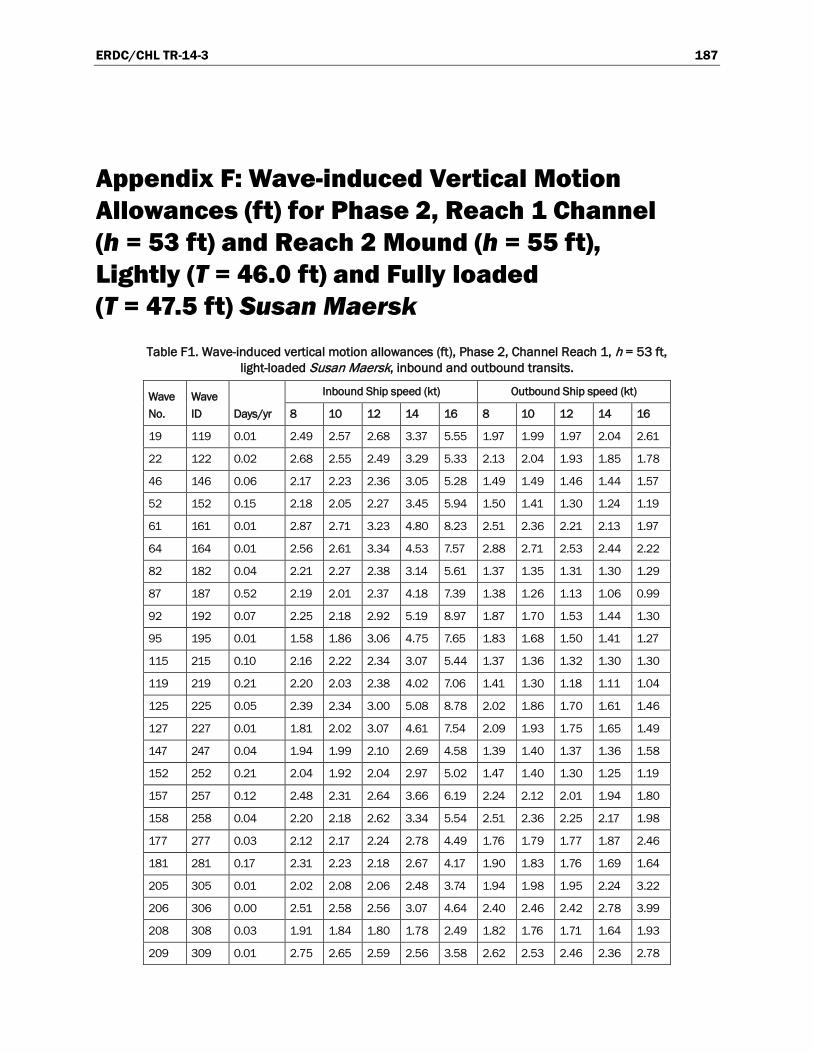
ERDC/CHL TR-14-3 187
Appendix F: Wave-induced Vertical Motion Allowances (ft) for Phase 2, Reach 1 Channel (h = 53 ft) and Reach 2 Mound (h = 55 ft), Lightly (T = 46.0 ft) and Fully loaded (T = 47.5 ft) Susan Maersk
Table F1. Wave-induced vertical motion allowances (ft), Phase 2, Channel Reach 1, h = 53 ft, light-loaded Susan Maersk, inbound and outbound transits.
Wave No.
Wave ID Days/yr
Inbound Ship speed (kt) Outbound Ship speed (kt)
8 10 12 14 16 8 10 12 14 16
19 119 0.01 2.49 2.57 2.68 3.37 5.55 1.97 1.99 1.97 2.04 2.61
22 122 0.02 2.68 2.55 2.49 3.29 5.33 2.13 2.04 1.93 1.85 1.78
46 146 0.06 2.17 2.23 2.36 3.05 5.28 1.49 1.49 1.46 1.44 1.57
52 152 0.15 2.18 2.05 2.27 3.45 5.94 1.50 1.41 1.30 1.24 1.19
61 161 0.01 2.87 2.71 3.23 4.80 8.23 2.51 2.36 2.21 2.13 1.97
64 164 0.01 2.56 2.61 3.34 4.53 7.57 2.88 2.71 2.53 2.44 2.22
82 182 0.04 2.21 2.27 2.38 3.14 5.61 1.37 1.35 1.31 1.30 1.29
87 187 0.52 2.19 2.01 2.37 4.18 7.39 1.38 1.26 1.13 1.06 0.99
92 192 0.07 2.25 2.18 2.92 5.19 8.97 1.87 1.70 1.53 1.44 1.30
95 195 0.01 1.58 1.86 3.06 4.75 7.65 1.83 1.68 1.50 1.41 1.27
115 215 0.10 2.16 2.22 2.34 3.07 5.44 1.37 1.36 1.32 1.30 1.30
119 219 0.21 2.20 2.03 2.38 4.02 7.06 1.41 1.30 1.18 1.11 1.04
125 225 0.05 2.39 2.34 3.00 5.08 8.78 2.02 1.86 1.70 1.61 1.46
127 227 0.01 1.81 2.02 3.07 4.61 7.54 2.09 1.93 1.75 1.65 1.49
147 247 0.04 1.94 1.99 2.10 2.69 4.58 1.39 1.40 1.37 1.36 1.58
152 252 0.21 2.04 1.92 2.04 2.97 5.02 1.47 1.40 1.30 1.25 1.19
157 257 0.12 2.48 2.31 2.64 3.66 6.19 2.24 2.12 2.01 1.94 1.80
158 258 0.04 2.20 2.18 2.62 3.34 5.54 2.51 2.36 2.25 2.17 1.98
177 277 0.03 2.12 2.17 2.24 2.78 4.49 1.76 1.79 1.77 1.87 2.46
181 281 0.17 2.31 2.23 2.18 2.67 4.17 1.90 1.83 1.76 1.69 1.64
205 305 0.01 2.02 2.08 2.06 2.48 3.74 1.94 1.98 1.95 2.24 3.22
206 306 0.00 2.51 2.58 2.56 3.07 4.64 2.40 2.46 2.42 2.78 3.99
208 308 0.03 1.91 1.84 1.80 1.78 2.49 1.82 1.76 1.71 1.64 1.93
209 309 0.01 2.75 2.65 2.59 2.56 3.58 2.62 2.53 2.46 2.36 2.78

ERDC/CHL TR-14-3 188
Table F2. Wave-induced vertical motion allowances (ft), Phase 2, Mound Reach 2, h = 55, 56, and 57 ft, light-loaded Susan Maersk, inbound and outbound transits.
Wave No.
Wave ID Days/yr
Inbound Ship speed (kt) Outbound Ship speed (kt)
8 10 12 14 16 8 10 12 14 16
h=55 ft
19 419 0.01 2.74 2.83 2.80 3.34 5.84 2.07 2.07 2.03 2.01 2.11
22 422 0.02 2.55 2.42 2.49 2.95 5.83 1.98 1.88 1.75 1.68 1.61
46 446 0.06 2.34 2.40 2.38 2.89 5.29 1.60 1.58 1.53 1.50 1.49
52 452 0.15 2.02 1.90 2.15 2.71 6.05 1.41 1.31 1.18 1.11 1.06
61 461 0.01 2.31 2.22 2.80 3.82 8.51 2.10 1.96 1.80 1.70 1.57
64 464 0.01 1.79 1.92 2.83 3.94 8.16 2.20 2.08 1.91 1.81 1.66
82 482 0.04 2.58 2.65 2.61 3.17 5.88 1.73 1.70 1.64 1.61 1.59
87 487 0.52 2.54 2.35 2.70 3.47 8.07 1.79 1.64 1.47 1.37 1.29
92 492 0.07 2.55 2.43 3.17 4.46 10.19 2.30 2.12 1.92 1.80 1.65
95 495 0.01 1.80 2.00 3.20 4.55 9.54 2.24 2.08 1.89 1.77 1.62
115 515 0.10 2.54 2.60 2.59 3.10 5.50 1.85 1.84 1.80 1.78 1.76
119 519 0.21 2.81 2.65 2.84 3.44 7.13 2.12 2.00 1.84 1.75 1.68
125 525 0.05 3.35 3.17 3.66 4.65 9.54 3.08 2.94 2.75 2.65 2.49
127 527 0.01 2.94 2.95 3.72 4.78 9.35 3.50 3.37 3.18 3.07 2.85
147 547 0.04 2.12 2.18 2.12 2.48 4.15 1.75 1.77 1.74 1.73 2.02
152 552 0.21 2.38 2.28 2.24 2.48 4.37 1.97 1.90 1.80 1.73 1.67
157 557 0.12 3.05 2.93 2.92 3.32 5.67 2.95 2.85 2.73 2.68 2.59
158 558 0.04 2.71 2.62 2.86 3.19 5.30 3.34 3.23 3.14 3.07 2.93
177 577 0.03 2.11 2.16 2.11 2.32 3.59 1.96 2.00 1.97 1.96 2.70
181 581 0.17 2.26 2.19 2.16 2.08 3.02 2.08 2.02 1.96 1.90 1.89
205 605 0.01 2.25 2.30 2.26 2.31 3.28 2.33 2.40 2.34 2.51 3.78
206 606 0.00 2.63 2.69 2.64 2.69 3.83 2.72 2.79 2.74 2.93 4.42
208 608 0.03 2.04 1.98 1.92 1.86 2.02 2.12 2.06 2.02 1.94 2.56
209 609 0.01 2.76 2.68 2.60 2.51 2.74 2.87 2.78 2.73 2.63 3.46
h=56 ft
19 419 0.01 2.81 2.88 2.78 3.28 5.65 2.16 2.17 2.12 2.09 2.09
22 422 0.02 2.56 2.43 2.46 2.90 5.69 2.05 1.95 1.81 1.74 1.67
46 446 0.06 2.39 2.44 2.36 2.83 5.11 1.68 1.65 1.60 1.57 1.55
52 452 0.15 2.02 1.89 2.12 2.65 5.89 1.47 1.36 1.24 1.16 1.10
61 461 0.01 2.28 2.17 2.71 3.66 8.55 2.15 2.01 1.85 1.75 1.62

ERDC/CHL TR-14-3 189
Wave No.
Wave ID Days/yr
Inbound Ship speed (kt) Outbound Ship speed (kt)
8 10 12 14 16 8 10 12 14 16
64 464 0.01 1.77 1.85 2.71 3.70 8.58 2.23 2.11 1.95 1.85 1.72
82 482 0.04 2.64 2.69 2.58 3.12 5.68 1.82 1.78 1.72 1.69 1.66
87 487 0.52 2.53 2.35 2.66 3.39 7.86 1.87 1.71 1.54 1.44 1.35
92 492 0.07 2.52 2.37 3.08 4.26 10.26 2.36 2.18 1.98 1.86 1.72
95 495 0.01 1.79 1.92 3.05 4.25 10.10 2.28 2.13 1.94 1.82 1.68
115 515 0.10 2.60 2.65 2.57 3.04 5.32 1.94 1.93 1.88 1.85 1.83
119 519 0.21 2.82 2.66 2.81 3.38 6.96 2.19 2.07 1.91 1.82 1.74
125 525 0.05 3.31 3.14 3.57 4.48 9.54 3.11 2.99 2.79 2.69 2.54
127 527 0.01 2.88 2.85 3.58 4.55 9.65 3.49 3.39 3.21 3.10 2.91
147 547 0.04 2.18 2.23 2.17 2.45 4.03 1.83 1.85 1.81 1.79 1.99
152 552 0.21 2.40 2.30 2.27 2.45 4.28 2.03 1.95 1.85 1.78 1.72
157 557 0.12 3.02 2.90 2.86 3.24 5.63 2.92 2.83 2.72 2.66 2.58
158 558 0.04 2.62 2.54 2.75 3.07 5.32 3.25 3.16 3.08 3.02 2.89
177 577 0.03 2.18 2.23 2.18 2.29 3.50 2.04 2.07 2.04 2.02 2.64
181 581 0.17 2.30 2.23 2.20 2.12 2.98 2.14 2.08 2.01 1.95 1.89
205 605 0.01 2.34 2.39 2.35 2.32 3.21 2.42 2.47 2.43 2.48 3.69
206 606 0.00 2.73 2.78 2.74 2.71 3.74 2.82 2.89 2.83 2.90 4.31
208 608 0.03 2.08 2.02 1.97 1.90 2.01 2.16 2.10 2.06 1.98 2.53
209 609 0.01 2.82 2.74 2.67 2.58 2.72 2.92 2.84 2.78 2.69 3.42
h=57 ft
19 419 0.01 2.88 2.95 2.84 3.25 5.09 2.26 2.25 2.20 2.17 2.14
22 422 0.02 2.57 2.45 2.44 2.85 4.51 2.11 2.01 1.87 1.79 1.73
46 446 0.06 2.44 2.49 2.38 2.80 4.57 1.76 1.73 1.67 1.63 1.61
52 452 0.15 2.01 1.90 2.09 2.59 4.64 1.53 1.42 1.29 1.21 1.15
61 461 0.01 2.26 2.13 2.63 3.51 7.72 2.19 2.05 1.89 1.79 1.71
64 464 0.01 1.75 1.78 2.57 3.47 8.88 2.26 2.15 1.99 1.89 1.82
82 482 0.04 2.69 2.74 2.62 3.07 5.07 1.90 1.86 1.80 1.76 1.72
87 487 0.52 2.52 2.35 2.61 3.31 6.12 1.94 1.78 1.60 1.49 1.42
92 492 0.07 2.50 2.33 2.98 4.08 9.30 2.42 2.24 2.04 1.91 1.81
95 495 0.01 1.79 1.85 2.88 3.96 10.52 2.34 2.18 2.00 1.88 1.79
115 515 0.10 2.65 2.71 2.60 3.01 4.78 2.02 2.01 1.95 1.92 1.89
119 519 0.21 2.82 2.68 2.77 3.31 5.48 2.27 2.14 1.97 1.88 1.81
125 525 0.05 3.28 3.12 3.48 4.34 8.54 3.15 3.03 2.84 2.74 2.66

ERDC/CHL TR-14-3 190
Wave No.
Wave ID Days/yr
Inbound Ship speed (kt) Outbound Ship speed (kt)
8 10 12 14 16 8 10 12 14 16
127 527 0.01 2.83 2.76 3.43 4.34 9.80 3.49 3.40 3.23 3.13 3.06
147 547 0.04 2.24 2.29 2.23 2.42 3.64 1.90 1.92 1.88 1.85 1.89
152 552 0.21 2.42 2.33 2.29 2.42 3.46 2.09 2.01 1.90 1.83 1.78
157 557 0.12 3.00 2.89 2.83 3.16 5.05 2.90 2.81 2.70 2.65 2.61
158 558 0.04 2.56 2.47 2.66 2.97 5.27 3.16 3.08 3.01 2.96 2.91
177 577 0.03 2.25 2.30 2.25 2.27 3.20 2.11 2.15 2.11 2.08 2.46
181 581 0.17 2.33 2.27 2.24 2.16 2.55 2.18 2.13 2.06 2.00 1.94
205 605 0.01 2.42 2.47 2.43 2.39 2.97 2.50 2.55 2.50 2.47 3.39
206 606 0.00 2.83 2.88 2.83 2.79 3.47 2.92 2.98 2.92 2.88 3.95
208 608 0.03 2.13 2.07 2.01 1.95 1.89 2.19 2.13 2.09 2.02 2.19
209 609 0.01 2.88 2.80 2.72 2.63 2.56 2.97 2.89 2.83 2.74 2.97
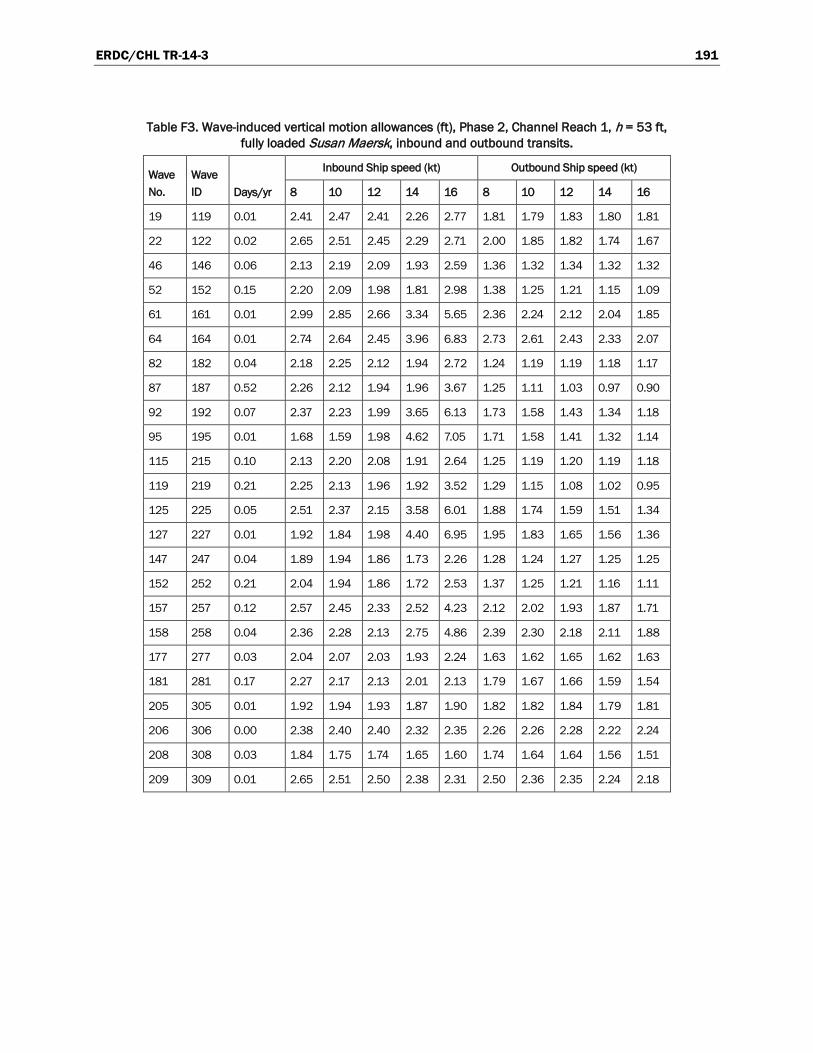
ERDC/CHL TR-14-3 191
Table F3. Wave-induced vertical motion allowances (ft), Phase 2, Channel Reach 1, h = 53 ft, fully loaded Susan Maersk, inbound and outbound transits.
Wave No.
Wave ID Days/yr
Inbound Ship speed (kt) Outbound Ship speed (kt)
8 10 12 14 16 8 10 12 14 16
19 119 0.01 2.41 2.47 2.41 2.26 2.77 1.81 1.79 1.83 1.80 1.81
22 122 0.02 2.65 2.51 2.45 2.29 2.71 2.00 1.85 1.82 1.74 1.67
46 146 0.06 2.13 2.19 2.09 1.93 2.59 1.36 1.32 1.34 1.32 1.32
52 152 0.15 2.20 2.09 1.98 1.81 2.98 1.38 1.25 1.21 1.15 1.09
61 161 0.01 2.99 2.85 2.66 3.34 5.65 2.36 2.24 2.12 2.04 1.85
64 164 0.01 2.74 2.64 2.45 3.96 6.83 2.73 2.61 2.43 2.33 2.07
82 182 0.04 2.18 2.25 2.12 1.94 2.72 1.24 1.19 1.19 1.18 1.17
87 187 0.52 2.26 2.12 1.94 1.96 3.67 1.25 1.11 1.03 0.97 0.90
92 192 0.07 2.37 2.23 1.99 3.65 6.13 1.73 1.58 1.43 1.34 1.18
95 195 0.01 1.68 1.59 1.98 4.62 7.05 1.71 1.58 1.41 1.32 1.14
115 215 0.10 2.13 2.20 2.08 1.91 2.64 1.25 1.19 1.20 1.19 1.18
119 219 0.21 2.25 2.13 1.96 1.92 3.52 1.29 1.15 1.08 1.02 0.95
125 225 0.05 2.51 2.37 2.15 3.58 6.01 1.88 1.74 1.59 1.51 1.34
127 227 0.01 1.92 1.84 1.98 4.40 6.95 1.95 1.83 1.65 1.56 1.36
147 247 0.04 1.89 1.94 1.86 1.73 2.26 1.28 1.24 1.27 1.25 1.25
152 252 0.21 2.04 1.94 1.86 1.72 2.53 1.37 1.25 1.21 1.16 1.11
157 257 0.12 2.57 2.45 2.33 2.52 4.23 2.12 2.02 1.93 1.87 1.71
158 258 0.04 2.36 2.28 2.13 2.75 4.86 2.39 2.30 2.18 2.11 1.88
177 277 0.03 2.04 2.07 2.03 1.93 2.24 1.63 1.62 1.65 1.62 1.63
181 281 0.17 2.27 2.17 2.13 2.01 2.13 1.79 1.67 1.66 1.59 1.54
205 305 0.01 1.92 1.94 1.93 1.87 1.90 1.82 1.82 1.84 1.79 1.81
206 306 0.00 2.38 2.40 2.40 2.32 2.35 2.26 2.26 2.28 2.22 2.24
208 308 0.03 1.84 1.75 1.74 1.65 1.60 1.74 1.64 1.64 1.56 1.51
209 309 0.01 2.65 2.51 2.50 2.38 2.31 2.50 2.36 2.35 2.24 2.18

ERDC/CHL TR-14-3 192
Table F4. Wave-induced vertical motion allowances (ft), Phase 2, Mound Reach 2, h = 55, 56, and 57 ft, fully loaded Susan Maersk, inbound and outbound transits.
Wave No.
Wave ID Days/yr
Inbound Ship speed (kt) Outbound Ship speed (kt)
8 10 12 14 16 8 10 12 14 16
h=55 ft
19 419 0.01 2.69 2.72 2.64 2.53 2.87 1.92 1.86 1.89 1.87 1.85
22 422 0.02 2.56 2.40 2.36 2.23 2.81 1.87 1.70 1.65 1.58 1.51
46 446 0.06 2.33 2.34 2.24 2.13 2.55 1.47 1.41 1.42 1.39 1.37
52 452 0.15 2.08 1.93 1.83 1.70 2.84 1.31 1.17 1.09 1.03 0.97
61 461 0.01 2.41 2.23 2.08 3.06 5.13 1.98 1.84 1.69 1.60 1.45
64 464 0.01 1.84 1.75 1.82 3.76 6.07 2.10 1.98 1.81 1.71 1.52
82 482 0.04 2.57 2.59 2.47 2.34 2.82 1.59 1.51 1.52 1.49 1.47
87 487 0.52 2.63 2.41 2.28 2.14 3.78 1.65 1.46 1.35 1.27 1.18
92 492 0.07 2.67 2.45 2.25 3.63 6.11 2.16 1.98 1.80 1.69 1.51
95 495 0.01 1.85 1.74 2.07 4.47 7.02 2.12 1.98 1.78 1.67 1.47
115 515 0.10 2.50 2.52 2.43 2.32 2.68 1.71 1.65 1.67 1.65 1.63
119 519 0.21 2.85 2.66 2.59 2.43 3.41 1.98 1.79 1.72 1.64 1.56
125 525 0.05 3.45 3.26 3.11 3.51 5.80 2.94 2.78 2.65 2.56 2.35
127 527 0.01 3.07 2.96 2.77 4.08 7.01 3.36 3.25 3.06 2.95 2.67
147 547 0.04 2.07 2.07 2.04 1.97 2.05 1.64 1.60 1.63 1.62 1.60
152 552 0.21 2.36 2.22 2.21 2.11 2.15 1.87 1.73 1.70 1.64 1.58
157 557 0.12 3.12 2.97 2.91 2.81 3.44 2.89 2.78 2.70 2.65 2.49
158 558 0.04 2.87 2.76 2.63 2.57 3.68 3.31 3.24 3.15 3.08 2.85
177 577 0.03 2.02 2.02 2.02 1.98 1.95 1.85 1.83 1.86 1.83 1.82
181 581 0.17 2.20 2.08 2.10 2.02 1.95 2.00 1.87 1.88 1.82 1.76
205 605 0.01 2.14 2.12 2.15 2.11 2.09 2.23 2.22 2.24 2.19 2.17
206 606 0.00 2.49 2.47 2.51 2.47 2.44 2.61 2.59 2.61 2.56 2.53
208 608 0.03 1.96 1.84 1.85 1.79 1.73 2.06 1.94 1.96 1.88 1.82
209 609 0.01 2.66 2.50 2.51 2.42 2.34 2.79 2.63 2.65 2.55 2.46
h=56 ft
19 419 0.01 2.76 2.77 2.68 2.60 2.82 2.02 1.95 1.97 1.96 1.93
22 422 0.02 2.57 2.41 2.30 2.26 2.71 1.94 1.76 1.68 1.64 1.57
46 446 0.06 2.37 2.37 2.27 2.19 2.49 1.56 1.48 1.48 1.46 1.43
52 452 0.15 2.06 1.92 1.79 1.71 2.72 1.37 1.22 1.14 1.08 1.01
61 461 0.01 2.36 2.19 2.03 2.85 4.77 2.03 1.88 1.74 1.65 1.50
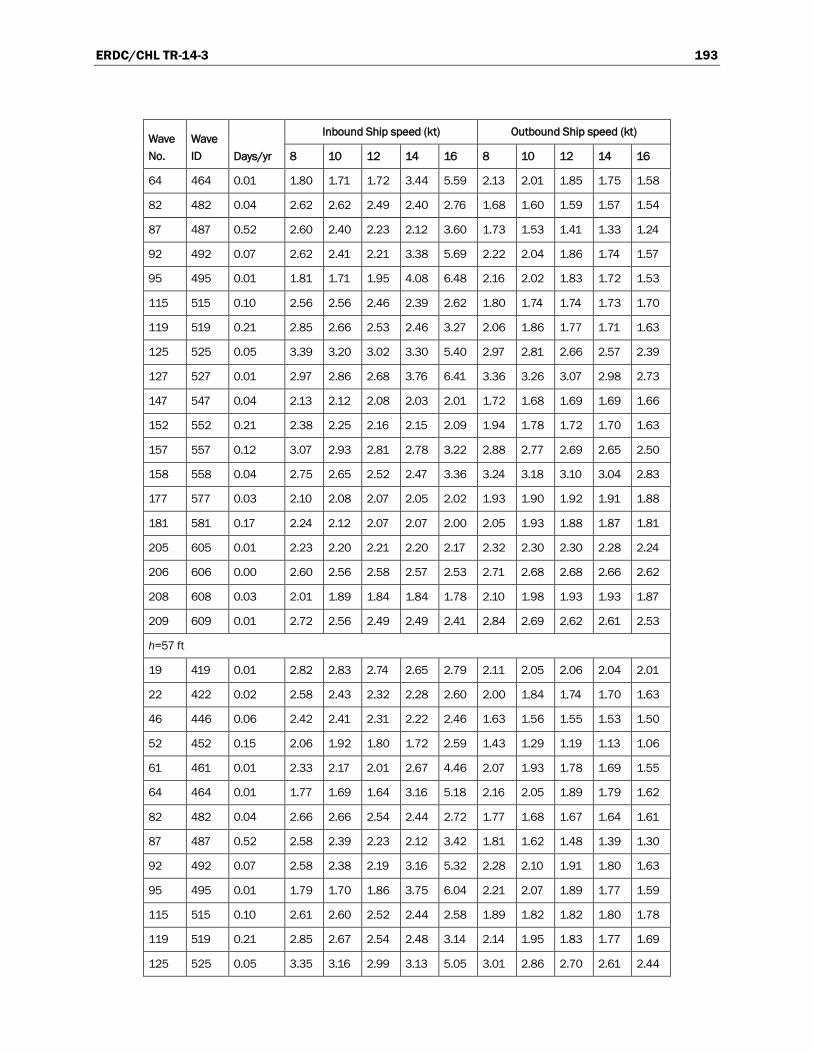
ERDC/CHL TR-14-3 193
Wave No.
Wave ID Days/yr
Inbound Ship speed (kt) Outbound Ship speed (kt)
8 10 12 14 16 8 10 12 14 16
64 464 0.01 1.80 1.71 1.72 3.44 5.59 2.13 2.01 1.85 1.75 1.58
82 482 0.04 2.62 2.62 2.49 2.40 2.76 1.68 1.60 1.59 1.57 1.54
87 487 0.52 2.60 2.40 2.23 2.12 3.60 1.73 1.53 1.41 1.33 1.24
92 492 0.07 2.62 2.41 2.21 3.38 5.69 2.22 2.04 1.86 1.74 1.57
95 495 0.01 1.81 1.71 1.95 4.08 6.48 2.16 2.02 1.83 1.72 1.53
115 515 0.10 2.56 2.56 2.46 2.39 2.62 1.80 1.74 1.74 1.73 1.70
119 519 0.21 2.85 2.66 2.53 2.46 3.27 2.06 1.86 1.77 1.71 1.63
125 525 0.05 3.39 3.20 3.02 3.30 5.40 2.97 2.81 2.66 2.57 2.39
127 527 0.01 2.97 2.86 2.68 3.76 6.41 3.36 3.26 3.07 2.98 2.73
147 547 0.04 2.13 2.12 2.08 2.03 2.01 1.72 1.68 1.69 1.69 1.66
152 552 0.21 2.38 2.25 2.16 2.15 2.09 1.94 1.78 1.72 1.70 1.63
157 557 0.12 3.07 2.93 2.81 2.78 3.22 2.88 2.77 2.69 2.65 2.50
158 558 0.04 2.75 2.65 2.52 2.47 3.36 3.24 3.18 3.10 3.04 2.83
177 577 0.03 2.10 2.08 2.07 2.05 2.02 1.93 1.90 1.92 1.91 1.88
181 581 0.17 2.24 2.12 2.07 2.07 2.00 2.05 1.93 1.88 1.87 1.81
205 605 0.01 2.23 2.20 2.21 2.20 2.17 2.32 2.30 2.30 2.28 2.24
206 606 0.00 2.60 2.56 2.58 2.57 2.53 2.71 2.68 2.68 2.66 2.62
208 608 0.03 2.01 1.89 1.84 1.84 1.78 2.10 1.98 1.93 1.93 1.87
209 609 0.01 2.72 2.56 2.49 2.49 2.41 2.84 2.69 2.62 2.61 2.53
h=57 ft
19 419 0.01 2.82 2.83 2.74 2.65 2.79 2.11 2.05 2.06 2.04 2.01
22 422 0.02 2.58 2.43 2.32 2.28 2.60 2.00 1.84 1.74 1.70 1.63
46 446 0.06 2.42 2.41 2.31 2.22 2.46 1.63 1.56 1.55 1.53 1.50
52 452 0.15 2.06 1.92 1.80 1.72 2.59 1.43 1.29 1.19 1.13 1.06
61 461 0.01 2.33 2.17 2.01 2.67 4.46 2.07 1.93 1.78 1.69 1.55
64 464 0.01 1.77 1.69 1.64 3.16 5.18 2.16 2.05 1.89 1.79 1.62
82 482 0.04 2.66 2.66 2.54 2.44 2.72 1.77 1.68 1.67 1.64 1.61
87 487 0.52 2.58 2.39 2.23 2.12 3.42 1.81 1.62 1.48 1.39 1.30
92 492 0.07 2.58 2.38 2.19 3.16 5.32 2.28 2.10 1.91 1.80 1.63
95 495 0.01 1.79 1.70 1.86 3.75 6.04 2.21 2.07 1.89 1.77 1.59
115 515 0.10 2.61 2.60 2.52 2.44 2.58 1.89 1.82 1.82 1.80 1.78
119 519 0.21 2.85 2.67 2.54 2.48 3.14 2.14 1.95 1.83 1.77 1.69
125 525 0.05 3.35 3.16 2.99 3.13 5.05 3.01 2.86 2.70 2.61 2.44
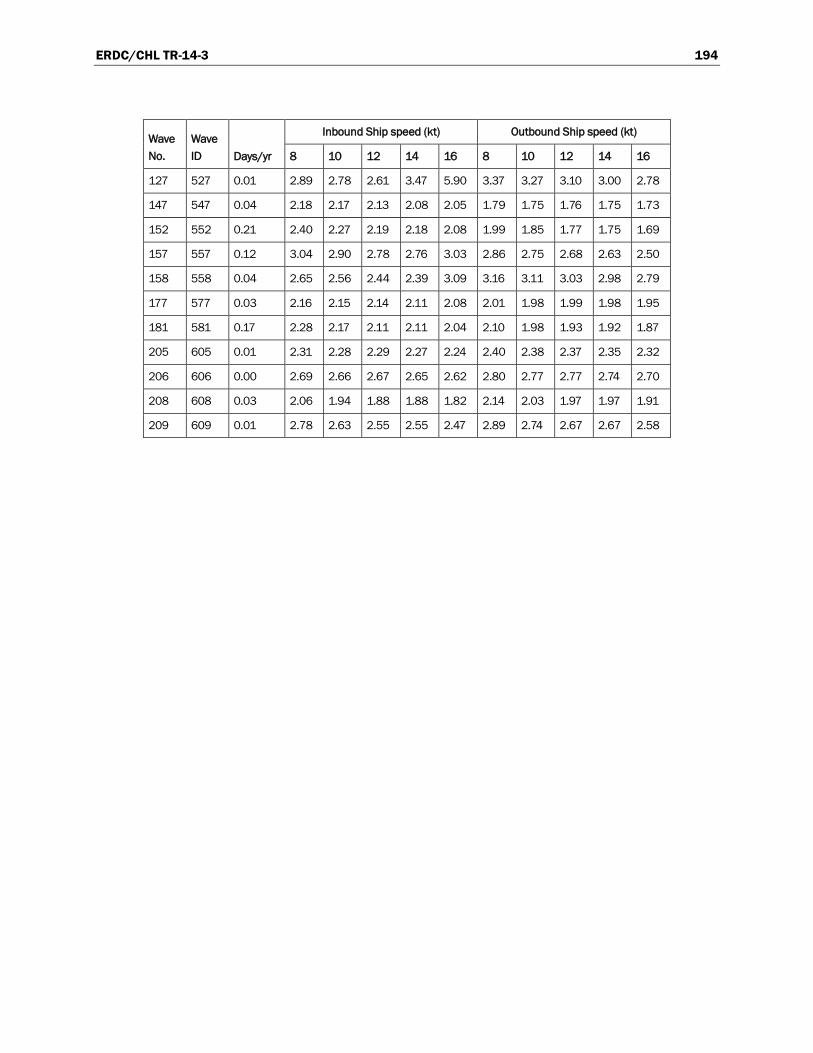
ERDC/CHL TR-14-3 194
Wave No.
Wave ID Days/yr
Inbound Ship speed (kt) Outbound Ship speed (kt)
8 10 12 14 16 8 10 12 14 16
127 527 0.01 2.89 2.78 2.61 3.47 5.90 3.37 3.27 3.10 3.00 2.78
147 547 0.04 2.18 2.17 2.13 2.08 2.05 1.79 1.75 1.76 1.75 1.73
152 552 0.21 2.40 2.27 2.19 2.18 2.08 1.99 1.85 1.77 1.75 1.69
157 557 0.12 3.04 2.90 2.78 2.76 3.03 2.86 2.75 2.68 2.63 2.50
158 558 0.04 2.65 2.56 2.44 2.39 3.09 3.16 3.11 3.03 2.98 2.79
177 577 0.03 2.16 2.15 2.14 2.11 2.08 2.01 1.98 1.99 1.98 1.95
181 581 0.17 2.28 2.17 2.11 2.11 2.04 2.10 1.98 1.93 1.92 1.87
205 605 0.01 2.31 2.28 2.29 2.27 2.24 2.40 2.38 2.37 2.35 2.32
206 606 0.00 2.69 2.66 2.67 2.65 2.62 2.80 2.77 2.77 2.74 2.70
208 608 0.03 2.06 1.94 1.88 1.88 1.82 2.14 2.03 1.97 1.97 1.91
209 609 0.01 2.78 2.63 2.55 2.55 2.47 2.89 2.74 2.67 2.67 2.58
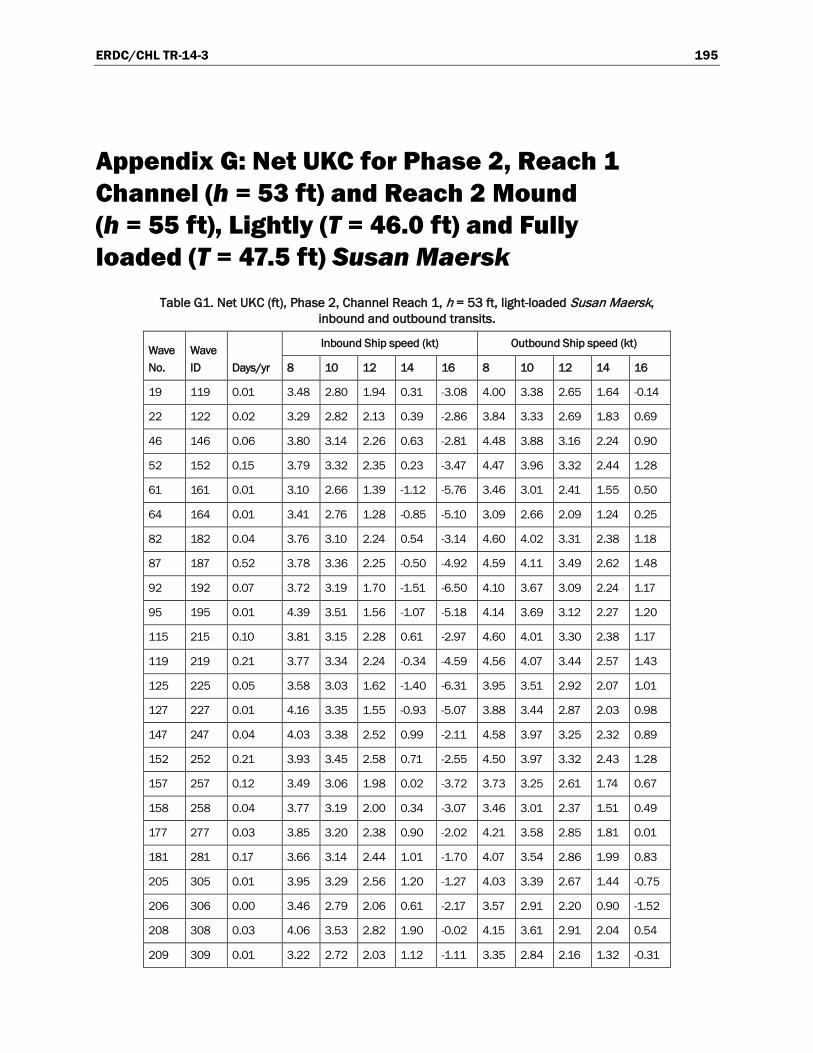
ERDC/CHL TR-14-3 195
Appendix G: Net UKC for Phase 2, Reach 1 Channel (h = 53 ft) and Reach 2 Mound (h = 55 ft), Lightly (T = 46.0 ft) and Fully loaded (T = 47.5 ft) Susan Maersk
Table G1. Net UKC (ft), Phase 2, Channel Reach 1, h = 53 ft, light-loaded Susan Maersk, inbound and outbound transits.
Wave No.
Wave ID Days/yr
Inbound Ship speed (kt) Outbound Ship speed (kt)
8 10 12 14 16 8 10 12 14 16
19 119 0.01 3.48 2.80 1.94 0.31 -3.08 4.00 3.38 2.65 1.64 -0.14
22 122 0.02 3.29 2.82 2.13 0.39 -2.86 3.84 3.33 2.69 1.83 0.69
46 146 0.06 3.80 3.14 2.26 0.63 -2.81 4.48 3.88 3.16 2.24 0.90
52 152 0.15 3.79 3.32 2.35 0.23 -3.47 4.47 3.96 3.32 2.44 1.28
61 161 0.01 3.10 2.66 1.39 -1.12 -5.76 3.46 3.01 2.41 1.55 0.50
64 164 0.01 3.41 2.76 1.28 -0.85 -5.10 3.09 2.66 2.09 1.24 0.25
82 182 0.04 3.76 3.10 2.24 0.54 -3.14 4.60 4.02 3.31 2.38 1.18
87 187 0.52 3.78 3.36 2.25 -0.50 -4.92 4.59 4.11 3.49 2.62 1.48
92 192 0.07 3.72 3.19 1.70 -1.51 -6.50 4.10 3.67 3.09 2.24 1.17
95 195 0.01 4.39 3.51 1.56 -1.07 -5.18 4.14 3.69 3.12 2.27 1.20
115 215 0.10 3.81 3.15 2.28 0.61 -2.97 4.60 4.01 3.30 2.38 1.17
119 219 0.21 3.77 3.34 2.24 -0.34 -4.59 4.56 4.07 3.44 2.57 1.43
125 225 0.05 3.58 3.03 1.62 -1.40 -6.31 3.95 3.51 2.92 2.07 1.01
127 227 0.01 4.16 3.35 1.55 -0.93 -5.07 3.88 3.44 2.87 2.03 0.98
147 247 0.04 4.03 3.38 2.52 0.99 -2.11 4.58 3.97 3.25 2.32 0.89
152 252 0.21 3.93 3.45 2.58 0.71 -2.55 4.50 3.97 3.32 2.43 1.28
157 257 0.12 3.49 3.06 1.98 0.02 -3.72 3.73 3.25 2.61 1.74 0.67
158 258 0.04 3.77 3.19 2.00 0.34 -3.07 3.46 3.01 2.37 1.51 0.49
177 277 0.03 3.85 3.20 2.38 0.90 -2.02 4.21 3.58 2.85 1.81 0.01
181 281 0.17 3.66 3.14 2.44 1.01 -1.70 4.07 3.54 2.86 1.99 0.83
205 305 0.01 3.95 3.29 2.56 1.20 -1.27 4.03 3.39 2.67 1.44 -0.75
206 306 0.00 3.46 2.79 2.06 0.61 -2.17 3.57 2.91 2.20 0.90 -1.52
208 308 0.03 4.06 3.53 2.82 1.90 -0.02 4.15 3.61 2.91 2.04 0.54
209 309 0.01 3.22 2.72 2.03 1.12 -1.11 3.35 2.84 2.16 1.32 -0.31
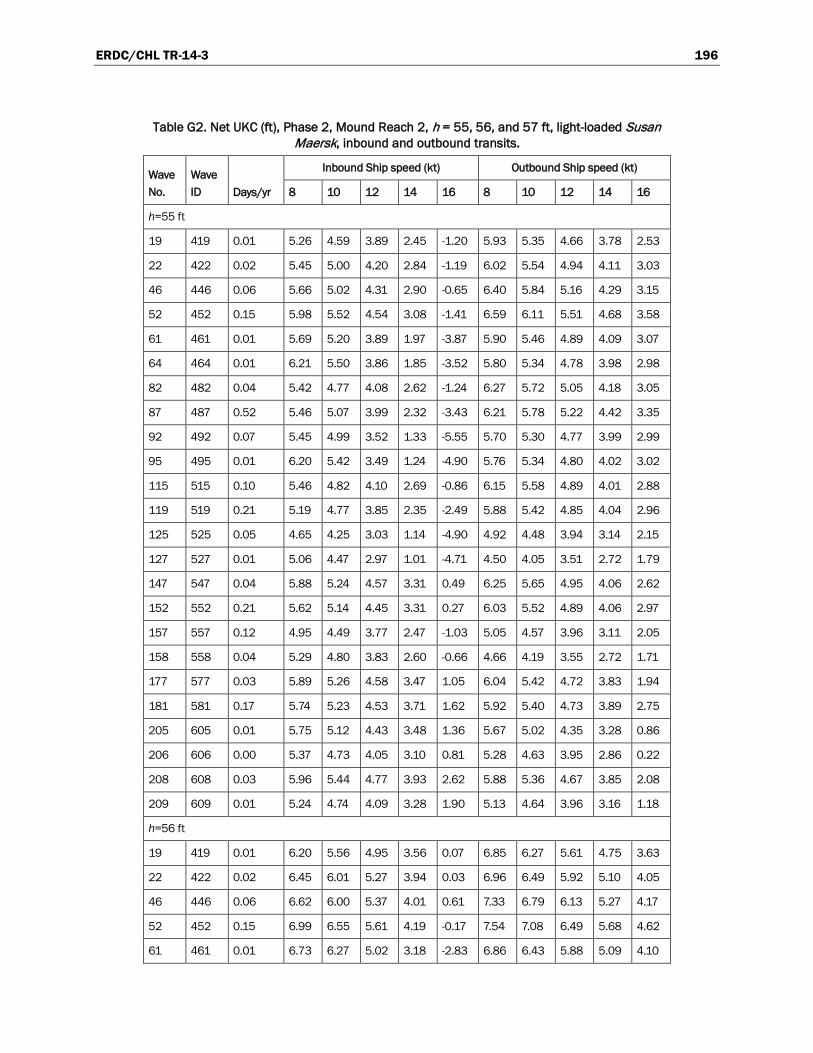
ERDC/CHL TR-14-3 196
Table G2. Net UKC (ft), Phase 2, Mound Reach 2, h = 55, 56, and 57 ft, light-loaded Susan Maersk, inbound and outbound transits.
Wave No.
Wave ID Days/yr
Inbound Ship speed (kt) Outbound Ship speed (kt)
8 10 12 14 16 8 10 12 14 16
h=55 ft
19 419 0.01 5.26 4.59 3.89 2.45 -1.20 5.93 5.35 4.66 3.78 2.53
22 422 0.02 5.45 5.00 4.20 2.84 -1.19 6.02 5.54 4.94 4.11 3.03
46 446 0.06 5.66 5.02 4.31 2.90 -0.65 6.40 5.84 5.16 4.29 3.15
52 452 0.15 5.98 5.52 4.54 3.08 -1.41 6.59 6.11 5.51 4.68 3.58
61 461 0.01 5.69 5.20 3.89 1.97 -3.87 5.90 5.46 4.89 4.09 3.07
64 464 0.01 6.21 5.50 3.86 1.85 -3.52 5.80 5.34 4.78 3.98 2.98
82 482 0.04 5.42 4.77 4.08 2.62 -1.24 6.27 5.72 5.05 4.18 3.05
87 487 0.52 5.46 5.07 3.99 2.32 -3.43 6.21 5.78 5.22 4.42 3.35
92 492 0.07 5.45 4.99 3.52 1.33 -5.55 5.70 5.30 4.77 3.99 2.99
95 495 0.01 6.20 5.42 3.49 1.24 -4.90 5.76 5.34 4.80 4.02 3.02
115 515 0.10 5.46 4.82 4.10 2.69 -0.86 6.15 5.58 4.89 4.01 2.88
119 519 0.21 5.19 4.77 3.85 2.35 -2.49 5.88 5.42 4.85 4.04 2.96
125 525 0.05 4.65 4.25 3.03 1.14 -4.90 4.92 4.48 3.94 3.14 2.15
127 527 0.01 5.06 4.47 2.97 1.01 -4.71 4.50 4.05 3.51 2.72 1.79
147 547 0.04 5.88 5.24 4.57 3.31 0.49 6.25 5.65 4.95 4.06 2.62
152 552 0.21 5.62 5.14 4.45 3.31 0.27 6.03 5.52 4.89 4.06 2.97
157 557 0.12 4.95 4.49 3.77 2.47 -1.03 5.05 4.57 3.96 3.11 2.05
158 558 0.04 5.29 4.80 3.83 2.60 -0.66 4.66 4.19 3.55 2.72 1.71
177 577 0.03 5.89 5.26 4.58 3.47 1.05 6.04 5.42 4.72 3.83 1.94
181 581 0.17 5.74 5.23 4.53 3.71 1.62 5.92 5.40 4.73 3.89 2.75
205 605 0.01 5.75 5.12 4.43 3.48 1.36 5.67 5.02 4.35 3.28 0.86
206 606 0.00 5.37 4.73 4.05 3.10 0.81 5.28 4.63 3.95 2.86 0.22
208 608 0.03 5.96 5.44 4.77 3.93 2.62 5.88 5.36 4.67 3.85 2.08
209 609 0.01 5.24 4.74 4.09 3.28 1.90 5.13 4.64 3.96 3.16 1.18
h=56 ft
19 419 0.01 6.20 5.56 4.95 3.56 0.07 6.85 6.27 5.61 4.75 3.63
22 422 0.02 6.45 6.01 5.27 3.94 0.03 6.96 6.49 5.92 5.10 4.05
46 446 0.06 6.62 6.00 5.37 4.01 0.61 7.33 6.79 6.13 5.27 4.17
52 452 0.15 6.99 6.55 5.61 4.19 -0.17 7.54 7.08 6.49 5.68 4.62
61 461 0.01 6.73 6.27 5.02 3.18 -2.83 6.86 6.43 5.88 5.09 4.10
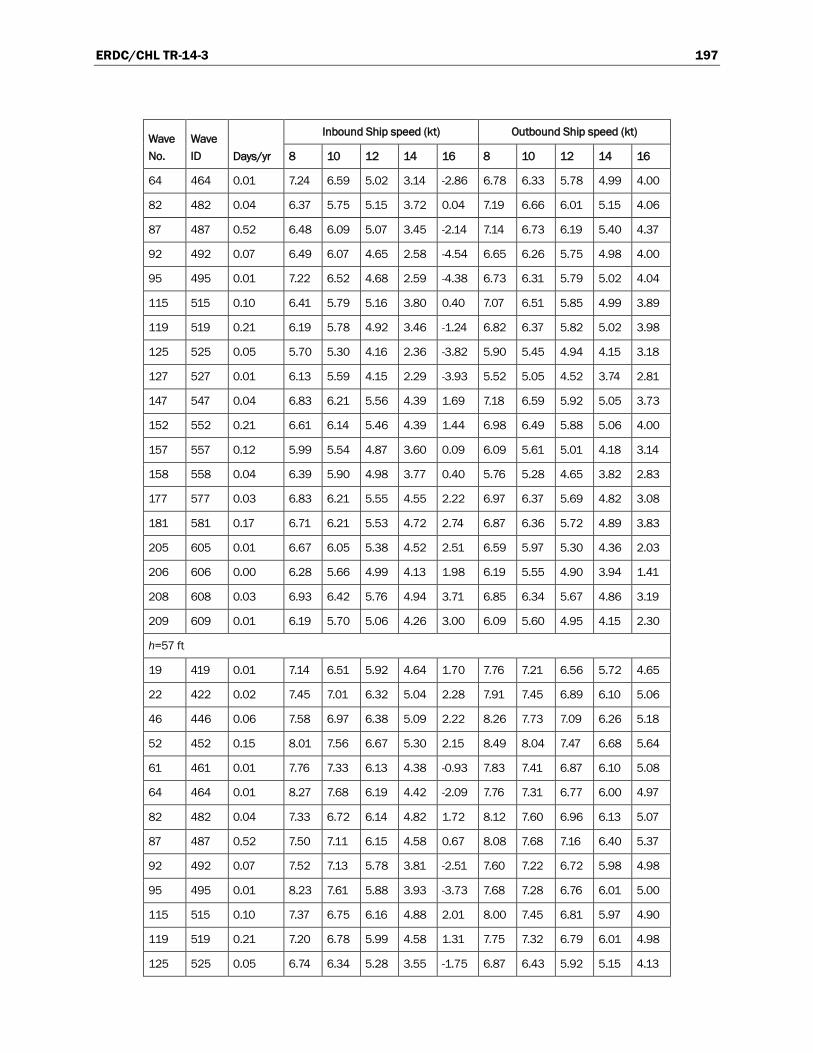
ERDC/CHL TR-14-3 197
Wave No.
Wave ID Days/yr
Inbound Ship speed (kt) Outbound Ship speed (kt)
8 10 12 14 16 8 10 12 14 16
64 464 0.01 7.24 6.59 5.02 3.14 -2.86 6.78 6.33 5.78 4.99 4.00
82 482 0.04 6.37 5.75 5.15 3.72 0.04 7.19 6.66 6.01 5.15 4.06
87 487 0.52 6.48 6.09 5.07 3.45 -2.14 7.14 6.73 6.19 5.40 4.37
92 492 0.07 6.49 6.07 4.65 2.58 -4.54 6.65 6.26 5.75 4.98 4.00
95 495 0.01 7.22 6.52 4.68 2.59 -4.38 6.73 6.31 5.79 5.02 4.04
115 515 0.10 6.41 5.79 5.16 3.80 0.40 7.07 6.51 5.85 4.99 3.89
119 519 0.21 6.19 5.78 4.92 3.46 -1.24 6.82 6.37 5.82 5.02 3.98
125 525 0.05 5.70 5.30 4.16 2.36 -3.82 5.90 5.45 4.94 4.15 3.18
127 527 0.01 6.13 5.59 4.15 2.29 -3.93 5.52 5.05 4.52 3.74 2.81
147 547 0.04 6.83 6.21 5.56 4.39 1.69 7.18 6.59 5.92 5.05 3.73
152 552 0.21 6.61 6.14 5.46 4.39 1.44 6.98 6.49 5.88 5.06 4.00
157 557 0.12 5.99 5.54 4.87 3.60 0.09 6.09 5.61 5.01 4.18 3.14
158 558 0.04 6.39 5.90 4.98 3.77 0.40 5.76 5.28 4.65 3.82 2.83
177 577 0.03 6.83 6.21 5.55 4.55 2.22 6.97 6.37 5.69 4.82 3.08
181 581 0.17 6.71 6.21 5.53 4.72 2.74 6.87 6.36 5.72 4.89 3.83
205 605 0.01 6.67 6.05 5.38 4.52 2.51 6.59 5.97 5.30 4.36 2.03
206 606 0.00 6.28 5.66 4.99 4.13 1.98 6.19 5.55 4.90 3.94 1.41
208 608 0.03 6.93 6.42 5.76 4.94 3.71 6.85 6.34 5.67 4.86 3.19
209 609 0.01 6.19 5.70 5.06 4.26 3.00 6.09 5.60 4.95 4.15 2.30
h=57 ft
19 419 0.01 7.14 6.51 5.92 4.64 1.70 7.76 7.21 6.56 5.72 4.65
22 422 0.02 7.45 7.01 6.32 5.04 2.28 7.91 7.45 6.89 6.10 5.06
46 446 0.06 7.58 6.97 6.38 5.09 2.22 8.26 7.73 7.09 6.26 5.18
52 452 0.15 8.01 7.56 6.67 5.30 2.15 8.49 8.04 7.47 6.68 5.64
61 461 0.01 7.76 7.33 6.13 4.38 -0.93 7.83 7.41 6.87 6.10 5.08
64 464 0.01 8.27 7.68 6.19 4.42 -2.09 7.76 7.31 6.77 6.00 4.97
82 482 0.04 7.33 6.72 6.14 4.82 1.72 8.12 7.60 6.96 6.13 5.07
87 487 0.52 7.50 7.11 6.15 4.58 0.67 8.08 7.68 7.16 6.40 5.37
92 492 0.07 7.52 7.13 5.78 3.81 -2.51 7.60 7.22 6.72 5.98 4.98
95 495 0.01 8.23 7.61 5.88 3.93 -3.73 7.68 7.28 6.76 6.01 5.00
115 515 0.10 7.37 6.75 6.16 4.88 2.01 8.00 7.45 6.81 5.97 4.90
119 519 0.21 7.20 6.78 5.99 4.58 1.31 7.75 7.32 6.79 6.01 4.98
125 525 0.05 6.74 6.34 5.28 3.55 -1.75 6.87 6.43 5.92 5.15 4.13
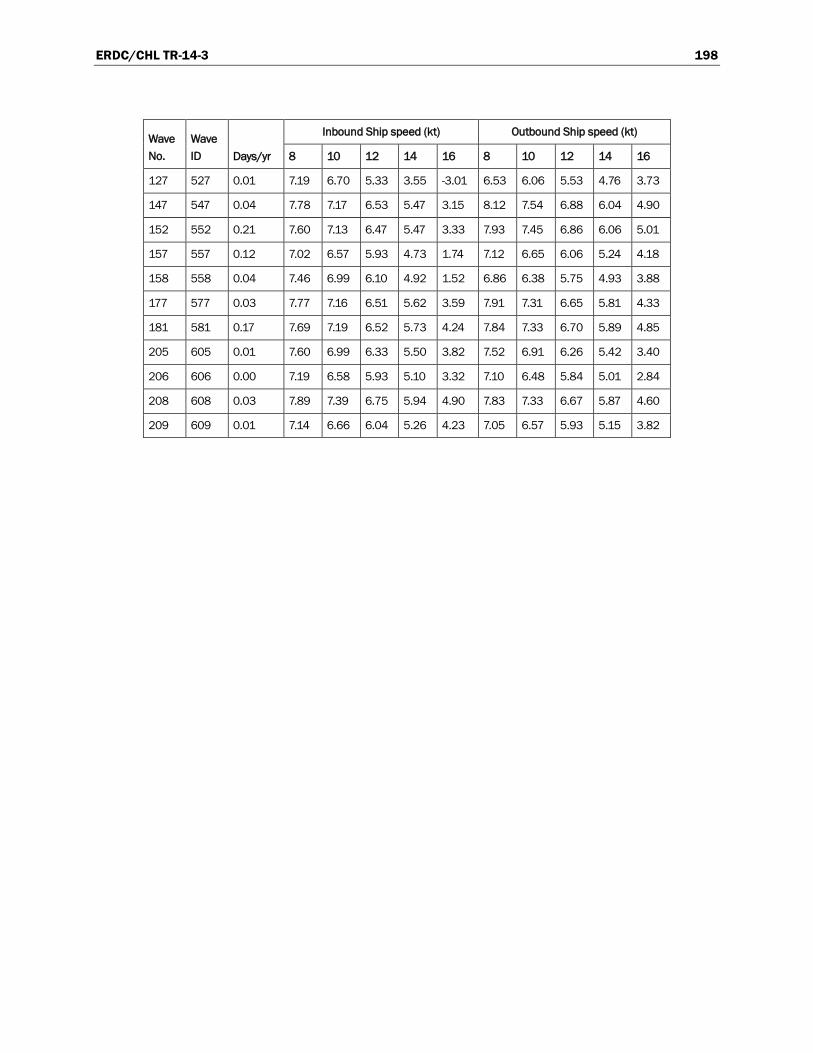
ERDC/CHL TR-14-3 198
Wave No.
Wave ID Days/yr
Inbound Ship speed (kt) Outbound Ship speed (kt)
8 10 12 14 16 8 10 12 14 16
127 527 0.01 7.19 6.70 5.33 3.55 -3.01 6.53 6.06 5.53 4.76 3.73
147 547 0.04 7.78 7.17 6.53 5.47 3.15 8.12 7.54 6.88 6.04 4.90
152 552 0.21 7.60 7.13 6.47 5.47 3.33 7.93 7.45 6.86 6.06 5.01
157 557 0.12 7.02 6.57 5.93 4.73 1.74 7.12 6.65 6.06 5.24 4.18
158 558 0.04 7.46 6.99 6.10 4.92 1.52 6.86 6.38 5.75 4.93 3.88
177 577 0.03 7.77 7.16 6.51 5.62 3.59 7.91 7.31 6.65 5.81 4.33
181 581 0.17 7.69 7.19 6.52 5.73 4.24 7.84 7.33 6.70 5.89 4.85
205 605 0.01 7.60 6.99 6.33 5.50 3.82 7.52 6.91 6.26 5.42 3.40
206 606 0.00 7.19 6.58 5.93 5.10 3.32 7.10 6.48 5.84 5.01 2.84
208 608 0.03 7.89 7.39 6.75 5.94 4.90 7.83 7.33 6.67 5.87 4.60
209 609 0.01 7.14 6.66 6.04 5.26 4.23 7.05 6.57 5.93 5.15 3.82

ERDC/CHL TR-14-3 199
Table G3. Net UKC (ft), Phase 2, Channel Reach 1, h = 53 ft, fully loaded Susan Maersk, inbound and outbound transits.
Wave No.
Wave ID Days/yr
Inbound Ship speed (kt) Outbound Ship speed (kt)
8 10 12 14 16 8 10 12 14 16
19 119 0.01 2.03 1.37 0.65 -0.16 -1.91 2.63 2.05 1.23 0.30 -0.95
22 122 0.02 1.79 1.33 0.61 -0.19 -1.85 2.44 1.99 1.24 0.36 -0.81
46 146 0.06 2.31 1.65 0.97 0.17 -1.73 3.08 2.52 1.72 0.78 -0.46
52 152 0.15 2.24 1.75 1.08 0.29 -2.12 3.06 2.59 1.85 0.95 -0.23
61 161 0.01 1.45 0.99 0.40 -1.24 -4.79 2.08 1.60 0.94 0.06 -0.99
64 164 0.01 1.70 1.20 0.61 -1.86 -5.97 1.71 1.23 0.63 -0.23 -1.21
82 182 0.04 2.26 1.59 0.94 0.16 -1.86 3.20 2.65 1.87 0.92 -0.31
87 187 0.52 2.18 1.72 1.12 0.14 -2.81 3.19 2.73 2.03 1.13 -0.04
92 192 0.07 2.07 1.61 1.07 -1.55 -5.27 2.71 2.26 1.63 0.76 -0.32
95 195 0.01 2.76 2.25 1.08 -2.52 -6.19 2.73 2.26 1.65 0.78 -0.28
115 215 0.10 2.31 1.64 0.98 0.19 -1.78 3.19 2.65 1.86 0.91 -0.32
119 219 0.21 2.19 1.71 1.10 0.18 -2.66 3.15 2.69 1.98 1.08 -0.09
125 225 0.05 1.93 1.47 0.91 -1.48 -5.15 2.56 2.10 1.47 0.59 -0.48
127 227 0.01 2.52 2.00 1.08 -2.30 -6.09 2.49 2.01 1.41 0.54 -0.50
147 247 0.04 2.55 1.90 1.20 0.37 -1.40 3.16 2.60 1.79 0.85 -0.39
152 252 0.21 2.40 1.90 1.20 0.38 -1.67 3.07 2.59 1.85 0.94 -0.25
157 257 0.12 1.87 1.39 0.73 -0.42 -3.37 2.32 1.82 1.13 0.23 -0.85
158 258 0.04 2.08 1.56 0.93 -0.65 -4.00 2.05 1.54 0.88 -0.01 -1.02
177 277 0.03 2.40 1.77 1.03 0.17 -1.38 2.81 2.22 1.41 0.48 -0.77
181 281 0.17 2.17 1.67 0.93 0.09 -1.27 2.65 2.17 1.40 0.51 -0.68
205 305 0.01 2.52 1.90 1.13 0.23 -1.04 2.62 2.02 1.22 0.31 -0.95
206 306 0.00 2.06 1.44 0.66 -0.22 -1.49 2.18 1.58 0.78 -0.12 -1.38
208 308 0.03 2.60 2.09 1.32 0.45 -0.74 2.70 2.20 1.42 0.54 -0.65
209 309 0.01 1.79 1.33 0.56 -0.28 -1.45 1.94 1.48 0.71 -0.14 -1.32
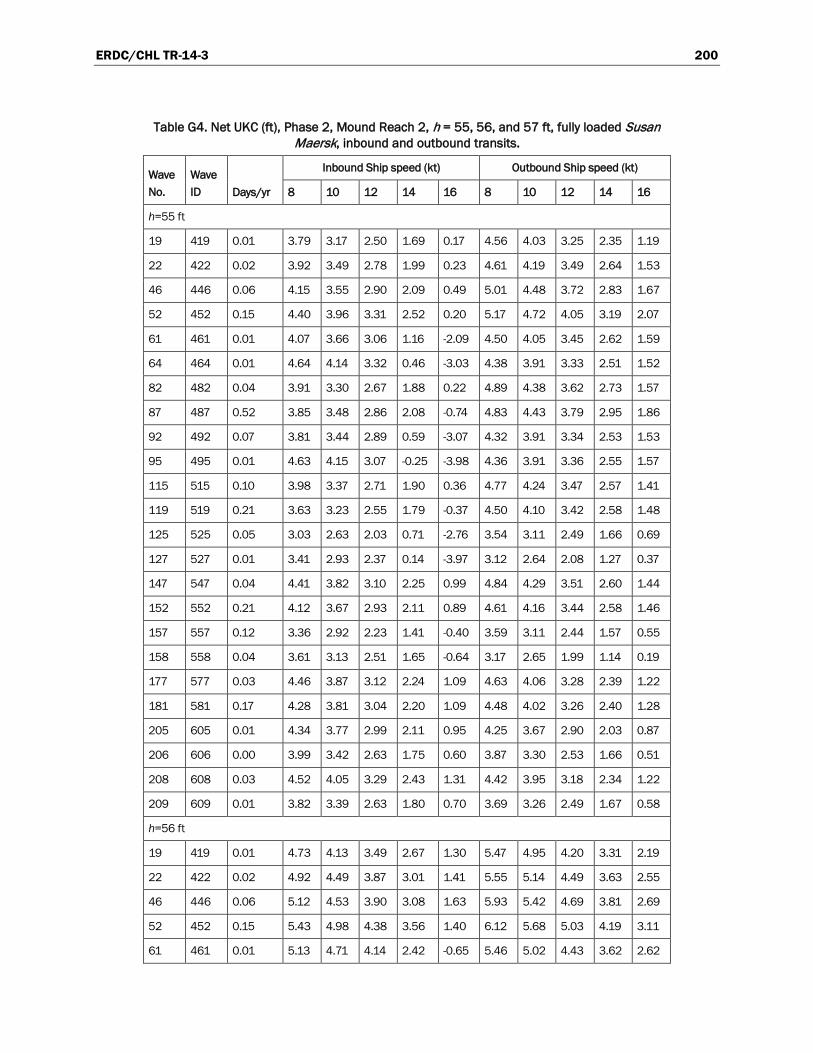
ERDC/CHL TR-14-3 200
Table G4. Net UKC (ft), Phase 2, Mound Reach 2, h = 55, 56, and 57 ft, fully loaded Susan Maersk, inbound and outbound transits.
Wave No.
Wave ID Days/yr
Inbound Ship speed (kt) Outbound Ship speed (kt)
8 10 12 14 16 8 10 12 14 16
h=55 ft
19 419 0.01 3.79 3.17 2.50 1.69 0.17 4.56 4.03 3.25 2.35 1.19
22 422 0.02 3.92 3.49 2.78 1.99 0.23 4.61 4.19 3.49 2.64 1.53
46 446 0.06 4.15 3.55 2.90 2.09 0.49 5.01 4.48 3.72 2.83 1.67
52 452 0.15 4.40 3.96 3.31 2.52 0.20 5.17 4.72 4.05 3.19 2.07
61 461 0.01 4.07 3.66 3.06 1.16 -2.09 4.50 4.05 3.45 2.62 1.59
64 464 0.01 4.64 4.14 3.32 0.46 -3.03 4.38 3.91 3.33 2.51 1.52
82 482 0.04 3.91 3.30 2.67 1.88 0.22 4.89 4.38 3.62 2.73 1.57
87 487 0.52 3.85 3.48 2.86 2.08 -0.74 4.83 4.43 3.79 2.95 1.86
92 492 0.07 3.81 3.44 2.89 0.59 -3.07 4.32 3.91 3.34 2.53 1.53
95 495 0.01 4.63 4.15 3.07 -0.25 -3.98 4.36 3.91 3.36 2.55 1.57
115 515 0.10 3.98 3.37 2.71 1.90 0.36 4.77 4.24 3.47 2.57 1.41
119 519 0.21 3.63 3.23 2.55 1.79 -0.37 4.50 4.10 3.42 2.58 1.48
125 525 0.05 3.03 2.63 2.03 0.71 -2.76 3.54 3.11 2.49 1.66 0.69
127 527 0.01 3.41 2.93 2.37 0.14 -3.97 3.12 2.64 2.08 1.27 0.37
147 547 0.04 4.41 3.82 3.10 2.25 0.99 4.84 4.29 3.51 2.60 1.44
152 552 0.21 4.12 3.67 2.93 2.11 0.89 4.61 4.16 3.44 2.58 1.46
157 557 0.12 3.36 2.92 2.23 1.41 -0.40 3.59 3.11 2.44 1.57 0.55
158 558 0.04 3.61 3.13 2.51 1.65 -0.64 3.17 2.65 1.99 1.14 0.19
177 577 0.03 4.46 3.87 3.12 2.24 1.09 4.63 4.06 3.28 2.39 1.22
181 581 0.17 4.28 3.81 3.04 2.20 1.09 4.48 4.02 3.26 2.40 1.28
205 605 0.01 4.34 3.77 2.99 2.11 0.95 4.25 3.67 2.90 2.03 0.87
206 606 0.00 3.99 3.42 2.63 1.75 0.60 3.87 3.30 2.53 1.66 0.51
208 608 0.03 4.52 4.05 3.29 2.43 1.31 4.42 3.95 3.18 2.34 1.22
209 609 0.01 3.82 3.39 2.63 1.80 0.70 3.69 3.26 2.49 1.67 0.58
h=56 ft
19 419 0.01 4.73 4.13 3.49 2.67 1.30 5.47 4.95 4.20 3.31 2.19
22 422 0.02 4.92 4.49 3.87 3.01 1.41 5.55 5.14 4.49 3.63 2.55
46 446 0.06 5.12 4.53 3.90 3.08 1.63 5.93 5.42 4.69 3.81 2.69
52 452 0.15 5.43 4.98 4.38 3.56 1.40 6.12 5.68 5.03 4.19 3.11
61 461 0.01 5.13 4.71 4.14 2.42 -0.65 5.46 5.02 4.43 3.62 2.62

ERDC/CHL TR-14-3 201
Wave No.
Wave ID Days/yr
Inbound Ship speed (kt) Outbound Ship speed (kt)
8 10 12 14 16 8 10 12 14 16
64 464 0.01 5.69 5.19 4.45 1.83 -1.47 5.36 4.89 4.32 3.52 2.54
82 482 0.04 4.87 4.28 3.68 2.87 1.36 5.81 5.30 4.58 3.70 2.58
87 487 0.52 4.89 4.50 3.94 3.15 0.52 5.76 5.37 4.76 3.94 2.88
92 492 0.07 4.87 4.49 3.96 1.89 -1.57 5.27 4.86 4.31 3.53 2.55
95 495 0.01 5.68 5.19 4.22 1.19 -2.36 5.33 4.88 4.34 3.55 2.59
115 515 0.10 4.93 4.34 3.71 2.88 1.50 5.69 5.16 4.43 3.54 2.42
119 519 0.21 4.64 4.24 3.64 2.81 0.85 5.43 5.04 4.40 3.56 2.49
125 525 0.05 4.10 3.70 3.15 1.97 -1.28 4.52 4.09 3.51 2.70 1.73
127 527 0.01 4.52 4.04 3.49 1.51 -2.29 4.13 3.64 3.10 2.29 1.39
147 547 0.04 5.36 4.78 4.09 3.24 2.11 5.77 5.22 4.48 3.58 2.46
152 552 0.21 5.11 4.65 4.01 3.12 2.03 5.55 5.12 4.45 3.57 2.49
157 557 0.12 4.42 3.97 3.36 2.49 0.90 4.61 4.13 3.48 2.62 1.62
158 558 0.04 4.74 4.25 3.65 2.80 0.76 4.25 3.72 3.07 2.23 1.29
177 577 0.03 5.39 4.82 4.10 3.22 2.10 5.56 5.00 4.25 3.36 2.24
181 581 0.17 5.25 4.78 4.10 3.20 2.12 5.44 4.97 4.29 3.40 2.31
205 605 0.01 5.26 4.70 3.96 3.07 1.95 5.17 4.60 3.87 2.99 1.88
206 606 0.00 4.89 4.34 3.59 2.70 1.59 4.78 4.22 3.49 2.61 1.50
208 608 0.03 5.48 5.01 4.33 3.43 2.34 5.39 4.92 4.24 3.34 2.25
209 609 0.01 4.77 4.34 3.68 2.78 1.71 4.65 4.21 3.55 2.66 1.59
h=57 ft
19 419 0.01 5.68 5.10 4.47 3.67 2.40 6.39 5.88 5.15 4.28 3.18
22 422 0.02 5.92 5.50 4.89 4.04 2.59 6.50 6.09 5.47 4.62 3.56
46 446 0.06 6.08 5.52 4.90 4.10 2.73 6.87 6.37 5.66 4.79 3.69
52 452 0.15 6.44 6.01 5.41 4.60 2.60 7.07 6.64 6.02 5.19 4.13
61 461 0.01 6.17 5.76 5.20 3.65 0.73 6.43 6.00 5.43 4.63 3.64
64 464 0.01 6.73 6.24 5.57 3.16 0.01 6.34 5.88 5.32 4.53 3.57
82 482 0.04 5.84 5.27 4.67 3.88 2.47 6.73 6.25 5.54 4.68 3.58
87 487 0.52 5.92 5.54 4.98 4.20 1.77 6.69 6.31 5.73 4.93 3.89
92 492 0.07 5.92 5.55 5.02 3.16 -0.13 6.22 5.83 5.30 4.52 3.56
95 495 0.01 6.71 6.23 5.35 2.57 -0.85 6.29 5.86 5.32 4.55 3.60
115 515 0.10 5.89 5.33 4.69 3.88 2.61 6.61 6.11 5.39 4.52 3.41
119 519 0.21 5.65 5.26 4.67 3.84 2.05 6.36 5.98 5.38 4.55 3.50
125 525 0.05 5.15 4.77 4.22 3.19 0.14 5.49 5.07 4.51 3.71 2.75

ERDC/CHL TR-14-3 202
Wave No.
Wave ID Days/yr
Inbound Ship speed (kt) Outbound Ship speed (kt)
8 10 12 14 16 8 10 12 14 16
127 527 0.01 5.61 5.15 4.60 2.85 -0.71 5.13 4.66 4.11 3.32 2.41
147 547 0.04 6.32 5.76 5.08 4.24 3.14 6.71 6.18 5.45 4.57 3.46
152 552 0.21 6.10 5.66 5.02 4.14 3.11 6.51 6.08 5.44 4.57 3.50
157 557 0.12 5.46 5.03 4.43 3.56 2.16 5.64 5.18 4.53 3.69 2.69
158 558 0.04 5.85 5.37 4.77 3.93 2.10 5.34 4.82 4.18 3.34 2.40
177 577 0.03 6.34 5.78 5.07 4.21 3.11 6.49 5.95 5.22 4.34 3.24
181 581 0.17 6.22 5.76 5.10 4.21 3.15 6.40 5.95 5.28 4.40 3.32
205 605 0.01 6.19 5.65 4.92 4.05 2.95 6.10 5.55 4.84 3.97 2.87
206 606 0.00 5.81 5.27 4.54 3.67 2.57 5.70 5.16 4.44 3.58 2.49
208 608 0.03 6.44 5.99 5.33 4.44 3.37 6.36 5.90 5.24 4.35 3.28
209 609 0.01 5.72 5.30 4.66 3.77 2.72 5.61 5.19 4.54 3.65 2.61
REPORT DOCUMENTATION PAGE Form Approved
OMB No. 0704-0188 Public reporting burden for this collection of information is estimated to average 1 hour per response, including the time for reviewing instructions, searching existing data sources, gathering and maintaining the data needed, and completing and reviewing this collection of information. Send comments regarding this burden estimate or any other aspect of this collection of information, including suggestions for reducing this burden to Department of Defense, Washington Headquarters Services, Directorate for Information Operations and Reports (0704-0188), 1215 Jefferson Davis Highway, Suite 1204, Arlington, VA 22202-4302. Respondents should be aware that notwithstanding any other provision of law, no person shall be subject to any penalty for failing to comply with a collection of information if it does not display a currently valid OMB control number. PLEASE DO NOT RETURN YOUR FORM TO THE ABOVE ADDRESS. 1. REPORT DATE (DD-MM-YYYY)
May 2014 2. REPORT TYPE
Final Report 3. DATES COVERED (From - To)
4. TITLE AND SUBTITLE
Vertical Ship Motion Study for Ambrose Entrance Chanel, New York
5a. CONTRACT NUMBER
5b. GRANT NUMBER
5c. PROGRAM ELEMENT NUMBER
6. AUTHOR(S)
Michael J. Briggs, Zeki Demirbilek, and Lihwa Lin
5d. PROJECT NUMBER
5e. TASK NUMBER
5f. WORK UNIT NUMBER
7. PERFORMING ORGANIZATION NAME(S) AND ADDRESS(ES) 8. PERFORMING ORGANIZATION REPORT NUMBER
Coastal and Hydraulics Laboratory US Army Engineer Research and Development Center 3909 Halls Ferry Road Vicksburg, MS 39180-6199
ERDC/CHL TR-14-3
9. SPONSORING / MONITORING AGENCY NAME(S) AND ADDRESS(ES) 10. SPONSOR/MONITOR’S ACRONYM(S) Commander, US Army Engineer District, New York (CENAN-EN-H)
11. SPONSOR/MONITOR’S REPORT
NUMBER(S)
12. DISTRIBUTION / AVAILABILITY STATEMENT Approved for public release; distribution is unlimited.
13. SUPPLEMENTARY NOTES
14. ABSTRACT
New York Harbor Pilots have expressed a concern to the New York District (NAN) about a mound that is approximately 1.5 miles seaward of the new limit of the Ambrose Channel. This mound is probably construction rubble that was placed there when the original Light Tower isolated and protected it somewhat from the main channel. The mound’s diameter and depth are similar to the width and depth of the Ambrose Channel offshore reach. Now that the Light Tower is no longer marking this mound, the Pilots are concerned about whether a ship might experience larger or more dramatic ship motions due to possible amplification across the mound relative to similar transits in the offshore reach. The US Army Engineer Research and Development Center (ERDC), Coastal and Hydraulics Laboratory (CHL), used the numerical models STWAVE and CMS-Wave to evaluate possible amplification effects of a range of wave conditions. The Channel Analysis and Design Evaluation Tool (CADET) was used to predict vertical ship motions due to wave-induced heave, pitch, and roll. Ship squat estimates calculated with the PIANC and Ankudinov empirical formulas were compared with the Beck, Newman, Tuck (BNT) squat predictions used in CADET. The net underkeel clearance based on these vertical ship motion components was used in a risk-based method of evaluating transits over the mound compared to similar transits in the main channel. These results were used to select a minimum dredge depth over the mound to insure that inadvertent transits over the mound would not incur any significant differences in ship response and potential grounding relative to similar transits in the offshore reach of the Ambrose Channel.
15. SUBJECT TERMS Ambrose Channel, CADET, PIANC, Vertical Ship Motion, ship squat,
Container ship, underkeel, Ambrose Mound
16. SECURITY CLASSIFICATION OF: 17. LIMITATION OF ABSTRACT
18. NUMBER OF PAGES
19a. NAME OF RESPONSIBLE PERSON
a. REPORT
Unclassified
b. ABSTRACT
Unclassified
c. THIS PAGE
Unclassified 213 19b. TELEPHONE NUMBER (include area code)
Standard Form 298 (Rev. 8-98)
Prescribed by ANSI Std. 239.18