ercot load forecasting - the weather … is an automated system that produces hourly forecasts for...
TRANSCRIPT

ERCOT LOAD FORECASTING
By Dr. Todd Crawford Chief Meteorologist The Weather Company, an IBM Business

Table of Contents
Methodology 3
— Weather Forecasting 3
— Load Forecasting 3
Results 4
— Aggregate 4
— Seasonal Variation 5
— The Weather Company VS. ERCOT-Issued Forecast 5
Conclusion 7
1Copyright 2016, The Weather Company, LLC. All Rights Reserved.

When a company’s profitability is dependent on weather, accuracy and insight can be critical to success. The Weather Company, an IBM Business (Weather) has recently made significant investments in both (a) an improved weather forecasting system and (b) data science capabilities. The former allows for the most accurate, timely, and spatially resolute weather forecasts in the industry, while expertise in the latter allows us to convert these accurate weather forecasts into user-friendly products for our clients in the utility and energy trading businesses. One of these exciting new products is a load forecasting module for the ERCOT region, with new forecasts produced each hour, at hourly resolution out to 15 days.
The Weather Company load forecasting algorithm exhibits errors (expressed with the MAPE metric) of generally less than 2% (for the aggregate ERCOT region) during the first three days of the forecast, rising to 3-4% by day 6 and 4-5% by day 9. A comparison with archived ERCOT-produced load forecasts out to 180 hours indicates that The Weather Company forecasts had lower errors for 98% of the forecast hours, with relative improvements ranging from 5-20%.
2Copyright 2016, The Weather Company, LLC. All Rights Reserved.
MethodologyWEATHER FORECASTING
Good load forecasts are strongly dependent upon good weather forecasts, and The Weather Company’s weather forecasting engine (Forecasts on Demand, or FoD) is unsurpassed in that regard. FoD is an automated system that produces hourly forecasts for all of the most relevant weather variables (e.g., temperature, dew point, wind speed, precipitation, cloud cover, snowfall) at 4-km spatial resolution across the globe. These forecasts are updated hourly based upon the latest observations and latest model data. FoD forecasts are a skill-weighted blend of all available weather models, including the ECMWF, GFS, and NAM models (deterministic and ensemble), along with GFS MOS and our own proprietary high-resolution weather model (RPM).
Weights are assigned to each model based upon the optimal combination of bias-corrected model forecasts over the most recent weeks. Furthermore, the first few hours of the forecast period are “forward-corrected” based upon the latest observations. Doing this insures that there are no discontinuities early in the forecast period.
The weather forecasts are updated each hour as new model data and observations come in, and the 4-km spatial resolution allows for “hyper-local” forecasts that generate a more accurate representation of energy demand via the load forecasts.
LOAD FORECASTING
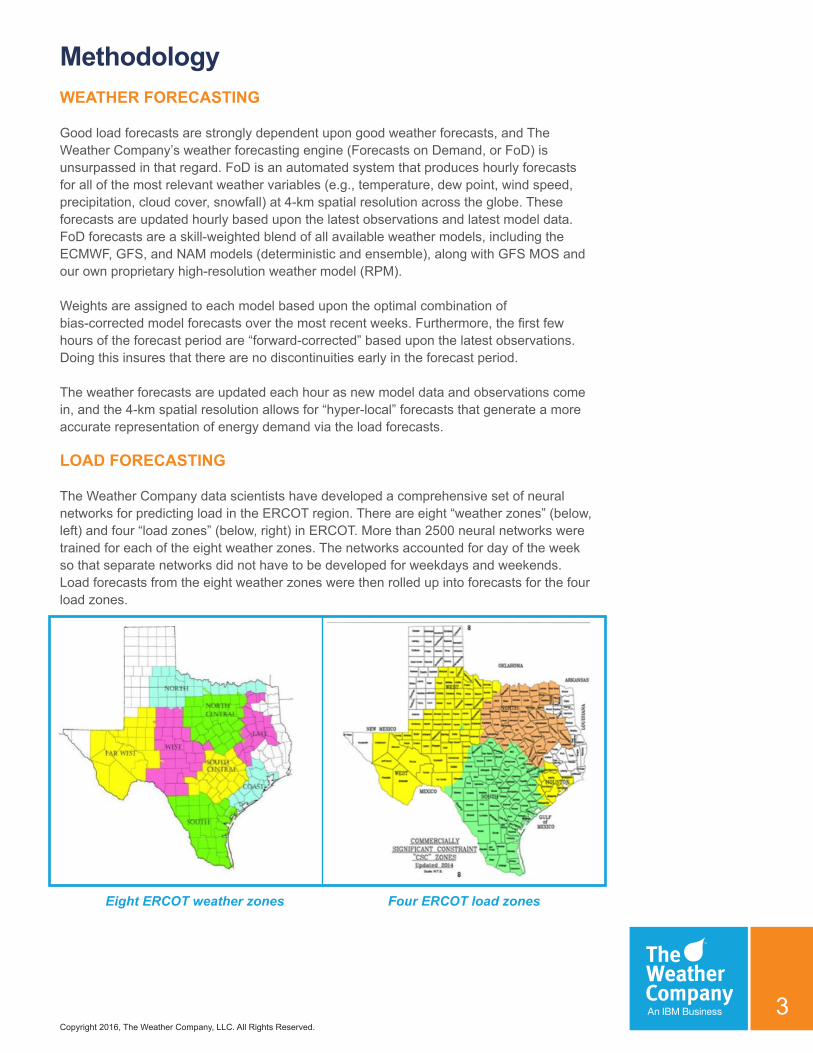
The Weather Company data scientists have developed a comprehensive set of neural networks for predicting load in the ERCOT region. There are eight “weather zones” (below, left) and four “load zones” (below, right) in ERCOT. More than 2500 neural networks were trained for each of the eight weather zones. The networks accounted for day of the week so that separate networks did not have to be developed for weekdays and weekends. Load forecasts from the eight weather zones were then rolled up into forecasts for the four load zones.
3Copyright 2016, The Weather Company, LLC. All Rights Reserved.
Eight ERCOT weather zones Four ERCOT load zones

4Copyright 2016, The Weather Company, LLC. All Rights Reserved.
For each of the eight weather zones, unique neural networks were trained for the bal-day and next day periods, along with each of the following three days, with a final one for the entire period beyond hour 120. Variable selection was used to optimize the appropriate set of weather parameters needed for each zone and forecast period.
The bal-day neural networks blend the most recent values of observed load into the raw forecast values using a similar “forward correction” scheme used in FoD. The next-day and medium-range forecasts are purely model driven.
ResultsTo assess the new forecasting system, we evaluated the 15-day hourly forecasts using data for the 12-month period from March 2015-February 2016. Using a full year of data insures that we capture any seasonal variability in the performance of the system. All results below are expressed with the MAPE (mean absolute percentage error) metric. The “percentage error” is defined here as the forecast error divided by the observed load.
AGGREGATE
The graph below shows aggregate statistics for the entire period, for each of the four load zones as well as overall numbers for the entire ERCOT region (dark blue). The data below is representative of the forecasts issued at 7 AM, but the data for other times (including the 10 AM forecasts) is quite similar.
Errors, expressed with the MAPE metric, for The Weather Company load forecasts from March 2015 – February 2016 across the ERCOT region
Note that the errors begin at zero at the start of the forecast period, since Weather ingests the latest hourly demand observation into its model at “forecast hour zero” and uses the most recent observations to forward-correct the first few hours of the forecast string. The errors increase more sharply with time early in the forecast period as the beneficial impact of the forward-correction scheme wanes. After the first few hours, the errors increase more linearly with time. There is also a clear diurnal signal as well, with the largest errors occurring in the late evening when absolute loads are highest.

5Copyright 2016, The Weather Company, LLC. All Rights Reserved.
Errors, expressed with the MAPE metric, for The Weather Company load forecasts from March 2015-February 2016 across the ERCOT region
It’s important to emphasize that the errors for the entire ERCOT region are lower than the errors from three of the four load zones, the exception being the more sparsely-populated West load zone. This behavior is expected. The errors in the sub-regions are generally uncorrelated, which typically results in better aggregate forecasts as a significant percentage of the errors cancel out upon combining the sub-regions. The lower errors in the West zone are primarily observed during spring and summer, when the eastern zones (North/South/Houston) are plagued by less predictable thunderstorm complexes (that produce larger forecast errors) than the West zone.
SEASONAL VARIATION
If we look at the errors as a function of season (below), we see that errors are generally similar through day 5. After that, errors are lowest in summer, when weather forecasting skill is higher due to a more persistent and predictable pattern. Similarly the errors in winter are considerably larger by the end of the forecast period during that more volatile season. Finally, the diurnal variation is noticeably smaller during the fall, presumably due to limited demand during this “shoulder season” with limited thunderstorm activity (unlike spring). Still, for all four seasons, errors remain less than 5% out to day 7.
THE WEATHER COMPANY FORECASTS VS. ERCOT-ISSUED FORECASTS
Market participants already have access to freely-available ERCOT load forecasts, which are updated every hour. Because of this, its important to demonstrate improved skill relative to the ERCOT-issued forecasts in order to prove the value of a new load forecasting system. This section will detail the performance of the new Weather system against the ERCOT system.
The first thing that stands out in the analysis is the consistently lower errors for The Weather Company forecasts throughout the forecast period, for both the 7 AM and 10 AM forecasts (below). The MAPE values from the Weather Company forecasts are consistently 0.15-0.5 percentage points lower than the ERCOT-issued forecasts.

6Copyright 2016, The Weather Company, LLC. All Rights Reserved.
Errors, expressed with the MAPE metric, for The Weather Company and ERCOT-issued load forecasts from 2015 for the aggregate ERCOT region, for 7 AM forecasts (left) and 10 AM forecasts (right)
If we express the improvement in Weather load forecasts relative to ERCOT-issued forecasts, we can see that the biggest gap is found during the crucial bal-day and next-day periods, with up to a 20% reduction in errors (below). The Weather Company advantage decreases with time, but still remains above 5% through the entire period.
Improvement in MAPE for The Weather Company forecasts relative to the ERCOT-issued forecasts, using the 7 AM forecasts

Conclusions The Weather Company has recently developed a new load forecasting module that has consistently exhibited lower errors than the freely-available ERCOT forecasts over the past year. The combination of best-in-class, hourly-updating weather forecasts at 4 km spatial resolution, and expertise/experience in machine learning techniques has allowed Weather to make this exciting new leap into the load forecasting arena.
The Weather Company forecast errors for the ERCOT region range from 2% during the first three days of the forecast to 4-5% by day 9. Errors are particularly low during the first 18 hours of the forecast, both in absolute terms and relative to the ERCOT-issued forecasts, when The Weather Company’s forward-correction algorithm provides significant added value by intelligently incorporating recent load observations.
There is little seasonal variation of forecast errors during the first six days of the forecast, but errors beyond that time are largest during the winter months, when temperature forecast errors are generally larger. Long-range errors during the summer are relatively low, on the other hand, since weather patterns are more stable and predictable during that season.
7Copyright 2016, The Weather Company, LLC. All Rights Reserved.
