erasmus+ programme, innovative european studies on
TRANSCRIPT

Erasmus+ PROGRAMME,
KEY ACTION: Cooperation for innovation and the exchange of good practices,
ACTION: Strategic Partnerships
FIELD: Strategic Partnerships for higher education, CALL: 2015
INNOVATIVE EUROPEAN STUDIES ON RENEWABLE ENERGY SYSTEMS
2015-1-TR01-KA203-021342
Partners:
GAZI UNIVERSITESI, Turkey
UNIVERSITATEA DIN PITESTI, Romania
KLAIPEDA UNIVERSITY, Lithuania
UNIVERSITA DEGLI STUDI DI PERUGIA, Italy
UNIVERSIDAD DEL PAIS VASCO, Spain

Hybrid Power Sources
Mitigation techniques of the fuel cell current ripple
Extremum Seeking Control Schemes
Global Maximum Power Point Tracking algorithms
for Photovoltaic arrays under Partially Shaded Conditions
Nicu BIZON
University of Pitesti,
Pitesti, Romania
INNOVATIVE EUROPEAN
STUDIES ON RENEWABLE
ENERGY SYSTEMS

Fuel Cell Hybrid Power Source: Part I
The first part of presentation is focused on:
Techniques of passive mitigation for the low frequency
(LF) fuel cell current ripple;
Analysis of the appropriate structures for inverter system
powered by Fuel Cell (FC);
Comparison of the filtering results obtained by passive
filters on high voltage (HV) and/or low voltage (LV) bus;
Evaluation of the LF fuel cell current ripple in the Fuel
Cell Hybrid Power Sources (FCHPS).
Validation of the modelling by measurements performed
in different experiments.

The presentation is organized as follows:
Section 1 briefly presents the main concepts related to Hybrid
Power Source (HPS) supplied by a Proton Exchange Membrane
Fuel Cell (PEMFC) stack. The FCHPS architecture proposed to be
analyzed is shown, too.
Section 2 is focused in the ripple evaluation on fuel cell (FC) HPS.
The current ripple will be measured by Ripple Factor (RF);
The power spectrum is shown to evaluate the FC current ripple.
The behavior of the FCHPS subsystems under dynamic load is
presented, too.
Section 3 presents few Matlab-Simulink simulations to be
compared with the experimental results obtained. The use of the
Low Pass Passive Filter on both HV DC and LV DC buses is
analyzed by simulation and experiment.
Last section concludes the presentation.
Fuel Cell Hybrid Power Source: Part I

INTRODUCTION The Polymer Electrolyte Membrane Fuel Cell (PEMFC) is one of the most promising
solutions to be utilized in Energy Generation System (EGS) and portable applications
because of its relatively lightweight and small size, ease of construction, fast start-up
and low operating temperature. Unfortunately, the relatively short PEMFC’s life
represents for moment a major obstacle to their commercialization. Inverter current ripple represents the main factor responsible for performance
degradation of PEMFC energy efficiency and PEMFC life cycle. The PEMFC low
frequency (LF) current ripple affects in much measure the PEMFC life cycle, causes
hysteretic losses and subsequently more fuel consumption. Recent experimental results
shown that LF inverter current ripple contributes with up to 10% reduction in the
available output power
The USA National Energy Technology Laboratory published the following guidelines for fuel
cell current ripple:
100/120 Hz ripple < 15% from 10% to 100% load, not to exceed 0.6 A for lighter loads;
50/60 Hz ripple: < 10% from 10% to 100% load, not to exceed 0.4 A for lighter loads;
10 kHz and above: < 60% from 10% to 100% load, not to exceed 2.4 A for lighter loads;
>100/120 Hz to <10 kHz, limit linearly interpolated between the 120 Hz and 10 kHz limits;
Transients below 50/60 Hz represent "load following" action of the system, and should track the
maximum available current signal from the fuel cell to within 1% for purposes of both fuel cell
integrity and efficiency.

INTRODUCTION
Figure 1. A typical EGS topology

INTRODUCTION
Figure 2. Back propagation of the current ripple
through the fuel cell inverter system
The new current ripple limits are given experimentally as Ripple Factor (RF) for
different frequency bands (for example, LF RF must be up to 5% from 10% to 100%
load, not to exceed 0.5 A for lighter loads; HF RF must be up to 40% from 10% to
100% load, not to exceed 2 A for lighter loads).
Transients below grid frequency (50/60 Hz) represent "load following"
action of the EGS control, and should track the Maximum Power Point
(MPP) signal from the PEMFC to within 1% for purposes of both PEMFC
reliability and efficiency (see figure 1)
Usually, 100Hz fuel cell
current ripple and other LF
harmonics appear in operation
of grid inverter system and HF
harmonics are generated by
PWM switching control of
DC-DC converter.
INTRODUCTION
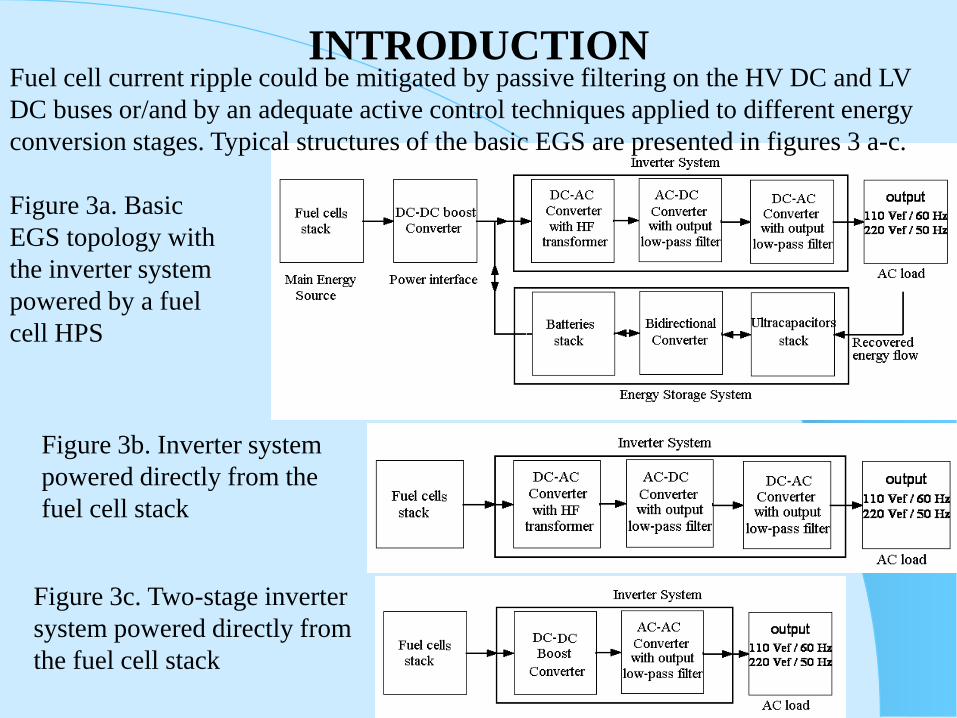
Figure 3c. Two-stage inverter
system powered directly from
the fuel cell stack
Figure 3b. Inverter system
powered directly from the
fuel cell stack
Figure 3a. Basic
EGS topology with
the inverter system
powered by a fuel
cell HPS
Fuel cell current ripple could be mitigated by passive filtering on the HV DC and LV
DC buses or/and by an adequate active control techniques applied to different energy
conversion stages. Typical structures of the basic EGS are presented in figures 3 a-c.

INTRODUCTION
Figure 4. Multiport EGS topology with power interface for ripple mitigation
INTRODUCTION
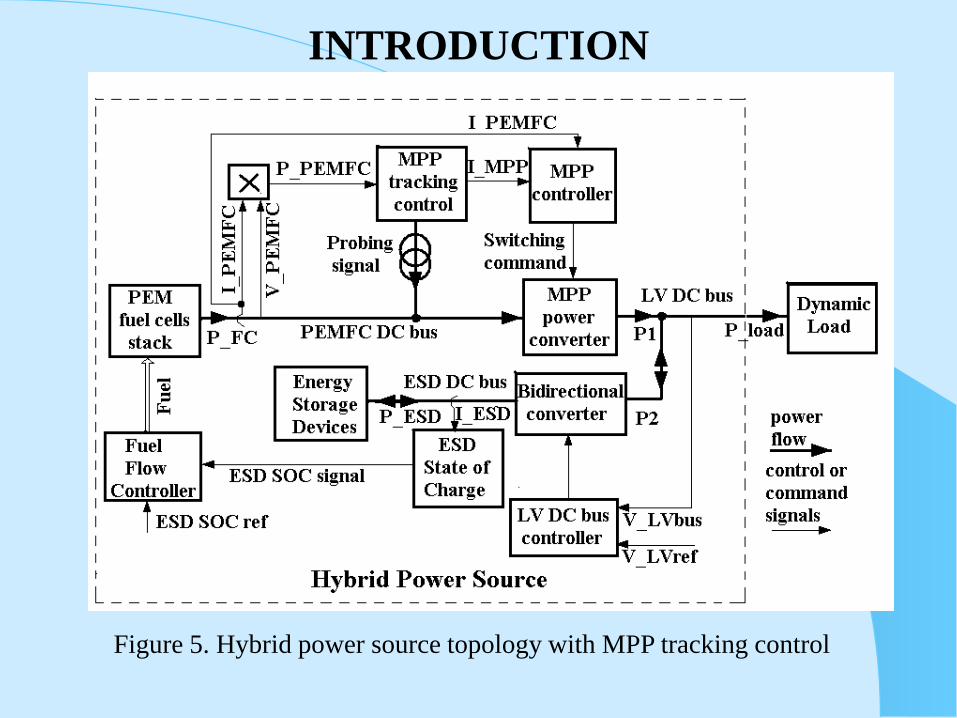
Figure 5. Hybrid power source topology with MPP tracking control

INTRODUCTION
Figure 6. Polarization and power characteristics for a PEMFC (a single cell)
max0
_ 1lnlnj
jjB
j
jjARAjjVV
nfc
conc
nfc
actohmicnfcocellcell

INTRODUCTION
Figure 7a. Proposed PEMFC macro-model that uses a transfer function for
modelling the PEMFC dynamic

INTRODUCTION
Figure 7b. Behaviour under load pulse for Nexa PEMFC
model that uses a transfer function to model its dynamic
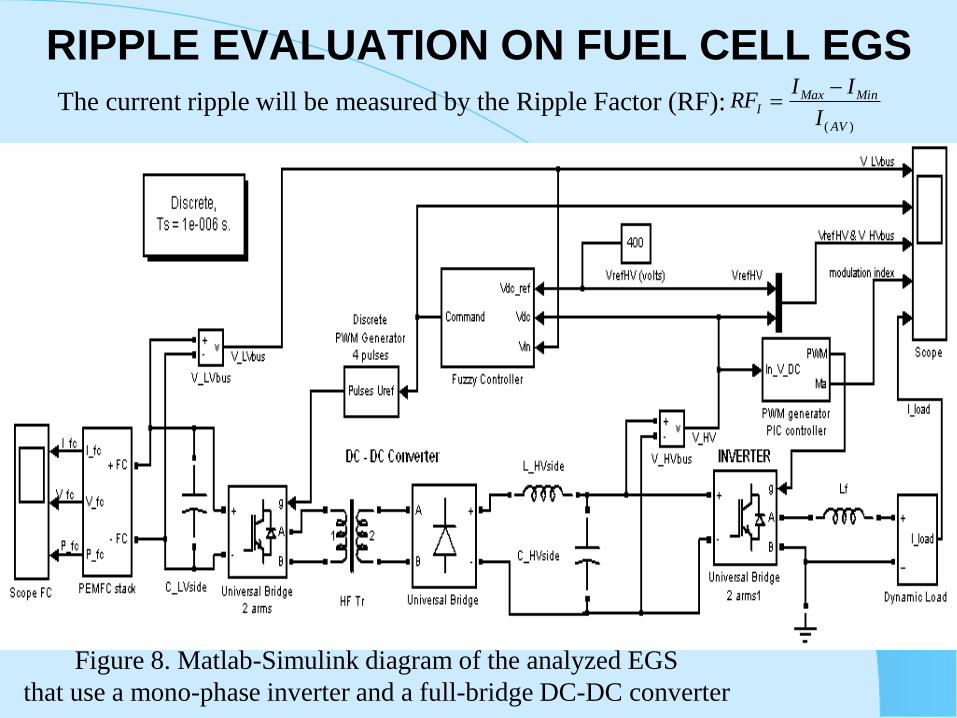
RIPPLE EVALUATION ON FUEL CELL EGS
)( AV
MinMaxI
I
IIRF
The current ripple will be measured by the Ripple Factor (RF):
Figure 8. Matlab-Simulink diagram of the analyzed EGS
that use a mono-phase inverter and a full-bridge DC-DC converter

RIPPLE EVALUATION ON FUEL CELL EGS Power Spectrum of the Inverter System: output voltage and current

RIPPLE EVALUATION ON FUEL CELL EGS Power Spectrum of the Inverter System – input voltage and current
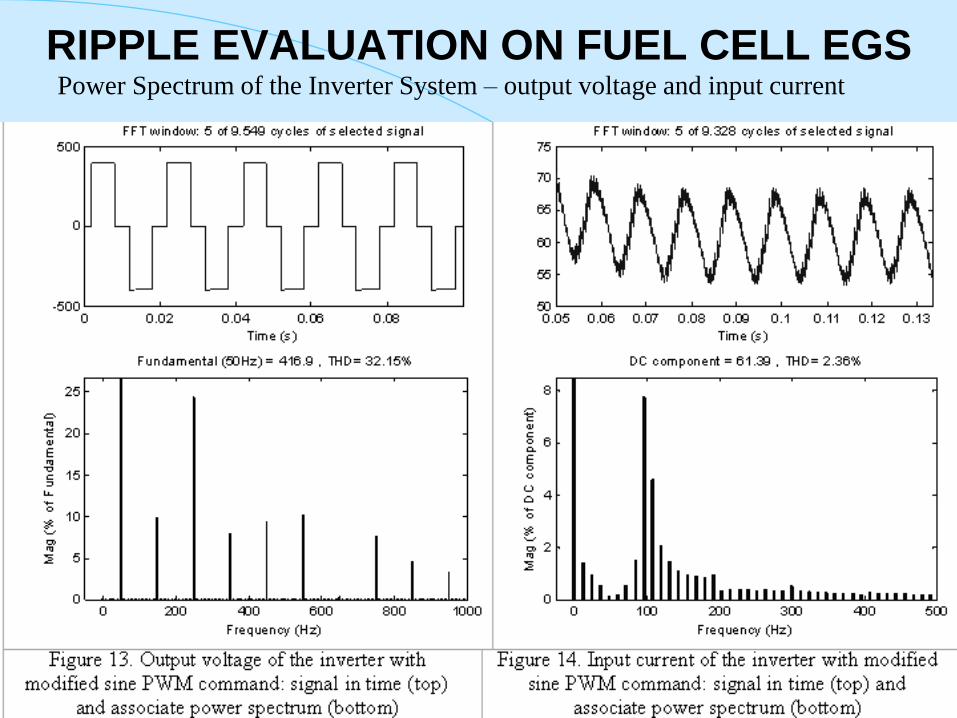
RIPPLE EVALUATION ON FUEL CELL EGS Power Spectrum of the Inverter System – output voltage and input current

RIPPLE EVALUATION ON FUEL CELL EGS Behaviour of the Inverter System under dynamic load: output voltage and input current

RIPPLE EVALUATION ON FUEL CELL EGS Behaviour of the Fuel Cell System under dynamic load

RIPPLE EVALUATION ON FUEL CELL EGS Use of the Low Pass Passive Filter on HV DC bus
HVside
HVsideRMS
HVsideVf
IC
100
)(1
4
The LF current harmonics normally appears on the LV DC bus. Without use of other
power interfaces (likes boost converter or passive/active filter) to mitigate the ripple,
this represents the fuel cell current ripple. The PEMFC current ripple factor is about
of (20A/70A)10028%, much higher than the new value required (5% or even 3%).
For example, considering I1(p-p)HVside =17A and an imposed voltage ripple value
ΔVHVside= 5V (see figure 15), these lead to a capacity of about 2mF. For this value of
capacity, the influence of the inductance value on current ripple mitigation was
tested for values in range 0.1 mH-10 mH.
If not otherwise stated, then LHVside=0.5 mH.
Some simulations are shown in next slides

RIPPLE EVALUATION ON FUEL CELL EGS Use of the Low Pass Passive Filter on HV DC bus under dynamic load

RIPPLE EVALUATION ON FUEL CELL EGS Use of the Low Pass Passive Filter on HV DC bus under dynamic load

RIPPLE EVALUATION ON FUEL CELL EGS Use of the Low Pass Passive Filter on HV DC bus under dynamic load

RIPPLE EVALUATION ON FUEL CELL EGS Use of the Low Pass Passive Filter on HV DC bus: power spectrum
We can remark that 100Hz current harmonic is less dependent of the load power level.

RIPPLE EVALUATION ON FUEL CELL EGS
Note that a passive filter of 2nd order in comparison with one of first order type not brings major improvements
HVsideL
Use of the Low Pass Passive Filter on HV DC bus: power spectrum

RIPPLE EVALUATION ON FUEL CELL EGS Use of the Low Pass Passive Filter on LV DC Bus
Note that ripple factor for FC current could be about 5% for high values of passive
components: LHVside=0.5 mH CHVside=2 mF and CLVside = 70 mF (bulky components)

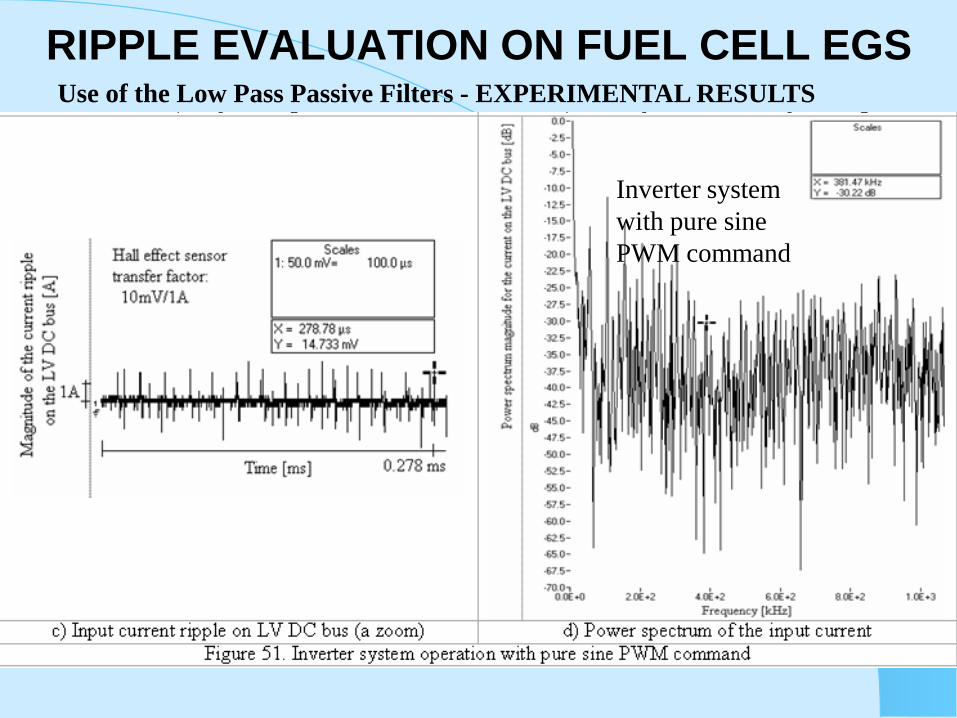
RIPPLE EVALUATION ON FUEL CELL EGS Use of the Low Pass Passive Filters - EXPERIMENTAL RESULTS
In this section the experimental results concerning the current ripple mitigation are
presented for the inverter systems with different command: full wave (figure 46),
modified sine PWM (figure 47) and pure sine PWM (figure 48), respectively.
Firstly, the laboratory tests were performed using as DC power souce a lead-sealed
battery (instead of PEMFC stack) and a variable resistive load, with maximum power
of 1 kW. It is know that battery has characteristics and behaviour operation similar to
the PEMFC stack, because both DC sources are based on specific but appropriate
electro-chemical processes.
To validate the above results, some experiments were repeated on a 2kW PEMFC
stack, available at the National Research and Development Institute for Cryogenics
and Isotopic Technologies - ICSI Rm.Valcea, Romania.
Experimental results are presented in figure 49, 50 and 51 for inverters system
without passive filter at input, which use a command type of full wave, modified sine
PWM (with phase-shifted) and pure sine PWM, respectively.

RIPPLE EVALUATION ON FUEL CELL EGS Use of the Low Pass Passive Filters - EXPERIMENTAL RESULTS

RIPPLE EVALUATION ON FUEL CELL EGS Use of the Low Pass Passive Filters - EXPERIMENTAL RESULTS

RIPPLE EVALUATION ON FUEL CELL EGS Use of the Low Pass Passive Filters - EXPERIMENTAL RESULTS
Inverter system with full wave
command

RIPPLE EVALUATION ON FUEL CELL EGS Use of the Low Pass Passive Filters - EXPERIMENTAL RESULTS
Inverter system with full wave
command

RIPPLE EVALUATION ON FUEL CELL EGS Use of the Low Pass Passive Filters - EXPERIMENTAL RESULTS
Inverter system
with modified
sine PWM
command

RIPPLE EVALUATION ON FUEL CELL EGS Use of the Low Pass Passive Filters - EXPERIMENTAL RESULTS
Inverter system
with modified
sine PWM
command

RIPPLE EVALUATION ON FUEL CELL EGS Use of the Low Pass Passive Filters - EXPERIMENTAL RESULTS
Inverter system
with pure sine
PWM command
RIPPLE EVALUATION ON FUEL CELL EGS Use of the Low Pass Passive Filters - EXPERIMENTAL RESULTS
Inverter system
with pure sine
PWM command

RIPPLE EVALUATION ON FUEL CELL EGS Use of the Low Pass Passive Filters - EXPERIMENTAL RESULTS

RIPPLE EVALUATION ON FUEL CELL EGS Use of the Low Pass Passive Filters - EXPERIMENTAL RESULTS
For all experiment the power of load is 100W and the ripple factor is around 6% (close
enough to 5% value, which was estimated by simulation). The obtained results are
shown in figure 52. Plot 52.a shows that the fundamental harmonic has in all cases the
main contribution to the current ripple. Plot 52.b shows that the harmonics mitigation
on LV DC bus is significant in all cases for CLVside values higher than 1mF.

RIPPLE EVALUATION ON FUEL CELL EGS Use of the Low Pass Passive Filters - EXPERIMENTAL RESULTS
The measured LF harmonics magnitudes shown in table 2 are represented in figure 53.
Plot 53.a shows that for different level of load power (excluding the case with no-load)
the fundamental harmonic has the main contribution to the current ripple.
Plot 52.b shows that all harmonics starting from the seventh harmonic (H_700) are well
mitigated by the passive filters.

RIPPLE EVALUATION ON FUEL CELL EGS Use of the Low Pass Passive Filters: 2 kW FC system - ICSI Rm.Valcea, Romania
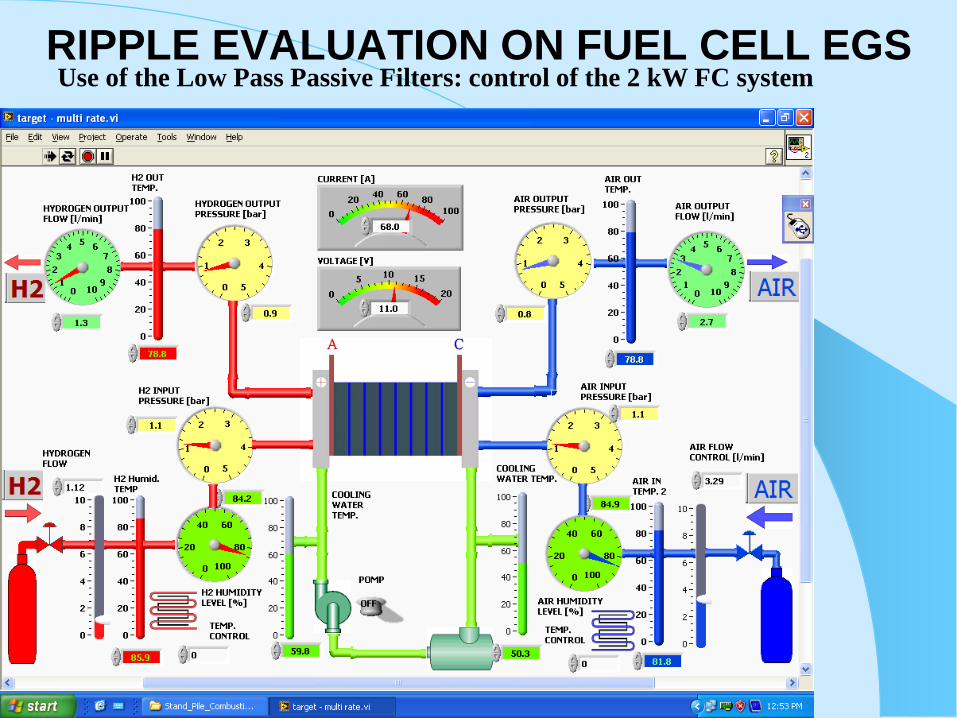
RIPPLE EVALUATION ON FUEL CELL EGS Use of the Low Pass Passive Filters: control of the 2 kW FC system

RIPPLE EVALUATION ON FUEL CELL EGS Use of the Low Pass Passive Filters: FC system - ICSI Rm.Valcea, Romania
ZSW (Ulm, Germania) – 500 W PEMFC

RIPPLE EVALUATION ON FUEL CELL EGS Use of the Low Pass Passive Filters - CONCLUSION
FC ripple factor is recommended to be less than 5% for an efficient
and safe operation, resulting bulky passive filters.
Consequently, before the LV DC voltage bus, it is recommended to be
used a boost power interface instead of a passive filter. In this case, it is
obviously that a better filtering based on active control can be made,
especially for the first LF harmonics, which mostly impose the value of
the ripple factor. Note that all harmonics starting from the seventh
harmonic are well mitigated by the passive filters.
The filter on the HV DC bus must be redesigned to mitigate the
current ripple under new imposed limit obtained, which are larger if the
boost power interface is used. So, reasonable values could be now
obtained for the passive components.
Advanced mitigation techniques for the FC current ripple will be
presented in second part of this presentation.

Fuel Cell Hybrid Power Source: Part II
The second part of presentation is focused on:
Techniques of active mitigation for the LF FC ripple;
Analysis of the appropriate FCHPS architectures for
active mitigation control of the LF FC ripple;
Comparison of the results in active filtering by different
control techniques: classical (peak current control (PCC)
or hysteretic control), based on fuzzy rules, nonlinear, etc;
Evaluation of the FC current ripple in FCHPS with
spread spectrum based on anti-control techniques;
Validation of the simulation results by measurements
performed in different experiments.

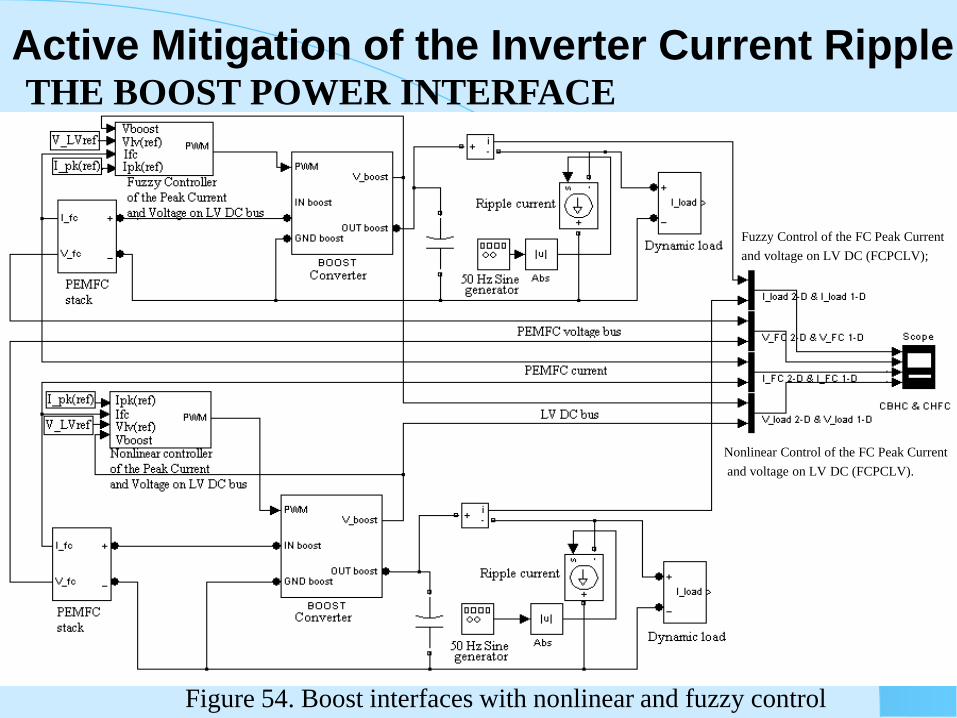
Active Mitigation of the Inverter Current Ripple THE BOOST POWER INTERFACE
In this section the performances of ripple mitigation using a boost power
interface is investigated. This DC-DC converter boost the voltage of the
PEMFC stack to the requested voltage on the LV DC bus that supply the
inverter system (see figure 54).
The main goals of the boost converter controller are to regulate the voltage on
the LV DC bus and to mitigate the current ripple that are back-propagated to the
PEMFC stack. Consequently, the voltage on LV DC bus and PEMFC current
must to be both control variables of the appropriate controller.
Different control techniques may be used to optimize the control performances
above mentioned. Two techniques of peak current control (PCC) are presented
here to compare their ability to mitigate the current ripple (see figure 54).
The PCC laws are implemented using a fuzzy controller and a nonlinear
controller (shown in figure 55.a and 55.b, respectively). Note that PC reference,
Ipk(ref) , could be chosen close to the MPP current. Voltage on the LV DC bus
will be boosted to the requested reference value, VLV(ref).
The ripple current is simply modelled by a rectified 50 Hz sine wave.
The load dynamic is modelled by a current controlled source.
Active Mitigation of the Inverter Current Ripple THE BOOST POWER INTERFACE
Figure 54. Boost interfaces with nonlinear and fuzzy control
Fuzzy Control of the FC Peak Current
and voltage on LV DC (FCPCLV);
Nonlinear Control of the FC Peak Current
and voltage on LV DC (FCPCLV).

Active Mitigation of the Inverter Current Ripple THE BOOST POWER INTERFACE
a) Fuzzy Control of the
PEMFC peak current
and voltage on LV DC
bus (FCPCLV)
b) Nonlinear Control of
the PEMFC peak current
and voltage on LV DC
bus (NCPCLV)
Figure 55. Control based on the PEMFC peak current and voltage on the LV DC bus

Active Mitigation of the Inverter Current Ripple THE BOOST POWER INTERFACE
Figure 56. Fuel cell voltage ripple (bottom) and current ripple (middle) for the
same load current ripple (top), using a boost power interface with peak current
control of fuzzy (thin line) and nonlinear (thick line) type

Active Mitigation of the Inverter Current Ripple THE BOOST POWER INTERFACE - conclusions
The advantage of using a 2-D control surface for fuzzy controller is that the
both control variables, fuel cell current and voltage on LV DC, can directly
control the duty-cycle of the switching command.
Instead of 2-D control surface, the NCPCLV controller uses a 1-D control
surface to generate a current ripple reference. Control is less flexible and thus
the performances of ripple mitigation are different, being lower in this case.
The ripple factor is about 2A/40A=5% and 5A/40A=7.5% for case of using
the fuzzy controller and nonlinear controller, respectively.
Better performances to mitigate the LF ripple could be obtained if the DC-DC
power interface is of multi-port type that use at least an auxiliary energy source
to supply the Controlled Current Source (CCS), which generates the anti-ripple.
An efficient way to mitigate the HF current ripple is to use the interleaving
switching technique. Some results are presented in next slides.

Active Mitigation of the Inverter Current Ripple INTERLEAVED PWM COMMAND
Figure 57. Matlab
diagram of the
DC-DC converter
The interleaved switching
technique is simply
implemented by delaying
the PWM pulses with Tsw/5,
where Tsw is the switching
period.

Active Mitigation of the Inverter Current Ripple INTERLEAVED PWM COMMAND
Figure 58. The DC-DC converter behaviour for a pulsed load

Active Mitigation of the Inverter Current Ripple INTERLEAVED PWM COMMAND
Figure 59. Fuel cell current (top), voltage (middle) and power (bottom) for pulse load

Active Mitigation of the Inverter Current Ripple INTERLEAVED PWM COMMAND
Figure 60. Fuel cell current (top) and its
power spectrum (bottom) for 0.5 kW load
Passive filters’ parameters:
LHVside=0.5 mH, CHVside=0.2 mF,
CLVside=100 uF (a low value is set).
2kW/12V PEMFC stack
100 Hz ripple factor is of
10A/100A=10% (< 15%) and
7A/40A=17,5% (> 15% )
for 75% and 25% rated load,
respectively.
RF for the HF current ripple is much
lower: about 2A/40A=5%
Conclusion: RF is to high for the
LF current ripple.
So, active mitigation based on bi-
buck topology is necessary.

Active Mitigation of the Inverter Current Ripple INTERLEAVED PWM COMMAND
Experimental results

Active Mitigation of the Inverter Current Ripple BI-BUCK TOPOLOGY
Figure 63. Bi-buck topology – Simulink diagram

Active Mitigation of the Inverter Current Ripple BI-BUCK TOPOLOGY
Figure 8. Load current in time (top)
and its power spectrum (bottom) Figure 7. Model of the dynamical load

Active Mitigation of the Inverter Current Ripple BI-BUCK TOPOLOGY
Figure 9. Bi-buck topology

Active Mitigation of the Inverter Current Ripple BI-BUCK TOPOLOGY Model of the bi-buck topology

Active Mitigation of the Inverter Current Ripple BI-BUCK TOPOLOGY – Controlled Voltage Source (CVS)

Active Mitigation of the Inverter Current Ripple BI-BUCK TOPOLOGY - CVS

Active Mitigation of the Inverter Current Ripple BI-BUCK TOPOLOGY - CVS
PWL control characteristic:
- input vector:
[-1, -0.5,-0.15, 0.15, 0.5, 1];
- output vector:
[-10,-10,-0.4, 0.4, 10, 10].

Active Mitigation of the Inverter Current Ripple BI-BUCK TOPOLOGY - CVS

Active Mitigation of the Inverter Current Ripple BI-BUCK TOPOLOGY - CVS

Active Mitigation of the Inverter Current Ripple BI-BUCK TOPOLOGY - CVS
Figure 21. The output voltage (top)
and its power spectrum (bottom)
with simulation parameters:
fsw=15 kHz, L=100 H, C=47 F,
Rout=2/3

Active Mitigation of the Inverter Current Ripple BI-BUCK TOPOLOGY - CVS
Figure 24. The CVS dynamic in phases plane using the simulation parameters:
fsw=15 kHz, L=100 H, C=47 F, Rout=2/3

Active Mitigation of the Inverter Current Ripple BI-BUCK TOPOLOGY – CVS: Conclusion
The bi-buck HPS topology was proposed as solution to mitigate the LF
current ripple on the HPS output node by injection of an anti-ripple current on
this point, where are connected the nonlinear load, the CVS and the CCS. The
injected current tracks the shape of LF inverter current ripple using an active
control loop for the CCS controller, which will be shown in next slides.
The proposed nonlinear CVS controller is designed to assure good
performances in both frequency and time domain. The closed loop frequency
value and voltage ripple could be tuned via the hysteresis level of the controller.
All the reported results have been validated in several simulations. The
nonlinear voltage CVS controller performs good performances:
- an output voltage ripple factor up to 4% for the load current in the rated range;
- a width of spread frequencies band in range of 3 kHz to 37 kHz, depending by
load power level;
- the power peaks in the range of 30% to 55% from the THD value.
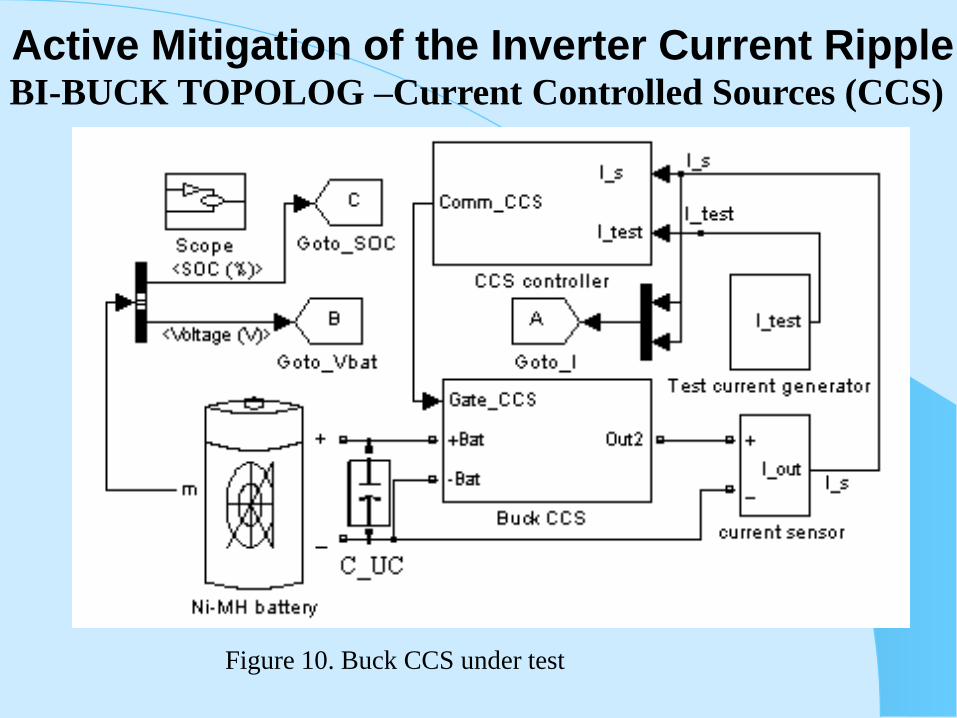
Active Mitigation of the Inverter Current Ripple BI-BUCK TOPOLOG –Current Controlled Sources (CCS)
Figure 10. Buck CCS under test

Active Mitigation of the Inverter Current Ripple BI-BUCK TOPOLOGY – CCS testing
Figure 13. Error of current
(top) and its power
spectrum (bottom) Figure 12. Simulation results for buck CCS
Figure 11. CCS hysteretic controller structure

Active Mitigation of the Inverter Current Ripple BI-BUCK TOPOLOGY – CCS Hysteretic current-mode control Peak current-mode control (PCC)
FC current (top) and its power spectrum (bottom): 1.26 kW HPS, GIfc=80

Active Mitigation of the Inverter Current Ripple BI-BUCK TOPOLOGY – CCS: nonlinear control law
)(1
*
)(1
)(
)(
)(
)(*
base
FC
outIfc
out
baseFC
FC
out
rippleFC
rippleout
rippleFC
rippleCCS
Ifc
GRF
RFG
V
V
RF
RF
I
I
I
IG
Computed gain G*Ifc vs. set value of the GIfc gain

Active Mitigation of the Inverter Current Ripple BI-BUCK TOPOLOGY – CCS: designing of FLC
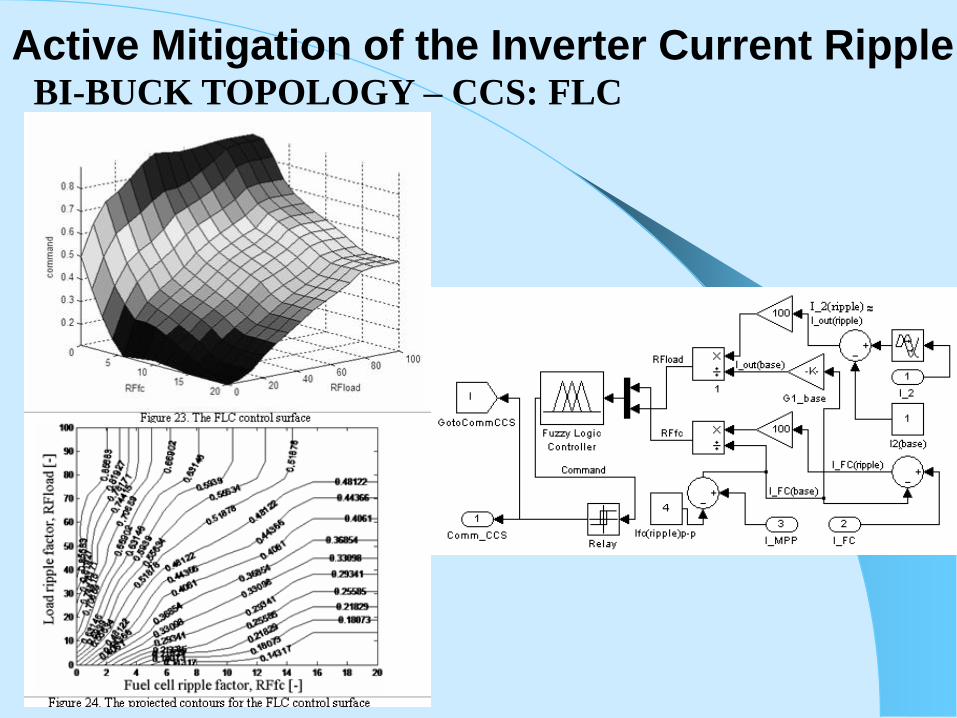
Active Mitigation of the Inverter Current Ripple BI-BUCK TOPOLOGY – CCS: FLC

Active Mitigation of the Inverter Current Ripple BI-BUCK TOPOLOGY – CCS: nonlinear controller

Active Mitigation of the Inverter Current Ripple BI-BUCK TOPOLOGY: simulation results
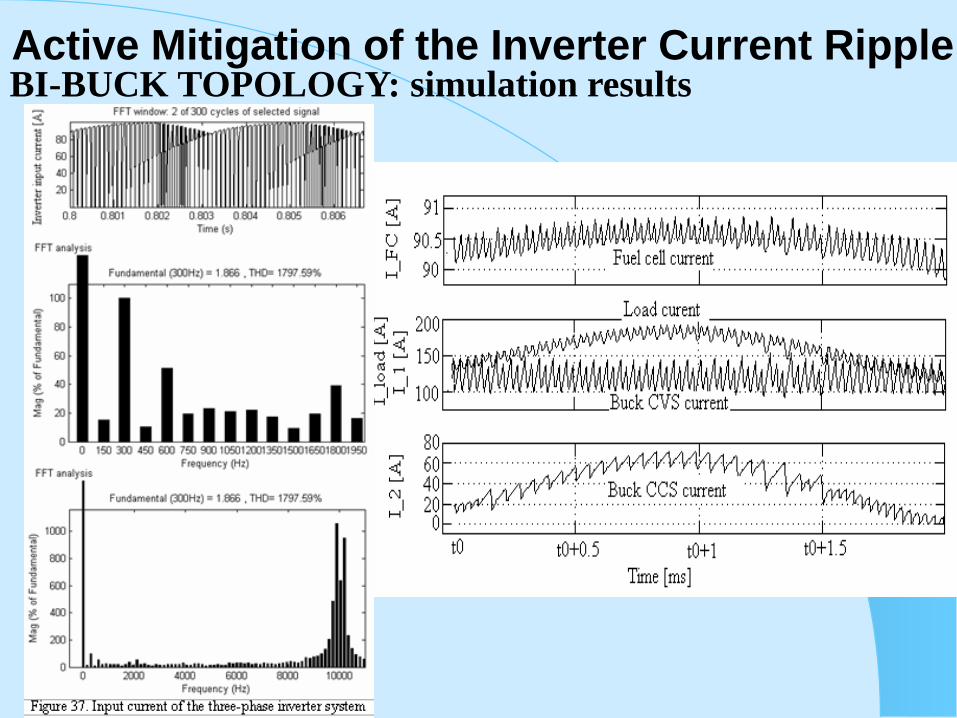
Active Mitigation of the Inverter Current Ripple BI-BUCK TOPOLOGY: simulation results

Active Mitigation of the Inverter Current Ripple
The LF current ripple normally appears in operation of the fuel cell inverter system
and this is back propagated on the HPS voltage bus, and finally to the PEMFC stack.
The design goal of the CCS controller is to mitigate this LF current ripple based on
an anti-ripple current generated by the buck CCS.
The input current of the inverter system has big HF harmonics close to the carrier
frequency. So, a low-pass filter is needed to extract its LF shape of this signal.
This filter introduces a variable phase-shift on the processed signal, thus a delayed
anti-ripple current is generated. Consequently, the desired mitigation performance
(RF up to 3%) can’t be obtained.
To avoid this problem, the anti-ripple current is generated using a mitigation control
loop for the CCS current that will track the FC current amplified by the GIfc gain.
The design methodology for the GIfc gain was presented here in detail.
Note that the CCS current will indirectly track the LF shape of the input current of
the inverter system based on proposed active control.
Consequently, the proposed bi-buck topology can effectively depress current RF to
be up to 3%, maintaining the voltage ripple factor up to 4% (or lower).
In simulation, the obtained current ripple factor is about 1%.
BI-BUCK TOPOLOGY: Conclusion

Part III: ESC schemes
In this part of the presentation, the architecture of the Hybrid Power
Source based on Maximum Power Point tracking controller to harvest the
energy available from used Renewable Energy Sources is presented. Usually,
the energy harvesting is based on Extremum Seeking Control (ESC) loop.
Two ESC schemes are proposed and analyzed in relation with the
classical ESC schemes: (1) the modified ESC scheme (named mESC scheme
because is based on band-pass filter BPF use, instead of series connection of
the high-pass and low-pass filters such as used in higher order ESC scheme)
and (2) its equivalent representation (named EQmESC because is based on
modified higher order ESC scheme).
The cut-off frequency of low-pass filter is chosen larger than in higher
order ESC schemes in both ESC schemes proposed. This improves the dither
persistence on the proposed ESC schemes, so the search speed of the
extremum increases accordingly.

Introduction
Architecture of the Hybrid Power Source
L FC ESSp p p
The power flow balance for the HPS The ESS power is
ESS L FCp p p
Different Energy Management Strategies (EMSs) were proposed for the
HPS used as distributed generation units in the smart grids or that supply the
power-train units in the hybrid vehicles.
If a load-following control loop is used, then the Energy Storage System
(ESS) will operate on Charge-Sustaining (CS) mode, dynamically
compensating the load changes.
If the load-following control loop is not used, then the ESS will operate in
one of the above mentioned mode by controlling the ESS charger based on two
available parameters, the charging ESS factor, kES, and the regenerative load
factor, kL.
The charger is a bidirectional DC-DC converter controlled by the EMS unit.
This part is organized as follows. Section 2 briefly presents some topologies
of the MPP tracking controller based on classical and proposed ESC schemes.
Analysis of the ESC schemes on the frequency domain is performed in Section
3. Last section concludes the first part of this presentation.
Introduction

MPP tracking controller
Figure 2 MPP tracking controller based on BPF
Figure 3 MPP tracking controller based on series connection of two filters (HPF+LPF)
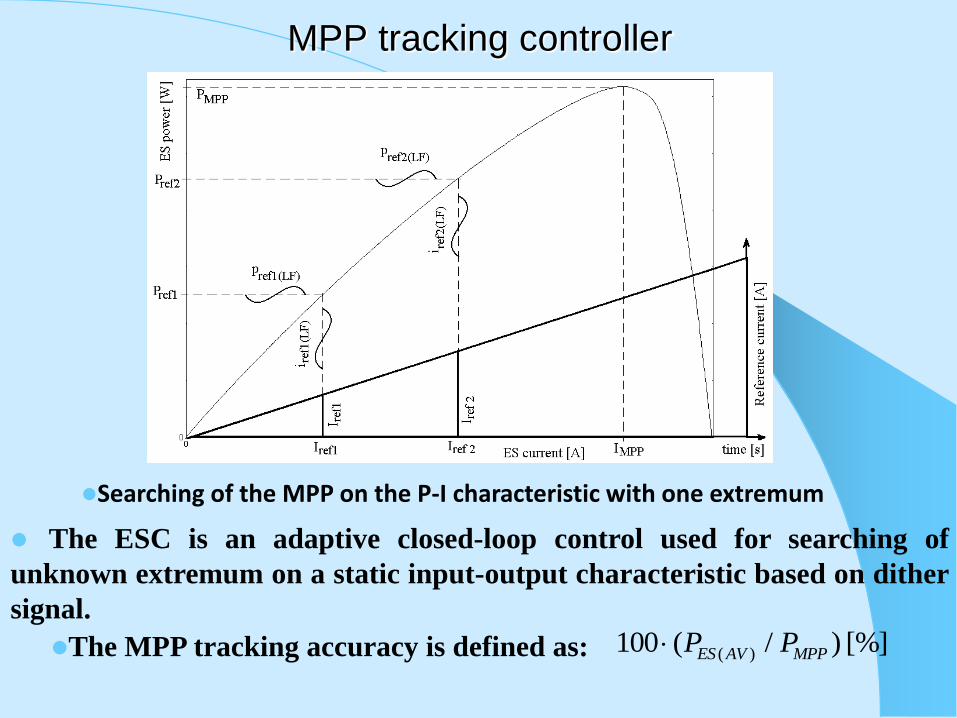
Searching of the MPP on the P-I characteristic with one extremum
MPP tracking controller
The ESC is an adaptive closed-loop control used for searching of
unknown extremum on a static input-output characteristic based on dither
signal.
The MPP tracking accuracy is defined as: ( )100 ( / ) [%]ES AV MPPP P

MPP tracking controller
The higher order ESC schemes
The higher order extremum seeking control (hoESC) schemes are
based on classical ESC scheme, which is augmented with LPF and/or
HPF as in Figure 3.
In this presentation, the cut-off frequency of LPF, l, is chosen larger
(l=ld, 3<l) than in hoES schemes proposed in the literature, where
l=ld, 0<l<1, and ωd is the dither frequency. Thus, at least three
harmonics of the ES power are processed into the ESC control loop to
improve the searching speed gain, GSS, based on increased level of the
dither persistence.
For example, the second harmonic of the reference current results
through the demodulation of first and third harmonics.
In this presentation, other approximate relationships of the
magnitudes for the first low frequency (LF) harmonics’ are shown in first
and second part, demonstrating the improved dither persistence on the
reference current.

MPP tracking controller
The proposed ESC scheme
In this section the modified ESC scheme, Figure 2 and its equivalent
representation (named EQmESC because is based on series connection
of the HP and LP filters; see Figure 3) are analyzed.
It may be noted that EQmESC scheme has the same topology with the
hoES control scheme, except the LPF cut-off frequencies that are larger
(l(EQmES)=l(mES)>3>1>l(hoES)).
The current-mode controller operates the DC-DC converter such as:
Thus:
( )ref eq ESi i
( )ref eq MPP ES MPPi I i I

Analysis of the ESC schemes on the frequency
domain
2( ) 1/ 1 / ,
( ) arg( ) arctan /
HPF h
HPF HPF h
G
G
2( ) 1/ / 1 ,
( ) arg( ) arctan /
LPF l
LPF LPF l
G
G
( ) ( ) ( ) ,
( ) arg( ) ( ) ( )
BPF HPF LPF
BPF BPF HPF LPF
G G G
G
The frequency characteristics of the HP, LP, and BP filters used are
given by the relationships , considering GBPF(s) = GHPF(s)GLPF(s)=
ωls/[(s + ωl)(s + ωh)], and shown in Figure 5 for h=0.5 and l=3.5

Analysis of the ESC schemes on the frequency
domain
1 1
3( ) 1( ) 1( ) 1( ) 3( )( )
1 1 1
3( )( ) ( ) ( )
( ) ( ) ( ) sin( ) ( ) ( ) sin( ) ( )
( ) ( ) ( ) sin( ) ( ) ( ) ( ) ( ) sin
eq LF HF d LPF LF d LPF eq LF
eq LF N LF HPF d LPF N LF HPF LPF
p t p t p t A t L G s p t A t L G s p
p t p t L G s A t L G s p t L G s G s A
1
( ) ( ) 3( )
( )
( ) ( ) sin( ) ( ) sin( ) ( )
d
N LF BPF d BPF LF d LF
t
p t L G s A t p t A t p t
Because the BPF topology can be represented as an equivalent series
combination of the HP and LP filters, then both mESC and EQmES
schemes operate equivalently based on the following signal processing
relationships on the ESC loop.
Thus, p3 and p3(eq) signals, and, obviously, the next signals on the
ESC loops have almost the same LF power spectrum:
3( )( ) 3( ) ( )( ) ( )( ) ( ) ( ) ( )eq LF LF ref eq LF ref LFp t p t i t i t
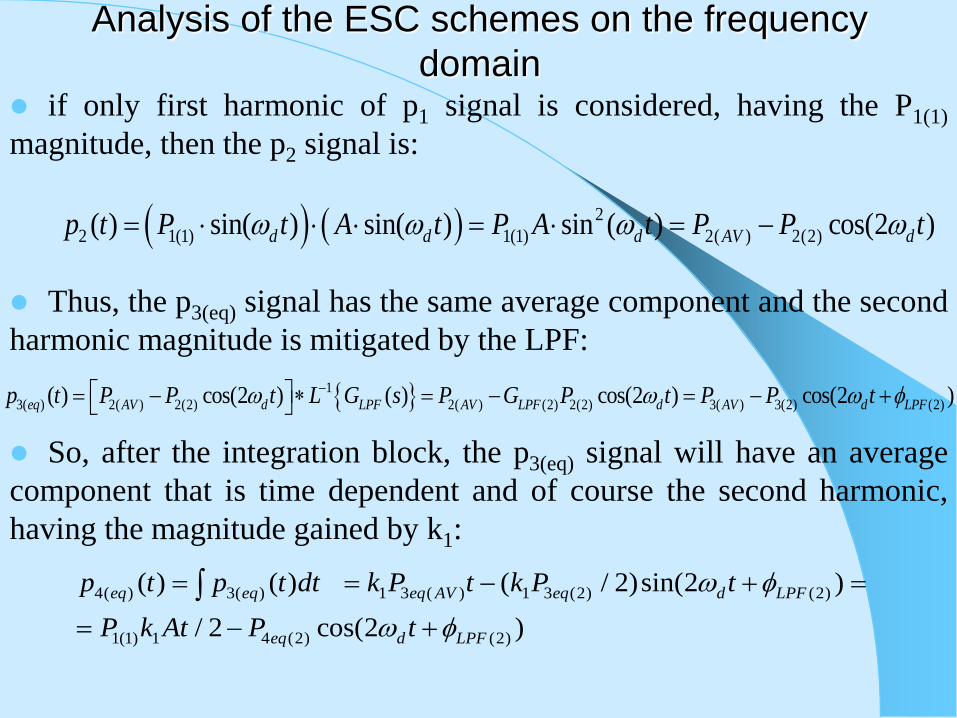
Analysis of the ESC schemes on the frequency
domain if only first harmonic of p1 signal is considered, having the P1(1)
magnitude, then the p2 signal is:
2
2 1(1) 1(1) 2( ) 2(2)( ) sin( ) sin( ) sin ( ) cos(2 )d d d AV dp t P t A t P A t P P t
Thus, the p3(eq) signal has the same average component and the second
harmonic magnitude is mitigated by the LPF:
1
3( ) 2( ) 2(2) 2( ) (2) 2(2) 3( ) 3(2) (2)( ) cos(2 ) ( ) cos(2 ) cos(2 )eq AV d LPF AV LPF d AV d LPFp t P P t L G s P G P t P P t
So, after the integration block, the p3(eq) signal will have an average
component that is time dependent and of course the second harmonic,
having the magnitude gained by k1:
4( ) 3( ) 1 3 ( ) 1 3 (2) (2)
1(1) 1 4 (2) (2)
( ) ( ) ( / 2)sin(2 )
/ 2 cos(2 )
eq eq eq AV eq d LPF
eq d LPF
p t p t dt k P t k P t
P k At P t
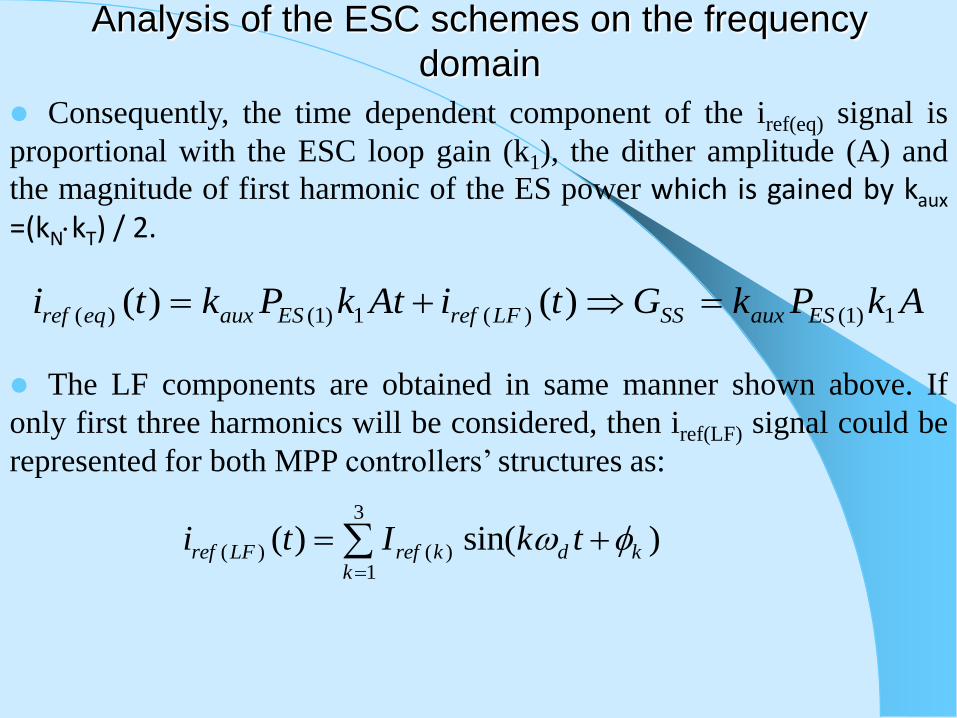
Analysis of the ESC schemes on the frequency
domain
Consequently, the time dependent component of the iref(eq) signal is
proportional with the ESC loop gain (k1), the dither amplitude (A) and
the magnitude of first harmonic of the ES power which is gained by kaux =(kNkT) / 2.
( ) (1) 1 ( ) (1) 1( ) ( )ref eq aux ES ref LF SS aux ESi t k P k At i t G k P k A
The LF components are obtained in same manner shown above. If
only first three harmonics will be considered, then iref(LF) signal could be
represented for both MPP controllers’ structures as:
3
( ) ( )1
( ) sin( )ref LF ref k d kk
i t I k t
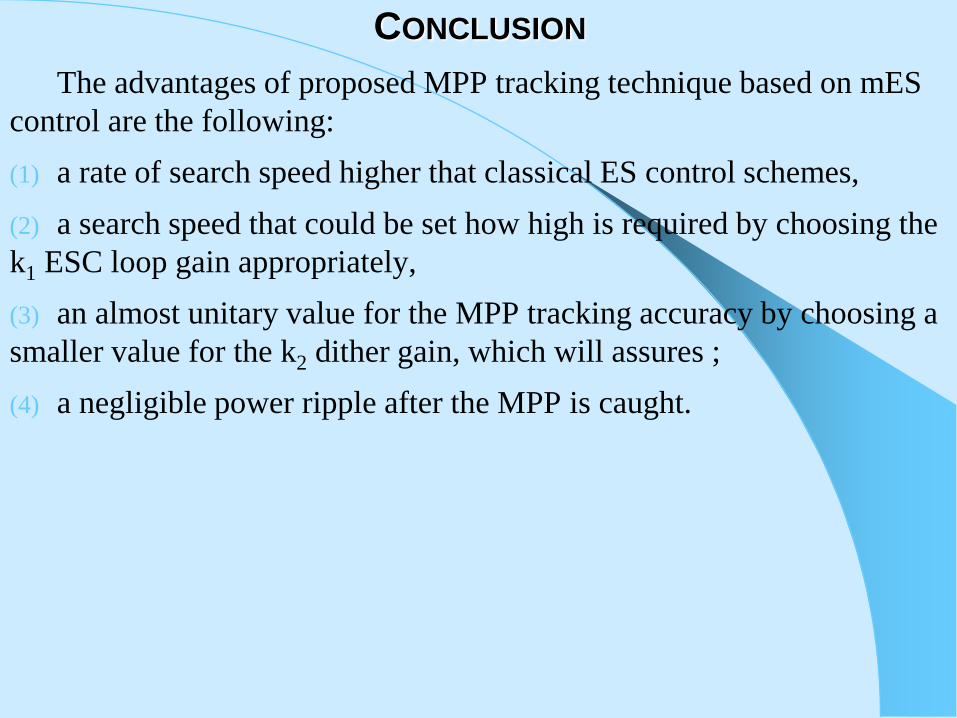
CONCLUSION
The advantages of proposed MPP tracking technique based on mES
control are the following:
(1) a rate of search speed higher that classical ES control schemes,
(2) a search speed that could be set how high is required by choosing the
k1 ESC loop gain appropriately,
(3) an almost unitary value for the MPP tracking accuracy by choosing a
smaller value for the k2 dither gain, which will assures ;
(4) a negligible power ripple after the MPP is caught.
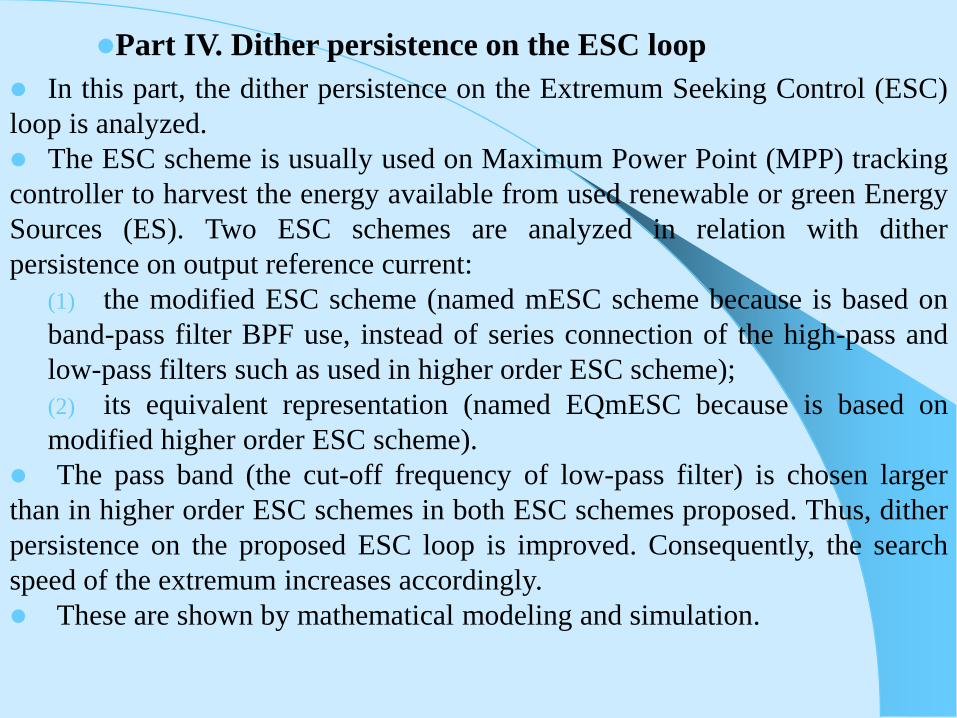
In this part, the dither persistence on the Extremum Seeking Control (ESC)
loop is analyzed.
The ESC scheme is usually used on Maximum Power Point (MPP) tracking
controller to harvest the energy available from used renewable or green Energy
Sources (ES). Two ESC schemes are analyzed in relation with dither
persistence on output reference current:
(1) the modified ESC scheme (named mESC scheme because is based on
band-pass filter BPF use, instead of series connection of the high-pass and
low-pass filters such as used in higher order ESC scheme);
(2) its equivalent representation (named EQmESC because is based on
modified higher order ESC scheme).
The pass band (the cut-off frequency of low-pass filter) is chosen larger
than in higher order ESC schemes in both ESC schemes proposed. Thus, dither
persistence on the proposed ESC loop is improved. Consequently, the search
speed of the extremum increases accordingly.
These are shown by mathematical modeling and simulation.
Part IV. Dither persistence on the ESC loop
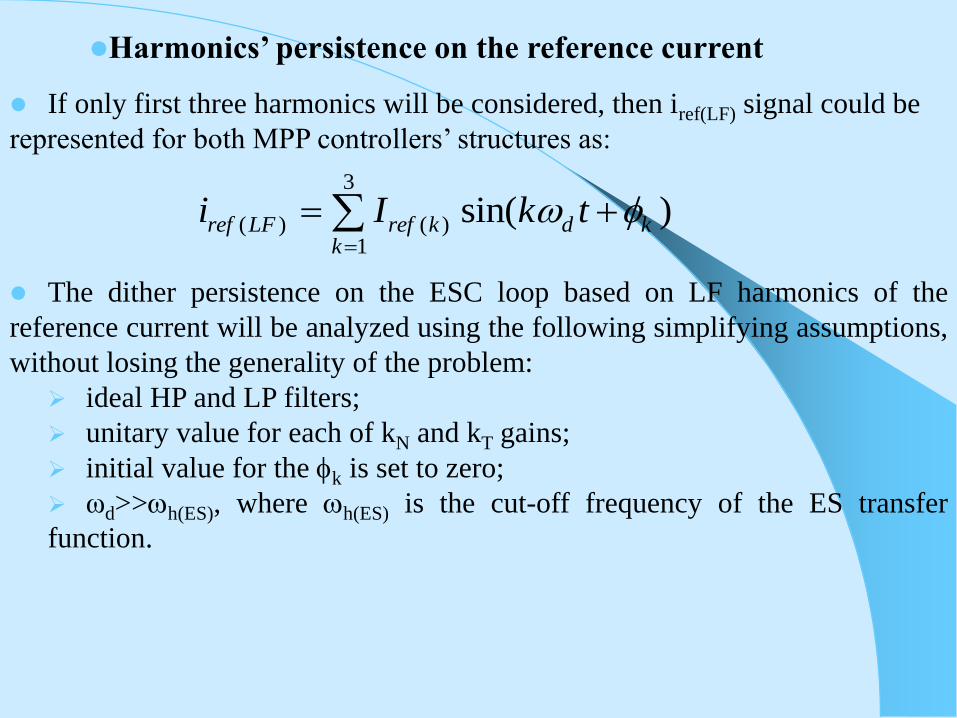
Harmonics’ persistence on the reference current
If only first three harmonics will be considered, then iref(LF) signal could be
represented for both MPP controllers’ structures as:
3
( ) ( )1
sin( )ref LF ref k d kk
i I k t
The dither persistence on the ESC loop based on LF harmonics of the
reference current will be analyzed using the following simplifying assumptions,
without losing the generality of the problem:
ideal HP and LP filters;
unitary value for each of kN and kT gains;
initial value for the k is set to zero;
ωd>>h(ES), where h(ES) is the cut-off frequency of the ES transfer
function.

The dither harmonics not interact with ES dynamic and ES power
signal will result from superposition of the LF dither harmonics via the ES
static characteristic.
The time-dependent gradient component will assure the searching of
the MPP. Usually, the ES static characteristic has a single MPP that
dynamically moves in the P-I plane.
Also, it is known that high power ES can be obtained by series/parallel
connections of multiple ESs. In this case the ES static characteristic could
have multiple MPPs and the global MPP is little bit more difficult to be
caught and then to be tracked.
The reference current, iref, which is used as probing signal to investigate
the power response via the ES power characteristic, will be given by the
following relationship:
( ) 1 2 3( ) ( ) sin( ) sin(2 ) sin(3 )ref ref ref LF ref d d di t I i t I a t a t a t
Harmonics’ persistence on the reference current

2 2
5(1) 1 1
2 2
5(2) 2 2 2
2 2
5(1) 3 3
,
,
I b c
I b c b
I b c
The harmonics of the i5(LF) signal are:
The iref(eq) signal has at least three harmonics beside the time-
dependent gradient component and gained dither:
3
( ) ( ) 5( ) 5( ) 21
sin( ) sin( )ref eq SS m k d k dk
i G t I k t k A t
Harmonics’ persistence on the reference current
3
2 21 1
2
11 1
3 3
3 13 1
2 1
2
3
2 2
3 1
2 2
2 1
3 1
1,
2 16
1,
8
3 41,
2 2 48
0,
81,
3 16
1
3 8
ES ES
d
ES
d
ESES
d
ES ES
d
ES
d
p a p ab k
p ac k
p a ap a ab k
c
p a p ab k
p a ac k

Testing the dither persistence
The dither persistence will be testing using a fuel cell (FC) stack as ES. A
preset 6 kW / 45 V model from the SimPower toolbox of the Matlab-
Simulink, version 2009b, is used. The FC stack has the parameters and
characteristics shown in next figures. If the fuel flow rate is set to nominal
value (50 lpm), then the P-I characteristic is shown in Figure 5.

The controlled current source is controlled by the reference current, iref,
given by relationship (5), where a1=0.3, a2=0.2, a3=0.1, and Iref value is varied
on the admissible range (up to IMPP=133 A) using linear variable generator.
The harmonics of the power response (pfc=vfvifc) and next signals on the
signal processing ESC loop are computed and displayed.
Testing the dither persistence
Figure 6 Testing diagram using the reference current as load

Testing the dither persistence
Figure 7 Testing diagram using the power derivatives to compute the signals’ harmonics
It is important to know if the harmonics of the i5(LF) signal have the same
value as the i5(LF) harmonics computed based on signal processing related to
ESC loop. So, the testing diagram that is shown in Figure 7 implements the
above mentioned relationships. The reference current, Iref, is varied on the
admissible range (up to IMPP=133 A) using a linear variable generator.
The i5(LF) harmonics using the power derivatives computed for a given Iref
value.

RESULTS
Figure 8 FC characteristics using a linear variable generator as load
Figure 9 Derivatives of the p_fc signal
The FC characteristics using the testing diagram shown in Figure 7 (a linear
variable generator for the ifc current is used) are shown in Figure 8. First
derivatives of the pfc signal are shown in Figure 9 using a signal processing
block to compute these derivatives.

RESULTS
Figure 10 Harmonics of the i5 signal computed based on the power derivatives
Figure 11 Harmonics of the i5 signal computed based on the signal processing in the ESC loop
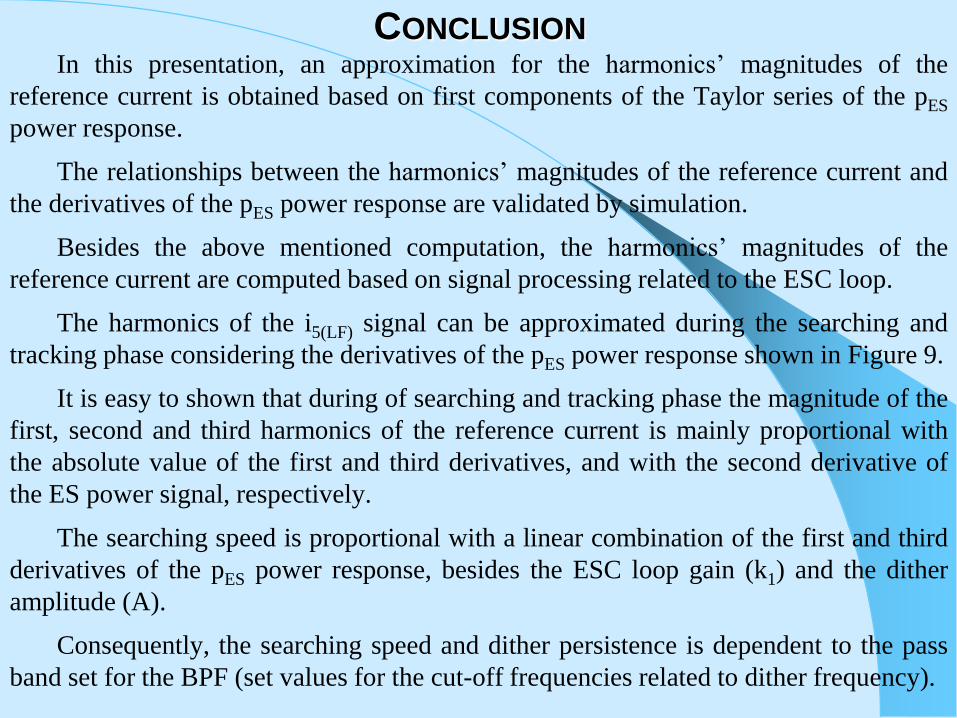
CONCLUSION In this presentation, an approximation for the harmonics’ magnitudes of the
reference current is obtained based on first components of the Taylor series of the pES
power response.
The relationships between the harmonics’ magnitudes of the reference current and
the derivatives of the pES power response are validated by simulation.
Besides the above mentioned computation, the harmonics’ magnitudes of the
reference current are computed based on signal processing related to the ESC loop.
The harmonics of the i5(LF) signal can be approximated during the searching and
tracking phase considering the derivatives of the pES power response shown in Figure 9.
It is easy to shown that during of searching and tracking phase the magnitude of the
first, second and third harmonics of the reference current is mainly proportional with
the absolute value of the first and third derivatives, and with the second derivative of
the ES power signal, respectively.
The searching speed is proportional with a linear combination of the first and third
derivatives of the pES power response, besides the ESC loop gain (k1) and the dither
amplitude (A).
Consequently, the searching speed and dither persistence is dependent to the pass
band set for the BPF (set values for the cut-off frequencies related to dither frequency).

Part V. Global Maximum Power Point Tracking
algorithms for Photovoltaic arrays under Partially
Shaded Conditions
1. Global Maximum Power Point Tracking
(GMPPT) algorithms - a brief review
2. The performance of the GMPP algorithms based
on the Extremum Seeking Control (ESC) schemes

The main objective of these presentations is to present an
Introduction in the Global Maximum Power Point (GMPP)
algorithms applied on power generated by the Photovoltaic (PV)
arrays.
Besides this survey on the GMPP algorithms proposed in last
decade, the Perturbed-based Extremum Seeking Control (PESC)
methods and their applications in PV arrays under Partially Shaded
Conditions (PSCs) are investigated as well.
The PESC schemes proposed to seek and track the GMPP of the
PV power will be analyzed as performance obtained for the
following indicators:
the searching resolution,
tracking accuracy,
tracking efficiency,
tracking speed,
and percent of the hit count.

Global Maximum
Power Point Tracking
algorithms

Global Maximum
Power Point Tracking
algorithms

Request permission from the copyright holder for the use of any part from this presentation
The first Asymptotic Perturbed Extremum Seeking Control (aPESC) scheme
was proposed in [41] for GMPP search based on Scalar PESC (PESCs) scheme
[42]. The PESCs scheme and its Asymptotic variant (aPESCs) are shown in
Figure 1 for switch in position (1) and (2). [41] Tan Y, Nešic D, Mareels I, Astolfi A. On global extremum seeking in the presence of local extrema. Automatica 2009;45(1):245–51.
Figure 1. The scalar PESC (PESCs) scheme and
its asymptotic variant (aPESCs)
Figure 2. The aPESC schemes based on (1) the
Lyapunov function (aPESCLy) and (2) the H1
harmonic (aPESCH1)

Request permission from the copyright holder for the use of any part from this presentation
The tracking loop is the same for all aPESC schemes proposed in the literature
and contains the following signal processing blocks of the process output
(y=yCC+yAC): the filtering (of the CC value, yCC), demodulation (product of the AC
value, yAC, with the dither signal), integration (of the demodulated signal), and
amplification (with k1). The filter can be of High-Pass Filter (HPF) type or Band-
Pass Filter (BPF) type [34]. The average value of the gradient for the tracking
signal is given by:
dx
dyk
dt
pd
dx
dykA
dt
pd A
22
111
1
2
1
The sweeping signal (p2 ) can have different expressions depending on the
asymptotic function chosen to modulate the dither:
- The asymptotic function is based on an exponential implementation [41];
- The asymptotic function is obtained through commutation between
constant and exponential amplitude of dither based on the Lyapunov switching
function [44];
- The asymptotic function is based on the magnitude of first harmonic
(H1) of the process output, which is obtained with Fast Fourier Transform (FFT) [44] Moura SJ, Chang YA. Lyapunov-based switched extremum seeking for photovoltaic power maximization. Control Eng Pract 2013;21(7):971–80.

Request permission from the copyright holder for the use of any part from this presentation
The H1 magnitude of the process output can be approximated by a using a BPF2
centered on the first harmonic, a derivative operator, or the BPF1 (see Figure 3).
Thus the following variants of the aPESCH1 scheme can be obtained in order to
be tested for GMPP search:
(1) the GaPESC scheme based on the BPF1,
(2) the GaPESCbpf scheme based on the BPF2,
(3) the GaPESCH1 scheme based on the H1
magnitude computed with the FFT, and
(4) the GaPESCd scheme based on the
derivative operator.
If the BPF2 is designed to approximate
the H1 magnitude, then the behavior of
both GaPESCbpf and GaPESCH1
schemes are almost the same. So, only
GaPESCH1 scheme will be considered
below.
Figure 3. The aPESC schemes

Request permission from the copyright holder for the use of any part from this presentation
Figure 4. The diagram of the GaPESC scheme

Request permission from the copyright holder for the use of any part from this presentation

Request permission from the copyright holder for the use of any part from this presentation
Figure 5. The Gd signals during the GMPP
search based on the GaPESC scheme
Figure 6. The GMPP search based on the
GaPESC scheme

Request permission from the copyright holder for the use of any part from this presentation
Figure 8. The PV characteristics for the 1Px7S PV
array under different irradiance sequences
PV characteristics for the
1Px3S PV array
PV characteristics for the
1Px5S PV array
Request permission from the copyright holder for the use of any part from this presentation

Request permission from the copyright holder for the use of any part from this presentation
Figure 12. The resolution of GMPP
searching for the GaPESCH1 scheme

Request permission from the copyright holder for the use of any part from this presentation

Request permission from the copyright holder for the use of any part from this presentation

Request permission from the copyright holder for the use of any part from this presentation

Request permission from the copyright holder for the use of any part from this presentation
The maximum, minimum and average value of the tracking accuracy reported
for GaPESC scheme is of 99.99%, 99.95% and 99.97%
The tracking efficiency of 99.97%
The resolution of all schemes is lower than 0.25% (1/402).
The robustness of the GMPP searching was tested for two PV patterns’ sequences
Each time the GMPP of the PV pattern from the noiselessly sequence was
accurately tracked.
The level of GMPP of the PV pattern from the noisy sequence is changed
randomly at each 10 milliseconds. Therefore, the GaPESC scheme searches
continuously the current GMPP.
Conclusions
Based on the performance shown and its simplicity of implementation, the
GaPESC scheme is competitive with similar techniques to scan the GMPP or other
advanced GMPP algorithms proposed.
Furthermore, the tuning ranges for the design parameters are relatively large
because the GaPESC scheme is based on adaptive control of ESC type.

This presentation is mainly based on following copyrighted materials:
N. Bizon (Ed.), Distributed Generation systems integrating Renewable Energy
Resources, 3 chapters written by N. Bizon, Nova Science Publishers Inc., USA,
2012, 978-1-61209-991-0 (hardcover), 978-1-61209-991-2 (ebook).
N. Bizon, Intelligent control of the Energy Generation System, book chapter in:
K. Metaxiotis (Ed.), Intelligent Information Systems and Knowledge
Management for Energy: Applications for Decision Support, Usage and
Environmental Protection, IGI Global, USA, 2009, chapter 2, pp. 40 - 96, ISBN
978-1-60566-737-9 (hardcover), ISBN 978-1-60566-738-6 (ebook).
N. Bizon, Nonlinear control of fuel cell hybrid power sources: Part II –Current
control, Applied Energy 88(7) (2011) 2574–2591,
http://dx.doi.org/10.1016/j.apenergy.2011.01.044
N. Bizon, Nonlinear control of fuel cell hybrid power sources: Part I –Voltage
control, Applied Energy 88(7) (2011) 2559–2573,
http://dx.doi.org/10.1016/j.apenergy.2011.01.030
N. Bizon, A new Topology of Fuel Cell Hybrid Power Source for Efficient
Operation and High Reliability, Journal of Power Sources 196(6) (2011) 3260–
3270, http://dx.doi.org/10.1016/j.jpowsour.2010.11.049
Request permission from the copyright holder for the use of any part from this presentation

This presentation is mainly based on following copyrighted materials (continued): N. Bizon, N. M. Tabatabaei and Hossein Shayeghi (Ed.), Analysis, Control and Optimal Operations
in Hybrid Power Systems - Advanced Techniques and Applications for Linear and Nonlinear
Systems, Springer Verlag London Limited, London, UK, 2013. 978-1-4471-5538-6, 978-1-4471-
5537-9.
http://dx.doi.org/10.1007/978-1-4471-5538-6,
http://www.springer.com/engineering/control/book/978-1-4471-5537-9
N. Bizon and N. M. Tabatabaei (Ed.), Advances in Energy Research: Energy and Power
Engineering, Nova Science Publishers Inc., USA, 2013 978-1-62257-534-3 (hardcover), 978-1-
62257-546-6 (ebook).
https://www.novapublishers.com/catalog/product_info.php?products_id=36315&osCsid=cce0dd5ced12
df6ba9340d8c9d71142b
N. Bizon (Ed.), Advances in Energy Research: Distributed Generation systems integrating
Renewable Energy Resources, 3 chapters by N. Bizon, Nova Science Publishers Inc., USA, 2012,
978-1-61209-991-0 (hardcover), 978-1-61209-991-2 (ebook). 692 pp
N. Bizon, Global Maximum Power Point Tracking (GMPPT) of Photovoltaic array using the
Extremum Seeking Control (ESC): A review and a new GMPPT ESC scheme, Renewable &
Sustainable Energy Reviews 57 (may 2016), 524–539, 10.1016/j.rser.2015.12.221
http://www.sciencedirect.com/science/article/pii/S1364032115016044
N. Bizon, Global Extremum Seeking Control of the Power Generated by a Photovoltaic Array
under Partially Shaded Conditions, Energy Conversion and Management,
10.1016/j.enconman.2015.11.046
http://www.sciencedirect.com/science/article/pii/S0196890415010663
Request permission from the copyright holder for the use of any part from this presentation

ACKNOWLEDGMENT
The support from the Ministry of EU
Affairs Turkish National Agency
under the Project Code: 2015-1-TR01-
KA203-021342 is acknowledged.

Thank!
Questions?
Nicu Bizon
University of Pitesti,
1 Targu din Vale, Arges, 110040 Pitesti, Romania
[email protected]; [email protected];
http://www.upit.ro/index.php?page=nicu-bizon-
personal-fecc
https://www.researchgate.net/profile/Nicu_Bizon