era-40 representation of the arctic atmospheric … representation of the arctic atmospheric...
TRANSCRIPT
ERA-40 representation of the arctic atmospheric moisture budget
David H. Bromwich, Sheng-Hung Wang, and Andrew J. Monaghan
Polar Meteorology Group, Byrd Polar Research Center and
Atmospheric Sciences Program, Department of Geography The Ohio State University, Columbus, OH
1 Introduction The European Centre for Medium-Range Weather Forecasts (ECMWF) 40-year Reanalysis (ERA-40, 1957-present, Uppala et al. 1999) has been eagerly awaited by the scientific community. It is a valuable complement to the 50+-year National Centers for Environmental Prediction (NCEP) / National Center for Atmospheric Research (NCAR) Reanalysis (NNR, 1948-present, Kalnay et al. 1996, Kistler et al. 2001). The higher horizontal resolution (T-159 vs. T-62), the greater use of recent satellite observations, and the more accurate treatment of sea ice and land ice in ERA-40 than NNR suggest that more accurate polar climate diagnoses will be possible using ERA-40. It is important to test this assumption, however.
Monthly mean ERA-40 data for January 1989-October 1992 provided by ECMWF are here evaluated in relation to the atmospheric moisture budget over the Arctic ocean and land areas. Extensive comparisons are made to the first ECMWF Reanalysis (ERA-15, 1979-1993) and the NNR. This is followed by an analysis of the negative geopotential height bias at 500 hPa of ERA-40 in relation to ERA-15 at high northern latitudes. This is done because this bias is primarily attributable to ERA-40, is a significant ERA-40 shortcoming, and apparently distorts the ERA-40 predicted precipitation over the central Arctic in summer (reported by Serreze and Etringer, this volume). Although the emphasis here is on the Arctic, some evaluation is presented for the Antarctic, particularly in relation to the ERA-40 negative geopotential height bias.
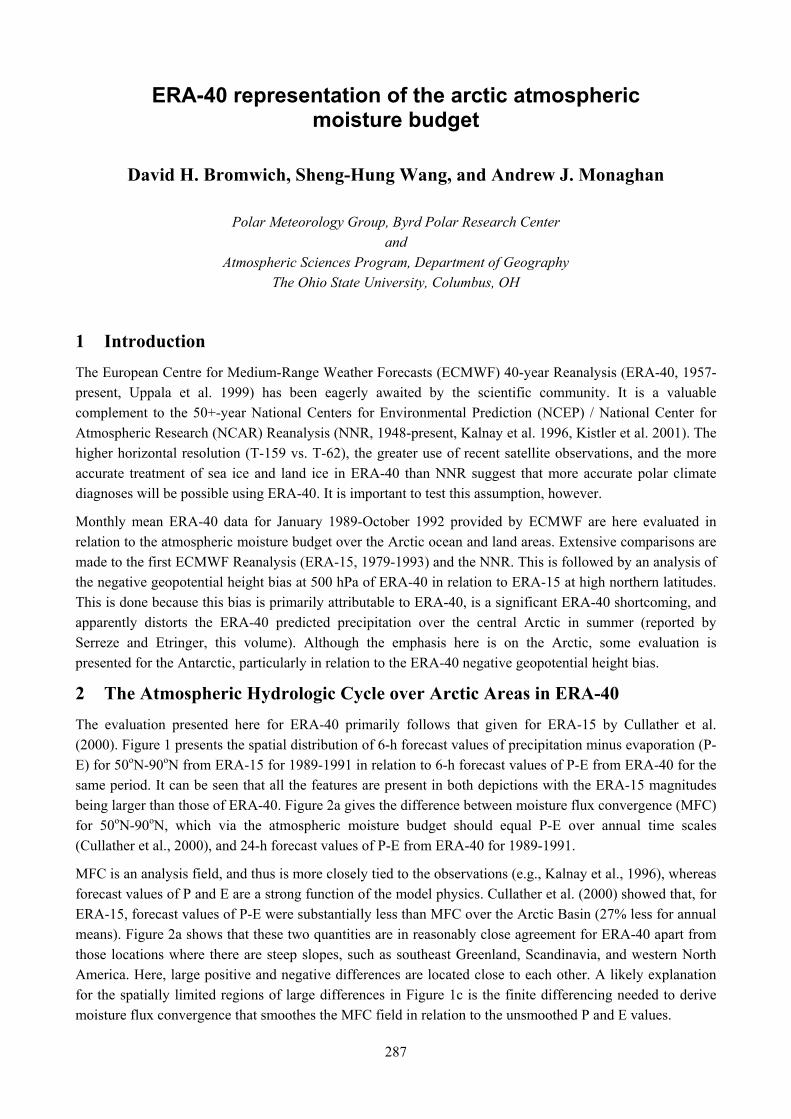
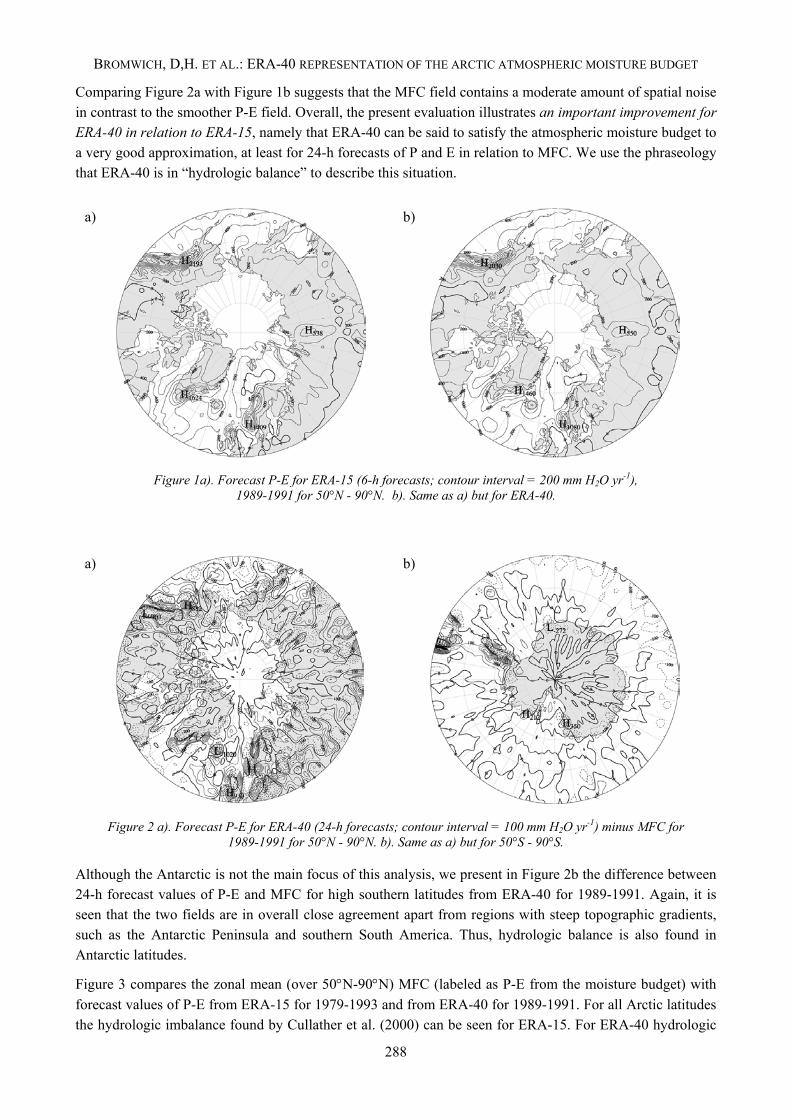
2 The Atmospheric Hydrologic Cycle over Arctic Areas in ERA-40 The evaluation presented here for ERA-40 primarily follows that given for ERA-15 by Cullather et al. (2000). Figure 1 presents the spatial distribution of 6-h forecast values of precipitation minus evaporation (P-E) for 50oN-90oN from ERA-15 for 1989-1991 in relation to 6-h forecast values of P-E from ERA-40 for the same period. It can be seen that all the features are present in both depictions with the ERA-15 magnitudes being larger than those of ERA-40. Figure 2a gives the difference between moisture flux convergence (MFC) for 50oN-90oN, which via the atmospheric moisture budget should equal P-E over annual time scales (Cullather et al., 2000), and 24-h forecast values of P-E from ERA-40 for 1989-1991.
MFC is an analysis field, and thus is more closely tied to the observations (e.g., Kalnay et al., 1996), whereas forecast values of P and E are a strong function of the model physics. Cullather et al. (2000) showed that, for ERA-15, forecast values of P-E were substantially less than MFC over the Arctic Basin (27% less for annual means). Figure 2a shows that these two quantities are in reasonably close agreement for ERA-40 apart from those locations where there are steep slopes, such as southeast Greenland, Scandinavia, and western North America. Here, large positive and negative differences are located close to each other. A likely explanation for the spatially limited regions of large differences in Figure 1c is the finite differencing needed to derive moisture flux convergence that smoothes the MFC field in relation to the unsmoothed P and E values.
287
BROMWICH, D,H. ET AL.: ERA-40 REPRESENTATION OF THE ARCTIC ATMOSPHERIC MOISTURE BUDGET
Comparing Figure 2a with Figure 1b suggests that the MFC field contains a moderate amount of spatial noise in contrast to the smoother P-E field. Overall, the present evaluation illustrates an important improvement for ERA-40 in relation to ERA-15, namely that ERA-40 can be said to satisfy the atmospheric moisture budget to a very good approximation, at least for 24-h forecasts of P and E in relation to MFC. We use the phraseology that ERA-40 is in “hydrologic balance” to describe this situation.
a)
b)
Figure 1a). Forecast P-E for ERA-15 (6-h forecasts; contour interval = 200 mm H2O yr-1), 1989-1991 for 50°N - 90°N. b). Same as a) but for ERA-40.
a)
b)
Figure 2 a). Forecast P-E for ERA-40 (24-h forecasts; contour interval = 100 mm H2O yr-1) minus MFC for 1989-1991 for 50°N - 90°N. b). Same as a) but for 50°S - 90°S.
Although the Antarctic is not the main focus of this analysis, we present in Figure 2b the difference between 24-h forecast values of P-E and MFC for high southern latitudes from ERA-40 for 1989-1991. Again, it is seen that the two fields are in overall close agreement apart from regions with steep topographic gradients, such as the Antarctic Peninsula and southern South America. Thus, hydrologic balance is also found in Antarctic latitudes.
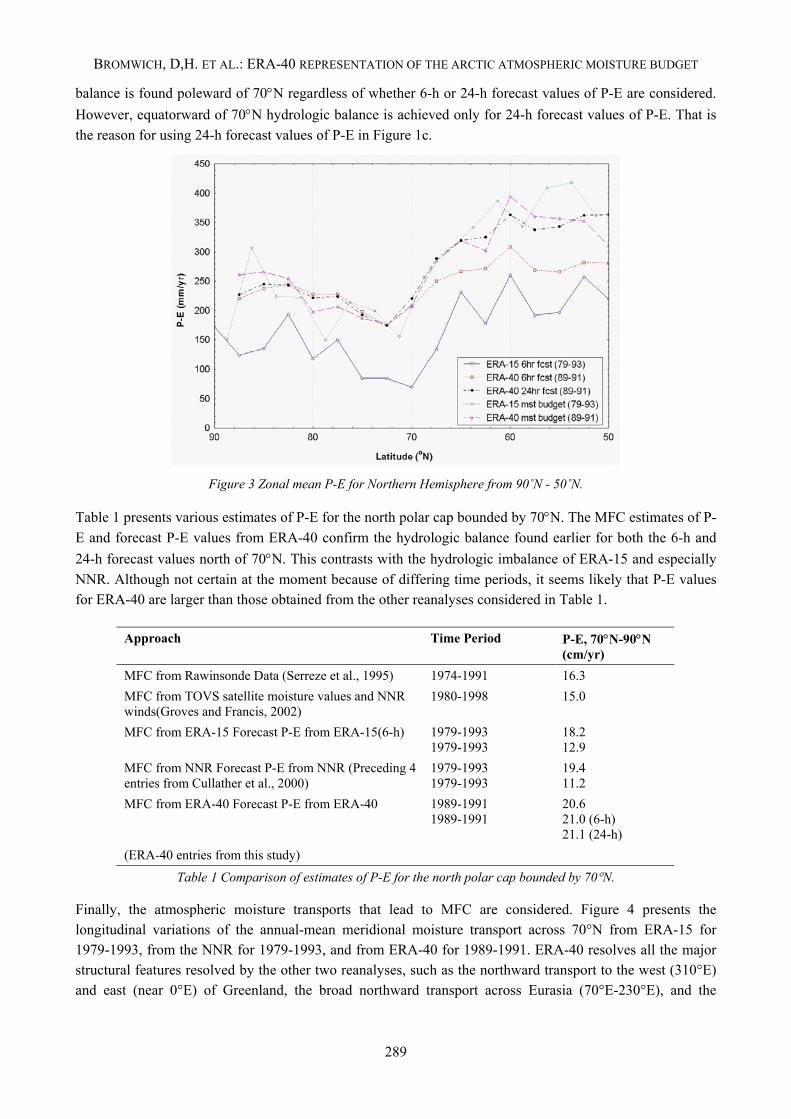
Figure 3 compares the zonal mean (over 50°N-90°N) MFC (labeled as P-E from the moisture budget) with forecast values of P-E from ERA-15 for 1979-1993 and from ERA-40 for 1989-1991. For all Arctic latitudes the hydrologic imbalance found by Cullather et al. (2000) can be seen for ERA-15. For ERA-40 hydrologic
288
BROMWICH, D,H. ET AL.: ERA-40 REPRESENTATION OF THE ARCTIC ATMOSPHERIC MOISTURE BUDGET
balance is found poleward of 70°N regardless of whether 6-h or 24-h forecast values of P-E are considered. However, equatorward of 70°N hydrologic balance is achieved only for 24-h forecast values of P-E. That is the reason for using 24-h forecast values of P-E in Figure 1c.
Figure 3 Zonal mean P-E for Northern Hemisphere from 90˚N - 50˚N.
Table 1 presents various estimates of P-E for the north polar cap bounded by 70°N. The MFC estimates of P-E and forecast P-E values from ERA-40 confirm the hydrologic balance found earlier for both the 6-h and 24-h forecast values north of 70°N. This contrasts with the hydrologic imbalance of ERA-15 and especially NNR. Although not certain at the moment because of differing time periods, it seems likely that P-E values for ERA-40 are larger than those obtained from the other reanalyses considered in Table 1.
Approach Time Period P-E, 70°N-90°N (cm/yr)
MFC from Rawinsonde Data (Serreze et al., 1995) 1974-1991 16.3 MFC from TOVS satellite moisture values and NNR winds(Groves and Francis, 2002)
1980-1998 15.0
MFC from ERA-15 Forecast P-E from ERA-15(6-h) 1979-1993 1979-1993
18.2 12.9
MFC from NNR Forecast P-E from NNR (Preceding 4 entries from Cullather et al., 2000)
1979-1993 1979-1993
19.4 11.2
MFC from ERA-40 Forecast P-E from ERA-40 1989-1991 1989-1991
20.6 21.0 (6-h) 21.1 (24-h)
(ERA-40 entries from this study)
Table 1 Comparison of estimates of P-E for the north polar cap bounded by 70°N.
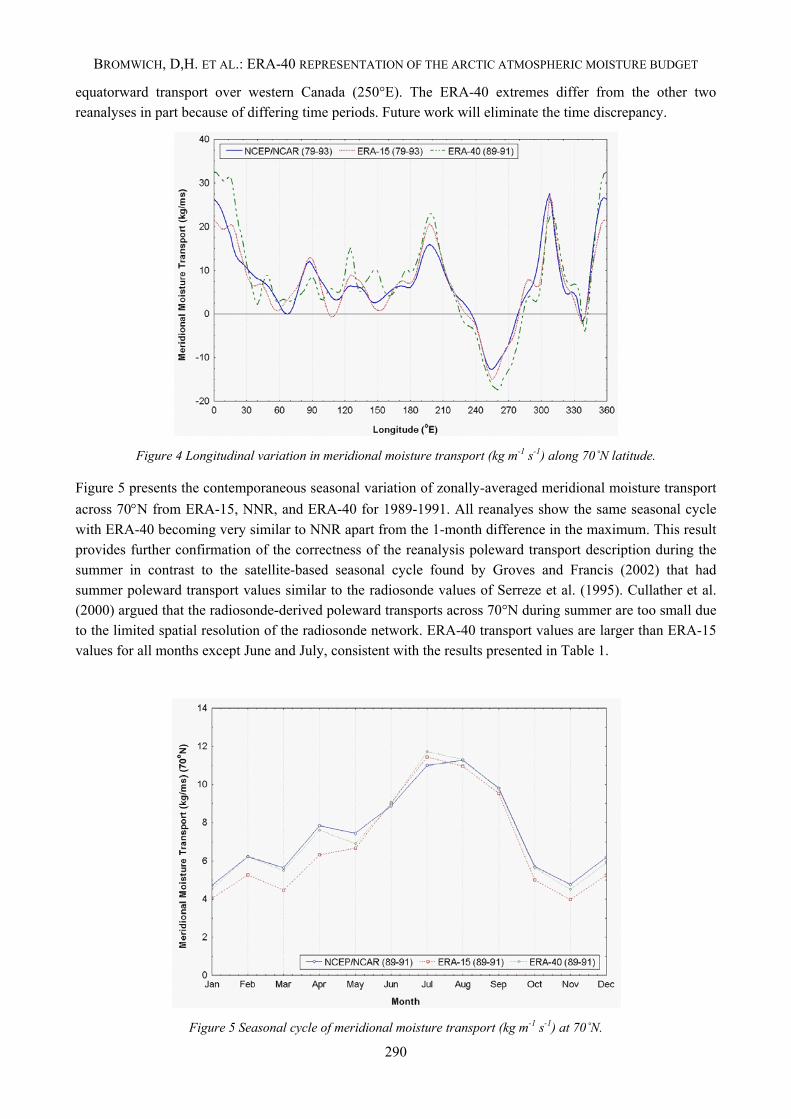
Finally, the atmospheric moisture transports that lead to MFC are considered. Figure 4 presents the longitudinal variations of the annual-mean meridional moisture transport across 70°N from ERA-15 for 1979-1993, from the NNR for 1979-1993, and from ERA-40 for 1989-1991. ERA-40 resolves all the major structural features resolved by the other two reanalyses, such as the northward transport to the west (310°E) and east (near 0°E) of Greenland, the broad northward transport across Eurasia (70°E-230°E), and the
289
BROMWICH, D,H. ET AL.: ERA-40 REPRESENTATION OF THE ARCTIC ATMOSPHERIC MOISTURE BUDGET
equatorward transport over western Canada (250°E). The ERA-40 extremes differ from the other two reanalyses in part because of differing time periods. Future work will eliminate the time discrepancy.
Figure 4 Longitudinal variation in meridional moisture transport (kg m-1 s-1) along 70˚N latitude.
Figure 5 presents the contemporaneous seasonal variation of zonally-averaged meridional moisture transport across 70°N from ERA-15, NNR, and ERA-40 for 1989-1991. All reanalyes show the same seasonal cycle with ERA-40 becoming very similar to NNR apart from the 1-month difference in the maximum. This result provides further confirmation of the correctness of the reanalysis poleward transport description during the summer in contrast to the satellite-based seasonal cycle found by Groves and Francis (2002) that had summer poleward transport values similar to the radiosonde values of Serreze et al. (1995). Cullather et al. (2000) argued that the radiosonde-derived poleward transports across 70°N during summer are too small due to the limited spatial resolution of the radiosonde network. ERA-40 transport values are larger than ERA-15 values for all months except June and July, consistent with the results presented in Table 1.
Figure 5 Seasonal cycle of meridional moisture transport (kg m-1 s-1) at 70˚N.
290
BROMWICH, D,H. ET AL.: ERA-40 REPRESENTATION OF THE ARCTIC ATMOSPHERIC MOISTURE BUDGET
In summary, the atmospheric moisture budget for the Arctic given by ERA-40 is a substantial improvement over that from ERA-15 in that hydrologic balance has been achieved. There is no evidence of spin-up of the forecast fields of P-E north of 70°N, but between 50°and 70°N substantial spin-up is evident and the 24-h forecast fields are the ones to use.
3 Lower Tropospheric Cold Bias in ERA-40
3.1 Arctic
3.1.1 Annual Averages, 1989-1991
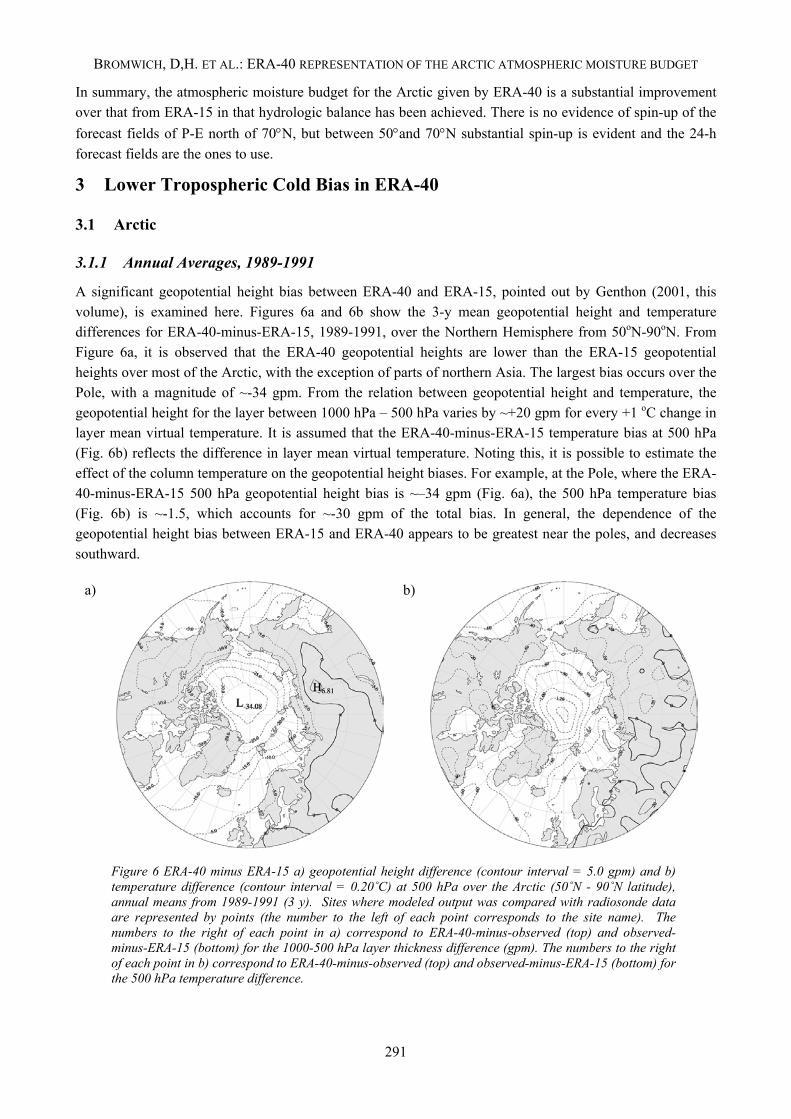
A significant geopotential height bias between ERA-40 and ERA-15, pointed out by Genthon (2001, this volume), is examined here. Figures 6a and 6b show the 3-y mean geopotential height and temperature differences for ERA-40-minus-ERA-15, 1989-1991, over the Northern Hemisphere from 50oN-90oN. From Figure 6a, it is observed that the ERA-40 geopotential heights are lower than the ERA-15 geopotential heights over most of the Arctic, with the exception of parts of northern Asia. The largest bias occurs over the Pole, with a magnitude of ~-34 gpm. From the relation between geopotential height and temperature, the geopotential height for the layer between 1000 hPa – 500 hPa varies by ~+20 gpm for every +1 oC change in layer mean virtual temperature. It is assumed that the ERA-40-minus-ERA-15 temperature bias at 500 hPa (Fig. 6b) reflects the difference in layer mean virtual temperature. Noting this, it is possible to estimate the effect of the column temperature on the geopotential height biases. For example, at the Pole, where the ERA-40-minus-ERA-15 500 hPa geopotential height bias is ~–34 gpm (Fig. 6a), the 500 hPa temperature bias (Fig. 6b) is ~-1.5, which accounts for ~-30 gpm of the total bias. In general, the dependence of the geopotential height bias between ERA-15 and ERA-40 appears to be greatest near the poles, and decreases southward.
a)
b)
Figure 6 ERA-40 minus ERA-15 a) geopotential height difference (contour interval = 5.0 gpm) and b) temperature difference (contour interval = 0.20˚C) at 500 hPa over the Arctic (50˚N - 90˚N latitude), annual means from 1989-1991 (3 y). Sites where modeled output was compared with radiosonde data are represented by points (the number to the left of each point corresponds to the site name). The numbers to the right of each point in a) correspond to ERA-40-minus-observed (top) and observed-minus-ERA-15 (bottom) for the 1000-500 hPa layer thickness difference (gpm). The numbers to the right of each point in b) correspond to ERA-40-minus-observed (top) and observed-minus-ERA-15 (bottom) for the 500 hPa temperature difference.
291
BROMWICH, D,H. ET AL.: ERA-40 REPRESENTATION OF THE ARCTIC ATMOSPHERIC MOISTURE BUDGET
In Fig. 6b, the values of ERA-40-minus-observed (top) and observed-minus-ERA-15 (bottom) 500 hPa temperature differences are plotted for selected radiosonde sites in order to indicate the relative bias of ERA-40 and ERA-15 to the observations. It is apparent that a cold bias, when averaged over several sites, is on the order of ~-1 oC, is present in the ERA-40 data, while a cold bias of ~-0.5 oC is present in the ERA-15 data. To investigate the relative contribution of the cold bias of ERA-40, the 1000 hPa – 500 hPa geopotential height thickness differences for ERA-40-minus-observed (top) and observed-minus-ERA-15 (bottom) are plotted in Fig. 6a next to each site where there is a continuous radiosonde record. Added together, if the two numbers are approximately the same as the contours, the bias is attributable almost entirely to the column temperature. Otherwise, if the sum of the numbers does not match the contours, the geopotential height bias is affected by other factors as well (e.g., surface pressure difference, model topography). Similarly, if the bias for ERA-40-minus-observed (top) is nearly identical to the contours plotted on the map, then the problem can be attributed largely to ERA-40 (conversely, the same is true for ERA-15). Upon summing the numbers and comparing with the contours in Fig. 6a, it is observed that the bias is almost entirely related to the 1000 hPa - 500 hPa column temperature at all of the sites. With respect to ERA-40 and ERA-15, the trends suggest that, in general, the cold bias in ERA-40 is the largest contributor to the geopotential height bias in the North Atlantic and Russian Arctic, while in the Canadian Arctic the effects of the temperature biases in ERA-40 (cold) and ERA-15 (warm) are approximately equal.
3.1.2 Seasonal Averages for JJA (Summer) and DJF (Winter), 1989-1991
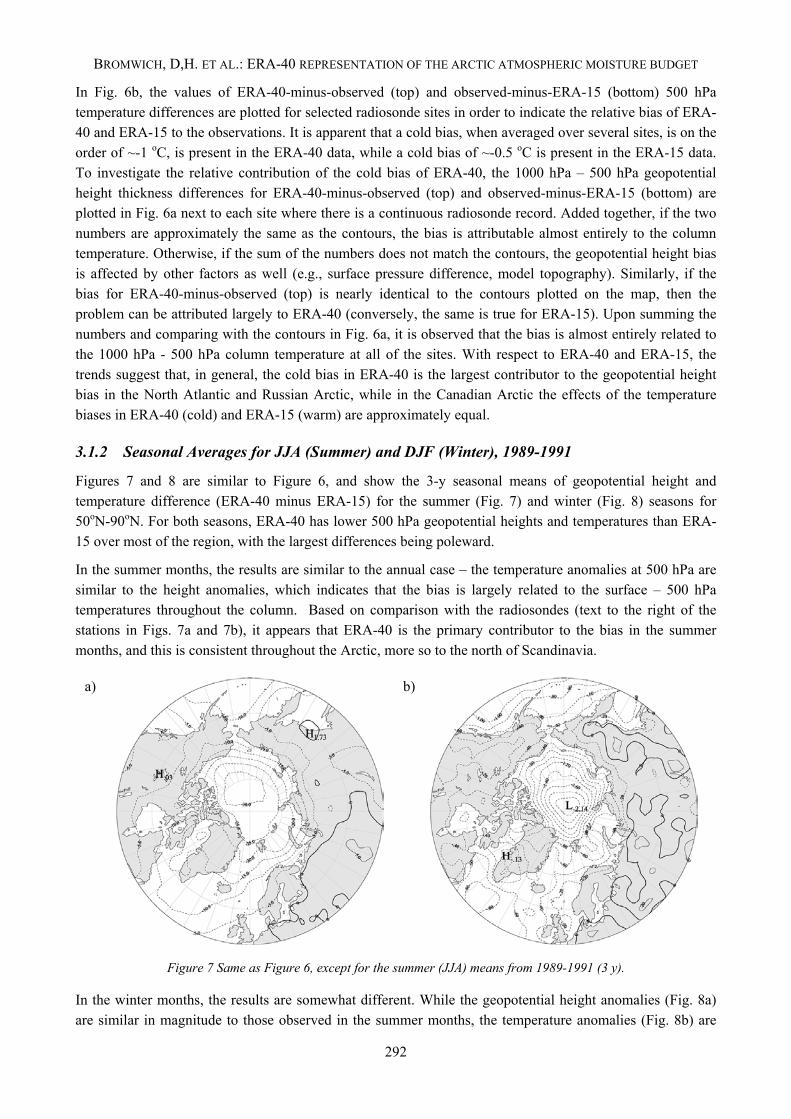
Figures 7 and 8 are similar to Figure 6, and show the 3-y seasonal means of geopotential height and temperature difference (ERA-40 minus ERA-15) for the summer (Fig. 7) and winter (Fig. 8) seasons for 50oN-90oN. For both seasons, ERA-40 has lower 500 hPa geopotential heights and temperatures than ERA-15 over most of the region, with the largest differences being poleward.
In the summer months, the results are similar to the annual case – the temperature anomalies at 500 hPa are similar to the height anomalies, which indicates that the bias is largely related to the surface – 500 hPa temperatures throughout the column. Based on comparison with the radiosondes (text to the right of the stations in Figs. 7a and 7b), it appears that ERA-40 is the primary contributor to the bias in the summer months, and this is consistent throughout the Arctic, more so to the north of Scandinavia.
a)
b)
Figure 7 Same as Figure 6, except for the summer (JJA) means from 1989-1991 (3 y).
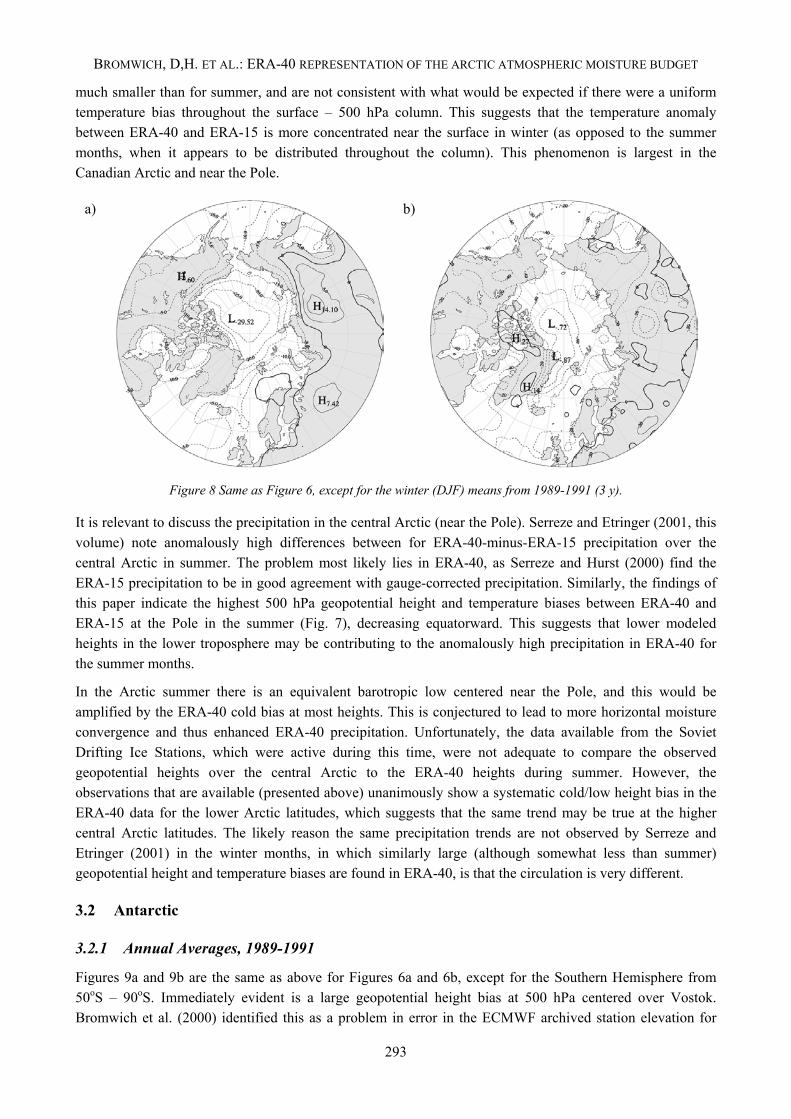
In the winter months, the results are somewhat different. While the geopotential height anomalies (Fig. 8a) are similar in magnitude to those observed in the summer months, the temperature anomalies (Fig. 8b) are
292
BROMWICH, D,H. ET AL.: ERA-40 REPRESENTATION OF THE ARCTIC ATMOSPHERIC MOISTURE BUDGET
much smaller than for summer, and are not consistent with what would be expected if there were a uniform temperature bias throughout the surface – 500 hPa column. This suggests that the temperature anomaly between ERA-40 and ERA-15 is more concentrated near the surface in winter (as opposed to the summer months, when it appears to be distributed throughout the column). This phenomenon is largest in the Canadian Arctic and near the Pole.
a)
b)
Figure 8 Same as Figure 6, except for the winter (DJF) means from 1989-1991 (3 y).
It is relevant to discuss the precipitation in the central Arctic (near the Pole). Serreze and Etringer (2001, this volume) note anomalously high differences between for ERA-40-minus-ERA-15 precipitation over the central Arctic in summer. The problem most likely lies in ERA-40, as Serreze and Hurst (2000) find the ERA-15 precipitation to be in good agreement with gauge-corrected precipitation. Similarly, the findings of this paper indicate the highest 500 hPa geopotential height and temperature biases between ERA-40 and ERA-15 at the Pole in the summer (Fig. 7), decreasing equatorward. This suggests that lower modeled heights in the lower troposphere may be contributing to the anomalously high precipitation in ERA-40 for the summer months.
In the Arctic summer there is an equivalent barotropic low centered near the Pole, and this would be amplified by the ERA-40 cold bias at most heights. This is conjectured to lead to more horizontal moisture convergence and thus enhanced ERA-40 precipitation. Unfortunately, the data available from the Soviet Drifting Ice Stations, which were active during this time, were not adequate to compare the observed geopotential heights over the central Arctic to the ERA-40 heights during summer. However, the observations that are available (presented above) unanimously show a systematic cold/low height bias in the ERA-40 data for the lower Arctic latitudes, which suggests that the same trend may be true at the higher central Arctic latitudes. The likely reason the same precipitation trends are not observed by Serreze and Etringer (2001) in the winter months, in which similarly large (although somewhat less than summer) geopotential height and temperature biases are found in ERA-40, is that the circulation is very different.
3.2 Antarctic
3.2.1 Annual Averages, 1989-1991
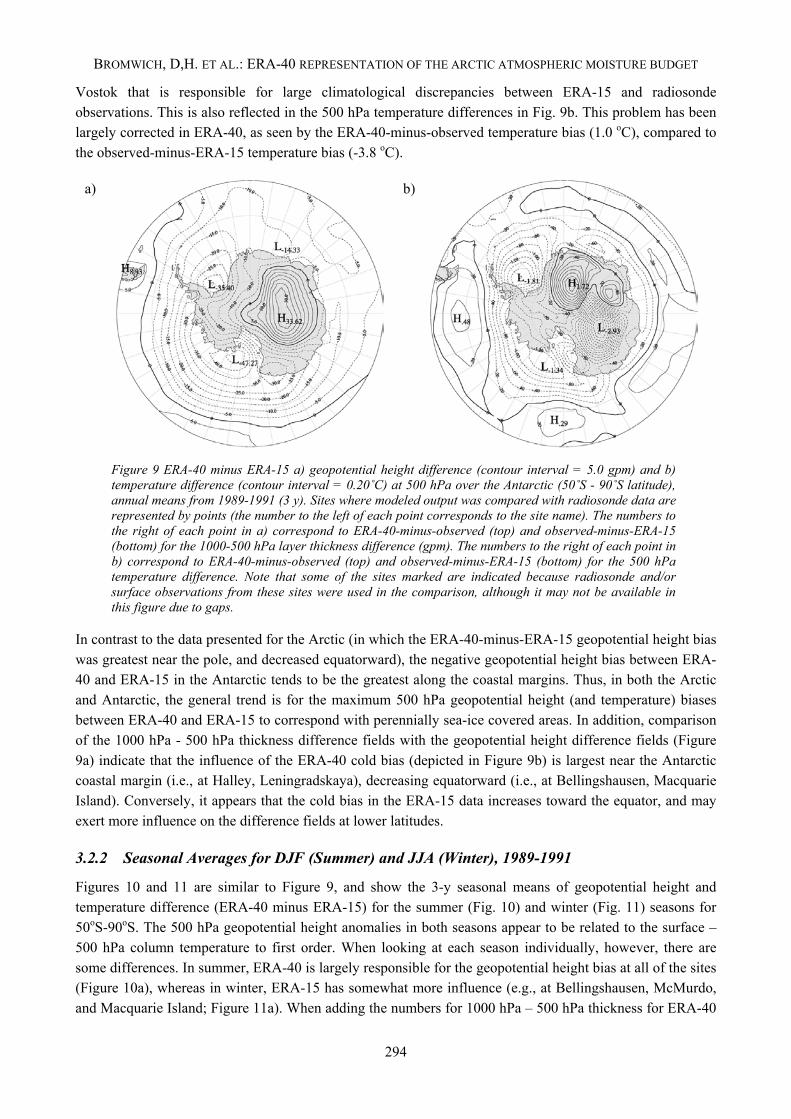
Figures 9a and 9b are the same as above for Figures 6a and 6b, except for the Southern Hemisphere from 50oS – 90oS. Immediately evident is a large geopotential height bias at 500 hPa centered over Vostok. Bromwich et al. (2000) identified this as a problem in error in the ECMWF archived station elevation for
293
BROMWICH, D,H. ET AL.: ERA-40 REPRESENTATION OF THE ARCTIC ATMOSPHERIC MOISTURE BUDGET
Vostok that is responsible for large climatological discrepancies between ERA-15 and radiosonde observations. This is also reflected in the 500 hPa temperature differences in Fig. 9b. This problem has been largely corrected in ERA-40, as seen by the ERA-40-minus-observed temperature bias (1.0 oC), compared to the observed-minus-ERA-15 temperature bias (-3.8 oC).
a)
b)
Figure 9 ERA-40 minus ERA-15 a) geopotential height difference (contour interval = 5.0 gpm) and b) temperature difference (contour interval = 0.20˚C) at 500 hPa over the Antarctic (50˚S - 90˚S latitude), annual means from 1989-1991 (3 y). Sites where modeled output was compared with radiosonde data are represented by points (the number to the left of each point corresponds to the site name). The numbers to the right of each point in a) correspond to ERA-40-minus-observed (top) and observed-minus-ERA-15 (bottom) for the 1000-500 hPa layer thickness difference (gpm). The numbers to the right of each point in b) correspond to ERA-40-minus-observed (top) and observed-minus-ERA-15 (bottom) for the 500 hPa temperature difference. Note that some of the sites marked are indicated because radiosonde and/or surface observations from these sites were used in the comparison, although it may not be available in this figure due to gaps.
In contrast to the data presented for the Arctic (in which the ERA-40-minus-ERA-15 geopotential height bias was greatest near the pole, and decreased equatorward), the negative geopotential height bias between ERA-40 and ERA-15 in the Antarctic tends to be the greatest along the coastal margins. Thus, in both the Arctic and Antarctic, the general trend is for the maximum 500 hPa geopotential height (and temperature) biases between ERA-40 and ERA-15 to correspond with perennially sea-ice covered areas. In addition, comparison of the 1000 hPa - 500 hPa thickness difference fields with the geopotential height difference fields (Figure 9a) indicate that the influence of the ERA-40 cold bias (depicted in Figure 9b) is largest near the Antarctic coastal margin (i.e., at Halley, Leningradskaya), decreasing equatorward (i.e., at Bellingshausen, Macquarie Island). Conversely, it appears that the cold bias in the ERA-15 data increases toward the equator, and may exert more influence on the difference fields at lower latitudes.
3.2.2 Seasonal Averages for DJF (Summer) and JJA (Winter), 1989-1991
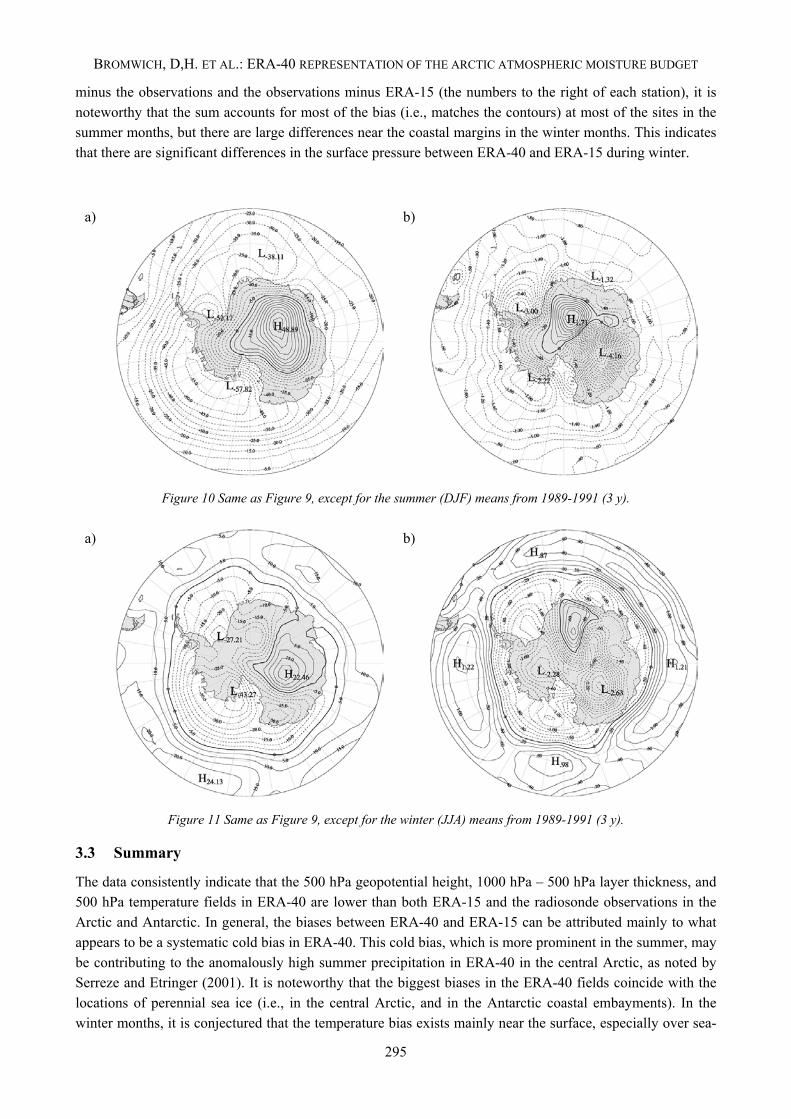
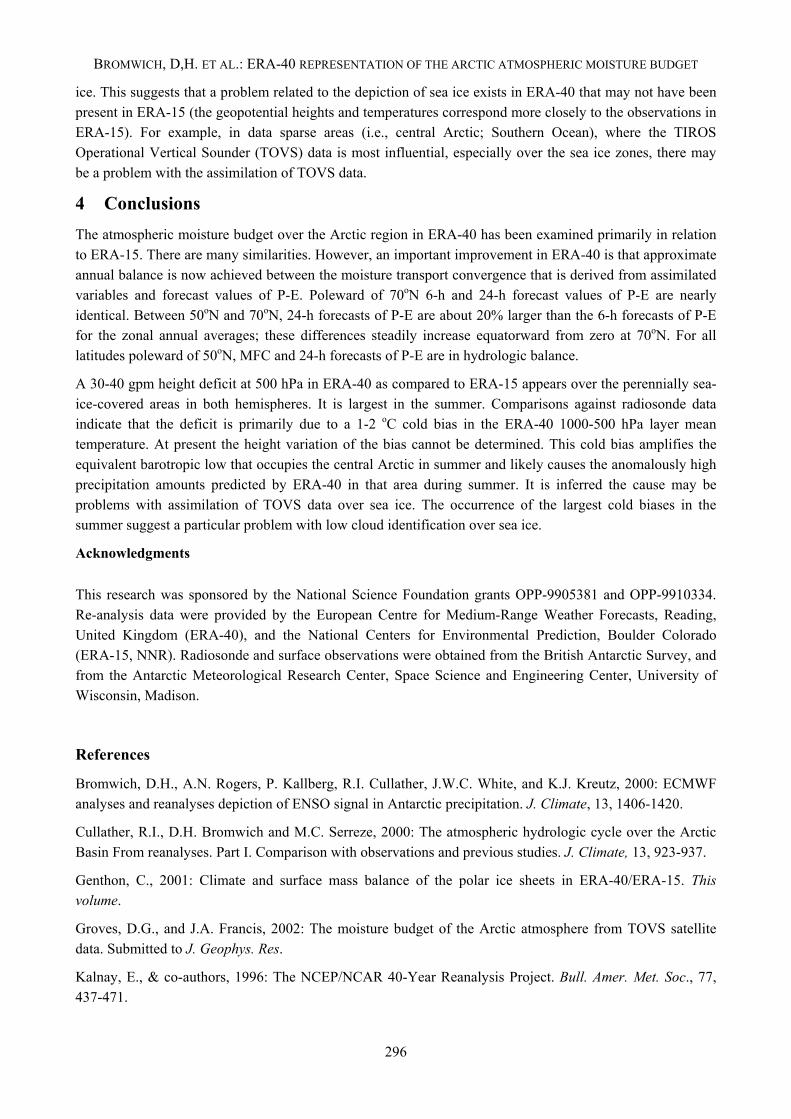
Figures 10 and 11 are similar to Figure 9, and show the 3-y seasonal means of geopotential height and temperature difference (ERA-40 minus ERA-15) for the summer (Fig. 10) and winter (Fig. 11) seasons for 50oS-90oS. The 500 hPa geopotential height anomalies in both seasons appear to be related to the surface – 500 hPa column temperature to first order. When looking at each season individually, however, there are some differences. In summer, ERA-40 is largely responsible for the geopotential height bias at all of the sites (Figure 10a), whereas in winter, ERA-15 has somewhat more influence (e.g., at Bellingshausen, McMurdo, and Macquarie Island; Figure 11a). When adding the numbers for 1000 hPa – 500 hPa thickness for ERA-40
294
BROMWICH, D,H. ET AL.: ERA-40 REPRESENTATION OF THE ARCTIC ATMOSPHERIC MOISTURE BUDGET
minus the observations and the observations minus ERA-15 (the numbers to the right of each station), it is noteworthy that the sum accounts for most of the bias (i.e., matches the contours) at most of the sites in the summer months, but there are large differences near the coastal margins in the winter months. This indicates that there are significant differences in the surface pressure between ERA-40 and ERA-15 during winter.
a)
b)
Figure 10 Same as Figure 9, except for the summer (DJF) means from 1989-1991 (3 y).
a)
b)
Figure 11 Same as Figure 9, except for the winter (JJA) means from 1989-1991 (3 y).
3.3 Summary
The data consistently indicate that the 500 hPa geopotential height, 1000 hPa – 500 hPa layer thickness, and 500 hPa temperature fields in ERA-40 are lower than both ERA-15 and the radiosonde observations in the Arctic and Antarctic. In general, the biases between ERA-40 and ERA-15 can be attributed mainly to what appears to be a systematic cold bias in ERA-40. This cold bias, which is more prominent in the summer, may be contributing to the anomalously high summer precipitation in ERA-40 in the central Arctic, as noted by Serreze and Etringer (2001). It is noteworthy that the biggest biases in the ERA-40 fields coincide with the locations of perennial sea ice (i.e., in the central Arctic, and in the Antarctic coastal embayments). In the winter months, it is conjectured that the temperature bias exists mainly near the surface, especially over sea-
295
BROMWICH, D,H. ET AL.: ERA-40 REPRESENTATION OF THE ARCTIC ATMOSPHERIC MOISTURE BUDGET
ice. This suggests that a problem related to the depiction of sea ice exists in ERA-40 that may not have been present in ERA-15 (the geopotential heights and temperatures correspond more closely to the observations in ERA-15). For example, in data sparse areas (i.e., central Arctic; Southern Ocean), where the TIROS Operational Vertical Sounder (TOVS) data is most influential, especially over the sea ice zones, there may be a problem with the assimilation of TOVS data.
4 Conclusions The atmospheric moisture budget over the Arctic region in ERA-40 has been examined primarily in relation to ERA-15. There are many similarities. However, an important improvement in ERA-40 is that approximate annual balance is now achieved between the moisture transport convergence that is derived from assimilated variables and forecast values of P-E. Poleward of 70oN 6-h and 24-h forecast values of P-E are nearly identical. Between 50oN and 70oN, 24-h forecasts of P-E are about 20% larger than the 6-h forecasts of P-E for the zonal annual averages; these differences steadily increase equatorward from zero at 70oN. For all latitudes poleward of 50oN, MFC and 24-h forecasts of P-E are in hydrologic balance.
A 30-40 gpm height deficit at 500 hPa in ERA-40 as compared to ERA-15 appears over the perennially sea-ice-covered areas in both hemispheres. It is largest in the summer. Comparisons against radiosonde data indicate that the deficit is primarily due to a 1-2 oC cold bias in the ERA-40 1000-500 hPa layer mean temperature. At present the height variation of the bias cannot be determined. This cold bias amplifies the equivalent barotropic low that occupies the central Arctic in summer and likely causes the anomalously high precipitation amounts predicted by ERA-40 in that area during summer. It is inferred the cause may be problems with assimilation of TOVS data over sea ice. The occurrence of the largest cold biases in the summer suggest a particular problem with low cloud identification over sea ice.
Acknowledgments
This research was sponsored by the National Science Foundation grants OPP-9905381 and OPP-9910334. Re-analysis data were provided by the European Centre for Medium-Range Weather Forecasts, Reading, United Kingdom (ERA-40), and the National Centers for Environmental Prediction, Boulder Colorado (ERA-15, NNR). Radiosonde and surface observations were obtained from the British Antarctic Survey, and from the Antarctic Meteorological Research Center, Space Science and Engineering Center, University of Wisconsin, Madison.
References
Bromwich, D.H., A.N. Rogers, P. Kallberg, R.I. Cullather, J.W.C. White, and K.J. Kreutz, 2000: ECMWF analyses and reanalyses depiction of ENSO signal in Antarctic precipitation. J. Climate, 13, 1406-1420.
Cullather, R.I., D.H. Bromwich and M.C. Serreze, 2000: The atmospheric hydrologic cycle over the Arctic Basin From reanalyses. Part I. Comparison with observations and previous studies. J. Climate, 13, 923-937.
Genthon, C., 2001: Climate and surface mass balance of the polar ice sheets in ERA-40/ERA-15. This volume.
Groves, D.G., and J.A. Francis, 2002: The moisture budget of the Arctic atmosphere from TOVS satellite data. Submitted to J. Geophys. Res.
Kalnay, E., & co-authors, 1996: The NCEP/NCAR 40-Year Reanalysis Project. Bull. Amer. Met. Soc., 77, 437-471.
296
BROMWICH, D,H. ET AL.: ERA-40 REPRESENTATION OF THE ARCTIC ATMOSPHERIC MOISTURE BUDGET
Kistler, R., & co-authors, 2001: The NCEP/NCAR 50 year reanalysis: Monthly means CD-ROM and Documentation. Bull. Amer. Meteor. Soc., 82, 247-267.
Serreze, M.C., M.C. Rehder, and R.G. Barry, 1995: The distribution and transport of atmospheric water vapour over the Arctic basin. Int. J. Climatology. 15, 709-727.
Serreze, M.C., and C.M. Hurst, 2000: Representation of mean Arctic precipitation from NCEP/NCAR and ERA reanalyses. J. Climate, 13, 182-201.
Serreze, M.C., and A.J. Etringer, 2001: Representation of Arctic Precipitation in ERA-40. This volume.
Uppala, S., J. K. Gibson, M. Fiorino, A. Hernandez, P. Kallberg, X. Li, K. Onogi, and S. Saarinen, 1999: ECMWF second generation reanalysis: ERA40. 2nd Intl. Conf. on Reanalyses, Reading, England, 23-27 Aug. 1999. World Meteorological Organization, Geneva, Switzerland.
297

298