equity valuation project monday, december 6, 2004mmoore.ba.ttu.edu/valuationreports/coke.pdf ·...
TRANSCRIPT

Equity Valuation Project Monday, December 6, 2004
Finance 3321-002
Group 22
Katie Lewandowski Mike Phillips
Lee Hennington Jason Richardson Matthew Nasche
Table of Contents
I. Executive Summary 3
II. Business and Industry Overview 4
a. Business Overview 4
b. Industry Analysis 5
c. Strengths 6
d. Weaknesses 7
e. Opportunities 7
f. Threats 8
g. Rivalry Among Existing Firms 8
h. Threat of New Entrants 9
i. Threat of Substitute Products 9
j. Bargaining Power of Buyers 10
k. Bargaining Power of Suppliers 11
l. Key Success Factors 11
III. Accounting Analysis 13
a. Sales manipulation Diagnostics 13
b. Core Expense Manipulation Diagnostics 14
c. Key Accounting Policies 15
d. Accounting Flexibility 15
e. Accounting Strategy 16
f. Quality of Disclosure 17
g. Potential Red Flags 18
IV. Ratio Analysis and Forecasting 19
a. Forecast 19
b. Liquidity 22
c. Profitability 25
d. Capital Structure 27
e. Z-Score 29
V. Valuation 31
a. Cost of Equity 31
b. Cost of Debt 32
c. Weighted Average Cost of Capital 32
d. Method of Comparables 33
e. Abnormal Earnings Growth Valuation 33
f. Discounted Dividends Valuation 34
g. Free Cash Flows Valuation 35
h. Residual Income Valuation 36
i. Long Run Residual Income 37
VI. Appendices 38
a. Discounted Dividends Model Sensitivity Analysis 38
b. Free Cash Flows Model Sensitivity Analysis 38
c. Abnormal Earnings Growth Sensitivity Analysis 39
d. Residual Income Sensitivity Analysis 39
e. Long Run Residual Income Sensitivity Analysis 40
f. Discounted Dividends Valuation 41
g. Free Cash Flows Valuation 41
h. Residual Income Valuation 42
i. Method of Comparables Valuation 42
j. Abnormal Earnings Growth Valuation Model 43
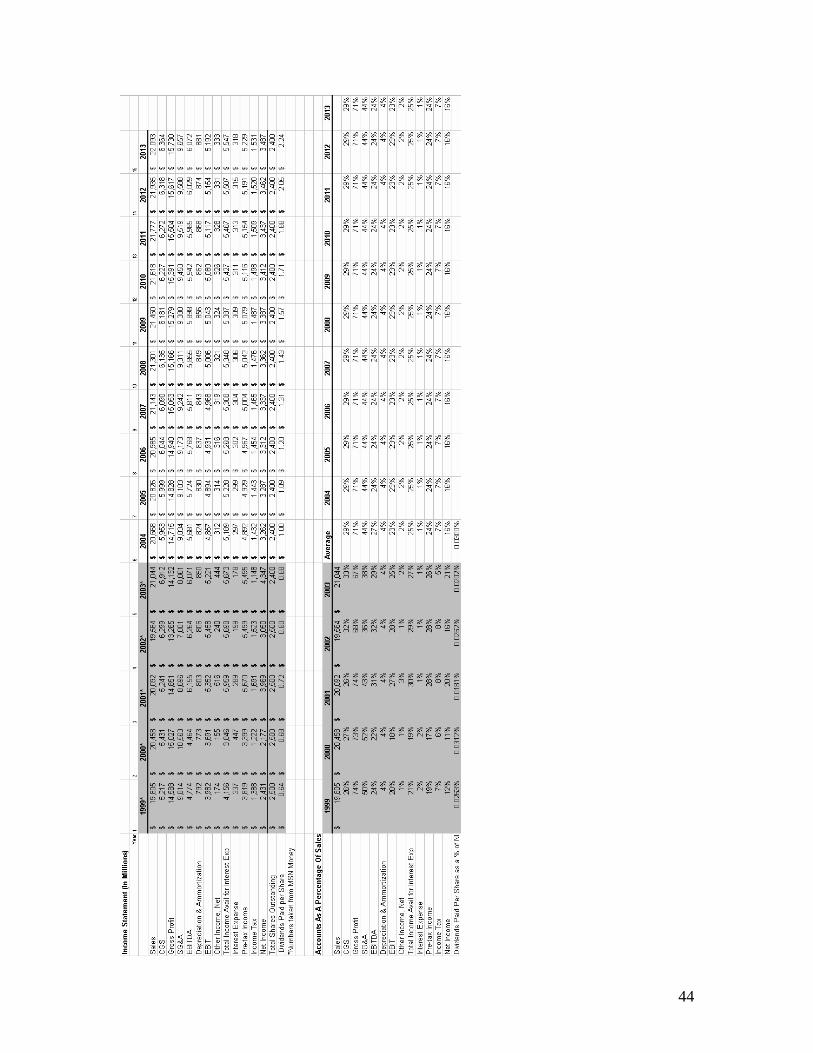
k. Income Statement 44
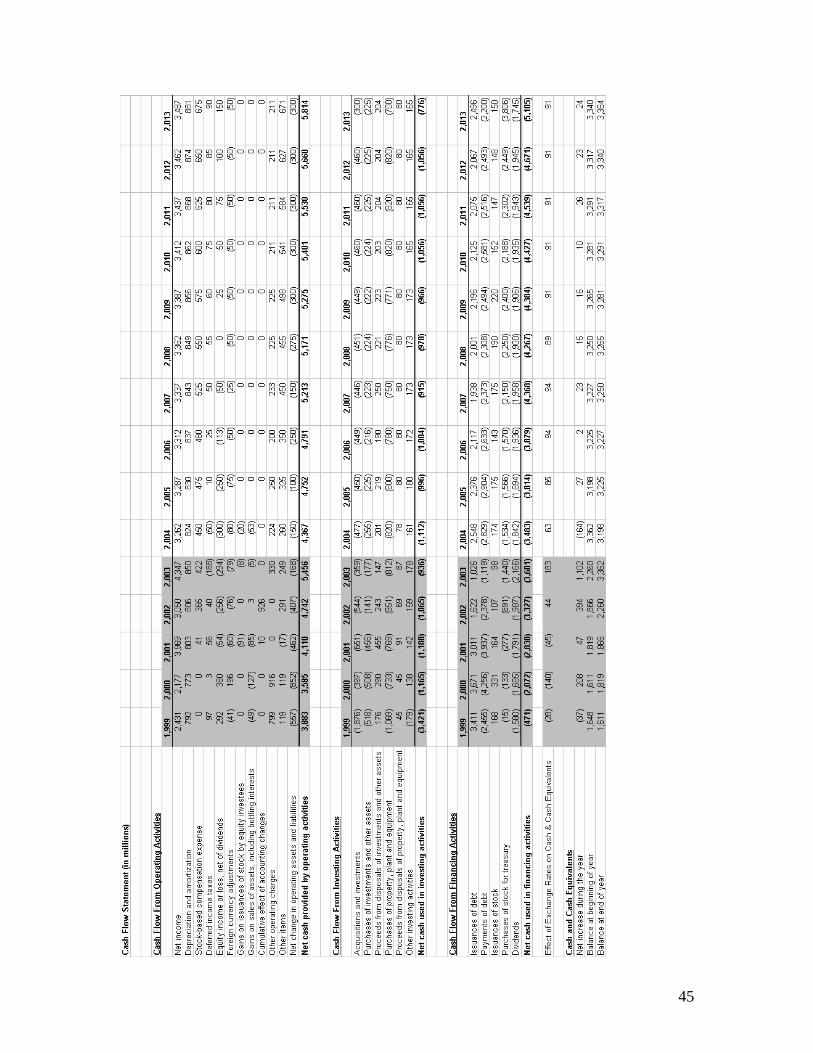
l. Cash Flow Statement 45
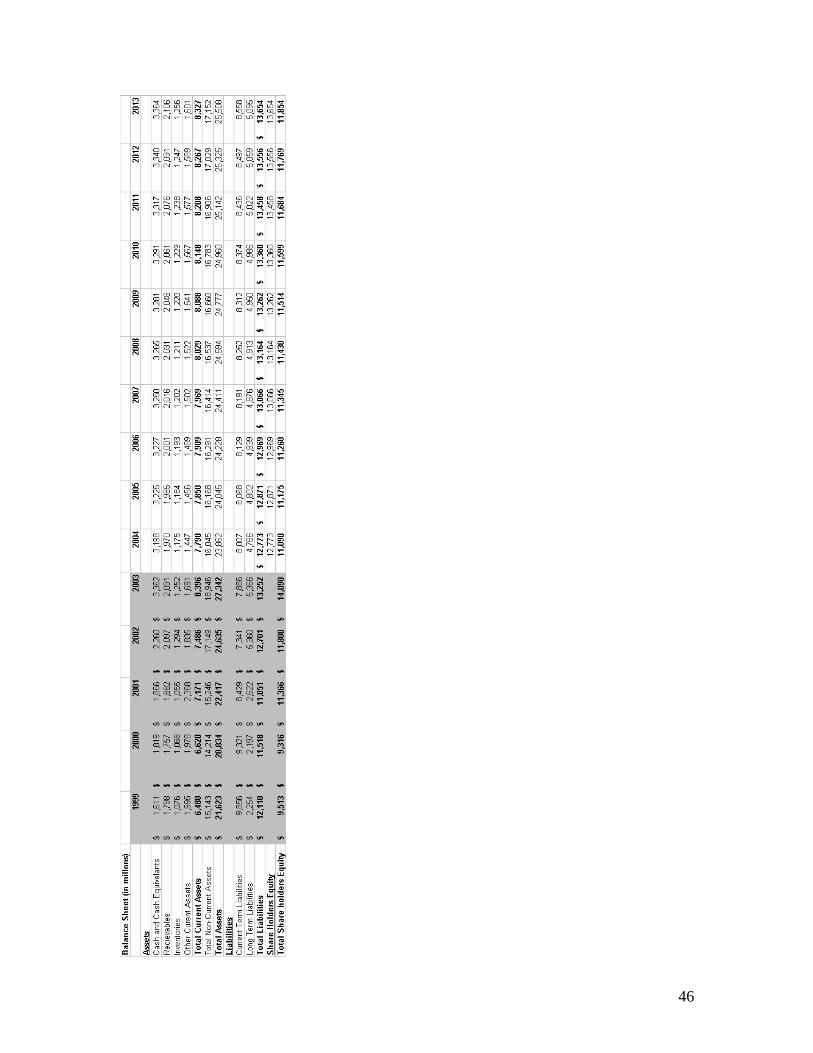
m. Balance Sheet 46
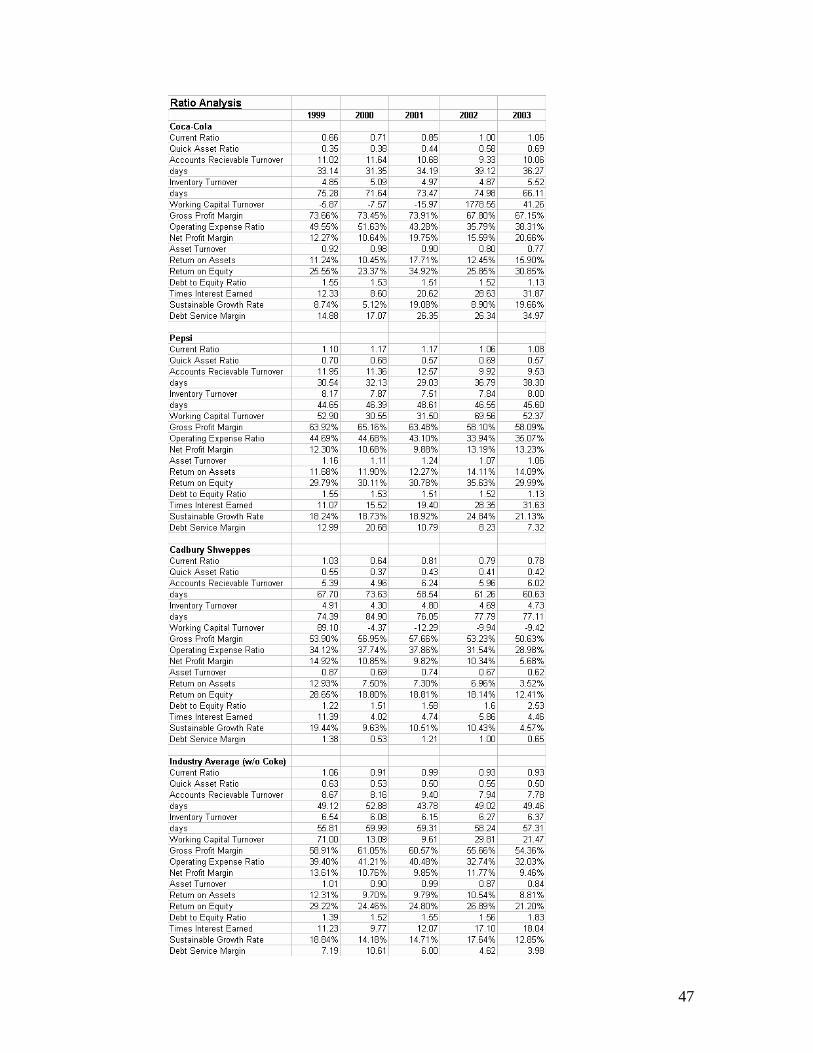
n. Ratio Analysis List 47
VII. References 48
1
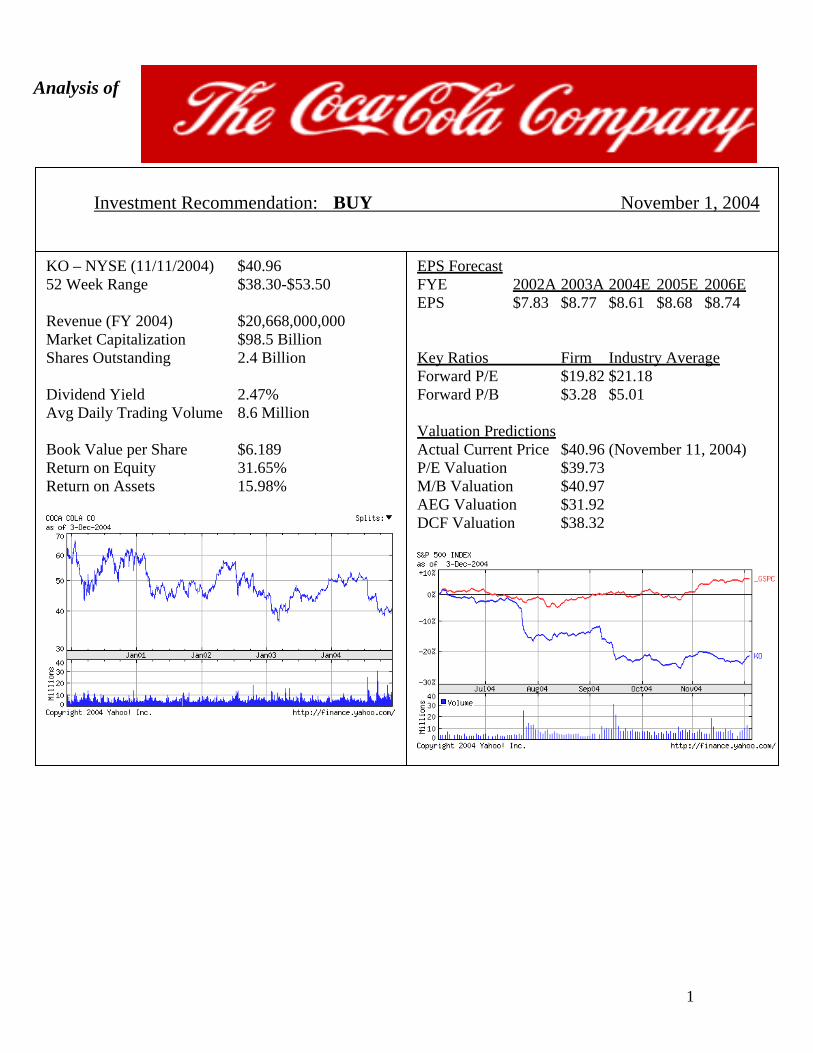
KO – NYSE (11/11/2004) $40.96 52 Week Range $38.30-$53.50 Revenue (FY 2004) $20,668,000,000 Market Capitalization $98.5 Billion Shares Outstanding 2.4 Billion Dividend Yield 2.47% Avg Daily Trading Volume 8.6 Million Book Value per Share $6.189 Return on Equity 31.65% Return on Assets 15.98%
EPS Forecast FYE 2002A 2003A 2004E 2005E 2006E EPS $7.83 $8.77 $8.61 $8.68 $8.74 Key Ratios Firm Industry Average Forward P/E $19.82 $21.18 Forward P/B $3.28 $5.01 Valuation Predictions Actual Current Price $40.96 (November 11, 2004) P/E Valuation $39.73 M/B Valuation $40.97 AEG Valuation $31.92 DCF Valuation $38.32
Investment Recommendation: BUY November 1, 2004
Analysis of
2
Executive Summary
Begun in an Atlanta residency, Coca-Cola has become one of the largest
manufacturers of soda in the world. They are currently a nationally recognized brand
name. Over the years, the company and their product have continually evolved to adapt
to the changing interests of the public. Coca-Cola’s competition includes PepsiCo and
Cadbury Schweppes. PepsiCo has proven to pose the greatest threat by picking up some
of Coca-Cola’s lagging market share this year.
In order for Coca-Cola to continue to thrive in the market there are three key
value drivers that must be addressed: profitable growth, cost management and efficient
capital structure. In order to remain profitable marketing and innovation are important
aspects for the company to focus on. Cost management focus is directed towards
lowering supply chain costs especially in foreign markets. Coca-Cola is already efficient
in that they have a strong competitive advantage but they hope to improve by decreasing
general and administrative costs in the future. Their largest weakness is their failure to
follow their competition’s lead in the non-beverage market where PepsiCo has gained
profit and market share.
Pepsi and Coke share much of the world market at 31.8% and 44% respectively.
Each brand tries to differentiate itself to gain and maintain loyal customers. Because
Coca-Cola only has two main competitors, price premiums are not a main focus of the
company. They instead focus on marketing, innovation and name brand image.
In order to analyze Coca-Cola, PepsiCo, and Cadbury Schweppes were used as
benchmarks for where the company stands in the industry. In looking at the firm’s past
performance in terms of liquidity, profitability and capital structure it was evident that
Coca-Cola is stronger than the industry. Coca-Cola’s liquidity was poor for the past five
years but held its own relative to the industry. The profitability of Coca-Cola outweighed
its competition while its measure of efficiency is currently far less than PepsiCo. Overall
the capital structure is well balanced. There have been many changes in the industry over
the past five years including the effects of September 11 and Coca-Cola appointing a new
CEO. After the initial adjustment period, the firm should be able to continue to improve
to more stable liquidity and increased stability.
3
Once the past reports were analyzed we were able to forecast the financial
statements for the next ten years. While sorting through financial statements it became
evident that the publicly available information was muddled and very condensed. The
difficulty ensued while trying to sort through the financial statements and raised
questions concerning the companies withholding of information. If they do not make
information easily accessible to the public we question whether they are trying to hide
certain valuable information. None the less, we were able to make assumptions and
derive the balance sheet from the forecasted income statement and the cash flows from
each of the aforementioned statements.
With the forecasted information, we were able to calculate a value for the firm
using the residual income method, the method of comparables, the abnormal earnings
growth method, the discounted dividends model and the free cash flow method. This was
done using the CAPM and the weighted average cost of capital each of which were
figured using a calculated beta and a published beta. After valuing the company using
each of the methods and comparing it to the price per share that Coca-Cola currently
trades for on the stock market, we felt that the price per share is currently understated
assuming that no more than 2% growth was attainable which we felt was fairly low
compared to past and potential growth. Coca-Cola’s stocks should be bought at this time.

4
Business and Industry Overview
Business Overview
Coca-cola has been around since 1886 when Dr. John Pemberton invented the
patented formula. In the beginning, the Atlanta pharmacist sold approximately nine
glasses of coca-cola a day for five cents per glass. Although he had a brilliant invention,
Pemberton lacked in marketing skills and soon sold the company for $2300 to Asa Griggs
Candler, who would become the company’s first president. Candler, whose vision was
much broader than Pemberton’s, had plants in Chicago, Dallas, and Los Angeles by
1895. Candler’s vision did not however run as far as bottling the popular drink and he
sold the bottling rights to two Chattanooga lawyers named Benjamin F. Thomas and
Joseph B. Whitehead for $1.
Early on, Coca-cola felt the pressure from their competition. In order to combat
the competition, they tried push their originality and produced their trademark contour
bottle (seen below) in 1915 which they pointed out could be recognized in the dark.
Their advertising ran towards slogans such as “Demand the genuine” and “accept no
substitute.” (2) Through it all, the Coca-Cola Company continued to grow. Between 1900
and 1920, they grew from two bottlers to 1,000, and in 1919, they came up with the
innovative 6-pack which made the product more mobile. In 1941 during WWII the
mobility increased when Woodruff, the president of their company, promised troops 5-
cent cokes wherever in the world they were which helped jump-start the foreign market.
In 1961, their growth continued when they introduced the new product Sprite.
Soon new flavors such as TAB and Fresca followed. Then in 1985 they released a new
Coca-Cola taste. This was the first change in formation in 99 years. While taste testers
loved it, the new Coca-Cola did not catch on with the public. The original formula was
returned under the name of Coca-Cola Classic. Today you can find over 20 flavors of

5
carbonated beverages as well as bottled water and juices all produced by the Coca-Cola
Company.
The Coca-Cola Company has been involved with the Olympic games almost from
the beginning. In the 90’s the market grew with endorsements in the FIFA World Cup
Football, Rugby World Cup and the National Basketball Association as well as becoming
the Official Soft Drink of NASCAR racing. In 1993 their advertising introduced
“Always Coca-Cola” and the adorable Coca-Cola polar bear as well as endorsing new
beverages including Powerade sports drink and Dasani bottled water. In 1997 $1 billion
servings of Coca-Cola beverages were sold daily, a big step from nine glasses per day.
Today, “The Coca-Cola Company is the largest manufacturer, distributor and marketer of
nonalcoholic beverage concentrates and syrups in the world.” Coca-Cola products are
now among the leading products in most of the more than 200 countries where they are
sold. (2)
Industry Analysis
The carbonated soft drink industry has been expanding steadily for many years,
but has begun to slow recently. As a result of this slow market growth, competition to
create new products and expand in to new markets has become fierce. Various
acquisitions and mergers have led to the industry being dominated by three giants who
together hold over 90% of the market (3), Coca-Cola, Pepsi, and Cadbury Schweppes.
Pepsi is by far Coca-
Cola’s largest competitor.
They have found great
success by expanding in to
the snack market, selling all
kinds of sweet and salty
snacks under its Frito Lay
brand. Coca-Cola has
Carbonated Soft Drink Sales VolumeAccording to Beverage-Digest.com
880090009200940096009800
100001020010400
1996
1997
1998
1999
2000
2001
2002
2003
In Millions ofCases
6
neglected this market, which could be one of the reasons that while Coke’s sales have
been slumping lately, Pepsi has shown net sales increases and has been picking up
valuable market share dropped by Coke this year.
Cadbury Schweppes boasts such brands as Dr. Pepper, 7up, A&W, Country Time,
and Hawaiian Punch. While this smaller company is not a great force in the industry as of
yet, it seems to have done well in recent years, showing revenues just under 12 billion
last year (3). If Cadbury Schweppes continues to grow in to new international markets, it
could pose a threat to Coca-Cola.
Strengths
Coca-Cola believes that in order to achieve effective execution within their
company, focus needs to be aimed towards three key value drivers: profitable growth;
cost management; and efficient capital structure. In attaining profitable growth, Coca-
Cola continues to broaden its family of brands across markets, with support from
marketing and innovation. One thing that the company is trying to do to manage
expansion and growth is to shift their attention from a “volume only” focus to a “volume
and value” focus. This strategy helps to put more of an emphasis on gross profit and
profit before taxes instead of emphasis only on volume.
In order to satisfy cost management, Coca-Cola continues to emphasize supply
chain initiatives. System economics can be improved by lowering supply chain costs.
Over the past year, Coca-Cola has established supply chain management companies in
North America, Japan, and China to increase procurement efficiencies and to centralize
production and logistics operations.
Coca-Cola maintains an efficient capital structure intended to optimize their cost
of capital. The company believes that they are provided a competitive advantage through
access to key financial markets, ability to raise funds at a low cost, and low cost of
borrowing. Over time, Coca-Cola wishes to reduce cost by decreasing general and
administrative costs as a percentage of net operating revenues. (5)
7
Weaknesses
One particular weakness for Coca-Cola Company includes the lack of non-
beverage products. Many of their competitors compete in both the food and beverage
industry. Coca-Cola, accordingly, suffers a miss on potential earnings in this area. Other
weaknesses of this company include the high level of competition and power of
consumers. Coca-Cola is constantly competing with PepsiCo for the number one
beverage in the nation. They must always keep the demand of consumers in mind since
consumers ultimately determine the company’s prosperity. Also, it is important to notice
that while Coca-Cola has suppliers and bottlers in many countries, they only own a
majority of them. By not owning all of these companies, they lose a small portion of
profit that they must give to the owners of the companies. (1)
Opportunities
The Coca-Cola Company is very active in developing new and innovative
products to satisfy the ever changing desires of its customers. In fulfilling these needs,
there are always new ways to improve current product lines and make use of new
technologies. Recently, The Coca-Cola Company has come out with several new
products which follow the current trend of Americans being very carbohydrate
conscience in what they consume. Products such as the new Coke C2, (released July
2004) (2) are becoming very popular here in the United States. This product is unique in
that it filled a consumer need that was previously unsatisfied. There seems to be no
reason why this same type of product could not be carried over into the company’s other
product lines such as the Vanilla and Cherry Coke flavors. The Coca-Cola Company also
recently released PowerAde Flava23, which became the first sports drink flavor created
by a superstar athlete (2). This can possibly open the door to an entire line of superstar
affiliated flavors. The Coca-Cola Company has also embraced the epidemic of obesity in
America by helping get the message out to exercise more through their website, which
provides useful information on health issues and leading an active lifestyle. Coca-Cola,
like its competitor PepsiCo, has aligned itself with certain fast food chains such as
8
McDonalds and Wendy’s as their supplier of fountain beverages. This sector of the soft
drink industry appears to be the one with the most potential for new growth, as
companies can be convinced to switch suppliers through incentive-filled contracts.
Threats
The main threat in the industry is that of new substitute products and mergers.
The one company that has the capacity to do this is their main competitor in PepsiCo,
which rivals Coca-Cola in many aspects of the industry. PepsiCo is trying to become
known as the product that is more in touch with the different groups that consume its
products. This can be seen with the recent release of products such as Pepsi Edge, which
is in direct competition to Coke C2, and the already established Mountain Dew and
Mountain Dew Code Red, which are targeted at the extreme sports trend sweeping
America. There is also not too much of a threat of competition in the marketplace, since
both companies know that an all out price war would likely be disastrous to everyone
involved. New regulations are also not very likely, as this is a stable industry and has
been for many years. (1)
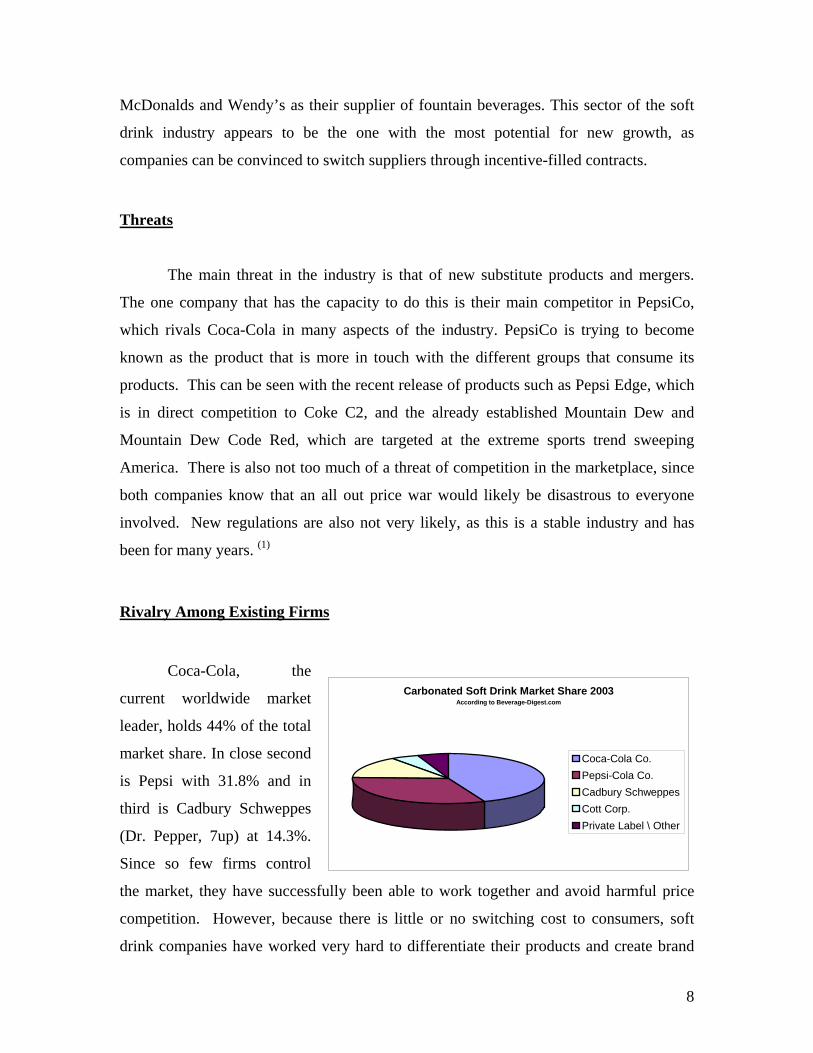
Rivalry Among Existing Firms
Coca-Cola, the
current worldwide market
leader, holds 44% of the total
market share. In close second
is Pepsi with 31.8% and in
third is Cadbury Schweppes
(Dr. Pepper, 7up) at 14.3%.
Since so few firms control
the market, they have successfully been able to work together and avoid harmful price
competition. However, because there is little or no switching cost to consumers, soft
drink companies have worked very hard to differentiate their products and create brand
Carbonated Soft Drink Market Share 2003According to Beverage-Digest.com
Coca-Cola Co.Pepsi-Cola Co.Cadbury SchweppesCott Corp.Private Label \ Other
9
awareness with consumers. They have also expanded into non-carbonated drinks and
experimented with new flavors.
Each company has had success with their diet brands, varied success with
flavored sodas (Cherry Coke, Vanilla Coke, Pepsi Twist), and most recently
disappointing results from their low carb brands (C2, Pepsi Edge). Pepsi has had great
success with its Gatorade brand which accounts for 73% of the sports drink market.
When combined with their Lipton and Tropicana brands, they are number one in the non-
carbonated beverage area and cokes biggest threat. Coke is also competing in these areas
with its Powerade, Minute Maid, and Nestea brands while Cadbury Schweppes has
recently purchased Snapple. The fastest growing segment right now is the 10 billion
dollar a year bottled water market, which Coca-Cola has moved in to with its Dasani
brand. (3)
Threat of New Entrants
There is little threat to Coca-Cola from new entrants. Any start up company
would require an enormous amount of capital to try and match the large beverage
companies’ advertising expenditures and efficient distribution. Even if a company could
raise enough capital they would find themselves at a serious cost disadvantage to the big
three. In the past, Coca-Cola and Pepsi have purchased most soft drink companies that
have shown potential for growth, effectively eliminating potential threats.
Threat of Substitute Products
In any industry, one of the big competitive threats is that of new products being
introduced into the market that could substitute for the original product that the company
offers. Some of the key factors with substitute products include relative price and
performance and a buyer’s willingness to switch products. One new phenomenon that
has recently caused a challenge in the substitution category is the Atkins diet craze. The
diet promotes losing weight by cutting carbohydrates among other things. This poses a
10
dilemma for the Coca-Cola team in that their predominate beverages are high in fructose
and contain many “bad carbs”. To combat this threat, Coca-Cola has begun producing
and selling a new substitute of their own. The new product, C2, has lower sugar content
and lower carbohydrate count then the original Coca-Cola. It is interesting to consider
that the Coca-Cola Company actually competes with itself by providing substitutions for
many of its original beverages.
There are many other substitute products currently on the market. The
nonalcoholic beverage industry is highly competitive with competitive products including
carbonates, packaged water, juices and nectars, fruit drinks, sports and energy drinks,
coffee and tea. Each of these substitute products are produced to perform the same
function of giving the customer an enjoyable tasting beverage while satisfying the
customer’s thirst. Their largest competitor, PepsiCo, sells a similar product for a
comparable price. These two companies together are able to offer a price premium when
compared to generic brands of similar beverage products because of their name brand
power. Coca-Cola is recognized worldwide thanks to their marketing and advertising
efforts. However, when you compare Coca-Cola to PepsiCo, the products, competition,
and name power are very similar. While most customers of Coca-Cola have a preference
due to the different tastes, these customers may be willing to switch products if there was
a sizable price difference between Coca-Cola and PepsiCo. So although Coca-Cola is the
largest selling non-alcoholic beverage, it has fierce enough competition from substitute
products to be a factor in pricing and continued effort to be innovative and provide the
quality that customers have come to expect.
Bargaining Power of Buyers
Coca-Cola is the industry leader in the nonalcoholic beverage market. Due to the
large size of orders and the ease in which coke can switch to another supplier for its raw
materials, Coca-Cola has a considerable amount of buying power. Buyers are more cost
conscious when the products they buy are undifferentiated. This would be the case with
Coca-Cola when buying raw materials. They will buy from the supplier with the lowest
11
price. If the company wants a lower price than they are offered, they can bargain for a
better price. The supplier may give them a better deal than they would for a smaller
company. The supplier will have to consider its opportunity cost, the cost of not doing
business with Coca-Cola.
Bargaining Power of Suppliers
Because of the large number of bottlers relative to soft drink companies, Coca-
Cola as a supplier has significant power over the bottlers. Three major competitors, Coca-
Cola, Pepsi, and Cadbury Schweppes, control the nonalcoholic beverage market. Since
there are only a few companies the bottlers can buy from, the soft drink companies have
the power. Coca-Cola supplies directly to some restaurants and other businesses. They
have some power over these customers because they generally have contracts they would
have to break to switch products.
Key Success Factors
Overall the soft drink industry strategy is one of differentiation instead of cost
leadership. This means soft drink companies must spend millions of dollars a year to
build brand awareness through advertising. The ability to successfully market a soft drink
is the main key success factors in the industry
The ability to generate a recognizable brand is something Coke has been able to
do very effectively. Theirs is one of the most widely recognized brands, worldwide in any
industry. This is why they are the number one soft drink company in the world. Another
key success factor in the soft drink is the ability to produce new brands and flavors that
taste good and are accepted by the public. This is one area where Coke has occasionally
stumbled. “New Coke” and C2 were rejected by consumers and resulted in a loss for the
company.
12
In conclusion, the Coca-Cola Company exists to benefit and satisfy everyone that
its products come into contact with. The company makes large marketing expenditures in
areas such as advertising, sponsorship, and promotion in support of its brands. These
costs are extended to increase brand awareness and consumer preference to promote
long-term growth and obtain a healthy share of worldwide nonalcoholic beverage shares.
Coca-Cola continues to keep its focus on quality in the marketplace, a strong working
environment, and most importantly value to its consumers. It is upon this focus and
foundation that Coca-Cola has retained its position as one of the most recognized and
successful companies around the world.
13
Accounting Analysis
Sales Manipulation Diagnostics
To assess the quality of Coca-Cola’s financial disclosures with respect to sales,
we have figured three diagnostic ratios. The first is the Net Sales / Cash From Sales. This
ratio shows how much cash was recorded in relation to total sales. Ideally a company
would want this number to equal one. This would mean that all sales were paid for
entirely in cash, and no need to account for bad debt. Coca-Cola’s Net Sales / Cash From
Sales ratio has gone down steadily from 5.706 in 2000 to 3.857 in 2003. This is a positive
trend for Coca-Cola.
The second diagnostic ration we did for Coca-Cola was Net Sales / Net Accounts
Receivable. This ratio shows how much of Coca-Cola’s sales where on account. A high
number here means fewer bad debts and more money in our pockets now. Logic would
suggest that the higher the percentage of sales paid for in cash, the less the percentage of
sales would go in to accounts receivable. It is for this reason that we found it strange that
according to the results of our diagnostic ratios, Coke is showing an increase in cash from
sales and sales on account in relation to net sales. We see this as a potential red flag
marking possible manipulations in accounts receivable.
The third ratio we performed was the Net Sales / Inventory Ratio. This ratio
shows how much inventory a company is holding in relation to net sales. The higher the
number the less inventory a company is holding which indicates efficiency. This number
seems to be decreasing for Coca-Cola which could indicate problems. Growing
inventories can be a sign of over anticipated sales.

14
Sales Manipulation Diagnostics
0.000
5.000
10.000
15.000
20.000
25.000
1999 2000 2001 2002 2003
Net Sales / Cash FromSalesNet Sales / NetAccounts RecievableNet Sales / Inventory
Core Expense Manipulation Diagnostics
To look for possible manipulations to Coca-Cola’s reported expenses, we have
performed three diagnostic ratios. They are Declining Asset Turnover ratio
(Sales/Assets), Cash Flow From
Operating Activities/Operating
Income, and Pension Expense over
SG&A. The Declining Asset
Turnover shows how assets are
growing in relation to sales. Over
the last five years, Coca-Cola’s Declining Asset Turnover has decreased steadily meaning
that their assets are growing more rapidly than their sales are increasing. This could
represent slowing sales or large asset acquisitions, but doesn’t seem to be indicative of
any accounting manipulations.
The second diagnostic test we performed was CFFO/OI. The numbers from this
calculation show that each year,
CFFO/OI is about one. This is
generally where a company would
want this ratio since these numbers
indicate that its operating income
is mostly cash and not credit.
The third diagnostic we
performed was Pension Expense / SG&A. This ratio shows what percentage of SG&A is
pension expense. Coca-Cola’s
pension expense was .7% in 2001
and rose steadily to 1.5% in 2003.
According to the Coca-Cola web
site, pension expense is on the rise
due to unforeseen lay-offs as a
15
result of company wide streamlining and restructuring. They estimate that this trend will
continue through 2004. Over all we don’t see any reasons to suspect expense
manipulations in the results of our diagnostics.
Key Accounting Policies
The Coca-Company is a manufacturing company that relies heavily upon
trademarks, goodwill, and research and development which helps to keep the company
innovative and above the competition in terms of sales. Therefore their key accounting
policies will be most readily descriptive in these key areas. By examining how the
company accounts for these things, we are able to best analyze their accounting strategy
and find where distortions and problems may occur. “[Their] financial statements are
prepared in accordance with accounting principles generally accepted in the United
States,” as reported in their annual 10-K reports. They amortize trademarks over their
useful lives. Those trademarks or goodwill without definite lives are not amortized and
are reevaluated annually for impairment. Another area of importance to the finances of
the Coca-Cola Company includes investments in other companies, many of which are
bottling companies. In the companies that they have considerable control over, they use
the equity method. In those companies that Coca-Cola does not control, they use the cost
method. Some of the policies which Coca-Cola reports includes, “advancing payments to
fund future marketing activities.”
Accounting Flexibility
There are areas in which the Coca-Cola Company has flexibility and control over
reporting. Some of these areas of flexibility are inherent based on their tendency to
change with the market such as fair market value. Coca-Cola must decide whether to
“write-down” an asset when it’s fair value drops below its carrying value. Estimates are
required in many areas including company holdings which are not traded publicly. For
these assets, they are required to determine fair value “based on valuation methodologies
including discounted cash flows, estimates of sales proceeds and external appraisals, as

16
appropriate.” Pension funds are another area of reporting flexibility. Pension liabilities
are estimated and reported as long term liabilities. They are expensed over each year. The
amount that is expensed is based on estimates. These estimates include how long a person
will live after they retire, when an employee will retire and how much they get paid when
they retire. If these estimates are not correct they can cause problems. Low estimates will
overstate net income because the pension expense will be lower than it should be. A low
pension expense will reduce the over all expenses and cause net income to appear higher
than it should be. Over stating the pension expense will result in a lower net income. If
the pension expense is over stated it will increase the total expenses this will make net
income lower than it should be. If net income is understated the taxable income is less
than it should be.
Accounting Strategy
The accounting policies used by Coca-Cola are very comparable to Pepsico, a
similar firm. Their amortization of goodwill and trademarks are based on estimates. One
key in comparing the companies is that they each estimate pension funds in the same
manner. In considering the two companies and their accounting policies, it is important
to note that there is little room for distortions due to the fact that they are so similarly
reported. Therefore, we can conclude that unless both companies are distorting
information unilaterally, Coca-Cola is not manipulating their numbers in these areas of
estimation.
Another key issue to report is that Coca-Cola has changed many of its policies
over the last few years. According to the auditing letter from Ernst & Young, Coca-Cola
changed it’s method of accounting and goodwill along with other intangible assets and
stock-based compensation in 2002. In 2001, there were changes made in their derivative
instruments and hedging activities. Ernst & Young went on to say that these changes
were acceptable in keeping Coca-Cola within industry standards.
In the past, Coca-Cola has been realistic in their estimates and policies in most
areas. They have recently had to increase their pension expenses by $48 million due to
underestimations. We do not feel that this was to overstate assets at any time it is just a
17
result of streamlining and restructuring which resulted in early pension payments to many
employees that they had to let go. This incurs longer pension payments and therefore
greater amounts of money.
One accounting strategy that Coca-Cola uses is hedging and derivatives. These
strategies are not used to distort information and are checked at least quarterly. As stated
on the Coca-Cola web-site, “virtually all of our derivatives are straightforward over-the-
counter instruments with liquid markets.” When the derivative instruments and hedging
activities were changed in 2001 to adhere to SFAS No. 133, there was a reduction in net
income of $10 million after taxes. When they enter into the money markets, they
consider the risk of default to be minimal due to the fact that they enter into investment
grade institutions only.
Overall, Coca-Cola’s accounting strategies are within the industry norms and
raise no questions as to why they use the policies they use. Their strategies make sense
for the type of company that they are and can be justified when changes occur.
Quality of Disclosure
With such a large emphasis on quality and brand-name, Coca-Cola is restricted
from disclosing one of their main strengths in marketing. Disclosure controls and
regulations guard the company, preventing them from including the value of marketing
performance as an asset to the business.
Coca-Cola Company does a good job of disclosing economic consequences by
providing a breakdown of financial statements separating countries with changing
political and economic environments and listing the carrying value of non-current assets.
This allows the investor to observe what percentage of the company could virtually be
affected by political or civil unrest and remove any uncertainty about solidity or stability
of their investment.
Reports have indicated that Coca-Cola has been on an apparent decline in the past
five years, but the company does not indicate to its investors the reason why it has not
been as efficient as in previous years. Instead, the company gives a sugar-coated version
of their recent and expected performance in the letter to its shareholders. The company
18
explains that they are optimistic about the future with focus on certain aspects needing
improvement, but they do not relay to the investor where they are at risk.
Coca-Cola is a firm of many segment and products in many different countries.
The company gives a limited explanation of the carrying value of some of the different
segments. They do not give an accurate breakdown of the individual countries’
performance or the breakdown of the different product lines. This breakdown is
significant in recognizing developing and potentially unstable markets and indicating just
how well each product line is doing.
Potential Red Flags
In performing our accounting analysis we were unable to find any accounting
distortions that we would want to correct for. We did have some problems finding some
of the accounts we would have liked to have used to do further diagnostic testing for sales
and expense manipulations, because of the overly consolidated financial statements
provided in their 10K. This in its self is a potential red flag, but because it is not
quantitative we don’t feel that corrections to the financial statements could be done
accurately. It is our opinion that the accounting decisions made are well within the
bounds of industry standards and the numbers reported are, as far as we could tell, true
and fair.
19
Ratio Analysis And Forecasting
In analyzing Coca-Cola’s financial reports it is important to gather past
information in order to predict what the future of the firm may be. First, we assessed the
firm by using financial ratio analysis. We used ratios to perform a liquidity analysis, a
profitability analysis, and a capital structure analysis. The liquidity ratios are used in
order to determine how liquid a company’s assets are. Liquidity is important in
“evaluating the risk related to a firm’s current liabilities” according to chapter 5 of
Business Analysis and Valuation. If a firm does not possess the assets required to repay
their liabilities, they may be considered an investment risk but, on the other hand if the
ratios are too high, then the company may not be imploring enough debt to reach it’s full
growth potential. The profitability ratios indicate how profitable a company is using its
current business methods. The ROE measures Net Income to Shareholders equity which
is very important to let a shareholder know how efficiently their investment is being
utilized. The ROA can tell “how much profit a company is able to generate for each
dollar of assets invested,” (BA&V). The capital structure ratios are useful in analyzing
investment strategy because it employs the use of debt and interest in computing the
ratios.
In performing an analysis it is important to come up with a benchmark to measure
Coca-Cola by. We therefore, measured Coca-Cola’s two main competitors, Pepsi and
Cadbury Schweppes, for liquidity, profitability, and capital structure using the same
ratios and plotted the results to come up with a comparison. After analyzing the recent
history of Coca-Cola in relation to Pepsi and Cadbury Schweppes, we forecasted Coca-
Cola’s financial statements.
Forecasting
To begin with, we first forecasted sales for the next 10 years. We have some
quarterly data for the year 2004. We used the data from the first two quarters to help
forecast the total for the year. The third quarter data was not available as of December 5,

20
2004. To forecast the next ten years we created a straight line representing Coke’s
upward trend through our existing data set using the following equation:
y = a + bx
Where
y = sales
x = number of years
xbya −=
( )∑∑
−
−= 22 xnx
yxnxyb
Linear Trend Line Sales Forecast Years(X) Sales(Y) X^2 XY X avrg= 3 1 $ 19,805 1 $ 19,805 Yavrg= 20,192.60 2 $ 20,458 4 $ 40,916 3 $ 20,092 9 $ 60,276 4 $ 19,564 16 $ 78,256 5 $ 21,044 25 $ 105,220 Totals 15 $ 100,963 55 $ 304,473 b= 158.40 a= 19,717.40
Sales (in millions)
$18,000$19,000$20,000$21,000$22,000$23,000
1999
2002
2005
2008
2011
Linear Trend(PredictedSales)Actual Sales
21
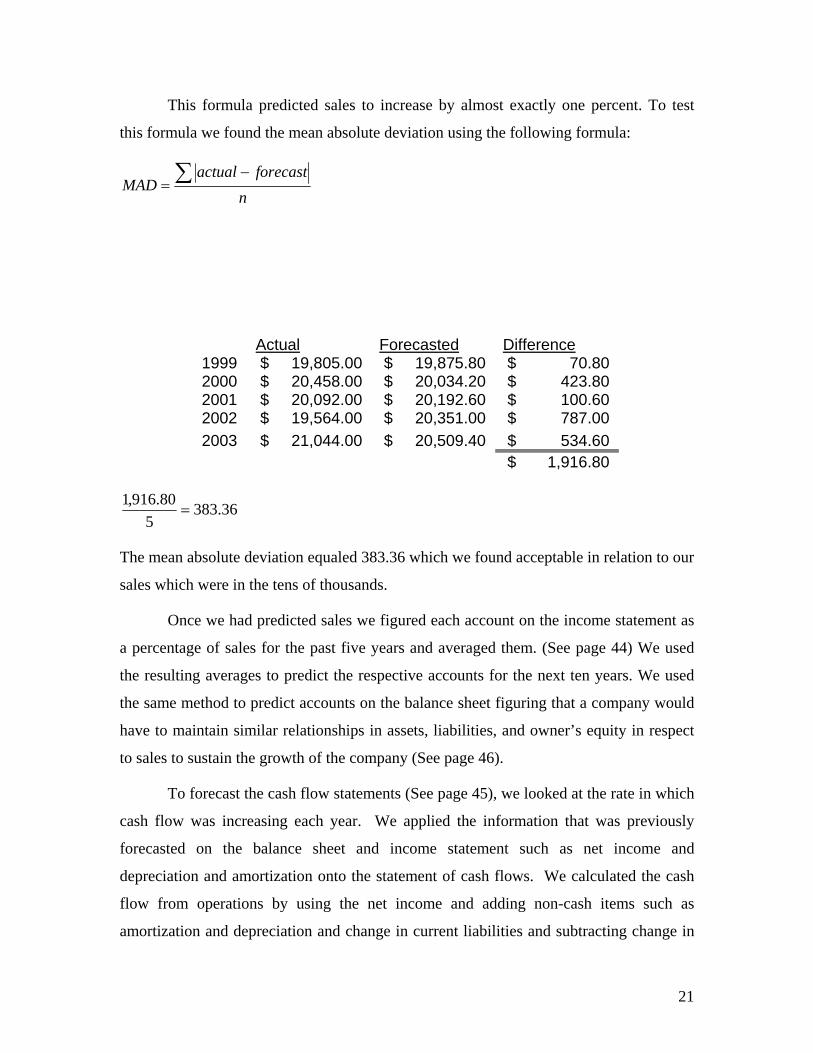
This formula predicted sales to increase by almost exactly one percent. To test
this formula we found the mean absolute deviation using the following formula:
nforecastactual
MAD ∑ −=
36.3835
80.916,1=
The mean absolute deviation equaled 383.36 which we found acceptable in relation to our
sales which were in the tens of thousands.
Once we had predicted sales we figured each account on the income statement as
a percentage of sales for the past five years and averaged them. (See page 44) We used
the resulting averages to predict the respective accounts for the next ten years. We used
the same method to predict accounts on the balance sheet figuring that a company would
have to maintain similar relationships in assets, liabilities, and owner’s equity in respect
to sales to sustain the growth of the company (See page 46).
To forecast the cash flow statements (See page 45), we looked at the rate in which
cash flow was increasing each year. We applied the information that was previously
forecasted on the balance sheet and income statement such as net income and
depreciation and amortization onto the statement of cash flows. We calculated the cash
flow from operations by using the net income and adding non-cash items such as
amortization and depreciation and change in current liabilities and subtracting change in
Actual Forecasted Difference 1999 $ 19,805.00 $ 19,875.80 $ 70.80 2000 $ 20,458.00 $ 20,034.20 $ 423.80 2001 $ 20,092.00 $ 20,192.60 $ 100.60 2002 $ 19,564.00 $ 20,351.00 $ 787.00 2003 $ 21,044.00 $ 20,509.40 $ 534.60 $ 1,916.80
22
non-cash current assets. Cash flow from investing activities has been steadily increasing
but remains negative throughout the past five years. Cash flow from financing activities
has been steadily decreasing and we therefore continued to decrease the cash flows for
future years making sure that the change in cash and cash equivalent from the previous
year equaled the sum of all cash flows.
Liquidity
Liquidity refers to how much of a company’s assets are, or are easily converted to
cash or cash equivalents. A company with out enough liquidity can have trouble paying
its short-term debts or finding enough cash to finance unexpected business opportunities.
The following five ratios evaluate Coca-Cola’s liquidity and compare it to Cadbury
Schweppes, Pepsi, and the industry average.
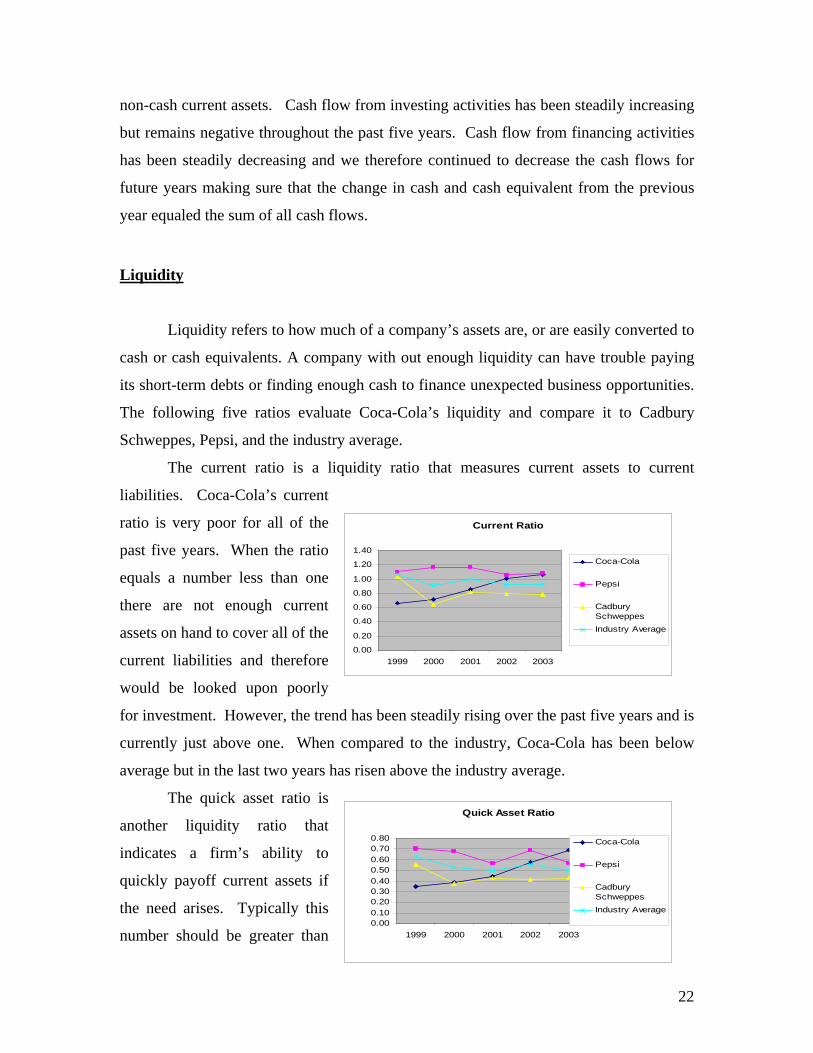
The current ratio is a liquidity ratio that measures current assets to current
liabilities. Coca-Cola’s current
ratio is very poor for all of the
past five years. When the ratio
equals a number less than one
there are not enough current
assets on hand to cover all of the
current liabilities and therefore
would be looked upon poorly
for investment. However, the trend has been steadily rising over the past five years and is
currently just above one. When compared to the industry, Coca-Cola has been below
average but in the last two years has risen above the industry average.
The quick asset ratio is
another liquidity ratio that
indicates a firm’s ability to
quickly payoff current assets if
the need arises. Typically this
number should be greater than
Current Ratio
0.00
0.20
0.40
0.60
0.80
1.00
1.20
1.40
1999 2000 2001 2002 2003
Coca-Cola
Pepsi
CadburySchweppesIndustry Average
Quick Asset Ratio
0.000.100.200.300.400.500.600.700.80
1999 2000 2001 2002 2003
Coca-Cola
Pepsi
CadburySchweppesIndustry Average
23
Inventory Turnover
0.00
1.00
2.00
3.00
4.00
5.00
6.00
7.00
8.00
9.00
1999 2000 2001 2002 2003
Coca-Cola
Pepsi
CadburySchw eppes
Industry Average
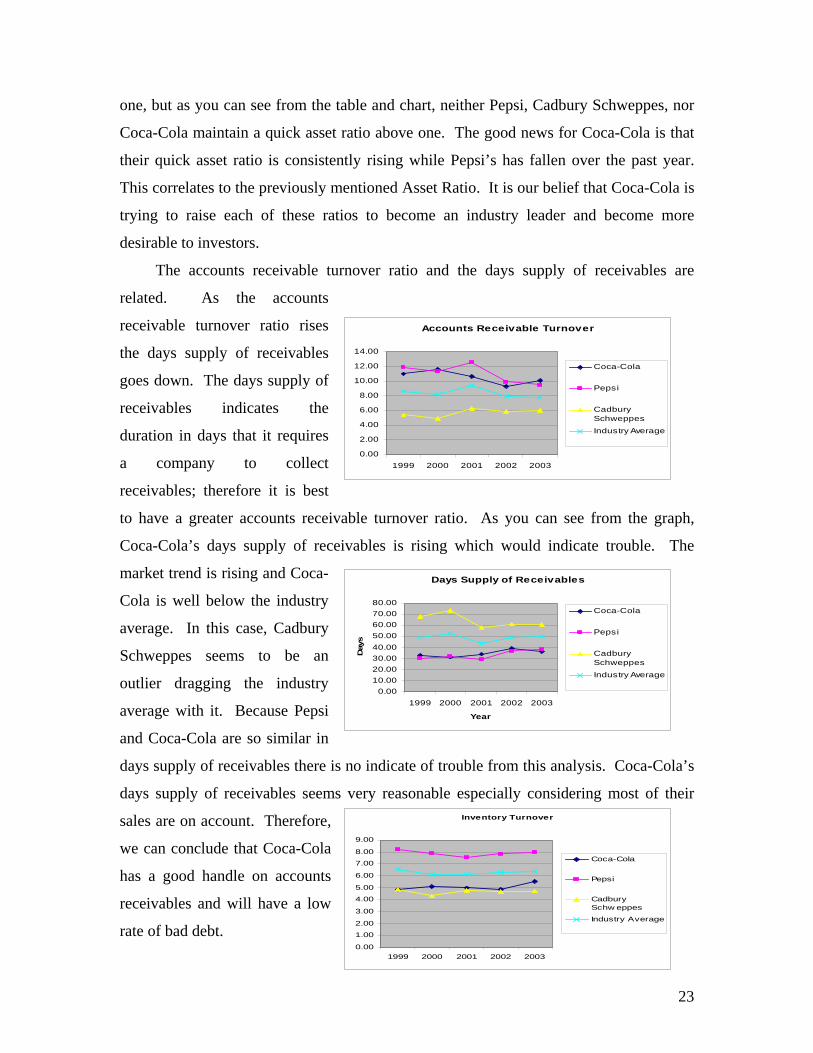
one, but as you can see from the table and chart, neither Pepsi, Cadbury Schweppes, nor
Coca-Cola maintain a quick asset ratio above one. The good news for Coca-Cola is that
their quick asset ratio is consistently rising while Pepsi’s has fallen over the past year.
This correlates to the previously mentioned Asset Ratio. It is our belief that Coca-Cola is
trying to raise each of these ratios to become an industry leader and become more
desirable to investors.
The accounts receivable turnover ratio and the days supply of receivables are
related. As the accounts
receivable turnover ratio rises
the days supply of receivables
goes down. The days supply of
receivables indicates the
duration in days that it requires
a company to collect
receivables; therefore it is best
to have a greater accounts receivable turnover ratio. As you can see from the graph,
Coca-Cola’s days supply of receivables is rising which would indicate trouble. The
market trend is rising and Coca-
Cola is well below the industry
average. In this case, Cadbury
Schweppes seems to be an
outlier dragging the industry
average with it. Because Pepsi
and Coca-Cola are so similar in
days supply of receivables there is no indicate of trouble from this analysis. Coca-Cola’s
days supply of receivables seems very reasonable especially considering most of their
sales are on account. Therefore,
we can conclude that Coca-Cola
has a good handle on accounts
receivables and will have a low
rate of bad debt.
Accounts Receivable Turnover
0.00
2.00
4.00
6.00
8.00
10.00
12.00
14.00
1999 2000 2001 2002 2003
Coca-Cola
Pepsi
CadburySchweppes
Industry Average
Days Supply of Receivables
0.0010.0020.0030.0040.0050.0060.0070.0080.00
1999 2000 2001 2002 2003
Year
Day
s
Coca-Cola
Pepsi
CadburySchweppes
Industry Average
24
Days Supply
0.00
10.00
20.00
30.00
40.00
50.00
60.00
70.00
80.00
90.00
1999 2000 2001 2002 2003
Coca-Cola
Pepsi
Cadbury
Industry average
Working Capital Turnover
-200.000.00
200.00400.00600.00800.00
1000.001200.001400.001600.001800.002000.00
1999 2000 2001 2002 2003
Coca-Cola
Pepsi
CadburySchw eppes
Industry Average
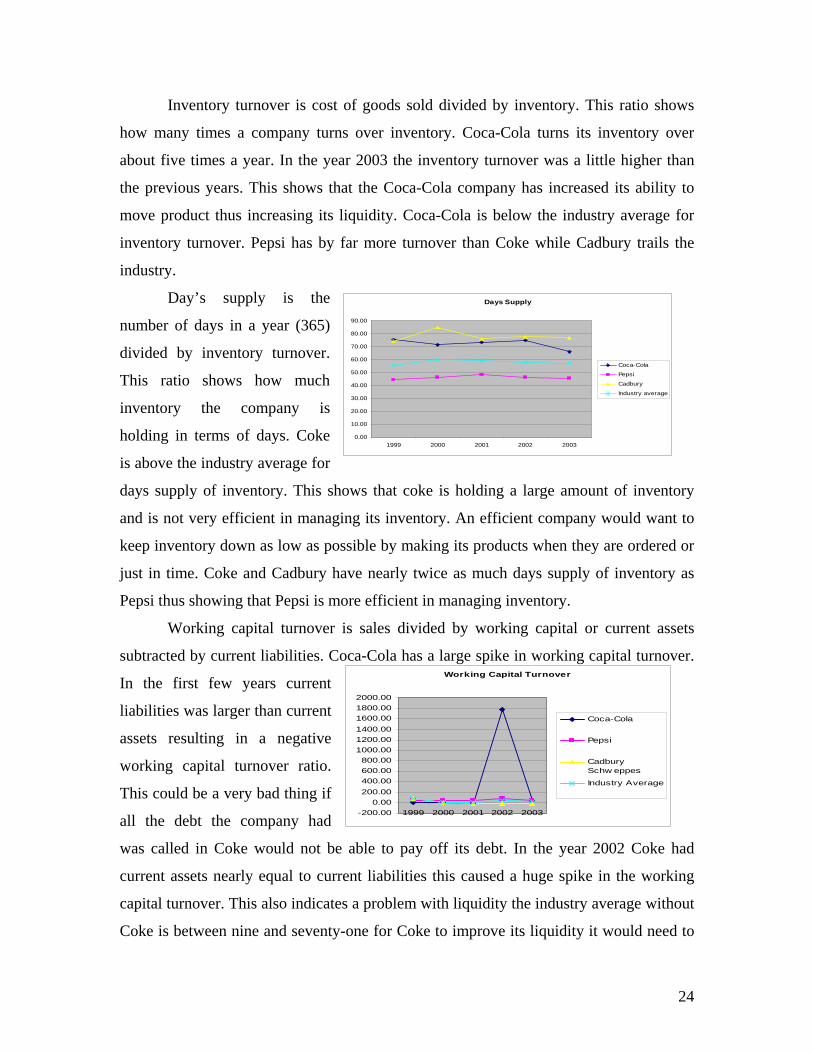
Inventory turnover is cost of goods sold divided by inventory. This ratio shows
how many times a company turns over inventory. Coca-Cola turns its inventory over
about five times a year. In the year 2003 the inventory turnover was a little higher than
the previous years. This shows that the Coca-Cola company has increased its ability to
move product thus increasing its liquidity. Coca-Cola is below the industry average for
inventory turnover. Pepsi has by far more turnover than Coke while Cadbury trails the
industry.
Day’s supply is the
number of days in a year (365)
divided by inventory turnover.
This ratio shows how much
inventory the company is
holding in terms of days. Coke
is above the industry average for
days supply of inventory. This shows that coke is holding a large amount of inventory
and is not very efficient in managing its inventory. An efficient company would want to
keep inventory down as low as possible by making its products when they are ordered or
just in time. Coke and Cadbury have nearly twice as much days supply of inventory as
Pepsi thus showing that Pepsi is more efficient in managing inventory.
Working capital turnover is sales divided by working capital or current assets
subtracted by current liabilities. Coca-Cola has a large spike in working capital turnover.
In the first few years current
liabilities was larger than current
assets resulting in a negative
working capital turnover ratio.
This could be a very bad thing if
all the debt the company had
was called in Coke would not be able to pay off its debt. In the year 2002 Coke had
current assets nearly equal to current liabilities this caused a huge spike in the working
capital turnover. This also indicates a problem with liquidity the industry average without
Coke is between nine and seventy-one for Coke to improve its liquidity it would need to
25
Operating Expense Ratio
0.00
0.10
0.20
0.30
0.40
0.50
0.60
1999 2000 2001 2002 2003
CokePepsiCadbury SchweppesIndustry Average
Gross Profit Margin
0%
10%
20%
30%
40%
50%
60%
70%
80%
1999 2000 2001 2002 2003
Coca-ColaPepsiCadburry SchweppesIndustry Average
lower its working capital turnover ratio by increasing current assets or by decreasing
current liabilities.
We found Coca-Cola’s liquidity to be below industry standards. The current ratio
and quick asset ratio have shown improvements over the past few years because current
assets have been increasing in relation to current liabilities, however inventory turnover
and days supply remain unsatisfactory in relation to the industry. This could be due to
bad inventory management or over estimated sales. Overall Coke’s lack of liquidity could
result in problems for coke in the future. (See page 47)
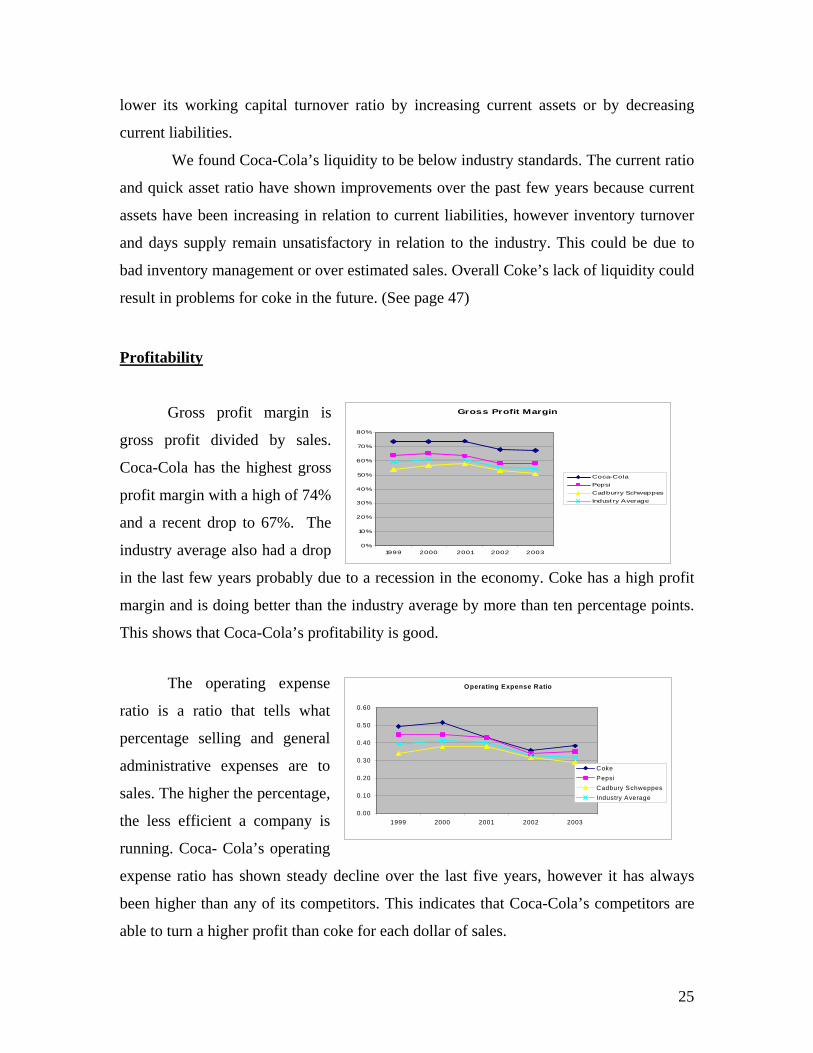
Profitability
Gross profit margin is
gross profit divided by sales.
Coca-Cola has the highest gross
profit margin with a high of 74%
and a recent drop to 67%. The
industry average also had a drop
in the last few years probably due to a recession in the economy. Coke has a high profit
margin and is doing better than the industry average by more than ten percentage points.
This shows that Coca-Cola’s profitability is good.
The operating expense
ratio is a ratio that tells what
percentage selling and general
administrative expenses are to
sales. The higher the percentage,
the less efficient a company is
running. Coca- Cola’s operating
expense ratio has shown steady decline over the last five years, however it has always
been higher than any of its competitors. This indicates that Coca-Cola’s competitors are
able to turn a higher profit than coke for each dollar of sales.
26
N e t P r o f i t M a r g i n
0 . 0 0
0 . 0 5
0 . 1 0
0 . 1 5
0 . 2 0
0 . 2 5
1 9 9 9 2 0 0 0 2 0 0 1 2 0 0 2 2 0 0 3
C o c a - C o l a
P e p s i
C a d b u r y S c h w e p p e s
I n d u s t r y A v e r a g e
A s s e t T u rn o v e r
0 .0 0
0 .2 0
0 .4 0
0 .6 0
0 .8 0
1 .0 0
1 .2 0
1 .4 0
1 9 9 9 2 0 0 0 2 0 0 1 2 0 0 2 2 0 0 3
C o c a -C o laP e p s iC a d b u ry S c h w e p p e sIn d u s try A v e ra g e
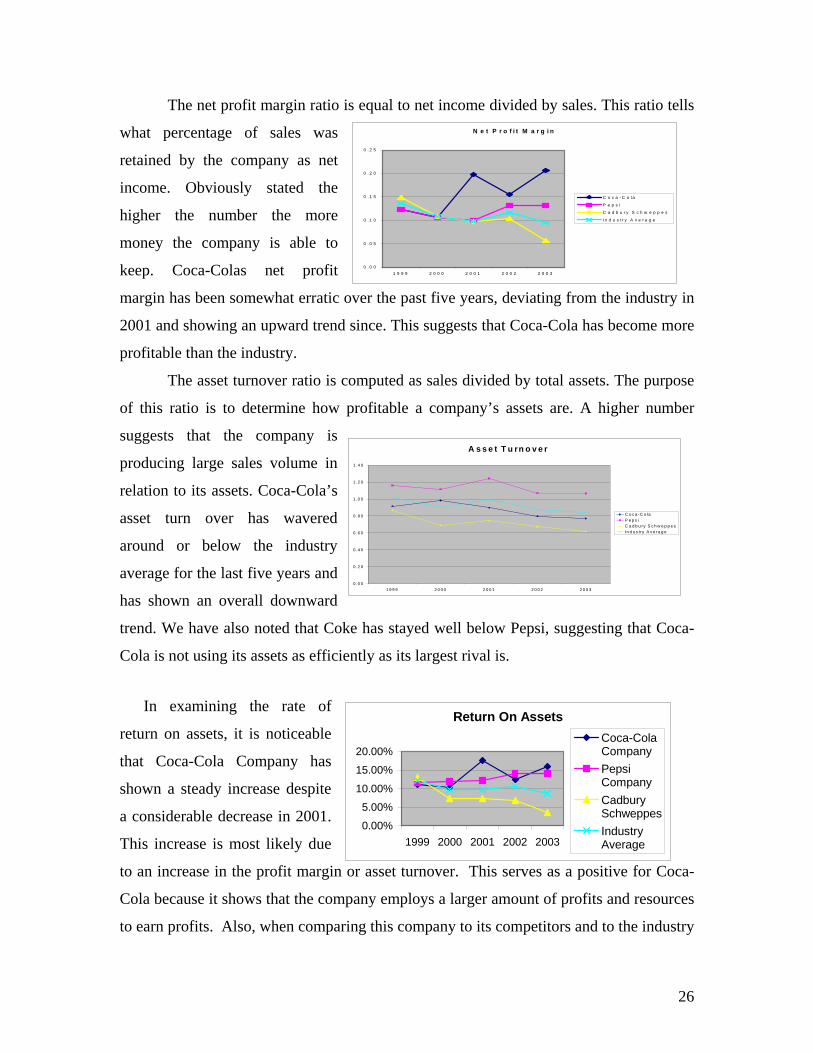
The net profit margin ratio is equal to net income divided by sales. This ratio tells
what percentage of sales was
retained by the company as net
income. Obviously stated the
higher the number the more
money the company is able to
keep. Coca-Colas net profit
margin has been somewhat erratic over the past five years, deviating from the industry in
2001 and showing an upward trend since. This suggests that Coca-Cola has become more
profitable than the industry.
The asset turnover ratio is computed as sales divided by total assets. The purpose
of this ratio is to determine how profitable a company’s assets are. A higher number
suggests that the company is
producing large sales volume in
relation to its assets. Coca-Cola’s
asset turn over has wavered
around or below the industry
average for the last five years and
has shown an overall downward
trend. We have also noted that Coke has stayed well below Pepsi, suggesting that Coca-
Cola is not using its assets as efficiently as its largest rival is.
In examining the rate of
return on assets, it is noticeable
that Coca-Cola Company has
shown a steady increase despite
a considerable decrease in 2001.
This increase is most likely due
to an increase in the profit margin or asset turnover. This serves as a positive for Coca-
Cola because it shows that the company employs a larger amount of profits and resources
to earn profits. Also, when comparing this company to its competitors and to the industry
Return On Assets
0.00%
5.00%
10.00%
15.00%
20.00%
1999 2000 2001 2002 2003
Coca-ColaCompanyPepsiCompanyCadburySchweppesIndustryAverage

27
Return On Equity
0.00%
5.00%
10.00%
15.00%
20.00%
25.00%
30.00%
35.00%
40.00%
1999 2000 2001 2002 2003
Coca-Cola
Pepsi
Cadbury Shweppes
Industry Average (w/oCoke)
average, one can observe that Coca-Cola has managed to stay completely above the
industry line and has shown consistently higher numbers than both its competitors.
The rate of return on equity figures show that Coca-Cola has about the same
fluctuations as their return on asset
for the past five periods. They
still, for the most part, seem to be
steadily increasing within an up
and down trend line. This also
serves as a positive for the
company because it means that profits have shown an overall increase. It also means that
Coca-Cola is not using as much debt financing in order to increase its assets and, as a
result, owner’s equity represents a larger percentage of total resources. This ratio, along
with return on assets, also proves that Coca-Cola has stayed above that industry average.
Overall we have found Coke to have profitability above industry standards. One
problem we found in our ratio analysis is a high percentage of SG&A compared to sales
suggesting Coke is not selling as efficiently as its competitors. Coke has also not been
making as much money as others in the industry off of it’s assets as seen by its
decreasing asset turnover. Other than these two areas, Coke seems to be doing well. (See
page 47)
Capital Structure
The debt to equity evaluation proves positive for Coca-Cola because it has been
rather steady around one. This
decreases credit risk and the
possibility that interest and debt
repayment cannot be satisfied
with available cash flows. There
has been a slight decrease in this
ratio over the past five years,
which proves that debt has become a smaller portion of total financing. Compared to its
Debt To Equity
0
1
2
3
1999 2000 2001 2002 2003
Coca-ColaCompany Pepsi Company
CadburySchweppesIndustryAverage

28
competitors and the industry average, Coca-Cola has maintained a position along the
same pattern, but has stayed considerably closer to one.
The figures for Coca Cola and Pepsi Co follow a similar increasing trend, while
those for Cadbury Schweppes
stay relatively low, without
much change form year to year.
These figures indicate that Coca
Cola and Pepsi Co have
sufficient funds to cover the
interest payments on their long term debts. Cadbury’s numbers suggest that they need to
be much more careful in how much interest bearing debt they take on, or they will not be
able to make the interest payments.
The debt service margin ratio illustrates how well a company is able to cover the
yearly payments on their long
term debt. Coca Cola’s numbers
show that every year their ability
to meet these payments is
increasing at a fairly rapid rate.
PepsiCo’s numbers however,
indicate that their ability to make
the payment increased until 2000 then began dropping off in more recent years to levels
that may start to raise concerns from creditors about their ability to make the payments.
Cadbury Schweppes numbers have once again remained very low compared to the rest of
the industry, but constant from year to year.
The sustainable growth
rate is the rate at which the firm
can grow while without
decreasing its profits. This ratio
is an excellent benchmark to
show how the company is doing
in relation to the industry. Coca Cola has been the most unpredictable in recent years,
Times Interest Earned
0
5
10
15
20
25
30
35
1999 2000 2001 2002 2003
Coca Cola
PepsiCo
CadburySchw eppes
Industry
Debt Service Margin
0
5
10
15
20
25
30
35
40
1999 2000 2001 2002 2003
Coca ColaPepsiCoCadbury SchweppesIndustry
Sustainable Growth Rate
0
0.05
0.1
0.15
0.2
0.25
0.3
1999 2000 2001 2002 2003
Coca Cola
PepsiCo
Cadbury Schweppes
Indust ry
29
going from reasonable levels to very low levels on a yearly basis. Each time they fall,
they do not seem to fall as far as in the previous year, which indicates that things are
getting better. PepsiCo was stable for 1999 to 2001, and then grew in 2002 before falling
back to the previous levels in 2003. Cadbury Schweppes has dropped every year since
1999, with the greatest changes coming in 2000, since then they have continued to fall,
but not at the levels seen before. (See page 47)
Coke’s capital structure ratios are moving in a positive trend in relation to the
industry. Overall they should not expect many problems in the future related to their
capital structure. Relative to their competitors, Coca Cola overall has a well-balanced
capital structure.
Z-Score
Altman’s Z – score = 1.2(Working Capital/Total Assets) + 1.4(Retained
Earnings/Total Assets) + 3.3(EBIT/Total Assets) + 0.6(Market Value Equity/Book Value
Liabilities) + 1.0(Sales/Total Assets)
= 1.2(510/27,342) + 1.4(26,687/27,342) + 3.3(5,673/27,342) + 0.6(40.71/5.39) +
1.0(21,044/27,342)
= 7.375 This observation of Cola-Cola Company’s Z-score predicts a very healthy
company with, not surprisingly, a low likelihood of failure. The reason for Coca-Cola’s
apparent strong financial performance and high market valuation is due to the positive
numbers in all variables of the equation. In the first component, one can see that there is
no deepening trouble with regard to repeated operating losses which would show a
reduction in working capital relative to total assets. The second component shows the
company’s history in its ability to reinvest earnings in itself. This is most likely due to
the fact that Coca-Cola has survived many years and has created an advantage to younger
companies through accumulated earnings. Ratio three, which makes adjustments for
variable tax rates and leverage due to borrowings, gives a plus to Coca-Cola in its
utilization of assets. The fourth component is a good indicator of the extent to which the
company’s assets can decline before debts may exceed assets. The final component

30
points out the profitability of Coca-Cola’s assets relative to the amount of sales generated
per asset. Coca-Cola’s cost of debt is estimated to be 5.19% which is a fairly low rate.
Comparatively, the z-score matches up with the low cost of debt. Because Coca-Cola has
such a high z-score, they should have the ability to borrow money at very low cost which
is shown to be the case.
31
Valuation
In valuing Coca Cola a combination of historical and forecasted data are used to
predict the firm’s overall value. First we used the non-intrinsic Method of Comparables
model, and then moved onto the more intrinsic methods including the Discounted
Dividends, Free Cash Flow, Residual Income and Abnormal Earnings Growth models.
Each different model analyzes different information about Coca Cola, and work to give
those valuing the firm an idea about how its current market price relates to its estimated
price derived from each of the different models. While analyzing each of the different
models, it can be concluded that Coca Cola would be an undervalued company in the
eyes of analysts based on the differences in estimated and actual share prices and the
relatively small growth rates that are needed to make the two equal.
In the valuation section we will be using the method of comparables as well as
four intrinsic valuation models, the discounted dividends, the discounted free cash flows,
the discounted residual income, and the abnormal earnings growth model, to estimate the
value of the Coca-Cola Company. Valuing the price of the firm is important to
shareholders as well as potential shareholder so they are able to determine if the company
is worth what they are paying for it. If a company is overvalued then it is a good time to
sell shares as well as vice versa, when it is undervalued it is a good time to buy shares.
This is important to the company as well because they may be willing to buy back shares
when the price is low. However, as you will see, valuing the firm is a complex process
that has many variables affecting its outcome. The market may reflect many variables
that are unable to be accurately predicted and it is therefore unlikely that you will beat the
market on a short-term basis.
Cost of Equity
Coca Cola has an estimated cost of equity of 5.44%. This figure was generated by
using a risk free rate of 3.26%, which is the rate on the seven year treasury bonds. The
beta used was calculated using a data regression for the previous sixty months, which is
32
approximately 0.544. The market risk premium was estimated to be 4%. Coca Cola’s
numbers show that they are a low credit risk, with little default risk.
Cost of Debt
Coca Cola’s cost of debt is estimated to be 5.19%; this figure was calculated
using a weighted average of short and long term debt and their pension obligations. The
short term debt represents 59% of the total debt at a cost of 1.97% interest. Long term
debt is 19% of total debt at an estimated cost of 5.28%, while the pension fund obligation
for the year represents 22% of the total at 14.35%. Coca Cola’s long term debt is
represented by a weighted average of their bond maturities. The bonds were divided into
three different categories, with the earliest maturity being in 1-3 years, the next being
those with maturities of 3-7 years, and the longest term bonds were those with maturities
of 10 or more years. The pension fund obligation cost was calculated by dividing the
interest, service, and the actuarial costs by the beginning balance of the ending pension
balance for the year.
Weighted Average Cost of Capital
Coca Cola’s Weighted Average Cost of Capital (WACC) is estimated to be
5.278%, in making these calculations it was determined that Coke is comprised of
11.88% debt and 88.12 % equity. Coca Cola has a very low debt to equity ratio, which
frees it from having to worry much about debt covenants and interest payments. The
downside to having such a small amount of is that Coke loses the tax benefit of the
interest paid on it debt. WACC was calculated by taking a weighted average of Coke’s
total equity and after tax debt, and dividing each by the total value of the company.
Equity was estimated at $98.304 billion, this figure was reached by multiplying the
current share price of $40.96 by the 2.4 billion outstanding shares. Debt was the total
book value of debt from the balance sheet, or $13252 billion. Coke’s weighted average
tax rate is 21%, which was calculated on previous 10K annual reports.
33
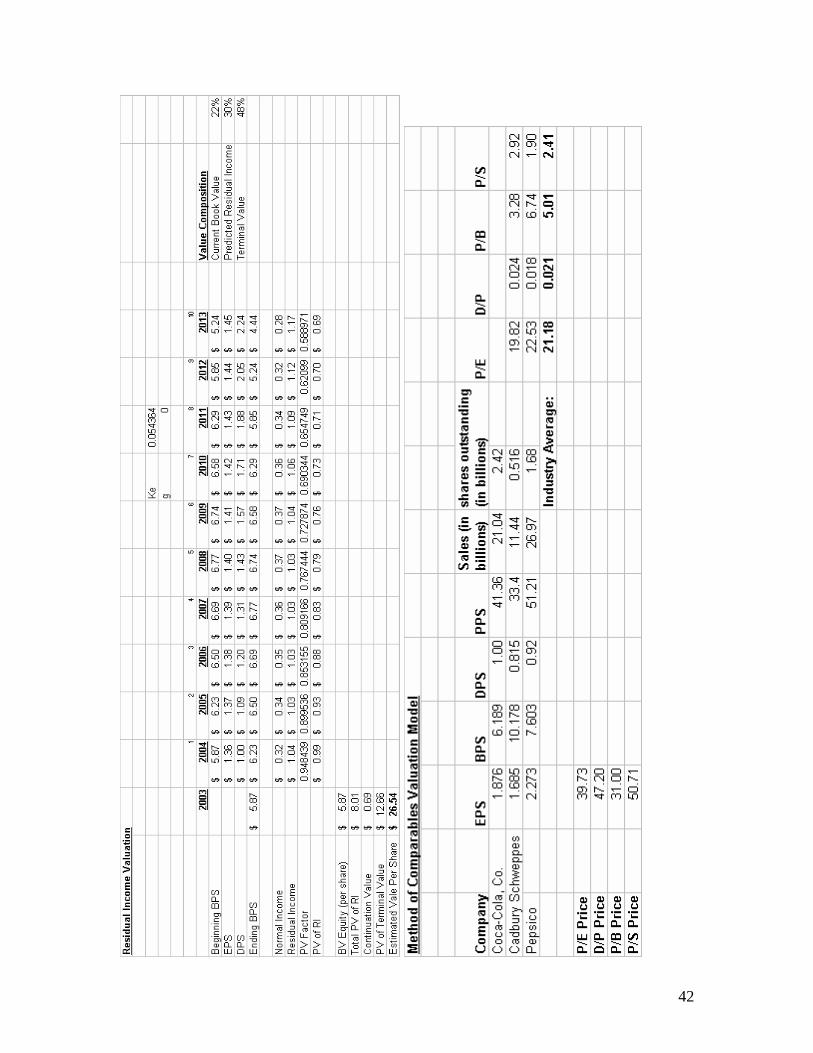
Method of Comparables Valuation
The method of comparables is a non-intrinsic model that is the least reliable
because it takes only the competitions information and neglects all firm specific data. It
may also be unreliable due to outliers. In the case of Coca-Cola we are unable to identify
any industry outliers because the industry consists of only three companies. However,
we feel that PepsiCo is comparable to Coca-Cola with name brand recognition and
market shares while Cadbury Schweppes is fairly obscure in comparison; therefore, we
created a method of comparables model removing Cadbury Schweppes and treating it as
an outlier. When doing this, the valuations of Coca-Cola were generally nearer the actual
value of the firm. The price to earnings ratio rose above Coca-Cola’s actual market value
and the price to book value became the more accurate measure of value. Price to sales
decreased dramatically making it comparable to Coca-Cola’s price and debt to price
actually increased the gap between estimated price and actual price.
When using the entire industry, the price to earnings method most accurately
reflected Coca-Cola’s price per share. The other methods were fairly inaccurate. Due to
the fluctuations in valuation price we felt that it may be worth averaging the range of
estimated prices. In doing so, the valuation of Coca-Cola was relatively more accurate
than choosing any method. We have concluded from our valuation using method of
comparables that the price to earnings valuation is the most accurate value when using
the entire firm but there is little faith that any one method may be accurate in the future
and we therefore believe that averaging the industry price when using the method of
comparables would allow for the most consistent valuation. Otherwise we should
eliminate Cadbury Schweppes from the market and value Coca-Cola using only PepsiCo
because there values were comparable. (see page 42)
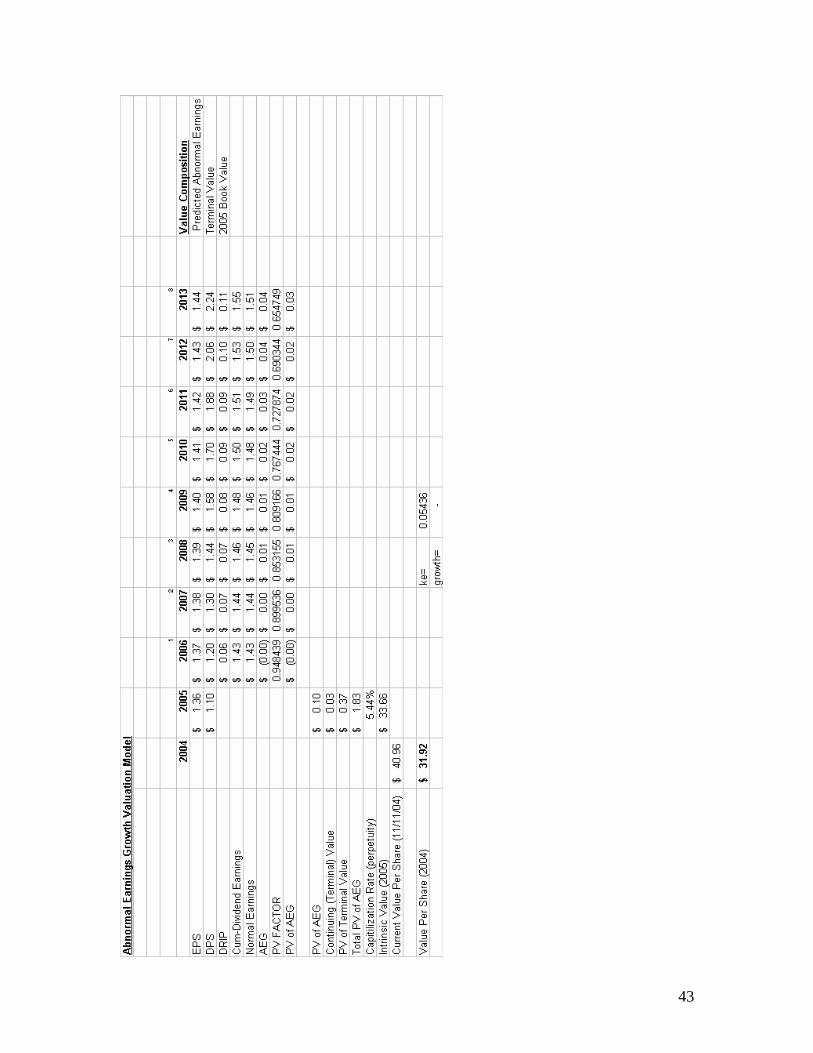
Abnormal Earnings Growth Valuation
The Abnormal Earnings Growth Model calculates the book value of equity plus
the present value of expected future abnormal earnings. Abnormal earnings consist of
expected net income less the normalized income multiplied by the discount rate. This
34
method implies that if a company has no difference between its expected net income and
the normalized earnings, then the amount invested in the stock should be no more than
the book value. Depending on whether a company’s expected earnings is more or less
than the normal income, investors should pay more or less for the stock. A high value for
abnormal earnings indicates that a firm shows positive abnormal future stock returns and
the contrary. (See page 43)
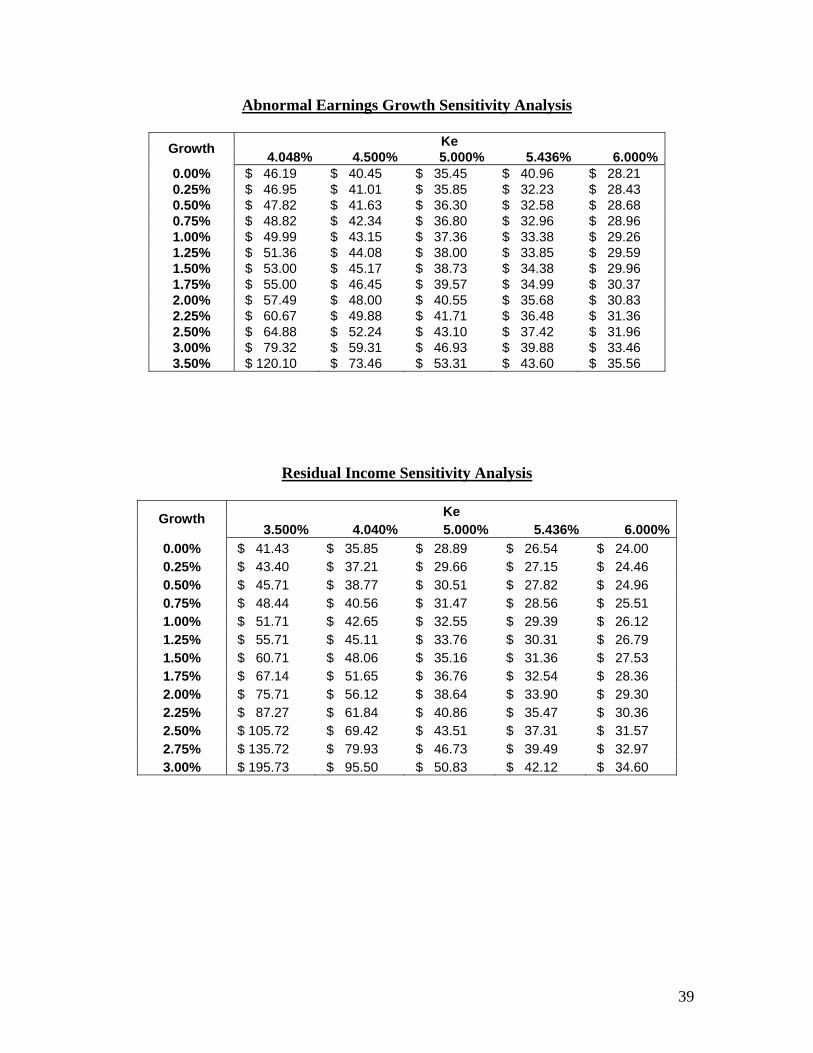
Our estimation for abnormal earnings was very low due to the minimal difference
between our cumulative dividend earnings and our normal earnings which suggest that
we have negative abnormal stock performance. Since we had a slightly lower estimated
value per share compared to the actual value per share, we added a reasonable growth
rate of 3.171%, implying that our estimations are not extremely sensitive to growth.
Using the given value of beta to calculate our cost of equity, we estimated that our value
per share was $46 compared to the actual value per share of 40$. Using our own cost of
equity and no growth , the model gives a stock price of 34.63 for November 1, 2004. This
would mean that our company would comprise a negative growth rate in order to meet
actual value. As a result, it can only be concluded that our company, in essence, is
undervalued using abnormal earnings and reveals an apparent limitation to this method.
(See page 39)
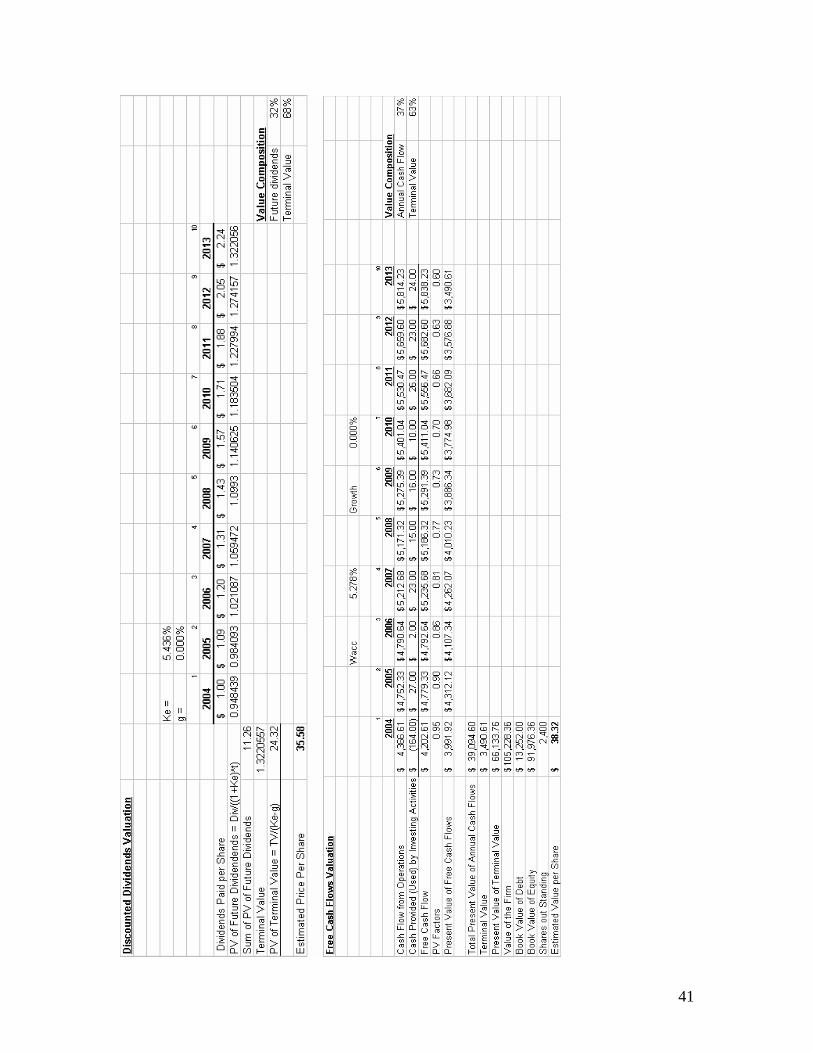
Discounted Dividends Valuation
The discounted dividends valuation model is used to relate Coca Cola’s future
equity to present values. The model is constructed by using the dividend growth rate to
project the future dividends, and then finding the present value of each individual
payment. The present value is calculated by dividing the dividend by 1 plus the cost of
equity minus the growth rate, and then multiplied to the power of the year the dividend
was issued. The terminal value is calculated by dividing the final forecasted dividend by
only the cost of equity minus the growth rate, and then finding the present value of it.
The estimated share price is calculated by adding the total of all the present values and
the present value of the terminal value. Coca Cola’s estimated share price, when using
the calculated Beta equaled its actual share price of $40.96 when a growth rate of 0.985%
35
was used in the calculations. This represents a very attainable figure that Coca Cola
should have no trouble achieving. According to this model Coca Cola is somewhat
undervalued, in that growth of not even 1% is required for the estimated price to equal
the actual share price. When calculated using the published Beta from Yahoo Finance,
even with a 0% growth rate the estimated share price was below the actual share price.
The model, with no growth values the stock at 34.63 at November 1, 2004. This
reinforces even more that Coca Cola is an unvalued stock when calculated using the
discounted dividends model. (See pages 41, 38)
Free Cash Flow Valuation
The free cash flow valuation utilizes the forecasts off the cash flow statements.
The predicted cash flow from operations and cash provided by the investing activities add
up to total the free cash flow which indicates the profitability of the firm. We then
determine the value in terms of today’s dollar amount. The book value of debt taken
from the value of the firm totals the book value of equity. The value of equity divided by
the number of shares should give you the firm value per share. (See page 45)
In our original valuation we assumed there was no growth and that our weighted
average cost of capital (WACC) is 5.278%. The estimated value per share resulted in
$26.94, a lower price than Coca-Cola is actually traded at by almost $15. We then
performed a sensitivity analysis by lowering the assumed weighted average cost of
capital to 3.75%. Leaving the growth rate at zero, the value of the firm using the adjusted
WACC came to $40.78, much closer to the market price per share of $40.96. We then
returned the WACC to our original estimate and adjusted the growth rate because we
assume that Coca-Cola will continue to grow in the future. With a growth rate of 2.15%,
the estimated value per share totaled $41. We then recalculated the WACC using the
published beta from yahoo finance and came up with 4.048% which increases the
estimated value of the firm to $37.26 with zero growth. The growth necessary to increase
the firms estimated value to $40.78, comparable to the actual value, was only 0.425%.
(See page 38)
36
After performing the free cash flow valuation we found that based on this model
the firm may be undervalued considering our growth rate is relatively small. There are
inherent limitations associated with this valuation process including how well the cash
flow statements are forecasted, if the cash flows are inaccurately predicted then the model
is less applicable. With no growth using our WACC, the model predicted a stock price of
37.33 for November 1, 2004.
Residual Income Valuation
The Residual Income Model is an accounting based model. In the RI model we
use data from the past to help determine the value of the firm to see if the firm is over
valued or under valued. The Residual Income model uses the relationships between
earnings per share dividends paid and the cost of equity to find the residual income. The
Residual Income is the amount of earnings left over after stock holders cost of equity is
met. After finding the forecasted Residual Income we then take the present value of the
future cash flows and add them together this gives us the total present value of Residual
Income for the ten year forecast. Next we will compute a terminal value for the Residual
Income model to do this we calculate a perpetuity which will also need discounted back
to the present. (See page 42)
In our Residual Income Valuation Model we found the cost of equity to be
5.4364% and with a growth of almost three percent we calculated a present value that is
almost the same as the current price. A three percent growth may be too low for Coco-
Cola; in other words, the firm may be undervalued. When we use the beta from yahoo to
calculate the cost of equity we get 4.04% which is lower than the cost of equity we
calculated. With the cost of equity from yahoo we would need an even lower growth rate
to get today’s price, this may further indicate the firm is undervalued. The current book
value makes up 14% of the firms estimated share value while the predicted Residual
Income for the next ten years makes up 20% of the firms estimated share value, 66% of
the firms estimated share value comes from the terminal value estimation. The yahoo
numbers are close to our numbers current book value is 14% of total value the predicted
RI over ten years is 23%, and the terminal value makes up 63% of the total value. The
37
firm gets most of its value from the terminal prediction which has the greatest chance for
error this could mean the firm is under valued or possibly overvalued. With non growth
rate the model values the firm at 25.83 for November 1, 2004. (See page 39)
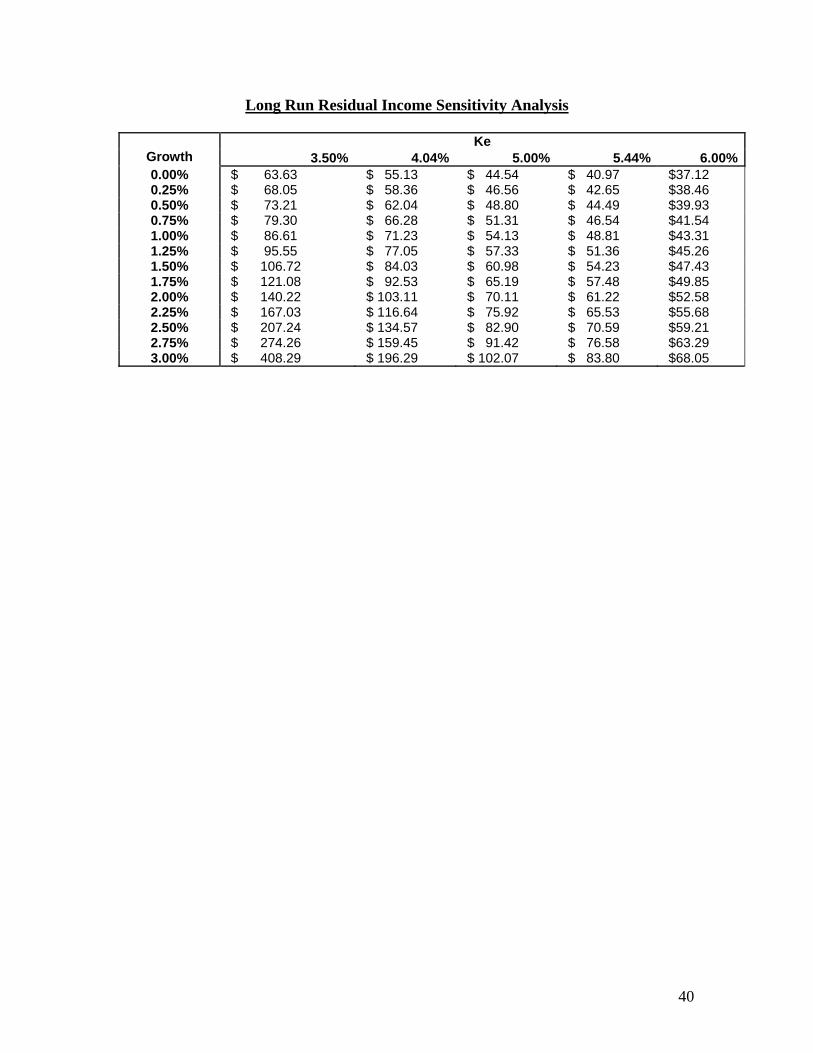
Long Run Residual Income
The long run residual income model estimates the value of the company’s stock
using the price over book ratio. Using 2003’s ROE of 35.98% and no growth the model
values the stock at 39.87 for November which is very close to Coke’s actual share price.
Because Coke will most likely have growth in the coming years, we feel that this model
shows that Coke is currently undervalued. (See page 40)

38
Appendices
Discounted Dividends Model Sensitivity Analysis
Ke Growth 4.040% 4.500% 5.000% 5.436% 6.000%
0.00% $ 49.57 $ 43.98 $ 39.10 $ 35.58 $ 31.81 0.25% $ 52.03 $ 45.87 $ 40.55 $ 36.75 $ 32.72 0.50% $ 54.85 $ 48.00 $ 42.16 $ 38.05 $ 33.71 0.75% $ 58.09 $ 50.41 $ 43.96 $ 39.47 $ 34.79 1.00% $ 61.87 $ 53.16 $ 45.99 $ 41.07 $ 35.99 1.25% $ 66.32 $ 56.34 $ 48.28 $ 42.85 $ 37.31 1.50% $ 71.65 $ 60.04 $ 50.91 $ 44.85 $ 38.77 1.75% $ 78.14 $ 64.42 $ 53.94 $ 47.13 $ 40.41 2.00% $ 86.23 $ 69.68 $ 57.47 $ 49.74 $ 42.25
Free Cash Flows Sensitivity Analysis
WACC Growth 3.500% 4.048% 4.500% 5.000% 5.278% 5.500%
0.00% $ 44.20 $ 37.26 $ 32.80 $ 28.82 $ 26.94 $ 25.57 0.25% $ 47.01 $ 39.23 $ 34.32 $ 29.99 $ 27.95 $ 26.48 0.50% $ 50.30 $ 41.49 $ 36.03 $ 31.29 $ 29.08 $ 27.49 0.75% $ 54.18 $ 44.08 $ 37.97 $ 32.73 $ 30.33 $ 28.60 1.00% $ 58.83 $ 47.10 $ 40.19 $ 34.36 $ 31.72 $ 29.84 1.25% $ 64.52 $ 50.66 $ 42.74 $ 36.21 $ 33.29 $ 31.22 1.50% $ 71.63 $ 54.92 $ 45.72 $ 38.32 $ 35.06 $ 32.78 1.75% $ 80.78 $ 60.11 $ 49.25 $ 40.76 $ 37.08 $ 34.54 2.00% $ 92.97 $ 66.56 $ 53.47 $ 43.60 $ 39.42 $ 36.55 2.25% $ 110.04 $ 74.79 $ 58.64 $ 46.96 $ 42.14 $ 38.88 2.50% $ 135.64 $ 85.70 $ 65.10 $ 50.99 $ 45.35 $ 41.59
39
Abnormal Earnings Growth Sensitivity Analysis
Ke Growth 4.048% 4.500% 5.000% 5.436% 6.000%0.00% $ 46.19 $ 40.45 $ 35.45 $ 40.96 $ 28.21 0.25% $ 46.95 $ 41.01 $ 35.85 $ 32.23 $ 28.43 0.50% $ 47.82 $ 41.63 $ 36.30 $ 32.58 $ 28.68 0.75% $ 48.82 $ 42.34 $ 36.80 $ 32.96 $ 28.96 1.00% $ 49.99 $ 43.15 $ 37.36 $ 33.38 $ 29.26 1.25% $ 51.36 $ 44.08 $ 38.00 $ 33.85 $ 29.59 1.50% $ 53.00 $ 45.17 $ 38.73 $ 34.38 $ 29.96 1.75% $ 55.00 $ 46.45 $ 39.57 $ 34.99 $ 30.37 2.00% $ 57.49 $ 48.00 $ 40.55 $ 35.68 $ 30.83 2.25% $ 60.67 $ 49.88 $ 41.71 $ 36.48 $ 31.36 2.50% $ 64.88 $ 52.24 $ 43.10 $ 37.42 $ 31.96 3.00% $ 79.32 $ 59.31 $ 46.93 $ 39.88 $ 33.46 3.50% $ 120.10 $ 73.46 $ 53.31 $ 43.60 $ 35.56
Residual Income Sensitivity Analysis
Ke Growth 3.500% 4.040% 5.000% 5.436% 6.000%
0.00% $ 41.43 $ 35.85 $ 28.89 $ 26.54 $ 24.00 0.25% $ 43.40 $ 37.21 $ 29.66 $ 27.15 $ 24.46 0.50% $ 45.71 $ 38.77 $ 30.51 $ 27.82 $ 24.96 0.75% $ 48.44 $ 40.56 $ 31.47 $ 28.56 $ 25.51 1.00% $ 51.71 $ 42.65 $ 32.55 $ 29.39 $ 26.12 1.25% $ 55.71 $ 45.11 $ 33.76 $ 30.31 $ 26.79 1.50% $ 60.71 $ 48.06 $ 35.16 $ 31.36 $ 27.53 1.75% $ 67.14 $ 51.65 $ 36.76 $ 32.54 $ 28.36 2.00% $ 75.71 $ 56.12 $ 38.64 $ 33.90 $ 29.30 2.25% $ 87.27 $ 61.84 $ 40.86 $ 35.47 $ 30.36 2.50% $ 105.72 $ 69.42 $ 43.51 $ 37.31 $ 31.57 2.75% $ 135.72 $ 79.93 $ 46.73 $ 39.49 $ 32.97 3.00% $ 195.73 $ 95.50 $ 50.83 $ 42.12 $ 34.60
40
Long Run Residual Income Sensitivity Analysis
Ke Growth 3.50% 4.04% 5.00% 5.44% 6.00%0.00% $ 63.63 $ 55.13 $ 44.54 $ 40.97 $37.12 0.25% $ 68.05 $ 58.36 $ 46.56 $ 42.65 $38.46 0.50% $ 73.21 $ 62.04 $ 48.80 $ 44.49 $39.93 0.75% $ 79.30 $ 66.28 $ 51.31 $ 46.54 $41.54 1.00% $ 86.61 $ 71.23 $ 54.13 $ 48.81 $43.31 1.25% $ 95.55 $ 77.05 $ 57.33 $ 51.36 $45.26 1.50% $ 106.72 $ 84.03 $ 60.98 $ 54.23 $47.43 1.75% $ 121.08 $ 92.53 $ 65.19 $ 57.48 $49.85 2.00% $ 140.22 $ 103.11 $ 70.11 $ 61.22 $52.58 2.25% $ 167.03 $ 116.64 $ 75.92 $ 65.53 $55.68 2.50% $ 207.24 $ 134.57 $ 82.90 $ 70.59 $59.21 2.75% $ 274.26 $ 159.45 $ 91.42 $ 76.58 $63.29 3.00% $ 408.29 $ 196.29 $ 102.07 $ 83.80 $68.05
41
42
43
44
45
46
47
48
References
1. http://finance.yahoo.com/
2. http://www2.coca-cola.com/
3. http://beverage-digest.com/editorial/datastats.html
4. http://moneycentral.msn.com/investor/invsub/results/hilite.asp?Symbol=KO
5. http://moneycentral.msn.com/investor/sec/filing.asp?Symbol=KO
(Coca-Cola 10k)
*All accounting numbers come from MSN Money and Edgarscan