equity & stock analysis/valuation - - munich personal ... & stock analysis/valuation leading...
TRANSCRIPT

MPRAMunich Personal RePEc Archive
Equity & Stock Analysis/Valuation
Ashiq Hussain
31. December 2009
Online at http://mpra.ub.uni-muenchen.de/58902/MPRA Paper No. 58902, posted 27. September 2014 02:26 UTC

Equity & Stock Analysis/Valuation
Leading and Dragging Cement Companies in Pakistan
Disclosure u/s 2711(h) FINRA RULES (page # 60)For further information [email protected]
2009
ASHIQ HUSSAINMatracon Pakistan Private Limited
12/25/2009
Pag
e2
LCL
DGCL
MLCF
PCL
Industry
Economy
Recommend
12/25/2009
World Economy View 3-5
Pakistan Economy 6-23
World Economy View 3-05
Pakistan Economy 6-23
Production & Sale 24
PEST Analysis 25
SWOT Analysis 26
Investment Tips/Tools 27-28
Lucky Cement 29-35
DG Khan Cement 36-42
Maple Leaf Cement 43-49
Pioneer Cement 50-56
Comparatives 57-59
Section Study
Pakistan Economy 6-7
PEST Analysis of Eco 8-9
Country Risk 10-12
Why to Invest Pak 13-14
Trade Policy 15-17
Financial Budget 18-21
Monitory/Fiscal Policy 22-23

Pag
e3
The Earth is not only sheltering but also feeding the billions of living things , which
are being managed and influenced by external and internal factors
Almost 71% of the earth surface is covered by the 5 oceans and the rest of that is
divided into 7 continents , the population of these continent comprises over 6.8
billions human beings with 1.67% growth rate per annum.
Living needs and requirements are accomplished through a system and economy is
that a system which provides living to the peoples or loosely defined as country’s
plan for its services ,goods produced and the exact way in which its economic plan is
carried out.
There are several types of economy’s but Market, Planed & Mix economies are
most prominent, while the other types i.e. Political, capitalist & Price market are not
well known
MARKET ECONOMY decisions are dominated by supply & demand
PLANNED ECONOMY production, distribution & prices are controlled by the
MIXED ECONOMY flexibility in some area and control in others, this includes
capitalist & socialist economic policies and often arise in
societies that seek to balance political & economic views
POLITICAL ECONOMY “capitalist regime” analyze the conditions under witch
production was carried out into the national states ,
political economy basically study process of polity
weather it is undergoing a surplus or deficit , also study of
human activity in shaping material world & mechanism of
distributing surplus or deficit generated from such
activities.
CAPITALIST ECONOMY otherwise called free market economy, where more
private participants in economic activities, free
environment to compete in economy, individuals/firms
acts for profit and high freedom for choice to customers
while government acts as police state.
PRICE MARKET ECO. where prices of goods and services are determined by
demand & supply forces, government to ensure that fair
prices (determine by demand & supply) are being
charged by suppliers. Peoples with sufficient control over
resources and wealth can purchase goods/services which
Source: Economic watch, Asia Monitor, CIA Fact book & Encyclopedia

Pag
e4
are highly priced in free economy . system thrown out
the poor’s and they can not purchase basic needs. This is
most efficient device to allocate resources with wealth or
income, (giving peoples what they deserve) price market
existing with the doctrine of socialism like. Limited
regulations of prices by the government to protect the
poor’s can be ideal for developing countries, as did by the
India & China
ISLAMIC ECONOMY Regulates in accordance with Islamic law’s, Government
& Private ownership of resources with restriction on Riba
(interest) but Profit earned through lawful businesses.
ZAKAT, USHER,KHUMS & GIZIA are primary while trade
taxes (trade with friend or foe countries) are secondary
revenues , government is responsible to control prices &
ensure only reasonable profit for the businessmen’s and
primarily responsible for fulfillment of basic needs &
provision of equal opportunities for prosperity & welfare of
all citizen (regardless of sect or religion) of the state.
Traditional Economy
Is a system where allocation of available resources is
made on the basis of in heritance. As a deep rooted
economic theory with well- belt social setup. Traditional
economy generally makes use of prehistoric instruments
& techniques, where age-old human occupations like
agriculture & cottage industries were focal point of
interests. Although there were some benefits where
peoples feels psychological free, comfortable and
secured , hence increase their working abilities and
reduce un employment & low crime rates. However
nations having traditional economy’s are fast switching off
to more contemporary concept like Mix /
Controlled / Market economy and Islamic Economy
(Muslim states) to keep pace with modern economic
trend and happenings .

Pag
e5
Global Economy Shift in economic activities from “agriculture” to “service”
which raised in growth in total as well as per capita GDP
and reducing number of peoples in poverty. Global
economy has equipped the economy with power to
market goods & services across countries in the globe.
Reaping benefit of economy in scale and availability of
cheap labor/capital & technology are its advantages,
while transportation of goods/services across nations,
emission of greenhouse gases, loss of domestic jobs &
displacement of labor because of shifting labor intensive
industries to low wage countries and formulation of un
differential legislation / regulations across the globe are
main disadvantages.
Economic Relations
Relations between two countries depends on factors like
import-export and investment which leads to bilateral or
multilateral trade. World Trade Organization(WTO)
managed to create free trade zones and made it possible
to promote free trade on global basis to minimize trade
barriers among different countries which are erected in
the form of oppressive foreign trade legislations & tax
policies which were not exactly in the favor of attracting
FDI from other countries.
Globalization and International Economic Relations
Globalization has led to social, economic, technical,
cultural & ecological interdependence among the nations.
Unrestricted movement of goods/services/flow of capital/
mobility of workforce and reduction of regulatory
obstacles need to be ensured for successful economic
relations. Globalization leads to free trade between
countries, flow of information’s, reduction in cultural
barriers and environmental issue of the world, resultantly
many mutual co-operations took place and economic
activities under taken across geographical borders.

Pag
e6
Regional Eco. Asia is the largest & populous continent , consist over
8.6% of land area and residing 4 billion peoples (60%
of the world population) comprises over 52 states ,
including economic giants (China & Japan), oil
enriched gulf countries , plentiful natural resources
states of formal USSR and largest democratic
republic of India
Pakistan Eco Pakistan economy is 26th largest for purchasing power
and 46th in term of GDP (World Bank 2008)
Agriculture sector : contributes 23% of GDP hosting
45% of labor workforce, hence world leading in
producing Agriculture commodities
Industry sector :Textile (is back bone of Pakistan
meets 9% of world demand) Food processing ,
Chemical, Iron & Steel besides Fertilizer & Cement
Imports: Hydrocarbons, Capital goods & Chemicals
Natural Resources : Oil, Gas, Coal, Iron & Copper
Economic Indicators :
L. Scale(Mfg) 5.4 Inflation 23%
Taxes (Rs. B) 959 Export ($ M) 13015
Remittance($M) 4919 Import ($ M) 21878
C.A deficit ($M) 7455 Trade Bal. 8863
Foreign Invest 1892 F. Reserve 10 ($B)
Exchange Rate 80 Rs/$ Lending Rate 14%
Source: Economic survey of Pakistan, Board of Investment-Pakistan, Trade development of Pakistan

Pag
e7
Stress on macro economic stability mainly emanated
from unstable balance of payments, falling value of
Rupee, escalating inflation & structural problems like
power shortage resulting in perceptible slow down in
economic activity, domestic socio political upheavals
& rapid changing global economic environments
added to multifaceted problems, but after
endorsement of economic stabilization program by
IMF, the economy got confidence back
Improvement in economic variables such as inflation,
foreign exchange reserves, import growth &
Government borrowing are evident of activity revival
hence Economic growth target 3% & fiscal deficit
target 5.6% of GDP are achievable and pressure on
monitory/fiscal & exchange rate policy will be
mitigated by lowering financing needs, elimination of
subsidies , partial transfer of oilpayments toforeign
exchange market and fall in international oil prices
will provide great help.
Downside risk to IMF program may come from
slippage on FBR revenues & sow down in export
neutralizing to some extent steep fall in import
growth , negative growth in LSM(large Scale
Manufacturing) and falling credit to private sector are
indication of falling economic activity, however still
prospects in Agriculture & Service sectors hoping to
achieve targets

Pag
e8
Political Consequences of 9/11 2001 are the major cause,
which adversely affected on Afghanistan & Pakistan
Assassination of Banazir Butto & International Crises
cause to Capital flight & stepping back of foreign
investors from Pak has close down the business &
economic activates and dropping down the currency
value about 15% against US Dollar
War against terror , suicidal & terrorist attacks are
major causes of social unrest
Successful Army operation in Swat and Waziristan has
shown some hope to the revival of security situation
Economic Factors
Economic growth
According to UN Economic & Social Commission for
Asia manufacturing sector is moderately growing
despite 60% fall in profit due to international crises &
oil prices as well as currency devaluation and fall in
export
Inflation
Energy crises, insecurity ,low infrastructure, low
productivity international cries, fuel prices hike,
currency devaluation , debt financing , capital flight
from Pakistan & low productivity in industrial workers
& poverty are all together causing inflation
Interest
Raising interest rate was raised up to 14% beside
tightening monetary policy to fight inflation, which
has brought down
Pag
e9
Exchange
Depreciation in Currency has not only increased debt
Burdon on Pakistan but also effecting the
international trades
Social Factors
Sense Social Justice is creeping among the society and
they are demanding capability base access over
wealth & resources as well as pressing government to
provide Education/Health/ Safety & Security besides
economic stability and justice
Technological Factors
Development & Promotion of Automation & IT in
organization to increase efficiency & productivity
particularly in manufacturing units Software for Bank
& DFI’s to promote investors confidence
NB Read in conjunction with working paper “ Why to Invest in Pakistan”

Pag
e10
Political Factors
Al-Qaida & Taliban
Existence of Taliban & alleged presence of Al-Qaida
management in Pakistan has not only deteriorated
security situation in Pakistan but also debarred foreign
investors to invest in Pakistan and resultantly economy
has sagged at 49.6 basis point in short term scoring,
despite effective operation in Swat & Malakand divisions,
however impending operation in Waziristan and new
Obama policy to expanding dialogue with radical groups
in Pakistan & Afghanistan , has positively been
responded in Pakistan.
Baluchistan
Provincial autonomy and more funding from federal
government through NFC award on the ground of area
and poverty instead of population. Consensus has
developed among political parties and would bring
positive result.
FATA
Demand has raised for self autonomy like Gilgat Baltistan
instead of merging with NWFP province
Gilgat Baltistan Council
Status like AJK government has announced by the Govt.
which will not damage the cause of Kashmir because
council has not been declared as province of Pakistan
Independent Judiciary & Social justice
Power package 125 M, BISP 85 M, IDP’s 56 M & EDU 45 Mand Support to Construct Dams & Electricity Production& interest in Investment in Pak by USA & explanatorynote on Carry Loger bill
Shares distribution of 1.2 billion rupees
Monopoly control fine on cement/ sugar &Petroleum prices
Waziristan operation & additional military aid by USA

Pag
e11
EU & USA announce to take measures to make Pakistaniexports most attractive., as demanded by Pakistan
Up gradation of Karachi steel by USSR
Goods train service to Turkey via Iran & Free Trade Zones
Pak Iran gas pipeline
Economic Factors
Foreign Direct Investment (FDI)
Global financial crises and volatile domestic security
situation caused 57% yoy slump because of FDI hurt
despite improvement in sovereign rating from negative to
stable (speculative grade B3) by Moody & revised rating
by Standard & Poor’s from CCC+ to B- (improved
external liquidity & reduction in fiscal deficit ) and
increased inflow from foreign portfolio investors , who
purchased $95( M )in just one month in local stock and
bringing DFI to $351 Mn. along with 1% cut in interest
rate(14% to 13%) with 10% liquidity placement with State
Bank of Pakistan(SBP) and release of 3rd trench of $7.6
billion loan. short term ranking of Pakistan is 44.4
Friends of Pakistan (Tokyo Accord) plus principal
approval of another 4 billion loans from IMF, and
impending approval of Carry Loger bill by president
Obama and some other assistance programs for Pakistan
by USA are in pipeline while will play a vital role in the
prosperity of economy.
Business Environment
Power Crises
As demand increased by industrialization while capacity
has not grown in tandem
Government is very serious to overcome & taken
following -short term measures like hiring Rental power
plants and provision of extra furnish oil /gas to existing
IPP’s and payment of their over dues,
Controlling line losses & improving distribution system
long term measures like construction of large, medium &
small dams, and initiate a pilot project of coal power
house.

Pag
e12
Disillusionment with Trade Policy
Government trade policy has come under flak for not
offering enough incentives to relive cost burden from
export sector, which is weighing heavily on
competitiveness. Without greater diversification in product
& trading partners it will not possible for Pakistan to
extricate itself from chronic trade deficits.
Physical Infrastructure of Road & Highways
Signed a contract of $230Mn by Asian Development
Bank for safe, fast & cost effective transportation up to
remote areas , it would attain infrastructure score of 36.1,
while institutional score to 29.6 ,while market orientation
to 47.5

Pag
e13
GREEN FIELD INVESTMENT INCENTIVES
Incentives
Capital / Profit & Dividend remittance allowed
5% custom duty on import of plant /machinery/
equipments on manufacturing/infrastructure sectors
& 0% on agriculture and 0-5% on services sectors. Tax
Relief (initial depreciation allow. ) 50% of PMI costs
Royalty/Technical Fee no restriction on payment of
fee in manufacturing & Rupee One lac or 5% of net
sale up to 5 years
Minimum investment , no limit on manufacturing
sector and US $ .3 million for agriculture & US$ .15
for service sectors
No permission required except some specific
industry/sector
Reasons
Geo-strategic location : Pakistan Is gateway to energy
enrich central Asian states , financial liquid gulf &
economically advanced for eastern tiger. This
strategic advantage alone makes Pakistan a
marketplace teeming with possibilities
Trained work fore : large part is proficient in English ,
hardworking & intelligent . Pakistan possess large
pool of trained/experienced (international)
professionals
Economic outlook : Pakistan have been touched a
growth rate of 8.4% in 2005 and growing middle class
180 million consumers, FDI reached to US $ 3.7
billion, fiscal deficit inclined up to 3% of GDP &
foreign reserves US$ 11.6 billion

Pag
e14
Investment policies : policies tailor to suit investors
needs, consistency in policies with liberalization, de-
regulations, privatization & facilitation being its
foremost cornerstones
Financial Market : Security & Exchange Commission
has improved the regulatory environment of stock
exchanges, corporate bond market & leasing sector,
while Federal board of Revenue brought structural
reforms in Tax/Tariff and State bank of Pakistan has
invigorated banking sector into high return on
investment
Infrastructure : Sea ports (recently developed
Gawader port) Airports, Roads (Highways & motor
ways) , Railway to Turkey Courier services & dry ports
export zones
Information : pre-feasibility information & land
leasing facility
Foreign Investment
Greenfield foreign direct investment (FDI) for year
2008-9 by our major trade partners amounting to
US$ 3179.9 million from USA, European countries
(UK, Germany, Switzerland & Norway) Asian countries
(China, Japan, Hongkong & Korea) Gulf States (UAE &
Saudi Arabia) in oil/gas, power, chemical, textile ,
construction , communication/transportation and
financial sectors
Legislation & Trade Agreements
Foreign private investment (promotion & protection)
Act 1976 Free trade agreement with China, Malaysia
& Sri lanka, South Asian Free trade agreement and
preferential trade agreements with Iran & Maurities
Pag
e15
Pakistan has been facing many difficulties on non
economic front, which lead to further deterioration
of business climate. The issued created due to
problems such as energy crises, business closures ,
declining long term FDI has worsen by war on terror.
Direct & indirect losses of lives, properties , business
assets & loss of image made business interaction
more difficult. After global crises , our economy is in
recovery phase. Trade performance of 2009-9
witnessed unprecedented economic downturn in out
major markets of USA & EU. Consumption decreased
in developed world & global trade shrink 9% and
badly effect on exporting countries. Pakistan exports
declined by $ 17.8 billion while imports shrinkage are
13%
There is major structural change as for as product
composition & geography of trade is concerned ,
there has been explosion of non textile manufactured
exports at the global level and Pakistani exports ,
which are comprises over 54% on textile, has sharply
declined. Our competitor economies have
significantly enhanced their share in non textile
manufactured, as for as textile & clothing sectors are
concerned , the rate of growth in clothing is much
higher then textile in int. market, whereas Pakistan is
managing to keep its market share in textile to an
extent, has been slow in benefiting from expansion in
higher value clothing sector.
Source: Ministry of Finance Pakistan, State Bank of Pakistan , Ministry of Production, International Monitory Fund (IMF)

Pag
e16
Principal reason for this growing disconnect between
evolving global market structure and out export
performance is the erosion of the competitiveness of
Pakistan’s traditional exports in general and
country’s weakness in diversifying its product &
market mix.
Fundamental principals of strategic trade policy
framework , besides others are promoting private
sector, investing in human resources, opportunities
for gainful employment, export led growth by
focusing development & facilitation , despite the
challenges of energy, low labor productivity, low level
of value addition in manufacturing of goods, low FDI ,
anti export bias in taxation & increased cost of
production because of not attaining to economy
level.
Government has announced the Following measures
to affect the international commerce.
To strengthen export competitiveness , government
will compensate inland freight cost to exporters of
Cement, Light engineering, leather, Furniture,
Tile/Marble & Soda
Government will support for brand development (for
getting higher prices in int. market) for 25% of cost
for Surgical instruments, Supports goods & Cutlery
Textile support by abolishing import duty in chemicals
Sea food 6% of export value will be reimbursement
on a/c of research & development and 50% of
certification expenditures by attaining HILAL board
certification.
Pag
e17
To increase overall competitiveness, Govt. promised
to “Zero Rate” export completed, interim relief is
given to Electric machinery, Carpet/Canvas, Support
goods, Footwear, Surgical/Medical instrument,
Cutlery, Fans, Furniture, Auto parts, Handicrafts,
Pharmaceuticals
To reduce cost of doing business in Pakistan , Govt.
will ease import restrictions on specialized
machinery/ Transportation equipments/Construction
spare parts, Waste disposal plant, Oil & Petroleum
industry
To allow improved development of Pharmaceutical /
Engineering services, Govt. to ease export restrictions
on the industries.
Import of used Computer & Monitors

Pag
e18
BUDGET 2009-10 (July – Jun)
Budget of Pak Rupees 2.9 trillion, based on uncertain
external inflows , where Rs. 724 billion are proposed for
debt financing, non development expenditures Rs. 1.55
trillion (Rs. 621 billion for public sector development
program ) and defense allocation of Rs 343 billion,
Earthquake rehabilitation for Rs. 25 billion & Banazir income
support program for Rs. 70 billion
War against terror since the year 2001-2 cost US $ 35 billion
to Pakistan and 2.5 million IDP’s (internally displaced
persons) and Government has to allocate Rs. 50 billion for
their relief, rehabilitation ,reconstruction & security. We
had presented that neglecting the real sectors of economy
(Agriculture, Industry) & fueling growth through high
consumption & luxury imports financed by external
borrowing have destroy our economy and budget deficit
reached to 7.6% of GDP, run on foreign exchange reserves,
stock market crash and inflation reached to 25% which can
be reduced by reducing poverty.
Govt. has nine point agenda for economic & social recovery
Macroeconomic stability & Real sector growth
Immediate threat to economy & servicing of international
debt financing were overcome through homegrown macro
economic stability program. This program already ensured
adjustment in petroleum prices & significant cut in
expenditures to reduce deficit by elimination of under
productive subsidies.

Pag
e19
Protection the poor’s
Banazir income support program for 5 million family by
direct cash assistance , woman empowerment & child care,
Health insurance / training & employment for poor’s,
provision of electric/gas , Farm to market roads & water
supply, 12% shares to workers, 1000 houses to worker,
daughter marriage allowance & micro financing to woman’s
. low cast flats for poor population through out the country
under prime minister housing scheme
Increase productivity & Value addition in Agriculture
Fixing crop prices to farmers with international comparison,
R & D for wheat/cotton, productive use of water by
irrigation system (cemented ) export of high value crops, no
import duty on agricultural machinery/equipments , 32
small & medium dams, raising Mangla dam , Gomal dam,
Setpar dam Canal improvement (Kachi & Raine canals)
Rainwater harvesting & groundwater recharge and
construction of warehouses for storage of food grain.
Making industries internationally competitive
Capital & Finance for development
Removing infrastructure bottleneck through PPP(private public Partner)
With a view to moving industry towards consolidation &
value addition on export an investment support fund has
created, small & medium enterprises (SME) sector has
strengthen by providing credit access ,based on
Government/Private at 50:50 percent basis point, Equity
financing by venture at above ratio FDI for industrial
financing .industrial clusters are going to involved for skill
development to ensure ownership, monitoring/oversight a
relevance of program. Excise duty has reduced by 5% on

Pag
e20
automobile industry, while Rs. 200/ton reduction in cement
industry, Textile industry has given cuts on import duty of
chemical etc, certain reductions/reliefs in tax/duty/levy to
protect & revive local industries along with following
facilities ie priority to providing electricity/gas & phase wise
reduction of subsidies ,formation of large export houses /
special economic zones & special industrial zones , access to
USA & EU markets, consolidation of industries is being
proposed , holding company formation facilitation , labor
ownership relation & privatization through PPP
Integrated energy development program
Holding company creation to assume bank loan to resolve
circular debt of this sector,( specially IPP & oil/gas
companies) reinforcement of transmission & distribution
system to minimize power losses/line losses. 15 IPP’s of
2921 MW are under construction (60% will be completed in
running year) 5 rental power plants for 800 MW are
negotiated for this year, 16 Hydro power projects for 4160
MW & 2 new combined cycle power projects of 500 each &
2 hydro (Jinnah & K.Khwar) are being completed by China
Basha Dam of 4500 MW has been allocated Rs. 4000 million
& 30 No’s small/medium dams has also been funded.
Solar thermal power of 50 MW, Wind energy forms, are
being developed , production of solar cell/modules of 80
KW capacity & solar water heaters , Depreciation allowance
has been enhanced to 100% for renewable energy
Human capital development
Education, Health, Clean drinking water, Sanitation ,
Population planning & gender equality are the main sectors
which are focused in the budget, construction of basic
education school & provision of missing facilities to existing
Pag
e21
educational/health structure and construction of 3500 new
filtration plants.
Human refights ministry has established to protect &
improve human rights & reduce violations.
Governance for a just & fail system
Improved “ Governance “ is must for just & fair system. The
manner in which public institutions & officials acquire and
excess authority to shape public policy and provide public
goods/services is at the crux of the government. Political
instability , corruption, volatile law & order situation and
inadequate infrastructure have left a detrimental impact on
Pakistan & business environments. Autonomous institutions
are needed, capable of outlasting their creators & resisting
capture by individuals lusting for power & money. They
must so function as to inspire confidence , which means
that they must protect the rights of society against the
exercise of arbitrary power.

Pag
e22
MONITORY AND FISCAL POLICY MEASURES
MONITORY POLICY
Pakistan monitory policy will remain vigilant about
providing a resurgence of inflation & a durable solution to
the problem of low tax revenues , should start with early
implementation of VAT regime according to tax broadening
program , where government could collect additional
revenue of Rs. 400 billion & will mark economy less
vulnerable and provide steady flow of resources needed to
reduce poverty & developing basic infrastructure and
strengthening government ability to deal with pressing
needs of the population , meanwhile friends of Pakistan &
IMF support will mitigate risk & enable Govt. to implement
financial program. Relaxation of the fiscal policy stance,
electricity tariff increases and the rebound in oil prices will
add to inflationary pressure that monitory policy needs to
combat. Increased flexibility of the exchange rate & the
timely elimination of the bank’s provision of foreign
exchange for imports of diesel & other refined products will
improve the function of foreign currency market and make
economy more resilient to external shock and further
strengthen to reserve position.
Accelerated reforms to strengthen state bank of Pakistan
(SBP) independence & legislative amendments to increase
its supervisory powers will enhance the Monitory Policy
framework and help strengthening banking system.
MEASURES AGREED WITH INT. FINANCIAL INSTITUTIONS
Tax on Agriculture & broadening tax net to 15% of GDP
potential of new tax source (stock market & real estate)
elimination of inter-corporate circular debt
single treasury account , & transparent social safety net
Pag
e23
programming of T-bill auction & flexible exchange rate
transfer of oil import bill to inter bank market
autonomy & enforcement power of SBP & contingency plan
for problem banks by SBP
not lifting “Floor” or assistance to stock exchange with out
consultation of IMF.
Exploitation of price mechanism through revival of
commission rate system
restoration of confidence of industrial sector by single digit
interest/inflation and last not least stable exchange rate
PROJECTION FOR YEAR 2009-10
external debt will touch to 33.2 % of GDP & GDP growth
rate will raise to 5% , & CPI based inflation will come down
to 13% current account deficit 5.7% & Foreign exchange
reserves will be US $ 11.291 billion and there would be
need of external financing of US $ 8.7 billion which will be
covered by FDI US $ 4.5 billion and long/short term loan
from other international financial institutions as well as
financing from bilateral creditors for projects
End of Govt. financing by SBP so that interest rates set out
at T. Bills auctions would have to be attractive.
Government borrowing through non banking sectors
phasing out energy subsidies & revenue mobilization
through Tax policy/administrative measures & reduction in
expenditure to bring deficit down to 3.3 %
enhancing SBP regulatory capacity and avoiding public
resources to support the stock & improve monitory
management would make it possible to build int. reserves
Grand National Savings are estimated to 15.7% based on
gross capital formation 21.3% of GDP

Pag
e24
Year wise Production & Sale Data (Million Tons)
Year Production Change
% Local % Export % Total
2004-5 17.909 14.788 1.565 16.353
2005-6 20.955 17.01 16.907 14.33 1.505 -3.83 18.412
2006-7 30.251 44.36 21.034 24.41 3.188 111.83 24.223
2007-8 37.157 22.83 22.596 7.3 7.717 142.02 30.286
2008-9 41.76 12.39 19.394 -14.07 11.381 47.48 30.775
Country wise Export of Cement & Klinker (Million Tons)
Major Listed Companies (Location wise production capacity) in Million Tons
1 Attock Cement Hub 1.796 1.796
2 Bestway Cement
Hattar 1.229
4.823Chakwal 3.6
3 Charat Cement Charat 1.05
4 Dewan Hattar 1.134
5 D.G Khan Cement
Chakwal 2.11
4.221D.G. Khan 2.11
6 Flying Cement 1.26
7 Gharibwal 2.678
8 Kohat Cement Kohat 2.678
9 Lafrage Pakistan 2.048
10 Lucky Cement
Lucky 3.912
7.512Karachi 3.6
11 Maple Leaf Mianwali 3.69
12 Pioneer 2.03
CEMENT CLINKER Total
Afghanistan India Others Others
1.408 0.157 1.565
1.414 0.091 1.505
1.726 1.071 0.391 3.188
2.778 0.787 3.045 1.106 7.717
3.202 0.67 6.567 0.942 11.381
Source: Pakistan Cement Industry, Export promotion bureau of Pakistan, APCMA(All Pakistan Cement ManufacturerAssociation) , Business Recorder of Pakistan
Pag
e25
PEST ANALYSIS OF CEMENT INDUSTRY OF PAKISTAN
Political
Tax policies Excise duty has decreased Excise duty Rs 200/ton
Tax collection rates at import stage has reduced 2%
from 5% for mineral fuel & oil and inland freight
compensation
No Sales tax or custom duty on raw material/
machinery import to set up new industrial projects
GST increase to 16% from 15% & special excise duty
1% and GST on gas raised from 24 to 25% oil
regulatory authority is controlling fuel prices as per
Int. market
Electricity subsidy will be lifted phase wise for
industry only
Employment Laws
Labor policy announced to protect workers rights,
settlement of industrial disputes, labor unions
compliance of International standards , minimum
wage rate Rs 2500 & tax threshold raised from Rs
150000 to Rs 180000
Safety , Health & Environmental Regulations
Environment protection act 1997
Health policy for industrial worker
Safety for workplace regulation in industrial policy

Pag
e26
SWOT ANALYSIS OF PAKISTAN CEMENT INDUSTRY
Strength Availability of raw material & Imported plants in most
co’s Expected export growth up to $ 1 billion in year
2010 Availability of foreign loan/investment in
portfolio &new plant
Effect of GDP growth & construction of infrastructure
houses and dams, where cement industry
maintaining 21% growth ,High quality int. standard
cement , standardized laboratories Cheap labor cost
& govt. incentives Largest exporter in Asia
Weakness Cross elasticity is negligible , no brand choice to
consumer Freight cost is 20% of sale price, & high
cost of plastic bag Logistic problem cause to loose
Russian market Idle capacity and loosing economic
scale production advantage
Over supply problem may arise by induction of new
plants ,Iran & India is expanding cement industry
IMF control may ask to curtail development exp.
Threats Depressed demand may cause over supply problem
and price war between manufactures & cause
business losses
WTO ratifying & hike in Coal/oil prices may badly
effect cost of production
Opportunity
Government gives incentives to import coal firing
units Traditional growth rate is 7% which may
dramatically increase by announcement of new dams
& mega projects Sri Lanka has demanded 360000
tons annual basis South Africa have potential
demand because of new stadium

Pag
e27
One aspect of smart investment is being able to determine
weather or not company is healthy company in general and
not just this past year, we also wants to know weather stock
is really bargain or not. Stock price & dividends are good to
know but not the only pieces of information’s we need to
make sound & long term investment decision because a
good year of either does not mean that will be more, there
are several kind of ratio analysis that can be used
Before going to evaluate, first make sure that company is on
sound wicket, then try to know at what price is the stock a
good buy ?,because good company is not always a good
investment , it is good investment only when it’s share price
offers appreciation potentials.
P/E Determines weather or not stock is too expensive or good
deal commonly used and abused valuation tool, because
market gives value to company’s on their future prospects
(not past performance), historical P/E represents inaccurate
picture, but forward PE . low P/E means company is under
valued and stock is good deal, low P/E stock have higher
yield than high P/E stock ( it is far riskier to trade when
multiplies above then 20 for new company’s) P/E represents
as multiple of current EPS, but this is not always true
because leverage firm will tend to higher P/E multiple,(it is
good to use for firm with no debt) secondly economy state
(boom or recession) also play significant role,
P/EBITDA is used to compare company’s having different
amount of debts, Assets & depreciation methods , useful for
low capital intensive & high growth companies
PE Real (EV/FCF) as revealed from title, it depicts true PE
value of the stock
Pag
e28
P/BV Stock price to book value ratio, represents Shareholders
share in assets, ratio below one represents that
Shareholders are undervalued , this ratio is used for
targeting takeover, useful for capital intensive business
DCF Comprehensive valuation method, where future cash flow is
discounted at desired rate of return
EV Market Capitalization +Net Debt-(Cash & Cash Equivalents)
Widely used & acceptable but this is also misnomer because
high debt would increase it, while actually is decrease the
value of enterprise , lower EV is more attractive to takeover
EV/Revenue, gives idea to investor of how much it costs to
buy the company’s sale, lower is attractive because
company is undervalued. it is good for comparing firms in
the same industry with different capital structure, but bad
way to compare firms having higher margin than others, it
may be used where EBITDA is negative, investors do not
care about this multiple
EV/EBITDA , low return suggest poor use of company
resources even if its profit margin is high, good more to
compare firms with vary capital structure but not enough
tool because firm having insolvency problem may reflect
high value and over statement of cash flow for firms having
high Fixed Asset’s
Financial ratios contribute towards making right investment
decision but even they have their limitations , most
Financial Ratio’s rely on historical data, they do not capture
subjective issues like Management Quality, Business
Potential, Investor Friendliness & Stock Liquidity, which are
all key components for an investment decision, so one
should not rely on financial tools solely but only use them to
get closer to right stock

Pag
e29
Lucky Cement is project of Youns Brothers , having 4 Textile
& one power unit beside Lucky Cement which is comprises
over two plants at Pezu & Karachi, first plant was erected in
1993 of 1.2 MTPY and was upgraded to 1.5 MTPY in 1999 &
4 MTPY in 2003 and 2nd plant of 2.5 MTPY capacity was set
up at Karachi & an addition of new plant of 1.25 MTPA
made the company capacity up to 7.75 MTPA in the year
2009 and planning to increase to the extent of 10.27 MTPA
in 2013, along with latest infrastructure & techniques
abating cost & expanding production / sale in the local and
particularly in International
Lucky Cement is largest cement producer & Exporter in Pak.
and having largest transport fleet (77 bulker +ship loader)
and 3552 MWH/per day power plant ,and 21 No’s
Generators of 175 MW/Hr , use of industrial waste slag for
manufacturing of cement is under consideration Safety
Health & Environment policy has made company as Zero
Injury Rate
FINANCIAL HIGHLIGHTS
Values Trailing Forward Indicators Trailing Forward
Equity 23251972 75417357 Share Price 59 368
Liabilities 15140390 12282510 MVE (M) 18927 145895
Assets 38392362 87699867 P/E Multiple 4 11
Net Sales 26330404 58960161 EBITDA (M) 8366 18221
Expenses 21733855 46144632 Cost Per Ton 3806 4653
Profit 4596549 12815529 EV (Per Share) 88 232
Source: Financial Statements for the financial year(July-Jun) 2005-2009, Management vision & strategy

Pag
e30
Strengths Capacity Expansion cost per ton Rs 2748 , lowest after PCL
Largest producer in both zones , having 18% market share
Largest Exporter because of Location advantages (near see
& near border) & excellent TPT /Ship loading equipments
Further expansion plan in south zone of 2.52 MPTA(1.26
each) to bring capacity up to 9.01 MTPA to be completed in
2012 & 10.27 MTPA in 2013
Gas supply has been arranged for expansion plan
Financial arrangement through issue of GDR (London
registered) ,with dilution effect of 10-12%
SILOS Facility (loose cement terminal) at Karachi port
Captive plant at Pezu converted on gas
Waste Heat Recovery plant will completed at end of 2009
Weakness Expansion with China plant
Used plant was installed at Pezu
Interest rate in Pak will go down soon and market will boost
up but GDR traded at London market will not react
accordingly
Opportunity
Expand export to Middle East , South Africa & Sri Lanka by
Sea Expand export to Afghanistan by Road from pezu plant
Grinding facility abroad with international partners
Threats Increase in Coal & Oil prices & Currency fluctuation (world
market shift from dollar to Euro)
Expected supply glut in near future & Price war may start
Pag
e31
PRODUCTION CAPACITY & SALE VOLUME
CAPACITY The year under review , company has increased its
production capacity from 3.94 MPTA to 7.75 MPTA (million
ton per annum) and currently operating at 74% of the
capacity , and do intend to further expand its line up to
10.27 MPTA with 97% utilization level as forecasted to
meet the prospective demand which is likely to rise up to
10.33 million ton at the end of the year 2014,planed
expansion will be carried out at rate of Rs 4843/= per ton
which will be funded by the issuance of new ordinary shares
SALE keeping in view ,local & international demand the
management has decided to double its export quantity with
in projected period (20% per year) while overall increase of
75% of the base year in sale quantity (15% per year)are
planed for the next five years
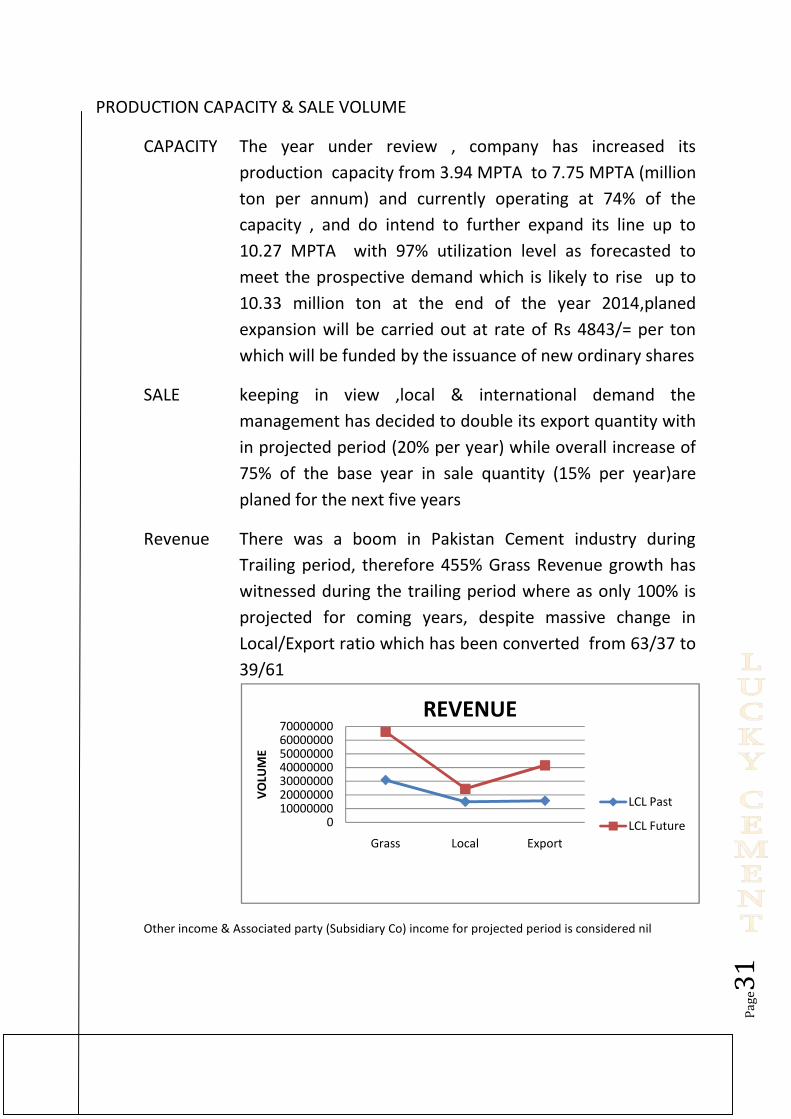
Revenue There was a boom in Pakistan Cement industry during
Trailing period, therefore 455% Grass Revenue growth has
witnessed during the trailing period where as only 100% is
projected for coming years, despite massive change in
Local/Export ratio which has been converted from 63/37 to
39/61
Other income & Associated party (Subsidiary Co) income for projected period is considered nil
010000000200000003000000040000000500000006000000070000000
Grass Local Export
VO
LUM
E
REVENUE
LCL Past
LCL Future
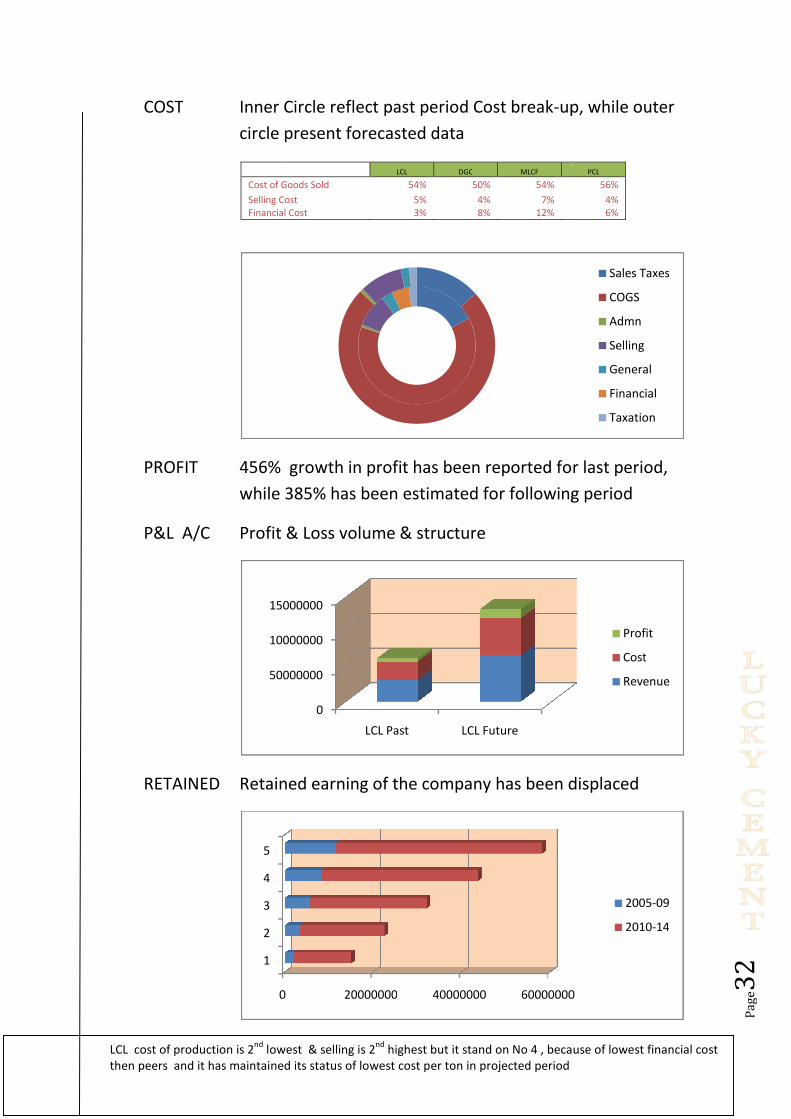
COST Inner Circle reflect past period Cost break
circle present forecasted data
PROFIT 456% growth in profit has been reported for last period,
while 385% has been estimated for following period
P&L A/C Profit & Loss volume & structure
RETAINED Retained earning of the company has been displaced
50000000
10000000
15000000
0
1
2
3
4
5
Cost of Goods Sold
Selling CostFinancial Cost
LCL cost of production is 2nd
lowest & selling is 2then peers and it has maintained its status of lowest cost per ton in projected period
Inner Circle reflect past period Cost break-up, while outer
circle present forecasted data
456% growth in profit has been reported for last period,
while 385% has been estimated for following period
& Loss volume & structure
Retained earning of the company has been displaced
0
50000000
10000000
15000000
LCL Past LCL Future
20000000 40000000 60000000
LCL DGC MLCF
Cost of Goods Sold 54% 50% 54%
Selling Cost 5% 4% 7%Financial Cost 3% 8% 12%
lowest & selling is 2nd
highest but it stand on No 4 , because of lowest financial costthen peers and it has maintained its status of lowest cost per ton in projected period
Pag
e32
up, while outer
456% growth in profit has been reported for last period,
while 385% has been estimated for following period
Retained earning of the company has been displaced
Sales Taxes
COGS
Admn
Selling
General
Financial
Taxation
Profit
Cost
Revenue
60000000
2005-09
2010-14
PCL
56%
4%6%
highest but it stand on No 4 , because of lowest financial costthen peers and it has maintained its status of lowest cost per ton in projected period
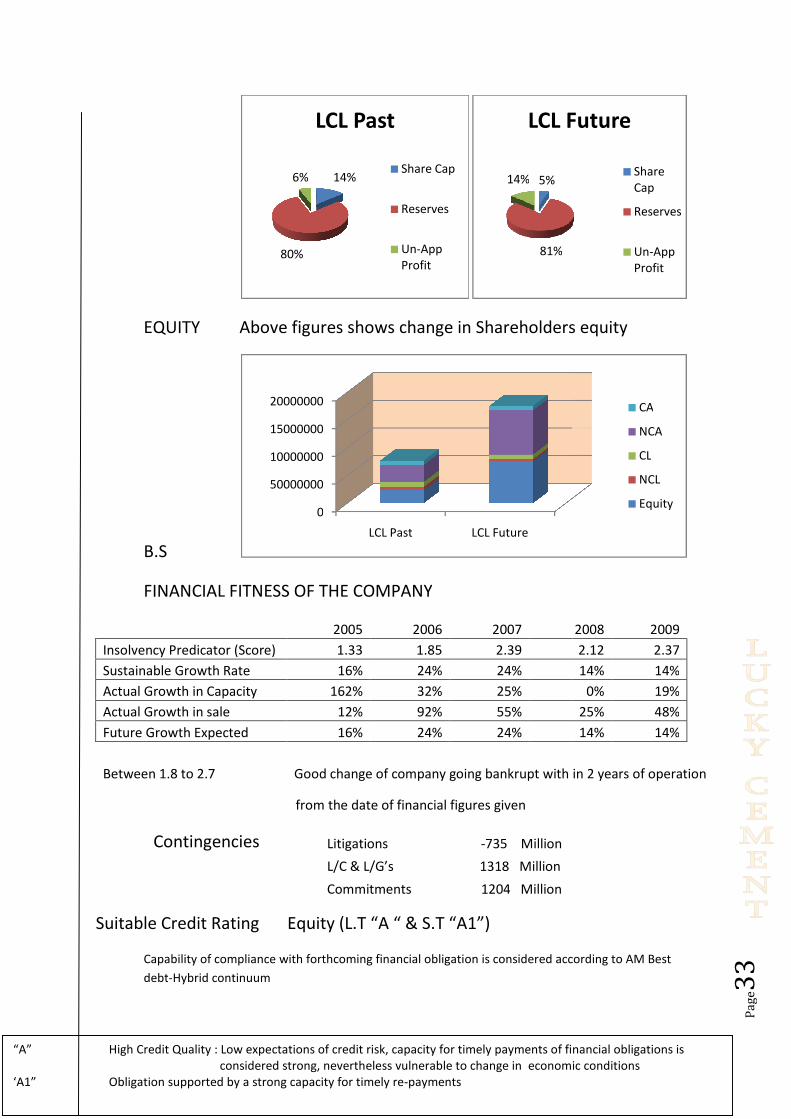
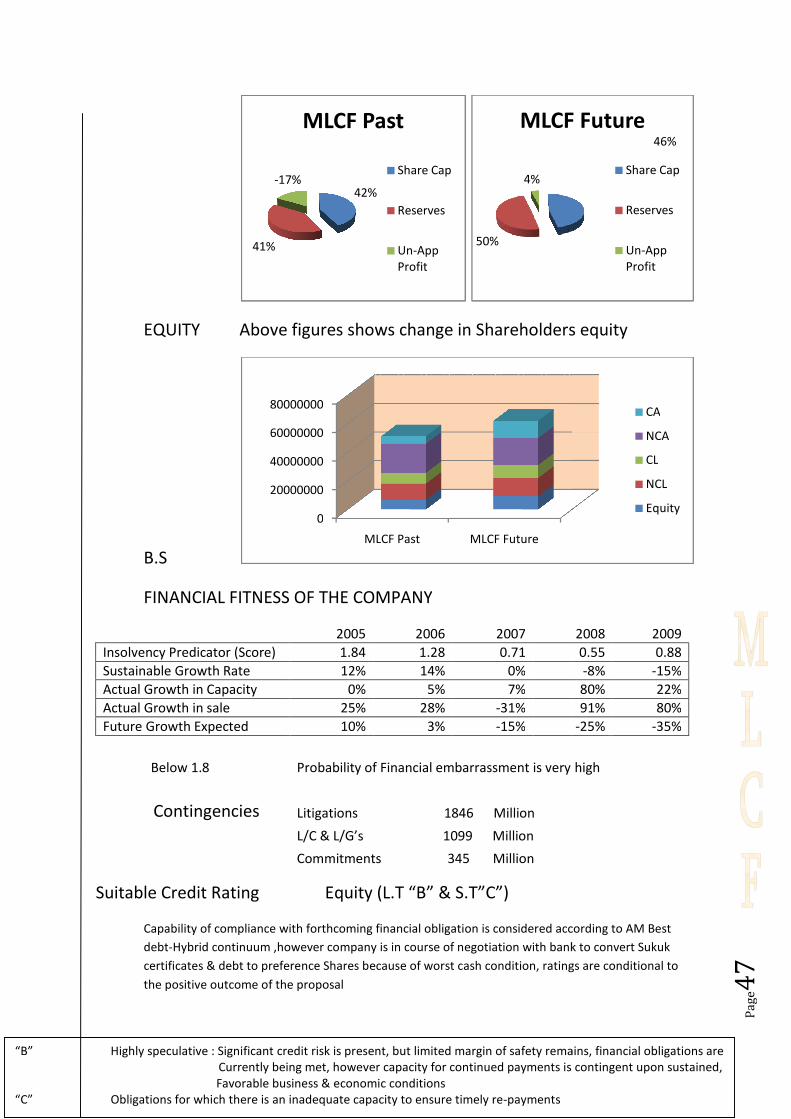
EQUITY Above figures shows change in Shareholders equity
B.S
FINANCIAL FITNESS OF THE COMPANY
Insolvency Predicator (Score)
Sustainable Growth Rate
Actual Growth in Capacity
Actual Growth in sale
Future Growth Expected
Between 1.8 to 2.7
Contingencies
Suitable Credit Rating
Capability of compliance with forthcoming financial obligation is considered according to AM Best
debt-Hybrid continuum
80%
50000000
10000000
15000000
20000000
“A” High Credit Quality : Low expectations of credit risk, capacity for timely payments of financial obligations isconsidered strong, nevertheles
‘A1” Obligation supported by a strong capacity for timely re
Above figures shows change in Shareholders equity
FINANCIAL FITNESS OF THE COMPANY
2005 2006 2007
1.33 1.85 2.39
16% 24% 24%
162% 32% 25%
12% 92% 55%
16% 24% 24%
Good change of company going bankrupt with in 2 years of operation
from the date of financial figures given
Litigations -735 Million
L/C & L/G’s 1318 Million
Commitments 1204 Million
Equity (L.T “A “ & S.T “A1”)
Capability of compliance with forthcoming financial obligation is considered according to AM Best
14%
80%
6%
LCL Past
Share Cap
Reserves
Un-AppProfit
5%
81%
14%
LCL Future
0
50000000
10000000
15000000
20000000
LCL Past LCL Future
High Credit Quality : Low expectations of credit risk, capacity for timely payments of financial obligations isconsidered strong, nevertheless vulnerable to change in economic conditions
Obligation supported by a strong capacity for timely re-payments
Pag
e33
Above figures shows change in Shareholders equity
2008 2009
2.12 2.37
14% 14%
0% 19%
25% 48%
14% 14%
Good change of company going bankrupt with in 2 years of operation
Capability of compliance with forthcoming financial obligation is considered according to AM Best
LCL Future
ShareCap
Reserves
Un-AppProfit
CA
NCA
CL
NCL
Equity
High Credit Quality : Low expectations of credit risk, capacity for timely payments of financial obligations iss vulnerable to change in economic conditions

Pag
e34
FREE CASH FLOW
2010 2011 2012 2013 2014
Rs. ,000 Rs. ,000 Rs. ,000 Rs. ,000 Rs. ,000
EBIT (1-t) 5371896 8470024 10312792 11984768 14583850
Depreciation 1163040 1163040 2392442 3636656 3636656
EBITDA 6534935 9633064 12705234 15621423 18220506
Change in Working Capital -1424583 2478435 -610900 868418 -461329
Capex 0 0 6065640 6138720 0
Free Cash Flow to Company 7959518 7154629 7250493 8614285 18681835
WACC 0 0 0 0 0
1 1 2 2 2
Present Value of Free Cash Flow 6941238 5441109 4808594 4982187 9422594
Terminal Value 164890001
PV of Terminal Value 83165894
Sum of PV of Forecasted FCF 31595722
PV of Terminal Value 83165894
Enterprise Value 114761616
Less Net Debt 4300000
Equity Value 110461616
No of Shares Outstanding 323375
Equity Value Per Share 342
SENSITIVITY ANALYSIS (Interest)
DCF Based Value Matrix Rs. Per Share
Interest Rate
Growth Rate 12% 13% 14%
4% 373 368 364
3% 345 342 338
2% 322 319 316
SENSITIVITY ANALYSIS (Exchange Rate & Prices )
DCF Based Value Matrix Rs. Per Share
prices Increase
Exchange Rate Local 5% Export 2% Sensitivity
3% 392 15%
Exchange rate & price changes in fist forecasted year followed by the basic assumptions
1 Shrinkage in local demand & start up of price war due to supply glut, may impede the production /sale and may evenhamper capacity enhancement plan ,if it persist for a long term

Pag
e35
SHORT TERM VALUATION SUMMARY
Pricing Methodology Tool Weight Value( Rs.)
Target Price using P/E Multiple 50% 89
Target Price using EV Multiple 50% 69
Weighted Average 79
Current Market Price 59
Upside/(downside) % 35
E/P & EV Multiple base value 35 which does not apply on LCL
Forward Earning Yield % 0.10
Forward Dividend Yield % 0.04
Short term horizon of 12 month, valuation is carried out by applying a special technique of inverseMultiple i.e. E/P multiple instead of P/E multiple, because 3 out of 4 companies were showing lossesIn the coming year and their EPS is negative (while 2 companies displaying negative P/E, due to currentand past year losses) therefore it does not make any sense to evaluate them with P/E multiple, hencemultiple is restated ,only for these companies, with price in the denominator (because price can never benegative) however 2
ndtool EV multiple is applied as per practice, because it was not posing likewise problem
Forward Revenue, EBITDA,PAT, EV, EPS or dividend is taken from well thought & practicable ManagementPlan, instead of presumption on historic performance of the company which does not encompass theCapacity/capability of the company neither business situation nor market demand
Valuation is based on company’s own multiples and work plan (instead of industry multiples which aredeceptive because cement in Pakistan is not mature industry but this sector is just evolving ,therefore thereIs no common practice or business methodology and every unit has unique capital structure and self
directive , hence producing mismatching results , however stock market is the best judge
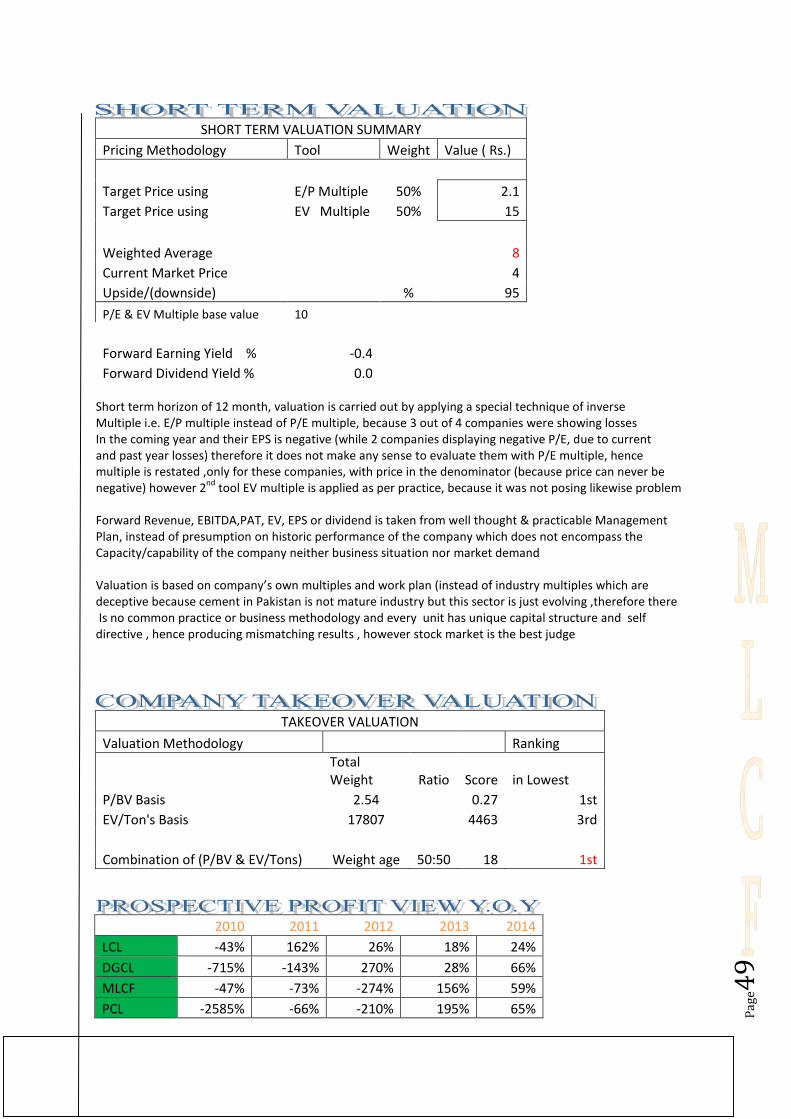
TAKEOVER VALUATION
Valuation Methodology Ranking
Total Weight Ratio Score in Lowest
P/BV Basis 2.54 0.81 3rd
EV/Ton's Basis 17807 3660 2nd
Combination of (P/BV & EV/Tons) Weight age 50:50 26 3rd
2010 2011 2012 2013 2014
LCL -43% 162% 26% 18% 24%
DGCL -715% -143% 270% 28% 66%
MLCF -47% -73% -274% 156% 59%
PCL -2585% -66% -210% 195% 65%
Pag
e36
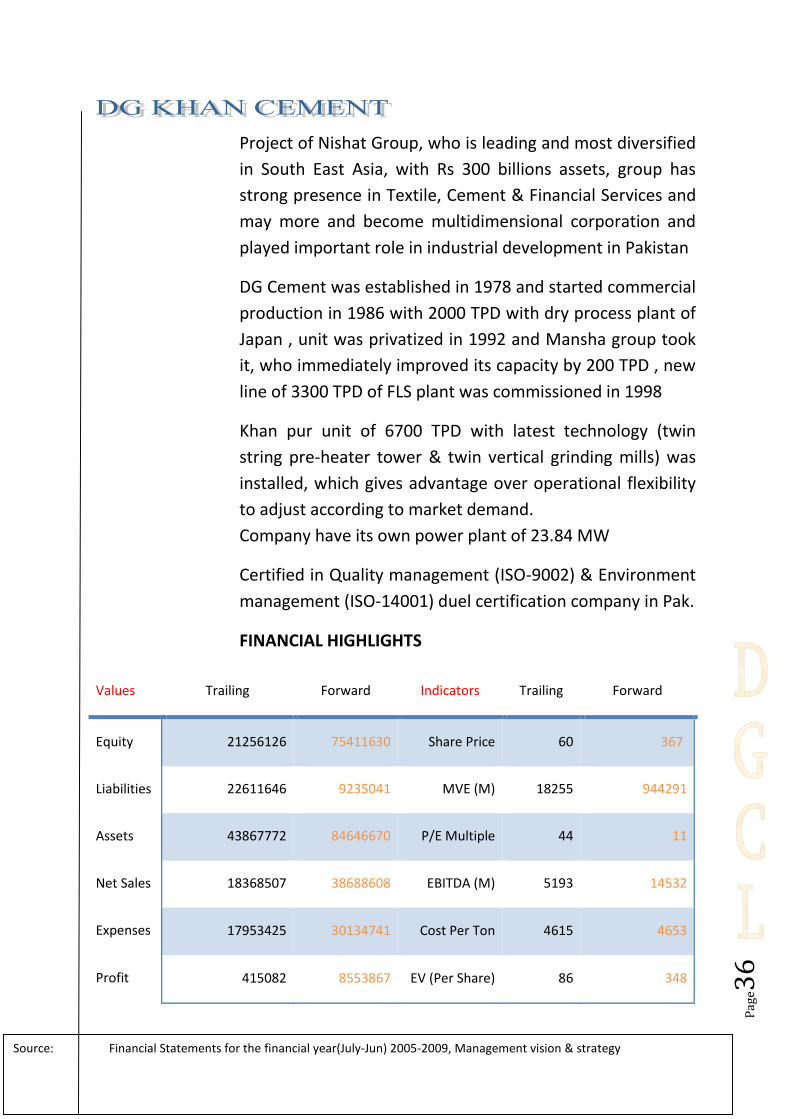
Project of Nishat Group, who is leading and most diversified
in South East Asia, with Rs 300 billions assets, group has
strong presence in Textile, Cement & Financial Services and
may more and become multidimensional corporation and
played important role in industrial development in Pakistan
DG Cement was established in 1978 and started commercial
production in 1986 with 2000 TPD with dry process plant of
Japan , unit was privatized in 1992 and Mansha group took
it, who immediately improved its capacity by 200 TPD , new
line of 3300 TPD of FLS plant was commissioned in 1998
Khan pur unit of 6700 TPD with latest technology (twin
string pre-heater tower & twin vertical grinding mills) was
installed, which gives advantage over operational flexibility
to adjust according to market demand.
Company have its own power plant of 23.84 MW
Certified in Quality management (ISO-9002) & Environment
management (ISO-14001) duel certification company in Pak.
FINANCIAL HIGHLIGHTS
Values Trailing Forward Indicators Trailing Forward
Equity 21256126 75411630 Share Price 60 367
Liabilities 22611646 9235041 MVE (M) 18255 944291
Assets 43867772 84646670 P/E Multiple 44 11
Net Sales 18368507 38688608 EBITDA (M) 5193 14532
Expenses 17953425 30134741 Cost Per Ton 4615 4653
Profit 415082 8553867 EV (Per Share) 86 348
Source: Financial Statements for the financial year(July-Jun) 2005-2009, Management vision & strategy

Pag
e37
Strengths Imported Machinery & Plant from Japan & France
Best Brand name in & outside Pakistan
Waste Heat Recovery plant of 10.4 MW
Solid waste as fuel for heating plant erection soon
Energy saving & low maintenance cost
Weakness Highest cost of Expansion & high depreciation
Opportunity
Expand export to Europe at high margin due to quality
Potential to increase product prices as compare to peers
Local & International finance facility due to strong group
Threats Increase in Coal & Oil prices & Currency fluctuation (world
market shift from dollar to Euro)
Expected supply glut in near future & Price war may start
Pag
e38
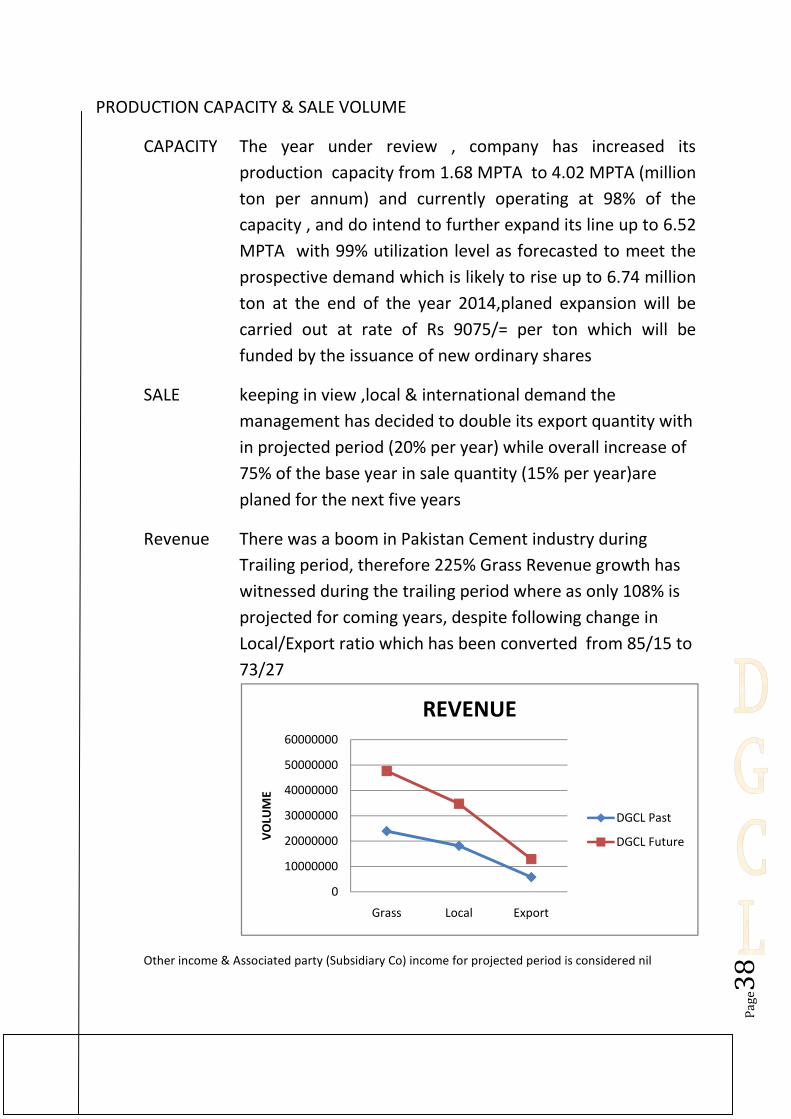
PRODUCTION CAPACITY & SALE VOLUME
CAPACITY The year under review , company has increased its
production capacity from 1.68 MPTA to 4.02 MPTA (million
ton per annum) and currently operating at 98% of the
capacity , and do intend to further expand its line up to 6.52
MPTA with 99% utilization level as forecasted to meet the
prospective demand which is likely to rise up to 6.74 million
ton at the end of the year 2014,planed expansion will be
carried out at rate of Rs 9075/= per ton which will be
funded by the issuance of new ordinary shares
SALE keeping in view ,local & international demand the
management has decided to double its export quantity with
in projected period (20% per year) while overall increase of
75% of the base year in sale quantity (15% per year)are
planed for the next five years
Revenue There was a boom in Pakistan Cement industry during
Trailing period, therefore 225% Grass Revenue growth has
witnessed during the trailing period where as only 108% is
projected for coming years, despite following change in
Local/Export ratio which has been converted from 85/15 to
73/27
Other income & Associated party (Subsidiary Co) income for projected period is considered nil
0
10000000
20000000
30000000
40000000
50000000
60000000
Grass Local Export
VO
LUM
E
REVENUE
DGCL Past
DGCL Future

COST Inner Circle reflect past period Cost break
circle present forecast
PROFIT 75% decline in profit has been reported for last period,
while Rs.8.55 Billion has been estimated for coming period
P&L A/C
RETAINED Retained earning of the company has been displaced
50000000
10000000
0
1
2
3
4
5
Cost of Goods Sold
Selling CostFinancial Cost
DGCL cost of production is low then peers but it stands on No 2, because of financial which is 8% which is 2after MLCF , however it has improved in projected period owing to shed off debt & lowering 50% depreciationrate and stands on No 4 (equal to LCL) regarding cost per ton
Inner Circle reflect past period Cost break-up, while outer
circle present forecasted data
75% decline in profit has been reported for last period,
while Rs.8.55 Billion has been estimated for coming period
Retained earning of the company has been displaced
0
50000000
10000000
DGCL Past DGCL Future
0 5000000 10000000 15000000 20000000
LCL DGC MLCF
Cost of Goods Sold 54% 50% 54%
Selling Cost 5% 4% 7%Financial Cost 3% 8% 12%
DGCL cost of production is low then peers but it stands on No 2, because of financial which is 8% which is 2F , however it has improved in projected period owing to shed off debt & lowering 50% depreciation
rate and stands on No 4 (equal to LCL) regarding cost per ton
Pag
e39
up, while outer
75% decline in profit has been reported for last period,
while Rs.8.55 Billion has been estimated for coming period
Retained earning of the company has been displaced
Sales Taxes
COGS
Admn
Selling
General
Financial
Profit
Cost
Revenue
20000000
2005-09
2010-14
PCL
56%
4%6%
DGCL cost of production is low then peers but it stands on No 2, because of financial which is 8% which is 2nd
lowF , however it has improved in projected period owing to shed off debt & lowering 50% depreciation

EQUITY Above figures shows change in Shareholders equity
B.S
FINANCIAL FITNESS OF THE COMPANY
Insolvency Predicator (Score)
Sustainable Growth Rate
Actual Growth in Capacity
Actual Growth in sale
Future Growth Expected
Below 1.8
Contingencies
Suitable Credit Rating
Capability of compliance with forthcoming financial obligation is considered according to AM Best
debt-Hybrid continuum
84%
50000000
10000000
15000000
20000000
“BBB” Good Credit Quality: Currently low expectation of credit risk, capacity for timely payments of financial obligationis considered adequate, nevertheless more vulnerable to change in economic conditions
“A3” Obligation supported by adequate capacity for timely rebusiness , economic or financial conditions
Above figures shows change in Shareholders equity
FINANCIAL FITNESS OF THE COMPANY
2005 2006 2007 2008
1.99 1.72 1.48 1.11
18% 12% 5%
12% 17% 4%
48% 49% -14%
-5% 1% -6% -
Probability of Financial embarrassment is very high
Litigations 1533 Million
L/C & L/G’s 927 Million
Commitments 1183 Million
Equity (L.T “BBB” & S.T”A3”)
Capability of compliance with forthcoming financial obligation is considered according to AM Best
14%
84%
2%
DGCL Past
Share Cap
Reserves
Un-AppProfit
65%
1%
DGCL Future
0
50000000
10000000
15000000
20000000
DGCL Past DGCL Future
Good Credit Quality: Currently low expectation of credit risk, capacity for timely payments of financial obligationis considered adequate, nevertheless more vulnerable to change in economic conditions
Obligation supported by adequate capacity for timely re-payments, however susceptible to adverse change inancial conditions
Pag
e40
Above figures shows change in Shareholders equity
2008 2009
1.11 1.30
0% 2%
97% 0%
86% 37%
-17% -22%
Probability of Financial embarrassment is very high
Capability of compliance with forthcoming financial obligation is considered according to AM Best
34%
DGCL Future
ShareCap
Reserves
Un-AppProfit
CA
NCA
CL
NCL
Equity
Good Credit Quality: Currently low expectation of credit risk, capacity for timely payments of financial obligationis considered adequate, nevertheless more vulnerable to change in economic conditions
payments, however susceptible to adverse change in

Pag
e41
FREE CASH FLOW
2010 2011 2012 2013 2014
Rs. ,000 Rs. ,000 Rs. ,000 Rs. ,000 Rs. ,000
EBIT (1-t) 1278509 2025352 5018726 6224809 9679709
Depreciation 852748 2814545 2814545 4852673 4852673
EBITDA 2131257 4839897 7833271 11077482 14532382
Change in Working Capital 8284740 -882044 8753774 -7796234 -6507672
Capex 0 11137500 0 11550000 0
Free Cash Flow to Company-
6153483 -5415559 -920502 7323716 21040054
WACC 0.138533 0.138533 0.138533 0.138533 0.1385326
113.85% 129.62% 147.57% 168.01% 191.28%
Present Value of Free Cash Flow-
5404904 -4178085 -623772 4359125 10999721
Terminal Value 199675081
PV of Terminal Value 104389951
Sum of PV of Forecasted FCF 5152086
PV of Terminal Value 104389951
Enterprise Value 109542037
Less Net Debt 9600018
Equity Value 99942019
No of Shares Outstanding 304249
Equity Value Per Share 328
SENSITIVITY ANALYSIS (Interest)
DCF Based Value Matrix Rs. Per Share
Interest Rate
Growth Rate 13% 14% 15%
4% 379 367 356
3% 338 328 319
2% 305 296 288
SENSITIVITY ANALYSIS (Exchange Rate & Prices )
DCF Based Value Matrix Rs. Per Share
prices Increase
Exchange Rate Local 5% Export 2% Sensitivity
3% 403 23%
Exchange rate & price changes in fist forecasted year followed by the basic assumptions
1 Shrinkage in local demand & start up of price war due to supply glut, may impede the production /sale and may evenhamper capacity enhancement plan ,if it persist for a long term

Pag
e42
SHORT TERM VALUATION SUMMARY
Pricing Methodology Tool Weight Value (Rs.)
Target Price using E/P Multiple 50% -0.04
Target Price using EV Multiple 50% 8
Weighted Average 4
Current Market Price 64
Upside/(downside) % -94
P/E & EV Multiple base value -36
Forward Earning Yield % -0.5
Forward Dividend Yield % 0.0
Short term horizon of 12 month, valuation is carried out by applying a special technique of inverseMultiple i.e. E/P multiple instead of P/E multiple, because 3 out of 4 companies were showing lossesIn the coming year and their EPS is negative (while 2 companies displaying negative P/E, due to currentand past year losses) therefore it does not make any sense to evaluate them with P/E multiple, hencemultiple is restated ,only for these companies, with price in the denominator (because price can never benegative) however 2
ndtool EV multiple is applied as per practice, because it was not posing likewise problem
Forward Revenue, EBITDA,PAT, EV, EPS or dividend is taken from well thought & practicable ManagementPlan, instead of presumption on historic performance of the company which does not encompass theCapacity/capability of the company neither business situation nor market demand
Valuation is based on company’s own multiples and work plan (instead of industry multiples which aredeceptive because cement in Pakistan is not mature industry but this sector is just evolving ,therefore thereIs no common practice or business methodology and every unit has unique capital structure and self
directive , hence producing mismatching results , however stock market is the best judge
TAKEOVER VALUATION
Valuation Methodology Ranking
TotalWeight Ratio Score in Lowest
P/BV Basis 2.54 0.86 4th
EV/Ton's Basis 17807 6539 4th
Combination of (P/BV & EV/Tons) Weight age 50:50 35 4th
2010 2011 2012 2013 2014
LCL -43% 162% 26% 18% 24%
DGCL -715% -143% 270% 28% 66%
MLCF -47% -73% -274% 156% 59%
PCL -2585% -66% -210% 195% 65%
Heavy loss of 2.55 billion and issuance of 1.113 billion new shares has badly affected on EPS
Pag
e43
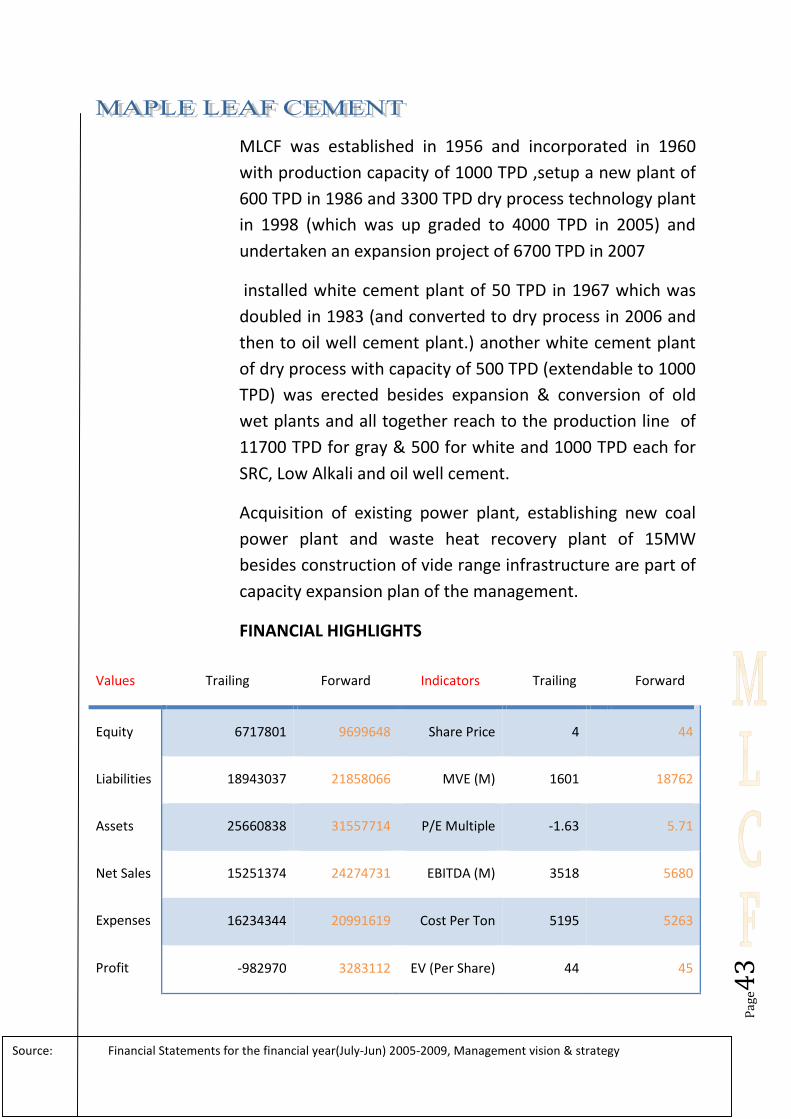
MLCF was established in 1956 and incorporated in 1960
with production capacity of 1000 TPD ,setup a new plant of
600 TPD in 1986 and 3300 TPD dry process technology plant
in 1998 (which was up graded to 4000 TPD in 2005) and
undertaken an expansion project of 6700 TPD in 2007
installed white cement plant of 50 TPD in 1967 which was
doubled in 1983 (and converted to dry process in 2006 and
then to oil well cement plant.) another white cement plant
of dry process with capacity of 500 TPD (extendable to 1000
TPD) was erected besides expansion & conversion of old
wet plants and all together reach to the production line of
11700 TPD for gray & 500 for white and 1000 TPD each for
SRC, Low Alkali and oil well cement.
Acquisition of existing power plant, establishing new coal
power plant and waste heat recovery plant of 15MW
besides construction of vide range infrastructure are part of
capacity expansion plan of the management.
FINANCIAL HIGHLIGHTS
Values Trailing Forward Indicators Trailing Forward
Equity 6717801 9699648 Share Price 4 44
Liabilities 18943037 21858066 MVE (M) 1601 18762
Assets 25660838 31557714 P/E Multiple -1.63 5.71
Net Sales 15251374 24274731 EBITDA (M) 3518 5680
Expenses 16234344 20991619 Cost Per Ton 5195 5263
Profit -982970 3283112 EV (Per Share) 44 45
Source: Financial Statements for the financial year(July-Jun) 2005-2009, Management vision & strategy
Pag
e44
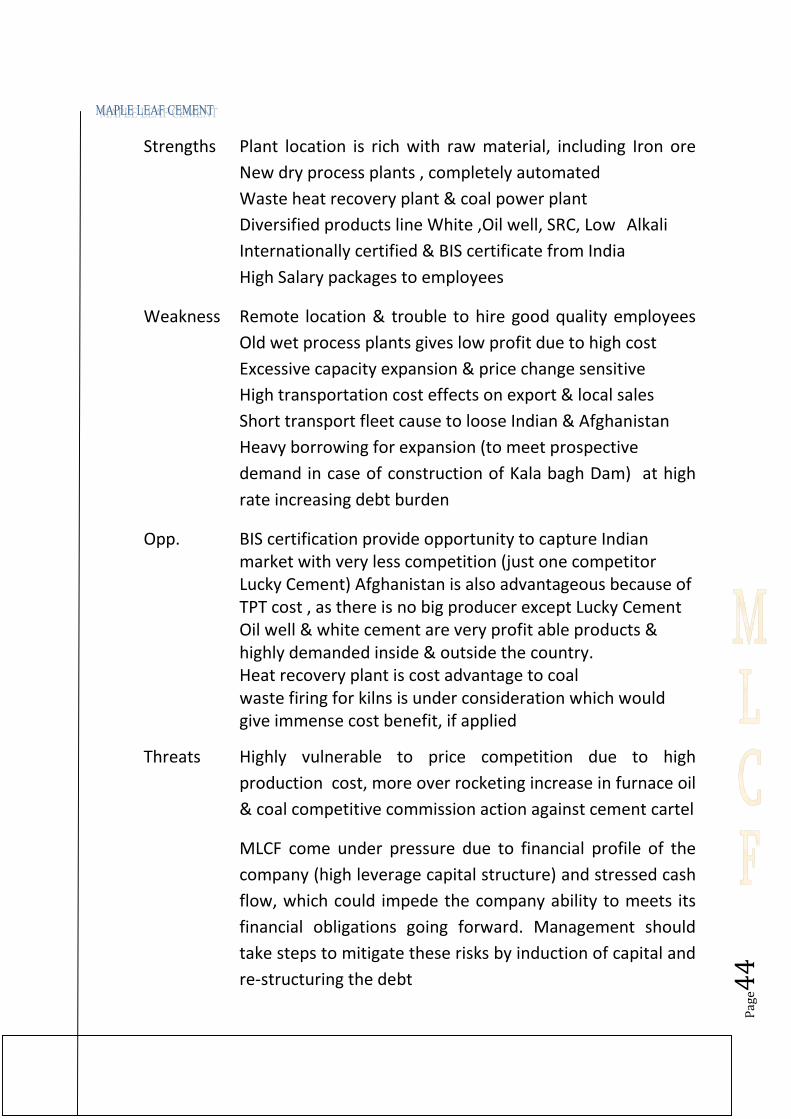
Strengths Plant location is rich with raw material, including Iron ore
New dry process plants , completely automated
Waste heat recovery plant & coal power plant
Diversified products line White ,Oil well, SRC, Low Alkali
Internationally certified & BIS certificate from India
High Salary packages to employees
Weakness Remote location & trouble to hire good quality employees
Old wet process plants gives low profit due to high cost
Excessive capacity expansion & price change sensitive
High transportation cost effects on export & local sales
Short transport fleet cause to loose Indian & Afghanistan
Heavy borrowing for expansion (to meet prospective
demand in case of construction of Kala bagh Dam) at high
rate increasing debt burden
Opp. BIS certification provide opportunity to capture Indianmarket with very less competition (just one competitorLucky Cement) Afghanistan is also advantageous because ofTPT cost , as there is no big producer except Lucky CementOil well & white cement are very profit able products &highly demanded inside & outside the country.Heat recovery plant is cost advantage to coalwaste firing for kilns is under consideration which wouldgive immense cost benefit, if applied
Threats Highly vulnerable to price competition due to high
production cost, more over rocketing increase in furnace oil
& coal competitive commission action against cement cartel
MLCF come under pressure due to financial profile of the
company (high leverage capital structure) and stressed cash
flow, which could impede the company ability to meets its
financial obligations going forward. Management should
take steps to mitigate these risks by induction of capital and
re-structuring the debt
Pag
e45
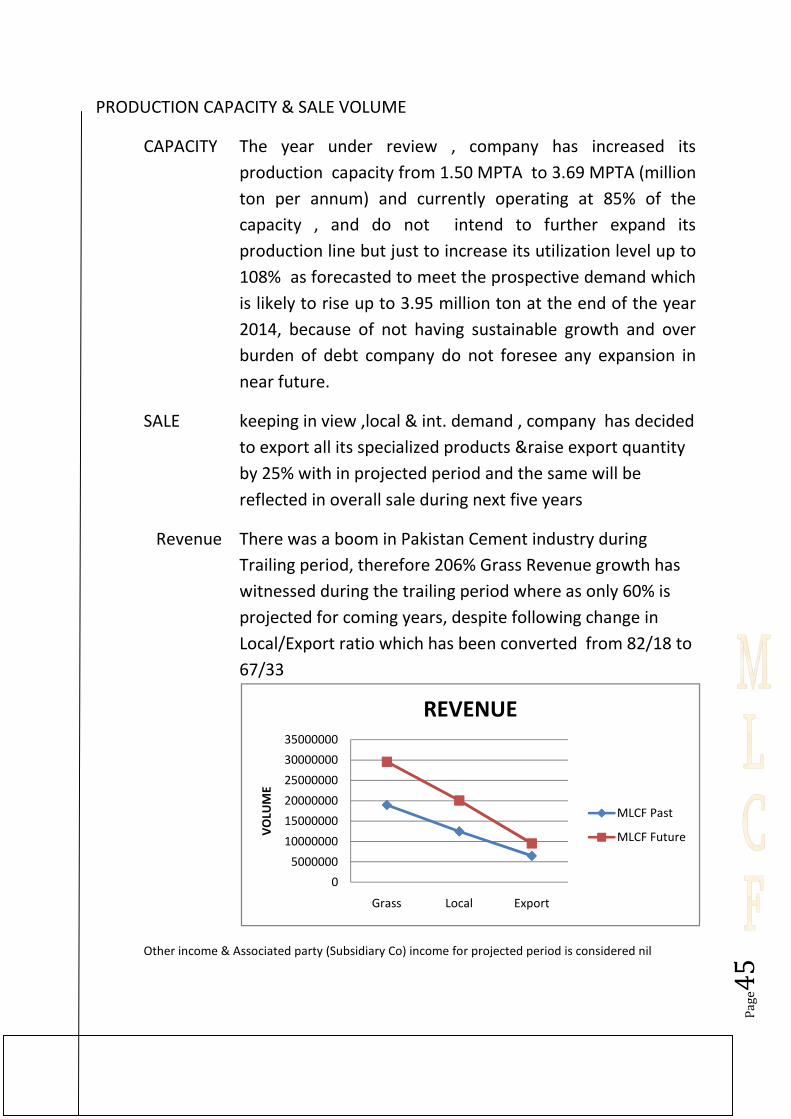
PRODUCTION CAPACITY & SALE VOLUME
CAPACITY The year under review , company has increased its
production capacity from 1.50 MPTA to 3.69 MPTA (million
ton per annum) and currently operating at 85% of the
capacity , and do not intend to further expand its
production line but just to increase its utilization level up to
108% as forecasted to meet the prospective demand which
is likely to rise up to 3.95 million ton at the end of the year
2014, because of not having sustainable growth and over
burden of debt company do not foresee any expansion in
near future.
SALE keeping in view ,local & int. demand , company has decided
to export all its specialized products &raise export quantity
by 25% with in projected period and the same will be
reflected in overall sale during next five years
Revenue There was a boom in Pakistan Cement industry during
Trailing period, therefore 206% Grass Revenue growth has
witnessed during the trailing period where as only 60% is
projected for coming years, despite following change in
Local/Export ratio which has been converted from 82/18 to
67/33
Other income & Associated party (Subsidiary Co) income for projected period is considered nil
0
5000000
10000000
15000000
20000000
25000000
30000000
35000000
Grass Local Export
VO
LUM
E
REVENUE
MLCF Past
MLCF Future

COST Inner Circle reflect past period Cost break
Circle present forecasted data
PROFIT 235% decline in profit has been reported for last period,
while Rs.2.76 Billion has been estimated for coming period
P&L A/C
RETAINED Retained earning of the company has been displaced
-2000000
20000000
40000000
60000000
-2000000
Cost of Goods Sold
Selling CostFinancial Cost
MLCF cost is very high , as reflected in table because of financial which is 12% & selling cost which is 7% ,despitelowering 25% depreciation rate in projected period, it still stands on highest cost per ton
Inner Circle reflect past period Cost break-up, while outer
ircle present forecasted data.
235% decline in profit has been reported for last period,
while Rs.2.76 Billion has been estimated for coming period
ained earning of the company has been displaced
2000000
0
20000000
40000000
60000000
MLCF Past MLCF Future
2000000-1000000 0 1000000200000030000004000000
1
2
3
4
5
LCL DGC MLCF
Cost of Goods Sold 54% 50% 54%
Selling Cost 5% 4% 7%Financial Cost 3% 8% 12%
MLCF cost is very high , as reflected in table because of financial which is 12% & selling cost which is 7% ,despitelowering 25% depreciation rate in projected period, it still stands on highest cost per ton
Pag
e46
up, while outer
235% decline in profit has been reported for last period,
while Rs.2.76 Billion has been estimated for coming period
ained earning of the company has been displaced
Sales Taxes
COGS
Admn
Selling
General
Financial
Taxation
Profit
Cost
Revenue
4000000
2005-09
2010-14
PCL
56%
4%6%
MLCF cost is very high , as reflected in table because of financial which is 12% & selling cost which is 7% ,despitelowering 25% depreciation rate in projected period, it still stands on highest cost per ton
EQUITY Above figures
B.S
FINANCIAL FITNESS OF THE COMPANY
Insolvency Predicator (Score)
Sustainable Growth Rate
Actual Growth in Capacity
Actual Growth in sale
Future Growth Expected
Below 1.8
Contingencies
Suitable Credit Rating
Capability of compliance with forthcoming financial obligation is considered according to AM Best
debt-Hybrid continuum ,however company is in course of negotiation with bank to convert Sukuk
certificates & debt to preference Shares because of worst cash c
the positive outcome of the proposal
41%
-17%
20000000
40000000
60000000
80000000
“B” Highly speculative : Significant credit risk is present, but limited margin of safety remains, financial obligations areCurrently being met, however capacity for continued paymentFavorable business & economic conditions
“C” Obligations for which there is an inadequate capacity to ensure timely re
Above figures shows change in Shareholders equity
FINANCIAL FITNESS OF THE COMPANY
2005 2006 2007
1.84 1.28 0.71
12% 14% 0%
0% 5% 7%
25% 28% -31%
10% 3% -15%
Probability of Financial embarrassment is very
Litigations 1846 Million
L/C & L/G’s 1099 Million
Commitments 345 Million
Equity (L.T “B” & S.T”C”)
Capability of compliance with forthcoming financial obligation is considered according to AM Best
,however company is in course of negotiation with bank to convert Sukuk
certificates & debt to preference Shares because of worst cash condition, ratings are conditional to
outcome of the proposal
42%17%
MLCF Past
Share Cap
Reserves
Un-AppProfit
50%
4%
MLCF Future
0
20000000
40000000
60000000
80000000
MLCF Past MLCF Future
Highly speculative : Significant credit risk is present, but limited margin of safety remains, financial obligations areCurrently being met, however capacity for continued payments is contingent upon sustained,Favorable business & economic conditions
Obligations for which there is an inadequate capacity to ensure timely re-payments
Pag
e47
shows change in Shareholders equity
2008 2009
0.55 0.88
-8% -15%
80% 22%
91% 80%
-25% -35%
high
Capability of compliance with forthcoming financial obligation is considered according to AM Best
,however company is in course of negotiation with bank to convert Sukuk
ondition, ratings are conditional to
46%
MLCF Future
Share Cap
Reserves
Un-AppProfit
CA
NCA
CL
NCL
Equity
Highly speculative : Significant credit risk is present, but limited margin of safety remains, financial obligations ares is contingent upon sustained,

Pag
e48
FREE CASH FLOW
2010 2011 2012 2013 2014
Rs. ,000 Rs. ,000 Rs. ,000 Rs. ,000 Rs. ,000
EBIT (1-t) 590931 1678877 2778110 3870448 4935068
Depreciation 745423 745423 745423 745423 745423
EBITDA 1336355 2424300 3523534 4615872 5680492
Change in Working Capital 2163476 1460108 914378 -274039 2604216
Capex 0 0 0 0 0
Free Cash Flow to Company -827122 964192 2609156 4889910 3076275
WACC 0.124296 0.124296 0.124296 0.124296 0.1242956
1 1 1 2 2
Present Value of Free Cash Flow -735677 762779 1835918 3060357 1712435
Terminal Value 33602447
PV of Terminal Value 18705092
Sum of PV of Forecasted FCF 6635813
PV of Terminal Value 18705092
Enterprise Value 25340905
Less Net Debt 10455503
Equity Value 14885402
No of Shares Outstanding 372263
Equity Value Per Share 40
SENSITIVITY ANALYSIS (Interest)
DCF Based Value Matrix Rs. Per Share
Interest Rate
Growth Rate 14% 15% 16%
4% 51 46 43
3% 43 40 37
2% 38 35 32
SENSITIVITY ANALYSIS (Exchange Rate & Prices )
DCF Based Value Matrix Rs. Per Share
prices Increase
Exchange Rate Local 5% Export 2% Sensitivity
3% 68 70%
Exchange rate & price changes in fist forecasted year followed by the basic assumptions
1 Shrinkage in local demand & start up of price war due to supply glut, may impede the production /sale and mayeven hamper capacity enhancement plan ,if it persist for a long term
2 Inability to shed off debt may cause severe threat to the company
Pag
e49
SHORT TERM VALUATION SUMMARY
Pricing Methodology Tool Weight Value ( Rs.)
Target Price using E/P Multiple 50% 2.1
Target Price using EV Multiple 50% 15
Weighted Average 8
Current Market Price 4
Upside/(downside) % 95
P/E & EV Multiple base value 10
Forward Earning Yield % -0.4
Forward Dividend Yield % 0.0
Short term horizon of 12 month, valuation is carried out by applying a special technique of inverseMultiple i.e. E/P multiple instead of P/E multiple, because 3 out of 4 companies were showing lossesIn the coming year and their EPS is negative (while 2 companies displaying negative P/E, due to currentand past year losses) therefore it does not make any sense to evaluate them with P/E multiple, hencemultiple is restated ,only for these companies, with price in the denominator (because price can never benegative) however 2
ndtool EV multiple is applied as per practice, because it was not posing likewise problem
Forward Revenue, EBITDA,PAT, EV, EPS or dividend is taken from well thought & practicable ManagementPlan, instead of presumption on historic performance of the company which does not encompass theCapacity/capability of the company neither business situation nor market demand
Valuation is based on company’s own multiples and work plan (instead of industry multiples which aredeceptive because cement in Pakistan is not mature industry but this sector is just evolving ,therefore thereIs no common practice or business methodology and every unit has unique capital structure and self
directive , hence producing mismatching results , however stock market is the best judge
TAKEOVER VALUATION
Valuation Methodology Ranking
TotalWeight Ratio Score in Lowest
P/BV Basis 2.54 0.27 1st
EV/Ton's Basis 17807 4463 3rd
Combination of (P/BV & EV/Tons) Weight age 50:50 18 1st
2010 2011 2012 2013 2014
LCL -43% 162% 26% 18% 24%
DGCL -715% -143% 270% 28% 66%
MLCF -47% -73% -274% 156% 59%
PCL -2585% -66% -210% 195% 65%

Pag
e50
PCL was incorporated in 1986 as medium size company and
commenced its operation with 2000 TPD in the year 2005
and carried out BMR to increase its capacity by 350 TPD and
then additional line of 4300 TPD was commissioned in
2006, bringing al together its capacity to 1.995 MTPA
company have completed its plants at very low cost as
compare to its peer, which gives him advantages of low
financial cost as well as low depreciation cost, hence it is
competing the giant units despite small unit
Company have converted its firing system from oil to coal
Management is very cautious to SHE (Safety, Health &
environment) as well as Social responsibility , therefore
installed number of equipments to control dust/gaseous /
noise and tree plantations. Comprehensive safety measures
and workers health plan
Company is very generous for the welfare of the community
as well ,therefore running several educational/health/
training and financial assistant projects in the area.
FINANCIAL HIGHLIGHTS
Values Trailing Forward Indicators Trailing Forward
Equity 4581430 3226858 Share Price 14 144
Liabilities 5766304 11258043 MVE (M) 2710 28733
Assets 10347734 14484902 P/E Multiple 75 18
Net Sales 5000235 11038258 EBITDA (M) 1244 3191
Expenses 4964121 9424807 Cost Per Ton 4360 4811
Profit 36114 1613451 EV (Per Share) 31 114
Source: Financial Statements for the financial year(July-Jun) 2005-2009, Management vision & strategy

Pag
e51
Strengths low cost on plant & equipments
Environment Management System ISO 14001 Certified &
QMS (ISO-9001) certified
Opportunity Centrally location to cover lower Punjab and beat/
compete the peers over inland freight cost (which are very
high in Pak)
Weakness Secondhand plant
Threats Expected supply glut in near future & Price war may start ,
which is for the company because of not having benefits of
economy scale production.
PCL planned acquisition of the majority ownership by Vision
Holding Middle East Ltd, who should immediately move
towards the following steps
strengthening capital structure and assembling a cohesive
and competent management team & implementation of an
effective business strategy

Pag
e52
PRODUCTION CAPACITY & SALE VOLUME
CAPACITY The year under review , company has increased its
production capacity from 0.705 MPTA to 1.99 MPTA
(million ton per annum) and currently operating at 57% of
the capacity , and do not intend to further expand its
production line but just to increase its utilization level up to
98% as forecasted to meet the prospective demand which
is likely to rise up to 2.04 million ton at the end of the year
2014, because of not having sustainable growth and capital
as well as debt constraints company do not foresee any
expansion in near future.
SALE keeping in view ,local & int. demand company has decided
to double its export quantity with in projected period (20%
per year) while overall increase of 75% of the base year in
sale quantity (15% per year)are planed for next five years
Revenue There was a boom in Pakistan Cement industry during
Trailing period, therefore 139% Grass Revenue growth has
witnessed during the trailing period where as only 109% is
projected for coming years, despite following change in
Local/Export ratio which has been converted from 85/15 to
79/21
Other income & Associated party (Subsidiary Co) income for projected period is considered nil
0
2000000
4000000
6000000
8000000
10000000
12000000
14000000
16000000
Grass Local Export
VO
LUM
E
REVENUE
PCL Past
PCL Future

COST Inner Circle reflect past period Cost break
circle present forecasted data
PROFIT 89% decline in profit has been reported for last period,
while Rs.1.61 Billion has been estimated for coming period
P&L A/C
RETAINED Retained earning of the company has been displaced
5000000
10000000
15000000
20000000
25000000
30000000
-1000000
Cost of Goods Sold
Selling CostFinancial Cost
PCL production cost is higher then its peers ,despite low depreciation cost (due to low cost plant) but stands onNo 3 , because of low financial which is 6% & selling cost which is 4% ,but it moves up to No 2 in projected periodwhich is bad indicator of company performance
Inner Circle reflect past period Cost break-up, while outer
circle present forecasted data
decline in profit has been reported for last period,
while Rs.1.61 Billion has been estimated for coming period
Retained earning of the company has been displaced
0
5000000
10000000
15000000
20000000
25000000
30000000
PCL Past PCL Future
1000000 -500000 0 500000 1000000
1
2
3
4
5
LCL DGC MLCF
Cost of Goods Sold 54% 50% 54%
Selling Cost 5% 4% 7%Financial Cost 3% 8% 12%
PCL production cost is higher then its peers ,despite low depreciation cost (due to low cost plant) but stands onNo 3 , because of low financial which is 6% & selling cost which is 4% ,but it moves up to No 2 in projected period
company performance
Pag
e53
up, while outer
decline in profit has been reported for last period,
while Rs.1.61 Billion has been estimated for coming period
Retained earning of the company has been displaced
Sales Taxes
COGS
Admn
Selling
General
Financial
Profit
Cost
Revenue
1000000
2005-09
2010-14
PCL
56%
4%6%
PCL production cost is higher then its peers ,despite low depreciation cost (due to low cost plant) but stands onNo 3 , because of low financial which is 6% & selling cost which is 4% ,but it moves up to No 2 in projected period

EQUITY Above figures shows change in
B.S
FINANCIAL FITNESS OF THE COMPANY
Insolvency Predicator (Score)
Sustainable Growth Rate
Actual Growth in Capacity
Actual Growth in sale
Future Growth Expected
Below 1.8
Contingencies
Suitable Credit Rating
Capability of compliance with forthcoming financial obligation is considered according to AM Best
debt-Hybrid continuum
6% 11%
5000000
10000000
15000000
20000000
25000000
30000000
“BB” Speculative : Possibility of credit risk is developi“A3” Obligation supported by adequate capacity for timely re
business , economic or financial conditions
Above figures shows change in Shareholders equity
FINANCIAL FITNESS OF THE COMPANY
2005 2006 2007 2008
0.84 1.61 1.01
20% 29% -4%
-53% 183% 0%
-44% 48% 12%
20% 29% -4%
Probability of Financial embarrassment is very high
Litigations -322 Million
L/C & L/G’s 14 MillionCommitments 22 Million
Equity (L.T “BB” & S.T”A3”)
Capability of compliance with forthcoming financial obligation is considered according to AM Best
83%
11%
PCL Past
Share Cap
Reserves
Un-AppProfit
29%9%
PCL Future
0
5000000
10000000
15000000
20000000
25000000
30000000
PCL Past PCL Future
Speculative : Possibility of credit risk is developing, this is not an investment gradeObligation supported by adequate capacity for timely re-payments, however susceptible to adverse change inbusiness , economic or financial conditions
Pag
e54
Shareholders equity
2008 2009
0.77 0.73
-8% 2%
0% 0%
42% 1%
-8% 2%
Probability of Financial embarrassment is very high
Capability of compliance with forthcoming financial obligation is considered according to AM Best
62%
PCL Future
Share Cap
Reserves
Un-AppProfit
CA
NCA
CL
NCL
Equity
payments, however susceptible to adverse change in

Pag
e55
FREE CASH FLOW
2010 2011 2012 2013 2014
Rs.,000 Rs. ,000 Rs. ,000 Rs. ,000 Rs. ,000
EBIT (1-t) 19005 671382 1365134 2078347 2784390
Depreciation 406547 406547 406547 406547 406547
EBITDA 425552 1077928 1771681 2484894 3190936
Change in Working Capital-
551095 286492 1015103-
1912332 -14796
Capex 0 0 0 0 0
Free Cash Flow to Company 976647 791436 756578 4397226 3205732
WACC 0.1256 0.1256 0.1256 0.1256 0.1256
1 1 1 2 2
Present Value of Free Cash Flow 867668 624666 530520 2739318 1774217
Terminal Value 34545407
PV of Terminal Value 19119208
Sum of PV of Forecasted FCF 6536389
PV of Terminal Value 19119208
Enterprise Value 25655597
Less Net Debt 3198701
Equity Value 22456896
No of Shares Outstanding 199532
Equity Value Per Share 113
SENSITIVITY ANALYSIS (Interest)
DCF Based Value Matrix Rs. Per Share
Interest Rate
Growth Rate 14% 15% 16%
4% 132 125 118
3% 118 113 107
2% 108 103 98
SENSITIVITY ANALYSIS (Exchange Rate & Prices )
DCF Based Value Matrix Rs. Per Share
prices Increase
Exchange Rate Local 5% Export 2% Sensitivity
3% 135 19%
Exchange rate & price changes in fist forecasted year followed by the basic assumptions
1 Shrinkage in local demand & start up of price war due to supply glut, may impede the production /sale and may evenhamper capacity enhancement plan ,if it persist for a long term
2 Inability to shed off debt may cause severe threat to the company

Pag
e56
SHORT TERM VALUATION SUMMARY
Pricing Methodology Tool Weight Value ( Rs.)
Target Price using E/P Multiple 50% -0.1
Target Price using EV Multiple 50% 11
Weighted Average 5
Current Market Price 13
Upside/(downside) % -60
P/E & EV Multiple base value -163
Forward Earning Yield % -0.8
Forward Dividend Yield % 0.0Short term horizon of 12 month, valuation is carried out by applying a special technique of inverseMultiple i.e. E/P multiple instead of P/E multiple, because 3 out of 4 companies were showing lossesIn the coming year and their EPS is negative (while 2 companies displaying negative P/E, due to currentand past year losses) therefore it does not make any sense to evaluate them with P/E multiple, hencemultiple is restated ,only for these companies, with price in the denominator (because price can never benegative) however 2
ndtool EV multiple is applied as per practice, because it was not posing likewise problem
Forward Revenue, EBITDA,PAT, EV, EPS or dividend is taken from well thought & practicable ManagementPlan, instead of presumption on historic performance of the company which does not encompass theCapacity/capability of the company neither business situation nor market demand
Valuation is based on company’s own multiples and work plan (instead of industry multiples which aredeceptive because cement in Pakistan is not mature industry but this sector is just evolving ,therefore thereIs no common practice or business methodology and every unit has unique capital structure and self
directive , hence producing mismatching results , however stock market is the best judge
TAKEOVER VALUATION
Valuation Methodology Ranking
TotalWeight Ratio Score in Lowest
P/BV Basis 2.54 0.59 2nd
EV/Ton's Basis 17807 3145 1st
Combination of (P/BV & EV/Tons) Weight age 50:50 20 2nd
2010 2011 2012 2013 2014
LCL -43% 162% 26% 18% 24%
DGCL -715% -143% 270% 28% 66%
MLCF -47% -73% -274% 156% 59%
PCL -2585% -66% -210% 195% 65%
Heaviest lost of the company history has worsen its position
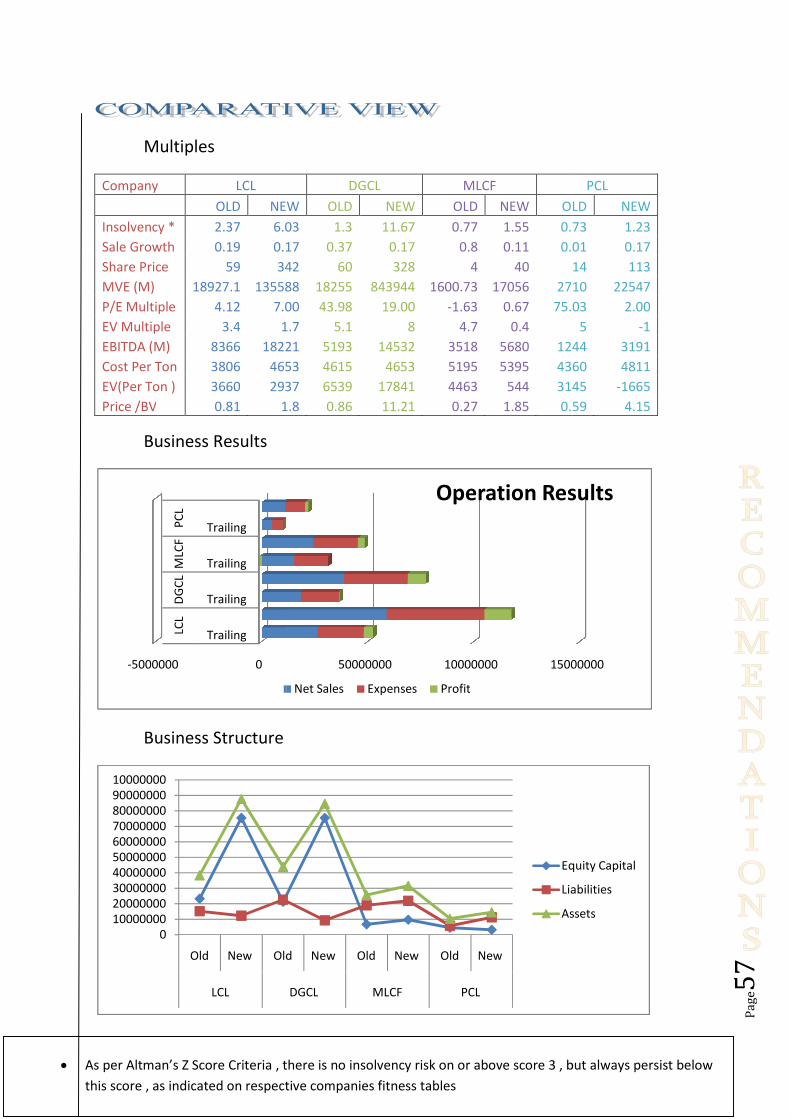
Multiples
Company LCL
OLD NEW
Insolvency * 2.37 6.03
Sale Growth 0.19 0.17
Share Price 59 342
MVE (M) 18927.1 135588
P/E Multiple 4.12 7.00
EV Multiple 3.4 1.7
EBITDA (M) 8366 18221
Cost Per Ton 3806 4653
EV(Per Ton ) 3660 2937
Price /BV 0.81 1.8
Business Results
Business Structure
-5000000 0
Trailing
Trailing
Trailing
Trailing
LCL
DG
CL
MLC
FP
CL
010000000200000003000000040000000500000006000000070000000800000009000000010000000
Old New Old
LCL
As per Altman’s Z Score Criteria , there is no insolvency risk on or above score 3 , but always persist below
this score , as indicated on respective companies fitness tables
DGCL MLCF
NEW OLD NEW OLD NEW OLD
6.03 1.3 11.67 0.77 1.55 0.73
0.17 0.37 0.17 0.8 0.11 0.01
342 60 328 4 40 14
135588 18255 843944 1600.73 17056 2710
7.00 43.98 19.00 -1.63 0.67 75.03
1.7 5.1 8 4.7 0.4
18221 5193 14532 3518 5680 1244
4653 4615 4653 5195 5395 4360
2937 6539 17841 4463 544 3145
1.8 0.86 11.21 0.27 1.85 0.59
50000000 10000000 15000000
Operation Results
Net Sales Expenses Profit
Old New Old New Old New
DGCL MLCF PCL
Equity Capital
Liabilities
Assets
, there is no insolvency risk on or above score 3 , but always persist below
this score , as indicated on respective companies fitness tables
Pag
e57
PCL
OLD NEW
0.73 1.23
0.01 0.17
14 113
2710 22547
75.03 2.00
5 -1
1244 3191
4360 4811
3145 -1665
0.59 4.15
15000000
Operation Results
Equity Capital
Liabilities
Assets
, there is no insolvency risk on or above score 3 , but always persist below

Equity Position
INSOLVENCY RISK SCORE (Free of Risk Score : 3.00)
S.T liquidated Value of Share
L.T liquidated Value of Share
Insolvency Score
Standard Risk
S.T Comparative Adj. (Anti Insolvency)
L.T Comparative Adj..(Anti Insolvency)
Improve/(Deteriorate) Past
Improve/(Deteriorate) Future
Past Trend of S/Price
S.T Max Risk Reward Ratio Adj.
L.T Max Risk Reward Ratio Adj.
NB:
S.T Optimum Portfolio operates with in respective risk of the Co
L.T Optimum Portfolio Recommended on respective risk of the Co
Note:
Insolvency predicator should be read in conjunction with
ascertain potential loss on investment, however liquidation does not took place, just
because of inability to pay off debts or other liabilities in short while and not just on the will
of lender or creditors ,but depends upon many other factors like earning potentia
company, qualities/vision of management, shareholders/group capacity of p
additional funds or absorbing loss
on the products of the company
020000000400000006000000080000000
100000000120000000140000000160000000180000000
OLD NEW OLD
LCL
Technical AM Best, Moody, Standard & Poor’s, FSDH, Persoli Corp Ltd, S C Securities Ltd, PACRA(Pak.Credit Rating Agency)FNE (First National Equity Ltd) , AFG (Applied Finance Group), Morning star equity Research, Wall street journal,Investopedia ,Scribd com , Prudential Financial and Kar
Assistance
INSOLVENCY RISK SCORE (Free of Risk Score : 3.00)
LCL DGCL MLCF PCL
61% 48% 26% 54%
86% 89% 30% 46%
2.37 1.30 0.77 0.73
0.21 0.57 0.74 0.76
(Anti Insolvency) 0.75 0.25
(Anti Insolvency) 0.46 0.25 0.15 0.14
78% -34% -58% -14%
64% 187% 195% 499%
38% -25% -80% -33%
1:[1.2] 1:2
1:35 1:41 1:12 1:13
Portfolio operates with in respective risk of the Company’s "Past"
L.T Optimum Portfolio Recommended on respective risk of the Company’s “Futu
Insolvency predicator should be read in conjunction with Net Worth of the company & then
potential loss on investment, however liquidation does not took place, just
because of inability to pay off debts or other liabilities in short while and not just on the will
of lender or creditors ,but depends upon many other factors like earning potentia
company, qualities/vision of management, shareholders/group capacity of p
additional funds or absorbing losses , lender/creditors tolerance limits and customer faith
products of the company
OLD NEW OLD NEW OLD NEW
DGCL MLCF PCL
Assets
Liabilities
Equity Capital
Poor’s, FSDH, Persoli Corp Ltd, S C Securities Ltd, PACRA(Pak.Credit Rating Agency)FNE (First National Equity Ltd) , AFG (Applied Finance Group), Morning star equity Research, Wall street journal,Investopedia ,Scribd com , Prudential Financial and Karachi Stock Exchange of Pakistan
Pag
e58
Total
Ratio
54%
46%
0.73 5.17
0.76
0.14
14%
499%
33%
ure
orth of the company & then
potential loss on investment, however liquidation does not took place, just
because of inability to pay off debts or other liabilities in short while and not just on the will
of lender or creditors ,but depends upon many other factors like earning potential of the
company, qualities/vision of management, shareholders/group capacity of pouring
, lender/creditors tolerance limits and customer faith
Assets
Liabilities
Equity Capital
Poor’s, FSDH, Persoli Corp Ltd, S C Securities Ltd, PACRA(Pak.Credit Rating Agency)FNE (First National Equity Ltd) , AFG (Applied Finance Group), Morning star equity Research, Wall street journal,
achi Stock Exchange of Pakistan

Pag
e59
INVESTMENT PLAN Ranking
Type of Investment LCL DGCL MLCF PCL Order
Share price as on Dec. 23, 2009 66 29.5 3.51 9.75
Short Term (One Year) MLCF
CMP of Shares 58.5 60.0 4.3 13.6 LCL
Multiple Basis 79 4 8 5
Up/Downside 35% -94% 95% -61%
Recommended Buy Sell Buy Sell
Risk Lover 100%
Risk avoid 100%
Optimizer 75% 25%
Long Term (5 -10 Year) MLCF
CMP of Shares 59 60 4 14 PCL
DCF Basis value 342 328 40 113 LCL
Up/Downside 484% 447% 830% 729% DGCL
Recommended Buy Buy Buy Buy
Risk Lover 53% 47%
Risk avoid 46% 54%
Optimizer 46% 25% 15% 14%
Takeover of Business MLCF
P/BV (Scores) 0.81 0.86 0.27 0.59 PCL
EV/Ton( Score) 3660 6539 4463 3145 LCL
Combine(Scor) 26 35 18 20 DGCL
Recommended Buy Buy
Priority 1st 2nd
NOTE:
Relative valuation for short term horizon of 12 months has been based on P/E multiple and
EV multiple,(Except for loss sustaining companies where P/E is replaced with E/P) derived
from estimates of forward year 2010. EV multiple help in comparing company’s
performance with its peers irrespective of depreciation & finance expenses, while PE
multiple helps in comparing company peers with respect to earning potential, Valuation is
based on multiples of the respective company to arrive at fair value and avoid exaggeration
because industry multiples, as stated earlier, are misleading due to unstable economy and
unorganized industry as well as rolling stock market (which is running under control since
last year and floor lifting was conditional to IMF approval)
Intrinsic Long Term valuation is reflected from DCF of respective company , which is based
on comprehensive financial statements, prepared in accordance with historical norm of
respective companies and vision/strategy of their managements
Inverse technique has proven its reliability ,as witnessed by latest stock prices as on Dec. 23, 2009, stocks aremoving towards prediction with slow or fast pace ,except MLCF which have slump down after publication of anarticle in newspaper on Dec.10, 2009, where debt conversion proposal of the company to the banks ,whomisconstrued & treated this as inability of the company to comply with impending financial obligations.http://www.dawn.com/wps/wcm/connect/dawn-content-library/dawn/news/business/11-banks-to-face-rs8-billion-sukuk-default---il--02

Pag
e60
The Research Analyst do hereby declare & states that
neither draft nor any section of this report has submitted to
any company for verification of factual accuracy of
information ,because research was not legal obligation nor
it contains any ratings (opinion expressed in this report is
for the sake of study & expression of information
Applicability or otherwise of categories, given against each
Ownership & material conflict of interest Not Applicable
Receipt of compensation Not Applicable
Position as Officer/Director Not Applicable
Meaning/Distribution of Ratings Rating meaning has been disclosed
in foot note of the page, and this is
the first & last rating ,hence no
distribution disclosure required
Price chart As the companies under review
were not placed on watch list &
report is not legitimate/formal, so
Not Applicable
Price Targets Method & Assumptions has been
given in attached spreadsheet files
of respective companies
It is stated that this report is not intended to be & must not
be taken as basis for an investment decision/advice , nor it
should be construed or solicitation to buy, hold/reduce or
sell securities of the companies referred in this report.