equity sectors: essential building blocks for portfolio construction
TRANSCRIPT

For most of the past two decades, equity allocations within portfolios have primarily been determined using conventional parameters such as capitalization (small, mid, large), style (value, blend, growth), and regional orientation (domestic vs. foreign exposure). Such frameworks deemphasize perhaps the largest non-company-specific determinant of equity volatility and returns: the sector and industry in which a company operates. This article will demonstrate that a sector-based framework is an effective approach to equity portfolio construction, helping investors to achieve a variety of objectives and greater control over underlying exposures.
Individual investors and advisers looking to build equity portfolios have primarily utilized one of two frameworks: the style box approach or sector and industry classification (see Equity classification systems in the modern era, page 2). Today, $4.4 trillion is deployed in U.S. equity/style box-classified funds, which represents about 90% of the entire U.S. dedicated equity fund market. By comparison, the other roughly 10% of the market ($514 billion) is composed of U.S. sector-based equity mutual funds and exchange-traded funds (ETFs).1 [Note: For this analysis, Morningstar’s style box classification and the Global Industry Classification Standard (GICS) developed by MSCI and Standard & Poor’s are used.]
While style box classification continues to be the most widely adopted approach to equity portfolio construction, there are increasing signs that more investors are adopting sector-based strategies. More than $26 billion in net new capital flowed into U.S. sector-based funds/ETFs in 2012, while broad-based equity/style box-classified funds had net outflows of $44 billion. So far in 2013, sector-based funds/ETFs have continued to gain market share, attracting 41% of total net flows to equity funds.2 While there may be a variety of reasons for the recent growth of sector-based strategies, more investors may be recogniz-ing the attributes of sectors, which make them ideal portfolio building blocks for those looking to generate alpha* and have greater control in managing risk.3
Understanding the attributes of sector-based equity allocationSector exposure has been a significant driver of equity performanceDiversification is a key element of any equity allocation approach. According to modern portfolio theory, combining assets that are imperfectly correlated with one another—meaning their performance does not move in lockstep—lowers the risk (volatility) of a portfolio and opens the door to potentially higher risk-adjusted returns.4
To construct a diversified equity portfolio, it is helpful to understand the historical determinants of performance for the asset class. One way to determine the most influential factors that have driven the performance of the equity markets is to perform an analysis of variance, which utilizes statistical meth-ods to attribute the variance of a variable (in this case, stock returns in an index) to certain factors, such as sector, style, and market cap. After accounting for those specific factors, the residual or remaining value can be attributed to other company-specific factors.
[Note: Diversification does not ensure a profit or guarantee against loss.]
Equity Sectors: Essential Building Blocks for Portfolio Construction
June 2013
leadership series | investment insights
Denise ChisholmSector Allocation Portfolio Manager
Scott O’Reilly, CFAVice President, Investment Capability Management
Miles Betro, CFASenior Asset Allocation Research Analyst
key takeawayS
• Applying a sector-based framework to equity portfolio construction can help investors achieve a variety of alpha-seeking investment objectives and greater control in managing portfolio risk.
• Beyond company-specific factors, sector exposure has been the most influential driver of equity market returns, yet sector-based portfolio construction remains an under-utilized strategy in the marketplace.
• Equity sectors have a variety of attributes, including stable classification, consistent earnings drivers, high return differentiation, clear volatility patterns, and low correlations, which together can help investors generate efficient portfolios.
• Sectors can be used as portfolio construction building blocks through a variety of investment strategies, including sector allocation, portfolio overlays, portfolio completion, and risk management, as well as to diversify wealth beyond human capital exposures.

2
Looking at the various sources of stock returns in the U.S. equity market over the past 20 years, we find that factors tied to a specific company have been the single most important explana-tory variable for the returns of stocks. In fact, company-specific factors explain roughly two-thirds of historical returns for the U.S. equity market over the past decade (see Exhibit 1, above). Due to the large influence of company-specific factors, individual stock investments tend to be highly volatile, and this helps explain why many investors make it a matter of policy to diversify their expo-sures to equities.
However, company-specific factors do not fully account for the performance of the U.S. equity market during the past 20 years; sector exposure is the second-most influential factor. The earn-ings of various companies within a given sector or industry can be influenced similarly by a specific economic, regulatory, tax, and geopolitical factor, yet that same factor may have little influence on earnings in other sectors. For example, the Federal Reserve’s monetary policies can significantly influence earnings for many different banks, but have far less impact on earnings for chemical manufacturers. Style and cap factors also have been important, albeit less powerful determinants of equity returns. Even when combined, both style and cap factors have been less influential on stock returns over time than sector exposure.
ExhiBit 1: After company-specific factors, sector exposure is
the largest determinant of equity market returns.
SOuRCE OF REtuRn FOR u.S. StOCKS
Data above represent rolling 12-month analysis of variance (ANOVA), which uses statistical models to attribute the variance of a variable (stock returns in the Russell 3000) to certain factors (sector, style, mar-ket cap). The residual is attributed to other company-specific factors. Source: Fidelity Investments as of Dec. 31, 2012.
equity classification systems in the modern eraInvestment classification systems attempt to group securities according to similar attributes or factors. Within the equity universe, two schools of thought dominate the investment landscape: the “style box” classification and sector/industry classification.
• Style box classification. Pioneered in the late 1970s and adopted more broadly in the 1980s, style classification generally relies on a combination of various quantitative financial statistics and third-party consensus earnings-growth estimates to determine whether the stock of a company is classified as a “value” stock (e.g., undervalued based on the underlying financial health of the company) or a “growth” stock (e.g., high earnings growth prospects). Sometimes a company’s stock may be categorized as having both value and growth characteristics, and part of its market capitalization is apportioned to both “styles” (i.e., blended category). Market capitalization then fur-ther divides the equity market based on the total value of outstanding shares of a company, and divides the universe into three buckets: small, mid, and large. This classification system ultimately results in a grid made up of nine indi-vidual boxes based on style and on market capitalization.
• Sector/industry classification. Sectors and industry clas-sifications generally rely on a hierarchical approach that, first, groups each company into one of 10 sectors based on the nature of its business—consumer discretionary, consumer staples, energy, financials, health care, industri-als, information technology, materials, telecommunication services, and utilities. Beneath each sector lies another layer, typically referred to as industry groups, which consist of multiple industries, and which subsequently can include multiple sub-industries. The Global Industry Classification Standard methodology assigns the stock of each com-pany to a sub-industry based on its principal business activity, identified by analyzing the relative importance of the sources of revenues and earnings. Then, the stock is categorized according to industry, industry group, and sec-tor. Each grouping below the highest sector level becomes more specific than the classification level above it.
0%
10%
20%
30%
40%
50%
60%
70%
80%
90%
100%
Dec
-90
Dec
-91
Dec
-92
Dec
-93
Dec
-94
Dec
-95
Dec
-96
Dec
-97
Dec
-98
Dec
-99
Dec
-00
Dec
-01
Dec
-02
Dec
-03
Dec
-04
Dec
-05
Dec
-06
Dec
-07
Dec
-08
Dec
-09
Dec
-10
Dec
-11
Dec
-12
Sector CapStyleCompany
Company Long-Term Average: 61%
Style Long-Term Average: 12%
Sector Long-Term Average: 22%
Cap Long-Term Average: 5%
Sector exposure has been the second-most influential factor in the performance of the U.S. equity market during the past 20 years.

3
Differentiating factors of sector-based portfolio constructionSector exposure has been such a significant driver of equity per-formance over time because of the distinct risk and performance characteristics of the 10 major sectors. It is these characteristics—or attributes—that also make sectors compelling building blocks for creating an equity portfolio to generate alpha and manage a portfolio’s risk exposure. [Note: Investing in a single sector can result in increased volatility because of its narrow concentration.]
Intuitive, stable businessesSector classifications tend to be fairly intuitive, as most investors are able to identify an energy or health care company based on the nature of its business operations. For instance, companies that manufacture products and services that meet basic human needs—such as food or detergent producers, electric utilities, and hospitals—are fairly easy to identify as being in the con-sumer staples, utilities, and health care sectors, respectively. Many businesses evolve over time, and many diversified compa-nies have business operations in multiple sectors/industries, all of which can influence their earnings and stock prices. However, a majority of them stick to their core expertise and focus on a particular industry (e.g., banking) or perhaps a few related industries (e.g., banking, trading, and investment management) within a given sector. Diversified companies thus are typically classified according to the largest—and highest revenue produc-ing—underlying business. For these reasons, sector components
rarely, if ever, change. During the past five years on average, one company in the S&P 500 was reclassified per month on a sector basis, and 70 companies per month were reclassified on a style box basis (see Exhibit 2, below left).
Almost by design, portfolio compositions within style box invest-ment frameworks change frequently based on ever-changing financial characteristics, such as market values, book and price values, forecast earnings growth, and historical sales per share, among other variables. Investors therefore may find it challeng-ing to know whether a company falls into a “value,” “blend,” or “growth” category without prior research. In addition, the financial characteristics that determine style box classification may not provide investors with the most accurate picture of the corporate composition or economic sensitivity of a group of stocks. This could lead investors into assuming undesirable risk exposures. For example, let’s assume an investor sought the relative per-formance stability of large-cap value stocks after experiencing losses in growth-oriented stocks when the tech bubble burst in the early 2000s. This investor may have been surprised during the 2007–2008 financial crisis by the significant price declines of banks, which are often seen as “cheap” value exposure and are a significant component of the large-cap value category.
The straightforward equity classification of sectors may allow investors to clearly understand what they own, which may give them more confidence in building equity portfolios suitable to their objectives. Meanwhile, the relative stability of a sector classification framework may provide allocators with very precise—and poten-tially effective—exposures when constructing equity portfolios.
Consistent performance driversAlthough company-specific factors lead to stock performance dif-ferentiation, companies within each sector also can be influenced by similar macro drivers of revenue and profit growth; hence, the stocks often react similarly to changes in the economic cycle. For example, consumer staples companies tend to have consistent demand for their products, which typically leads to stable rev-enues, earnings, and stock performance relative to other sectors. A toothpaste producer is typically not going to see major swings in its earnings or stock price regardless of the trajectory of the economy, because few people are likely to cut back on a basic need such as toothpaste, even during tough times.
At the same time, although some style box classifications tend to have higher exposures to certain sectors, there are companies in all 10 sectors that are represented in each style category. This diverse style box composition can make the earnings and stock prices of style box components somewhat less uniformly influ-enced by certain factors, such as shifts in the economy. Roughly one-third of companies within the Russell 3000 Index are classi-fied as both value and growth companies, with portions of their market capitalization assigned to each category.5 As a result of the diverse makeup of the style box components, there can be fewer
ExhiBit 2: the constituents of sectors tend to be stable over
time, while style box constituents rotate far more frequently.
MOnth-tO-MOnth ClASSiFiCAtiOn ChAngES
FOR S&P 500 COnStituEntS
Source: Fidelity Investments, Morningstar Direct as of Dec. 31, 2012.
0
20
40
60
80
100
120
140# of Sector Changes# of Style Box Changes
Dec
-200
6M
ar-2
007
Jun-
2007
Sep-
2007
Dec
-200
7M
ar-2
008
Jun-
2008
Sep-
2008
Dec
-200
8M
ar-2
009
Jun-
2009
Sep-
2009
Dec
-200
9M
ar-2
010
Jun-
2010
Sep-
2010
Dec
-201
0M
ar-2
011
Jun-
2011
Sep-
2011
Dec
-201
1M
ar-2
012
Jun-
2012
Sep-
2012
Dec
-201
2

4
consistent patterns of earnings results and stock performance amid fluctuations in an economy.
High performance dispersion Equity sectors tend to have significant performance dispersion relative to each other, which is a key attribute for any alpha-seeking equity allocation strategy. Historical analysis shows that the dispersion of returns between the best- and worst-performing sectors (average = 43%) has been nearly double that of style box categories (average = 24%)—see Exhibit 3, above. By the nature of their composition, style box-oriented strategies are diversified across multiple sectors, leading to relatively lower performance dispersion. The wider dispersion of individual sectors relative to style box components suggests that sectors tend to be more vola-tile, but this dispersion also allows an investor the opportunity to have greater control in managing a portfolio’s risk exposure and greater opportunity to generate alpha. As with any strategy that
deviates from a market-cap-weighted benchmark, it’s also impor-tant for an investor to recognize that active sector allocations can potentially lead to increased return variance over short-term periods. For this reason, making effective equity sector alloca-tions to achieve an investment objective may be best suited to investors who have the appropriate experience, investment tools, and research capabilities.
Clear patterns of volatility The deviations of equity sector performance are often illustrated by the periodic table of returns (see Exhibit 4, top table, page 5). This table illustrates the lack of a clear pattern of sector returns, which speaks to the rationale for why diversification across sectors is important. At the same time, an additional periodic table (see Exhibit 4, bottom table) shows the volatility (i.e., standard deviations) of sectors. This particular view illustrates that although the volatility of sectors can change from year to year, there are some clear patterns of relative volatility between sectors that can help enhance their predictability. In general, more economically sensitive sectors, such as energy, materials, and information technology, tend to show more volatility than the average level of volatility for the broader U.S. equity market in any given year, while defensive-oriented sectors, such as consumer staples and utilities, tend to show less volatility than the market average. Information technology was the most volatile sector in each year from 1994 to 2001, and has also been more volatile than most sectors in other years. Consumer staples,
Sectors represented by the top 3000 U.S. stocks as measured by market capitalization and defined by GICS. Style box indexes include the Russell Top 200 Growth, Russell Top 200 Value, Russell Midcap Growth, Russell Midcap Value, Russell 2000 Value, Russell 2000 Growth. See index defini-tions on page 10. Source: Fidelity Investments as of Dec. 31, 2012.
ExhiBit 3: Equity sectors have had nearly twice the performance dispersion of style box indexes, providing allocators with more
levers to construct equity portfolios when seeking alpha and managing risk.
DiSPERSiOn BEtwEEn BESt- AnD wORSt-PERFORMing SECtORS & StylE BOx inDExES
0
20
40
60
80
100
120
140
Dec
-199
2Ju
n- 1
993
Dec
- 199
3Ju
n- 1
994
Dec
- 199
4Ju
n- 1
995
Dec
- 199
5Ju
n- 1
996
Dec
- 199
6Ju
n- 1
997
Dec
- 199
7Ju
n- 1
998
Dec
- 199
8Ju
n- 1
999
Dec
-199
9Ju
n- 2
000
Dec
- 200
0Ju
n- 2
001
Dec
- 200
1Ju
n- 2
002
Dec
-200
2Ju
n-2
003
Dec
- 200
3Ju
n- 2
004
Dec
- 200
4Ju
n- 2
005
Dec
- 200
5Ju
n-2
006
Dec
-200
6Ju
n-2
007
Dec
- 200
7Ju
n- 2
008
Dec
- 200
8Ju
n- 2
009
Dec
-200
9Ju
n-2
010
Dec
- 201
0Ju
n- 2
011
Dec
- 201
1Ju
n- 2
012
Dec
-201
2
% R
etur
n D
ispe
rsio
n (M
ax-M
in)
Sector IndexesStyle Box Indexes
Avg = 43%
Avg = 23%
The high return dispersion of individual sectors... allows an investor the opportunity to have greater control over managing a portfolio’s risk exposure.

5
which has been the least volatile sector in 10 of the past 12 years, tends to be on the opposite end of the spectrum, showing persistently lower volatility than most other sectors (Exhibit 4).
Low performance correlationsTo achieve adequate diversification, equity allocators need to evaluate not only the dispersion of returns, but also the correlation of those returns. Equity sectors have exhibited low return correlations over extended time periods.6 From 2000 through 2009, each of the 10 sectors showed performance correlations below 0.5 versus at least one other sector, and seven of 10 sectors had correlations against the broader market of 0.8 or lower (see Exhibit 5, page 6). The most dramatic examples of low correlations among individual sectors tend to be between the most and least economically sensitive sectors. For example, the utilities sector historically has been one of the least economically sensitive sectors—a consumer tends to be more willing to curtail spending on discretionary items before failing to pay the
electricity bill. Thus, during the 2000s, utilities had a very low correlation to information technology, which is an economically sensitive sector.
Further, sectors have shown generally lower return correlations compared with style box categories. During the 2000s, the aver-age correlation of sectors versus one another was 0.52, while the average correlation among style box benchmarks over the same period was 0.76.7
Sectors can help diversify and lower portfolio risk Consistent performance volatility patterns and low correlations are attractive features in portfolio construction that can enhance the ability to manage portfolio risk and reap diversification benefits. While an investment in any single sector may not be an appropriate level of diversification for an equity portfolio, a diver-sified exposure across sectors may allow an investor to achieve a desired level of portfolio diversification and volatility. For example,
ExhiBit 4: historically, performance leadership among individual equity sectors has rotated frequently (upper table), and there have
been some clear patterns of volatility among sectors, as shown by the color scheme in the standard deviation table (lower table).
U.S. equity market represented by top 3000 U.S. stocks as measured by market capitalization; sectors as defined by GICS. Source: Fidelity Investments as of Dec. 31, 2012. Past performance is no guarantee of future results.
Equity Sectors: Annual Total Return
1992 1993 1994 1995 1996 1997 1998 1999 2000 2001 2002 2003 2004 2005 2006 2007 2008 2009 2010 2011 2012
27% 22% 24% 56% 34% 49% 71% 98% 53% 6% –6% 53% 35% 40% 36% 40% –16% 63% 32% 18% 26% Financials
23% 21% 9% 50% 33% 41% 52% 32% 39% 3% –7% 40% 23% 16% 28% 34% –23% 56% 30% 14% 21% Consumer Discretionary
16% 19% 7% 46% 29% 36% 39% 27% 29% –2% –11% 40% 21% 11% 21% 17% –28% 48% 28% 10% 19% Telecom Services
11% 18% 5% 41% 27% 36% 26% 24% 27% –5% –13% 33% 20% 8% 21% 17% –35% 31% 19% 6% 19% Health Care
10% 16% 2% 37% 25% 32% 25% 21% 7% –10% –16% 33% 17% 7% 19% 14% –38% 25% 19% 2% 15% U.S. Equity Market
10% 13% 1% 37% 23% 31% 22% 17% 2% –11% –19% 33% 14% 5% 19% 14% –39% 25% 18% 1% 15% Industrials
10% 12% –2% 35% 17% 27% 13% 17% –11% –11% –20% 30% 13% 5% 17% 13% –40% 24% 16% –1% 13% Materials
9% 12% –2% 31% 14% 27% 9% 1% –14% –12% –21% 26% 13% 3% 15% 8% –41% 16% 14% –1% 12% Information Technology
5% 12% –5% 31% 14% 22% 8% –3% –22% –14% –24% 24% 9% 3% 15% 8% –44% 16% 13% –2% 10% Consumer Staples
4% –2% –9% 22% 7% 22% –4% –3% –41% –18% –33% 15% 5% 2% 10% –7% –45% 16% 7% –14% 6% Utilities
–12% –6% –11% 18% 2% 13% –8% –11% –42% –24% –38% 14% 5% –2% 7% –14% –47% 12% 7% –15% 6% Energy
Equity Sectors: Annual Standard Deviation
1992 1993 1994 1995 1996 1997 1998 1999 2000 2001 2002 2003 2004 2005 2006 2007 2008 2009 2010 2011 2012
16% 15% 17% 17% 25% 28% 34% 33% 45% 54% 47% 20% 18% 25% 22% 16% 37% 41% 25% 27% 19% Materials
14% 15% 16% 13% 14% 18% 28% 30% 28% 32% 44% 18% 16% 18% 16% 15% 34% 34% 24% 27% 17% Information Technology
14% 14% 15% 10% 13% 18% 25% 22% 27% 30% 23% 17% 13% 16% 15% 15% 30% 30% 24% 23% 16% Financials
13% 13% 13% 10% 12% 18% 25% 21% 25% 23% 22% 16% 11% 13% 10% 14% 30% 30% 23% 21% 14% Energy
11% 12% 13% 9% 12% 17% 24% 18% 23% 21% 21% 16% 10% 10% 10% 13% 30% 23% 23% 19% 12% Consumer Discretionary
10% 11% 12% 9% 11% 16% 23% 16% 23% 20% 20% 15% 10% 10% 9% 12% 26% 23% 22% 17% 11% U.S. Equity Market
10% 11% 11% 8% 11% 16% 23% 16% 21% 20% 20% 15% 10% 10% 9% 12% 24% 19% 20% 17% 11% Industrials
9% 10% 11% 8% 11% 15% 23% 15% 21% 18% 18% 14% 10% 9% 7% 10% 23% 18% 17% 13% 10% Telecom Services
8% 8% 10% 8% 11% 15% 22% 15% 19% 16% 16% 12% 8% 8% 7% 10% 21% 18% 15% 11% 10% Health Care
8% 7% 10% 7% 10% 12% 21% 15% 19% 14% 14% 10% 8% 8% 6% 10% 19% 17% 13% 9% 9% Utilities
8% 6% 9% 5% 9% 12% 15% 14% 16% 8% 14% 9% 8% 5% 3% 7% 15% 16% 13% 6% 8% Consumer Staples

6
ExhiBit 5: All 10 equity sectors exhibited low correlations (below 0.5) relative to at least one other sector during the 2000s (upper table),
and have had generally lower correlations on average relative to style box categories (lower table).
Sectors: represented by the top 3000 U.S. stocks as measured by market cap and defined by GICS. Style box categories: large cap growth - Russell Top 200 Growth; large cap value - Russell Top 200 Value; mid cap growth - Russell Midcap Growth; mid cap value - Russell Midcap Value; small cap growth - Russell 2000 Growth; small cap value - Russell 2000 Value. Source: Fidelity Investments as of Dec. 31, 2012. Correlation coefficient: the interdependence of two random variables that range in value from −1 to +1, in-dicating perfect negative correlation at −1, absence of correlation at 0, and perfect positive correlation at +1.
an investor looking to maintain some exposure to equities and at the same time lower his or her equity risk profile might be more confident in tilting allocations toward sectors with histori-cally lower volatility. Several equity sectors and industries have had lower volatility than the very broadly diversified U.S. equity
market. During the 10-year period ending December 2012, four of the 10 GICS sectors (consumer staples, utilities, telecommu-nications, and health care) and 10 of the 68 industries displayed lower volatility than the broadly diversified S&P 500 Index (see Exhibit 6, below).
Small Cap Growth
Small Cap Value
Mid Cap Growth
Mid Cap Value
Large Cap Growth
Large Cap Value
Small Cap Growth 1.00 0.81 0.95 0.67 0.78 0.57
Small Cap Value 0.81 1.00 0.73 0.90 0.63 0.76
Mid Cap Growth 0.95 0.73 1.00 0.68 0.87 0.62
Mid Cap Value 0.67 0.90 0.68 1.00 0.70 0.90
Large Cap Growth 0.78 0.63 0.87 0.70 1.00 0.75
Large Cap Value 0.57 0.76 0.62 0.90 0.75 1.00
ExhiBit 6: More sector and industry diversification doesn’t always result in less risk than the broader u.S. equity market; some
sectors have had lower risk than the equity market.
u.S. Equity SECtOR & inDuStRy 10-yEAR StAnDARD DEviAtiOnS
Data shown are for the top 3000 U.S. stocks as measured by market capitalization. Sectors and industries are defined by GICS. Source: Fidelity Invest-ments as of Dec. 31, 2012.
IPP
& tr
ader
s
Bld
g pr
oduc
tsC
onsu
mer
fina
nce
Div
ersi
fied
svcs
Pap
er &
fore
st p
rodu
cts
Con
stru
ctio
n m
ater
ials
Offi
ce e
lect
roni
csH
ouse
hold
dur
able
sC
onst
ruct
ion
& e
ngin
eerin
gN
et s
oftw
are
& s
vcs
RE
mgm
t & d
evel
opm
ent
Elec
t equ
ip &
inst
rum
ents
Com
mun
icat
ions
equ
ipm
ent
Con
glom
erat
esC
omm
erci
al b
anks
Mul
tilin
e re
tail
Leis
ure
equi
p
Per
sona
l pro
duct
s
Met
als
& m
inin
gA
uto
com
pon
ents
Inte
rnet
& c
atal
ogTr
ansp
ort i
nfra
stru
ctur
e
Oil
gas
& c
onsu
mab
les
Text
iles,
app
arel
& lu
xury
Life
sci
ence
tool
s &
svc
s
Thri
fts
& m
tg fi
nanc
eSp
ecia
lty r
etai
lC
ompu
ters
& p
erip
hera
lsH
otel
s, r
esta
uran
ts &
leis
ure
Con
tain
ers
& p
ckg
Aer
o &
def
ense
Hea
lth c
are
prov
ider
s
Hea
lth e
quip
& s
uppl
ies
Div
ersi
fied
tele
com
Com
m s
vcs
& s
uppl
ies
Tele
com
svc
s
Food
& s
tapl
es r
etai
lFo
od p
rodu
cts0%
10%
20%
30%
40%Sector Industry
Con
sum
er S
tapl
es (
CS)
CS
-C
S -
UTL
-M
ulti-
util
CS
-Hou
seho
ld p
rodu
cts
UTL
-Ele
ctri
c ut
ilitie
sC
S -
Bev
erag
es H
ealth
car
e (H
TH)
Util
ities
(U
TL)
HTH
-P
harm
aU
TL -
Gas
util
ities
UTL
-W
ater
Tele
com
mun
icat
ion
Ser
vice
s(TE
L)TE
L -
Top
30
00
U.S
. sto
cks
IND
- TEC
-TE
C -I
t svc
sH
TH -
CD
-Dis
trib
utor
sFI
N -I
nsur
ance
HTH
-H
TH -
Bio
tech
IND
-P
rofe
ssio
nal s
ervi
ces
IND
- Indu
stri
als
(IN
D)
CD
-M
edia
TEC
-S
oftw
are
HTH
-C
onsu
mer
Dis
cret
iona
ry (
CD
)IN
D -
Air
frei
ght
Info
rmat
ion
Tech
nolo
gy (
TEC
)M
AT -
HTH
-H
C te
chC
D - TE
C -
CD
-FI
N -
ENE
-C
S -T
obac
coTE
L -W
irele
ss F
inan
cial
s (F
IN)
IND
-R
oad
& r
ail
MAT
-C
hem
ical
s E
nerg
y (E
NE)
CD
-C
S -
IND
-El
ec e
quip
CD
-C
onsu
mer
svc
sIN
D -
Trad
ing
cos
CD
- M
ater
ials
(M
AT)
CD
-FI
N - IN
D -
FIN
-R
EITs
FIN
-C
ap m
kts
TEC
-IN
D -
Mac
hine
ryU
TL -
TEC
-TE
C -
Sem
icon
duct
ors
FIN
- TEC
-IN
D -
CD
- TEC
-M
AT -
MAT
-FI
N -
ENE
-Eq
uipm
ent &
svc
sFI
N - IN
D -
MAT
-C
D -
IND
-M
arin
eC
D -
IND
-IN
D -
Airl
ines
CD
-A
utos
Performance Correlations: U.S. Sectors and Style (2000–2009)
Consumer Discretionary
Consumer Staples Energy Financials Health Care Industrials Materials Technology Telecom
Services Utilities
Consumer Discretionary 1.00 0.52 0.44 0.78 0.50 0.87 0.71 0.76 0.64 0.37
Consumer Staples 0.52 1.00 0.38 0.63 0.54 0.60 0.57 0.22 0.35 0.39
Energy 0.44 0.38 1.00 0.44 0.35 0.56 0.69 0.35 0.34 0.64
Financials 0.78 0.63 0.44 1.00 0.51 0.80 0.63 0.47 0.47 0.48
Health Care 0.50 0.54 0.35 0.51 1.00 0.55 0.44 0.46 0.42 0.47
Industrials 0.87 0.60 0.56 0.80 0.55 1.00 0.77 0.66 0.55 0.47
Materials 0.71 0.57 0.69 0.63 0.44 0.77 1.00 0.50 0.46 0.46
Technology 0.76 0.22 0.35 0.47 0.46 0.66 0.50 1.00 0.68 0.21
Telecom Services 0.64 0.35 0.34 0.47 0.42 0.55 0.46 0.68 1.00 0.24
Utilities 0.37 0.39 0.64 0.48 0.47 0.47 0.46 0.21 0.24 1.00
7
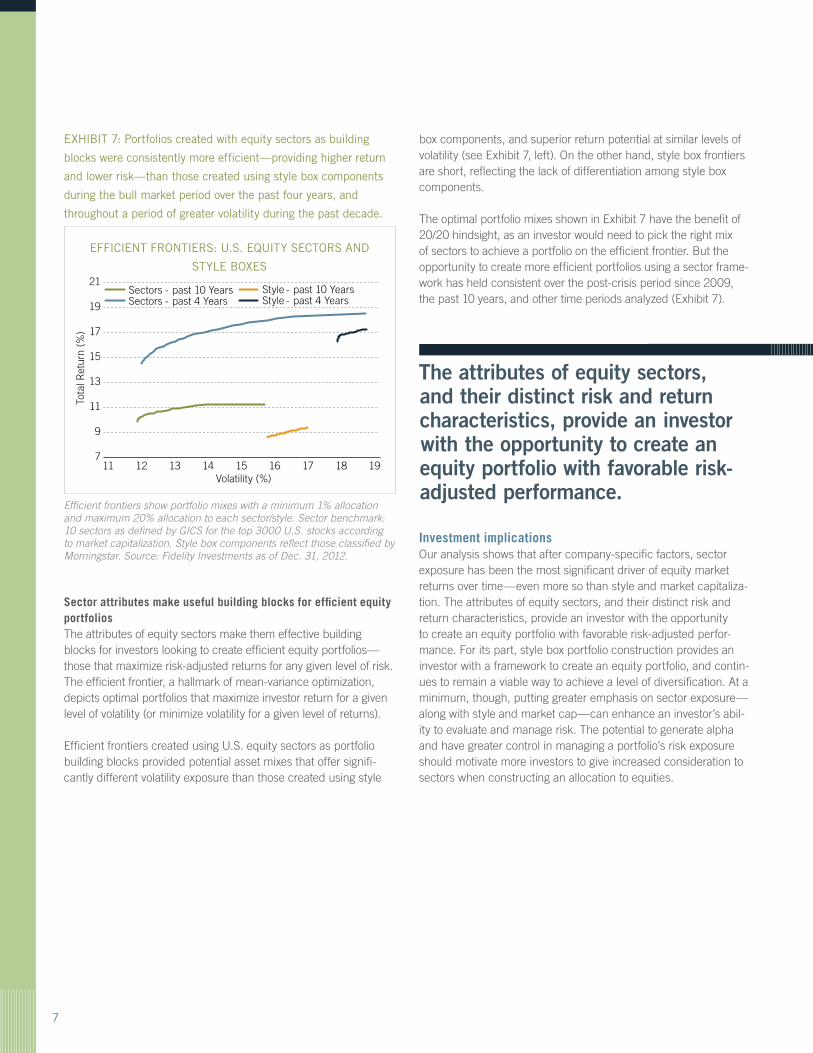
box components, and superior return potential at similar levels of volatility (see Exhibit 7, left). On the other hand, style box frontiers are short, reflecting the lack of differentiation among style box components.
The optimal portfolio mixes shown in Exhibit 7 have the benefit of 20/20 hindsight, as an investor would need to pick the right mix of sectors to achieve a portfolio on the efficient frontier. But the opportunity to create more efficient portfolios using a sector frame-work has held consistent over the post-crisis period since 2009, the past 10 years, and other time periods analyzed (Exhibit 7).
ExhiBit 7: Portfolios created with equity sectors as building
blocks were consistently more efficient—providing higher return
and lower risk—than those created using style box components
during the bull market period over the past four years, and
throughout a period of greater volatility during the past decade.
EFFiCiEnt FROntiERS: u.S. Equity SECtORS AnD
StylE BOxES
Efficient frontiers show portfolio mixes with a minimum 1% allocation and maximum 20% allocation to each sector/style. Sector benchmark: 10 sectors as defined by GICS for the top 3000 U.S. stocks according to market capitalization. Style box components reflect those classified by Morningstar. Source: Fidelity Investments as of Dec. 31, 2012.
7
9
11
13
15
17
19
21
11 12 13 14 15 16 17 18 19
Tota
l Ret
urn
(%)
Volatility (%)
Sectors - past 10 YearsSectors - past 4 Years
Style - past 10 YearsStyle - past 4 Years
Sector attributes make useful building blocks for efficient equity portfoliosThe attributes of equity sectors make them effective building blocks for investors looking to create efficient equity portfolios— those that maximize risk-adjusted returns for any given level of risk. The efficient frontier, a hallmark of mean-variance optimization, depicts optimal portfolios that maximize investor return for a given level of volatility (or minimize volatility for a given level of returns).
Efficient frontiers created using U.S. equity sectors as portfolio building blocks provided potential asset mixes that offer signifi-cantly different volatility exposure than those created using style
The attributes of equity sectors, and their distinct risk and return characteristics, provide an investor with the opportunity to create an equity portfolio with favorable risk-adjusted performance.
Investment implicationsOur analysis shows that after company-specific factors, sector exposure has been the most significant driver of equity market returns over time—even more so than style and market capitaliza-tion. The attributes of equity sectors, and their distinct risk and return characteristics, provide an investor with the opportunity to create an equity portfolio with favorable risk-adjusted perfor-mance. For its part, style box portfolio construction provides an investor with a framework to create an equity portfolio, and contin-ues to remain a viable way to achieve a level of diversification. At a minimum, though, putting greater emphasis on sector exposure—along with style and market cap—can enhance an investor’s abil-ity to evaluate and manage risk. The potential to generate alpha and have greater control in managing a portfolio’s risk exposure should motivate more investors to give increased consideration to sectors when constructing an allocation to equities.

8
Using sectors to construct equity portfoliosOur analysis shows that equity sectors have certain attributes that can be exploited by investors looking to achieve a variety of objectives with an equity allocation. The next step is to determine a strategy that takes advantage of these attributes in a way that best serves an investment objective.8 The following represent some of the sector strategies employed today in the marketplace, as well as some innovative approaches that will be the focus of future Fidelity Leadership Series articles.
Sector allocation approaches. Involve shifting sector allocations within a diversified equity portfolio based on certain analytical criteria, including business cycle rotations, and technical, fundamental, and quantitative factors.
• Business cycle approach. The business cycle approach to sector investing uses probabilistic analysis based on historical data of certain factors, such as corporate earnings, interest rates, and inflation, to identify sectors that are likely to either outperform or underperform in the current phase of the economic cycle (see “The Business Cycle Approach to Sector Investing,” Fidelity Leadership Series, May 2012.)
• Technical analysis. Allocation strategies based on technical analysis examine the historical price changes of sectors as a basis for determining future opportunities. These strategies look for the relative strength of each sector’s price movements by analyzing trends, moving averages, and other technical characteristics.
• Fundamental analysis. Fundamental analysis evaluates each sector’s underlying companies to ultimately determine which industry groups, industries, or sub-industries have the best valuation characteristics, earnings growth, and return potential relative to their peers.
• Quantitative analysis. Quantitative strategies leverage sophisticated mathematical models to evaluate a large number of factors, which could include a range of economic, fundamental, and technical factors. Quantitative strategies will often test the historical predictive success of these many factors to determine the appropriate positioning.
• Blended analysis. Blended analysis can incorporate any combination of the business cycle approach, technical, fundamental, and quantitative analysis.
Portfolio overlays. The adoption of an overlay—a screen or view based on a certain factor—to determine which sectors may be positively or negatively influenced by such a factor. For example, an inflation overlay can be used to allocate capital toward sectors that are influenced by rising or falling input prices, which can affect corporate profits.
Innovative approaches• Portfolio completion strategies. In a portfolio completion
strategy, the aggregated sector exposure of a diversified portfolio may not align with an investor’s risk tolerance or objectives. In such a scenario, an investor may choose to add a focused sector or industry allocation to tilt the overall equity portfolio sector weights to create a more diversified or desired sector composition. For example, an investor with holdings across three diversified portfolio managers might find he or she has a higher-than-desired exposure to pro-cyclical sectors. In this case, the investor may want to compensate for those holdings with allocations to more defensive sector vehicles, thus completing his or her equity exposure to serve an objective.
• Diversifying beyond human capital exposures. Sector-based investing strategies may also provide an asset allocator with an effective tool to diversify his or her investment portfolio away from the exposures associated with human capital (i.e., the economic value of one’s work capabilities). Human capital can carry with it additional risk exposures, such as an overexposure to an individual’s total wealth given the economic sector in which he or she works, or the cyclicality of one’s earnings. Many people have nearly all of their human capital concentrated in a single economic sector—the sector of their career—but they naturally diversify their financial capital across many sectors in investment accounts. As a result, these individuals—particularly those who receive profit sharing and stock options, and who participate in employer-sponsored stock plans—may be unwittingly exposing their total wealth to significant single-sector risk, which may carry with it greater sensitivity to financial market fluctuations and trends beyond their control within that sector. For example, a stock trader likely has high exposure to the financials sector, and his or her compensation might vary depending on market conditions. Because non-financial assets such as human capital, real estate holdings, and small-business ownership are generally illiquid and more difficult or impossible to transfer, diversifying investments across financial assets with different sector exposures or market and volatility profiles can be an appropriate approach.

9
• Sector rolldown strategies. During and after the 2007–2008 global financial crisis, some investors questioned whether certain target-date strategies were appropriately exposed to risk assets, as many experienced significant losses despite substantial portfolio diversification. Because equity sectors have certain consistent characteristics, they could be used as a tool to roll down a portfolio’s risk exposure as an investor approaches a specific target date. Sectors with stable end markets—such as consumer staples, utilities, and health care—have rarely experienced significant price “bubbles” and the subsequent losses that can create stress for investors and their portfolios in retirement. Historically, these sectors have generated attractive risk-adjusted returns that could support an investor’s retirement objective.
Final thoughts During the past 13 years, equity market volatility escalated amid two of the worst bear markets in history. The increased globalization of the world economy, among other factors, also led to increased correlations within equities and across multiple asset classes. As the market dynamics evolved, disappointing returns and a greater emphasis on risk management have caused some investors to question traditional portfolio construction approaches. Given their attributes, equity sectors can be used as effective portfolio building blocks in a variety of strategies, providing investors with another tool for selecting portfolio exposures to drive investment performance and manage portfolio risk.
Denise ChisholmSector Allocation Portfolio Manager
Denise Chisholm is a sector allocation portfolio manager for SelectCo, a unit of Fidelity Investments. She is instrumental in delivering innovative sector-based packaged solutions using a combination of sector mutual funds and exchange-traded funds.
Miles Betro, CFASenior Asset Allocation Research Analyst
Miles Betro is a senior research analyst in the Asset Allocation Research Team at Fidelity Investments. The Asset Allocation Research Team conducts economic, fundamental, and quantitative research to develop asset alloca-tion recommendations for Fidelity’s portfolio managers and investment teams.
Scott O’Reilly, CFAVice President, Investment Capability Management
Scott O’Reilly is a vice president in the Investment Capability Management group at Fidelity Investments. In his current role, Mr. O’Reilly is responsible for overseeing the development of and advocacy for Fidelity’s sector equity strategies.
Authors

10
Endnotes 1 Source: Investment Company Institute, Haver Analytics, Fidelity Investments as of Dec. 31, 2012.2 Sector fund flows refer to sector equity classified mutual funds and exchange-traded funds as defined by Morningstar, and excludes the commodity, asset allocation, and fund of fund category mutual funds and ETFs. Source: Morningstar, Fidelity Investments as of Mar. 31, 2013. 3 References to risk or volatility are expressed by standard deviation of returns, unless otherwise noted. 4 Fisher and Lorie’s 1970 publication in The Journal of Business showed that a portfolio of 32 stocks could capture 95% of the volatility reduction.5 Source: Fidelity Investments as of Dec. 31, 2012.6 Return correlations can converge over shorter time periods.7 Sectors defined by GICS for the top 3000 U.S. stocks according to market capitalization. Style box categories are represented by: large cap growth - Russell Top 200 Growth Index; large cap value - Russell Top 200 Value Index; mid cap growth - Russell Midcap Growth Index; mid cap value - Russell Midcap Value Index; small cap growth - Russell 2000 Growth Index; small cap value - Russell 2000 Value Index. Source: Fidelity Investments as of Dec. 31, 2012.8 When using a sector-based portfolio construction framework, it’s important for an investor to recognize that active sector allocations can lead to increased variance, or tracking error, from market-weighted indexes. Regardless of whether the active sector allocation has been made to generate alpha or manage risk exposures, returns that vary from the broader market are likely to be monitored and scrutinized. Investors and advisers that actively allocate their sector exposures must be comfortable that there are likely to be periods of out- and under-performance with this approach, as sectors may go in and out of favor.
Definitions *Alpha: the excess return over a benchmark, taking into account the risk taken to obtain that return.
Mean-variance optimization mathematically accounts for expected return (mean) and risk (variance) in an attempt to find optimal portfolios along the so-called efficient frontier with the maximum return for the minimum risk.
The Sharpe ratio compares portfolio returns above the risk-free rate relative to overall portfolio volatility. A higher Sharpe ratio implies better risk-adjusted returns.
Standard deviation shows how much variation there is from the average (mean or expected value). A low standard deviation indicates that the data points tend to be very close to the mean, whereas a high standard deviation indicates that the data points are spread out over a large range of values.
Correlation coefficient measures the interdependencies of two random variables that range in value from −1 to +1, indicating perfect negative correlation at −1, absence of correlation at 0, and perfect positive correlation at +1.
Sectors are defined as follows:
• Consumer Discretionary – companies that manufacture goods or provide services that people want but don’t necessarily need, such as high-definition televisions, new cars, and family vacations; businesses tend to be the most sensitive to economic cycles.
• Consumer Staples – companies that provide goods and services that people use on a daily basis, like food, clothing, or other personal products; businesses tend to be less sensitive to economic cycles.
• Energy – companies whose businesses are dominated by either of the following activities: the construction or provision of oil rigs, drilling equipment, and other energy-related services and equipment, including seismic data collection; the exploration, production, marketing, refining, and/or transportation of oil and gas products, coal, and consumable fuels.
• Financials – companies involved in activities such as banking, consumer finance, investment banking and brokerage, asset management, insurance and investments, and real estate, including REITs.
• Health Care – companies in two main industry groups: health care equipment suppliers, manufacturers, and providers of health care services; and companies involved in research, development, production, and marketing of pharmaceuticals and biotechnology products.
• Industrials – companies whose businesses manufacture and distribute capital goods, provide commercial services and supplies, or provide transportation services.
• Information Technology – companies in technology software & services and technology hardware & equipment.
• Materials – companies that are engaged in a wide range of commodity-related manufacturing.
• Telecommunication Services – companies that provide communications services primarily through fixed line, cellular, wireless, high bandwidth, and/or fiber-optic cable networks.
• Utilities – companies considered electric, gas, or water utilities, or companies that operate as independent producers and/or distributors of power.
Index definitions• Russell 2000® Index is a market capitalization-weighted index of
smaller company stocks.
• Russell 2000 Growth Index is an unmanaged index that measures the performance of those Russell 2000 Index companies with higher price-to-book ratios and higher forecasted growth values.
• Russell 2000 Value Index is an unmanaged index that measures the performance of those Russell 2000 Index companies with lower price-to-book ratios and lower forecasted growth values.
• Russell Midcap Index measures the performance of the 800 smallest companies in the Russell 1000 Index, which represent approximately 26% of the total market capitalization of the Russell 1000 Index.
• Russell Midcap Growth Index is an unmanaged index that measures the performance of those Russell Midcap Index companies with higher price-to-book ratios and higher forecasted growth values.
• Russell Midcap Value Index is an unmanaged index that measures the performance of those Russell Midcap Index companies with lower price-to-book ratios and lower forecasted growth values.
• Russell 3000® Index is constructed to provide a comprehensive, unbiased, and stable barometer of the broad market and is completely reconstituted annually to ensure new and growing equities are reflected.
• Russell Top 200 Index measures the performance of the largest cap segment of the U.S. equity universe; a subset of the Russell 3000® Index. Russell Top 200 includes approximately 200 of the largest securities based on a combination of their market cap and current index membership, and represents approximately 68% of the U.S. market.
• Russell Top 200 Growth Index is an unmanaged index that measures the performance of those Russell Top 200 Index companies with higher price-to-book ratios and higher forecasted growth values.
• Russell Top 200 Value Index is an unmanaged index that measures the performance of those Russell Top 200 Index companies with lower price-to-book ratios and lower forecasted growth values.
• S&P 500® Index, a market capitalization-weighted index of common stocks, is a registered service mark of The McGraw-Hill Companies, Inc., and has been licensed for use by Fidelity Distributors Corporation.

11
Past performance is no guarantee of future results.
Neither diversification nor asset allocation ensure a profit or guarantee against loss.
All indexes are unmanaged and performance of the indices includes reinvestment of dividends and interest income and, unless otherwise noted, is not illustrative of any particular investment. An investment cannot be made in any index.
Stock markets, especially non-U.S. markets, are volatile and can decline significantly in response to adverse issuer, political, regulatory, market, or economic developments. Foreign securities are subject to interest-rate, currency-exchange-rate, economic, and political risks, all of which are magnified in emerging markets.
Sector investing can be volatile because of its narrow concentration in a specific industry.
Investing involves risk, including risk of loss. Investment decisions should be based on an individual’s own goals, time horizon, and tolerance for risk.
The securities of smaller, less well known companies can be more volatile than those of larger companies.
Growth stocks can perform differently from the market as a whole and from other types of stocks, and can be more volatile than other types of stocks. Value stocks can perform differently from other types of stocks and can continue to be undervalued by the market for long periods of time.
Third-party marks are the property of their respective owners; all other marks are the property of FMR LLC.
If receiving this piece through your relationship with Fidelity Financial Advisor Solutions (FFAS) this publication is provided to investment professionals, plan sponsors, institutional investors, and individual investors by Fidelity Investments Institutional Services Company, Inc.
If receiving this piece through your relationship with Fidelity Personal & Workplace Investing (PWI), Fidelity Family Office Services (FFOS), or Fidelity Institutional Wealth Services (IWS), this publication is through Fidelity Brokerage Services LLC, Member NYSE.
If receiving this piece through your relationship with National Financial or Fidelity Capital Markets, this publication is FOR INSTITUTIONAL INVESTOR USE ONLY. Clearing and custody services are provided through National Financial Services LLC, Member NYSE, SIPC.

651698.1.0
© 2013 FMR LLC. All rights reserved.