equity research reports · pdf fileof energy resources in 2015. ... umwh mkumw holdings...
TRANSCRIPT
Equity research│September 21, 2017
Asia Pacific Daily - 21 September 2017
Equity Research Reports…
▌IDEA OF THE DAY | Asia Pacific Navigating ASIA PACIFIC 2017 - China's One Belt & One Road Initiative | P2 One Belt One Road (OBOR), China's key national strategy, could be mutually beneficial for China and OBOR countries, in our view. We see infrastructure as the best angle for cooperation under the OBOR strategy. We estimate investment mobilised by OBOR to boost GDP of emerging Asia (ex-China) by 0.6% and that of ASEAN countries by 0.7% p.a. in 2017-2025F. We recommend Chinese construction companies, capital goods and commodity players, ASEAN construction companies and banks as potential key beneficiaries. ——————————————————————————————————————————————————————————————————————————————————————— ▌Economics MAL - Economic Update - Aug 2017 consumer price inflation | P3 ——————————————————————————————————————————————————————————————————————————————————————— ▌Australia TPG Telecom (REDUCE, tp:A$4.30▼) - Spending up big in the years ahead | P4 Transurban Group (HOLD, tp:A$11.68▼) - All we (might) need is just a little patience | P5 ——————————————————————————————————————————————————————————————————————————————————————— ▌China/Hong Kong Swire Properties Ltd (ADD, tp:HK$31.00) - Swire/Taikoo brand is gaining traction | P6 ——————————————————————————————————————————————————————————————————————————————————————— ▌India Financial Services - Overall (OVERWEIGHT) - Asset quality bottoming out; valuations attractive | P7 ——————————————————————————————————————————————————————————————————————————————————————— ▌Indonesia Astra International (HOLD, tp:Rp8,700.00) - Few surprises in August | P8 Property Devt & Invt (OVERWEIGHT) - Chinese developers: limited impact for now but… | P9 ——————————————————————————————————————————————————————————————————————————————————————— ▌South Korea SK Hynix (ADD, tp:W95,000.00) - Toshiba deal likely closing in favour of Hynix | P10 ——————————————————————————————————————————————————————————————————————————————————————— ▌Malaysia Berjaya Sports Toto (ADD▲, tp:RM2.85▲) - Appealing dividend yields | P11 Autos (UNDERWEIGHT) - Still in acceleration mode | P12 Strategy Note - Investor sentiment: Current vs. Jan-Feb 17 | P13 ——————————————————————————————————————————————————————————————————————————————————————— ▌Singapore Willas-Array (NR, ctp:S$0.79) - Opportunities in distribution | P14 ——————————————————————————————————————————————————————————————————————————————————————— ▌Thailand Total Access Communication (REDUCE, tp:THB53.63▲) - Misplaced optimism | P15
Showcasing CIMB Research Ideas
CHN: Navigating China: Education 19/9 Invest for a bright future
——————————————————————————————————————————————————————————————————————————————————
THB: BTS Group 18/9 Synergistic growth along MRT lines
——————————————————————————————————————————————————————————————————————————————————
IN: Strategy Note-Alpha 15/9 Metals: continued rally is contrary to history
——————————————————————————————————————————————————————————————————————————————————
HKG: Property - Overall 14/9 Navigating farmland conversion in HK
——————————————————————————————————————————————————————————————————————————————————
THB: Telco - Mobile 13/9 Rationalisation of spectrum reserve prices a catalyst
——————————————————————————————————————————————————————————————————————————————————
Regional Equity Research Contact
Michael GREENALL, CFP Regional Head of Research T: (60) 3 2261 9088 E: [email protected]
———————————————————————————————————————————————————————————————————————————————————
Show Style "View Doc Map"
CIMB Conference / Events |
SGX-CIMB Catalist Day 20 November 2017; Singapore; Singapore —————————————————————————————————————————
CIMB Korea C-Suite Double Bagger Conference 22 - 23 November 2017; Malaysia; Seoul —————————————————————————————————————————
CIMB 10th Annual Malaysia Corporate Day 04 January 2018; Malaysia; Kuala Lumpur
IMPORTANT DISCLOSURES, INCLUDING ANY REQUIRED RESEARCH CERTIFICATIONS, ARE PROVIDED AT THE END OF THIS REPORT. IF THIS REPORT IS DISTRIBUTED IN THE UNITED STATES IT IS DISTRIBUTED BY CIMB SECURITIES (USA), INC. AND IS CONSIDERED THIRD-PARTY AFFILIATED RESEARCH.
Powered by the EFA Platform
Navigating Asia Pacific│Strategy│September 20, 2017
Strategy Note
IMPORTANT DISCLOSURES, INCLUDING ANY REQUIRED RESEARCH CERTIFICATIONS, ARE PROVIDED AT THE END OF THIS REPORT. IF THIS REPORT IS DISTRIBUTED IN THE UNITED STATES IT IS DISTRIBUTED BY CIMB SECURITIES (USA), INC. AND IS CONSIDERED THIRD-PARTY AFFILIATED RESEARCH. EFACustomEntityStatement|
Powered by the EFA Platform
Asia Pacific Strategy China’s Belt & Road: An Old-New Beginning ■ One Belt One Road (OBOR), China’s key national strategy, could be mutually
beneficial for China and OBOR countries, in our view. ■ We see infrastructure as the best angle for cooperation under the OBOR strategy. ■ We estimate investment mobilised by OBOR to boost GDP of emerging Asia (ex-
China) by 0.6% and that of ASEAN countries by 0.7% p.a.in 2017-2025F. ■ We recommend Chinese construction companies, capital goods and commodity
players, ASEAN construction companies and banks as key beneficiaries.
One Belt One Road - China’s key national strategy One Belt One Road (OBOR) was initiated by Chinese President Xi Jinping in 2013 and is one of China’s most important national strategies, in our view. The strategy covers c.67 countries, representing 62% of global population, 1/3 of global GDP and trade, and 75% of energy resources in 2015. These countries are important partners for China in terms of trade, investment and overseas projects. We think OBOR will be mutually beneficial for China and OBOR initiative countries and will be implemented in two “waves”. The first, Infrastructure Development, and the second, Connectivity. That said, there may also be security, political and economic risks.
Infrastructure investment – best angle of cooperation under OBOR Infrastructure is the best angle for cooperation between countries under the OBOR strategy, in our view. While the average quality of infrastructure in OBOR countries is close to the global average, there are huge gaps between the best and worst, implying great potential to address deficiency. The gap between infrastructure investment required to maintain economic growth and actual investment made over the next decade is also substantial, at c.5% of GDP for emerging Asia ex-China, based on ADB’s estimate.
OBOR to help narrow infra investment gap in emerging Asia Multilateral development banks like AIIB and ADB are important sources of infrastructure financing apart from the government and private sector. Significant progress has been made since China set up AIIB in 2015. We project the total infrastructure investment mobilised by the OBOR strategy in emerging Asia (ex-China) over 2017-2025F to be US$475bn/63bn from AIIB/ADB, which combined, will likely boost regional GDP by 0.6%.
Mutual benefits for ASEAN countries and Chinese corporates We estimate the additional infra investment in ASEAN countries to reach US$212bn over 2017 to 2025F under the OBOR strategy, accounting for 0.7% of GDP. Sector-wise, we forecast 1) additional 10% of steel exports from China; 2) 9% incremental cement capacity required; 3) 21% more new contracts in the region for Chinese construction companies and 4) 5% boost in exports for the Chinese heavy machinery industry.
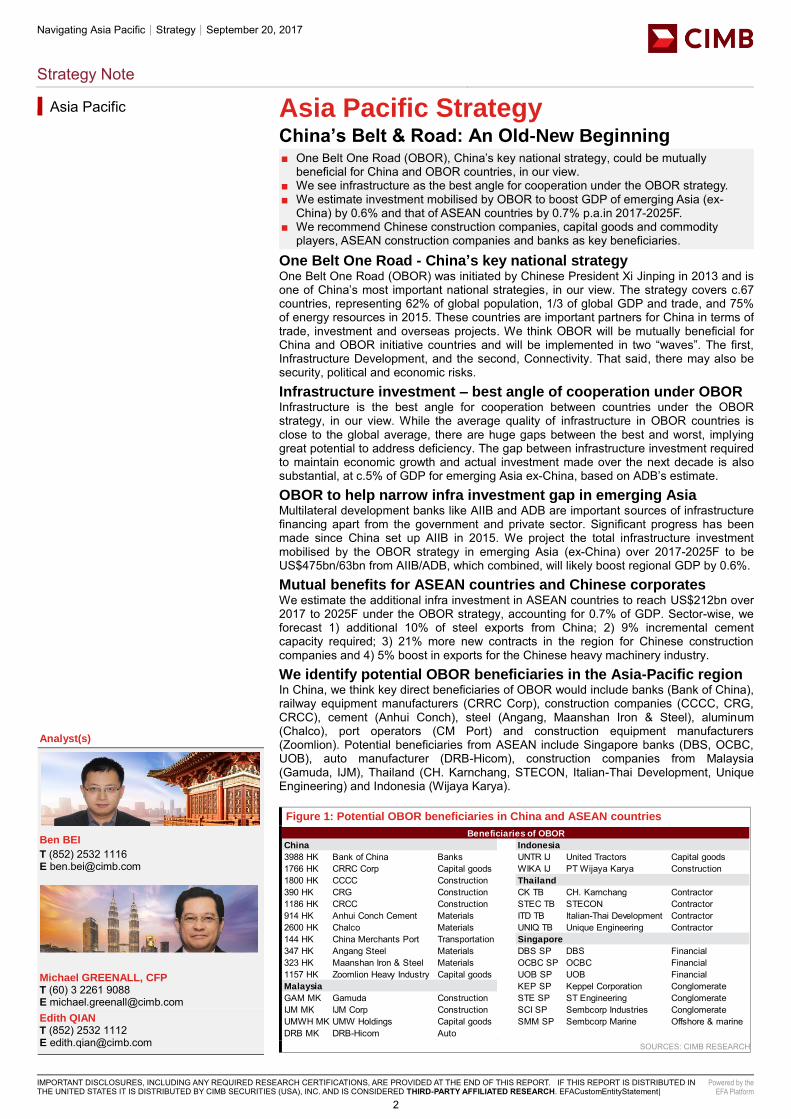
We identify potential OBOR beneficiaries in the Asia-Pacific region In China, we think key direct beneficiaries of OBOR would include banks (Bank of China), railway equipment manufacturers (CRRC Corp), construction companies (CCCC, CRG, CRCC), cement (Anhui Conch), steel (Angang, Maanshan Iron & Steel), aluminum (Chalco), port operators (CM Port) and construction equipment manufacturers (Zoomlion). Potential beneficiaries from ASEAN include Singapore banks (DBS, OCBC, UOB), auto manufacturer (DRB-Hicom), construction companies from Malaysia (Gamuda, IJM), Thailand (CH. Karnchang, STECON, Italian-Thai Development, Unique Engineering) and Indonesia (Wijaya Karya).
Figure 1: Potential OBOR beneficiaries in China and ASEAN countries
SOURCES: CIMB RESEARCH
Asia Pacific
Insert
Analyst(s)
Ben BEI
T (852) 2532 1116 E [email protected]
Michael GREENALL, CFP T (60) 3 2261 9088 E [email protected] Edith QIAN T (852) 2532 1112 E [email protected]
China Indonesia
3988 HK Bank of China Banks UNTR IJ United Tractors Capital goods1766 HK CRRC Corp Capital goods WIKA IJ PT Wijaya Karya Construction1800 HK CCCC Construction Thailand
390 HK CRG Construction CK TB CH. Karnchang Contractor1186 HK CRCC Construction STEC TB STECON Contractor914 HK Anhui Conch Cement Materials ITD TB Italian-Thai Development Contractor2600 HK Chalco Materials UNIQ TB Unique Engineering Contractor144 HK China Merchants Port Transportation Singapore
347 HK Angang Steel Materials DBS SP DBS Financial 323 HK Maanshan Iron & Steel Materials OCBC SP OCBC Financial 1157 HK Zoomlion Heavy Industry Capital goods UOB SP UOB Financial Malaysia KEP SP Keppel Corporation Conglomerate GAM MK Gamuda Construction STE SP ST Engineering ConglomerateIJM MK IJM Corp Construction SCI SP Sembcorp Industries Conglomerate UMWH MK UMW Holdings Capital goods SMM SP Sembcorp Marine Offshore & marine DRB MK DRB-Hicom Auto
Beneficiaries of OBOR
2
Malaysia│September 20, 2017
Economics Note
IMPORTANT DISCLOSURES, INCLUDING ANY REQUIRED RESEARCH CERTIFICATIONS, ARE PROVIDED AT THE END OF THIS REPORT. IF THIS REPORT IS DISTRIBUTED IN THE UNITED STATES IT IS DISTRIBUTED BY CIMB SECURITIES (USA), INC. AND IS CONSIDERED THIRD-PARTY AFFILIATED RESEARCH.
Powered by the EFA Platform
Economics Update Aug 2017 consumer price inflation ■ Headline inflation exceeded expectations in Aug, accelerating to 3.7% yoy. ■ Fuel inflation rebounded in Aug, on the back of monthly gains in retail fuel prices, a
trend that extends into Sep based on month-to-date pump prices. ■ Core inflation slipped in Aug due to dips in healthcare, recreation & culture and
miscellaneous goods and services. ■ We revise our inflation forecast upwards to 3.8% in 2017 but expect BNM to keep the
policy rate on hold at 3.00% this year.
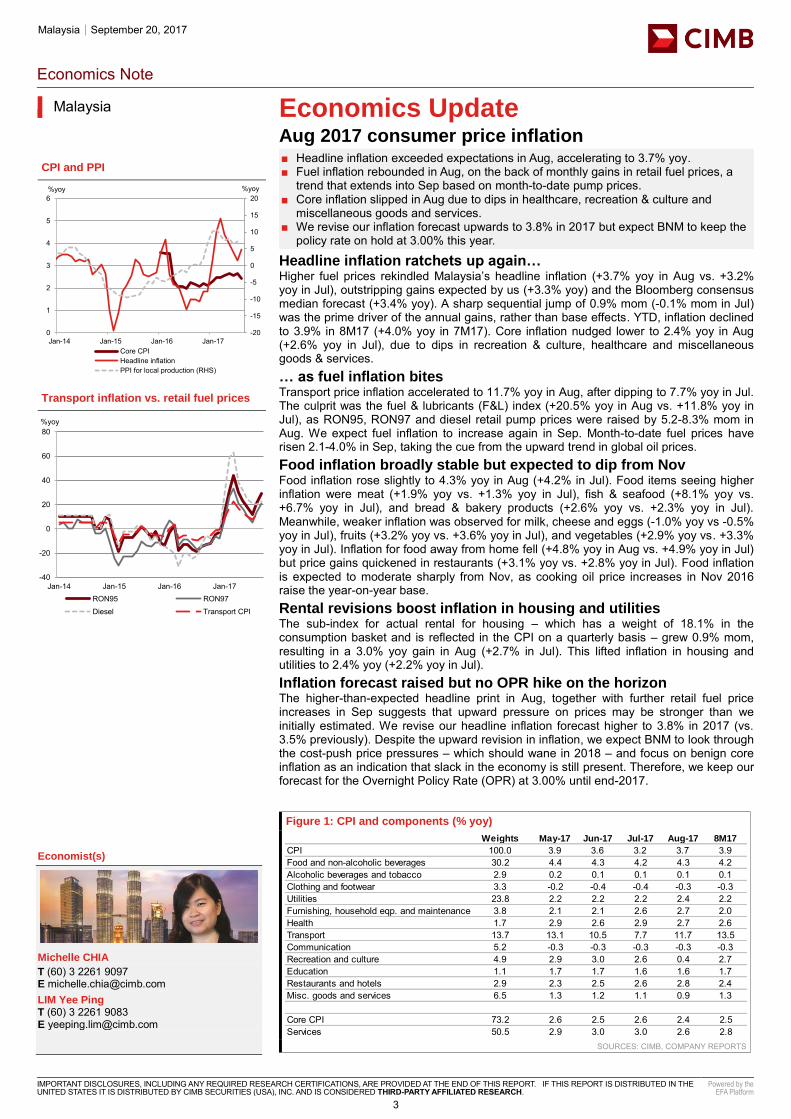
Headline inflation ratchets up again… Higher fuel prices rekindled Malaysia’s headline inflation (+3.7% yoy in Aug vs. +3.2% yoy in Jul), outstripping gains expected by us (+3.3% yoy) and the Bloomberg consensus median forecast (+3.4% yoy). A sharp sequential jump of 0.9% mom (-0.1% mom in Jul) was the prime driver of the annual gains, rather than base effects. YTD, inflation declined to 3.9% in 8M17 (+4.0% yoy in 7M17). Core inflation nudged lower to 2.4% yoy in Aug (+2.6% yoy in Jul), due to dips in recreation & culture, healthcare and miscellaneous goods & services. … as fuel inflation bites Transport price inflation accelerated to 11.7% yoy in Aug, after dipping to 7.7% yoy in Jul. The culprit was the fuel & lubricants (F&L) index (+20.5% yoy in Aug vs. +11.8% yoy in Jul), as RON95, RON97 and diesel retail pump prices were raised by 5.2-8.3% mom in Aug. We expect fuel inflation to increase again in Sep. Month-to-date fuel prices have risen 2.1-4.0% in Sep, taking the cue from the upward trend in global oil prices. Food inflation broadly stable but expected to dip from Nov Food inflation rose slightly to 4.3% yoy in Aug (+4.2% in Jul). Food items seeing higher inflation were meat (+1.9% yoy vs. +1.3% yoy in Jul), fish & seafood (+8.1% yoy vs. +6.7% yoy in Jul), and bread & bakery products (+2.6% yoy vs. +2.3% yoy in Jul). Meanwhile, weaker inflation was observed for milk, cheese and eggs (-1.0% yoy vs -0.5% yoy in Jul), fruits (+3.2% yoy vs. +3.6% yoy in Jul), and vegetables (+2.9% yoy vs. +3.3% yoy in Jul). Inflation for food away from home fell (+4.8% yoy in Aug vs. +4.9% yoy in Jul) but price gains quickened in restaurants (+3.1% yoy vs. +2.8% yoy in Jul). Food inflation is expected to moderate sharply from Nov, as cooking oil price increases in Nov 2016 raise the year-on-year base. Rental revisions boost inflation in housing and utilities The sub-index for actual rental for housing – which has a weight of 18.1% in the consumption basket and is reflected in the CPI on a quarterly basis – grew 0.9% mom, resulting in a 3.0% yoy gain in Aug (+2.7% in Jul). This lifted inflation in housing and utilities to 2.4% yoy (+2.2% yoy in Jul). Inflation forecast raised but no OPR hike on the horizon The higher-than-expected headline print in Aug, together with further retail fuel price increases in Sep suggests that upward pressure on prices may be stronger than we initially estimated. We revise our headline inflation forecast higher to 3.8% in 2017 (vs. 3.5% previously). Despite the upward revision in inflation, we expect BNM to look through the cost-push price pressures – which should wane in 2018 – and focus on benign core inflation as an indication that slack in the economy is still present. Therefore, we keep our forecast for the Overnight Policy Rate (OPR) at 3.00% until end-2017.
Figure 1: CPI and components (% yoy)
SOURCES: CIMB, COMPANY REPORTS
Malaysia
CPI and PPI
Transport inflation vs. retail fuel prices
Insert
Economist(s)
Michelle CHIA
T (60) 3 2261 9097 E [email protected] LIM Yee Ping T (60) 3 2261 9083 E [email protected]
-20
-15
-10
-5
0
5
10
15
20
0
1
2
3
4
5
6
Jan-14 Jan-15 Jan-16 Jan-17
%yoy%yoy
Core CPIHeadline inflationPPI for local production (RHS)
-40
-20
0
20
40
60
80
Jan-14 Jan-15 Jan-16 Jan-17
%yoy
RON95 RON97
Diesel Transport CPI
Weights May-17 Jun-17 Jul-17 Aug-17 8M17
CPI 100.0 3.9 3.6 3.2 3.7 3.9Food and non-alcoholic beverages 30.2 4.4 4.3 4.2 4.3 4.2Alcoholic beverages and tobacco 2.9 0.2 0.1 0.1 0.1 0.1Clothing and footwear 3.3 -0.2 -0.4 -0.4 -0.3 -0.3Utilities 23.8 2.2 2.2 2.2 2.4 2.2Furnishing, household eqp. and maintenance 3.8 2.1 2.1 2.6 2.7 2.0Health 1.7 2.9 2.6 2.9 2.7 2.6Transport 13.7 13.1 10.5 7.7 11.7 13.5Communication 5.2 -0.3 -0.3 -0.3 -0.3 -0.3Recreation and culture 4.9 2.9 3.0 2.6 0.4 2.7Education 1.1 1.7 1.7 1.6 1.6 1.7Restaurants and hotels 2.9 2.3 2.5 2.6 2.8 2.4Misc. goods and services 6.5 1.3 1.2 1.1 0.9 1.3
Core CPI 73.2 2.6 2.5 2.6 2.4 2.5Services 50.5 2.9 3.0 3.0 2.6 2.8
3
Telco - Integrated│Australia│Equity research│September 19, 2017
IMPORTANT DISCLOSURES REGARDING COMPANIES THAT ARE THE SUBJECT OF THIS REPORT AND AN EXPLANATION OF RECOMMENDATIONS CAN BE FOUND AT THE END OF THIS DOCUMENT. MORGANS FINANCIAL LIMITED (ABN 49 010 669 726) AFSL 235410 - A PARTICIPANT OF ASX GROUP
Powered by EFA
TPG Telecom
Spending up big in the years ahead
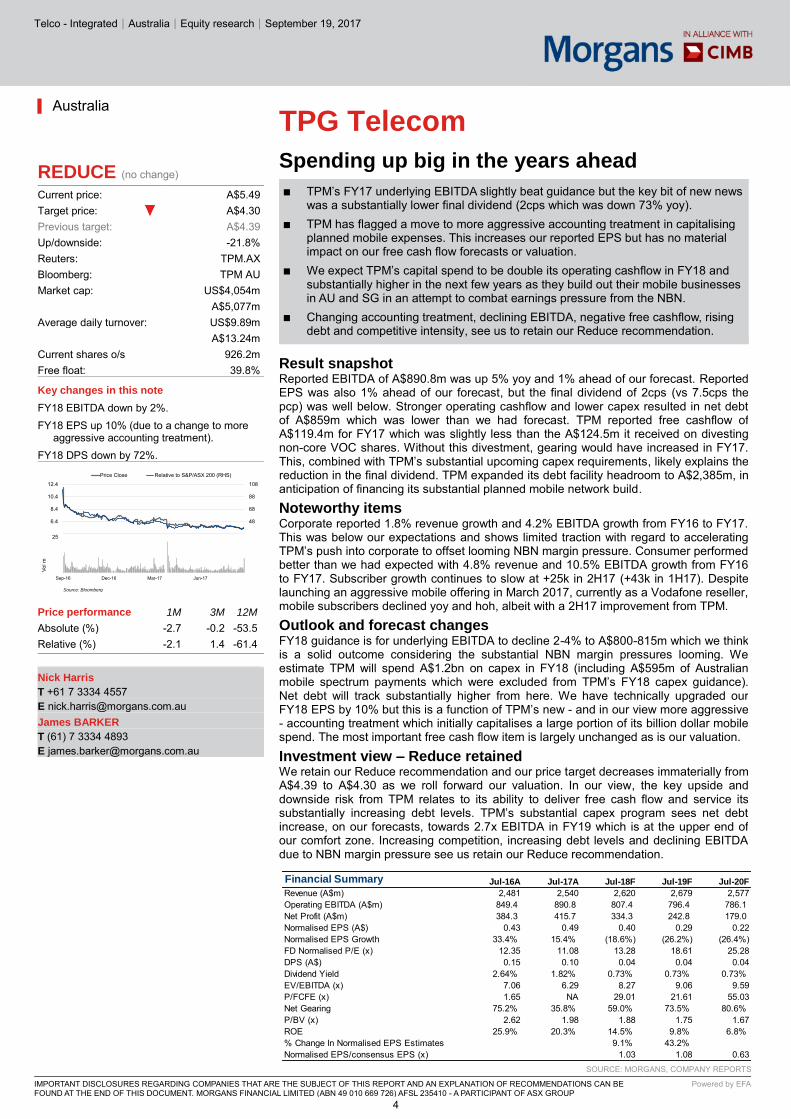
TPM’s FY17 underlying EBITDA slightly beat guidance but the key bit of new news ■was a substantially lower final dividend (2cps which was down 73% yoy).
TPM has flagged a move to more aggressive accounting treatment in capitalising ■planned mobile expenses. This increases our reported EPS but has no material impact on our free cash flow forecasts or valuation.
We expect TPM’s capital spend to be double its operating cashflow in FY18 and ■substantially higher in the next few years as they build out their mobile businesses in AU and SG in an attempt to combat earnings pressure from the NBN.
Changing accounting treatment, declining EBITDA, negative free cashflow, rising ■debt and competitive intensity, see us to retain our Reduce recommendation.
Result snapshot Reported EBITDA of A$890.8m was up 5% yoy and 1% ahead of our forecast. Reported EPS was also 1% ahead of our forecast, but the final dividend of 2cps (vs 7.5cps the pcp) was well below. Stronger operating cashflow and lower capex resulted in net debt of A$859m which was lower than we had forecast. TPM reported free cashflow of A$119.4m for FY17 which was slightly less than the A$124.5m it received on divesting non-core VOC shares. Without this divestment, gearing would have increased in FY17. This, combined with TPM’s substantial upcoming capex requirements, likely explains the reduction in the final dividend. TPM expanded its debt facility headroom to A$2,385m, in anticipation of financing its substantial planned mobile network build.
Noteworthy items Corporate reported 1.8% revenue growth and 4.2% EBITDA growth from FY16 to FY17. This was below our expectations and shows limited traction with regard to accelerating TPM’s push into corporate to offset looming NBN margin pressure. Consumer performed better than we had expected with 4.8% revenue and 10.5% EBITDA growth from FY16 to FY17. Subscriber growth continues to slow at +25k in 2H17 (+43k in 1H17). Despite launching an aggressive mobile offering in March 2017, currently as a Vodafone reseller, mobile subscribers declined yoy and hoh, albeit with a 2H17 improvement from TPM.
Outlook and forecast changes FY18 guidance is for underlying EBITDA to decline 2-4% to A$800-815m which we think is a solid outcome considering the substantial NBN margin pressures looming. We estimate TPM will spend A$1.2bn on capex in FY18 (including A$595m of Australian mobile spectrum payments which were excluded from TPM’s FY18 capex guidance). Net debt will track substantially higher from here. We have technically upgraded our FY18 EPS by 10% but this is a function of TPM’s new - and in our view more aggressive - accounting treatment which initially capitalises a large portion of its billion dollar mobile spend. The most important free cash flow item is largely unchanged as is our valuation.
Investment view – Reduce retained We retain our Reduce recommendation and our price target decreases immaterially from A$4.39 to A$4.30 as we roll forward our valuation. In our view, the key upside and downside risk from TPM relates to its ability to deliver free cash flow and service its substantially increasing debt levels. TPM’s substantial capex program sees net debt increase, on our forecasts, towards 2.7x EBITDA in FY19 which is at the upper end of our comfort zone. Increasing competition, increasing debt levels and declining EBITDA due to NBN margin pressure see us retain our Reduce recommendation.
SOURCE: MORGANS, COMPANY REPORTS
▎Australia
REDUCE (no change) Current price: A$5.49 Target price: A$4.30 Previous target: A$4.39 Up/downside: -21.8% Reuters: TPM.AX Bloomberg: TPM AU Market cap: US$4,054m A$5,077m Average daily turnover: US$9.89m A$13.24m Current shares o/s 926.2m Free float: 39.8%
Key changes in this note
FY18 EBITDA down by 2%. FY18 EPS up 10% (due to a change to more
aggressive accounting treatment). FY18 DPS down by 72%.
Price performance 1M 3M 12M
Absolute (%) -2.7 -0.2 -53.5 Relative (%) -2.1 1.4 -61.4 Nick Harris
T +61 7 3334 4557 E [email protected] James BARKER
T (61) 7 3334 4893 E [email protected]
Financial Summary Jul-16A Jul-17A Jul-18F Jul-19F Jul-20F
Revenue (A$m) 2,481 2,540 2,620 2,679 2,577Operating EBITDA (A$m) 849.4 890.8 807.4 796.4 786.1Net Profit (A$m) 384.3 415.7 334.3 242.8 179.0Normalised EPS (A$) 0.43 0.49 0.40 0.29 0.22Normalised EPS Growth 33.4% 15.4% (18.6%) (26.2%) (26.4%)FD Normalised P/E (x) 12.35 11.08 13.28 18.61 25.28DPS (A$) 0.15 0.10 0.04 0.04 0.04Dividend Yield 2.64% 1.82% 0.73% 0.73% 0.73%EV/EBITDA (x) 7.06 6.29 8.27 9.06 9.59P/FCFE (x) 1.65 NA 29.01 21.61 55.03Net Gearing 75.2% 35.8% 59.0% 73.5% 80.6%P/BV (x) 2.62 1.98 1.88 1.75 1.67ROE 25.9% 20.3% 14.5% 9.8% 6.8%% Change In Normalised EPS Estimates 9.1% 43.2%Normalised EPS/consensus EPS (x) 1.03 1.08 0.63
28
48
68
88
108
4.4
6.4
8.4
10.4
12.4
Price Close Relative to S&P/ASX 200 (RHS)
Source: Bloomberg
510152025
Sep-16 Dec-16 Mar-17 Jun-17
Vol m
4
Toll Roads│Australia│Equity research│September 20, 2017
IMPORTANT DISCLOSURES REGARDING COMPANIES THAT ARE THE SUBJECT OF THIS REPORT AND AN EXPLANATION OF RECOMMENDATIONS CAN BE FOUND AT THE END OF THIS DOCUMENT. MORGANS FINANCIAL LIMITED (ABN 49 010 669 726) AFSL 235410 - A PARTICIPANT OF ASX GROUP
Powered by EFA
Transurban Group
All we (might) need is just a little patience
The CFO’s presentation to the Morgans’ network highlighted the key value drivers. ■ We are seeking a more attractive entry point into this high quality stock. This may ■
arise if TCL raises capital as expected or if there is an uptick in government bond rates.
Adjustments to forecasts for development capex, reduced DRP take-up being ■replaced with an assumed $740m capital raising, and factoring in the 395 Express Lanes have reduced our 12 month target price 9 cps to $11.68ps. HOLD retained.
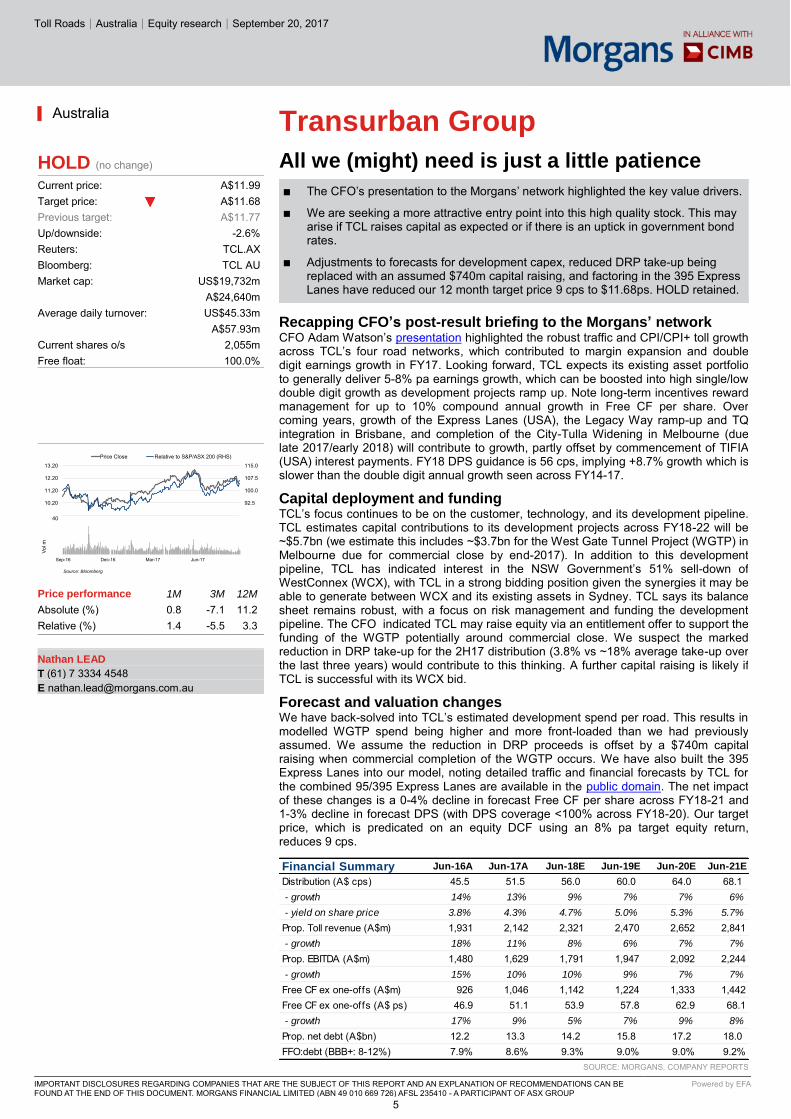
Recapping CFO’s post-result briefing to the Morgans’ network CFO Adam Watson’s presentation highlighted the robust traffic and CPI/CPI+ toll growth across TCL’s four road networks, which contributed to margin expansion and double digit earnings growth in FY17. Looking forward, TCL expects its existing asset portfolio to generally deliver 5-8% pa earnings growth, which can be boosted into high single/low double digit growth as development projects ramp up. Note long-term incentives reward management for up to 10% compound annual growth in Free CF per share. Over coming years, growth of the Express Lanes (USA), the Legacy Way ramp-up and TQ integration in Brisbane, and completion of the City-Tulla Widening in Melbourne (due late 2017/early 2018) will contribute to growth, partly offset by commencement of TIFIA (USA) interest payments. FY18 DPS guidance is 56 cps, implying +8.7% growth which is slower than the double digit annual growth seen across FY14-17.
Capital deployment and funding TCL’s focus continues to be on the customer, technology, and its development pipeline. TCL estimates capital contributions to its development projects across FY18-22 will be ~$5.7bn (we estimate this includes ~$3.7bn for the West Gate Tunnel Project (WGTP) in Melbourne due for commercial close by end-2017). In addition to this development pipeline, TCL has indicated interest in the NSW Government’s 51% sell-down of WestConnex (WCX), with TCL in a strong bidding position given the synergies it may be able to generate between WCX and its existing assets in Sydney. TCL says its balance sheet remains robust, with a focus on risk management and funding the development pipeline. The CFO indicated TCL may raise equity via an entitlement offer to support the funding of the WGTP potentially around commercial close. We suspect the marked reduction in DRP take-up for the 2H17 distribution (3.8% vs ~18% average take-up over the last three years) would contribute to this thinking. A further capital raising is likely if TCL is successful with its WCX bid.
Forecast and valuation changes We have back-solved into TCL’s estimated development spend per road. This results in modelled WGTP spend being higher and more front-loaded than we had previously assumed. We assume the reduction in DRP proceeds is offset by a $740m capital raising when commercial completion of the WGTP occurs. We have also built the 395 Express Lanes into our model, noting detailed traffic and financial forecasts by TCL for the combined 95/395 Express Lanes are available in the public domain. The net impact of these changes is a 0-4% decline in forecast Free CF per share across FY18-21 and 1-3% decline in forecast DPS (with DPS coverage <100% across FY18-20). Our target price, which is predicated on an equity DCF using an 8% pa target equity return, reduces 9 cps.
SOURCE: MORGANS, COMPANY REPORTS
▎Australia
HOLD (no change) Current price: A$11.99 Target price: A$11.68 Previous target: A$11.77 Up/downside: -2.6% Reuters: TCL.AX Bloomberg: TCL AU Market cap: US$19,732m A$24,640m Average daily turnover: US$45.33m A$57.93m Current shares o/s 2,055m Free float: 100.0%
Price performance 1M 3M 12M
Absolute (%) 0.8 -7.1 11.2 Relative (%) 1.4 -5.5 3.3 Nathan LEAD
T (61) 7 3334 4548 E [email protected]
Financial Summary Jun-16A Jun-17A Jun-18E Jun-19E Jun-20E Jun-21E
Distribution (A$ cps) 45.5 51.5 56.0 60.0 64.0 68.1 - growth 14% 13% 9% 7% 7% 6%
- yield on share price 3.8% 4.3% 4.7% 5.0% 5.3% 5.7%
Prop. Toll revenue (A$m) 1,931 2,142 2,321 2,470 2,652 2,841 - growth 18% 11% 8% 6% 7% 7%
Prop. EBITDA (A$m) 1,480 1,629 1,791 1,947 2,092 2,244 - growth 15% 10% 10% 9% 7% 7%
Free CF ex one-offs (A$m) 926 1,046 1,142 1,224 1,333 1,442Free CF ex one-offs (A$ ps) 46.9 51.1 53.9 57.8 62.9 68.1 - growth 17% 9% 5% 7% 9% 8%
Prop. net debt (A$bn) 12.2 13.3 14.2 15.8 17.2 18.0 FFO:debt (BBB+: 8-12%) 7.9% 8.6% 9.3% 9.0% 9.0% 9.2%
85.0
92.5
100.0
107.5
115.0
9.20
10.20
11.20
12.20
13.20
Price Close Relative to S&P/ASX 200 (RHS)
Source: Bloomberg
10203040
Sep-16 Dec-16 Mar-17 Jun-17
Vol m
5
Property Investment│Hong Kong
Company Flash Note
IMPORTANT DISCLOSURES, INCLUDING ANY REQUIRED RESEARCH CERTIFICATIONS, ARE PROVIDED AT THE END OF THIS REPORT. IF THIS REPORT IS DISTRIBUTED IN THE UNITED STATES IT IS DISTRIBUTED BY CIMB SECURITIES (USA), INC. AND IS CONSIDERED THIRD-PARTY AFFILIATED RESEARCH.
Powered by the EFA Platform
Insert Insert
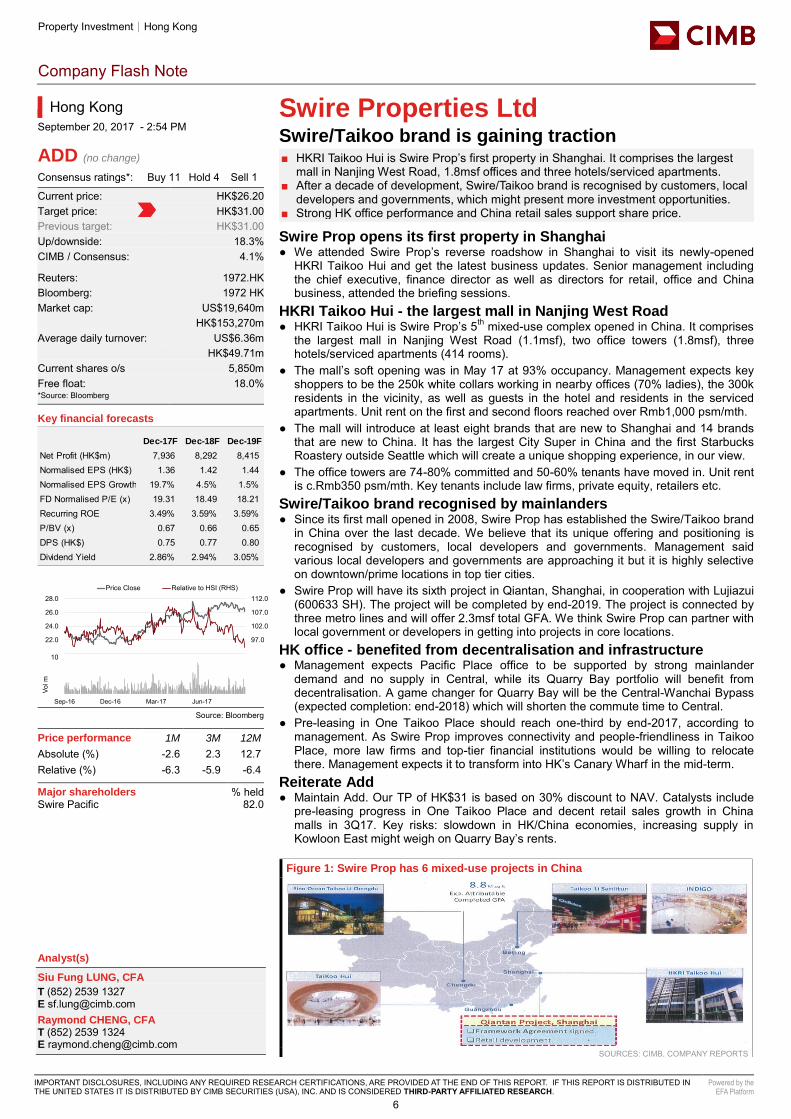
Swire Properties Ltd Swire/Taikoo brand is gaining traction ■ HKRI Taikoo Hui is Swire Prop’s first property in Shanghai. It comprises the largest
mall in Nanjing West Road, 1.8msf offices and three hotels/serviced apartments. ■ After a decade of development, Swire/Taikoo brand is recognised by customers, local
developers and governments, which might present more investment opportunities. ■ Strong HK office performance and China retail sales support share price.
Swire Prop opens its first property in Shanghai ● We attended Swire Prop’s reverse roadshow in Shanghai to visit its newly-opened
HKRI Taikoo Hui and get the latest business updates. Senior management including the chief executive, finance director as well as directors for retail, office and China business, attended the briefing sessions.
HKRI Taikoo Hui - the largest mall in Nanjing West Road ● HKRI Taikoo Hui is Swire Prop’s 5th mixed-use complex opened in China. It comprises
the largest mall in Nanjing West Road (1.1msf), two office towers (1.8msf), three hotels/serviced apartments (414 rooms).
● The mall’s soft opening was in May 17 at 93% occupancy. Management expects key shoppers to be the 250k white collars working in nearby offices (70% ladies), the 300k residents in the vicinity, as well as guests in the hotel and residents in the serviced apartments. Unit rent on the first and second floors reached over Rmb1,000 psm/mth.
● The mall will introduce at least eight brands that are new to Shanghai and 14 brands that are new to China. It has the largest City Super in China and the first Starbucks Roastery outside Seattle which will create a unique shopping experience, in our view.
● The office towers are 74-80% committed and 50-60% tenants have moved in. Unit rent is c.Rmb350 psm/mth. Key tenants include law firms, private equity, retailers etc.
Swire/Taikoo brand recognised by mainlanders ● Since its first mall opened in 2008, Swire Prop has established the Swire/Taikoo brand
in China over the last decade. We believe that its unique offering and positioning is recognised by customers, local developers and governments. Management said various local developers and governments are approaching it but it is highly selective on downtown/prime locations in top tier cities.
● Swire Prop will have its sixth project in Qiantan, Shanghai, in cooperation with Lujiazui (600633 SH). The project will be completed by end-2019. The project is connected by three metro lines and will offer 2.3msf total GFA. We think Swire Prop can partner with local government or developers in getting into projects in core locations.
HK office - benefited from decentralisation and infrastructure ● Management expects Pacific Place office to be supported by strong mainlander
demand and no supply in Central, while its Quarry Bay portfolio will benefit from decentralisation. A game changer for Quarry Bay will be the Central-Wanchai Bypass (expected completion: end-2018) which will shorten the commute time to Central.
● Pre-leasing in One Taikoo Place should reach one-third by end-2017, according to management. As Swire Prop improves connectivity and people-friendliness in Taikoo Place, more law firms and top-tier financial institutions would be willing to relocate there. Management expects it to transform into HK’s Canary Wharf in the mid-term.
Reiterate Add ● Maintain Add. Our TP of HK$31 is based on 30% discount to NAV. Catalysts include
pre-leasing progress in One Taikoo Place and decent retail sales growth in China malls in 3Q17. Key risks: slowdown in HK/China economies, increasing supply in Kowloon East might weigh on Quarry Bay’s rents.
Figure 1: Swire Prop has 6 mixed-use projects in China
SOURCES: CIMB, COMPANY REPORTS
Hong Kong
September 20, 2017 - 2:54 PM
ADD (no change) Consensus ratings*: Buy 11 Hold 4 Sell 1
Current price: HK$26.20 Target price: HK$31.00 Previous target: HK$31.00
Up/downside: 18.3% CIMB / Consensus: 4.1%
Reuters: 1972.HK Bloomberg: 1972 HK Market cap: US$19,640m HK$153,270m Average daily turnover: US$6.36m HK$49.71m Current shares o/s 5,850m Free float: 18.0% *Source: Bloomberg Key financial forecasts
Source: Bloomberg Price performance 1M 3M 12M
Absolute (%) -2.6 2.3 12.7 Relative (%) -6.3 -5.9 -6.4
Major shareholders % held Swire Pacific 82.0 Insert
Analyst(s)
Siu Fung LUNG, CFA
T (852) 2539 1327 E [email protected] Raymond CHENG, CFA T (852) 2539 1324 E [email protected]
Dec-17F Dec-18F Dec-19F
Net Profit (HK$m) 7,936 8,292 8,415Normalised EPS (HK$) 1.36 1.42 1.44Normalised EPS Growth 19.7% 4.5% 1.5%FD Normalised P/E (x) 19.31 18.49 18.21Recurring ROE 3.49% 3.59% 3.59%P/BV (x) 0.67 0.66 0.65DPS (HK$) 0.75 0.77 0.80Dividend Yield 2.86% 2.94% 3.05%
92.0
97.0
102.0
107.0
112.0
20.0
22.0
24.0
26.0
28.0Price Close Relative to HSI (RHS)
5
10
Sep-16 Dec-16 Mar-17 Jun-17
Vol m
6
Financial Services│India│September 20, 2017
Sector Note
IMPORTANT DISCLOSURES, INCLUDING ANY REQUIRED RESEARCH CERTIFICATIONS, ARE PROVIDED AT THE END OF THIS REPORT. IF THIS REPORT IS DISTRIBUTED IN THE UNITED STATES IT IS DISTRIBUTED BY CIMB SECURITIES (USA), INC. AND IS CONSIDERED THIRD-PARTY AFFILIATED RESEARCH.
Powered by the EFA Platform
Financial Services - Overall Asset quality bottoming out; valuations attractive ■ Corporate slippages are on a declining trend, in line with our thesis that a large part
of the stress has been recognised by the banks. ■ The resolution of the large stressed assets referred to NCLT could be a key sector
catalyst in the next 6-12 months. ■ Incremental NPL provisions for top 50 accounts of private lenders likely to be
manageable but PSU banks may be negatively affected given their weak profitability. ■ We believe the risk-reward is favourable for corporate lenders given attractive
valuations and improving ROEs. Maintain sector Overweight.
Corporate slippages have been trending down Corporate slippages are on a declining trend, as seen in the latest quarterly results (1QFY18). A large part of corporate slippages in 1QFY18 came from one chunky account in the electronics sector. Delinquencies were largely from agri loans due to farm loan waivers and retail/SME segment which was affected by demonetisation. Given that the bulk of the stress has been recognised by the banks we expect overall corporate delinquencies to start declining from the current levels.
Resolution of stressed loans referred to NCLT is key The resolution of stressed loans referred to National Company Law Tribunal (NCLT) could be a key catalyst in the next 6-12 months. Though banks have to make incremental provisions of up to 50% on these loans, mandated by RBI, this should improve overall coverage and strengthen balance sheets. We do not expect material incremental provisions on these loans for private banks, though the profitability of PSU banks could be dampened. Any positive resolution of stressed loans could re-rate corporate lenders.
Historical evidence of asset quality recovery across cycles Our analysis suggests that almost 35% of delinquencies were recovered or upgraded in the last 17 years. We estimate actual write-offs comprised 27% of bad loans in the last 17 years. Adjusted write-offs (after recoveries from the written-off accounts in the subsequent periods) only comprised 22% of bad loans in the past 17 years, based on our estimates. We expect overall credit costs to peak in FY18F as asset quality issues ease. We expect credit costs to normalise in FY19F onwards.
Margins negatively affected by downward re-pricing of loans Retail banks’ margins has remained stable in last 1-2 quarters (HDFCB witnessed 10bp margin uptick in 1QFY18), while corporate lenders’ margins were negative affected by the repricing of loans from base rate to MCLR. We were surprised by the pace at which corporate lenders’ margins were affected. Margins may face pressure in next 1-2 quarters but this could be partially cushioned by lower interest reversals on NPLs and improved funding profiles. We think margins will stabilise in 3Q-4QFY18F and improve thereafter.
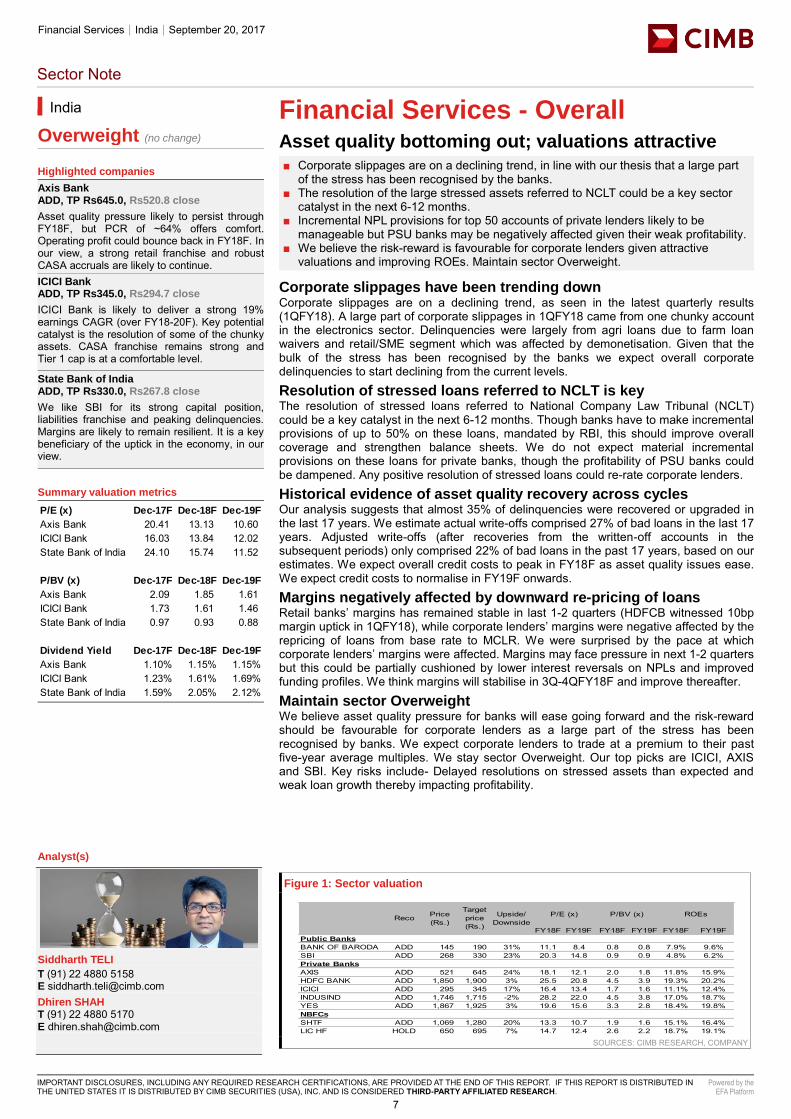
Maintain sector Overweight We believe asset quality pressure for banks will ease going forward and the risk-reward should be favourable for corporate lenders as a large part of the stress has been recognised by banks. We expect corporate lenders to trade at a premium to their past five-year average multiples. We stay sector Overweight. Our top picks are ICICI, AXIS and SBI. Key risks include- Delayed resolutions on stressed assets than expected and weak loan growth thereby impacting profitability.
Figure 1: Sector valuation
SOURCES: CIMB RESEARCH, COMPANY
India
Overweight (no change)
Highlighted companies
Axis Bank ADD, TP Rs645.0, Rs520.8 close
Asset quality pressure likely to persist through FY18F, but PCR of ~64% offers comfort. Operating profit could bounce back in FY18F. In our view, a strong retail franchise and robust CASA accruals are likely to continue. ICICI Bank ADD, TP Rs345.0, Rs294.7 close
ICICI Bank is likely to deliver a strong 19% earnings CAGR (over FY18-20F). Key potential catalyst is the resolution of some of the chunky assets. CASA franchise remains strong and Tier 1 cap is at a comfortable level.
State Bank of India ADD, TP Rs330.0, Rs267.8 close
We like SBI for its strong capital position, liabilities franchise and peaking delinquencies. Margins are likely to remain resilient. It is a key beneficiary of the uptick in the economy, in our view.
Summary valuation metrics
Analyst(s)
Siddharth TELI
T (91) 22 4880 5158 E [email protected] Dhiren SHAH T (91) 22 4880 5170 E [email protected]
P/E (x) Dec-17F Dec-18F Dec-19F
Axis Bank 20.41 13.13 10.60 ICICI Bank 16.03 13.84 12.02 State Bank of India 24.10 15.74 11.52
P/BV (x) Dec-17F Dec-18F Dec-19F
Axis Bank 2.09 1.85 1.61 ICICI Bank 1.73 1.61 1.46 State Bank of India 0.97 0.93 0.88
Dividend Yield Dec-17F Dec-18F Dec-19F
Axis Bank 1.10% 1.15% 1.15%ICICI Bank 1.23% 1.61% 1.69%State Bank of India 1.59% 2.05% 2.12%
FY18F FY19F FY18F FY19F FY18F FY19FPublic Banks
BANK OF BARODA ADD 145 190 31% 11.1 8.4 0.8 0.8 7.9% 9.6%SBI ADD 268 330 23% 20.3 14.8 0.9 0.9 4.8% 6.2%Private Banks
AXIS ADD 521 645 24% 18.1 12.1 2.0 1.8 11.8% 15.9%HDFC BANK ADD 1,850 1,900 3% 25.5 20.8 4.5 3.9 19.3% 20.2%ICICI ADD 295 345 17% 16.4 13.4 1.7 1.6 11.1% 12.4%INDUSIND ADD 1,746 1,715 -2% 28.2 22.0 4.5 3.8 17.0% 18.7%YES ADD 1,867 1,925 3% 19.6 15.6 3.3 2.8 18.4% 19.8%NBFCs
SHTF ADD 1,069 1,280 20% 13.3 10.7 1.9 1.6 15.1% 16.4%LIC HF HOLD 650 695 7% 14.7 12.4 2.6 2.2 18.7% 19.1%
P/BV (x) ROEsReco Price (Rs.)
Target price (Rs.)
Upside/ Downside
P/E (x)
7
Autos│Indonesia
Company Flash Note
IMPORTANT DISCLOSURES, INCLUDING ANY REQUIRED RESEARCH CERTIFICATIONS, ARE PROVIDED AT THE END OF THIS REPORT. IF THIS REPORT IS DISTRIBUTED IN THE UNITED STATES IT IS DISTRIBUTED BY CIMB SECURITIES (USA), INC. AND IS CONSIDERED THIRD-PARTY AFFILIATED RESEARCH.
Powered by the EFA Platform
Insert Insert
Astra International Few surprises in August ■ ASII’s wholesale 4W volumes slowed down in Aug, though 8M17 was still in line with
our expectation. ■ We are positive on its resilient 4W market share in Aug 17, but this could come at the
expense of margin given the company’s aggressive price discounting. ■ 2W sales volume continued to see positive momentum, offering a glimmer of hope of
a recovery in consumer spending in the lower-middle segment.
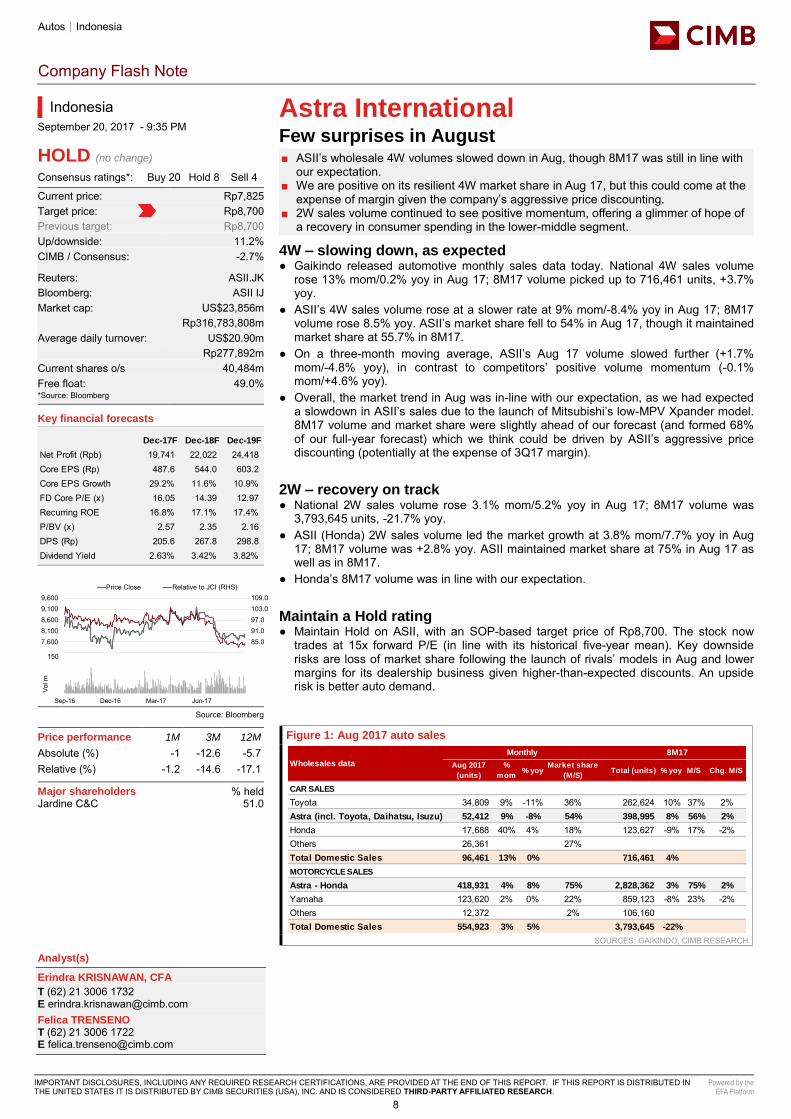
4W – slowing down, as expected ● Gaikindo released automotive monthly sales data today. National 4W sales volume
rose 13% mom/0.2% yoy in Aug 17; 8M17 volume picked up to 716,461 units, +3.7% yoy.
● ASII’s 4W sales volume rose at a slower rate at 9% mom/-8.4% yoy in Aug 17; 8M17 volume rose 8.5% yoy. ASII’s market share fell to 54% in Aug 17, though it maintained market share at 55.7% in 8M17.
● On a three-month moving average, ASII’s Aug 17 volume slowed further (+1.7% mom/-4.8% yoy), in contrast to competitors’ positive volume momentum (-0.1% mom/+4.6% yoy).
● Overall, the market trend in Aug was in-line with our expectation, as we had expected a slowdown in ASII’s sales due to the launch of Mitsubishi’s low-MPV Xpander model. 8M17 volume and market share were slightly ahead of our forecast (and formed 68% of our full-year forecast) which we think could be driven by ASII’s aggressive price discounting (potentially at the expense of 3Q17 margin).
2W – recovery on track ● National 2W sales volume rose 3.1% mom/5.2% yoy in Aug 17; 8M17 volume was
3,793,645 units, -21.7% yoy. ● ASII (Honda) 2W sales volume led the market growth at 3.8% mom/7.7% yoy in Aug
17; 8M17 volume was +2.8% yoy. ASII maintained market share at 75% in Aug 17 as well as in 8M17.
● Honda’s 8M17 volume was in line with our expectation.
Maintain a Hold rating ● Maintain Hold on ASII, with an SOP-based target price of Rp8,700. The stock now
trades at 15x forward P/E (in line with its historical five-year mean). Key downside risks are loss of market share following the launch of rivals’ models in Aug and lower margins for its dealership business given higher-than-expected discounts. An upside risk is better auto demand.
Figure 1: Aug 2017 auto sales
SOURCES: GAIKINDO, CIMB RESEARCH
Aug 2017
(units)
%
mom% yoy
Market share
(M/S)Total (units) % yoy M/S Chg. M/S
CAR SALES
Toyota 34,809 9% -11% 36% 262,624 10% 37% 2%Astra (incl. Toyota, Daihatsu, Isuzu) 52,412 9% -8% 54% 398,995 8% 56% 2%
Honda 17,688 40% 4% 18% 123,627 -9% 17% -2%Others 26,361 27%Total Domestic Sales 96,461 13% 0% 716,461 4%
MOTORCYCLE SALES
Astra - Honda 418,931 4% 8% 75% 2,828,362 3% 75% 2%
Yamaha 123,620 2% 0% 22% 859,123 -8% 23% -2%Others 12,372 2% 106,160 Total Domestic Sales 554,923 3% 5% 3,793,645 -22%
Monthly 8M17
Wholesales data
Indonesia
September 20, 2017 - 9:35 PM
HOLD (no change) Consensus ratings*: Buy 20 Hold 8 Sell 4
Current price: Rp7,825 Target price: Rp8,700 Previous target: Rp8,700
Up/downside: 11.2% CIMB / Consensus: -2.7%
Reuters: ASII.JK Bloomberg: ASII IJ Market cap: US$23,856m Rp316,783,808m Average daily turnover: US$20.90m Rp277,892m Current shares o/s 40,484m Free float: 49.0% *Source: Bloomberg Key financial forecasts
Source: Bloomberg Price performance 1M 3M 12M
Absolute (%) -1 -12.6 -5.7 Relative (%) -1.2 -14.6 -17.1
Major shareholders % held Jardine C&C 51.0 Insert
Analyst(s)
Erindra KRISNAWAN, CFA
T (62) 21 3006 1732 E [email protected] Felica TRENSENO T (62) 21 3006 1722 E [email protected]
Dec-17F Dec-18F Dec-19F
Net Profit (Rpb) 19,741 22,022 24,418Core EPS (Rp) 487.6 544.0 603.2Core EPS Growth 29.2% 11.6% 10.9%FD Core P/E (x) 16.05 14.39 12.97Recurring ROE 16.8% 17.1% 17.4%P/BV (x) 2.57 2.35 2.16DPS (Rp) 205.6 267.8 298.8Dividend Yield 2.63% 3.42% 3.82%
79.085.091.097.0103.0109.0
7,1007,6008,1008,6009,1009,600
Price Close Relative to JCI (RHS)
50
100
150
Sep-16 Dec-16 Mar-17 Jun-17
Vol m
8
Property│Indonesia│September 20, 2017
Sector Note │ Alpha series
IMPORTANT DISCLOSURES, INCLUDING ANY REQUIRED RESEARCH CERTIFICATIONS, ARE PROVIDED AT THE END OF THIS REPORT. IF THIS REPORT IS DISTRIBUTED IN THE UNITED STATES IT IS DISTRIBUTED BY CIMB SECURITIES (USA), INC. AND IS CONSIDERED THIRD-PARTY AFFILIATED RESEARCH.
Powered by the EFA Platform
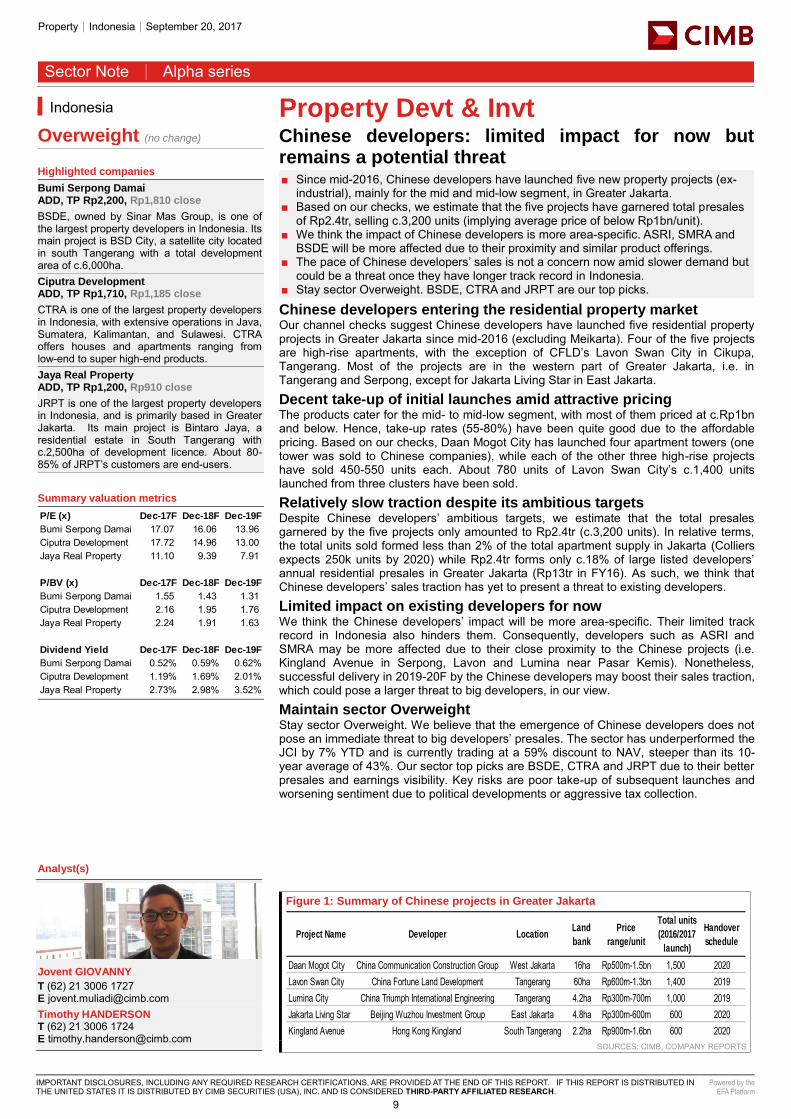
Property Devt & Invt Chinese developers: limited impact for now but remains a potential threat ■ Since mid-2016, Chinese developers have launched five new property projects (ex-
industrial), mainly for the mid and mid-low segment, in Greater Jakarta. ■ Based on our checks, we estimate that the five projects have garnered total presales
of Rp2.4tr, selling c.3,200 units (implying average price of below Rp1bn/unit). ■ We think the impact of Chinese developers is more area-specific. ASRI, SMRA and
BSDE will be more affected due to their proximity and similar product offerings. ■ The pace of Chinese developers’ sales is not a concern now amid slower demand but
could be a threat once they have longer track record in Indonesia. ■ Stay sector Overweight. BSDE, CTRA and JRPT are our top picks.
Chinese developers entering the residential property market Our channel checks suggest Chinese developers have launched five residential property projects in Greater Jakarta since mid-2016 (excluding Meikarta). Four of the five projects are high-rise apartments, with the exception of CFLD’s Lavon Swan City in Cikupa, Tangerang. Most of the projects are in the western part of Greater Jakarta, i.e. in Tangerang and Serpong, except for Jakarta Living Star in East Jakarta.
Decent take-up of initial launches amid attractive pricing The products cater for the mid- to mid-low segment, with most of them priced at c.Rp1bn and below. Hence, take-up rates (55-80%) have been quite good due to the affordable pricing. Based on our checks, Daan Mogot City has launched four apartment towers (one tower was sold to Chinese companies), while each of the other three high-rise projects have sold 450-550 units each. About 780 units of Lavon Swan City’s c.1,400 units launched from three clusters have been sold.
Relatively slow traction despite its ambitious targets Despite Chinese developers’ ambitious targets, we estimate that the total presales garnered by the five projects only amounted to Rp2.4tr (c.3,200 units). In relative terms, the total units sold formed less than 2% of the total apartment supply in Jakarta (Colliers expects 250k units by 2020) while Rp2.4tr forms only c.18% of large listed developers’ annual residential presales in Greater Jakarta (Rp13tr in FY16). As such, we think that Chinese developers’ sales traction has yet to present a threat to existing developers.
Limited impact on existing developers for now We think the Chinese developers’ impact will be more area-specific. Their limited track record in Indonesia also hinders them. Consequently, developers such as ASRI and SMRA may be more affected due to their close proximity to the Chinese projects (i.e. Kingland Avenue in Serpong, Lavon and Lumina near Pasar Kemis). Nonetheless, successful delivery in 2019-20F by the Chinese developers may boost their sales traction, which could pose a larger threat to big developers, in our view.
Maintain sector Overweight Stay sector Overweight. We believe that the emergence of Chinese developers does not pose an immediate threat to big developers’ presales. The sector has underperformed the JCI by 7% YTD and is currently trading at a 59% discount to NAV, steeper than its 10-year average of 43%. Our sector top picks are BSDE, CTRA and JRPT due to their better presales and earnings visibility. Key risks are poor take-up of subsequent launches and worsening sentiment due to political developments or aggressive tax collection.
Figure 1: Summary of Chinese projects in Greater Jakarta
SOURCES: CIMB, COMPANY REPORTS
Indonesia
Overweight (no change)
Highlighted companies
Bumi Serpong Damai ADD, TP Rp2,200, Rp1,810 close
BSDE, owned by Sinar Mas Group, is one of the largest property developers in Indonesia. Its main project is BSD City, a satellite city located in south Tangerang with a total development area of c.6,000ha. Ciputra Development ADD, TP Rp1,710, Rp1,185 close
CTRA is one of the largest property developers in Indonesia, with extensive operations in Java, Sumatera, Kalimantan, and Sulawesi. CTRA offers houses and apartments ranging from low-end to super high-end products. Jaya Real Property ADD, TP Rp1,200, Rp910 close
JRPT is one of the largest property developers in Indonesia, and is primarily based in Greater Jakarta. Its main project is Bintaro Jaya, a residential estate in South Tangerang with c.2,500ha of development licence. About 80-85% of JRPT’s customers are end-users. Summary valuation metrics
Insert
Analyst(s)
Jovent GIOVANNY
T (62) 21 3006 1727 E [email protected] Timothy HANDERSON T (62) 21 3006 1724 E [email protected]
P/E (x) Dec-17F Dec-18F Dec-19F
Bumi Serpong Damai 17.07 16.06 13.96 Ciputra Development 17.72 14.96 13.00 Jaya Real Property 11.10 9.39 7.91
P/BV (x) Dec-17F Dec-18F Dec-19F
Bumi Serpong Damai 1.55 1.43 1.31 Ciputra Development 2.16 1.95 1.76 Jaya Real Property 2.24 1.91 1.63
Dividend Yield Dec-17F Dec-18F Dec-19F
Bumi Serpong Damai 0.52% 0.59% 0.62%Ciputra Development 1.19% 1.69% 2.01%Jaya Real Property 2.73% 2.98% 3.52%
Project Name Developer LocationLand
bank
Price
range/unit
Total units
(2016/2017
launch)
Handover
schedule
Daan Mogot City China Communication Construction Group West Jakarta 16ha Rp500m-1.5bn 1,500 2020Lavon Swan City China Fortune Land Development Tangerang 60ha Rp600m-1.3bn 1,400 2019Lumina City China Triumph International Engineering Tangerang 4.2ha Rp300m-700m 1,000 2019Jakarta Living Star Beijing Wuzhou Investment Group East Jakarta 4.8ha Rp300m-600m 600 2020Kingland Avenue Hong Kong Kingland South Tangerang 2.2ha Rp900m-1.6bn 600 2020
9
Semiconductor│South Korea
Company Flash Note
IMPORTANT DISCLOSURES, INCLUDING ANY REQUIRED RESEARCH CERTIFICATIONS, ARE PROVIDED AT THE END OF THIS REPORT. IF THIS REPORT IS DISTRIBUTED IN THE UNITED STATES IT IS DISTRIBUTED BY CIMB SECURITIES (USA), INC. AND IS CONSIDERED THIRD-PARTY AFFILIATED RESEARCH.
Powered by the EFA Platform
Insert Insert
SK Hynix Toshiba deal likely closing in favour of Hynix ■ Bloomberg reported that Toshiba’s board agreed to sell its NAND flash business to a
tri-nation consortium headed by Bain Capital. ■ With limited control (max 15% stake within the Bain consortium), near-term benefit for
Hynix should be limited. ■ We, however, believe technology collaboration and better coordination of capacity
expansion for Toshiba and Hynix could become feasible with the deal.
Toshiba’s flip flopping likely coming to an end ● According to Bloomberg and local Japanese press reports, the 7-month-long bidding
process to sell Toshiba’s NAND flash business unit is likely coming to an end soon, with Toshiba’s board agreeing to the proposal of Bain consortium today.
● The auction has long been fairly unpredictable with Toshiba continuously changing its stance over three main bidder groups (Bain Capital, Western Digital, and Hon Hai).
No details of Bain’s proposal available yet ● With no official disclosure or comment available from Toshiba and final stock purchase
agreement (SPA) yet to come, Bain consortium’s proposal details remain unknown, except for the funding.
● According to Bloomberg, Bain, Toshiba, SK Hynix and Hoya will pay about JPY960bn for common and convertible stock, while Apple, Dell, Kingston Technology, and Seagate will inject JPY440bn for convertible and non-convertible preferred stock.
● The special purpose entity for the acquisition will be called ‘Pangea’ and will receive about JPY600bn in loans. The participation of state-backed investors from Japan (the Innovation Network Corp of Japan and the Development Bank of Japan) for the Bain consortium remains unclear.
Limited near-term impact for Hynix ● We find today’s news as positive for the investment sentiment on Hynix, with higher
possibility of Hynix’s participation in Toshiba’s chip business purchase. While the acquisition by the Western Digital camp could be largely neutral to Hynix, Hon Hai’s win could have been the worst case for Hynix and the NAND industry.
● We, however, see limited benefit for Hynix in the near-term from the potential Toshiba acquisition, as Hynix would be just one of many stakeholders of the Bain Consortium.
● Potential financial burden for Hynix from the deal would be negligible, considering our estimates for Hynix’s net cash level (W2.8tr at end-FY17F) and free cash flow (W4.1tr and W7.2tr in FY17F and FY18F respectively).
Major NAND customers’ participation bodes well for NAND demand ● We believe the deal participation of major NAND customers, including Apple and Dell,
should suggest continuously tight supply of NAND in the foreseeable future. ● Our checks suggest these major NAND customers have been keen to work out a long-
term volume supply contract with the likes of Samsung Electronics but do not appear to feel safe about the supply conditions for the next year.
● We envision potential technology collaboration and better coordination of capacity expansion for Toshiba and Hynix should become more feasible if the deal goes through as reported.
Stronger for memory cycle ahead; Add maintained ● We expect memory upcycle to persist well into next year, with Hynix being one of the
major beneficiaries. We maintain Add and our target price, which is based on 1.6x FY18F P/BV (historical 10-year average). Key risk to our Add call is Hynix’s execution on new memory processes (1xnm for DRAM and 72-layer 3D NAND).
Figure 1: NAND flash market share based on value
SOURCES: IHS, Company data, CIMB Research
32% 29% 28% 31%36% 37%
19% 25% 22% 19%
19% 17%
20% 19%20%
16%
16%15%
18% 17% 19%21%
18% 19%
10% 10% 10% 12% 10% 11%
0%
10%
20%
30%
40%
50%
60%
70%
80%
90%
100%
2012 2013 2014 2015 2016 1H17SEC Toshiba Western Digital Micron/Intel SK Hynix
South Korea
September 20, 2017 - 7:11 PM
ADD (no change) Consensus ratings*: Buy 33 Hold 5 Sell 0
Current price: W80,700 Target price: W95,000 Previous target: W95,000
Up/downside: 17.7% CIMB / Consensus: 4.3%
Reuters: 000660.KS Bloomberg: 000660 KS Market cap: US$51,932m W58,749,792m Average daily turnover: US$229.1m W261,948m Current shares o/s 728.0m Free float: 70.9% *Source: Bloomberg Key financial forecasts
Source: Bloomberg Price performance 1M 3M 12M
Absolute (%) 20.4 26.1 105.6 Relative (%) 18 24.1 86.3
Major shareholders % held SKT 21.1 Insert
Analyst
Dohoon LEE
T (82) 2 6730 6121 E [email protected]
Dec-17F Dec-18F Dec-19F
Net Profit (Wb) 10,343 10,726 9,951Normalised EPS (W) 14,208 14,734 13,670Normalised EPS Growth 250% 4% (7%)FD Normalised P/E (x) 5.68 5.48 5.90Recurring ROE 35.8% 27.7% 20.6%P/BV (x) 1.74 1.34 1.11DPS (W) 970 1,164 1,455Dividend Yield 1.20% 1.44% 1.80%
90110130150170190
34,00044,00054,00064,00074,00084,000
Price Close Relative to KOSPI (RHS)
5
10
15
Sep-16 Dec-16 Mar-17 Jun-17
Vol m
10
Gaming│Malaysia│September 20, 2017
Company Note
IMPORTANT DISCLOSURES, INCLUDING ANY REQUIRED RESEARCH CERTIFICATIONS, ARE PROVIDED AT THE END OF THIS REPORT. IF THIS REPORT IS DISTRIBUTED IN THE UNITED STATES IT IS DISTRIBUTED BY CIMB SECURITIES (USA), INC. AND IS CONSIDERED THIRD-PARTY AFFILIATED RESEARCH.
Powered by the EFA Platform
Insert Insert
Berjaya Sports Toto Appealing dividend yields ■ Berjaya Sports Toto (BST) reported 1QFY4/18 core net profit of RM68.7m; broadly in
line at 24% of our and 27% of the market’s full-year expectations. ■ The group declared 1Q18 DPS of 4 sen (vs. 1Q17 DPS: 4 sen). ■ 1Q18 sales and earnings growth yoy was fuelled by H.R. Owen due to higher vehicle
sales from new product launches as well as a lower prize payout ratio from STM. ■ We tweak up our FY18-20F EPS by 3.5-3.7% for housekeeping purposes and lower
our pay-out ratio assumption. ■ We upgrade our call to an Add in view of the share price retracement and we think
that its FY18-20F estimated yields of 6.4-6.7% should keep the stock attractive.
1QFY18 EPS broadly in line BST reported 1QFY4/18 turnover of RM1.5bn (+2.5% yoy) while core net earnings (after stripping out forex gain and reversal of inventories) increased 1.5% yoy to RM68.7m. This was broadly in line at 24% of our and 27% of the market’s full-year estimates.
4 sen DPS declared, within expectations The group also declared 1QFY18 DPS of 4 sen (vs. 1Q17 DPS: 4 sen), which represents a payout ratio of 78%. This was in line with our full-year DPS estimate of 14.8 sen (based on an 80% payout ratio assumption).
1QFY18 pre-tax profit helped by a better showing from H.R. Owen Overall, 1QFY18 yoy revenue growth was mainly fuelled by the higher contribution from H.R. Owen (a luxury car distributor and 72%-owned subsidiary of BST’s Philippine subsidiary). The improved earnings from H.R. Owen (+124% yoy) and Sports Toto Malaysia helped to offset the weaker contribution stemming from its Philippine Gaming Management Corporation (PGMC), which saw a 25.2% yoy decline in pre-tax profit on the back of lower lease rental income and higher operating expenses.
Gaming business better due to lower prize payout ratio STM, the group’s principal number forecast operator (NFO) operations, experienced declining revenue growth whereby sales declined by 2.3% yoy but pre-tax profit grew by 2.3% yoy. STM’s profitability was helped by a lower prize payout during the quarter. We estimate that 1Q18’s prize payout ratio was at 71.7% compared to 1Q17’s payout ratio of 73% (-1.3% pts yoy).
Upgrade to Add; dividend yields are attractive at 6.4-6.7% We tweak up our FY18-20F EPS by 3.5-3.7% for housekeeping purposes following the release of the group’s annual report and we impute a lower pay-out ratio assumption. However, we are upgrading our call to an Add from Hold as valuations are now attractive following the 22% share price retracement over the last 6 months and we think that estimated dividend yields of 6.4-6.7% should keep the stock attractive at these levels. Our DDM-based target price is lifted slightly to RM2.85.
Key risks Upside risks to our call include lower-than-expected prize payout ratios and better-than-expected dividend payout, while downside risks include further proliferation of illegal gaming operators.
SOURCE: COMPANY DATA, CIMB FORECASTS
Malaysia
ADD (previously HOLD) Consensus ratings*: Buy 6 Hold 6 Sell 1
Current price: RM2.32 Target price: RM2.85 Previous target: RM2.80
Up/downside: 22.9% CIMB / Consensus: 0.2%
Reuters: BSTB.KL Bloomberg: BST MK Market cap: US$746.3m RM3,125m Average daily turnover: US$0.76m RM3.25m Current shares o/s: 1,351m Free float: 63.3% *Source: Bloomberg Key changes in this note
FY18-20F EPS increased by 3.5-3.7%.
Source: Bloomberg
Price performance 1M 3M 12M Absolute (%) 1.3 -9.7 -31 Relative (%) 1.5 -9.3 -38.1
Major shareholders % held Gateway Benefit SB 23.2 Berjaya Land 13.5 Insert
Analyst(s)
Kristine WONG
T (60) 3 2261 9085 E [email protected]
Financial Summary Apr-16A Apr-17A Apr-18F Apr-19F Apr-20F
Revenue (RMm) 5,563 5,735 5,905 6,042 6,186Operating EBITDA (RMm) 522.0 419.3 468.6 479.1 487.8Net Profit (RMm) 306.2 241.3 259.5 265.9 272.6Core EPS (RM) 0.23 0.18 0.19 0.20 0.20Core EPS Growth (19.4%) (21.2%) 7.5% 2.5% 2.5%FD Core P/E (x) 10.24 12.99 12.08 11.79 11.50DPS (RM) 0.19 0.14 0.15 0.16 0.16Dividend Yield 8.19% 6.03% 6.62% 6.79% 6.96%EV/EBITDA (x) 7.25 9.34 7.84 7.56 7.30P/FCFE (x) 4.30 15.44 8.16 13.85 13.31Net Gearing 73.5% 90.8% 41.0% 35.3% 30.0%P/BV (x) 4.09 4.08 2.49 2.39 2.29ROE 42.2% 31.4% 25.6% 20.7% 20.4%% Change In Core EPS Estimates 3.72% 3.53% 3.70%CIMB/consensus EPS (x) 0.90 0.89 0.93
55.0
72.9
90.7
2.10
2.60
3.10
Price Close Relative to FBMKLCI (RHS)
20406080
Sep-16 Dec-16 Mar-17 Jun-17
Vol m
11
Automobiles and Parts│Malaysia│September 20, 2017
Sector Note
IMPORTANT DISCLOSURES, INCLUDING ANY REQUIRED RESEARCH CERTIFICATIONS, ARE PROVIDED AT THE END OF THIS REPORT. IF THIS REPORT IS DISTRIBUTED IN THE UNITED STATES IT IS DISTRIBUTED BY CIMB SECURITIES (USA), INC. AND IS CONSIDERED THIRD-PARTY AFFILIATED RESEARCH.
Powered by the EFA Platform
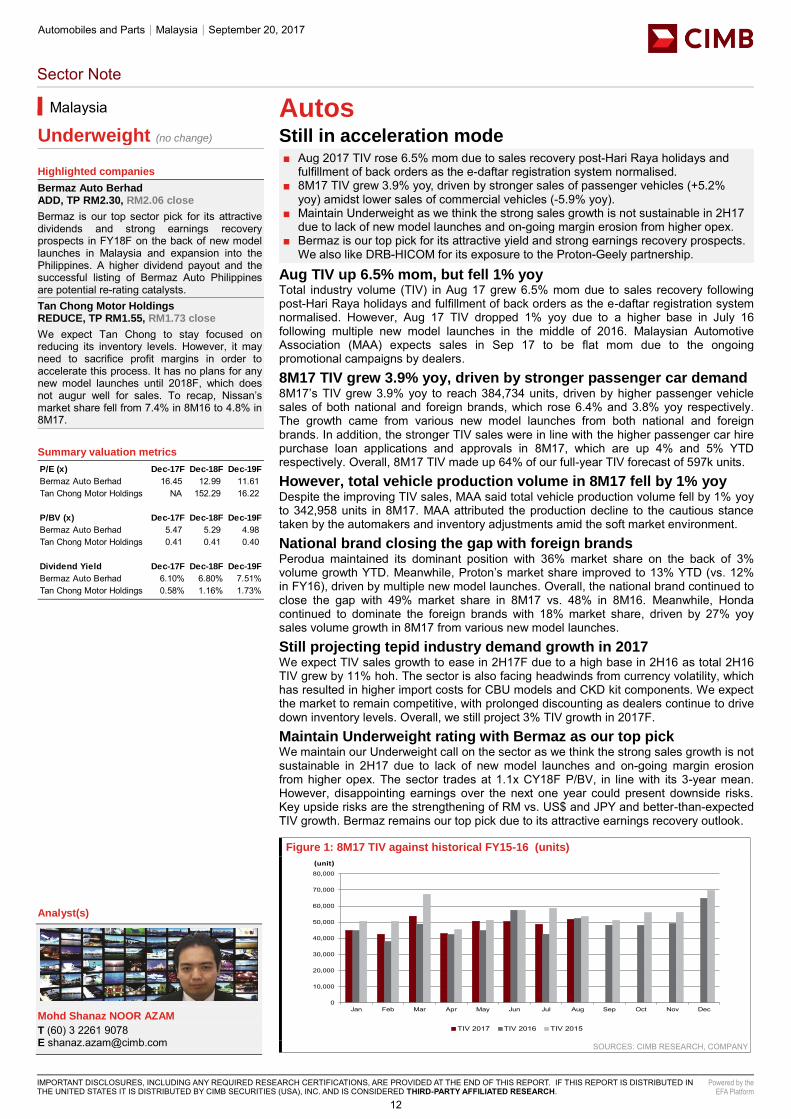
Autos Still in acceleration mode ■ Aug 2017 TIV rose 6.5% mom due to sales recovery post-Hari Raya holidays and
fulfillment of back orders as the e-daftar registration system normalised. ■ 8M17 TIV grew 3.9% yoy, driven by stronger sales of passenger vehicles (+5.2%
yoy) amidst lower sales of commercial vehicles (-5.9% yoy). ■ Maintain Underweight as we think the strong sales growth is not sustainable in 2H17
due to lack of new model launches and on-going margin erosion from higher opex. ■ Bermaz is our top pick for its attractive yield and strong earnings recovery prospects.
We also like DRB-HICOM for its exposure to the Proton-Geely partnership.
Aug TIV up 6.5% mom, but fell 1% yoy Total industry volume (TIV) in Aug 17 grew 6.5% mom due to sales recovery following post-Hari Raya holidays and fulfillment of back orders as the e-daftar registration system normalised. However, Aug 17 TIV dropped 1% yoy due to a higher base in July 16 following multiple new model launches in the middle of 2016. Malaysian Automotive Association (MAA) expects sales in Sep 17 to be flat mom due to the ongoing promotional campaigns by dealers.
8M17 TIV grew 3.9% yoy, driven by stronger passenger car demand 8M17’s TIV grew 3.9% yoy to reach 384,734 units, driven by higher passenger vehicle sales of both national and foreign brands, which rose 6.4% and 3.8% yoy respectively. The growth came from various new model launches from both national and foreign brands. In addition, the stronger TIV sales were in line with the higher passenger car hire purchase loan applications and approvals in 8M17, which are up 4% and 5% YTD respectively. Overall, 8M17 TIV made up 64% of our full-year TIV forecast of 597k units.
However, total vehicle production volume in 8M17 fell by 1% yoy Despite the improving TIV sales, MAA said total vehicle production volume fell by 1% yoy to 342,958 units in 8M17. MAA attributed the production decline to the cautious stance taken by the automakers and inventory adjustments amid the soft market environment.
National brand closing the gap with foreign brands Perodua maintained its dominant position with 36% market share on the back of 3% volume growth YTD. Meanwhile, Proton’s market share improved to 13% YTD (vs. 12% in FY16), driven by multiple new model launches. Overall, the national brand continued to close the gap with 49% market share in 8M17 vs. 48% in 8M16. Meanwhile, Honda continued to dominate the foreign brands with 18% market share, driven by 27% yoy sales volume growth in 8M17 from various new model launches.
Still projecting tepid industry demand growth in 2017 We expect TIV sales growth to ease in 2H17F due to a high base in 2H16 as total 2H16 TIV grew by 11% hoh. The sector is also facing headwinds from currency volatility, which has resulted in higher import costs for CBU models and CKD kit components. We expect the market to remain competitive, with prolonged discounting as dealers continue to drive down inventory levels. Overall, we still project 3% TIV growth in 2017F.
Maintain Underweight rating with Bermaz as our top pick We maintain our Underweight call on the sector as we think the strong sales growth is not sustainable in 2H17 due to lack of new model launches and on-going margin erosion from higher opex. The sector trades at 1.1x CY18F P/BV, in line with its 3-year mean. However, disappointing earnings over the next one year could present downside risks. Key upside risks are the strengthening of RM vs. US$ and JPY and better-than-expected TIV growth. Bermaz remains our top pick due to its attractive earnings recovery outlook.
Figure 1: 8M17 TIV against historical FY15-16 (units)
SOURCES: CIMB RESEARCH, COMPANY
Malaysia
Underweight (no change)
Highlighted companies
Bermaz Auto Berhad ADD, TP RM2.30, RM2.06 close
Bermaz is our top sector pick for its attractive dividends and strong earnings recovery prospects in FY18F on the back of new model launches in Malaysia and expansion into the Philippines. A higher dividend payout and the successful listing of Bermaz Auto Philippines are potential re-rating catalysts. Tan Chong Motor Holdings REDUCE, TP RM1.55, RM1.73 close
We expect Tan Chong to stay focused on reducing its inventory levels. However, it may need to sacrifice profit margins in order to accelerate this process. It has no plans for any new model launches until 2018F, which does not augur well for sales. To recap, Nissan’s market share fell from 7.4% in 8M16 to 4.8% in 8M17.
Summary valuation metrics
Insert
Analyst(s)
Mohd Shanaz NOOR AZAM
T (60) 3 2261 9078 E [email protected]
P/E (x) Dec-17F Dec-18F Dec-19F
Bermaz Auto Berhad 16.45 12.99 11.61 Tan Chong Motor Holdings NA 152.29 16.22
P/BV (x) Dec-17F Dec-18F Dec-19F
Bermaz Auto Berhad 5.47 5.29 4.98 Tan Chong Motor Holdings 0.41 0.41 0.40
Dividend Yield Dec-17F Dec-18F Dec-19F
Bermaz Auto Berhad 6.10% 6.80% 7.51%Tan Chong Motor Holdings 0.58% 1.16% 1.73%
0
10,000
20,000
30,000
40,000
50,000
60,000
70,000
80,000
Jan Feb Mar Apr May Jun Jul Aug Sep Oct Nov Dec
(unit)
TIV 2017 TIV 2016 TIV 2015
12
Malaysia│September 20, 2017
Strategy Note
IMPORTANT DISCLOSURES, INCLUDING ANY REQUIRED RESEARCH CERTIFICATIONS, ARE PROVIDED AT THE END OF THIS REPORT. IF THIS REPORT IS DISTRIBUTED IN THE UNITED STATES IT IS DISTRIBUTED BY CIMB SECURITIES (USA), INC. AND IS CONSIDERED THIRD-PARTY AFFILIATED RESEARCH.
Powered by the EFA Platform
Malaysia Strategy Investor sentiment: Current vs. Jan-Feb 17 ■ We spent many weeks marketing our 2H economic and strategy outlook to investors. ■ Foreign investors are more positive and some have raised their position in Malaysia to
Overweight. However, foreign investors’ sentiments were not unanimous. ■ Domestic funds were less upbeat given the strong 8% YTD gain in KLCI. ■ Top questions are on (1) GDP growth numbers; (2) consumer sentiment; and (3)
timing of the 14TH general election for the country. ■ Maintain our KLCI target of 1,790 and top three picks for the market.
Foreign funds interests in Malaysia continue to improve We spent several weeks marketing our 2H17 economic and strategy outlook to 178 investors from 52 investment firms in Kuala Lumpur, Bangkok, Singapore and Hong Kong. Overall, domestic funds were less upbeat compared to the start of the year, following the strong YTD KLCI performance. However, we noted stronger foreign funds interests compared to our marketing trip in Jan-Feb 2017 due to stronger-than-expected GDP growth of 5.7% in 1H17.
Areas of macro interests have shifted to GDP growth At the start of the year, foreign investors were more interested in our forex views but that has now shifted to the sustainability of the strong 1H17 GDP growth as well as better appreciation of key drivers behind the GDP. We sensed that foreign investors are now more comfortable with the ringgit, which has appreciated 7.3% YTD to RM4.1875/US$1. In terms of investment themes, investors are most keen on our PNB transformation, tourism, GE14 and progress of the small-mid cap research schemes (MiDs) themes.
Key questions at the top of investors’ minds Top questions on strategy are: 1) potential timeline and market impact of GE14, 2) potential reasons for slower-than-expected corporate earnings growth against better-than-expected GDP growth, 3) whether the PNB transformation will unlock value for companies and 4) which companies offer the best exposure to the infrastructure and consumer stories in Malaysia. Key questions on macro were potential measures in Budget 2018, which we think is likely to maintain a prudent fiscal deficit and focus on advancing infrastructure investments, improving business conditions for SMEs, spurring productivity growth and providing fiscal support to lower income households.
Casting an eye over Malaysia’s improving fundamentals Investors broadly agreed that macro risks had subsided, following the stronger-than-expected upturn in Malaysia’s economy (1H17: +5.7% yoy; 2017F: +5.4%). Many, however, pointed out that consumer confidence, business sentiment and corporate earnings continued to lag the robust headline GDP growth numbers. A key driver of sequential gains in real GDP growth was the recovery in the upstream and downstream palm oil output after weather-related disruptions last year. Other sectors that contributed to accelerating growth in 1H17 were E&E, retail trade and finance.
Taking a breather on monetary policy As economic momentum reasserts itself in Malaysia and inflationary pressures gradually moderate, the urgency for monetary policy to pull strings from the top has reduced. Investors concurred that there was little urgency for BNM to raise or lower the Overnight Policy Rate from the current rate of 3%, at this juncture. There were also divergent views on whether the market’s more dovish view of global interest rates in the next year or the more hawkish guidance by central bankers in the US and Eurozone would prevail.
Maintain KLCI target and our top picks Investors generally concur with our view that the Malaysia market is likely to remain range-bound as the market awaits new catalysts to drive the market. We are of the view that potential catalysts for KLCI could include stronger-than-expected corporate earnings and/or strong foreign funds inflows. We maintain our end-2017 KLCI target of 1,790 points (16x P/E) and our top three picks continue to be Axiata, Tenaga and Gamuda.
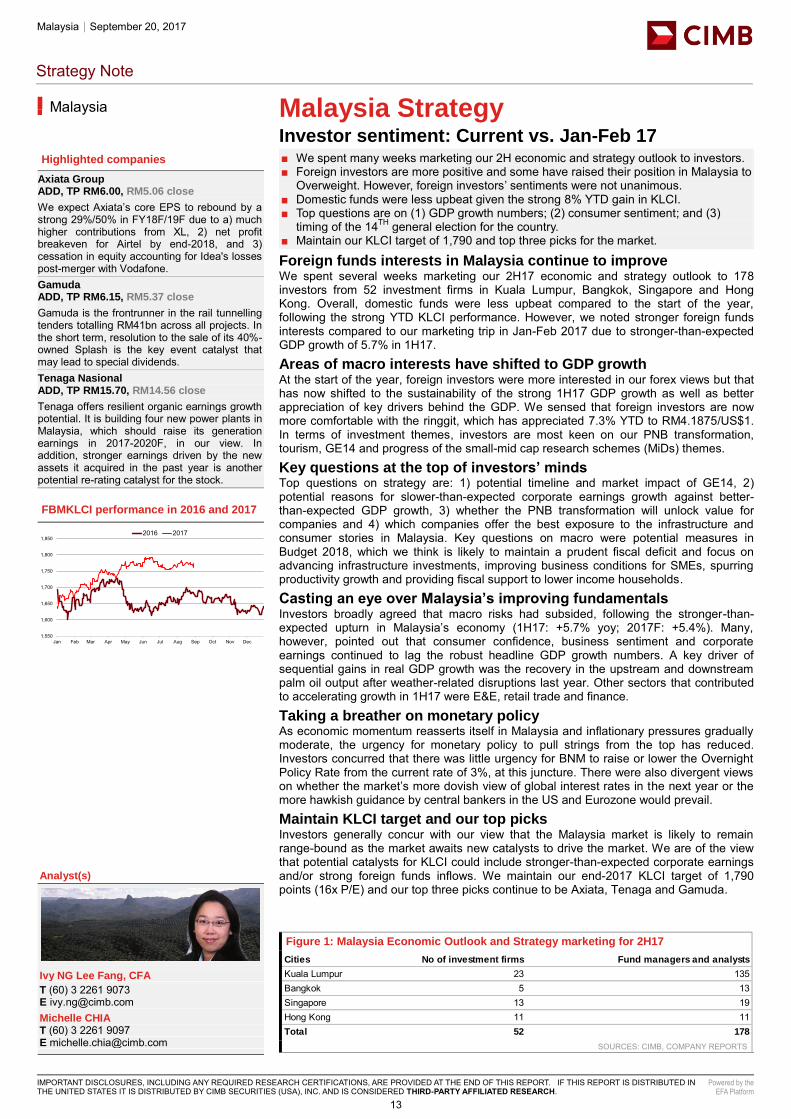
Figure 1: Malaysia Economic Outlook and Strategy marketing for 2H17
SOURCES: CIMB, COMPANY REPORTS
Malaysia
Highlighted companies
Axiata Group ADD, TP RM6.00, RM5.06 close
We expect Axiata’s core EPS to rebound by a strong 29%/50% in FY18F/19F due to a) much higher contributions from XL, 2) net profit breakeven for Airtel by end-2018, and 3) cessation in equity accounting for Idea's losses post-merger with Vodafone. Gamuda ADD, TP RM6.15, RM5.37 close
Gamuda is the frontrunner in the rail tunnelling tenders totalling RM41bn across all projects. In the short term, resolution to the sale of its 40%-owned Splash is the key event catalyst that may lead to special dividends. Tenaga Nasional ADD, TP RM15.70, RM14.56 close
Tenaga offers resilient organic earnings growth potential. It is building four new power plants in Malaysia, which should raise its generation earnings in 2017-2020F, in our view. In addition, stronger earnings driven by the new assets it acquired in the past year is another potential re-rating catalyst for the stock.
FBMKLCI performance in 2016 and 2017
Insert
Analyst(s)
Ivy NG Lee Fang, CFA
T (60) 3 2261 9073 E [email protected] Michelle CHIA T (60) 3 2261 9097 E [email protected]
1,550
1,600
1,650
1,700
1,750
1,800
1,850
Jan Feb Mar Apr May Jun Jul Aug Sep Oct Nov Dec
2016 2017
Cities No of investment firms Fund managers and analysts
Kuala Lumpur 23 135Bangkok 5 13Singapore 13 19Hong Kong 11 11Total 52 178
13
Technology Components│Singapore│September 20, 2017 Shariah Compliant
Eyes on the Ground
IMPORTANT DISCLOSURES, INCLUDING ANY REQUIRED RESEARCH CERTIFICATIONS, ARE PROVIDED AT THE END OF THIS REPORT. IF THIS REPORT IS DISTRIBUTED IN THE UNITED STATES IT IS DISTRIBUTED BY CIMB SECURITIES (USA), INC. AND IS CONSIDERED THIRD-PARTY AFFILIATED RESEARCH.
Powered by the EFA Platform
Willas-Array Opportunities in distribution ■ WAE is an established electronic components distributor. ■ The company was listed on the SGX in 2001 and dual-listed on the Stock Exchange
of Hong Kong in 2013. ■ Management expects market conditions to be challenging in FY18F but still sees
growth opportunities in the automotive and home appliances segments. ■ We note that a single supplier accounted for 40.7% of WAE’s FY3/17 purchases. ■ WAE trades at a historical FY17 P/BV of 0.6x and FY17 dividend yield of 6.8%.
What it does WAE was established in the early 1980s and listed on the Main Board of SGX in 2001. The company also dual-listed on the Main Board of The Stock Exchange of Hong Kong in 2013. WAE is engaged in the distribution of electronic components used in industrial, audio and video, telecommunications, home appliance, lighting, electronic manufacturing services and automotive segments. The company also provides engineering solutions. Established player Backed by long-standing relationships with more than 20 internationally-reputable principal suppliers, WAE distributes over 10,000 product items to over 3,000 customers. Its main markets are China, Hong Kong and Taiwan. WAE has established a network of offices that are strategically located in Beijing, Chengdu, Chongqing, Guangzhou, Qingdao, Shanghai, Shenzhen, Xiamen and Zhongshan. It has a subsidiary in Shanghai, which serves as a logistics centre for the group in Northern China. Key business segments are telecommunications and industrials In FY17, China accounted for 98% of revenue, while Taiwan accounted for the remaining 2%. WAE’s three largest revenue contributors in FY17 were telecommunications (27%), industrials (22%) and home appliances (13%). The automotive segment registered the strongest yoy revenue growth of 32.4% in FY17 and accounted for 11% of sales in FY17 (FY16: 9%). Key risks are customer concentration and supplier risk According to management, in FY17, sales to the group’s five largest customers accounted for approximately 20.0% of total sales for the year and the single largest customer accounted for approximately 5.9% of revenue. Purchases from the group’s five largest suppliers accounted for approximately 87.7% of WAE’s total purchases for FY17 and the single largest supplier accounted for approximately 40.7%. Outlook Management expects market conditions to remain challenging in the year ahead, in line with China’s slowing economic growth. Although it admits that the electronic components industry is unlikely to experience exponential growth in the near term, management is confident that WAE’s business is viable because of the diverse usage of electronic components. Management plans to focus its resources on potential growth segments, such as automotive and home appliances. Historical valuations WAE trades at a historical FY17 P/E of 8.7x (local peers’ average: 30.2x) and P/BV of 0.6x (local peers’ average: 0.74x). Historical FY17 dividend yield was 6.8%. Net gearing at end Mar-17 was 0.95x.
SOURCE: COMPANY DATA, CIMB
Singapore
NON RATED Current price: S$0.79 Consensus Tgt Price: N/A Up/downside: N/A Reuters: WLAR.SI Bloomberg: WAE SP Market cap: US$44.73m S$60.31m Average daily turnover: US$0.01m S$0.01m Current shares o/s: 75.50m Free float: 54.9%
Source: Bloomberg Price performance 1M 3M 12M
Absolute (%) -1.3 4.6 31.7 Relative (%) -0.5 5.3 18.6
Major shareholders % held Max Power Assets Ltd 23.7 Kwok Chan Cheung 10.4 Yeoman 3-Rights Value 8.2
This Eyes On the Ground report represents a preliminary assessment of the subject company, and does not represent initiation into CIMB's coverage universe. It does not carry investment ratings and CIMB does not commit to regular updates on an ongoing basis.
Insert
Analyst(s)
William TNG, CFA
T (65) 6210 8676 E [email protected]
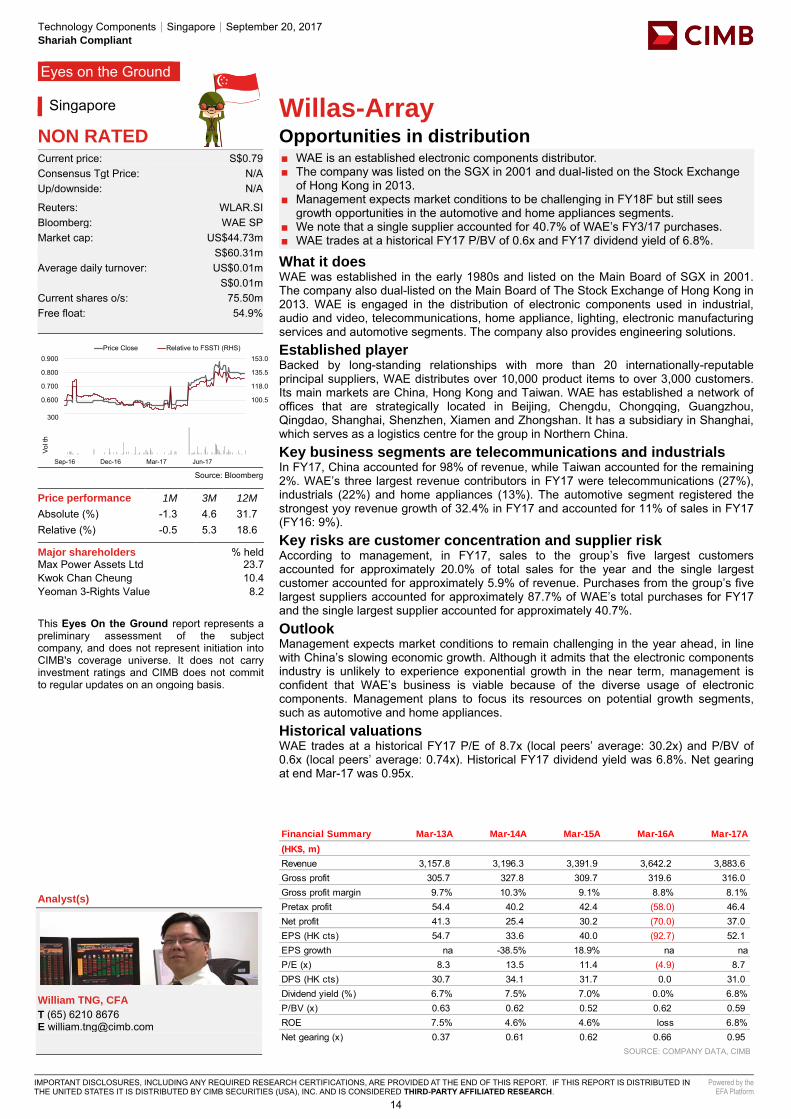
Financial Summary Mar-13A Mar-14A Mar-15A Mar-16A Mar-17A
(HK$, m)
Revenue 3,157.8 3,196.3 3,391.9 3,642.2 3,883.6Gross profit 305.7 327.8 309.7 319.6 316.0Gross profit margin 9.7% 10.3% 9.1% 8.8% 8.1%Pretax profit 54.4 40.2 42.4 (58.0) 46.4Net profit 41.3 25.4 30.2 (70.0) 37.0EPS (HK cts) 54.7 33.6 40.0 (92.7) 52.1EPS growth na -38.5% 18.9% na naP/E (x) 8.3 13.5 11.4 (4.9) 8.7DPS (HK cts) 30.7 34.1 31.7 0.0 31.0Dividend yield (%) 6.7% 7.5% 7.0% 0.0% 6.8%P/BV (x) 0.63 0.62 0.52 0.62 0.59ROE 7.5% 4.6% 4.6% loss 6.8%Net gearing (x) 0.37 0.61 0.62 0.66 0.95
83.0
100.5
118.0
135.5
153.0
0.500
0.600
0.700
0.800
0.900Price Close Relative to FSSTI (RHS)
100
200
300
Sep-16 Dec-16 Mar-17 Jun-17
Vol t
h
14
Telco - Mobile│Thailand│September 20, 2017 Shariah Compliant
Company Note
IMPORTANT DISCLOSURES, INCLUDING ANY REQUIRED RESEARCH CERTIFICATIONS, ARE PROVIDED AT THE END OF THIS REPORT. IF THIS REPORT IS DISTRIBUTED IN THE UNITED STATES IT IS DISTRIBUTED BY CIMB SECURITIES (USA), INC. AND IS CONSIDERED THIRD-PARTY AFFILIATED RESEARCH.
Powered by the EFA Platform
Insert Insert
Total Access Communication Misplaced optimism ■ Maintain Reduce due to possible delays in the 2.3GHz deal and spectrum auctions in
FY18. ■ We raise our TP by 8.3% to THB53.63 as we roll forward our valuation to FY18F. ■ We think investors are too optimistic on the 2.3GHz deal and better cost structure. ■ DTAC’s EV/EBITDA looks cheap in FY17F but could rise in FY19F. ■ Upside risks to our call are stronger revenue from 2.3GHz and lower network costs.
Too optimistic Our recent discussions with investors indicate that the market is overly optimistic on DTAC on many fronts, i.e. revenue market share gain from the 2.3GHz deal, not needing additional bandwidth due to the 2.3GHz deal, cost savings from the transition from concession to licence and the stock trading at a cheap FY17F EV/EBITDA. Contrary to the market, our Reduce call on DTAC hinges on 1) only marginal upside from the 2.3GHz deal, 2) DTAC’s inability to avoid a capex cycle, and 3) its FY18F EV/EBITDA rising.
2.3GHz deal We think the 2.3GHz deal between DTAC and TOT could reduce its regulatory costs during the last phase of the concession contract, which ends in Sep 18, and enhance DTAC’s ability to defend its revenue market share. We have built DTAC’s 2.3GHz deal into our forecasts from 4Q17F onwards. However, we also cannot rule out the probability of delays in the 2.3GHz deal, similar to AIS, which has been waiting for TOT to endorse the 2.1GHz deal and tower/network rental deals for nine quarters.
850MHz and 1800MHz spectrum auction in 2H18F We think DTAC can win an 850MHz licence at THB32.9bn and 1800MHz licence at THB33.7bn during the 2H18 spectrum auctions. We think the National Broadcasting and Telecommunications Commission will set the reserve prices for 850MHz and 1800MHz licences at the final prices of the 900MHz and 1800MHz licences in 2015. We believe DTAC will need both licences to maintain 1) competitiveness in bandwidth holding, 2) its coverage and indoor penetration capability, and 3) 2G services for 3m-4m customers.
Marginal savings from transition from concession to licence We expect pre-tax cost savings from the transition from concession to licence to be THB1bn in FY19F. We estimate DTAC’s FY17F concession-related costs, i.e. regulatory fees, amortisation expense on concessionary assets and other D&A expense to be THB34.7bn. After its concession ends in Sep 18, we estimate FY19F licence-related costs, i.e. regulatory fees, network rental fees and D&A expense, to be THB33.7bn (Fig 5). We expect FY19F core net profit to rise due to favourable operating leverage effect.
Cheap FY17F EV/EBITDA DTAC’s FY17F EV/EBITDA at 5.8x looks cheap compared to AIS’s 10x and True’s 9.6x. If we incorporate higher net debt from a new capex cycle for licence and network acquisitions and lower EBITDA from network rental fees, the difference in EV/EBITDA multiples between AIS and DTAC falls from 4.3x currently to only 1.7x in FY19F and between True and DTAC from 3.9x currently to zero in FY19F (Fig 7).
Maintain Reduce Maintain Reduce. Potential de-rating catalysts are 1) delay in 2.3GHz deal, and 2) delay in 850MHz and 1800MHz auctions. We maintain FY17-19F forecasts but raise our DCF-based target price by 8.3% to THB53.63 as we roll forward our cashflow projection from FY17F to FY18F (Fig 6). Upside risks to our bearish call are 1) stronger revenue growth from the 2.3GHz deal, and 2) lower network rental fees from the JV deal with CAT.
SOURCE: COMPANY DATA, CIMB FORECASTS
Thailand
REDUCE (no change) Consensus ratings*: Buy 6 Hold 7 Sell 17
Current price: THB56.75 Target price: THB53.63 Previous target: THB49.50
Up/downside: -5.5% CIMB / Consensus: 3.2%
Reuters: DTAC.BK Bloomberg: DTAC TB Market cap: US$4,063m THB134,373m Average daily turnover: US$13.54m THB454.0m Current shares o/s: 2,368m Free float: 29.4% *Source: Bloomberg Key changes in this note
No change.
Source: Bloomberg
Price performance 1M 3M 12M Absolute (%) 7.1 9.1 66.9 Relative (%) 0.3 3.3 54.9
Major shareholders % held Telenor Asia Pte. Ltd. 42.6 Thai Telco Holding 22.4 TOT 5.6 Insert
Analyst(s)
Pisut NGAMVIJITVONG
T (66) 2 761 9226 E [email protected]
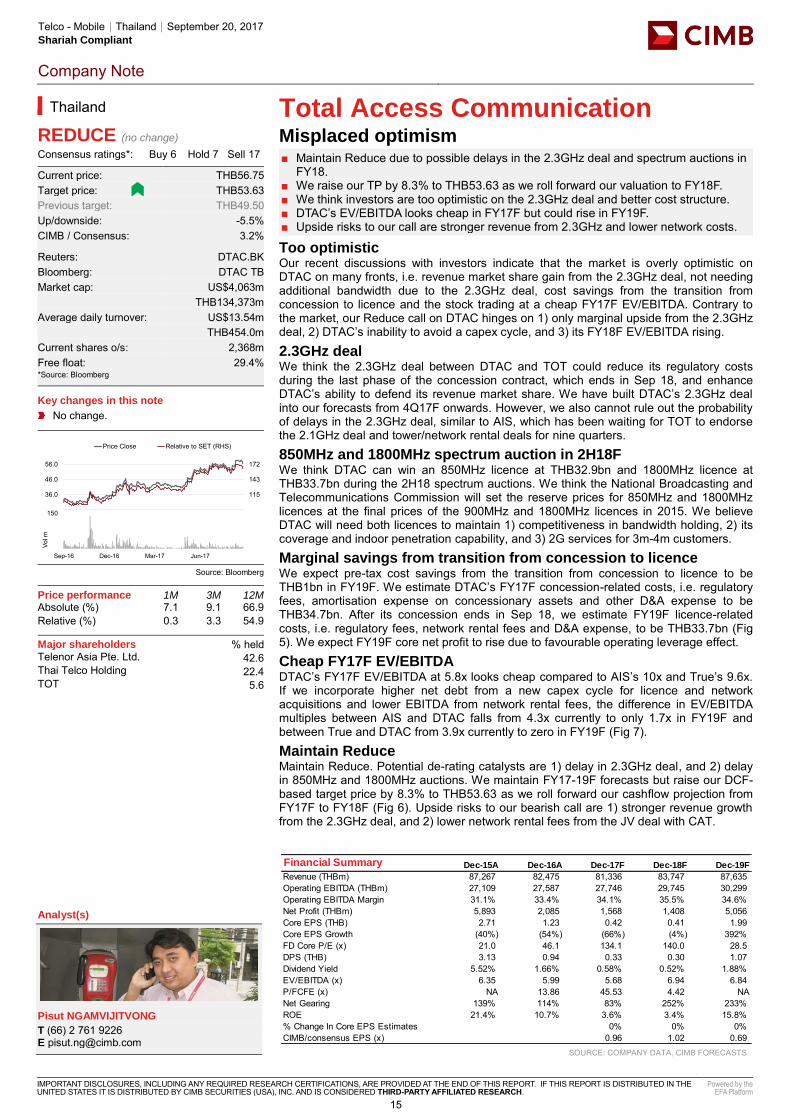
Financial Summary Dec-15A Dec-16A Dec-17F Dec-18F Dec-19F
Revenue (THBm) 87,267 82,475 81,336 83,747 87,635Operating EBITDA (THBm) 27,109 27,587 27,746 29,745 30,299Operating EBITDA Margin 31.1% 33.4% 34.1% 35.5% 34.6%Net Profit (THBm) 5,893 2,085 1,568 1,408 5,056Core EPS (THB) 2.71 1.23 0.42 0.41 1.99Core EPS Growth (40%) (54%) (66%) (4%) 392%FD Core P/E (x) 21.0 46.1 134.1 140.0 28.5DPS (THB) 3.13 0.94 0.33 0.30 1.07Dividend Yield 5.52% 1.66% 0.58% 0.52% 1.88%EV/EBITDA (x) 6.35 5.99 5.68 6.94 6.84P/FCFE (x) NA 13.86 45.53 4.42 NANet Gearing 139% 114% 83% 252% 233%ROE 21.4% 10.7% 3.6% 3.4% 15.8%% Change In Core EPS Estimates 0% 0% 0%CIMB/consensus EPS (x) 0.96 1.02 0.69
86
115
143
172
26.0
36.0
46.0
56.0
Price Close Relative to SET (RHS)
50
100
150
Sep-16 Dec-16 Mar-17 Jun-17
Vol m
15
Asia Pacific Daily│Equity research│September 21, 2017
REGIONAL HEAD
Michael William GREENALL Regional Head of Research +60 (3) 2261 9088 [email protected]
COUNTRY HEADS OF RESEARCH
Ivy NG, CFA Siew Khee. LIM Erwan TEGUH Kasem PRUNRATANAMALA, CFA Ben BEI Malaysia Singapore Indonesia Thailand Hong Kong/China +60 (3) 2261-9073 +65 6210-8664 +62 (21) 3006-1720 +66 (2) 657-9221 +852 2532-1116 [email protected] [email protected] [email protected] [email protected] [email protected] Dohoon LEE Satish KUMAR South Korea India +82 (2) 6730-6121 +91 (22) 6602-5185 [email protected] [email protected] Yolan SEIMON Ralph Christian BODOLLO Sri Lanka Philippines +94 (11) 230-6273 +63 (2) 888-7118 [email protected] [email protected] Coverage via partnership arrangement with Coverage via partnership arrangement with John Keells Stock Brokers SB Equities
REGIONAL SECTOR HEADS
KJ KWANG Ivy NG, CFA Raymond YAP, CFA Offshore & Marine Plantations Transportation +82 (2) 6730-6123 +60 (3) 2261-9073 +60 (3) 2261-9072 [email protected] [email protected] [email protected]
7
16
Asia Pacific Daily│Equity research│September 21, 2017
DISCLAIMER WJV#05 The content of this report (including the views and opinions expressed therein, and the information comprised therein) has been prepared by and belongs to CIMB save that (i) if it is a report written by the analyst(s) of John Keells Stock Brokers (“John Keells”), it belongs to John Keells; (ii) if it is a report written by the analyst(s) of SB Equities Inc (“SBE”), it belongs to SBE; and (iii) if it is a report written by the analyst(s) of Morgans Financial Limited (“Morgans”), it belongs to Morgans. This report is distributed by CIMB and in respect of sections of the report relating to (i), (ii) and/or (iii) aforesaid, it is distributed pursuant to an arrangement between John Keells, SBE and Morgans respectively and none of the aforesaid parties is an affiliate of CIMB. This report is not directed to, or intended for distribution to or use by, any person or entity who is a citizen or resident of or located in any locality, state, country or other jurisdiction where such distribution, publication, availability or use would be contrary to law or regulation. By accepting this report, the recipient hereof represents and warrants that he is entitled to receive such report in accordance with the restrictions set forth below and agrees to be bound by the limitations contained herein (including the “Restrictions on Distributions” set out below). Any failure to comply with these limitations may constitute a violation of law. This publication is being supplied to you strictly on the basis that it will remain confidential. No part of this report may be (i) copied, photocopied, duplicated, stored or reproduced in any form by any means or (ii) redistributed or passed on, directly or indirectly, to any other person in whole or in part, for any purpose without the prior written consent of CIMB. The information contained in this research report is prepared from data believed to be correct and reliable at the time of issue of this report. CIMB, John Keells, SBE and/or Morgans, as the case may be, may or may not issue regular reports on the subject matter of this report at any frequency and may cease to do so or change the periodicity of reports at any time. None of CIMB, John Keells, SBE or Morgans is under any obligation to update this report in the event of a material change to the information contained in this report. None of CIMB, John Keells, SBE or Morgans has any and none of them will accept any, obligation to (i) check or ensure that the contents of this report remain current, reliable or relevant, (ii) ensure that the content of this report constitutes all the information a prospective investor may require, (iii) ensure the adequacy, accuracy, completeness, reliability or fairness of any views, opinions and information, and accordingly, CIMB, John Keells, SBE and Morgans and their respective affiliates and related persons (and their respective directors, associates, connected persons and/or employees) shall not be liable in any manner whatsoever for any consequences (including but not limited to any direct, indirect or consequential losses, loss of profits and damages) of any reliance thereon or usage thereof. In particular, CIMB, John Keells, SBE and Morgans disclaim all responsibility and liability for the views and opinions set out in this report. Unless otherwise specified, this report is based upon reasonable sources. Such sources will, unless otherwise specified, for market data, be market data and prices available from the main stock exchange or market where the relevant security is listed, or, where appropriate, any other market. Information on the accounts and business of company(ies) will generally be based on published statements of the company(ies), information disseminated by regulatory information services, other publicly available information and information resulting from our research. Whilst every effort is made to ensure that statements of facts made in this report are accurate, all estimates, projections, forecasts, expressions of opinion and other subjective judgments contained in this report are based on assumptions considered to be reasonable as of the date of the document in which they are contained and must not be construed as a representation that the matters referred to therein will occur. Past performance is not a reliable indicator of future performance. The value of investments may go down as well as up and those investing may, depending on the investments in question, lose more than the initial investment. No report shall constitute an offer or an invitation by or on behalf of CIMB, John Keells, SBE or Morgans or their respective affiliates to any person to buy or sell any investments. CIMB, John Keells, SBE and/or Morgans and/or their respective affiliates and related companies, their directors, associates, connected parties and/or employees may own or have positions in securities of the company(ies) covered in this research report or any securities related thereto and may from time to time add to or dispose of, or may be materially interested in, any such securities. Further, CIMB, John Keells, SBE and/or Morgans and/or their respective affiliates and related companies do and seek to do business with the company(ies) covered in this research report and may from time to time act as market maker or have assumed an underwriting commitment in securities of such company(ies), may sell them to or buy them from customers on a principal basis and may also perform or seek to perform significant investment banking, advisory, underwriting or placement services for or relating to such company(ies) as well as solicit such investment, advisory or other services from any entity mentioned in this report. CIMB, John Keells, SBE and/or Morgans and/or their respective affiliates may enter into an agreement with the company(ies) covered in this report relating to the production of research reports. CIMB, John Keells, SBE and/or Morgans may disclose the contents of this report to the company(ies) covered by it and may have amended the contents of this report following such disclosure. The analyst responsible for the production of this report hereby certifies that the views expressed herein accurately and exclusively reflect his or her personal views and opinions about any and all of the issuers or securities analysed in this report and were prepared independently and autonomously. No part of the compensation of the analyst(s) was, is, or will be directly or indirectly related to the inclusion of specific recommendations(s) or view(s) in this report. The analyst(s) who prepared this research report are prohibited from receiving any compensation, incentive or bonus based on specific investment banking transactions or for providing a specific recommendation for, or view of, a particular company. Information barriers and other arrangements may be established where necessary to prevent conflicts of interests arising. However, the analyst(s) may receive compensation that is based on his/their coverage of company(ies) in the performance of his/their duties or the performance of his/their recommendations and the research personnel involved in the preparation of this report may also participate in the solicitation of the businesses as described above. In reviewing this research report, an investor should be aware that any or all of the foregoing, among other things, may give rise to real or potential conflicts of interest. Additional information is, subject to the duties of confidentiality, available on request. The term “John Keells Stock Brokers” shall, unless the context otherwise requires, mean each of John Keells Stock Brokers and its affiliates, subsidiaries and related companies. The term “SB Equities Inc.” shall, unless the context otherwise requires, mean each of SB Equities Inc. and its affiliates, subsidiaries and related companies. The term “Morgans Financial Limited” shall, unless the context otherwise requires, mean each of Morgans Financial Limited and its affiliates, subsidiaries and related companies. The term “CIMB” shall denote, where appropriate, the relevant entity distributing or disseminating the report in the particular jurisdiction referenced below, or, in every other case, CIMB Group Holdings Berhad ("CIMBGH") and its affiliates, subsidiaries and related companies.
8
17
Asia Pacific Daily│Equity research│September 21, 2017
Country CIMB Entity Regulated by Hong Kong CIMB Securities Limited Securities and Futures Commission Hong Kong India CIMB Securities (India) Private Limited Securities and Exchange Board of India (SEBI) Indonesia PT CIMB Securities Indonesia Financial Services Authority of Indonesia Malaysia CIMB Investment Bank Berhad Securities Commission Malaysia Singapore CIMB Research Pte. Ltd. Monetary Authority of Singapore South Korea CIMB Securities Limited, Korea Branch Financial Services Commission and Financial Supervisory Service Thailand CIMB Securities (Thailand) Co. Ltd. Securities and Exchange Commission Thailand
Information in this report is a summary derived from individual research reports. As such, readers are directed to the individual research report or note to review the individual Research Analyst’s full analysis of the subject company. Important disclosures relating to the companies that are the subject of research reports published by CIMB, John Keells, SBE or Morgans, as the case may be, and the proprietary position by each of them and shareholdings of its Research Analysts’ who prepared the report in the securities of the company(s) are available in the individual research report. This report does not purport to contain all the information that a prospective investor may require. CIMB, John Keells, SBE and Morgans and their respective affiliates do not make any guarantee, representation or warranty, express or implied, as to the adequacy, accuracy, completeness, reliability or fairness of any such information and opinion contained in this report. None of CIMB, John Keells, SBE, Morgans and their respective affiliates and related persons shall be liable in any manner whatsoever for any consequences (including but not limited to any direct, indirect or consequential losses, loss of profits and damages) of any reliance thereon or usage thereof. This report is general in nature and has been prepared for information purposes only. It is intended for circulation amongst CIMB and its affiliates’ clients generally and does not have regard to the specific investment objectives, financial situation and the particular needs of any specific person who may receive this report. The information and opinions in this report are not and should not be construed or considered as an offer, recommendation or solicitation to buy or sell the subject securities, related investments or other financial instruments or any derivative instrument, or any rights pertaining thereto. Investors are advised to make their own independent evaluation of the information contained in this research report, consider their own individual investment objectives, financial situation and particular needs and consult their own professional and financial advisers as to the legal, business, financial, tax and other aspects before participating in any transaction in respect of the securities of company(ies) covered in this research report. The securities of such company(ies) may not be eligible for sale in all jurisdictions or to all categories of investors. Australia : The distribution of this report is not an offer to buy or sell to any person within or outside Australia or a solicitation to any person within or outside of Australia to buy or sell any instrument described herein. This report is being issued outside Australia to a limited number of institutional investors and may not be provided to any person other than the original recipient and may not be reproduced or used for any other purposes. Canada: This research report has not been prepared in accordance with the disclosure requirements of Dealer Member Rule 3400 – Research Restrictions and Disclosure Requirements of the Investment Industry Regulatory Organization of Canada. For any research report distributed by CIBC, further disclosures related to CIBC conflicts of interest can be found at https://researchcentral.cibcwm.com . China: For the purpose of this report, the People’s Republic of China (“PRC”) does not include the Hong Kong Special Administrative Region, the Macau Special Administrative Region or Taiwan. The distributor of this report has not been approved or licensed by the China Securities Regulatory Commission or any other relevant regulatory authority or governmental agency in the PRC. This report contains only marketing information. The distribution of this report is not an offer to buy or sell to any person within or outside PRC or a solicitation to any person within or outside of PRC to buy or sell any instruments described herein. This report is being issued outside the PRC to a limited number of institutional investors and may not be provided to any person other than the original recipient and may not be reproduced or used for any other purpose. France: Only qualified investors within the meaning of French law shall have access to this report. This report shall not be considered as an offer to subscribe to, or used in connection with, any offer for subscription or sale or marketing or direct or indirect distribution of financial instruments and it is not intended as a solicitation for the purchase of any financial instrument. Germany: This report is only directed at persons who are professional investors as defined in sec 31a(2) of the German Securities Trading Act (WpHG). This publication constitutes research of a non-binding nature on the market situation and the investment instruments cited here at the time of the publication of the information. The current prices/yields in this issue are based upon closing prices from Bloomberg as of the day preceding publication. Please note that neither the German Federal Financial Supervisory Agency (BaFin), nor any other supervisory authority exercises any control over the content of this report. Hong Kong: This report is issued and distributed in Hong Kong by CIMB Securities Limited (“CHK”) which is licensed in Hong Kong by the Securities and Futures Commission for Type 1 (dealing in securities), Type 4 (advising on securities) and Type 6 (advising on corporate finance) activities. Any investors wishing to purchase or otherwise deal in the securities covered in this report should contact the Head of Sales at CIMB Securities Limited. The views and opinions in this research report are of CIMB, John Keells, SBE or Morgans, as the case may be, as of the date hereof and are subject to change. If the Financial Services and Markets Act of the United Kingdom or the rules of the Financial Conduct Authority apply to a recipient, our obligations owed to such recipient therein are unaffected. CHK has no obligation to update its opinion or the information in this research report. This publication is strictly confidential and is for private circulation only to clients of CHK. India: This report is issued and distributed in India by CIMB Securities (India) Private Limited (”CIMB India") which is registered with SEBI as a stock-broker under the Securities and Exchange Board of India (Stock Brokers and Sub-Brokers) Regulations, 1992, the Securities and Exchange Board of India (Research Analyst) Regulations, 2014 (SEBI Registration Number INH000000669) and in accordance with the provisions of Regulation 4 (g) of the Securities and Exchange Board of India (Investment Advisers) Regulations, 2013, CIMB India is not required to seek registration with SEBI as an Investment Adviser. The research analysts, strategists or economists principally responsible for the preparation of this research report are segregated from equity stock broking and merchant banking of CIMB India and they have received compensation based upon various factors, including quality, accuracy and value of research, firm profitability or revenues, client feedback and competitive factors. Research analysts', strategists' or economists' compensation is not linked to investment banking or capital markets transactions performed or proposed to be performed by CIMB India or its affiliates.”
9
18
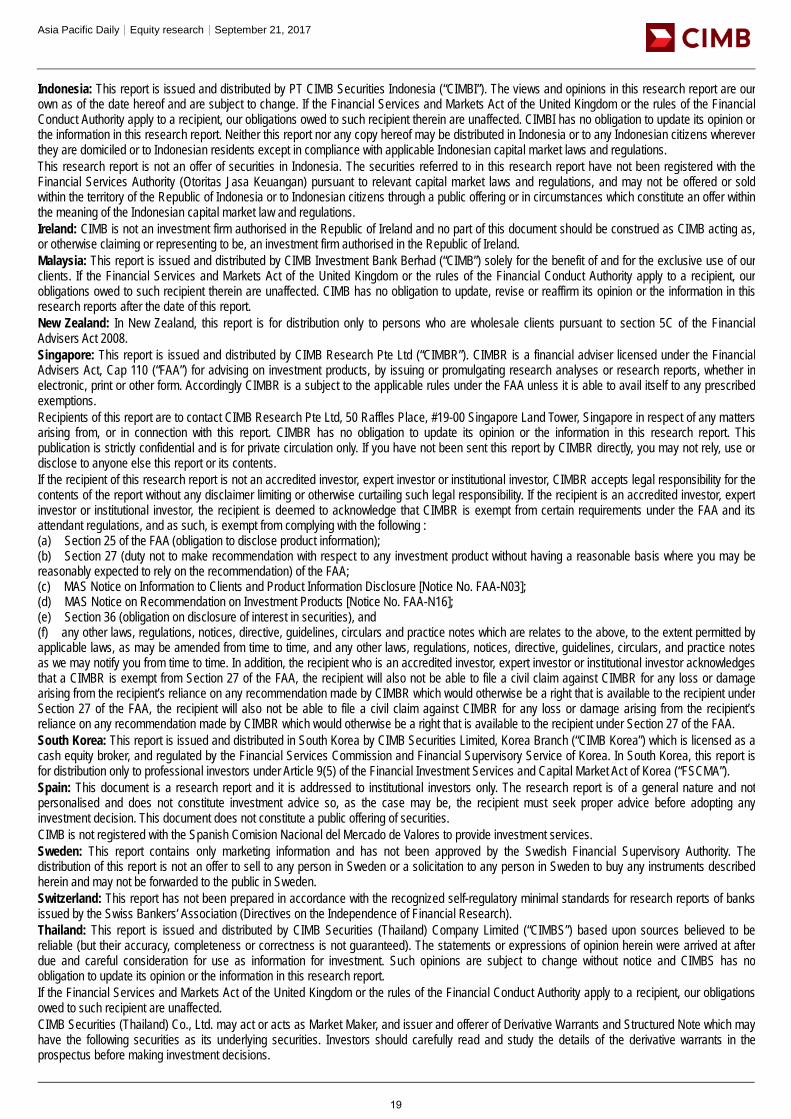
Asia Pacific Daily│Equity research│September 21, 2017
Indonesia: This report is issued and distributed by PT CIMB Securities Indonesia (“CIMBI”). The views and opinions in this research report are our own as of the date hereof and are subject to change. If the Financial Services and Markets Act of the United Kingdom or the rules of the Financial Conduct Authority apply to a recipient, our obligations owed to such recipient therein are unaffected. CIMBI has no obligation to update its opinion or the information in this research report. Neither this report nor any copy hereof may be distributed in Indonesia or to any Indonesian citizens wherever they are domiciled or to Indonesian residents except in compliance with applicable Indonesian capital market laws and regulations. This research report is not an offer of securities in Indonesia. The securities referred to in this research report have not been registered with the Financial Services Authority (Otoritas Jasa Keuangan) pursuant to relevant capital market laws and regulations, and may not be offered or sold within the territory of the Republic of Indonesia or to Indonesian citizens through a public offering or in circumstances which constitute an offer within the meaning of the Indonesian capital market law and regulations. Ireland: CIMB is not an investment firm authorised in the Republic of Ireland and no part of this document should be construed as CIMB acting as, or otherwise claiming or representing to be, an investment firm authorised in the Republic of Ireland. Malaysia: This report is issued and distributed by CIMB Investment Bank Berhad (“CIMB”) solely for the benefit of and for the exclusive use of our clients. If the Financial Services and Markets Act of the United Kingdom or the rules of the Financial Conduct Authority apply to a recipient, our obligations owed to such recipient therein are unaffected. CIMB has no obligation to update, revise or reaffirm its opinion or the information in this research reports after the date of this report. New Zealand: In New Zealand, this report is for distribution only to persons who are wholesale clients pursuant to section 5C of the Financial Advisers Act 2008. Singapore: This report is issued and distributed by CIMB Research Pte Ltd (“CIMBR”). CIMBR is a financial adviser licensed under the Financial Advisers Act, Cap 110 (“FAA”) for advising on investment products, by issuing or promulgating research analyses or research reports, whether in electronic, print or other form. Accordingly CIMBR is a subject to the applicable rules under the FAA unless it is able to avail itself to any prescribed exemptions. Recipients of this report are to contact CIMB Research Pte Ltd, 50 Raffles Place, #19-00 Singapore Land Tower, Singapore in respect of any matters arising from, or in connection with this report. CIMBR has no obligation to update its opinion or the information in this research report. This publication is strictly confidential and is for private circulation only. If you have not been sent this report by CIMBR directly, you may not rely, use or disclose to anyone else this report or its contents. If the recipient of this research report is not an accredited investor, expert investor or institutional investor, CIMBR accepts legal responsibility for the contents of the report without any disclaimer limiting or otherwise curtailing such legal responsibility. If the recipient is an accredited investor, expert investor or institutional investor, the recipient is deemed to acknowledge that CIMBR is exempt from certain requirements under the FAA and its attendant regulations, and as such, is exempt from complying with the following : (a) Section 25 of the FAA (obligation to disclose product information); (b) Section 27 (duty not to make recommendation with respect to any investment product without having a reasonable basis where you may be reasonably expected to rely on the recommendation) of the FAA; (c) MAS Notice on Information to Clients and Product Information Disclosure [Notice No. FAA-N03]; (d) MAS Notice on Recommendation on Investment Products [Notice No. FAA-N16]; (e) Section 36 (obligation on disclosure of interest in securities), and (f) any other laws, regulations, notices, directive, guidelines, circulars and practice notes which are relates to the above, to the extent permitted by applicable laws, as may be amended from time to time, and any other laws, regulations, notices, directive, guidelines, circulars, and practice notes as we may notify you from time to time. In addition, the recipient who is an accredited investor, expert investor or institutional investor acknowledges that a CIMBR is exempt from Section 27 of the FAA, the recipient will also not be able to file a civil claim against CIMBR for any loss or damage arising from the recipient’s reliance on any recommendation made by CIMBR which would otherwise be a right that is available to the recipient under Section 27 of the FAA, the recipient will also not be able to file a civil claim against CIMBR for any loss or damage arising from the recipient’s reliance on any recommendation made by CIMBR which would otherwise be a right that is available to the recipient under Section 27 of the FAA. South Korea: This report is issued and distributed in South Korea by CIMB Securities Limited, Korea Branch (“CIMB Korea”) which is licensed as a cash equity broker, and regulated by the Financial Services Commission and Financial Supervisory Service of Korea. In South Korea, this report is for distribution only to professional investors under Article 9(5) of the Financial Investment Services and Capital Market Act of Korea (“FSCMA”). Spain: This document is a research report and it is addressed to institutional investors only. The research report is of a general nature and not personalised and does not constitute investment advice so, as the case may be, the recipient must seek proper advice before adopting any investment decision. This document does not constitute a public offering of securities. CIMB is not registered with the Spanish Comision Nacional del Mercado de Valores to provide investment services. Sweden: This report contains only marketing information and has not been approved by the Swedish Financial Supervisory Authority. The distribution of this report is not an offer to sell to any person in Sweden or a solicitation to any person in Sweden to buy any instruments described herein and may not be forwarded to the public in Sweden. Switzerland: This report has not been prepared in accordance with the recognized self-regulatory minimal standards for research reports of banks issued by the Swiss Bankers’ Association (Directives on the Independence of Financial Research). Thailand: This report is issued and distributed by CIMB Securities (Thailand) Company Limited (“CIMBS”) based upon sources believed to be reliable (but their accuracy, completeness or correctness is not guaranteed). The statements or expressions of opinion herein were arrived at after due and careful consideration for use as information for investment. Such opinions are subject to change without notice and CIMBS has no obligation to update its opinion or the information in this research report. If the Financial Services and Markets Act of the United Kingdom or the rules of the Financial Conduct Authority apply to a recipient, our obligations owed to such recipient are unaffected. CIMB Securities (Thailand) Co., Ltd. may act or acts as Market Maker, and issuer and offerer of Derivative Warrants and Structured Note which may have the following securities as its underlying securities. Investors should carefully read and study the details of the derivative warrants in the prospectus before making investment decisions.
10
19
Asia Pacific Daily│Equity research│September 21, 2017
AAV, ADVANC, AMATA, ANAN, AOT, AP, BA, BANPU, BBL, BCH, BCP, BCPG, BDMS, BEAUTY, BEC, BEM, BJC, BH, BIG, BLA, BLAND, BPP, BTS, CBG, CENTEL, CHG, CK, CKP, COM7, CPALL, CPF, CPN, DELTA, DTAC, EA, EGCO, EPG, GFPT, GLOBAL, GLOW, GPSC, GUNKUL, HMPRO, INTUCH, IRPC, ITD, IVL, KBANK, KCE, KKP, KTB, KTC, LH, LHBANK, LPN, MAJOR, MALEE, MEGA, MINT, MONO, MTLS, PLANB, PSH, PTL, PTG, PTT, PTTEP, PTTGC, QH, RATCH, ROBINS, S, SAWAD, SCB, SCC, SCCC, SIRI, SPALI, SPRC, STEC, STPI, SUPER, TASCO, TCAP, THAI, THANI, THCOM, TISCO, TKN, TMB, TOP, TPIPL, TRUE, TTA, TU, TVO, UNIQ, VGI, WHA, WORK. Corporate Governance Report: The disclosure of the survey result of the Thai Institute of Directors Association (“IOD”) regarding corporate governance is made pursuant to the policy of the Office of the Securities and Exchange Commission. The survey of the IOD is based on the information of a company listed on the Stock Exchange of Thailand and the Market for Alternative Investment disclosed to the public and able to be accessed by a general public investor. The result, therefore, is from the perspective of a third party. It is not an evaluation of operation and is not based on inside information. The survey result is as of the date appearing in the Corporate Governance Report of Thai Listed Companies. As a result, the survey result may be changed after that date. CIMBS does not confirm nor certify the accuracy of such survey result.
Score Range: 90 - 100 80 - 89 70 - 79 Below 70 or No Survey Result Description: Excellent Very Good Good N/A
United Arab Emirates: The distributor of this report has not been approved or licensed by the UAE Central Bank or any other relevant licensing authorities or governmental agencies in the United Arab Emirates. This report is strictly private and confidential and has not been reviewed by, deposited or registered with UAE Central Bank or any other licensing authority or governmental agencies in the United Arab Emirates. This report is being issued outside the United Arab Emirates to a limited number of institutional investors and must not be provided to any person other than the original recipient and may not be reproduced or used for any other purpose. Further, the information contained in this report is not intended to lead to the sale of investments under any subscription agreement or the conclusion of any other contract of whatsoever nature within the territory of the United Arab Emirates. United Kingdom: In the United Kingdom and European Economic Area, this report is being disseminated by CIMB Securities (UK) Limited (“CIMB UK”). CIMB UK is authorized and regulated by the Financial Conduct Authority and its registered office is at 27 Knightsbridge, London, SW1X7YB. Unless specified to the contrary, this report has been issued and approved for distribution in the U.K. and the EEA by CIMB UK. Investment research issued by CIMB UK has been prepared in accordance with CIMB Group’s policies for managing conflicts of interest arising as a result of publication and distribution of investment research. This report is for distribution only to, and is solely directed at, selected persons on the basis that those persons: (a) are eligible counterparties and professional clients of CIMB UK; (b) have professional experience in matters relating to investments falling within Article 19(5) of the Financial Services and Markets Act 2000 (Financial Promotion) Order 2005 (as amended, the “Order”), (c) fall within Article 49(2)(a) to (d) (“high net worth companies, unincorporated associations etc”) of the Order; (d) are outside the United Kingdom subject to relevant regulation in each jurisdiction, or (e) are persons to whom an invitation or inducement to engage in investment activity (within the meaning of section 21 of the Financial Services and Markets Act 2000) in connection with any investments to which this report relates may otherwise lawfully be communicated or caused to be communicated (all such persons together being referred to as “relevant persons”). This report is directed only at relevant persons and must not be acted on or relied on by persons who are not relevant persons. Any investment or investment activity to which this report relates is available only to relevant persons and will be engaged in only with relevant persons. Where this report is labelled as non-independent, it does not provide an impartial or objective assessment of the subject matter and does not constitute independent “investment research” under the applicable rules of the Financial Conduct Authority in the UK. Consequently, any such non-independent report will not have been prepared in accordance with legal requirements designed to promote the independence of investment research and will not subject to any prohibition on dealing ahead of the dissemination of investment research. Any such non-independent report must be considered as a marketing communication. United States: This research report is distributed in the United States of America by CIMB Securities (USA) Inc, a U.S. registered broker-dealer and a related company of CIMB Research Pte Ltd, CIMB Investment Bank Berhad, PT CIMB Securities Indonesia, CIMB Securities (Thailand) Co. Ltd, CIMB Securities Limited, CIMB Securities (India) Private Limited, and is distributed solely to persons who qualify as “U.S. Institutional Investors” as defined in Rule 15a-6 under the Securities and Exchange Act of 1934. This communication is only for Institutional Investors whose ordinary business activities involve investing in shares, bonds, and associated securities and/or derivative securities and who have professional experience in such investments. Any person who is not a U.S. Institutional Investor or Major Institutional Investor must not rely on this communication. The delivery of this research report to any person in the United States of America is not a recommendation to effect any transactions in the securities discussed herein, or an endorsement of any opinion expressed herein. CIMB Securities (USA) Inc, is a FINRA/SIPC member and takes responsibility for the content of this report. For further information or to place an order in any of the above-mentioned securities please contact a registered representative of CIMB Securities (USA) Inc. Other jurisdictions: In any other jurisdictions, except if otherwise restricted by laws or regulations, this report is only for distribution to professional, institutional or sophisticated investors as defined in the laws and regulations of such jurisdictions.
Corporate Governance Report of Thai Listed Companies (CGR). CG Rating by the Thai Institute of Directors Association (Thai IOD) in 2016, Anti-Corruption 2016 AAV – Very Good, n/a, ADVANC – Very Good, Certified, AEONTS – Good, n/a, AMATA – Excellent, Declared, ANAN – Very Good, Declared, AOT – Excellent, Declared, AP – Very Good, Declared, ASK – Very Good, Declared, ASP – Very Good, Certified, BANPU – Very Good, Certified, BAY – Excellent, Certified, BBL – Very Good, Certified, BCH – not available, Declared, BCP - Excellent, Certified, BEM – Very Good, n/a, BDMS – Very Good, n/a, BEAUTY – Good, Declared, BEC - Good, n/a, BH - Good, Declared, BIGC - Excellent, Declared, BJC – Good, n/a, BJCHI – Good, Declared, BLA – Very Good, Certified, BPP – not available, n/a, BR - Good, n/a, BTS - Excellent, Certified, CBG – Good, n/a, CCET – not available, n/a, CENTEL – Very Good, Certified, CHG – Very Good, n/a, CK – Excellent, n/a, COL – Very Good, Declared, CPALL – not available, Declared, CPF – Excellent, Declared, CPN - Excellent, Certified, DELTA - Excellent, Declared, DEMCO – Excellent, Certified, DIF – not available, n/a, DTAC – Excellent, Certified, EA – Very Good, Declared, ECL – Good, Certified, EGCO - Excellent, Certified, EPG – Good, n/a, GFPT - Excellent, Declared, GGC – not available, n/a, GLOBAL – Very Good, Declared, GLOW – Very Good, Certified,
11
20
Asia Pacific Daily│Equity research│September 21, 2017
GPSC – Excellent, Declared, GRAMMY - Excellent, n/a, GUNKUL – Very Good, Declared, HANA - Excellent, Certified, HMPRO - Excellent, Declared, ICHI – Very Good, Declared, III – not available, n/a, INTUCH - Excellent, Certified, IRPC – Excellent, Certified, ITD – Good, n/a, IVL - Excellent, Certified, JAS – not available, Declared, JASIF – not available, n/a, JUBILE – Good, Declared, KAMART – not available, n/a, KBANK - Excellent, Certified, KCE - Excellent, Certified, KGI – Good, Certified, KKP – Excellent, Certified, KSL – Very Good, Declared, KTB - Excellent, Certified, KTC – Excellent, Certified, LH - Very Good, n/a, LPN – Excellent, Declared, M – Very Good, Declared, MACO – Very Good, n/a, MAJOR - Good, n/a, MAKRO – Good, Declared, MALEE – Very Good, Declared, MBKET – Very Good, Certified, MC – Very Good, Declared, MCOT – Excellent, Declared, MEGA – Very Good, Declared, MINT - Excellent, Certified, MTLS – Very Good, Declared, NYT – Excellent, n/a, OISHI – Very Good, n/a, PLANB – Very Good, Declared, PLAT – Good, Declared, PSH – not available, n/a, PSL - Excellent, Certified, PTT - Excellent, Certified, PTTEP - Excellent, Certified, PTTGC - Excellent, Certified, QH – Excellent, Declared, RATCH – Excellent, Certified, ROBINS – Very Good, Declared, RS – Very Good, n/a, SAMART - Excellent, n/a, SAPPE - Good, n/a, SAT – Excellent, Certified, SAWAD – Good, n/a, SC – Excellent, Declared, SCB - Excellent, Certified, SCBLIF – not available, n/a, SCC – Excellent, Certified, SCN – Good, Declared, SCCC - Excellent, Declared, SIM - Excellent, n/a, SIRI - Good, n/a, SPA - Good, n/a, SPALI - Excellent, Declared, SPRC – Very Good, Declared, STA – Very Good, Declared, STEC – Excellent, n/a, SVI – Excellent, Certified, TASCO – Very Good, Declared, TCAP – Excellent, Certified, THAI – Very Good, Declared, THANI – Very Good, Certified, THCOM – Excellent, Certified, THRE – Very Good, Certified, THREL – Very Good, Certified, TICON – Very Good, Declared, TIPCO – Very Good, Certified, TISCO - Excellent, Certified, TK – Very Good, n/a, TKN – Good, n/a, TMB - Excellent, Certified, TNR – not available, n/a, TOP - Excellent, Certified, TPCH – Good, n/a, TPIPP – not available, n/a, TRUE – Very Good, Declared, TTW – Very Good, Declared, TU – Excellent, Declared, TVO – Very Good, Declared UNIQ – not available, Declared, VGI – Excellent, Declared, WHA – not available, Declared, WHART – not available, n/a, WORK – not available, n/a. Companies participating in Thailand’s Private Sector Collective Action Coalition Against Corruption programme (Thai CAC) under Thai Institute of Directors (as of October 28, 2016) are categorized into: - Companies that have declared their intention to join CAC, and - Companies certified by CAC
CIMB Recommendation Framework Stock Ratings Definition: Add The stock’s total return is expected to exceed 10% over the next 12 months. Hold The stock’s total return is expected to be between 0% and positive 10% over the next 12 months. Reduce The stock’s total return is expected to fall below 0% or more over the next 12 months. The total expected return of a stock is defined as the sum of the: (i) percentage difference between the target price and the current price and (ii) the forward net dividend yields of the stock. Stock price targets have an investment horizon of 12 months.
Sector Ratings Definition: Overweight An Overweight rating means stocks in the sector have, on a market cap-weighted basis, a positive absolute recommendation. Neutral A Neutral rating means stocks in the sector have, on a market cap-weighted basis, a neutral absolute recommendation. Underweight An Underweight rating means stocks in the sector have, on a market cap-weighted basis, a negative absolute recommendation.
Country Ratings Definition: Overweight An Overweight rating means investors should be positioned with an above-market weight in this country relative to benchmark. Neutral A Neutral rating means investors should be positioned with a neutral weight in this country relative to benchmark. Underweight An Underweight rating means investors should be positioned with a below-market weight in this country relative to benchmark.
12
21