equity research - heronettaheronetta.com/pdfs/wells fargo mlp monthly march 2014.pdf · wells fargo...
TRANSCRIPT

Please see page 83 for rating definitions, important disclosures and required analyst certifications All estimates/forecasts are as of 03/10/14 unless otherwise stated.
Wells Fargo Securities, LLC does and seeks to do business with companies covered in its research reports. As a result, investors should be aware that the firm may have a conflict of interest that could affect the objectivity of the report and investors should consider this report as only a single factor in making their investment decision.
MLPART030714-145959
March 10, 2014
Equity Research
MLP Monthly: March 2014 • Flat Year-To-Date - MLPs Underperform. Following flat performance in
January, Master Limited Partnerships (MLPs) were down 0.4% in February (as measured by the Wells Fargo Securities MLP Index), underperforming the S&P 500, which gained 4.3%. Performance was affected by (1) earnings season volatility (largely driven by weather; see below for details) and (2) reverberations following BWP’s distribution cut announcement on February 10, 2014.
• Still Positive For 2014. We forecast a median sector total return of 13%. Our outlook is supported by the following: (1) solid fundamentals as the buildout of U.S. energy infrastructure remains visible for the next several years; (2) the fact that MLP valuations still screen attractive relative to other asset classes; (3) the fact that fund flow remains positive given the growth, maturation, and mainstreaming of the MLP sector; and (4) the fact that the combination of the MLP-ization of the energy sector and (conversely) consolidation could continue to drive performance.
• A Wild Ride This Earnings Season. Notwithstanding BWP’s announced distribution cut, Q4 MLPs earnings have been mixed. To date, 60 out of 67 MLPs under coverage have released earnings, with 36 companies (or 60%) reporting results that were in line with or above our expectations. Q4 earnings trends we observed include the following: (1) Q4 weather affected results, i.e., Q1 upstream and G&P earnings are also likely to be negatively affected; (2) 2013 distribution coverage was light, but is expected to improve this year; (3) midstream growth capital for 2014-15 is trending higher; (4) the performance of recent third-party acquisitions appears mixed, with some G&P deals underperforming; (5) no step change in dry gas activity with recent price improvement, though some regions could benefit (e.g., Haynesville); (6) ATMs could be a principal source of equity financing in 2014 for some MLPs (absent acquisitions).
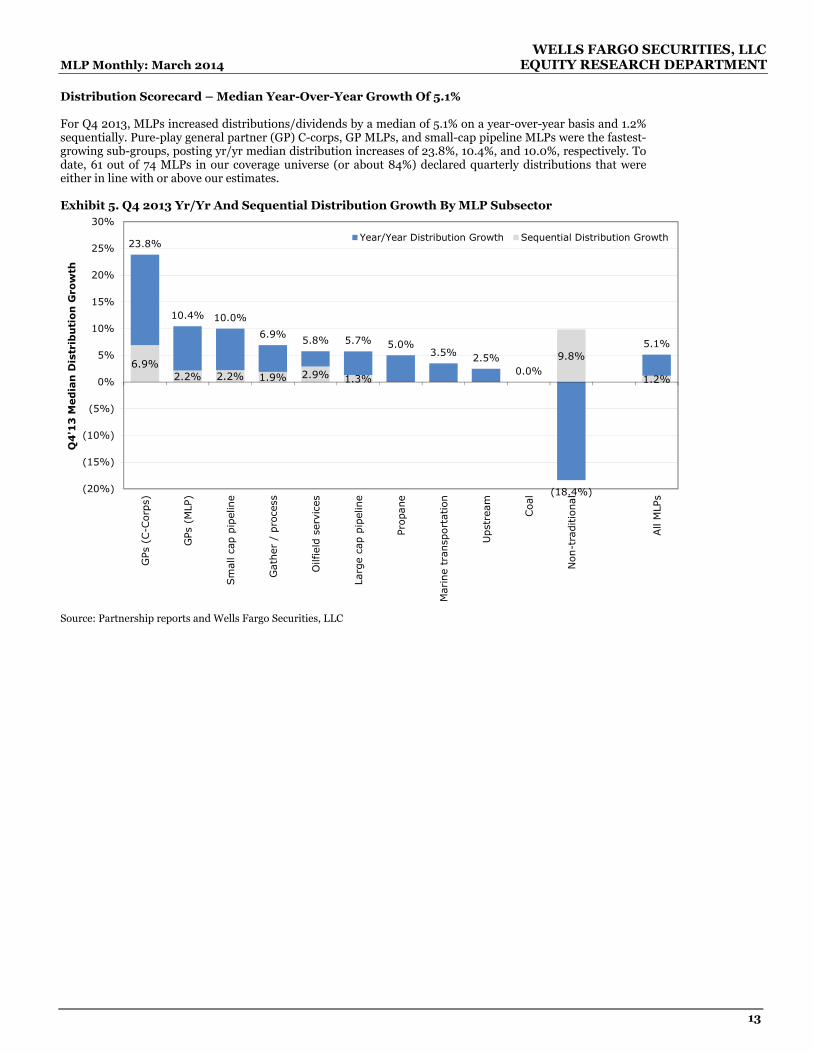
• Distribution Scorecard – Median Year-Over-Year Growth Of 5.1%. For Q4 2013, MLPs increased distributions/dividends by a median of 5.1% on a year-over-year basis and 1.2% sequentially. Pure-play general partner (GP) C-corps, GP MLPs, and small-cap pipeline MLPs were the fastest-growing sub-groups, posting year-over-year median distribution increases of 23.8%, 10.4%, and 10.0%, respectively. To date, 61 out of 74 MLPs in our coverage universe (or about 84%) declared distributions that were in line with or above our estimates.
• MLPs By Business Activity – A Reference Guide. Given the proliferation of MLPs (33 IPOs in the past two years), the growing divergence in performance for MLP subgroups, and the recent volatility in commodity prices, the importance of owning the right MLP in the right sector has increased. In general, we continue to favor crude and NGL oriented MLPs over natural gas pipeline and storage given relative industry fundamentals. (Please see Exhibit 6 inside this report for a breakdown of MLPs by business activity. The table is meant as a reference guide to help investors identify the exposures within the sector they wish to focus on.)
• Top Picks. We continue to favor high-growth, fee-based MLPs (including GPs) but are beginning to gravitate to some higher yielding, moderate growth names that screen as relative values. Our top picks are ATLS ($42.45), CMLP ($22.39), ETE ($43.65), QEPM ($21.37) and WMB ($41.30).
Master Limited Partnerships
Michael Blum, Senior Analyst(212) 214-5037
michael . j [email protected] Lui, CPA, Senior Analyst
(212) [email protected]
Praneeth Satish, Senior Analyst(212) 214-8056
[email protected] Shiu, Associate Analyst
(212) 214-5038 er [email protected]
Ned Baramov, Associate Analyst(212) 214-8021
[email protected] Freeland, Associate Analyst
(212) [email protected]
Michael Webber, CFA, Senior Analyst(212) 214-8019
[email protected] Dubinsky, Senior Analyst
(212) [email protected]


WELLS FARGO SECURITIES, LLC MLP Monthly: March 2014 EQUITY RESEARCH DEPARTMENT
3
TABLE OF CONTENTS Wells Fargo MLP Equity Research Published In February ......................................................................................................................... 5
Flat Year-To-Date - MLPs Underperform.................................................................................................................................................... 8
Still Positive For 2014 ................................................................................................................................................................................... 8
Valuation Overview ....................................................................................................................................................................................... 9
How To Play – Top Picks .............................................................................................................................................................................. 9
A Wide Ride This Earnings Season With A Dichotomy In Performance...................................................................................................10
Distribution Scorecard – Median Year-Over-Year Growth Of 5.1% ..........................................................................................................13
MLPs By Business Activity – A Reference Guide........................................................................................................................................14
What’s Up(stream): Upstream MLP March Update...................................................................................................................................16
Upstream MLPs Underperform Broader MLP Index In February.........................................................................................................16
Q4 Earnings Season Tracks Below Expectations ....................................................................................................................................16
2014 Guidance Ranges Largely Below Our Forecasts.............................................................................................................................16
Are Distributions Secure? ........................................................................................................................................................................ 17
Appendix...................................................................................................................................................................................................18
The View From The Bridge: Marine MLP March Update ..........................................................................................................................19
Marine MLPs Solid Earnings Performance, We Maintain Our Positive 2014 Outlook.........................................................................19
Marine MLPs Outperform In February ...................................................................................................................................................19
Pure-Play Marine GPs To Emerge In 2014..............................................................................................................................................19
Marine GPs Underperform In February................................................................................................................................................. 20
Group Expansion Likely Continues In 2014 .......................................................................................................................................... 20
Marine MLPs Outperform In February ...................................................................................................................................................21
Marine GP Trends And Valuation........................................................................................................................................................... 22
Mining The Data: Coal MLP March Update .............................................................................................................................................. 24
Coal Industry Overview........................................................................................................................................................................... 24
Coal MLPs Up Slightly, But Trail Broader Markets ............................................................................................................................... 26
Monthly Price Update—Nat Gas Surges and Most Coal Up Due To Weather ...................................................................................... 27
Miners Provide Mostly Weak Q4 Earnings Reports .............................................................................................................................. 28
February Price Performance....................................................................................................................................................................... 29
The Wells Fargo Securities, LLC MLP Index ............................................................................................................................................. 29
MLP Short Interest Increased In February................................................................................................................................................ 30
Update On Factors Driving MLP Performance...........................................................................................................................................31
Investment Grade And High Yield Spreads Narrowed In February ......................................................................................................31
MLP Yield Spread To Treasuries Widened In February .........................................................................................................................31

WELLS FARGO SECURITIES, LLC Master Limited Partnerships EQUITY RESEARCH DEPARTMENT
4
MLP CDS Spreads Decreased In February............................................................................................................................................. 32
Trading Volume Increased In February ................................................................................................................................................. 33
MLP Acquisition Activity ............................................................................................................................................................................ 34
Six Acquisitions Were Announced In February......................................................................................................................................... 34
MLPs Announced $1.3 Billion Of Equity In February............................................................................................................................... 36
MLP IPO Update--1 Offering Completed Year To Date--Backlog At 21 ................................................................................................... 38
MLPs Issued $6.2 Billion Of Debt In February ......................................................................................................................................... 39
Update On MLP Products ........................................................................................................................................................................... 40
MLP Open-End Fund, ETN, And ETF Overview ................................................................................................................................... 40
MLP ETF Update..................................................................................................................................................................................... 40
MLP Open-End Fund Update ................................................................................................................................................................. 40
MLP ETN Update .................................................................................................................................................................................... 42
MLP Closed-End Fund Update............................................................................................................................................................... 43
Commodity Overview And Forecast ........................................................................................................................................................... 44
Natural Gas Prices Increased In February ............................................................................................................................................. 44
Basis Differentials Were Mixed In February.......................................................................................................................................... 44
Natural Gas Storage Withdrawal Smaller Than The Consensus ........................................................................................................... 46
Implied 2014 Seasonal Storage Spread Was Lower Versus The Prior Month ...................................................................................... 47
Some Loan Opportunities In February................................................................................................................................................... 48
Crude Oil Prices Increased In February ................................................................................................................................................. 48
Brent/WTI Crude Price Differential Narrowed In February ................................................................................................................. 49
WTI And Brent Forward Price Curves Suggest Spread Could Increase................................................................................................ 49
Cushing Inventory Increases From Prior Month ................................................................................................................................... 50
Crude Oil Market Backwardated In February .........................................................................................................................................51
Natural Gas Liquids Outlook ...................................................................................................................................................................51
NGL Composite Price Increased In February .........................................................................................................................................51
Frac Spreads Were Lower In February................................................................................................................................................... 52
NGL-To-WTI And NGL-To-Brent Crude Ratios .................................................................................................................................... 53
Overview Of Wells Fargo Commodity Price Forecasts .......................................................................................................................... 55
Overview Of Key Economic Forecasts ........................................................................................................................................................ 55
Supplemental Tables....................................................................................................................................................................................57
Comp Tables .................................................................................................................................................................................................61

WELLS FARGO SECURITIES, LLC MLP Monthly: March 2014 EQUITY RESEARCH DEPARTMENT
5
Wells Fargo MLP Equity Research Published In February
If you would like a copy of any of these reports, please contact us or your Wells Fargo salesperson.
Thematic Research
• 02/03/14 - NGL Snapshot: January 2014
• 02/03/14 - U.S. LPG Exports: Cross-Sector Thoughts
• 02/06/14 - MLP Monthly: February 2014
• 02/07/14 - What's Up(stream): February 2014
• 02/07/14 - MLP Weekender: Matrix Reloaded
• 02/12/14 - MLPs: BWP Fallout--More Cuts To Come?
• 02/14/14 - MLP Weekender: More Thoughts On Distrib. Cuts
• 02/21/14 - MLP Weekender: What Keeps Us Up At Night?
• 02/27/14 - NGL Snapshot: February 2014
• 02/28/14 - MLP Weekender: The Baseball Game
Partnership Specific Reports
• 02/03/14 - MPLX: Q4 Beats--Raising Valuation But Maintain Market Perform
• 02/03/14 - EPD: Q4 Exceeds Forecast--Raising Estimates
• 02/03/14 - KMI/KMP/KMR: Lack Of Surprise Disappoints
• 02/04/14 - APU: Strong Start To FY2014--No Change To Neutral Outlook: Challenging Market Conditions Appear Manageable
• 02/05/14 - NKA: FQ3 Slightly Below Forecast--Lowering Valuation: Gas Storage Fundamentals Remain Challenging In Our View
• 02/05/14 - OKE: Adjusting Valuation For OGS Spin-Off--Maintain Outperform
• 02/06/14 - DPM: Spectra Meeting Incrementally Positive - Raising Valuation
• 02/06/14 - SEP: Q4 Light, But Growth Trajectory Visible & Confirmed: Investor Meeting Takeaways & Q4 Earnings Review
• 02/07/14 - MMP: Upgrading To Outperform On Accelerated Growth Trajectory: Visible Growth, Favorable Fundamentals And Attractive Valuation
• 02/07/14 - PAA: Q4 In Line--Raising Valuation On Higher Growth Capex
• 02/07/14 - PAGP: Q4 Slight Beat--Raising Valuation On Higher Growth Capex
• 02/07/14 - NS: Q4 In-Line 2014 Guidance Unchanged Raising Valuation
• 02/07/14 - NSH: Q4 DCF Slightly Below Estimate -- Raising Valuation
• 02/10/14 - TLLP: Q4 Light--Transitional Quarter--Positive Thesis Intact
• 02/10/14 - SPH: FQ1 Miss On Volumes--Lowering FY2014 Estimates: Despite Challenging Market Attractive Yield Secure In Our View
• 02/10/14 - BPL: Q4 Ahead Of Forecast--Raising Valuation Range
WELLS FARGO SECURITIES, LLC Master Limited Partnerships EQUITY RESEARCH DEPARTMENT
6
• 02/10/14 - BWP: Lowering Valuation Range On Distribution Reduction: Current Unit Price Mostly Reflects Future Distribution Outlook
• 02/10/14 - SXE: Stock Thoughts Post Offering: Potential Acq. Would Be An Incremental Positive, In Our View
• 02/11/14 - BWP: Follow Up Thoughts On Distribution Cut And Quarter: Distribution Growth Appears Several Years Away--Neutral Outlook
• 02/11/14 - TCP: Q4 Essentially In Line--Maintain Market Perform
• 02/11/14 - DKL: Dropdown Acquisition Essentially In Line With Expectations
• 02/13/14 - NGL: FQ3 Results Light But Thesis Intact--Raising Valuation
• 02/13/14 - MEP: Q4 Miss--Long-Term Positive Outlook Intact: No Change To Five-Year Distribution CAGR Estimate Of 10%
• 02/13/14 - NGLS: Strong Q4 On LPG Exports--Raising Estimates And Valuation
• 02/13/14 - EEP/EEQ: Q4 Miss--No Change To Neutral Outlook
• 02/14/14 - TRGP: Downgrading To Market Perform On Valuation: Q4 DCF Light Dividend Increase In-Line
• 02/14/14 - ARP: Suspending Equity Research Coverage
• 02/14/14 - APL: Q4 Preview - Adjusting Estimates Ahead Of The Quarter: Positioned To Benefit From Higher NGL Prices - Positive Outlook
• 02/18/14 - PVR: Q4 Light--Merger With RGP Appears On Track
• 02/18/14 - EQM: Q4 In Line--View Strategic Shift A Positive--Raising Range
• 02/19/14 - USAC: Q4 In Line But 2014 Guidance Light: 2014E HP Additions Unchanged--Cash Flow Likely To Ramp In H2
• 02/19/14 - APL: Q4 And Guidance Below Forecast--Maintain Outperform: Recent Underperformance More Than Offsets Reset Expectations
• 02/19/14 - ATLS: Guidance At APL Below Forecast--Maintain Outperform: Recent Underperformance More Than Offsets Reset Expectations
• 02/19/14 - GEL: Q4 Misses--Lowering 2014 DCF Per Unit Estimate
• 02/19/14 - HEP: Updating Our Model Before Q4 2013 Earnings
• 02/19/14 - ETE/ETP/RGP/SXL: First Look At Q4 Results
• 02/20/14 - ACMP: Q4 In Line But Distribution Beat--Raising Valuation Range
• 02/20/14 - SXL: Q4 Beats On Crude Marketing--Raising Valuation
• 02/20/14 - ETP: Q4 DCF Above Forecast--Maintain Market Perform
• 02/21/14 - ETE: Q4 In Line--Raising Valuation--Still A Top Pick: LNG Upside Not Fully Reflected In Valuation
• 02/21/14 - RGP: Q4 Below Forecast Lowering 2014 DCF/Unit Estimate
• 02/21/14 - LGCY: Q4 & 2014 Guidance Light - Maintain Outperform: Value Proposition Still Seems Compelling- 9% Yield + 2-4% Growth
WELLS FARGO SECURITIES, LLC MLP Monthly: March 2014 EQUITY RESEARCH DEPARTMENT
7
• 02/24/14 - WPZ: Q4 EBITDA In Line--2014-15 Guidance Reaffirmed: Should Benefit From Pending Dropdown And Organic Initiatives
• 02/24/14 - HEP: Q4 In Line--Lowering Valuation Range
• 02/24/14 - WMB: Raising Valuation On Long-Term Dividend Growth Prospects: Should Benefit In 2014-15 From $5B+ Of Organic Initiatives
• 02/25/14 - EXLP: Q4 In Line--2014 Capex Guidance Ahead Of Expectations
• 02/26/14 - EROC: Lowering Estimates For Q4 Prerelease
• 02/26/14 - NKA: Increases FY'14 Guidance; Preliminary FY'15 Outlook In-Line
• 02/26/14 - OKS: Q4 Results In-Line - No Change To Neutral Outlook
• 02/26/14 - OKE: Q4 Results In-Line - Maintain Positive Outlook
• 02/27/14 - CEQP: Q4 In-Line; 2014 Guidance Reaffirmed
• 02/27/14 - CMLP: Q4 Essentially In Line--2014 Guidance Reaffirmed: Maintain Outperform
• 02/27/14 - SUSP: Drop-Downs Likely To Beat 2014 Guidance--Raising Valuation
• 02/28/14 - EROC: Downgrading To Market Perform And Lowering Val Range: Potential Acq. Likely To Support Coverage Rather Than Growth
• 02/28/14 - VNR: Downgrading To Market Perform On Valuation: Premium 8% Yield Reflects Visible Growth Outlook In Our View
• 02/28/14 - MWE: Downgrading To Market Perform--Accelerated Growth Delayed: Financing Burden To Weigh On Growth In Our View
• 02/28/14 - ACMP/EXLP: Accretive Acquisitions Announced
• 02/28/14 - BBEP: Q4 Results & 2014 Guidance Light - Maintain Outperform: Still Compelling Value - 10% Yield Plus 3% Growth, In Our View
WELLS FARGO SECURITIES, LLC Master Limited Partnerships EQUITY RESEARCH DEPARTMENT
8
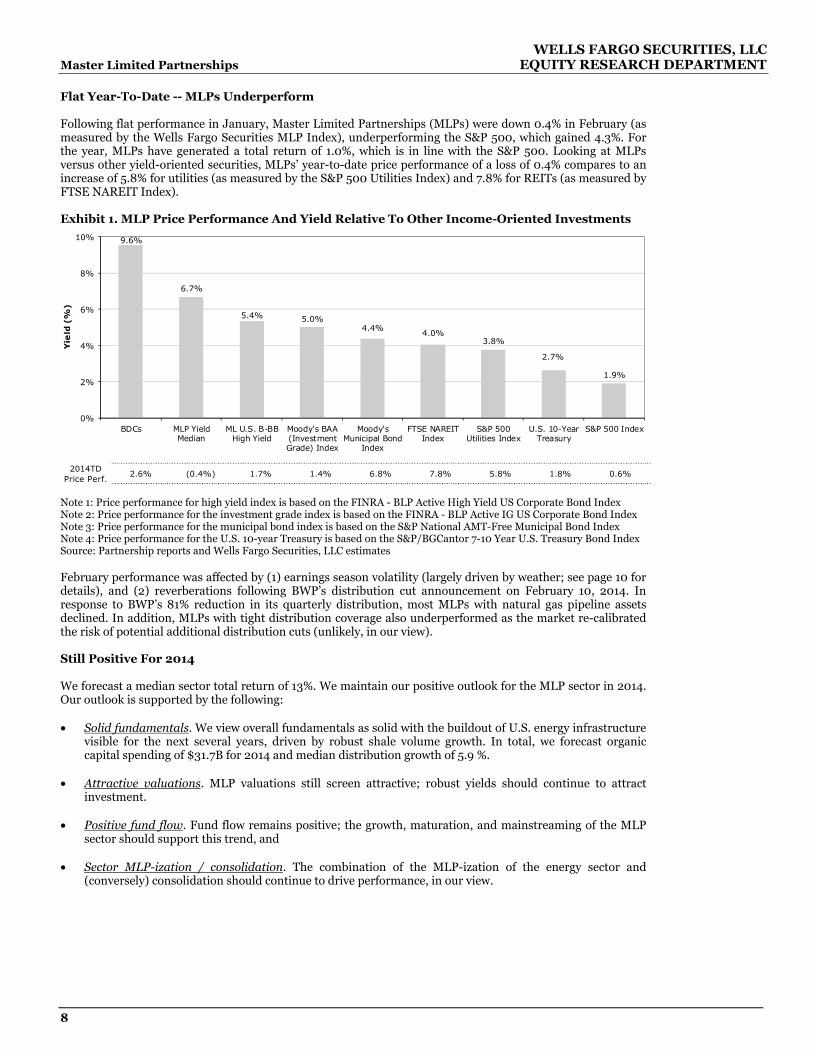
Flat Year-To-Date -- MLPs Underperform Following flat performance in January, Master Limited Partnerships (MLPs) were down 0.4% in February (as measured by the Wells Fargo Securities MLP Index), underperforming the S&P 500, which gained 4.3%. For the year, MLPs have generated a total return of 1.0%, which is in line with the S&P 500. Looking at MLPs versus other yield-oriented securities, MLPs’ year-to-date price performance of a loss of 0.4% compares to an increase of 5.8% for utilities (as measured by the S&P 500 Utilities Index) and 7.8% for REITs (as measured by FTSE NAREIT Index). Exhibit 1. MLP Price Performance And Yield Relative To Other Income-Oriented Investments
2014TD Price Perf.
2.6% (0.4%) 1.7% 1.4% 6.8% 7.8% 5.8% 1.8% 0.6%
9.6%
6.7%
5.4% 5.0%4.4%
4.0%3.8%
2.7%
1.9%
0%
2%
4%
6%
8%
10%
BDCs MLP YieldMedian
ML U.S. B-BBHigh Yield
Moody's BAA(InvestmentGrade) Index
Moody'sMunicipal Bond
Index
FTSE NAREITIndex
S&P 500Utilities Index
U.S. 10-YearTreasury
S&P 500 Index
Yie
ld (
%)
Note 1: Price performance for high yield index is based on the FINRA - BLP Active High Yield US Corporate Bond Index Note 2: Price performance for the investment grade index is based on the FINRA - BLP Active IG US Corporate Bond Index Note 3: Price performance for the municipal bond index is based on the S&P National AMT-Free Municipal Bond Index Note 4: Price performance for the U.S. 10-year Treasury is based on the S&P/BGCantor 7-10 Year U.S. Treasury Bond Index Source: Partnership reports and Wells Fargo Securities, LLC estimates February performance was affected by (1) earnings season volatility (largely driven by weather; see page 10 for details), and (2) reverberations following BWP’s distribution cut announcement on February 10, 2014. In response to BWP’s 81% reduction in its quarterly distribution, most MLPs with natural gas pipeline assets declined. In addition, MLPs with tight distribution coverage also underperformed as the market re-calibrated the risk of potential additional distribution cuts (unlikely, in our view). Still Positive For 2014 We forecast a median sector total return of 13%. We maintain our positive outlook for the MLP sector in 2014. Our outlook is supported by the following: • Solid fundamentals. We view overall fundamentals as solid with the buildout of U.S. energy infrastructure
visible for the next several years, driven by robust shale volume growth. In total, we forecast organic capital spending of $31.7B for 2014 and median distribution growth of 5.9 %.
• Attractive valuations. MLP valuations still screen attractive; robust yields should continue to attract
investment. • Positive fund flow. Fund flow remains positive; the growth, maturation, and mainstreaming of the MLP
sector should support this trend, and • Sector MLP-ization / consolidation. The combination of the MLP-ization of the energy sector and
(conversely) consolidation should continue to drive performance, in our view.
WELLS FARGO SECURITIES, LLC MLP Monthly: March 2014 EQUITY RESEARCH DEPARTMENT
9
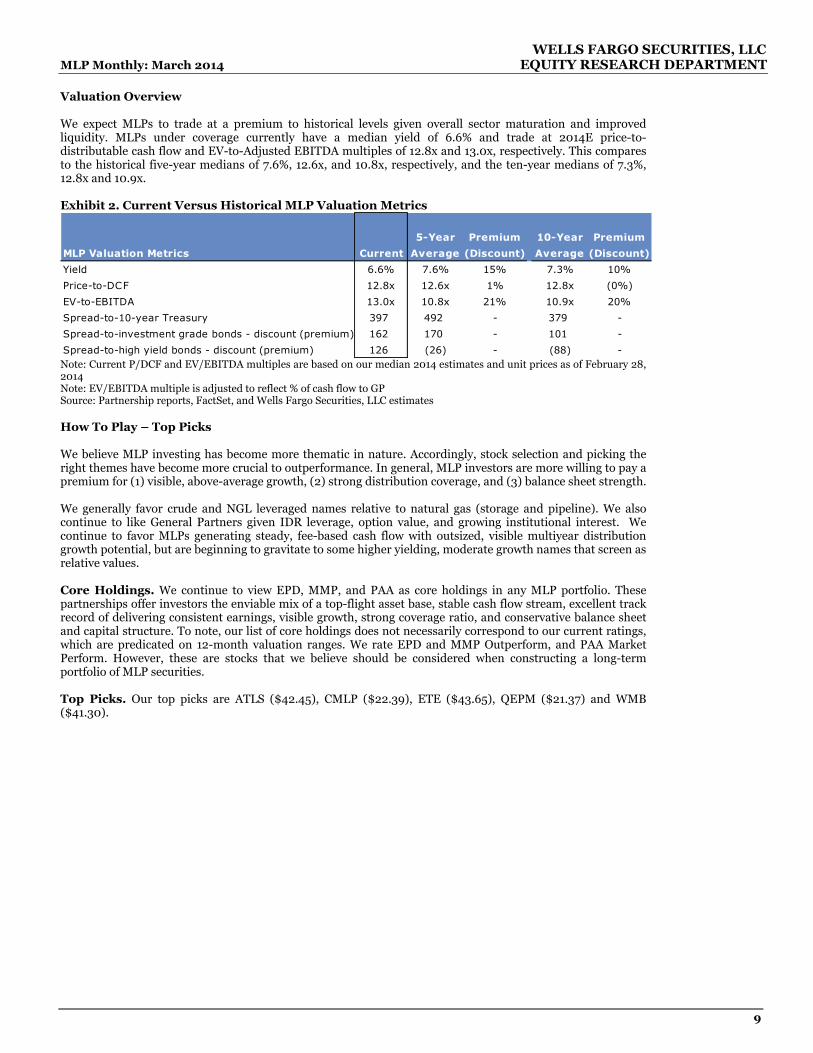
Valuation Overview We expect MLPs to trade at a premium to historical levels given overall sector maturation and improved liquidity. MLPs under coverage currently have a median yield of 6.6% and trade at 2014E price-to-distributable cash flow and EV-to-Adjusted EBITDA multiples of 12.8x and 13.0x, respectively. This compares to the historical five-year medians of 7.6%, 12.6x, and 10.8x, respectively, and the ten-year medians of 7.3%, 12.8x and 10.9x. Exhibit 2. Current Versus Historical MLP Valuation Metrics
5-Year Premium 10-Year Premium
MLP Valuation Metrics Current Average (Discount) Average (Discount)
Yield 6.6% 7.6% 15% 7.3% 10%
Price-to-DCF 12.8x 12.6x 1% 12.8x (0%)
EV-to-EBITDA 13.0x 10.8x 21% 10.9x 20%
Spread-to-10-year Treasury 397 492 - 379 -
Spread-to-investment grade bonds - discount (premium) 162 170 - 101 -
Spread-to-high yield bonds - discount (premium) 126 (26) - (88) - Note: Current P/DCF and EV/EBITDA multiples are based on our median 2014 estimates and unit prices as of February 28, 2014 Note: EV/EBITDA multiple is adjusted to reflect % of cash flow to GP Source: Partnership reports, FactSet, and Wells Fargo Securities, LLC estimates How To Play – Top Picks We believe MLP investing has become more thematic in nature. Accordingly, stock selection and picking the right themes have become more crucial to outperformance. In general, MLP investors are more willing to pay a premium for (1) visible, above-average growth, (2) strong distribution coverage, and (3) balance sheet strength. We generally favor crude and NGL leveraged names relative to natural gas (storage and pipeline). We also continue to like General Partners given IDR leverage, option value, and growing institutional interest. We continue to favor MLPs generating steady, fee-based cash flow with outsized, visible multiyear distribution growth potential, but are beginning to gravitate to some higher yielding, moderate growth names that screen as relative values. Core Holdings. We continue to view EPD, MMP, and PAA as core holdings in any MLP portfolio. These partnerships offer investors the enviable mix of a top-flight asset base, stable cash flow stream, excellent track record of delivering consistent earnings, visible growth, strong coverage ratio, and conservative balance sheet and capital structure. To note, our list of core holdings does not necessarily correspond to our current ratings, which are predicated on 12-month valuation ranges. We rate EPD and MMP Outperform, and PAA Market Perform. However, these are stocks that we believe should be considered when constructing a long-term portfolio of MLP securities. Top Picks. Our top picks are ATLS ($42.45), CMLP ($22.39), ETE ($43.65), QEPM ($21.37) and WMB ($41.30).

WELLS FARGO SECURITIES, LLC Master Limited Partnerships EQUITY RESEARCH DEPARTMENT
10
Exhibit 3. Top Picks By Sub Sector Price Current Valuation Range Total Return
2/28/2014 Yield Low High Potential
Large-Cap Pipeline MLPs
Enterprise Products Partners L.P. (EPD) $67.11 4.2% $69 $73 10%
Magellan Midstream Partners L.P. (MMP) $67.67 3.5% $72 $76 13%
Small-Cap Pipeline MLPs
Crestwood Midstream Partners LP (CMLP) $22.39 7.3% $26 $28 28%
NGL Energy Partners L.P. (NGL) $36.26 5.9% $37 $40 12%
Valero Energy Partners L.P. (VLP) $36.99 2.3% $40 $43 15%
Western Refining Logistics, L.P. (WNRL) $29.25 3.9% $29 $31 7%
Gathering And Processing MLPs
Atlas Pipeline Partners L.P. (APL) $30.74 8.1% $37 $39 32%
DCP Midstream Partners L.P. (DPM) $48.80 6.0% $53 $56 18%
QEP Midstream Partners, L.P. (QEPM) $21.37 4.9% $25 $27 27%
Upstream MLPs
Memorial Production Partners L.P. (MEMP) $22.34 9.8% $22 $24 13%
Midstream Marine MLPs
Capital Product Partners L.P. (CPLP) $10.76 8.6% $11 $12 16%
Seadrill Partners LLC (SDLP) $31.41 5.7% $38 $41 32%
General Partnerships
Atlas Energy L.P. (ATLS) $42.45 4.3% $50 $52 25%
Energy Transfer Equity L.P. (ETE) $43.65 3.2% $52 $54 25%
Williams Companies Inc. (WMB) $41.30 3.9% $48 $51 24%
Source: FactSet and Wells Fargo Securities, LLC estimates A Wild Ride This Earnings Season With A Dichotomy In Performance To date, 60 out of 67 MLPs under coverage have released earnings, with 36 companies (or 60%) reporting results that were in line with or above our expectations. The trend continues with a dichotomy in performance, as evidenced by Q4 results. In general, MLPs with a leading market position, strong management team, and a good history of execution reported Q4 results in line with or above our forecast and reaffirmed or raised guidance. In contrast, MLPs with more volatile businesses were at greater risk of missing earnings forecasts and reducing guidance. The best- and worst-performing MLP subsectors (relative to our Q4 2013 estimates) were coal and upstream, respectively. Coal MLPs benefitted from higher-than-expected volume (i.e., ARLP) and one-time items (i.e., NRP), while quarterly results of upstream MLPs were negatively affected by (1) adverse weather conditions (see below for details), (2) wider-than-forecast crude oil basis differentials (difficult to hedge), and (3) rising lease operating expenses. Based on commodity exposure, MLPs primarily engaged in providing crude oil/refined products midstream services also reported strong Q4 results (i.e., 75% were in line with or beat), while the performance of natural gas-focused names was largely below expectations (i.e., only 38% were in line with or beat). Natural gas pipeline and storage fundamentals have remained challenging and continue to weigh on contributions from these assets. All GP MLPs under coverage (i.e., six) released Q4 2013 earnings, with all companies reporting results that were in line with or above our expectations.

WELLS FARGO SECURITIES, LLC MLP Monthly: March 2014 EQUITY RESEARCH DEPARTMENT
11
Exhibit 4. Earnings Scorecard
7
4
8
5
1 1
4
6
1
3
3 6
66
2
1 2
2
1 3
1
0
5
10
15
20
Natural GasLiquids
RefinedProducts /Crude Oil
Upstream Natural Gas/
Compression
Propane Coal Shipping GeneralPartners
Nu
mb
er
of
MLP
s
Miss In-Line Beat Did Not Report
Source: Partnership reports and Wells Fargo Securities, LLC estimates Investor expectations appear to be rising, in our view. Several MLPs reported results that appeared to be in line with expectations or solid, but that experienced weakness in their stock prices. For example, OKS reported in-line results, but the stock sold off as investors were disappointed that ONEOK is unlikely to capture the full arbitrage opportunity of the wide Mid-Con to Gulf Coast propane spread in Q1. QEPM reported strong results and told the market that a drop-down could still occur in spite of the midstream separation plan at QEP. However, the stock sold off post earnings as investors perhaps were hoping for an additional catalyst. Finally, CMLP reported essentially in-line results and reaffirmed 2014 guidance, though weather did affect Arrow volume. Nevertheless, the stock was weak post earnings. Other trends we garnered during the Q4 earnings season include the following: • Q4 Weather Affected Results; Q1 Also Likely To Be Negatively Affected. Adverse weather
conditions in Texas, the Mid-Continent, and Rocky Mountain regions affected Q4 results (upstream and gathering and processing MLPs in particular). Production curtailments and plant disruptions generated some noise in the quarter. We anticipate that Q1 2014 earnings could also be negatively affected as challenging weather conditions have persisted into 2014 in some key producing regions. Some of the MLPs with G&P operations/volume affeted by weather in Q4 2013 include CMLP, EEP/MEP, WES, and WPZ. Virtually all upstream MLPs indicated that Q4 results were affected by weather to varying degrees.
• 2013 Distribution Coverage Was Light; Ratio Is Poised To Improve This Year. We estimate
that 26 out of the 61 (or 43%) MLPs under coverage (and also formed before 2012) generated a distribution coverage ratio below 1x in 2013. This is a substantial increase from 21 MLPs (or 34%) that did not generate enough cash flow to fully cover their distributions in 2012. The deterioration in distribution coverage was mainly experienced in the upstream subsector (i.e., seven MLPs with below 1x coverage in 2013. versus two MLPs in 2013). Surprisingly, the year-over-year variance was also attributable to lower coverage reported by large-cap pipeline MLPs (i.e.. 8 out of 14 MLPs (or 57%) in 2013. versus 5 companies in 2012). In general, the shortfalls in 2013 coverage were largely driven by (1) the impact of lower commodity prices, (2) financing costs/burden associated with large investments with long-lead times, (3) acquisitions consummated at lofty multiples. and/or (4) weakness in natural gas fundamentals on pipelines and storage assets. For 2014, we forecast that 13 companies under coverage will generate a coverage ratio below 1x.
• Midstream Investment Opportunities Remain Plentiful. Several MLPs provided/updated their
2014-15 capex guidance to include spending for new projects they plan to undertake. Specifically, our 2014-15 growth capex forecast has increased by approximately $6.5B, to $57.3B from a total of $50.8B estimated as of December 31, 2013 (before the start of the Q4 2013 earnings season). Part of the increase is attributable to new capital allocated to the development of midstream infrastructure in the Northeast (e.g.. WPZ’s $2.1B Atlantic Sunrise project, MWE’s larger-than-expected capex program of $1.8-2.3B, versus our prior estimate of $1B).

WELLS FARGO SECURITIES, LLC Master Limited Partnerships EQUITY RESEARCH DEPARTMENT
12
• Performance Of Recent Third-Party Acquisitions Appears Mixed. In general, contributions from some recent acquisitions, driven by producer activity have been below management’s initial expectations. The shortfall highlights the risk of achieving targeted acquisition returns/gathering and processing volumes predicated on producers’ development plans, which tend to be less visible and dynamic. Specifically, APL lower its 2014 financial guidance primarily to reflect lower anticipated growth tied to its south Texas assets (acquired in mid-2013). Additionally, XTEX’s Ohio River Valley (ORV) volumes have been below its original expectations. Management indicated that the combination of severe winter weather and gathering and processing constraints in the region impeded the pace of wells coming on line and associated condensate production. In contrast, acquisitions of other midstream assets (non-G&P) appear to be tracking in line with or exceeding expectations. For example, BPL, MMP, SUSP, and USAC indicated that the performance of their recent acquisitions is meeting or beating their initial projections.
• No Step Change In Dry Gas Activity With Price Improvement, Though Some Regions Could
Benefit. In general, MLPs have not noticed a material change in producers’ capital allocation plans despite the recent increase in natural gas prices, which most view as being primarily weather driven. The focus continues to be on the development of liquids-rich resource plays. However, some companies have indicated increased activity in the Haynesville as gas prices have strengthened. Specifically, ACMP noted that CHK and EXCO plan to increase the number of rigs deployed in the area to 7-9 and 2-3 rigs, respectively. Additionally, Kinder Morgan highlighted the Haynesville as an area where activity could pick up sooner than expected.
• Gas Storage Fundamentals Remain Challenging Though Recent Volatility Has Helped. In
general, management teams remain bearish on longer term natural gas storage fundamentals. BWP cited the weak gas storage environment as one of the reasons why it decided to cut its distribution. BPL intends to sell its natural gas storage business (Lodi) in 2014 and incurred a non-cash impairment charge of $169MM for the quarter. CEQP is still proceeding with its plans to decommission 23 billions of cubic feet (Bcf) of capacity despite the year-over-year improvement in Tres Palacios’ Q4 results. Finally, NKA’s FQ3 2014 results were below expectations, but the partnership increased its FY2014 guidance on near-term volatility cash flow.
• ATMs Could Be A Principal Source Of Equity Financing In 2014 (Absent Acquisitions). We
anticipate that MLPs will continue to use their at-the-market (ATM) programs in 2014 to help fund their capital expenditure. For our coverage universe, we estimate MLPs will raise approximately $7.8B (or close to 30% of 2014E total equity issuances) via ATMs. This compares to $6.7B of equity raised through ATMs in 2013. Notably, a few MLPs (e.g., ACMP, EEP, WES) indicated that equity raised from their ATM programs should be sufficient to finance their capital budgets for 2014 (absent acquisitions).
WELLS FARGO SECURITIES, LLC MLP Monthly: March 2014 EQUITY RESEARCH DEPARTMENT
13
Distribution Scorecard – Median Year-Over-Year Growth Of 5.1% For Q4 2013, MLPs increased distributions/dividends by a median of 5.1% on a year-over-year basis and 1.2% sequentially. Pure-play general partner (GP) C-corps, GP MLPs, and small-cap pipeline MLPs were the fastest-growing sub-groups, posting yr/yr median distribution increases of 23.8%, 10.4%, and 10.0%, respectively. To date, 61 out of 74 MLPs in our coverage universe (or about 84%) declared quarterly distributions that were either in line with or above our estimates. Exhibit 5. Q4 2013 Yr/Yr And Sequential Distribution Growth By MLP Subsector
6.9%2.2% 2.2% 1.9% 2.9% 1.3%
9.8%
1.2%
23.8%
10.4% 10.0%
6.9%5.8% 5.7% 5.0%
3.5% 2.5%0.0%
(18.4%)
5.1%
(20%)
(15%)
(10%)
(5%)
0%
5%
10%
15%
20%
25%
30%
GPs
(C-C
orp
s)
GPs
(MLP
)
Sm
all ca
p p
ipel
ine
Gath
er /
pro
cess
Oilf
ield
ser
vice
s
Larg
e ca
p p
ipel
ine
Propane
Mar
ine
tran
sport
atio
n
Upst
ream
Coal
Non-t
raditio
nal
All
MLP
s
Q4
'13
Med
ian
Dis
trib
uti
on
Gro
wth
Year/Year Distribution Growth Sequential Distribution Growth
Source: Partnership reports and Wells Fargo Securities, LLC

WELLS FARGO SECURITIES, LLC Master Limited Partnerships EQUITY RESEARCH DEPARTMENT
14
MLPs By Business Activity – A Reference Guide Given the proliferation of MLPs (33 IPOs in the past two years), the growing divergence in performance for MLP subgroups and recent volatility in commodity prices, the importance of owning the right MLP in the right sector has increased. In general, we continue to favor MLPs in the crude oil and NGL segments over MLPs with natural gas pipeline and storage assets given relative industry fundamentals. In response to multiple inquiries from investors, we are providing a table that breaks down MLPs between five product-based business activities. These activities include natural gas, natural gas liquids (NGLs), refined products, crude oil, and other. The other category includes such business activities as asphalt, coal, construction/logistics/operational (for third-parties), olefins, real estate rents, refinery, sulfur, and water-handling services, among others. The table does not represent commodity price exposure. Rather, it categorizes MLP business activity by commodity based on relative contribution to EBITDA, gross margin, operating margin, or revenue (in order of preference and based on available company operating/financial disclosures). In other words, an MLP with 50% of EBITDA derived from crude oil pipelines will be shown as having a 50% “exposure” to crude oil (i.e., related to the business of handling crude oil and does not necessarily equate to crude oil price exposure). Given limited company disclosures regarding cash flow generated by commodity product type, we made some general assumptions in our analysis, which we recognize could have inadvertently skewed our estimate(s) for a company’s product-based cash flow profile. Our primary assumptions include the following: • If a business segment (e.g., pipelines or storage) reports volumes from two different types of products
(e.g., crude oil and refined products), but reports only one cash flow number (e.g., EBITDA, gross margin), then the cash flow was allocated between product type based on actual/forecasted volumes.
• In cases where no throughput metrics were provided (e.g., storage), but a total capacity split by product handled was available (e.g., total crude oil and refined product storage capacity), then the cash flow numbers were allocated based on the amount of capacity by product.
• If the cash flow from a smaller business (e.g., crude oil) was reported within a larger business segment (e.g., refined products), and no operating metrics were provided for the smaller business, then the cash flow of the smaller business (i.e., crude oil) was included as part of the larger segment (i.e., refined products).
For MLPs with gathering & processing businesses, we made the following assumptions:
• Fee-based gathering activities and equity residue gas sales were classified as natural gas;
• Compression businesses were included within natural gas;
• Fee-based processing cash flow was classified as NGLs;
• Cash flow from equity NGLs under percent-of-proceeds (POP), percent-of-liquids (POL), and keep-whole (KW) agreements were included within NGLs;
• Fractionation businesses were included within NGLs; and
• Equity condensate was included in crude oil.
Our intention for this table is to serve as a general reference guide to help investors identify the subsector within the industry they wish to focus on. We plan to provide a commodity sensitivity analysis for the MLP sector in a future monthly report. The following is a summary of the top MLPs with the most exposure by commodity category: • Natural gas: EPB, EQM, EXLP, NKA, TCP, and USAC (100% each)
• NGLs: APU (100%), SPH (100%), NGLS (90%), OKS (74%), and DPM (72%)
• Refined products: BPL (85%); TLLP (84%), SUSP (75%), GLP (73%), and HEP (73%)
• Crude oil: MCEP (99%), EEP (92%), PAA (87%), QRE (84%), and LGCY (83%)

WELLS FARGO SECURITIES, LLC MLP Monthly: March 2014 EQUITY RESEARCH DEPARTMENT
15
Exhibit 6. MLP Commodity Mix Commodity Mix 2014 Estimates
Base Natural Refined CrudeTicker Calc Gas NGLs Products Oil Other
Buckeye Partners, L.P. BPL E 0% 0% 85% 12% 3%Boardw alk Pipeline Partners, LP BWP R 96% 4% 0% 0% 0%Enbridge Energy Partners, L.P. Class A EEP E 4% 4% 0% 92% 0%El Paso Pipeline Partners, L.P. EPB E 100% 0% 0% 0% 0%Enterprise Products Partners L.P. EPD G 16% 54% 2% 17% 11%Energy Transfer Partners, L.P. ETP E 47% 27% 10% 15% 0%Kinder Morgan Energy Partners, L.P. KMP E 42% 2% 18% 25% 12%Magellan Midstream Partners, L.P. MMP E 0% 0% 70% 30% 0%NuStar Energy L.P. NS E 0% 0% 59% 41% 0%ONEOK Partners, L.P. OKS E 22% 74% 0% 4% 0%Plains All American Pipeline, L.P. PAA E 6% 7% 0% 87% 0%Spectra Energy Partners, LP SEP E 80% 4% 0% 15% 0%Sunoco Logistics Partners L.P. SXL E 0% 0% 18% 82% 0%Williams Partners L.P. WPZ E 52% 26% 0% 0% 22%Large Cap Pipeline MLP Average 33% 14% 19% 30% 3%
Arc Logistics Partners LP ARCX R 28% 0% 22% 41% 9%Blueknight Energy Partners, L.P. BKEP O 0% 0% 0% 54% 46%Crestw ood Midstream Partners LP CMLP G 78% 8% 0% 12% 3%Delek Logistics Partners LP DKL E 0% 0% 50% 50% 0%Exterran Partners, L.P. EXLP E 100% 0% 0% 0% 0%Genesis Energy, L.P. GEL O 0% 0% 9% 70% 21%Global Partners LP GLP G 0% 0% 73% 11% 16%Holly Energy Partners, L.P. HEP R 0% 0% 73% 27% 0%Martin Midstream Partners L.P. MMLP E 0% 20% 7% 10% 62%MPLX LP MPLX R 0% 3% 43% 54% 0%NGL Energy Partners LP NGL E 0% 38% 2% 37% 23%Niska Gas Storage Partners LLC NKA E 100% 0% 0% 0% 0%Susser Petroleum Partners LP SUSP G 0% 0% 75% 0% 25%TC PipeLines, LP TCP O 100% 0% 0% 0% 0%Tesoro Logistics LP TLLP E 0% 0% 84% 16% 0%USA Compression Partners LP USAC E 100% 0% 0% 0% 0%Valero Energy Partners LP VLP R 0% 0% 64% 36% 0%Western Refining Logistics, LP WNRL E 0% 0% 55% 32% 13%Small Cap Pipeline MLP Average 28% 4% 31% 25% 12%
Access Midstream Partners, L.P. ACMP E 97% 3% 0% 0% 0%American Midstream Partners, LP AMID G 72% 20% 0% 8% 0%Atlas Pipeline Partners, L.P. APL G 40% 56% 0% 4% 0%DCP Midstream Partners, LP DPM G 23% 72% 0% 5% 0%EQT Midstream Partners LP EQM E 100% 0% 0% 0% 0%Midcoast Energy Partners LP Class A MEP E 45% 40% 0% 14% 0%MarkWest Energy Partners, L.P. MWE O 27% 70% 0% 3% 0%Targa Resources Partners LP NGLS G 0% 90% 0% 10% 0%PVR Partners, L.P. PVR E 64% 15% 0% 3% 18%QEP Midstream Partners LP QEPM E 80% 0% 0% 14% 6%Regency Energy Partners LP RGP G 50% 39% 0% 8% 4%Southcross Energy Partners, L.P. SXE G 47% 50% 0% 3% 0%Western Gas Partners, LP WES G 69% 28% 0% 2% 0%Crosstex Energy, L.P. XTEX G 47% 41% 0% 12% 0%Gathering & Processing MLP Average 54% 38% 0% 6% 2%
BreitBurn Energy Partners L.P. BBEP R 17% 5% 0% 79% 0%Eagle Rock Energy Partners, L.P. EROC R 25% 17% 0% 56% 2%EV Energy Partners, L.P. EVEP R 55% 21% 0% 24% 0%Legacy Reserves LP LGCY R 15% 2% 0% 83% 0%Linn Energy, LLC LINE R 27% 11% 0% 63% 0%LRR Energy, L.P. LRE R 22% 8% 0% 70% 0%Mid-Con Energy Partners, LP MCEP R 1% 0% 0% 99% 0%Memorial Production Partners LP MEMP R 38% 15% 0% 47% 0%QR Energy, LP QRE R 11% 6% 0% 84% 0%Vanguard Natural Resources, LLC VNR R 37% 18% 0% 45% 0%Upstream MLP Average 25% 10% 0% 65% 0%
AmeriGas Partners, L.P. APU E 0% 100% 0% 0% 0%Suburban Propane Partners, L.P. SPH E 0% 100% 0% 0% 0%Propane MLP Average 0% 100% 0% 0% 0%
All MLPs Average 34% 19% 14% 28% 5%
Ups
trea
m M
LPs
Larg
e C
ap P
ipel
ine
MLP
sSm
all &
Mid
Cap
.G
athe
ring
& P
roce
ssin
g M
LPs
Prop
Base Calc Key: E = EBITDA; G = Gross Margin; O = Operating Margin; and R = Revenue Source: Partnership reports and Wells Fargo Securities, LLC estimates

WELLS FARGO SECURITIES, LLC Master Limited Partnerships EQUITY RESEARCH DEPARTMENT
16
What’s Up(stream): Upstream MLP March Update Author: Praneeth Satish, Senior Analyst, Upstream MLPs, Equity Research Upstream MLPs Underperform Broader MLP Index In February Upstream MLPs were down 1.6% in February on a market-cap basis, versus a 0.4% decline for the broader Wells Fargo Securities MLP Index and a 4.3% gain for the S&P 500. The relative underperformance was primarily attributable to a weak Q4 2013 earnings cycle for upstream MLPs, in our view. Our top pick in the upstream MLP sector is MEMP. Exhibit 7. Upstream MLP Performance By Month
Market Cap ($B)
$1.5 $2.1 $0.8 $1.4 $1.5 $7.4 $0.4 $0.5 $1.0 $1.5 $2.4
##### ARP BBEP EROC EVEP LGCY LINE LRE MCEP MEMP QRE VNR Upstream MLP
Jan-14 10% 1% (7%) 6% (7%) 6% (4%) 2% (0%) 4% 2% 2.9% 0.0%
Feb-14 (4%) (3%) (12%) (2%) 1% (3%) 5% 1% 2% (1%) (1%) (1.6%) (0.4%)
YTD 10% 1% (7%) 6% (7%) 6% (4%) 2% (0%) 4% 2% 1.4% 0.1%
Wells Fargo Indices 1
Note: Colors are a visual indication of relative performance for any given month Note 1: Market-cap weighted performance Source: FactSet and Wells Fargo Securities, LLC Q4 Earnings Season Tracks Below Expectations Upstream MLP Q4 2013 earnings results were largely below our expectations. Eight out of 11 upstream MLPs under coverage reported Q4 earnings that were below our forecast. The relatively poor earnings cycle was largely attributable to (1) weather-related disruptions in West Texas and the Mid-Continent, (2) wider-than-forecast crude oil basis differentials (difficult to hedge), and (3) rising lease operating expenses for a number of upstream MLPs. Most management teams indicated that weather-related disruptions continued in Q1 2014. While we anticipate earnings results in Q1 2014 could also be weak, we believe investors/analysts have adequately reset earnings expectations heading into the quarter. Exhibit 8. Q4 2013 Earnings Scorecard
Q4'13 EBITDA ($MM) Q4'13 DCF/Unit Beat Or Variance From Est.Ticker Actual Our Est. Street Actual Our Est. Miss? EBITDA DCF/Unit
Atlas Resource Partners, L.P. ARP $67.4 $69.6 $62.2 $0.62 $0.65 Miss (3.1%) (4.6%)BreitBurn Energy Partners L.P. BBEP $109.4 $123.1 $122.4 $0.49 $0.70 Miss (11.1%) (30.3%)Eagle Rock Energy Partners, L.P. EROC $57.4 $55.2 $58.3 $0.12 $0.13 Beat 4.0% (7.7%)EV Energy Partners, L.P. EVEP $53.7 $58.7 $59.0 $0.54 $0.60 Miss (8.4%) (9.9%)Legacy Reserves LP LGCY $64.2 $72.9 $69.1 $0.57 $0.73 Miss (11.9%) (22.4%)Linn Energy, LLC LINE $448.7 $392.3 $423.3 $0.81 $0.70 Beat 14.4% 16.4%LRR Energy, L.P. LRE $20.4 $21.2 $20.3 $0.49 $0.51 Miss (3.5%) (3.7%)Mid-Con Energy Partners, LP MCEP $14.4 $15.2 $14.5 $0.63 $0.63 Miss (5.1%) (0.9%)Memorial Production Partners LP MEMP $65.0 $71.1 $68.1 $0.57 $0.83 Miss (8.5%) (31.1%)QR Energy, LP QRE $72.0 $72.5 $73.3 $0.58 $0.59 In-line (0.8%) (1.6%)Vanguard Natural Resources, LLC VNR $74.3 $80.8 $86.3 $0.54 $0.57 Miss (8.1%) (6.0%)
Upstream MLP Median (5.1%) (6.0%) Source: Company data and Wells Fargo Securities, LLC estimates 2014 Guidance Ranges Largely Below Our Forecasts In addition to weak Q4 2013 results, upstream MLPs provided preliminary 2014 guidance ranges that were largely below our forecasts. Management teams indicated that many of the factors that weighed on Q4 2013 results are likely to persist into early 2014. Nevertheless, most partnerships were optimistic that DCF and coverage should improve markedly heading into H2 2014. The following Exhibit tracks the median distribution coverage ratio for upstream MLPs under coverage. While coverage was approximately 1.1x in Q3 2013, we estimate that coverage could decrease to approximately 1.00x in Q4 2013E. However, we forecast coverage to improve gradually over the course of the year and exceed 1.1x by Q4 2014E.

WELLS FARGO SECURITIES, LLC MLP Monthly: March 2014 EQUITY RESEARCH DEPARTMENT
17
Exhibit 9. Median Upstream MLP Distribution Coverage Ratios By Quarter
1.09x
1.01x
1.04x
1.08x
1.11x
0.90x
0.95x
1.00x
1.05x
1.10x
1.15x
Q3'13A Q1'14E Q2'14E Q3'14E Q4'14E
Med
ian
Dis
trib
uti
on
Co
vera
ge R
ati
o
Source: Company data and Wells Fargo Securities, LLC estimates Are Distributions Secure? Despite the earnings miss and relatively light 2014 guidance outlooks, we believe distributions are secure for most upstream MLPs under coverage and poised to increase modestly in 2014 for a number of partnerships. That stated, the upstream MLP with the lowest projected distribution coverage ratio 2014 is EVEP. We believe the stability of the partnership’s distribution is predicated on a successful ramp in cash flow tied to the build-out of midstream infrastructure in the Utica and growing cash flow contributions from EVEP’s overriding royalty interest (ORRI).
WELLS FARGO SECURITIES, LLC Master Limited Partnerships EQUITY RESEARCH DEPARTMENT
18
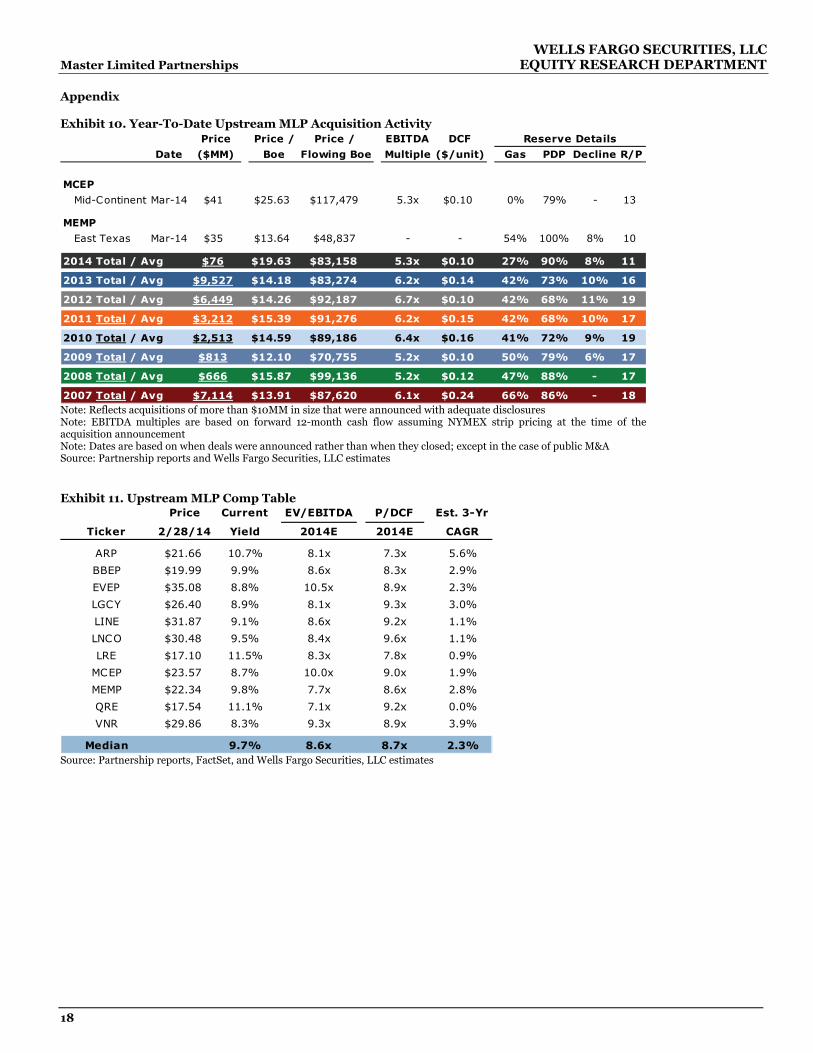
Appendix Exhibit 10. Year-To-Date Upstream MLP Acquisition Activity
Price Price / Price / EBITDA DCF Reserve Details
Date ($MM) Boe Flowing Boe Multiple ($/unit) Gas PDP Decline R/P
MCEP
Mid-Continent Mar-14 $41 $25.63 $117,479 5.3x $0.10 0% 79% - 13
MEMP
East Texas Mar-14 $35 $13.64 $48,837 - - 54% 100% 8% 10
2014 Total / Avg $76 $19.63 $83,158 5.3x $0.10 27% 90% 8% 11
2013 Total / Avg $9,527 $14.18 $83,274 6.2x $0.14 42% 73% 10% 16
2012 Total / Avg $6,449 $14.26 $92,187 6.7x $0.10 42% 68% 11% 19
2011 Total / Avg $3,212 $15.39 $91,276 6.2x $0.15 42% 68% 10% 17
2010 Total / Avg $2,513 $14.59 $89,186 6.4x $0.16 41% 72% 9% 19
2009 Total / Avg $813 $12.10 $70,755 5.2x $0.10 50% 79% 6% 17
2008 Total / Avg $666 $15.87 $99,136 5.2x $0.12 47% 88% - 17
2007 Total / Avg $7,114 $13.91 $87,620 6.1x $0.24 66% 86% - 18 Note: Reflects acquisitions of more than $10MM in size that were announced with adequate disclosures Note: EBITDA multiples are based on forward 12-month cash flow assuming NYMEX strip pricing at the time of the acquisition announcement Note: Dates are based on when deals were announced rather than when they closed; except in the case of public M&A Source: Partnership reports and Wells Fargo Securities, LLC estimates Exhibit 11. Upstream MLP Comp Table
Price Current EV/EBITDA P/DCF Est. 3-Yr
Ticker 2/28/14 Yield 2014E 2014E CAGR
ARP $21.66 10.7% 8.1x 7.3x 5.6%
BBEP $19.99 9.9% 8.6x 8.3x 2.9%
EVEP $35.08 8.8% 10.5x 8.9x 2.3%
LGCY $26.40 8.9% 8.1x 9.3x 3.0%
LINE $31.87 9.1% 8.6x 9.2x 1.1%
LNCO $30.48 9.5% 8.4x 9.6x 1.1%
LRE $17.10 11.5% 8.3x 7.8x 0.9%
MCEP $23.57 8.7% 10.0x 9.0x 1.9%
MEMP $22.34 9.8% 7.7x 8.6x 2.8%
QRE $17.54 11.1% 7.1x 9.2x 0.0%
VNR $29.86 8.3% 9.3x 8.9x 3.9%
Median 9.7% 8.6x 8.7x 2.3% Source: Partnership reports, FactSet, and Wells Fargo Securities, LLC estimates

WELLS FARGO SECURITIES, LLC MLP Monthly: March 2014 EQUITY RESEARCH DEPARTMENT
19
The View From The Bridge: Marine MLP March Update Authors: Michael Webber, Senior Analyst Sameed Musvee, Associate Analyst Shipping, Equipment Leasing and Marine MLPs, Equity Research Marine MLPs Post Solid Earnings Performance, We Maintain Our Positive 2014 Outlook Marine MLPs generally performed well during earnings with five out of six Marine MLPs under coverage beating Consensus estimates despite some moderate fundamental weakness (intermediate-term overcapacity) in the LNG and offshore spaces. We maintain our positive 2014 outlook for the group as: (1) we view long-term fundamentals as solid, with the buildout of U.S. LNG export infrastructure visible for the next 3-5 years (2) marine MLPs still appear to have attractive total return potential relative to other asset classes; (3) the potential for solid distribution growth, particularly in names such as SDLP (up 25%) given the financing needs of parent SDRL; and (4) continued support from fund flows. While we believe there is a degree of downside risk to the group given relatively solid valuations and near-term fundamental cross-winds, we view the group’s risk/reward profile as positive. To note, our estimates imply a group-wide total return of approximately 22%. Marine MLPs Outperform In February Marine MLPs were up 1.7% in February, outperforming the broader MLP space (the Wells Fargo Securities MLP Index was down 0.4%), though underperforming the S&P 500 (up 4.3%). KNOP (7.3%), TOO (4.1%), TGP (3.0%), CPLP (2.3%), DLNG (2.0%) and SDLP (1.7%) all moved higher, while NMM and GMLP were down by 6.9% and 0.8%, respectively. We attribute most of the downside to equity issuance/profit taking (in names like NMM). SDLP and CPLP remain our top Marine MLP picks, due to SDLP’s potential for 25% 2014/2015 distribution growth and CPLP’s secure about 8.6% yield and emerging growth story. We expect continued expansion of the Marine MLP group in 2014, with about 5 public Marine/Drilling C-Corps openly talking about forming MLPs (along with a meaningful shadow backlog). Exhibit 12. Marine MLP Overview
Marine MLPs Ticker Market Cap ($M) RatingPrice
2/28/14Valuation
RangeAnnualized Distribution
Current Yield
3-Yr Est. Dist. CAGR
Capital Product Partners L.P. CPLP $950 Outperform $10.76 $11 - $12 $0.93 8.6% 2.1%
Golar LNG Partners Limited GMLP $1,870 Outperform $30.21 $36 - $40 $2.09 6.9% 5.9%
Navios Maritime Partners L.P. NMM $1,350 Outperform $17.10 $18 - $20 $1.77 10.4% 0.0%Seadrill Partners LLC SDLP $1,886 Outperform $31.41 $38 - $41 $1.78 5.7% 19.3%
Teekay LNG Partners LP. TGP $3,098 Market Perform $41.67 $42 - $46 $2.77 6.6% 4.0%
Teekay Offshore Partners LP TOO $2,813 Outperform $32.76 $35 - $38 $2.15 6.6% 8.1%KNOT Offshore Partners LP 2 KNOP $501 Not Rated $28.75 NA $1.76 6.1% 9.3%Dynagas LNG Partners LP 2 DLNG $657 Not Rated $21.81 NA $1.46 6.7% 9.2%
Source: Capital IQ and Wells Fargo Securities, LLC estimates
(1) We are currently modeling a flat distribution for NMM. Should that market firm or should NMM complete an unforeseen acquisition, that growth rate could be higher. We note that NMM 's management has reiterated that its distribution is secure till the end of 2014.
Note: Shading indicates our top pick.(2) Consensus data. Not rated.
Pure-Play Marine GPs To Emerge In 2014 The Marine GPs remain one of our favorite groups in 2014, as key players (TK, GLNG, GLOG) move closer to becoming pure-play GPs, in our view. We believe that Marine GPs look attractive from an absolute and relative (compared to C-Corp GPs) valuation standpoint, given the potential for outsized distribution/dividend growth prospects. TK and GLNG remain our top Marine GP picks. The TK story has grown simpler over the past two years, and at this point, just two events (the Knarr dropdown in Q4 2014 and subsequent dividend increase) stand between investors and heightened GP value recognition (our TK valuation range is $60-72). We note that GLNG may have the most long-term upside potential of any major name in the space, stemming from its diversification into floating liquefaction, regas, and its underrated GP story (which we think could easily be worth $20-25/share (on its own) in 2016/2017 assuming a 6-7% growth rate at GMLP). We believe that it is very feasible that GLOG could spin off only a portion of its on-the-water fleet into an MLP (MLP spin-off announced on January 13), with the excess on-the-water tonnage adding more immediate growth to a future MLP. This could potentially pull forward GLOG’s GP valuation upside potential of 30-50% (based on our preliminary assumptions).
WELLS FARGO SECURITIES, LLC Master Limited Partnerships EQUITY RESEARCH DEPARTMENT
20
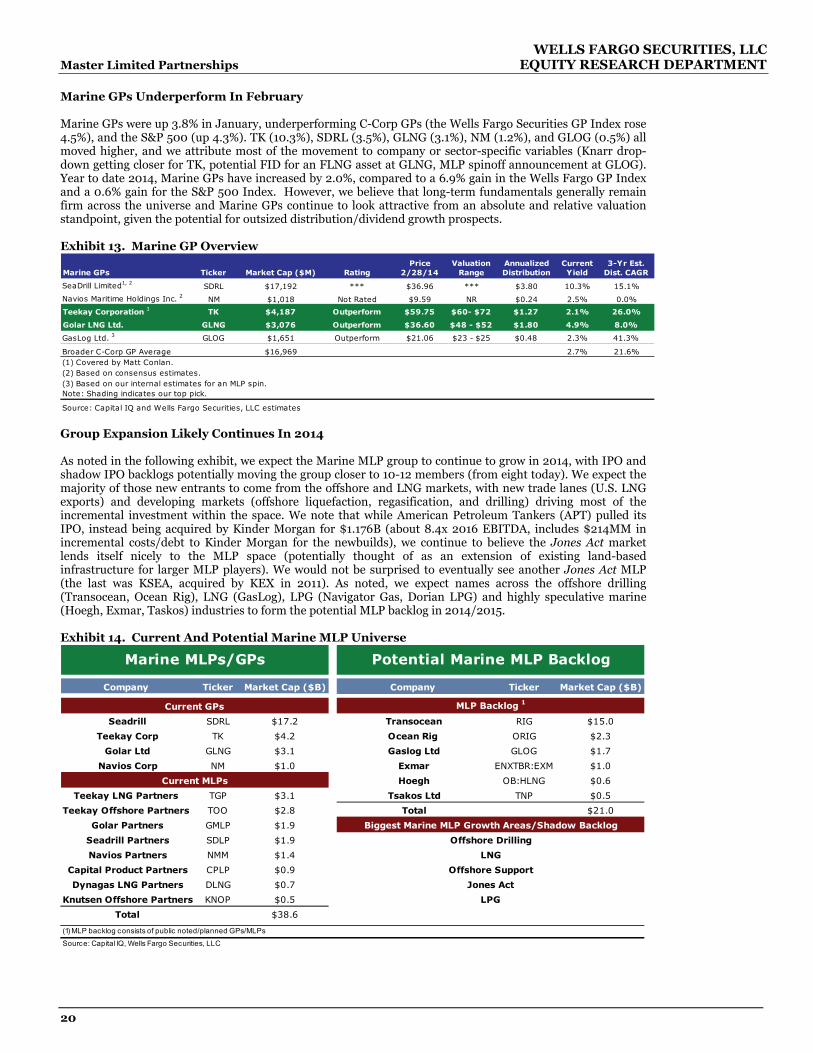
Marine GPs Underperform In February Marine GPs were up 3.8% in January, underperforming C-Corp GPs (the Wells Fargo Securities GP Index rose 4.5%), and the S&P 500 (up 4.3%). TK (10.3%), SDRL (3.5%), GLNG (3.1%), NM (1.2%), and GLOG (0.5%) all moved higher, and we attribute most of the movement to company or sector-specific variables (Knarr drop-down getting closer for TK, potential FID for an FLNG asset at GLNG, MLP spinoff announcement at GLOG). Year to date 2014, Marine GPs have increased by 2.0%, compared to a 6.9% gain in the Wells Fargo GP Index and a 0.6% gain for the S&P 500 Index. However, we believe that long-term fundamentals generally remain firm across the universe and Marine GPs continue to look attractive from an absolute and relative valuation standpoint, given the potential for outsized distribution/dividend growth prospects. Exhibit 13. Marine GP Overview
Marine GPs Ticker Market Cap ($M) RatingPrice
2/28/14Valuation
RangeAnnualized Distribution
Current Yield
3-Yr Est. Dist. CAGR
SeaDrill Limited1, 2 SDRL $17,192 *** $36.96 *** $3.80 10.3% 15.1%
Navios Maritime Holdings Inc. 2 NM $1,018 Not Rated $9.59 NR $0.24 2.5% 0.0%
Teekay Corporation 3 TK $4,187 Outperform $59.75 $60- $72 $1.27 2.1% 26.0%
Golar LNG Ltd. GLNG $3,076 Outperform $36.60 $48 - $52 $1.80 4.9% 8.0%
GasLog Ltd. 3 GLOG $1,651 Outperform $21.06 $23 - $25 $0.48 2.3% 41.3%
Broader C-Corp GP Average $16,969 2.7% 21.6%
Source: Capital IQ and Wells Fargo Securities, LLC estimates
(3) Based on our internal estimates for an MLP spin.Note: Shading indicates our top pick.
(1) Covered by Matt Conlan.(2) Based on consensus estimates.
Group Expansion Likely Continues In 2014 As noted in the following exhibit, we expect the Marine MLP group to continue to grow in 2014, with IPO and shadow IPO backlogs potentially moving the group closer to 10-12 members (from eight today). We expect the majority of those new entrants to come from the offshore and LNG markets, with new trade lanes (U.S. LNG exports) and developing markets (offshore liquefaction, regasification, and drilling) driving most of the incremental investment within the space. We note that while American Petroleum Tankers (APT) pulled its IPO, instead being acquired by Kinder Morgan for $1.176B (about 8.4x 2016 EBITDA, includes $214MM in incremental costs/debt to Kinder Morgan for the newbuilds), we continue to believe the Jones Act market lends itself nicely to the MLP space (potentially thought of as an extension of existing land-based infrastructure for larger MLP players). We would not be surprised to eventually see another Jones Act MLP (the last was KSEA, acquired by KEX in 2011). As noted, we expect names across the offshore drilling (Transocean, Ocean Rig), LNG (GasLog), LPG (Navigator Gas, Dorian LPG) and highly speculative marine (Hoegh, Exmar, Taskos) industries to form the potential MLP backlog in 2014/2015. Exhibit 14. Current And Potential Marine MLP Universe
Company Ticker Market Cap ($B) Company Ticker Market Cap ($B)
Seadrill SDRL $17.2 Transocean RIG $15.0
Teekay Corp TK $4.2 Ocean Rig ORIG $2.3
Golar Ltd GLNG $3.1 Gaslog Ltd GLOG $1.7
Navios Corp NM $1.0 Exmar ENXTBR:EXM $1.0
Hoegh OB:HLNG $0.6
Teekay LNG Partners TGP $3.1 Tsakos Ltd TNP $0.5
Teekay Offshore Partners TOO $2.8 Total $21.0
Golar Partners GMLP $1.9
Seadrill Partners SDLP $1.9
Navios Partners NMM $1.4
Capital Product Partners CPLP $0.9
Dynagas LNG Partners DLNG $0.7
Knutsen Offshore Partners KNOP $0.5
Total $38.6
(1) MLP backlog consists of public noted/planned GPs/MLPs
Source: Capital IQ, Wells Fargo Securities, LLC
MLP Backlog 1
Marine MLPs/GPs Potential Marine MLP Backlog
Current GPs
Current MLPs
Biggest Marine MLP Growth Areas/Shadow Backlog
Offshore Drilling
Offshore Support
Jones Act
LNG
LPG
WELLS FARGO SECURITIES, LLC MLP Monthly: March 2014 EQUITY RESEARCH DEPARTMENT
21
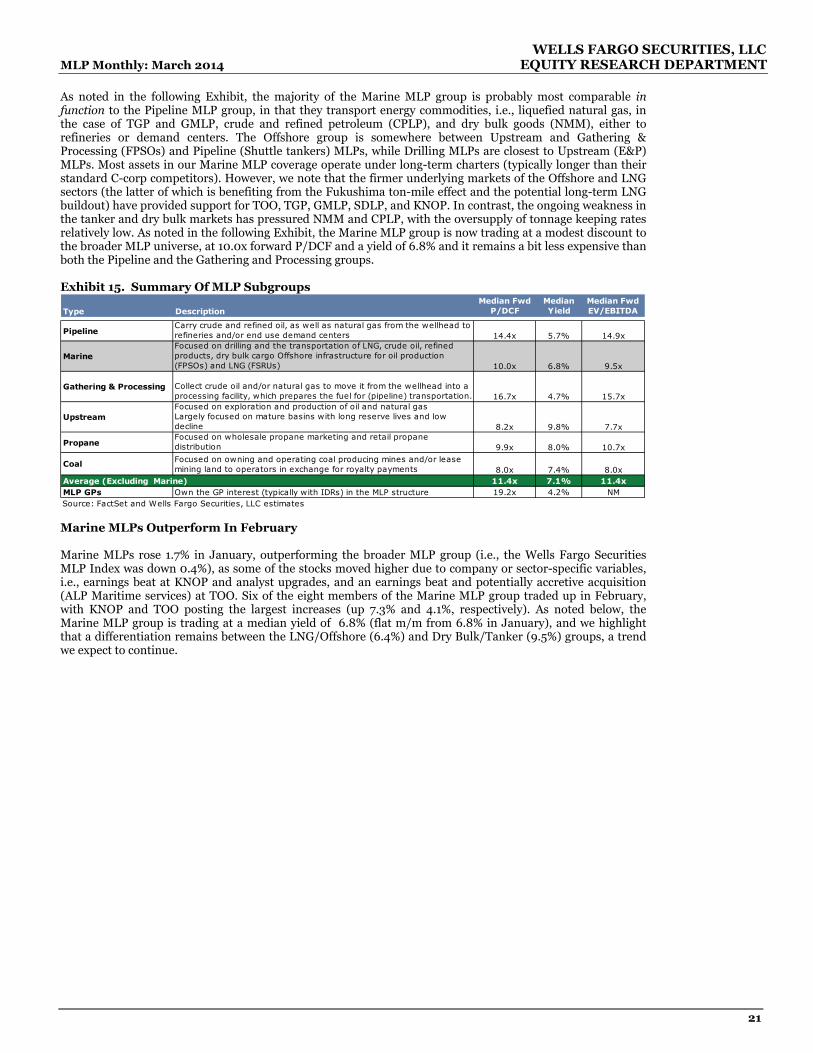
As noted in the following Exhibit, the majority of the Marine MLP group is probably most comparable in function to the Pipeline MLP group, in that they transport energy commodities, i.e., liquefied natural gas, in the case of TGP and GMLP, crude and refined petroleum (CPLP), and dry bulk goods (NMM), either to refineries or demand centers. The Offshore group is somewhere between Upstream and Gathering & Processing (FPSOs) and Pipeline (Shuttle tankers) MLPs, while Drilling MLPs are closest to Upstream (E&P) MLPs. Most assets in our Marine MLP coverage operate under long-term charters (typically longer than their standard C-corp competitors). However, we note that the firmer underlying markets of the Offshore and LNG sectors (the latter of which is benefiting from the Fukushima ton-mile effect and the potential long-term LNG buildout) have provided support for TOO, TGP, GMLP, SDLP, and KNOP. In contrast, the ongoing weakness in the tanker and dry bulk markets has pressured NMM and CPLP, with the oversupply of tonnage keeping rates relatively low. As noted in the following Exhibit, the Marine MLP group is now trading at a modest discount to the broader MLP universe, at 10.0x forward P/DCF and a yield of 6.8% and it remains a bit less expensive than both the Pipeline and the Gathering and Processing groups. Exhibit 15. Summary Of MLP Subgroups Type Description
Median FwdP/DCF
MedianYield
Median Fwd EV/EBITDA
PipelineCarry crude and refined oil, as well as natural gas from the wellhead to refineries and/or end use demand centers 14.4x 5.7% 14.9x
MarineFocused on drilling and the transportation of LNG, crude oil, refined products, dry bulk cargo Offshore infrastructure for oil production (FPSOs) and LNG (FSRUs) 10.0x 6.8% 9.5x
Gathering & Processing Collect crude oil and/or natural gas to move it from the wellhead into a processing facility, which prepares the fuel for (pipeline) transportation. 16.7x 4.7% 15.7x
UpstreamFocused on exploration and production of oil and natural gasLargely focused on mature basins with long reserve lives and low decline 8.2x 9.8% 7.7x
PropaneFocused on wholesale propane marketing and retail propane distribution 9.9x 8.0% 10.7x
Coal Focused on owning and operating coal producing mines and/or lease mining land to operators in exchange for royalty payments 8.0x 7.4% 8.0x
11.4x 7.1% 11.4xMLP GPs Own the GP interest (typically with IDRs) in the MLP structure 19.2x 4.2% NMSource: FactSet and Wells Fargo Securities, LLC estimates
Average (Excluding Marine)
Marine MLPs Outperform In February Marine MLPs rose 1.7% in January, outperforming the broader MLP group (i.e., the Wells Fargo Securities MLP Index was down 0.4%), as some of the stocks moved higher due to company or sector-specific variables, i.e., earnings beat at KNOP and analyst upgrades, and an earnings beat and potentially accretive acquisition (ALP Maritime services) at TOO. Six of the eight members of the Marine MLP group traded up in February, with KNOP and TOO posting the largest increases (up 7.3% and 4.1%, respectively). As noted below, the Marine MLP group is trading at a median yield of 6.8% (flat m/m from 6.8% in January), and we highlight that a differentiation remains between the LNG/Offshore (6.4%) and Dry Bulk/Tanker (9.5%) groups, a trend we expect to continue.

WELLS FARGO SECURITIES, LLC Master Limited Partnerships EQUITY RESEARCH DEPARTMENT
22
Exhibit 16. Marine MLP Yields1
(1) Excludes the period from Q4 2008-Q1 2009 to normalize for market volatility.(2) Not rated, reflects Consensus.Source: Capital IQ, Wells Fargo Securities, LLC estimates
5.0%
2.9%4.4%
0.6%
5.3% 6.6%4.6%
8.1%
4.8%
Med: 5.5%
6.9% 5.9% 5.9%
Med: 6.2%7.7%
11.0% 11.4%
6.5%
Max: 6.5%
14.4%
Max: 7.1%
14.1%Max: 7.1%
Max: 8.3%
22.5%
18.5%
11.2%
5.7%6.6% 6.9% 6.6% 6.1% 6.7%
8.6%10.4%
6.8%
0.0%
5.0%
10.0%
15.0%
20.0%
25.0%
30.0%
0%
5%
10%
15%
20%
25%
30%
SDLP TGP GMLP TOO KNOP DLNG CPLP NMM Median
Trough Distribution Yield Median Distribution Yield
Peak Distribution Yield Current DistributionYield
22
Marine GP Trends And Valuation The broader C-Corp GP group trades at a median yield of 2.6% and a price/2014 DCF of 21.3x, while marine GPs such as TK trade at about 14.7x (based on our estimated GP value). We continue to see significant value within the Marine GP group, as TK looks to be the first Marine GP to approach a traditional GP valuation, potentially followed by GLOG and GLNG. We note that GLOGs price/2014 DCF of 24.7x, does not reflect GLOG’s full fleet of LNG carriers (amplifying its 2014 DCF multiple), which are expected to be delivered from 2014 to 2016; so in reality, GLOG is trading at about 9.3 fully delivered DCF.
Exhibit 17. C-Corp GP Valuation/Comp Table Company Ticker Market Cap ($B) Current Yield % Price/2014 DCF 3-Yr Dist. CAGR P/DCF / Growth
Kinder Morgan, Inc. Class P KMI $34.0 5.1% 18.4x 6.4% 2.9x
Williams Companies, Inc. WMB $28.4 3.9% 19.2x 17.6% 1.1x
ONEOK, Inc. OKE $12.4 2.7% 21.3x 22.0% 1.0x
Targa Resources Corp. TRGP $4.1 2.5% 31.1x 21.3% 1.5x
Plains GP Holdings LP Class A PAGP $17.0 2.3% - 21.9% NA
Crosstex Energy, Inc. XTXI $2.0 1.4% 34.1x 28.8% 1.2x
C-Corp GP Median $17.0 2.7% 21.3x 21.6% 1.2x
Teekay Corp. TK $4.2 2.1% 14.7x 26.0% 0.6x
Golar LNG Ltd. GLNG $3.1 5.1% NA 8.0% NA
GasLog1GLOG $1.6 2.3% 24.7x 2 41.3% 0.6x
(1) Based on our hypothetical MLP estimates
(2) On a fully delivered 2016 basis, GLOG is trading at ~9.3x DCF.
Source: Capital IQ, Wells Fargo Securities, LLC
• GLOG: MLP Spin Could Provide Meaningful Upside Potential. GLOG has publicly noted a potential MLP for the past several quarters (confirmed though GLOG officially filed its intent on January 13). While no details were disclosed in the February 28 release or earnings call, we believe such a spin would make sense (and eventually create meaningful valuation uplift) particularly given how well GLOG’s platform lends itself to an MLP-like structure. Specifically, its fleet carries an average contract tenor of about 5.0 years (excluding options, with average rates of $77,000/day), limiting re-contracting risk, and

WELLS FARGO SECURITIES, LLC MLP Monthly: March 2014 EQUITY RESEARCH DEPARTMENT
23
its largely pre-chartered order book could provide 80% fleet growth for an MLP. We note that GLOG’s contract tenor and potential growth would likely rank well against the marine MLP average (six years and 7.0%). We note that we believe it is very feasible that GLOG could spin off only a portion of its on-the-water fleet into an MLP, with the excess on-the-water tonnage adding more immediate growth to a future MLP. This could potentially pull forward GLOG’s GP valuation upside potential of 30-50% (based on our conservative assumptions) as earlier, more frequent dropdowns could lead to a faster realization of higher GP/IDR split levels.
• TGP: Reportedly Short-Listed For Yamal (Russia) LNG Project. According to TradeWinds news
and our channels, TGP has been short-listed to participate in the 16.5 mtpa ($30B) Yamal LNG project (Russia), which is expected to require 16 icebreaking LNG carriers ($320-360MM apiece) and potentially 18 conventional LNG carriers (about $200MM each). Negotiations are continuing, with plans to award tenders for the icebreaking carriers still pending. The three shipping companies reportedly shortlisted, Sovcomflot (Russia's largest shipping company, state-owned, and potentially privatizing at some point over the intermediate term), Mitsui OSK Lines, and TGP, are all highly speculative, high-quality owners, with track records of owning/operating high-spec assets. The first tender (test asset) was reportedly already awarded to Sovcomflot (SCF), according to trade press. According to the report, SCF and Mitsui OSK Lines are expected to be awarded six vessels each, with TGP taking four of the icebreaking LNG carriers, with additional, traditional carriers likely to be secured/tendered at a later date. Based on our preliminary assumptions, we believe that four ice-breaking LNG carriers will be significantly accretive to TGP's DCF. We estimate $0.23/unit in annual DCF upside potential (2.5% growth/year) at ~$0.06/unit/vessel, assuming a day rate of $147,500/day, opex of $35,000/day, cost of $340MM/vessel and 55% leverage ($187MM in debt). We note that the delivery/time frame for that business may be closer than we initially forecasted, with assets delivering about 3 years from now (as opposed to our original 4-5 year estimate). Given the scale/returns associated with the highly speculative project, we believe that a successful Yamal award, along with TGP's existing group pipeline, could push its distribution growth rate closer to 8-10% over the next 3-5 years.
• TOO: Acquires ALP Maritime Services, FPSO Dropdowns And Organic Growth To Remain
Key Focal Points. On February 21, TOO agreed to acquire ALP Maritime Services, a long-haul ocean towage and offshore installation shipping company based in the Netherlands, for about $260MM, which includes the cost of four vessel newbuilds that are expected to deliver in 2016. The ALP acquisition is expected to be financed using TOO’s existing liquidity and a debt issuance closer to the vessels expected delivery. TOO noted that the margin for the towing and anchor handling vessels is expected to be greater relative to its FPSOs and shuttle tankers, which generate 9-13% unlevered internal rates of return (IRR). We view this transaction as positive given the potential accretion at TOO noted by management, though specific financials on the vessels were not yet disclosed. In addition, we note that FPSO dropdowns and organic growth are to remain key focal points for TOO, and we view the approximately $1.1B Knarr FPSO, delivering on schedule in Q4 2014, as the next dropdown for TOO, potentially followed by the Foinhaven (pending resolution of operational issues) and the Hummingbird FPSO. In terms of future organic growth, the Salamander FSO, a $50MM shuttle tanker conversion, remains on schedule to start its ten-year charter with Salamander Energy in Asia in Q3 2014. We believe additional organic growth will continue to be a focus, with any new offshore projects in the North Sea or Brazil (all of which would be acquired directly at TOO, bypassing TK’s balance sheet). We note that while it appears that Sevan has won the hull design for the Bream FPSO, with Premier Oil now looking for a top-side provider, we believe TOO may still eventually get involved. TOO noted that it remained in consistent contact with Sevan (minority owned by TK) over the design. While we had believed Premier's initial (implied) ownership of the asset and Teekay's lack of direct involvement meant the project was unlikely for TOO, it now seems feasible, and we plan to closely monitor the situation.

WELLS FARGO SECURITIES, LLC Master Limited Partnerships EQUITY RESEARCH DEPARTMENT
24
Mining The Data: Coal MLP March Update Authors: Sam Dubinsky, Senior Analyst Amir Chaudhri, Associate Analyst Metals and Mining, Equity Research Coal Industry Overview The coal industry mines two types of coal, thermal and metallurgical. Thermal coal is used as a fuel source for electricity generation and competes with natural gas. Thermal coal fundamentals have been challenging over the past several years, due to weak natural gas prices, which have resulted in utilities switching away from coal in favor of natural gas. Metallurgical coal has also been in a multiyear downturn, due to slowing global steel production growth, compounded by increasing supply from low-cost mining regions. The year 2014 will likely be a muted one for thermal coal companies as most miners have locked in contracts at depressed pricing, which will likely limit earnings upside. Still, we believe fundamentals are improving, which may set the stage for a better 2015. We are growing more constructive on the thermal coal industry, due to the end of inventory destocking at utilities, which has weighed on demand and pricing through most of 2012 and 2013. In our view, restocking will occur if utilities experience normal seasonal burn rates (i.e., cold winter, hot summer, etc.). The following exhibit summarizes coal stockpiles in 2013 and the five-year average. Exhibit 18. U.S. Coal Stockpile Summary
Source: EIA, Wells Fargo Securities, LLC We also see improved demand from select coal markets such as the Illinois and Powder River basins, due to a recovery in natural gas prices, which have averaged above $5 per million British thermal units (MMBtu) so far in 2014 (up from average prices of about $2.75/MMBtu in 2012 and about $3.75/MMBtu in 2013). We believe higher natural gas prices will result in utilities switching back modestly to coal, which will likely reverse three years of negative trends. We are still cautious on companies with Appalachia (particularly Central App) exposure as we estimate this region is only economical compared to natural gas at $5+/MMBtu and is likely to lose share to lower cost mining geographies. The following exhibit details coal’s competitiveness with natural gas pricing by region and summarizes coal’s share of total U.S. electricity generation in recent years.

WELLS FARGO SECURITIES, LLC MLP Monthly: March 2014 EQUITY RESEARCH DEPARTMENT
25
Exhibit 19. Coal Competitiveness and Share of U.S. Electricity Generation
Source for both charts: SNL, Bloomberg, EIA, Wells Fargo Securities, LLC estimates We have been more cautious on the metallurgical coal market. Spot rates are currently near $117/MT, which is about 20% below the 2013 average of $147/MT and about 40% below the 2012 average of $190/MT. Rates are at a level where most North American miners fail to generate meaningful profit. Sluggish global steel production (particularly in China), competition from lower cost mining regions, and FX trends have more than offset supply cutbacks resulting in weak North American fundamentals. The following exhibit compares global steel production (broken out China/Rest of World) with met coal pricing. Exhibit 20. Global Steel Production versus Met Coal Pricing
*Note 2014 steel production data is an estimate derived by applying year-to-date percent changes in WorldSteel data (through January 2014) to the prior year’s full-year figure. Source for both charts: World Steel Association (WorldSteel), Metal Bulletin Research, Platts, Wells Fargo Securities, LLC The coal MLP and GP investment universe consists of five companies. The following exhibit provides a brief company description of each.

WELLS FARGO SECURITIES, LLC Master Limited Partnerships EQUITY RESEARCH DEPARTMENT
26
Exhibit 21. Coal MLP and GP Company Universe Company Company Description
Alliance Resource Partners L.P. (ARLP) ARLP is a thermal coal miner with high exposure to the Illinois Basin. Alliance Holdings GP L.P (AHGP) AHGP is the general partner of ARLP.
Natural Resource Partners L.P. (NRP) NRP generates about 60% of its revenue from leasing thermal and metallurgical coal reserves, primarily in the Northern Appalachia, Central Appalachia, and Illinois basins. Other revenue is derived from leasing aggregate and oil and gas reserves.
Oxford Resource Partners L.P. (OXF) OXF is a thermal coal miner with high exposure to the Northern Appalachia basin.
Rhino Resource Partners (RNO) RNO is a diversified coal miner with exposure to Northern Appalachia, Central Appalachia, and Western Bituminous regions.
Source: Wells Fargo Securities, LLC Coal MLPs Up Slightly, But Trail Broader Markets Our coal miner MLP and GP index inched up 0.5% in February, ahead of the Wells Fargo Securities MLP Index (down 0.4%), but trailing the broader market (up 4-5%). Note our index performed in line with non-MLP coal mining stocks (up 0.7%). The best-performing coal MLP/GP was Rhino Resource Partners, up 9%, followed by Alliance Resource Partners, up 5%. The worst performer was Oxford Resource Partners, down 6%, followed by Natural Resource Partners, down 4%. The following exhibit details coal stock performances for the month. Exhibit 22. Monthly Coal Stock Performance
Close CloseCompany Name and Ticker 01/31/14 02/28/14
Coal MLP and GPsAlliance Resource Partners, L.P. (ARLP) $82.40 7.0% $86.16 4.6% 11.9%Alliance Holdings GP, L.P. (AHGP) $62.53 6.7% $62.20 -0.5% 6.1%Natural Resource Partners L.P. (NRP) $15.76 -21.0% $15.12 -4.1% -24.2%Oxford Resource Partners, LP (OXF) $1.26 2.4% $1.18 -6.3% -4.1%Rhino Resource Partners LP (RNO) $11.56 1.6% $12.56 8.7% 10.4%Average -0.7% 0.5% 0.0%
Coal CompaniesAlpha Natural Resources, Inc. (ANR) $5.68 -20.4% $5.37 -5.5% -24.8%Arch Coal, Inc. (ACI) $4.24 -4.7% $4.56 7.5% 2.5%Cloud Peak Energy Inc. (CLD) $18.73 4.1% $19.40 3.6% 7.8%Peabody Energy Corporation (BTU) $17.05 -12.7% $17.56 3.0% -10.1%Walter Energy, Inc. (WLT) $11.36 -31.7% $10.79 -5.0% -35.1%Average -13.1% 0.7% -11.9%
Total Coal Index Average -6.9% 0.6% -6.0%
Wells Fargo Securities MLP Index 0.0% -0.4% -0.4%
NASDAQ 4,103.9 -1.7% 4,308.1 5.0% 3.1%
S&P 500 1,782.6 -3.6% 1,859.5 4.3% 0.6%
Dow Jones Industrials 15,698.9 -5.3% 16,321.7 4.0% -1.5%
% Ch MTD
% Ch MTD
%Ch YTD
Results presented cannot and should not be viewed as an indicator of future performance. Source: FactSet and Wells Fargo Securities, LLC

WELLS FARGO SECURITIES, LLC MLP Monthly: March 2014 EQUITY RESEARCH DEPARTMENT
27
Monthly Price Update—Natural Gas Surges and Most Coal Up Due To Weather Natural gas prices, which dictate long-term demand and pricing for thermal coal (substitute raw materials) surged 25.9% to average $5.87 per MMBtu in February due to the cold winter weather that has been affecting much of the country. Average monthly natural gas price is now up about 62% over the past three months, since the heating season began. The rally in natural gas prices has been a positive catalyst for coal pricing, as well. Powder River Basin was the best-performing coal region in February, with average monthly pricing up 2.6%, while the Illinois Basin and Northern App were each up fractionally. Central App, which has high exposure to struggling metallurgical coal markets and is losing share to lower cost thermal regions, saw pricing fall 2.1% in the month. Year to date, Powder River Basin has been the best performer, with prices up 8%, followed by Illinois Basin and Northern App, each up about 1%. Central App has bucked the trend with prices down 1.6% year to date. Monthly average met coal prices declined 4.2% month over month, to $122.97/MT (delivery at Australian ports). A recent slowdown in Chinese steel production (about 50% of global steel production) has contributed to the weakness in met coal prices. Chinese steel production slowed during the annual Chinese Lunar New Year holiday (which occurred in the first week of February), but has also been affected by tightening credit, as well as temporary pollution control measures by local governments. Note that we track the price of premium low-volume HCC at Australian ports as it sets the benchmark for global met coal prices. Exhibit 23. Monthly Average Coal and Natural Gas Price Summary Coal Type Location Feb-14 % Ch MoM % Ch YTD
Natural Gas ($/million BTU): U.S. $5.87 25.9% 36.1%
Thermal Coal ($/short ton):Central Appalachia Basin Eastern U.S. $62.57 (2.1%) (1.6%)Northern Appalachia Basin Eastern U.S. $68.57 0.1% 0.8%Illinois Basin Eastern U.S. $46.52 0.3% 0.8%Powder River Basin Wyoming $12.42 2.6% 8.0%Uinta Basin Western U.S. $36.00 0.0% 0.1%
Metallurgical Coal ($/metric ton):Premium Low Vol HCC Australian Ports $122.97 (4.2%) (6.5%)
Source: The Energy Information Administration, Bloomberg, Platts, Factset, Wells Fargo Securities, LLC
WELLS FARGO SECURITIES, LLC Master Limited Partnerships EQUITY RESEARCH DEPARTMENT
28
Miners Provide Mostly Weak Q4 Earnings Reports Natural Resource Partners’ Q4 revenue of $94.7MM (up 15% qtr/qtr) and EPU of $0.42 were both ahead of consensus of $82.9MM and $0.32. Still, the upside was mostly due to a one-time right-of-way condemnation payment of around $10MM (mix of higher royalty mines also helped). DCF/unit was $0.63; coverage was 1.8x (following the 36% distribution cut announced on January 9). Guidance was a non-event as the partnership already negatively previewed 2014 results, expecting revenue of $305-340MM (down 5-15% yr/yr). The weak outlook was due to high exposure to Central App coal, which is struggling, due to very weak met pricing/demand (stemming from slower global growth), as well as challenges in thermal (Central App is losing share to lower cost regions). Some of the weakness in coal is being offset by growth in oil/gas royalties and the full-year contribution of the soda ash acquisition. Rhino Resource Partners’ Q4 results were challenging, with revenue and EBITDA down about 24-25% yr/yr. Weakness was most pronounced in Central App, where price per ton and volumes fell 10% and 29%, respectively. Northern App and western coal were mixed with pricing up in both segments, but offset by higher costs and lower volumes. On a positive note, the company is selling oil and gas properties for $185M. Rhino is to provide 2014 guidance in March. Alpha Natural Resources reported Q4 adjusted EBITDA of $71 million, down 67% yr/yr, but ahead of the Street at $59 million. Weakness was broad based, with pricing and volumes falling across basins. Alpha also lowered 2014 shipment guidance, expecting volumes of 77-90M tons, versus a prior 79-90M; the reduction is due to metallurgical coal. Roughly 98% of western coal volumes are priced and committed, versus 76% of eastern steam and 56% of met coal. Arch Coal reported Q4 adjusted EBITDA of $34 million, below expectations of $59.7 million. During the quarter, Arch saw volumes decrease 10.5% yr/yr and 15.7% sequentially, to 32.3 million tons. Average selling prices (ASP) declined 18% yr/yr, but improved 2.3% qtr/qtr. The company targets shipments of 131.5-142.3M tons in 2014 versus. 140M tons in 2013; pricing trends are mixed, with PRB coal up, but met coal down. Cost commentary for 2014 was also negative, with PRB targeted at $10.70-11.00/ton, up from $10.40-10.60 in 2013, and $63-67/ton in Appalachia, from $65-69 in 2013. Powder River basin coal miner Cloud Peak reported Q4 2013 adjusted EBITDA of $62M, slightly below analyst expectations of $63M. Total revenue declined by approximately 5.8% yr/yr and sequentially, due to an 8.2% yr/yr and 6.2% month over month drop in volumes. Pricing fared better, up 0.7% yr/yr and flat qtr/qtr. The company provided FY2014 EBITDA guidance of $180-220 million, which was below the consensus estimate of about $235M. Met coal miner Walter Energy reported Q4 adjusted EPS loss of $0.55, well above the Street at negative $0.87. GAAP earnings were lower, at negative $2.79, due to a $140MM charge related to the valuation of deferred income taxes. Revenue of $472M was up 3.6% qtr/qtr and slightly below the Street, at $475MM. The company did not provide 2014 guidance, but met coal settlement prices fell in Q1 and Q2, suggesting a negative bias to earnings.

WELLS FARGO SECURITIES, LLC MLP Monthly: March 2014 EQUITY RESEARCH DEPARTMENT
29
February Price Performance In February 2014, the Wells Fargo Securities MLP Index decreased 0.4%, underperforming the S&P 500, which increased 4.3% for the month. The best-performing MLP subsectors (market-cap weighted) in February were GPs and Crude Oil, which increased 4.5% and 3.7%, respectively. The two worst-performing MLP subsectors in February were Refined Products (down 1.7%) and Upstream (down 1.6%). Exhibit 24. February 2014 Performance By Subsector (Market-Cap Weighted)
(1.7%)
(1.6%)
(1.2%)
(1.2%)
(0.6%)
0.7%
0.9%
3.7%
4.5%
4.3%
(0.4%)
(4%) (2%) 0% 2% 4% 6%
Wells Fargo Securities Refined Products MLP Index
Wells Fargo Securities Upstream MLP Index
Wells Fargo Securities Natural Gas Pipelines MLP Index
Wells Fargo Securities Coal MLP Index
Wells Fargo Securities Gathering & Processing MLP Index
Wells Fargo Securities Propane MLP Index
Wells Fargo Securities Marine Transportation MLP Index
Wells Fargo Securities Crude Oil MLP Index
Wells Fargo Securities GP Composite Index
S&P 500 Index
Wells Fargo Securities MLP Index
Note: Performance metrics for our index (shown in the preceding table) are market-cap weighted and may not match figures elsewhere in this report that could be based on an equal weighting of averages and/or medians. Source: Standard & Poor’s, FactSet, and Wells Fargo Securities, LLC The best-performing MLPs in January were PSXP, TEP, TLLP, PDH, and XTEX, while the worst-performing MLPs were BWP, NKA, CLMT, EROC, and AMID. Exhibit 25. Best And Worst Performers (February 2014 Price Performance)
4.3%
(50.0%)
(14.1%)
(12.4%)
(12.1%)
(11.3%)
12.4%
12.8%
13.2%
19.3%
22.4%
(60%) (50%) (40%) (30%) (20%) (10%) 0% 10% 20% 30%
S&P 500 Index
Boardwalk Pipeline Partners L.P. (BWP)
Niska Gas Storage Partners LLC (NKA)
Calumet Specialty Products Partners L.P. (CLMT)
Eagle Rock Energy Partners L.P. (EROC)
American Midstream Partners L.P. (AMID)
Crosstex Energy L.P. (XTEX)
PetroLogistics L.P. (PDH)
Tesoro Logistics L.P. (TLLP)
Tallgrass Energy Partners LP (TEP)
Phillips 66 Partners L.P. (PSXP)
Worst performing
MLPs in February
Best performing
MLPs in February
Source: FactSet and Wells Fargo Securities, LLC The Wells Fargo Securities, LLC MLP Index Real-time price quotes for the Wells Fargo Securities, LLC MLP Index are available on Bloomberg and Reuters under the symbol WMLP (and WMLPT for total return) and on FactSet Marquee under the symbol WML-CME. For further information and to find historical performance data from 1990 (downloadable--subscription required), as well as MLP performance by subsector, please visit: https://wellsfargoresearch.wachovia.net/Indices/Pages/index%20details/WMLP.html.

WELLS FARGO SECURITIES, LLC Master Limited Partnerships EQUITY RESEARCH DEPARTMENT
30
Exhibit 26. Monthly Wells Fargo Securities MLP Index Price Performance Jan Feb March April May June July Aug Sep Oct Nov Dec Annual
2000 8.5% (2.4%) (1.7%) 1.0% 0.5% 5.2% 2.0% 1.8% 9.1% (4.4%) (3.1%) 11.2% 29.9%
2001 9.7% 0.9% 1.8% 8.1% 1.4% (2.0%) 4.1% 3.4% (2.5%) 5.0% (2.9%) 2.0% 32.0%
2002 (1.1%) (9.8%) 9.4% 1.9% (3.7%) (5.1%) (1.7%) 6.0% (3.8%) (0.9%) 0.6% 2.2% (7.3%)
2003 3.2% 0.8% 1.3% 6.1% 2.9% 4.0% 0.9% 0.4% 1.6% 1.2% 3.5% 4.8% 35.4%
2004 (2.6%) 0.9% 2.7% (9.2%) (0.8%) 2.0% 3.5% 2.2% 5.4% (0.6%) 4.4% 1.7% 9.2%
2005 4.1% 1.1% (3.9%) 2.7% (0.5%) 4.0% 4.3% (3.2%) 0.4% (2.5%) (4.6%) (2.6%) (1.2%)
2006 5.0% (1.4%) 0.7% 0.9% 1.1% (1.7%) 3.6% 1.6% (1.3%) 4.3% 3.5% 1.5% 19.0%
2007 4.1% 2.1% 4.4% 5.7% (0.9%) 0.7% (1.3%) (6.5%) (2.8%) 5.4% (5.1%) 0.4% 5.6%
2008 (2.0%) (1.2%) (6.5%) 6.2% 0.2% (4.9%) (2.6%) 0.4% (17.0%) (2.0%) (18.4%) (3.7%) (42.7%)
2009 14.0% (5.7%) 0.2% 9.4% 8.1% (1.1%) 10.9% (3.9%) 5.0% 1.8% 5.3% 6.7% 61.3%
2010 0.1% 3.8% 2.9% 2.7% (6.6%) 5.5% 7.1% (3.2%) 6.1% 4.5% 1.5% 2.0% 28.7%
2011 2.5% 2.7% (0.2%) 2.9% (5.7%) 0.8% (2.3%) (2.1%) (4.2%) 9.8% (1.2%) 5.6% 7.9%
2012 1.6% 3.3% (3.4%) 1.7% (8.5%) 3.4% 4.6% 0.8% 1.9% (0.1%) (1.6%) (2.8%) 0.1%
2013 11.7% 0.5% 5.0% 0.7% (2.8%) 3.2% (0.4%) (3.5%) 2.0% 2.0% 0.7% 1.9% 22.2%
2014 0.0% (0.4%) (0.4%)
Median 3.2% 0.8% 1.0% 2.7% (0.6%) 1.4% 2.8% 0.4% 1.0% 1.5% (0.3%) 1.9% 9.2%
Average 3.9% (0.3%) 0.9% 2.9% (1.1%) 1.0% 2.3% (0.4%) (0.0%) 1.7% (1.2%) 2.2% 13.3%
Source: Standard & Poor’s and Wells Fargo Securities, LLC MLP Short Interest Increased In February In February, short interest volume increased by 2.2% (i.e. median) relative to the prior month. The five MLPs with the largest month-over-month increases were MEP (up 1028%), BKEP (up 408%), WPT (up 135%), CELP (up 93%), and LRE (up 68%). The five MLPs with the largest month-over-month decreases in short interest were AMID (down 76%), USAC (down 60%), OXF (down 28%), BWP (down 25%), and QEPM (down 24%). For February, the median days to cover for MLPs decreased from the prior month, to 3.3 days from 3.5 days. The five MLPs with the highest days-to-cover ratios include SMLP, 32.6; MPLX, 17.0; TOO, 16.2; TGP, 15.2; ARP, 14.2. Although a higher short interest ratio is usually a bearish sign, a positive catalyst could cause a more pronounced increase in the stock price of an MLP with a higher short-interest ratio than an MLP with a lower short-interest ratio, all else being equal. Namely, a positive event typically causes short-sellers of a stock to cover or close out their positions (i.e. buy back the stock), creating additional buying pressure, which could further drive up the stock price. Exhibit 27. Short Interest Summary By MLP Subsector
Percent In ShortInterest Volumes Days ToFrom Prior Month Cover
Large-Cap Pipeline MLP Median 2.8% 3.6
Small- & Mid-Cap Midstream MLP Median 1.7% 3.2
Oilfield Services MLP Median (11.5%) 2.4
Gathering & Processing MLP Median (1.1%) 3.3
Upstream MLP Median 7.3% 3.3
Propane MLP Median 1.8% 3.0
Marine MLP Median 5.6% 3.4
Coal MLP Median (8.3%) 2.8
Non-Traditional MLP Median 24.0% 2.8
MLP GPs Median 5.7% 3.5
All MLPs Average 20.3% 4.4
All MLPs Median 2.2% 3.3
C-Corp GPs Median 6.8% 3.0 Source: FactSet and Wells Fargo Securities, LLC

WELLS FARGO SECURITIES, LLC MLP Monthly: March 2014 EQUITY RESEARCH DEPARTMENT
31
Update On Factors Driving MLP Performance Investment Grade And High Yield Spreads Narrowed In February In February, the investment grade and high yield credit spreads (to the 10-Year U.S. Treasury) narrowed by 7 bps and 26 bps, respectively. The investment grade spread to the Treasury was 235 bps at the end of February, versus 242 bps at the end of January (and versus a ten-year historical average spread of 270 bps). At the end of February, the high yield index yield was 271 bps above the 10-year U.S. Treasury, versus 296 bps at the end of January (and versus a ten-year historical average spread (i.e., 2004-2013) of 459 bps. During February, the 10-year U.S. Treasury yield ended essentially flat at 2.66%, compared to 2.67% at the end of January. For the month, non-investment-grade bond yields decreased 26 bps, to 5.37% from 5.63% in the prior month, while investment grade bond yields decreased 7 bps, to 5.01% from 5.08% in the prior month. Exhibit 28. High Yield/Investment Grade Credit Spreads To The 10-Year Treasury
0
200
400
600
800
1,000
1,200
1,400
1,600
1,800
Jan-0
4
Jul-
04
Jan-0
5
Jul-
05
Jan-0
6
Jul-
06
Jan-0
7
Jul-
07
Jan-0
8
Jul-
08
Jan-0
9
Jul-
09
Jan-1
0
Jul-
10
Jan-1
1
Jul-
11
Jan-1
2
Jul-
12
Jan-1
3
Jul-
13
Jan-1
4
Basi
s-p
oin
t sp
read
to
Ten
-Year
U.S
. Tre
asu
ry
High-Yield (ML U.S.) SpreadTo Treasury
Investment Grade (Moody's)Spread To Treasury
Historical High Yield Spread Average
Historical Investment Grade Spread Average
Source: Bloomberg, FactSet, and Wells Fargo Securities, LLC MLP Yield Spread To Treasuries Widened In February MLPs were trading at a 397 bp spread above the 10-year Treasury yield at the end of February (versus 394 bps at the end of January). The current spread compares with a ten-year historical average spread of 379 bps. At the end of February, the median MLP yield was 6.63% (based on declared MLP distributions), which is 3 bps higher than the MLP yield at the end of January (i.e., 6.60%). The yield on the 10-year Treasury remained flat, resulting in an approximate 3 bp widening of the spread. Notably, the historical spread between MLP yields and Treasuries has ranged from negative 4 bps to positive 1,648 bps since 2000.

WELLS FARGO SECURITIES, LLC Master Limited Partnerships EQUITY RESEARCH DEPARTMENT
32
Exhibit 29. Historical MLP Spread To The 10-Year Treasury
(200)
0
200
400
600
800
1,000
1,200
1,400
1,600
1,800
Jan-0
3Ju
l-03
Jan-0
4Ju
l-04
Jan-0
5Ju
l-05
Jan-0
6Ju
l-06
Jan-0
7Ju
l-07
Jan-0
8Ju
l-08
Jan-0
9Ju
l-09
Jan-1
0Ju
l-10
Jan-1
1Ju
l-11
Jan-1
2Ju
l-12
Jan-1
3Ju
l-13
Jan-1
4
Ba
sis
-poin
t spre
ad t
o
Te
n-Y
ear
U.S
. T
reasury
MLP Yield Spread To Treasury
Historical MLP Yield Spread Average
200
250
300
350
400
450
500
550
600
650
700
Sep-
12
Nov
-12
Jan-1
3
Mar
-13
May
-13
Jul-13
Sep-
13
Nov
-13
Jan-1
4
Ba
sis
-poin
t spre
ad to
T
en
-Year U
.S. T
reasury
Historical MLP Yield Spread
Average
Source: FactSet and Wells Fargo Securities, LLC MLP CDS Spreads Decreased In February In February, credit default swap (CDS) spreads for large-cap pipeline MLPs with publicly traded debt averaged 83 bps, which was below the average CDS spread in January of 85 bps. The 2.2% decrease in the MLP CDS spread compares to a 0.1% decrease in the Markit North America Investment Grade CDS Index (i.e., a CDS index composed of 125 equally weighted CDS on investment grade entities). Exhibit 30. Average MLP CDS Spreads
88
104
102
112 1
30
160
153
141
146
135
121
116
108
100
95
96
96 103
111
148
183 2
03
191
194
179
163
148
151
160 1
77
179
169
147
127
127
129
122
122
115
100
82 9
7
102
87
83
83
80
78 85
83
0
50
100
150
200
250
Jan
Feb
Mar
Apr
May Jun
Jul
Aug
Sep Oct
Nov
Dec Jan
Feb
Mar
Apr
May Jun
Jul
Aug
Sep Oct
Nov
Dec Jan
Feb
Mar
Apr
May Jun
Jul
Aug
Sep Oct
Nov
Dec Jan
Feb
Mar
Apr
May Jun
Jul
Aug
Sep Oct
Nov
Dec Jan
Feb
Mar
Apr
May Jun
Jul
Aug
Sep Oct
Nov
Dec
2010 2011 2012 2013 2014
Avg
5-Y
r CD
S S
pre
ad O
f In
vest
men
t G
rade
MLP
s (B
ps)
Average CDS Spread Of Investment Grade MLPs Markit North America Investment Grade CDS Index
Note: Large-cap pipeline MLP group consists of EEP, EPD, ETP, KMP, MMP, OKS, and PAA Source: FactSet, Bloomberg, and Wells Fargo Securities, LLC Since 2008, MLP CDS spreads have averaged approximately 150 bps (through February 2014). Typically, a CDS represents a bilateral contract between a buyer of bonds and a seller of protection on these bonds. The spread represents the cost (or premium) of insuring bonds against a potential default. A wider CDS spread implies that bond investors are more concerned about an underlying company’s financial position. Conversely, a narrower CDS spread implies that bondholders are confident in a company’s ability to meet its bond payment obligations.

WELLS FARGO SECURITIES, LLC MLP Monthly: March 2014 EQUITY RESEARCH DEPARTMENT
33
Trading Volume Increased In February The average daily trading volume for the MLP sector increased to an average of 385,000 units in February, versus 283,000 in January. For 2014 to date, daily trading volume has averaged 332,000, which represents a 12% decrease from last year’s average of 379,000 units. Exhibit 31. Median MLP Daily Trading Volume (In Units)
384 385
309
423 394
419
336 309
405
338 363
283
385
0
100
200
300
400
500
Feb 1
3
Mar
13
Apr
13
May
13
Jun 1
3
Jul 13
Aug 1
3
Sep
13
Oct
13
Nov
13
Dec
13
Jan 1
4
Feb 1
4
Avg
. D
ail
y T
rad
ing
Vo
l. (
00
0s)
114 124
146
190
239 260
277
315
379
332
0
75
150
225
300
375
450
2005 2006 2007 2008 2009 2010 2011 2012 2013 2014TD
Avg
. D
ail
y T
rad
ing
Vo
l. (
00
0s)
Source: FactSet and Wells Fargo Securities, LLC The number of large block trades (greater than 100,000 units) increased in February to 136 from 61 in January, and was above the comparable period in 2013 (78). The MLPs with the most block trades in February were BWP (21) and DPM (8).

WELLS FARGO SECURITIES, LLC Master Limited Partnerships EQUITY RESEARCH DEPARTMENT
34
Exhibit 32. Total Number Of MLP Block Trades
Jan Feb Mar Apr May Jun Jul Aug Sep Oct Nov Dec Total
2007 0 0 0 0 41 20 39 22 39 40 79 126 406
2008 57 71 64 35 27 45 36 28 53 48 19 17 500
2009 19 21 25 39 13 21 11 10 34 10 12 49 264
2010 12 15 19 22 24 16 15 35 39 5 28 23 253
2011 36 34 62 31 17 64 18 35 32 23 24 51 427
2012 36 36 60 32 20 88 31 49 73 43 61 80 609
2013 69 78 146 60 159 115 126 109 98 141 112 131 1,344
2014 61 136 197
0
20
40
60
80
100
120
140
160
Aug-0
7O
ct-0
7D
ec-
07
Feb-0
8Apr-
08
Jun-
08
Aug-0
8O
ct-0
8D
ec-
08
Feb-0
9Apr-
09
Jun-
09
Aug-0
9O
ct-0
9D
ec-
09
Feb-1
0Apr-
10
Jun-
10
Aug-1
0O
ct-1
0D
ec-
10
Feb-1
1Apr-
11
Jun-
11
Aug-1
1O
ct-1
1D
ec-
11
Feb-1
2Apr-
12
Jun-
12
Aug-1
2O
ct-1
2D
ec-
12
Feb-1
3Apr-
13
Jun-
13
Aug-1
3O
ct-1
3D
ec-
13
Feb-1
4
Nu
mb
er
of b
lock t
rades
(>1
00
,00
0 u
nit
s)
Source: Bloomberg and Wells Fargo Securities, LLC MLP Acquisition Activity Six Acquisitions Were Announced In February MLPs announced six acquisitions in February, totaling approximately $2.9 billion. This compares to $5.0 billion in January and $6.1 billion during the comparable period in 2013. The largest transaction was WPZ’s acquisition of WMB’s Canadian assets for $1.2 billion.

WELLS FARGO SECURITIES, LLC MLP Monthly: March 2014 EQUITY RESEARCH DEPARTMENT
35
Exhibit 33. Historical MLP Acquisition Spending
$ in millions 2005 2006 2007 2008 2009 2010 2011 2012 2013 2014TD
Pipelines $1,633 $3,072 $1,722 $2,668 $1,373 $4,713 $18,064 $14,625 $14,016 $1,010
Storage $1,562 $637 $1,663 $706 $597 $3,676 $4,408 $2,058 $3,373 $96
Gathering/Processing/Fractionation $1,744 $4,218 $4,803 $781 $1,040 $6,000 $6,243 $8,678 $23,428 $1,300
Upstream $0 $900 $7,283 $563 $967 $2,418 $4,370 $5,996 $8,751 $0
Marine Transportation $106 $106 $418 $1,413 $135 $850 $1,819 $736 $3,276 $260
Coal $71 $334 $223 $25 $399 $170 $253 $139 $34 $0
Propane $228 $550 $48 $42 $276 $49 $3,116 $1,927 $775 $70
Other $0 $5 $1,431 $0 $123 $585 $888 $4,669 $2,935 $160
Total $5,343 $9,822 $17,590 $6,198 $4,909 $18,460 $39,159 $38,826 $56,587 $2,896
$5,343 $9,822
$17,590
$6,198 $4,909
$18,460
$39,159 $38,826
$56,587
$2,896
$0
$10,000
$20,000
$30,000
$40,000
$50,000
$60,000
2005 2006 2007 2008 2009 2010 2011 2012 2013 2014TD
Total MLP Acquisitions
($ In Millions)
Source: Partnership reports and Wells Fargo Securities, LLC For 2014 to date, acquisition multiples have averaged 9.2x, which compares with 9.2x in 2013. We expect acquisition activity to continue in 2014 given MLPs’ low cost of capital. Exhibit 34. Estimated Acquisition Multiples Paid
2005 2006 2007 2008 2009 2010 2011 2012 2013 2014TD
Pipelines 8.3x 8.4x 13.9x 9.3x 8.2x 9.5x 10.9x 11.0x 11.2x 10.2x
Storage 11.6x 9.2x 10.0x 8.3x 8.8x 9.9x 11.3x 8.9x 10.9x 9.5x
Gathering/Processing/Fractionation 9.7x 9.2x 9.9x 10.0x 6.7x 9.1x 10.6x 11.7x 10.4x 9.0x
Upstream - 5.0x 6.5x 5.0x 5.4x 6.8x 6.0x 6.9x 6.3x -
Marine Transportation - 9.1x 9.0x 9.1x 6.0x 7.1x 7.8x 6.7x 8.5x -
Coal 4.6x - 7.3x - 5.8x - 7.3x - - -
Propane 7.4x 7.5x 6.3x 5.5x 6.4x - 7.8x 7.5x - -
Other - - 9.6x - 5.3x 7.3x 9.1x 9.0x 7.6x 8.0x
Total 8.3x 8.1x 9.1x 7.9x 6.6x 8.3x 8.8x 8.8x 9.2x 9.2x
8.3x 8.1x9.1x
7.9x
6.6x
8.3x8.8x 8.8x 9.2x 9.2x
0.0x
2.0x
4.0x
6.0x
8.0x
10.0x
12.0x
14.0x
2005 2006 2007 2008 2009 2010 2011 2012 2013 2014TD
Average Forward EBITDA Multiple
Paid On MLP Acquisitions
Source: Partnership reports and Wells Fargo Securities, LLC estimates

WELLS FARGO SECURITIES, LLC Master Limited Partnerships EQUITY RESEARCH DEPARTMENT
36
MLPs Announced $1.2 Billion Of Equity In February In February, there were three secondary offerings, which raised $1.2 billion in proceeds for the issuers. Equity raised during the month was lower than in the comparable period in 2013 (i.e., $2.3 billion). Exhibit 35. MLP Equity Offerings Over The Trailing 13 Months
$441 $572 $658 $273
$3,632
$672 $345
$1,825 $1,676 $1,699
$1,781
$325
$1,280
$2,443
$1,576
$1,438
$1,279
$775
$243
$1,247
$372 $240
$325
$342
$350
$3,511
$1,230
$6,213
$535
$0
$1,814
$1,587
$299
$2,278 $2,560
$5,460
$3,453
$2,140 $1,912
$3,101 $3,436
$5,270
$8,562
$1,744
$660
$1,247
$0
$1,000
$2,000
$3,000
$4,000
$5,000
$6,000
$7,000
$8,000
$9,000
Feb 13 Mar 13 Apr 13 May 13 Jun 13 Jul 13 Aug 13 Sep 13 Oct 13 Nov 13 Dec 13 Jan 14 Feb 14
Gro
ss E
qu
ity P
roce
ed
s ($
MM
)
At-The-Market Units To Seller / SponsorUnits Sold By Sponsors Private PlacementPublic Offering IPO
Source: Partnership reports and Wells Fargo Securities, LLC For 2014, we forecast equity issuance of $24.8 billion versus 2013 issuance of $42.7 billion. Forecasted equity issuances in 2015 and beyond assume a sharp drop in equity capital markets activity. The lower issuance level primarily reflects the exclusion of MLPs not under coverage, potential IPOs (i.e., a backlog of at least $5.0 billion), as well as reduced visibility in acquisition/growth capital spending and conservatism in our modeling assumptions.

WELLS FARGO SECURITIES, LLC MLP Monthly: March 2014 EQUITY RESEARCH DEPARTMENT
37
Exhibit 36. Historical And Forecasted MLP Equity Issuances
$34.8
$3.6 $4.6 $5.7
$9.4
$14.7
$9.1 $7.6
$15.1 $16.9
$42.7
$24.8
$17.7
$13.6
$9.9
$0.0
$5.0
$10.0
$15.0
$20.0
$25.0
$30.0
$35.0
$40.0
$45.0
$50.0
2003 2004 2005 2006 2007 2008 2009 2010 2011 2012 2013 2014E 2015E 2016E 2017E
MLP
Eq
uit
y I
ssu
an
ces
($ in
B)
Estimated Remaining 2014 Issuance
YTD equity issuance of $2.0B
Source: Partnership reports and Wells Fargo Securities, LLC estimates Exhibit 37. 2014 MLP Equity Offerings
No. Of Offer Gross Equity Perf. Since Offering Perf. + 5 Days
Date Issuer Offering Type Units (MM) Price Proceeds ($MM) MLP S&P 500 MLP S&P 500
1/14/14 APU Units Sold By Sponsors 8.0 $42.73 $341.8 0.3% 1.1% 0.0% 0.3%
1/15/14 CELP IPO 3.8 $20.00 $75.0 19.5% 0.6% 16.8% (1.1%)
1/23/14 AMID Public Offering 3.4 $26.75 $91.0 (12.1%) 1.7% (0.4%) (1.9%)
1/31/14 SXE Public Offering 8.0 $16.50 $151.8 (1.3%) 4.3% 8.6% 0.8%
2/10/14 NMM Public Offering 5.5 $17.30 $95.2 (5.7%) 3.3% 1.9% 2.3%
2/19/14 KMP Public Offering 6.9 $78.32 $540.4 (5.2%) 1.7% (3.8%) 0.9%
2/27/14 DPM Public Offering 12.5 $48.90 $611.3 (0.2%) 0.3% 2.0% 1.1%
Total / Median $1,906 (1.3%) 1.7% 1.9% 0.8%
Year-To-Date Offering Type % Of Total
IPO 4%
Public Offering 78%
At-The-Market 0%
Private Placement 0%
Units Sold By Sponsors 18%
Units To Seller / Sponsor 0% Source: Partnership reports, FactSet, and Wells Fargo Securities, LLC

WELLS FARGO SECURITIES, LLC Master Limited Partnerships EQUITY RESEARCH DEPARTMENT
38
MLP IPO Update--1 Offering Completed Year To Date--Backlog At 21 Year to date, one MLP has come public, raising total proceeds of $75 million. There are currently four public filings and one pending filing for potential MLP IPOs totaling approximately $1.6 billion. In addition to the known backlog, there is a significant shadow backlog, as well. Several utilities, shipping, oilfield service, and E&P companies have made public announcements that they are considering forming MLPs. In total, we calculate that approximately 22 potential MLP IPOs are currently in the backlog (5 identified and 17 shadow). The backlog is comprised as follows (by sub-sector): Coal – 2; Marine / Shipping – 6, Midstream – 11, Propane – 1, and E&P – 2. Exhibit 38. Backlog Of Identified MLP IPOs And Recently Completed Deals
Company Name Ticker Sector
S-1 Est. Capital Raise
($MM) (1)
Date Of Latest S-1 Filing (2)
Potential IPO Backlog (Identified)
Antero Midstream Partners LP AM Midstream (Gathering, Compresion, Water) - 2/7/2014
Armstrong Resource Partners, LP ARPS Coal (Leasing & Royalty Payments) - 7/2/2012
Enable Midstream Partners, LP ENBL Midstream (Gathering & Processing) - 2/24/2014
Foresight Energy Partners, LP FELP Coal (Coal Production) - 4/12/2012
GasLog Ltd. MLP N/A Marine / Shipping - NA
Total $1,591
IPOs Completed In 2014
Cypress Energy Partners, L.P. CELP Other (Water Disposal / Pipeline Inspection) - 1/15/2014
Total $75
Total For All Above $1,666 Note 1: Represents projected IPO proceeds based on SEC filings, were available Note 2: Form F-1 in the case of foreign issuers Source: Partnership SEC filings and Wells Fargo Securities, LLC Exhibit 39. Historical MLP IPOs And Potential Backlog
22
20
ARCX
18 CVRR
AHD DLNG
AHGP EMES
ATN FISH
BBEP 14 KNOP
BGH CPLP 13 13 MEP
CEP CQP AMID ALDW NSLP
CLMT DEP GMLP DKL OCIP
10 EROC ENP GSJK EQM OCIR
BWP ETE EPB LRE HCLP PAGP
DPM EVEP KGS MCEP LGP PSXP
EPE HPGP LGCY 7 MEMP MPLX QEPM
GLP LINE NGLS ACMP NGL NTI SRLP
HLND MGG NMM NKA NRGM PDH SXCP
4 NRGP PVG OSP OXF OILT SDLP TEP AM
CPNO NSP RGP QELP 3 PNG RNF SMLP USAC ARPS
HEP TGP TOO SEP PSE QRE RRMS SUSP VLP ENBL
KSP TLP UCLP SGLP WES RNO TLLP SXE WNRL 1 FELP
USS WPZ VEH VNR WMZ TRGP UAN WGP WPT CELP Shipping
2004 2005 2006 2007 2008 2009 2010 2011 2012 2013 2014TD Backlog
Identified Backlog
Shadow Backlog
5
17
Source: Partnership SEC filings and Wells Fargo Securities, LLC
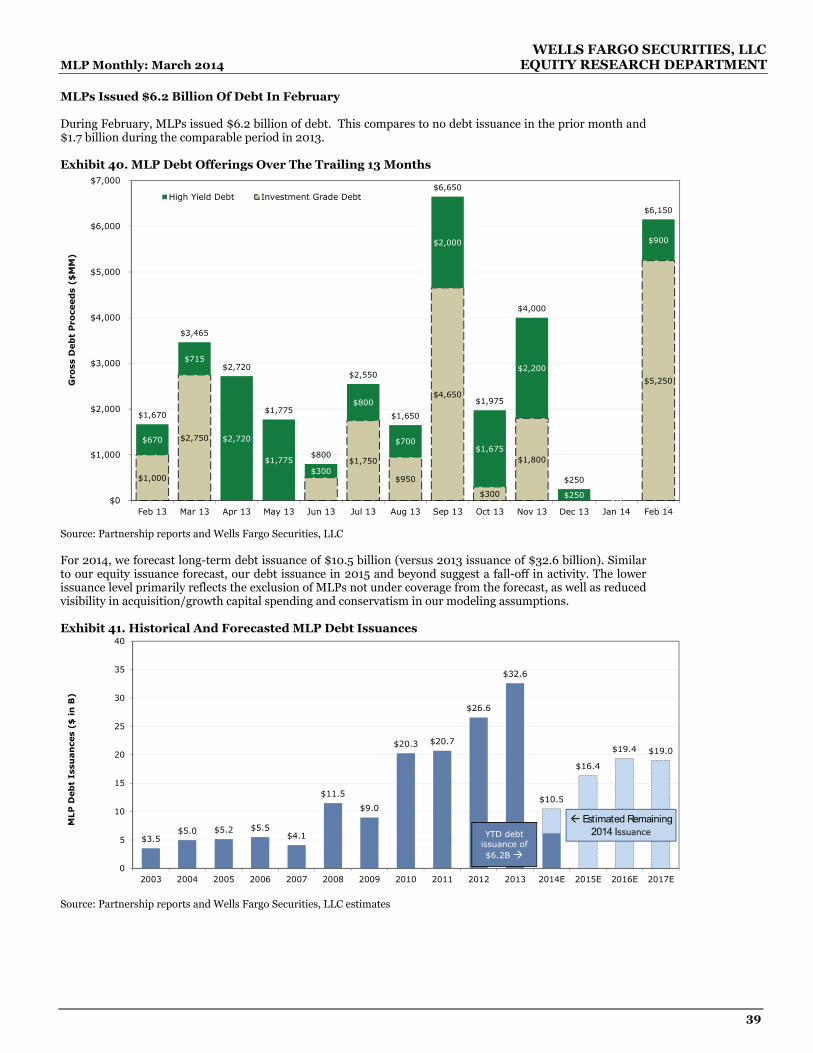
WELLS FARGO SECURITIES, LLC MLP Monthly: March 2014 EQUITY RESEARCH DEPARTMENT
39
MLPs Issued $6.2 Billion Of Debt In February During February, MLPs issued $6.2 billion of debt. This compares to no debt issuance in the prior month and $1.7 billion during the comparable period in 2013. Exhibit 40. MLP Debt Offerings Over The Trailing 13 Months
$1,000
$2,750
$1,750
$950
$4,650
$300
$1,800
$5,250
$670
$715
$2,720
$1,775 $300
$800
$700
$2,000
$1,675
$2,200
$250 $0
$900
$1,670
$3,465
$2,720
$1,775
$800
$2,550
$1,650
$6,650
$1,975
$4,000
$250
$6,150
$0
$1,000
$2,000
$3,000
$4,000
$5,000
$6,000
$7,000
Feb 13 Mar 13 Apr 13 May 13 Jun 13 Jul 13 Aug 13 Sep 13 Oct 13 Nov 13 Dec 13 Jan 14 Feb 14
Gro
ss D
eb
t P
roce
ed
s ($
MM
)
High Yield Debt Investment Grade Debt
Source: Partnership reports and Wells Fargo Securities, LLC For 2014, we forecast long-term debt issuance of $10.5 billion (versus 2013 issuance of $32.6 billion). Similar to our equity issuance forecast, our debt issuance in 2015 and beyond suggest a fall-off in activity. The lower issuance level primarily reflects the exclusion of MLPs not under coverage from the forecast, as well as reduced visibility in acquisition/growth capital spending and conservatism in our modeling assumptions. Exhibit 41. Historical And Forecasted MLP Debt Issuances
$3.5 $5.0 $5.2 $5.5
$4.1
$11.5
$9.0
$20.3 $20.7
$26.6
$32.6
$10.5
$16.4
$19.4 $19.0
0
5
10
15
20
25
30
35
40
2003 2004 2005 2006 2007 2008 2009 2010 2011 2012 2013 2014E 2015E 2016E 2017E
MLP
Deb
t Is
suan
ces
($ in
B)
YTD debt issuance of $6.2B
Estimated Remaining 2014 Issuance
Source: Partnership reports and Wells Fargo Securities, LLC estimates

WELLS FARGO SECURITIES, LLC Master Limited Partnerships EQUITY RESEARCH DEPARTMENT
40
Update On MLP Products MLP Open-End Fund, ETN, And ETF Overview In February, total assets for MLP products, i.e., MLP open-end funds, closed-end funds, exchange-traded notes (ETN), and exchange-traded funds (ETF), increased 3.1%, to $59.1 billion from $57.3 billion in January. On a sequential basis, MLP ETF assets increased 1.7%, MLP open-end funds increased 8.0%, MLP ETN assets increased 0.6%, and MLP closed-end funds increased 1.3%. Exhibit 42. MLP Products Cumulative Total Net Assets
$5.7 $7.1 $7.2
$15.9
$8.5
$17.3
$9.0
$24.3
$0.0
$5.0
$10.0
$15.0
$20.0
$25.0
$30.0
MLP ETFs MLP Open-End Funds MLP ETNs MLP Closed-End Funds
Cu
mu
lati
ve T
ota
l N
et
Ass
ets
($
B)
Mar-13 Apr-13 May-13 Jun-13 Jul-13 Aug-13 Sep-13 Oct-13 Nov-13 Dec-13 Jan-14 Feb-14
MLP ETFs have increased their assets by +55%
MLP open-end funds have increased their assets by
+175%
MLP ETNs have increased their assets by +35%
MLP closed-end funds have increased their assets by
+51%
Source: Bloomberg, FactSet, and Wells Fargo Securities, LLC MLP ETF Update MLP ETFs’ total net assets increased 1.7%, to $8.5 billion in February from $8.4 billion in January. The ETF market-cap weighted yield was 6.2% (versus the median MLP yield of 6.6%). Notably, the largest MLP ETF, AMLP, had a dividend yield of 6.4% at the end of the month. The return for the ETF group year to date was -1.9% (market-cap weighted), which compares to a return of -0.4% for the Wells Fargo Securities MLP Index (i.e., price performance). Exhibit 43. ETF Comp Table
Price Market Dividend YTD NAV / Total Net
MLP Exchange Traded Funds (ETFs) Ticker 2/28/14 Value (MM) Yield Return Share Assets (MM)
Alerian MLP ETF AMLP $17.41 $7,614.5 6.4% (2.1%) $17.55 $7,655.0
Alerian Energy Infrastructure ETF ENFR $26.10 $5.2 1.0% 0.9% $26.33 $3.9
First Trust North American Energy Infrastructure Fund ETF EMLP $23.94 $469.3 3.5% 1.9% $24.04 $471.4
Global X Junior MLP ETF MLPJ $16.28 $14.7 6.1% 1.2% $16.33 $14.7
Global X MLP ETF MLPA $15.91 $77.2 5.5% (1.7%) $15.99 $77.5
Global X MLP & Energy Infrastructure ETF MLPX-USA $16.65 $29.1 0.5% 2.0% $16.86 $29.5
Yorkville High Income MLP ETF YMLP $18.16 $267.9 9.0% (1.5%) $18.18 $261.3
Yorkville High Income Infrastructure ETF YMLI $21.07 $33.7 6.3% 0.3% $21.19 $33.9
MLP ETF Mean / Total $1,063.9 4.8% 0.1% $19.56 $8,547.2
MLP ETF Median (2) $55.4 6.3% (1.9%) $17.87 $55.7
MLP
ET
Fs
Note 1: NAV per share calculated using the most recent NAV available Note 2: Dividend yield and year-to-date return represent market-cap weighted figures Source: Fund reports, Bloomberg, FactSet, and Wells Fargo Securities, LLC estimates MLP Open-End Fund Update In February, the median implied yield for MLP open-end funds was 5.4%, which compares to the median MLP yield of 6.6%. For the month, total assets of MLP open-end funds increased by approximately 8.0%, to $17.3 billion from $16.0 billion in January. MLP open-end funds’ total return year to date was 3.2%, which compares to a total return of 1.0% for the Wells Fargo MLP TR Index.

WELLS FARGO SECURITIES, LLC MLP Monthly: March 2014 EQUITY RESEARCH DEPARTMENT
41
Exhibit 44. MLP Open-End Funds (Mutual Funds) Total Current
NAV Assets Annualized Implied Minimum YTD Total Front MgmtMLP Open-End Fund Ticker 2/28/14 ($ in MM) Dividend Yield Investment Return Load Fee
The ALPS | Alerian MLP Infrastr. Index Fund Class A ALERX $10.81 $7.5 $0.70 6.4% $2,500 0.3% 1.3% 1.3%
The ALPS | Alerian MLP Infrastr. Index Fund Class C ALRCX $10.76 $2.5 $0.70 6.5% $2,500 0.2% 1.9% 1.9%
The ALPS | Alerian MLP Infrastr. Index Fund Class I ALRIX $10.83 $1.1 $0.70 6.4% $1,000,000 0.3% 0.9% 0.9%
Brown Advisory Equity Income Fund* BIADX $12.88 $182.1 $0.28 2.2% $250,000 (0.8%) 0.0% 1.0%
Brown Advisory Equity Income Fund* BADAX $12.86 $3.0 $0.25 2.0% $2,000 (0.8%) 0.0% 1.0%
Center Coast MLP Focus Fund - Retail CCCAX $10.92 $803.2 $0.68 6.3% $2,500 0.6% 5.8% 1.0%
Center Coast MLP Focus Fund - Retail CCCCX $10.60 $818.2 $0.68 6.5% $2,500 0.5% 0.0% 1.0%
Center Coast MLP Focus Fund - Institutional CCCNX $10.97 $693.1 $0.68 6.2% $1,000,000 0.7% 0.0% 1.0%
Cushing Royalty Energy Income Fund Class A* CURAX $18.49 $59.2 $1.60 8.7% $2,000 1.9% 5.8% 1.4%
Cushing Royalty Energy Income Fund Class C* CURCX $18.25 $11.7 $1.60 8.8% $2,000 1.7% 0.0% 1.4%
Cushing Royalty Energy Income Fund Class I* CURZX $18.57 $3.2 $1.60 8.6% $250,000 1.9% 0.0% 1.4%
Cushing Renaissance Advantage Fund Class A* CRZAX $24.07 $11.1 $0.14 0.6% $2,000 4.0% 5.8% 1.3%
Cushing Renaissance Advantage Fund Class C* CRZCX $23.93 $5.9 $0.14 0.6% $2,000 3.9% 1.0% 1.3%
Cushing Renaissance Advantage Fund Class I* CRZZX $24.09 $38.7 $0.14 0.6% $250,000 4.0% 0.0% 1.3%
Eagle MLP Strategy Class A EGLAX $12.94 $71.7 $0.47 3.6% $2,500 2.8% 0.0% 0.0%
Eagle MLP Strategy Class C EGLCX $12.92 $18.7 $0.38 3.0% $100,000 2.6% 0.0% 0.0%
Eagle MLP Strategy Class I EGLIX $12.95 $465.6 $0.49 3.8% $2,500 2.8% 0.0% 0.0%
FAMCO MLP & Energy Income Fund - Retail INFRX $12.96 $44.9 $0.65 5.0% $2,500 3.8% 5.5% 1.0%
FAMCO MLP & Energy Income Fund - Institutional INFIX $12.75 $422.4 $0.67 5.2% $1,000,000 3.9% 0.0% 1.0%
FAMCO MLP & Energy Infrastructure Fund MLPPX $12.80 $33.8 $0.67 5.2% $1,000,000 3.9% 0.0% 0.8%
Goldman Sachs MLP Energy Infrastructure Fund Class A GLPAX $11.47 $134.5 $0.45 3.9% $1,000 3.9% 5.5% 1.0%
Goldman Sachs MLP Energy Infrastructure Fund Class C GLPCX $11.39 $40.0 $0.45 4.0% $1,000 3.7% 0.0% 1.0%
Goldman Sachs MLP Energy Infrastructure Fund Class I GMLPX $11.51 $458.7 $0.45 3.9% $1,000,000 3.9% 0.0% 1.0%
Goldman Sachs MLP Energy Infrastructure Fund Class R GLPIX $11.50 $24.1 $0.45 3.9% $0 3.9% 0.0% 1.0%
Goldman Sachs MLP Energy Infrastructure Fund Class IR GLPRX $11.45 $0.0 $0.45 3.9% $0 3.8% 0.0% 1.0%
MainGate MLP Fund - Retail AMLPX $12.69 $151.0 $0.63 5.0% $2,500 4.8% 5.8% 1.3%
MainGate MLP Fund - Institutional IMLPX $12.80 $434.0 $0.63 4.9% $1,000,000 4.9% 0.0% 1.3%
Salient MLP & Energy Infrastructure II C lass A SMAPX $13.00 $0.0 $0.53 4.1% $2,500 3.7% 5.5% 1.0%
Salient MLP & Energy Infrastructure II C lass C SMFPX $12.95 $0.0 $0.46 3.5% $2,500 3.5% 0.0% 1.0%
Salient MLP & Energy Infrastructure II C lass I SMLPX $12.99 $0.0 $0.56 4.3% $1,000,000 3.7% 0.0% 1.0%
Oppenheimer SteelPath MLP Alpha Fund Class A MLPAX $12.34 $1,388.2 $0.69 5.6% $3,000 3.3% 5.8% 1.1%
Oppenheimer SteelPath MLP Alpha Fund Class C MLPGX $12.15 $571.0 $0.69 5.7% $3,000 3.2% 1.0% 1.1%
Oppenheimer SteelPath MLP Alpha Fund Class I MLPOX $12.49 $1,408.6 $0.69 5.5% $1,000,000 3.5% 0.0% 1.1%
Oppenheimer SteelPath MLP Select 40 Fund Class A MLPFX $12.18 $697.3 $0.71 5.8% $3,000 2.9% 5.8% 0.7%
Oppenheimer SteelPath MLP Select 40 Fund Class C MLPEX $12.03 $305.2 $0.71 5.9% $3,000 2.7% 1.0% 0.7%
Oppenheimer SteelPath MLP Select 40 Fund Class I MLPTX $12.35 $1,508.5 $0.71 5.7% $1,000,000 2.9% 0.0% 0.7%
Oppenheimer SteelPath MLP Select 40 Fund Class Y MLPYX $12.35 $59.2 $0.71 5.7% $1,000,000 2.9% 0.0% 0.7%
Oppenheimer SteelPath MLP Income Fund Class A MLPDX $10.85 $1,680.3 $0.78 7.1% $3,000 (0.3%) 5.8% 1.0%
Oppenheimer SteelPath MLP Income Fund Class C MLPRX $10.64 $1,069.5 $0.78 7.3% $3,000 (0.5%) 0.0% 1.0%
Oppenheimer SteelPath MLP Income Fund Class I MLPZX $10.96 $632.8 $0.78 7.1% $1,000,000 (0.3%) 0.0% 1.0%
Oppenheimer SteelPath MLP Alpha Plus Fund Class A MLPLX $12.20 $120.3 $0.66 5.4% $3,000 4.4% 5.8% 1.3%
Oppenheimer SteelPath MLP Alpha Plus Fund Class C MLPMX $12.05 $23.4 $0.66 5.5% $3,000 4.3% 0.0% 1.3%
Oppenheimer SteelPath MLP Alpha Plus Fund Class I MLPNX $12.28 $65.8 $0.66 5.4% $1,000,000 4.5% 0.0% 1.3%
The Cushing MLP Premier Fund - Retail CSHAX $21.83 $542.0 $1.34 6.1% $2,000 2.9% 5.8% 1.1%
The Cushing MLP Premier Fund - Retail CSHCX $21.20 $658.4 $1.34 6.3% $2,000 2.7% 0.0% 1.1%
The Cushing MLP Premier Fund - Institutional CSHZX $22.03 $285.0 $1.34 6.1% $250,000 2.9% 0.0% 1.1%
Tortoise MLP & Pipeline Fund - Investor Class TORTX $16.32 $233.8 $0.13 0.8% $2,500 5.5% 5.8% 0.9%
Tortoise MLP & Pipeline Fund - C Class TORCX $16.20 $38.4 $0.07 0.5% $2,500 5.4% 0.0% 0.0%
Tortoise MLP & Pipeline Fund - Institutional Class TORIX $16.40 $1,068.8 $0.16 1.0% $1,000,000 5.6% 0.0% 1.1%
MLP Open-End Fund Total / Median $17,296.4 5.4% $3,000 3.2% 0.0% 1.0%
Op
en
-En
d F
un
ds
*Not a MLP dedicated fund Source: Bloomberg, FactSet, and Wells Fargo Securities, LLC
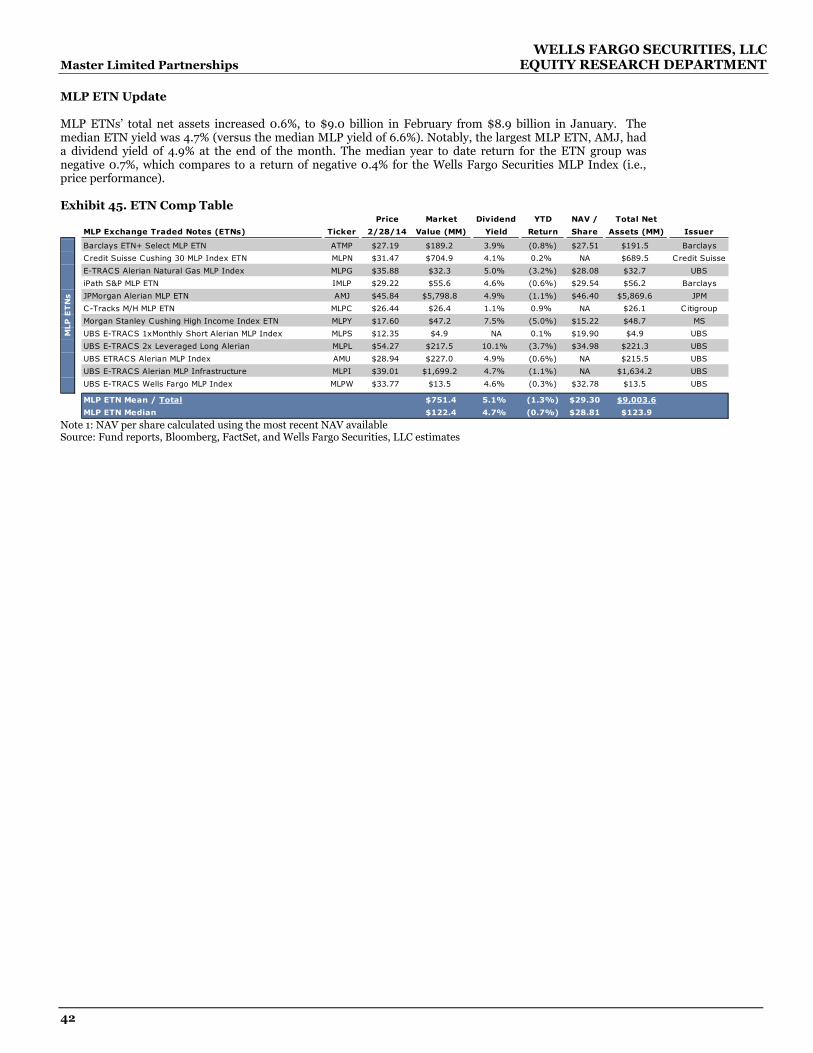
WELLS FARGO SECURITIES, LLC Master Limited Partnerships EQUITY RESEARCH DEPARTMENT
42
MLP ETN Update MLP ETNs’ total net assets increased 0.6%, to $9.0 billion in February from $8.9 billion in January. The median ETN yield was 4.7% (versus the median MLP yield of 6.6%). Notably, the largest MLP ETN, AMJ, had a dividend yield of 4.9% at the end of the month. The median year to date return for the ETN group was negative 0.7%, which compares to a return of negative 0.4% for the Wells Fargo Securities MLP Index (i.e., price performance). Exhibit 45. ETN Comp Table
Price Market Dividend YTD NAV / Total Net
MLP Exchange Traded Notes (ETNs) Ticker 2/28/14 Value (MM) Yield Return Share Assets (MM) Issuer
Barclays ETN+ Select MLP ETN ATMP $27.19 $189.2 3.9% (0.8%) $27.51 $191.5 Barclays
Credit Suisse Cushing 30 MLP Index ETN MLPN $31.47 $704.9 4.1% 0.2% NA $689.5 Credit Suisse
E-TRACS Alerian Natural Gas MLP Index MLPG $35.88 $32.3 5.0% (3.2%) $28.08 $32.7 UBS
iPath S&P MLP ETN IMLP $29.22 $55.6 4.6% (0.6%) $29.54 $56.2 Barclays
JPMorgan Alerian MLP ETN AMJ $45.84 $5,798.8 4.9% (1.1%) $46.40 $5,869.6 JPM
C-Tracks M/H MLP ETN MLPC $26.44 $26.4 1.1% 0.9% NA $26.1 Citigroup
Morgan Stanley Cushing High Income Index ETN MLPY $17.60 $47.2 7.5% (5.0%) $15.22 $48.7 MS
UBS E-TRACS 1xMonthly Short Alerian MLP Index MLPS $12.35 $4.9 NA 0.1% $19.90 $4.9 UBS
UBS E-TRACS 2x Leveraged Long Alerian MLPL $54.27 $217.5 10.1% (3.7%) $34.98 $221.3 UBS
UBS ETRACS Alerian MLP Index AMU $28.94 $227.0 4.9% (0.6%) NA $215.5 UBS
UBS E-TRACS Alerian MLP Infrastructure MLPI $39.01 $1,699.2 4.7% (1.1%) NA $1,634.2 UBS
UBS E-TRACS Wells Fargo MLP Index MLPW $33.77 $13.5 4.6% (0.3%) $32.78 $13.5 UBS
MLP ETN Mean / Total $751.4 5.1% (1.3%) $29.30 $9,003.6
MLP ETN Median $122.4 4.7% (0.7%) $28.81 $123.9
MLP
ET
Ns
Note 1: NAV per share calculated using the most recent NAV available Source: Fund reports, Bloomberg, FactSet, and Wells Fargo Securities, LLC estimates
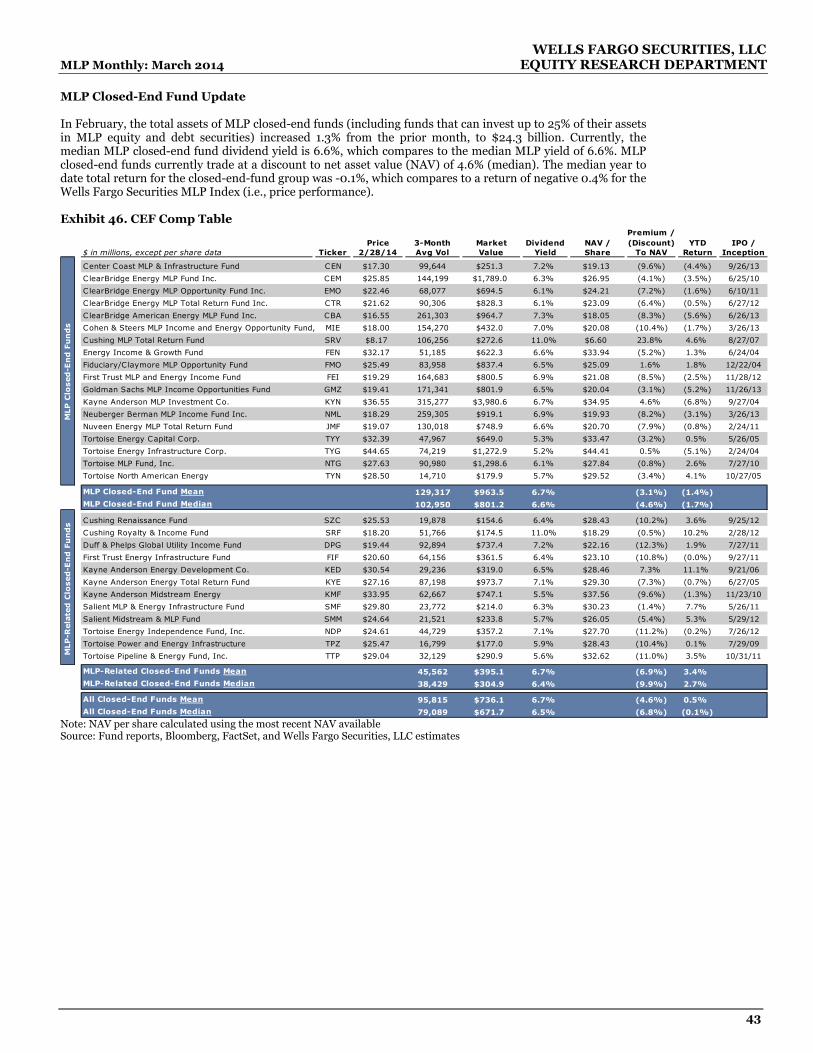
WELLS FARGO SECURITIES, LLC MLP Monthly: March 2014 EQUITY RESEARCH DEPARTMENT
43
MLP Closed-End Fund Update In February, the total assets of MLP closed-end funds (including funds that can invest up to 25% of their assets in MLP equity and debt securities) increased 1.3% from the prior month, to $24.3 billion. Currently, the median MLP closed-end fund dividend yield is 6.6%, which compares to the median MLP yield of 6.6%. MLP closed-end funds currently trade at a discount to net asset value (NAV) of 4.6% (median). The median year to date total return for the closed-end-fund group was -0.1%, which compares to a return of negative 0.4% for the Wells Fargo Securities MLP Index (i.e., price performance). Exhibit 46. CEF Comp Table
Premium /Price 3-Month Market Dividend NAV / (Discount) YTD IPO /
$ in millions, except per share data Ticker 2/28/14 Avg Vol Value Yield Share To NAV Return Inception
Center Coast MLP & Infrastructure Fund CEN $17.30 99,644 $251.3 7.2% $19.13 (9.6%) (4.4%) 9/26/13
ClearBridge Energy MLP Fund Inc. CEM $25.85 144,199 $1,789.0 6.3% $26.95 (4.1%) (3.5%) 6/25/10
ClearBridge Energy MLP Opportunity Fund Inc. EMO $22.46 68,077 $694.5 6.1% $24.21 (7.2%) (1.6%) 6/10/11
ClearBridge Energy MLP Total Return Fund Inc. CTR $21.62 90,306 $828.3 6.1% $23.09 (6.4%) (0.5%) 6/27/12
ClearBridge American Energy MLP Fund Inc. CBA $16.55 261,303 $964.7 7.3% $18.05 (8.3%) (5.6%) 6/26/13
Cohen & Steers MLP Income and Energy Opportunity Fund, MIE $18.00 154,270 $432.0 7.0% $20.08 (10.4%) (1.7%) 3/26/13
Cushing MLP Total Return Fund SRV $8.17 106,256 $272.6 11.0% $6.60 23.8% 4.6% 8/27/07
Energy Income & Growth Fund FEN $32.17 51,185 $622.3 6.6% $33.94 (5.2%) 1.3% 6/24/04
Fiduciary/Claymore MLP Opportunity Fund FMO $25.49 83,958 $837.4 6.5% $25.09 1.6% 1.8% 12/22/04
First Trust MLP and Energy Income Fund FEI $19.29 164,683 $800.5 6.9% $21.08 (8.5%) (2.5%) 11/28/12
Goldman Sachs MLP Income Opportunities Fund GMZ $19.41 171,341 $801.9 6.5% $20.04 (3.1%) (5.2%) 11/26/13
Kayne Anderson MLP Investment Co. KYN $36.55 315,277 $3,980.6 6.7% $34.95 4.6% (6.8%) 9/27/04
Neuberger Berman MLP Income Fund Inc. NML $18.29 259,305 $919.1 6.9% $19.93 (8.2%) (3.1%) 3/26/13
Nuveen Energy MLP Total Return Fund JMF $19.07 130,018 $748.9 6.6% $20.70 (7.9%) (0.8%) 2/24/11
Tortoise Energy Capital Corp. TYY $32.39 47,967 $649.0 5.3% $33.47 (3.2%) 0.5% 5/26/05
Tortoise Energy Infrastructure Corp. TYG $44.65 74,219 $1,272.9 5.2% $44.41 0.5% (5.1%) 2/24/04
Tortoise MLP Fund, Inc. NTG $27.63 90,980 $1,298.6 6.1% $27.84 (0.8%) 2.6% 7/27/10
Tortoise North American Energy TYN $28.50 14,710 $179.9 5.7% $29.52 (3.4%) 4.1% 10/27/05
MLP Closed-End Fund Mean 129,317 $963.5 6.7% (3.1%) (1.4%)
MLP Closed-End Fund Median 102,950 $801.2 6.6% (4.6%) (1.7%)
Cushing Renaissance Fund SZC $25.53 19,878 $154.6 6.4% $28.43 (10.2%) 3.6% 9/25/12
Cushing Royalty & Income Fund SRF $18.20 51,766 $174.5 11.0% $18.29 (0.5%) 10.2% 2/28/12
Duff & Phelps Global Utility Income Fund DPG $19.44 92,894 $737.4 7.2% $22.16 (12.3%) 1.9% 7/27/11
First Trust Energy Infrastructure Fund FIF $20.60 64,156 $361.5 6.4% $23.10 (10.8%) (0.0%) 9/27/11
Kayne Anderson Energy Development Co. KED $30.54 29,236 $319.0 6.5% $28.46 7.3% 11.1% 9/21/06
Kayne Anderson Energy Total Return Fund KYE $27.16 87,198 $973.7 7.1% $29.30 (7.3%) (0.7%) 6/27/05
Kayne Anderson Midstream Energy KMF $33.95 62,667 $747.1 5.5% $37.56 (9.6%) (1.3%) 11/23/10
Salient MLP & Energy Infrastructure Fund SMF $29.80 23,772 $214.0 6.3% $30.23 (1.4%) 7.7% 5/26/11
Salient Midstream & MLP Fund SMM $24.64 21,521 $233.8 5.7% $26.05 (5.4%) 5.3% 5/29/12
Tortoise Energy Independence Fund, Inc. NDP $24.61 44,729 $357.2 7.1% $27.70 (11.2%) (0.2%) 7/26/12
Tortoise Power and Energy Infrastructure TPZ $25.47 16,799 $177.0 5.9% $28.43 (10.4%) 0.1% 7/29/09
Tortoise Pipeline & Energy Fund, Inc. TTP $29.04 32,129 $290.9 5.6% $32.62 (11.0%) 3.5% 10/31/11
MLP-Related Closed-End Funds Mean 45,562 $395.1 6.7% (6.9%) 3.4%
MLP-Related Closed-End Funds Median 38,429 $304.9 6.4% (9.9%) 2.7%
All Closed-End Funds Mean 95,815 $736.1 6.7% (4.6%) 0.5%
All Closed-End Funds Median 79,089 $671.7 6.5% (6.8%) (0.1%)
MLP
-Rela
ted
Clo
sed
-En
d F
un
ds
MLP
Clo
sed
-En
d F
un
ds
Note: NAV per share calculated using the most recent NAV available Source: Fund reports, Bloomberg, FactSet, and Wells Fargo Securities, LLC estimates

WELLS FARGO SECURITIES, LLC Master Limited Partnerships EQUITY RESEARCH DEPARTMENT
44
Commodity Overview And Forecast Natural Gas Prices Increased In February The average price of natural gas (Henry Hub) increased 25.9% in February, to $5.87 per MMBtu from $4.66 in the prior month. Natural gas futures are currently averaging $4.55 per MMBtu in 2014E, $4.23 per MMBtu in 2015E, $4.15 per MMBtu in 2016E, and $4.19 per MMBtu in 2017E. Exhibit 47. Natural Gas Outlook
$0
$2
$4
$6
$8
$10
$12
$14
Jan-07 Jan-08 Jan-09 Jan-10 Jan-11 Jan-12 Jan-13 Jan-14 Jan-15E Jan-16E Jan-17E
Natu
ral G
as
Pri
ce -
Hen
ry H
ub
($
/M
MB
tu)
Historical
NYMEX Futures
Dotted Line Represents Price Deck Assumed In Wells Fargo Securities'
Models
Source: Bloomberg, FactSet, and Wells Fargo Securities, LLC estimates Basis Differentials Were Mixed In February Basis differentials were mixed in February relative to the prior month. CIG Rockies, Waha, Centerpoint East, Houston Ship, Chicago, Kosciusko, Transco Zone 4, Transco Zone 6, Florida Gas Zone 3, and AECO basis differentials widened to $1.66 per MMBtu, $0.12 per MMBtu, $0.27 per MMBtu, $0.04 per MMBtu, $32.23 per MMBtu, $0.12 per MMBtu, $0.08 per MMBtu, $1.92 per MMBtu, $0.13 per MMBtu, and $2.49 per MMBtu from $0.32 per MMBtu, ($0.07) per MMBtu, ($0.03) per MMBtu, ($0.02) per MMBtu, $2.04 per MMBtu, $0.04 per MMBtu, ($0.03) per MMBtu, $0.19 per MMBtu, ($0.08) per MMBtu, and ($0.55) per MMBtu in January. Differentials narrowed at Carthage, Columbia Gulf Mainline, and Dominion South Point to ($0.55) per MMBtu, $0.03 per MMBtu, and $0.06 per MMBtu, respectively, from ($0.86) per MMBtu, ($0.08) per MMBtu, and ($0.20) per MMBtu. As a reminder, natural gas basis differentials are a key driver of intrastate natural gas transportation results (specifically in the Texas/Gulf Coast region) for a number of MLPs. Intrastate pipeline networks transport natural gas between many hubs and points within Texas; hence, basis differentials among multiple hubs in the region are a driver of segment revenue.

WELLS FARGO SECURITIES, LLC MLP Monthly: March 2014 EQUITY RESEARCH DEPARTMENT
45
Exhibit 48. U.S. Basis Differentials Relative To Henry Hub
AECO HUB
$0.32 $1.66
$(0.07)$0.12
$(0.02)$0.04
$(0.86)$(0.55)
$(0.03)$0.27
$(0.08)$0.03
$0.04 $0.12
$(0.03)$0.08
$(0.08)$0.13
$2.04 $32.23
$(0.20)$0.06
$0.19 $1.92
$(0.55)$2.49
JANUARY PricingFEBRUARY Pric ing
Source: Bloomberg and Wells Fargo Securities, LLC In the following Exhibit, we have highlighted the Katy-Waha basis spread (i.e. West to East) given its prominence within a number of MLP intrastate pipeline systems. For February, the differential between these two hubs averaged -$0.54 per MMBtu, which compares to the prior month average of -$0.05. In early February, the basis spread was temporarily very negative, but normalized within the week. At the end of February, the Katy-Waha basis spread was about -$0.10 per MMBtu, while the average spread in the past five years (i.e., 2009-2013) has been approximately $0.11. To note, several MLP management teams have indicated that the breakeven cost to move natural gas across Texas is approximately $0.08-0.12 per MMBtu. Hence, the West-to-East basis differential needs to increase from current levels for pipeline operators to utilize excess pipeline capacity to ship natural gas volume on a spot basis.

WELLS FARGO SECURITIES, LLC Master Limited Partnerships EQUITY RESEARCH DEPARTMENT
46
Exhibit 49. Historical Katy-To-Waha Differential Qtr1 $0.29Qtr2 $0.98Qtr3 $1.03Qtr4 $1.37
2008 Avg $0.92Qtr1 $0.65Qtr2 $0.45Qtr3 $0.06Qtr4 $0.01
2009 Avg $0.35Qtr1 $0.00Qtr2 $0.11Qtr3 $0.23Qtr4 $0.08
2010 Avg $0.11Qtr1 $0.01Qtr2 $0.08Qtr3 $0.04Qtr4 $0.03
2011 Avg $0.04Qtr1 $0.03Qtr2 $0.02Qtr3 $0.03Qtr4 $0.00
2012 Avg $0.02Qtr1 $0.01Qtr2 $0.05Qtr3 $0.04Qtr4 ($0.01)
2013 Avg $0.02Qtr1TD ($0.27)
Qtr2Qtr3Qtr4
2014 Avg ($0.05)Five-Year Avg $0.11
20
14
20
13
20
12
20
11
20
10
20
08
20
09
$0.2
0
$0.3
1
$0.2
5
$0.2
5
$0.2
9
$0.9
8
$1.0
3
$1.3
7
$0.6
5
$0.4
5
$0.0
6
$0.0
6
$0.0
0
$0.1
1 $0.2
3
$0.0
8
$0.0
1
$0.0
8
$0.0
4
$0.0
3
$0.0
3
$0.0
2
$0.0
3
$0.0
0
$0.0
1
$0.0
5
$0.0
4
($0.0
1)
($0.2
7)
($0.60)
($0.40)
($0.20)
$0.00
$0.20
$0.40
$0.60
$0.80
$1.00
$1.20
$1.40
$1.60
Q1'0
7
Q2'0
7
Q3'0
7
Q4'0
7
Q1'0
8
Q2'0
8
Q3'0
8
Q4'0
8
Q1'0
9
Q2'0
9
Q3'0
9
Q4'0
9
Q1'1
0
Q2'1
0
Q3'1
0
Q4'1
0
Q1'1
1
Q2'1
1
Q3'1
1
Q4'1
1
Q1'1
2
Q2'1
2
Q3'1
2
Q4'1
2
Q1'1
3
Q2'1
3
Q3'1
3
Q4'1
3
Q1'1
4
Historical Average:
$0.11/MMBtu
Source: Bloomberg and Wells Fargo Securities, LLC Natural Gas Storage Withdrawal Smaller Than The Consensus The EIA reported a natural gas storage withdrawal for the week ended February 21, 2014, of 95 billion cubic feet (Bcf), which was smaller than the Street’s estimate of 102 Bcf. The five-year average withdrawal for the comparable week is 121 Bcf. During the same week last year, U.S. natural gas storage supplies decreased by 171 Bcf. Storage now stands at 1,348 Bcf, which is below the five-year average by approximately 34.5% and below levels in the prior-year period by 40.2%.

WELLS FARGO SECURITIES, LLC MLP Monthly: March 2014 EQUITY RESEARCH DEPARTMENT
47
Exhibit 50. Natural Gas Storage Inventory
1,000
1,500
2,000
2,500
3,000
3,500
4,000
3/13 4/13 5/13 6/13 7/13 8/13 9/13 10/13 11/13 12/13 1/14 2/14
Bil
lio
n c
ub
ic f
eet
Series1 5-year average Prior year Current year
1,000
1,200
1,400
1,600
1,800
2,000
2,200
2,400
2,600
2,800
3,000
3,200
3,400
1/31 2/14 2/28
Billion c
ubic
feet
1,000
1,500
2,000
2,500
3,000
3,500
4,000
3/13 4/13 5/13 6/13 7/13 8/13 9/13 10/13 11/13 12/13 1/14 2/14
Bil
lio
n c
ub
ic f
eet
Series1 5-year average Prior year Current year
1,000
1,500
2,000
2,500
3,000
3,500
4,000
3/13 4/13 5/13 6/13 7/13 8/13 9/13 10/13 11/13 12/13 1/14 2/14
Bil
lio
n c
ub
ic f
eet
Series1 5-year average Prior year Current year
500
1,000
1,500
2,000
2,500
3,000
3,500
4,000
3/13 4/13 5/13 6/13 7/13 8/13 9/13 10/13 11/13 12/13 1/14 2/14
Billion c
ubic
feet
5-year range 5-year average Prior year Current year
Source: EIA and Wells Fargo Securities, LLC Implied 2014 Seasonal Storage Spread Was Lower Versus The Prior Month At the end of February, the implied winter summer spreads for 2014, 2015, 2016, and 2017 were approximately $0.25 per MMBtu, $0.40 per MMBtu, $0.45 per MMBtu, and $0.47 per MMBtu, respectively, versus $0.29 per MMBtu, $0.37 per MMBtu, $0.41 per MMBtu, and $0.42 per MMBtu at the end of the prior month. The aforementioned spreads are based on the difference between maximum NYMEX futures monthly pricing for the winter (10/1 to 3/31) and minimum NYMEX futures monthly pricing for the summer (4/1 to 9/30). The five- and ten-year historical average spreads (i.e., 2009-2013 and 2004-2013) are $0.64 per MMBtu and $0.95 per MMBtu, respectively. As a reminder, the winter-to-summer spread represents the effective value of storage in any given year because a user of storage can buy natural gas in the summer (when prices are seasonally low, due to less demand), inject it into storage, and sell forward on the NYMEX at the higher winter price, locking in a margin. Exhibit 51. Historical And Forecasted Winter-to-Summer Spread Based On NYMEX Futures
$0.38
$0.75
$1.14
$2.30
$1.25
$0.90
$1.20
$0.61 $0.46
$0.68
$0.24 $0.25 $0.40 $0.45 $0.47
$0.00
$0.50
$1.00
$1.50
$2.00
$2.50
2003 2004 2005 2006 2007 2008 2009 2010 2011 2012 2013 2014E 2015E 2016E 2017E
Avera
ge W
inte
r /
Su
mm
er
Sp
read
($
/M
MB
tu)
Storage Seasons
2004-13 Average
Note: Figures are based on natural gas storage seasons Source: Bloomberg, FactSet, and Wells Fargo Securities, LLC
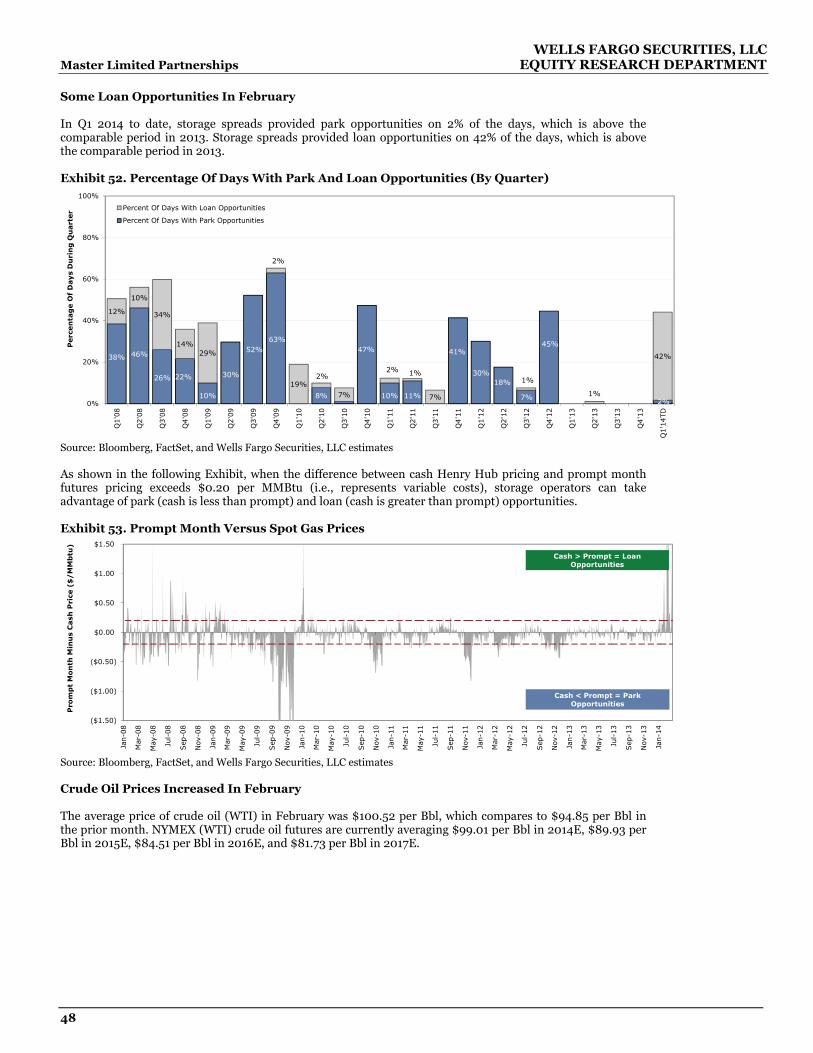
WELLS FARGO SECURITIES, LLC Master Limited Partnerships EQUITY RESEARCH DEPARTMENT
48
Some Loan Opportunities In February In Q1 2014 to date, storage spreads provided park opportunities on 2% of the days, which is above the comparable period in 2013. Storage spreads provided loan opportunities on 42% of the days, which is above the comparable period in 2013. Exhibit 52. Percentage Of Days With Park And Loan Opportunities (By Quarter)
38% 46%
26% 22%
10%
30%
52%63%
8%
47%
10% 11%
41%
30%18%
7%
45%
0% 0% 0%
0%
2%
12%
10%
34%
14%29%
2%
19%2%
7%
2% 1%
7%
1%
1%
42%
0%
20%
40%
60%
80%
100%
Q1'0
8
Q2'0
8
Q3'0
8
Q4'0
8
Q1'0
9
Q2'0
9
Q3'0
9
Q4'0
9
Q1'1
0
Q2'1
0
Q3'1
0
Q4'1
0
Q1'1
1
Q2'1
1
Q3'1
1
Q4'1
1
Q1'1
2
Q2'1
2
Q3'1
2
Q4'1
2
Q1'1
3
Q2'1
3
Q3'1
3
Q4'1
3
Q1'1
4TD
Perc
en
tag
e O
f D
ays
Du
rin
g Q
uart
er Percent Of Days With Loan Opportunities
Percent Of Days With Park Opportunities
Source: Bloomberg, FactSet, and Wells Fargo Securities, LLC estimates As shown in the following Exhibit, when the difference between cash Henry Hub pricing and prompt month futures pricing exceeds $0.20 per MMBtu (i.e., represents variable costs), storage operators can take advantage of park (cash is less than prompt) and loan (cash is greater than prompt) opportunities. Exhibit 53. Prompt Month Versus Spot Gas Prices
($1.50)
($1.00)
($0.50)
$0.00
$0.50
$1.00
$1.50
Jan-0
8
Mar
-08
May
-08
Jul-
08
Sep
-08
Nov
-08
Jan-0
9
Mar
-09
May
-09
Jul-
09
Sep
-09
Nov
-09
Jan-1
0
Mar
-10
May
-10
Jul-
10
Sep
-10
Nov
-10
Jan-1
1
Mar
-11
May
-11
Jul-
11
Sep
-11
Nov
-11
Jan-1
2
Mar
-12
May
-12
Jul-
12
Sep
-12
Nov
-12
Jan-1
3
Mar
-13
May
-13
Jul-
13
Sep
-13
Nov
-13
Jan-1
4
Pro
mp
t M
on
th M
inu
s C
ash
Pri
ce (
$/
MM
btu
)
Cash > Prompt = Loan Opportunities
Cash < Prompt = Park Opportunities
Source: Bloomberg, FactSet, and Wells Fargo Securities, LLC estimates Crude Oil Prices Increased In February The average price of crude oil (WTI) in February was $100.52 per Bbl, which compares to $94.85 per Bbl in the prior month. NYMEX (WTI) crude oil futures are currently averaging $99.01 per Bbl in 2014E, $89.93 per Bbl in 2015E, $84.51 per Bbl in 2016E, and $81.73 per Bbl in 2017E.

WELLS FARGO SECURITIES, LLC MLP Monthly: March 2014 EQUITY RESEARCH DEPARTMENT
49
Exhibit 54. Crude Oil Outlook
$0
$20
$40
$60
$80
$100
$120
$140
$160
Jan-07 Jan-08 Jan-09 Jan-10 Jan-11 Jan-12 Jan-13 Jan-14 Jan-15E Jan-16E Jan-17E
Cru
de O
il P
rice
-W
TI
($/B
bl)
Historical
NYMEX Futures
Dotted Line Represents Price Deck Assumed In Wells Fargo Securities'
Models
Source: Bloomberg, FactSet, and Wells Fargo Securities, LLC estimates Brent/WTI Crude Price Differential Narrowed In February In February, the Brent-to-WTI spread decreased to an average of $8.08 per barrel (or a WTI discount to Brent of approximately 7.4%) from $12.08 per barrel in the prior month. Exhibit 55. WTI-To-Brent Crude Differential
($10)
($5)
$0
$5
$10
$15
$20
$25
$30
Jan-1
0
Mar
-10
May
-10
Jul-
10
Sep
-10
Nov
-10
Jan-1
1
Mar
-11
May
-11
Jul-
11
Sep
-11
Nov
-11
Jan-1
2
Mar
-12
May
-12
Jul-
12
Sep
-12
Nov
-12
Jan-1
3
Mar
-13
May
-13
Jul-
13
Sep
-13
Nov
-13
Jan-1
4
Bre
nt/
WT
I C
rud
e O
il S
pre
ad
($
/B
bl)
WTI ($) > Brent ($)
Brent ($) > WTI ($)
Source: FactSet and Wells Fargo Securities, LLC WTI And Brent Forward Price Curves Suggest Spread Could Increase At the end of February, spot WTI and Brent crude oil prices reflected a differential of $6.71 per barrel (versus an average monthly spread of $8.08 per barrel). Based on current forward pricing for WTI and Brent crude, the spread is expected to average $6.56 per barrel at the beginning of 2014, $12.14 per barrel at the beginning of 2015, $12.97 per barrel at the beginning of 2016, and $12.70 per barrel at the beginning of 2017.

WELLS FARGO SECURITIES, LLC Master Limited Partnerships EQUITY RESEARCH DEPARTMENT
50
Exhibit 56. WTI And Brent Forward Price Curves And Spread
$6.56
$12.14 $12.97 $12.70
$1
$3
$5
$7
$9
$11
$13
$15
$17
$75
$80
$85
$90
$95
$100
$105
$110
$115
$120
Q2'1
4
Q3'1
4
Q4'1
4
Q1'1
5
Q2'1
5
Q3'1
5
Q4'1
5
Q1'1
6
Q2'1
6
Q3'1
6
Q4'1
6
Q1'1
7
Q2'1
7
Q3'1
7
Q4'1
7
Bre
nt-
WTI
pri
ce d
iffe
ren
tial
($ p
er
barr
el)
Cru
de o
il p
rice
($
per
barr
el)
Brent (Left Axis) WTI (Left Axis) Brent-WTI Differential (Right Axis)
Source: FactSet and Wells Fargo Securities, LLC Cushing Inventory Decreases From Prior Month Cushing crude oil inventory levels currently stand at 32,132 MBbls (based on EIA data as of February 28, 2014), which compares to the highest level on record of 51,862 MBbls reached during the week ended February 11, 2013, and 40,276 MBbls at the end of January. The current oil inventory at Cushing represents a decrease of approximately 37% relative to the prior-year period of 50,841 MBbls and a decrease of 16% relative to the five-year historical period average for the comparable period of 38,241 MBbls. Exhibit 57. Weekly Crude Oil Supply At Cushing, Oklahoma
20,000
25,000
30,000
35,000
40,000
45,000
50,000
55,000
Feb Mar Apr May Jun Jul Jul Aug Sep Oct Nov Dec Jan Feb
Inven
tory
in
th
ou
san
d b
arr
els
February 2014 TTM Inventory February 2013 TTM Inventory Historical 5-Year Average
Note 1: Excludes Strategic Petroleum Reserves (SPR) Note 2: Data as of February 28, 2014 (latest data) Source: EIA and Wells Fargo Securities, LLC

WELLS FARGO SECURITIES, LLC MLP Monthly: March 2014 EQUITY RESEARCH DEPARTMENT
51
Crude Oil Market Backwardated In February In February, forward pricing for crude oil was below spot pricing (i.e., a backwardated market). The average spread was negative $0.57 per barrel in February, versus a spread of negative $0.08 per barrel in January (and versus a contango spread of $0.50 per barrel in the comparable prior-year period). As a reference, the average one month contango spread in 2013 was $0.07. To note, the long-term (i.e., 2014-16) crude-oil market remains backwardated. Exhibit 58. Crude Oil Contango / Backwardation
$3.1
9
$1.2
5
$1.0
5
$0.8
9
$0.4
0
$1.6
9
$0.7
6
$0.6
4
$1.6
1
$0.5
3
$0.3
1
$0.1
0
$0.3
8
$0.3
7
$0.3
2
$0.4
9
$0.4
4
$0.2
1
($0.5
5)
$0.2
1
($0.3
1)
($1.75)
($1.00)
($0.25)
$0.50
$1.25
$2.00
$2.75
$3.50
$4.25
Q1'0
9
Q2'0
9
Q3'0
9
Q4'0
9
Q1'1
0
Q2'1
0
Q3'1
0
Q4'1
0
Q1'1
1
Q2'1
1
Q3'1
1
Q4'1
1
Q1'1
2
Q2'1
2
Q3'1
2
Q4'1
2
Q1'1
3
Q2'1
3
Q3'1
3
Q4'1
3
Q1'1
4
$ p
er
Bb
l
Generic Crude Oil Contract: CL2-CL1 Average Quarterly Price Differential
($5)
($3)
$0
$3
$5
$8
$10
1/2
/09
3/2
7/0
9
6/1
9/0
9
9/1
1/0
9
12/3
/09
3/1
/10
5/2
1/1
0
8/1
3/1
0
11/4
/10
1/2
7/1
1
4/2
0/1
1
7/1
4/1
1
10/5
/11
12/2
8/1
1
3/2
2/1
2
6/1
4/1
2
9/6
/12
11/2
8/1
2
2/2
2/1
3
5/1
6/1
3
8/8
/13
10/3
0/1
3
1/2
4/1
4
$ p
er
Bb
l
Generic Crude Oil Contract: CL2-CL1 Price Differential
Source for both graphs: Bloomberg, FactSet, and Wells Fargo Securities, LLC estimates Natural Gas Liquids Outlook Note: For more information on the NGL market please refer to our monthly NGL snapshot report. NGL Composite Price Increased In February NGL composite prices averaged $1.16 per gallon in February, an increase from the average NGL composite price in January of $1.11 per gallon. Based on the data provided by the Wells Fargo Commodity Derivatives Group, the forward curve for NGLs is currently averaging $0.97 per gallon in 2014E, $0.91 per gallon in 2015E, $0.88 per gallon in 2016E, and $0.86 per gallon in 2017E.
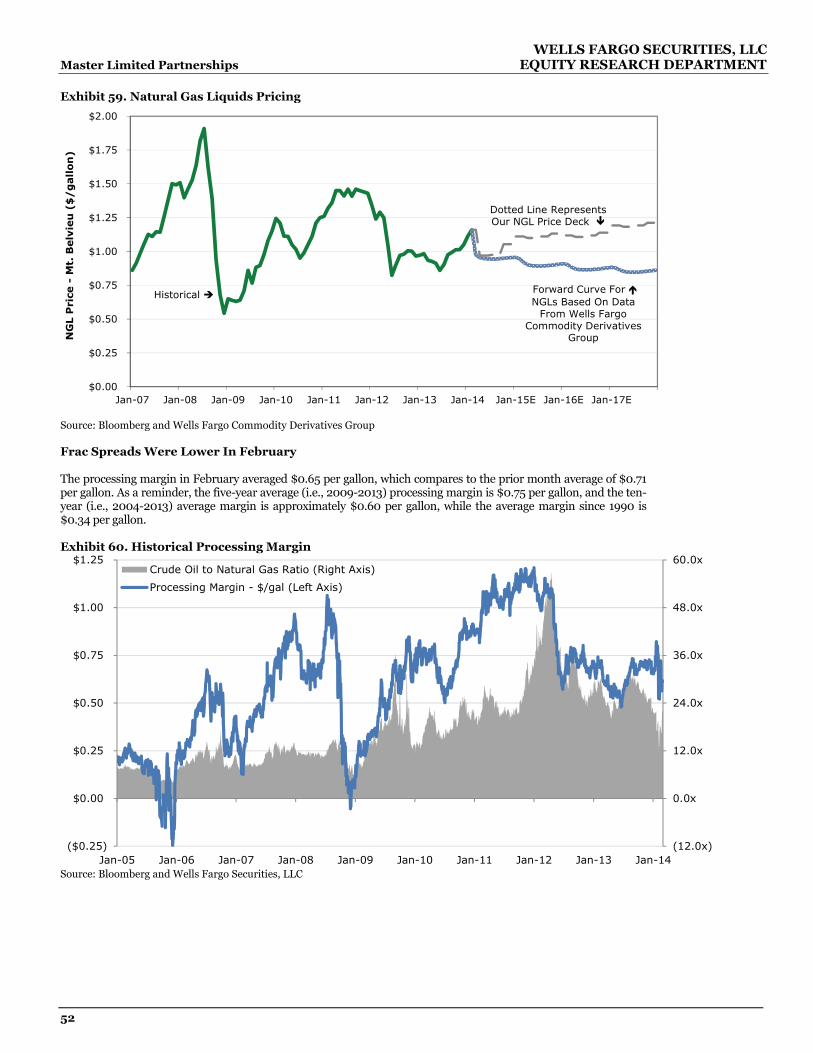
WELLS FARGO SECURITIES, LLC Master Limited Partnerships EQUITY RESEARCH DEPARTMENT
52
Exhibit 59. Natural Gas Liquids Pricing
$0.00
$0.25
$0.50
$0.75
$1.00
$1.25
$1.50
$1.75
$2.00
Jan-07 Jan-08 Jan-09 Jan-10 Jan-11 Jan-12 Jan-13 Jan-14 Jan-15E Jan-16E Jan-17E
NG
L P
rice
-M
t. B
elv
ieu
($
/g
all
on
)
Historical Forward Curve For NGLs Based On Data
From Wells Fargo Commodity Derivatives
Group
Dotted Line RepresentsOur NGL Price Deck
Source: Bloomberg and Wells Fargo Commodity Derivatives Group Frac Spreads Were Lower In February The processing margin in February averaged $0.65 per gallon, which compares to the prior month average of $0.71 per gallon. As a reminder, the five-year average (i.e., 2009-2013) processing margin is $0.75 per gallon, and the ten-year (i.e., 2004-2013) average margin is approximately $0.60 per gallon, while the average margin since 1990 is $0.34 per gallon. Exhibit 60. Historical Processing Margin
(12.0x)
0.0x
12.0x
24.0x
36.0x
48.0x
60.0x
($0.25)
$0.00
$0.25
$0.50
$0.75
$1.00
$1.25
Jan-05 Jan-06 Jan-07 Jan-08 Jan-09 Jan-10 Jan-11 Jan-12 Jan-13 Jan-14
Crude Oil to Natural Gas Ratio (Right Axis)
Processing Margin - $/gal (Left Axis)
Source: Bloomberg and Wells Fargo Securities, LLC

WELLS FARGO SECURITIES, LLC MLP Monthly: March 2014 EQUITY RESEARCH DEPARTMENT
53
Exhibit 61. Histogram Of Historical Frac Spread Since 1990
Min: ($0.90)
Max: $1.21
Median: $0.20
Mean: $0.34
STDev: $0.31
68% of values: $0.03 - 0.65
95% of values: $-0.27 - 0.96
2%
13%
19%
15%
9%
5%
0%
2%
4%
6%
8%
10%
12%
14%
16%
18%
20%
($0.
30)
($0.
25)
($0.
20)
($0.
15)
($0.
10)
($0.
05)
$0.0
0
$0.0
5
$0.1
0
$0.1
5
$0.2
0
$0.2
5
$0.3
0
$0.3
5
$0.4
0
$0.4
5
$0.5
0
$0.5
5
$0.6
0
$0.6
5
$0.7
0
$0.7
5
$0.8
0
$0.8
5
$0.9
0
$0.9
5
$1.0
0
$1.0
5
$1.1
0
$1.1
5
$1.2
0
$1.2
5
Pe
rce
nta
ge O
f T
ota
l O
ccu
ren
ces
Sin
ce 1
99
0
Frac Spread Per $0.05/Gallon Interval
Current Frac
Spread
Source: Bloomberg and Wells Fargo Securities, LLC NGL-To-WTI And NGL-To-Brent Crude Ratios The NGL-to-WTI and NGL-to-Brent crude oil ratios averaged 49% and 45%, respectively, in February, which compares to the prior month’s ratios of 49% and 44%. At the end of the month, the spread between Brent and WTI was $6.10 per Bbl. To note, NGL prices to a large extent track Brent more closely than WTI, in our view, given that a significant portion of overall demand for NGLs is predicated on exports and competition in the global markets (e.g., ethylene derivative and LPG exports). For example, U.S. ethylene-derivative exports compete with ethylene produced by naphtha-based crackers overseas, which is predicated on Brent pricing. Hence, an increase in the Brent-to-WTI premium could result in a higher NGL-to-crude (WTI) ratio, all else being equal. Exhibit 62. Historical NGL-To-Crude-Oil Ratio
30%
40%
50%
60%
70%
80%
Jan-10 May-10 Sep-10 Jan-11 May-11 Sep-11 Jan-12 May-12 Sep-12 Jan-13 May-13 Sep-13 Jan-14
NG
L T
o C
rud
e O
il R
ati
o (
%)
NGL To WTI Crude NGL To Brent Crude
Source: Bloomberg and Wells Fargo Securities, LLC
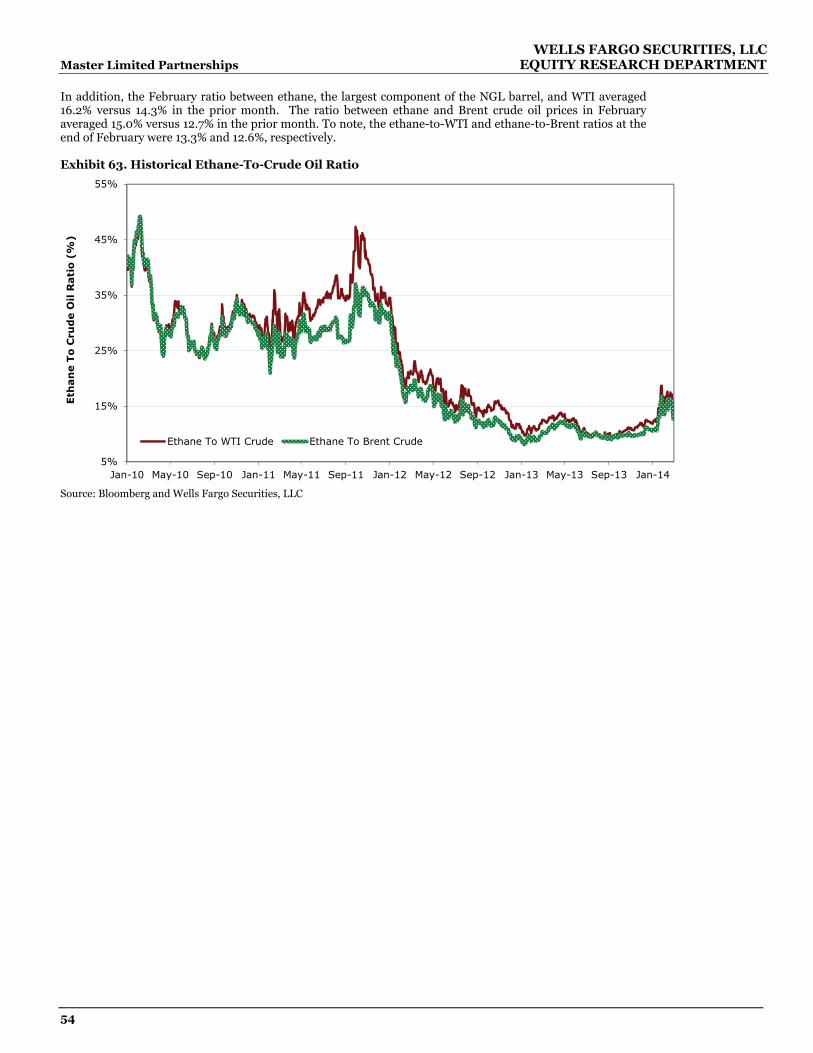
WELLS FARGO SECURITIES, LLC Master Limited Partnerships EQUITY RESEARCH DEPARTMENT
54
In addition, the February ratio between ethane, the largest component of the NGL barrel, and WTI averaged 16.2% versus 14.3% in the prior month. The ratio between ethane and Brent crude oil prices in February averaged 15.0% versus 12.7% in the prior month. To note, the ethane-to-WTI and ethane-to-Brent ratios at the end of February were 13.3% and 12.6%, respectively. Exhibit 63. Historical Ethane-To-Crude Oil Ratio
5%
15%
25%
35%
45%
55%
Jan-10 May-10 Sep-10 Jan-11 May-11 Sep-11 Jan-12 May-12 Sep-12 Jan-13 May-13 Sep-13 Jan-14
Eth
an
e T
o C
rud
e O
il R
ati
o (
%)
Ethane To WTI Crude Ethane To Brent Crude
Source: Bloomberg and Wells Fargo Securities, LLC
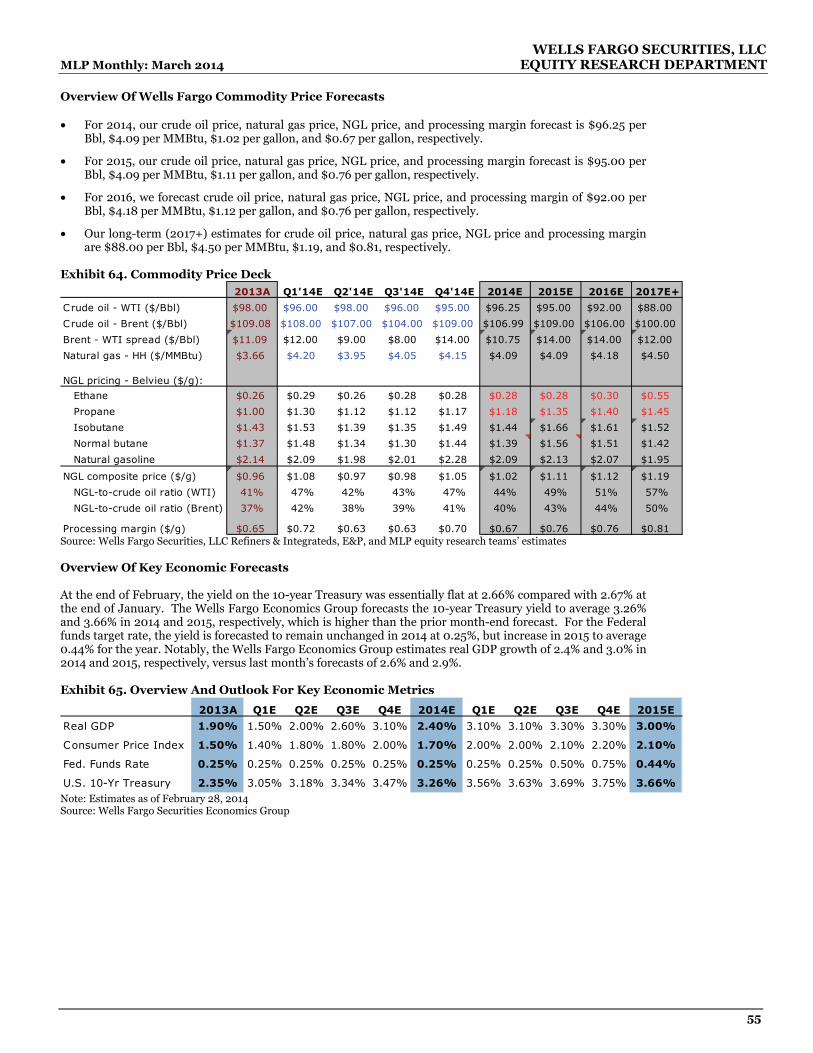
WELLS FARGO SECURITIES, LLC MLP Monthly: March 2014 EQUITY RESEARCH DEPARTMENT
55
Overview Of Wells Fargo Commodity Price Forecasts • For 2014, our crude oil price, natural gas price, NGL price, and processing margin forecast is $96.25 per
Bbl, $4.09 per MMBtu, $1.02 per gallon, and $0.67 per gallon, respectively.
• For 2015, our crude oil price, natural gas price, NGL price, and processing margin forecast is $95.00 per Bbl, $4.09 per MMBtu, $1.11 per gallon, and $0.76 per gallon, respectively.
• For 2016, we forecast crude oil price, natural gas price, NGL price, and processing margin of $92.00 per Bbl, $4.18 per MMBtu, $1.12 per gallon, and $0.76 per gallon, respectively.
• Our long-term (2017+) estimates for crude oil price, natural gas price, NGL price and processing margin are $88.00 per Bbl, $4.50 per MMBtu, $1.19, and $0.81, respectively.
Exhibit 64. Commodity Price Deck
2013A Q1'14E Q2'14E Q3'14E Q4'14E 2014E 2015E 2016E 2017E+
Crude oil - WTI ($/Bbl) $98.00 $96.00 $98.00 $96.00 $95.00 $96.25 $95.00 $92.00 $88.00
Crude oil - Brent ($/Bbl) $109.08 $108.00 $107.00 $104.00 $109.00 $106.99 $109.00 $106.00 $100.00
Brent - WTI spread ($/Bbl) $11.09 $12.00 $9.00 $8.00 $14.00 $10.75 $14.00 $14.00 $12.00
Natural gas - HH ($/MMBtu) $3.66 $4.20 $3.95 $4.05 $4.15 $4.09 $4.09 $4.18 $4.50
NGL pricing - Belvieu ($/g):
Ethane $0.26 $0.29 $0.26 $0.28 $0.28 $0.28 $0.28 $0.30 $0.55
Propane $1.00 $1.30 $1.12 $1.12 $1.17 $1.18 $1.35 $1.40 $1.45
Isobutane $1.43 $1.53 $1.39 $1.35 $1.49 $1.44 $1.66 $1.61 $1.52
Normal butane $1.37 $1.48 $1.34 $1.30 $1.44 $1.39 $1.56 $1.51 $1.42
Natural gasoline $2.14 $2.09 $1.98 $2.01 $2.28 $2.09 $2.13 $2.07 $1.95
NGL composite price ($/g) $0.96 $1.08 $0.97 $0.98 $1.05 $1.02 $1.11 $1.12 $1.19
NGL-to-crude oil ratio (WTI) 41% 47% 42% 43% 47% 44% 49% 51% 57%
NGL-to-crude oil ratio (Brent) 37% 42% 38% 39% 41% 40% 43% 44% 50%
Processing margin ($/g) $0.65 $0.72 $0.63 $0.63 $0.70 $0.67 $0.76 $0.76 $0.81 Source: Wells Fargo Securities, LLC Refiners & Integrateds, E&P, and MLP equity research teams’ estimates Overview Of Key Economic Forecasts At the end of February, the yield on the 10-year Treasury was essentially flat at 2.66% compared with 2.67% at the end of January. The Wells Fargo Economics Group forecasts the 10-year Treasury yield to average 3.26% and 3.66% in 2014 and 2015, respectively, which is higher than the prior month-end forecast. For the Federal funds target rate, the yield is forecasted to remain unchanged in 2014 at 0.25%, but increase in 2015 to average 0.44% for the year. Notably, the Wells Fargo Economics Group estimates real GDP growth of 2.4% and 3.0% in 2014 and 2015, respectively, versus last month’s forecasts of 2.6% and 2.9%. Exhibit 65. Overview And Outlook For Key Economic Metrics
2013A Q1E Q2E Q3E Q4E 2014E Q1E Q2E Q3E Q4E 2015E
Real GDP 1.90% 1.50% 2.00% 2.60% 3.10% 2.40% 3.10% 3.10% 3.30% 3.30% 3.00%
Consumer Price Index 1.50% 1.40% 1.80% 1.80% 2.00% 1.70% 2.00% 2.00% 2.10% 2.20% 2.10%
Fed. Funds Rate 0.25% 0.25% 0.25% 0.25% 0.25% 0.25% 0.25% 0.25% 0.50% 0.75% 0.44%
U.S. 10-Yr Treasury 2.35% 3.05% 3.18% 3.34% 3.47% 3.26% 3.56% 3.63% 3.69% 3.75% 3.66% Note: Estimates as of February 28, 2014 Source: Wells Fargo Securities Economics Group
WELLS FARGO SECURITIES, LLC Master Limited Partnerships EQUITY RESEARCH DEPARTMENT
56
This page intentionally left blank.
WELLS FARGO SECURITIES, LLC MLP Monthly: March 2014 EQUITY RESEARCH DEPARTMENT
57
Supplemental Tables

WELLS FARGO SECURITIES, LLC Master Limited Partnerships EQUITY RESEARCH DEPARTMENT
58
Exhibit 66. Q4 2013 Distribution Scorecard Q4'12A Q3'13A Q4'13E Q4'13A Percent Variance
($MM, except per unit data) Ticker Distribution Distribution Distribution Distribution Yr/Yr Seq. From Est.
Buckeye Partners, L.P. BPL $1.04 $1.08 $1.09 $1.09 4.8% 1.2% 0.0%Boardw alk Pipeline Partners, LP BWP $0.53 $0.53 $0.53 $0.10 (81.2%) (81.2%) (81.2%)Enbridge Energy Partners, L.P. Class A EEP $0.54 $0.54 $0.54 $0.54 0.0% 0.0% 0.0%El Paso Pipeline Partners, L.P. EPB $0.61 $0.65 $0.65 $0.65 6.6% 0.0% 0.0%Enterprise Products Partners L.P. EPD $0.66 $0.69 $0.70 $0.70 6.1% 1.4% 0.0%Energy Transfer Partners, L.P. ETP $0.89 $0.91 $0.92 $0.92 2.9% 1.7% 0.5%Kinder Morgan Energy Partners, L.P. KMP $1.29 $1.35 $1.36 $1.36 5.4% 0.7% 0.0%Magellan Midstream Partners, L.P. MMP $0.50 $0.56 $0.58 $0.59 17.0% 4.9% 0.4%NuStar Energy L.P. NS $1.10 $1.10 $1.10 $1.10 0.0% 0.0% 0.0%ONEOK Partners, L.P. OKS $0.71 $0.73 $0.73 $0.73 2.8% 0.7% 0.0%Plains All American Pipeline, L.P. PAA $0.56 $0.60 $0.61 $0.62 9.3% 2.5% 0.4%Spectra Energy Partners, LP SEP $0.50 $0.52 $0.55 $0.55 10.4% 5.8% 0.0%Sunoco Logistics Partners L.P. SXL $0.55 $0.63 $0.66 $0.66 21.6% 5.2% 0.4%Williams Partners L.P. WPZ $0.83 $0.88 $0.89 $0.89 7.9% 1.7% 0.0%Large Cap Pipeline Median 5.7% 1.3% 0.0%
Arc Logistics Partners LP ARCX NA NA Not Covered $0.39 NA NA Not CoveredBlueknight Energy Partners, L.P. BKEP $0.12 $0.12 $0.13 $0.13 10.0% 3.3% 1.2%Crestw ood Midstream Partners LP CMLP $0.39 $0.41 $0.41 $0.41 5.1% 1.2% 0.0%Cheniere Energy Partners, L.P. CQP $0.43 $0.43 Not Covered $0.43 0.0% 0.0% Not CoveredDelek Logistics Partners LP DKL $0.38 $0.41 $0.42 $0.42 10.7% 2.5% (0.6%)Genesis Energy, L.P. GEL $0.49 $0.52 $0.54 $0.54 10.3% 2.4% 0.0%Global Partners LP GLP $0.57 $0.60 $0.61 $0.61 7.5% 2.1% 0.8%Holly Energy Partners, L.P. HEP $0.47 $0.49 $0.50 $0.50 6.4% 1.5% 0.0%Lehigh Gas Partners LP LGP $0.44 $0.50 Not Covered $0.51 17.1% 2.0% Not CoveredMartin Midstream Partners L.P. MMLP $0.77 $0.78 $0.79 $0.79 1.9% 0.3% 0.0%MPLX LP MPLX $0.26 $0.30 $0.31 $0.31 19.0% 5.0% 0.8%NGL Energy Partners LP NGL $0.46 $0.51 $0.53 $0.53 14.9% 3.9% 0.5%Niska Gas Storage Partners LLC NKA $0.35 $0.35 $0.35 $0.35 0.0% 0.0% 0.0%Oiltanking Partners, L.P. OILT $0.39 $0.45 Not Covered $0.47 20.5% 5.6% Not CoveredPhillips 66 Partners LP PSXP NA $0.21 Not Covered $0.22 NA 5.8% Not CoveredRose Rock Midstream, L.P. RRMS $0.40 $0.45 Not Covered $0.47 15.5% 3.3% Not CoveredSusser Petroleum Partners LP SUSP $0.44 $0.47 $0.48 $0.49 10.9% 3.5% 0.8%TC PipeLines, LP TCP $0.78 $0.81 $0.81 $0.81 3.8% 0.0% 0.0%Tesoro Logistics LP TLLP $0.47 $0.55 $0.57 $0.57 19.6% 3.7% (0.9%)TransMontaigne Partners L.P. TLP $0.64 $0.65 Not Covered $0.65 1.6% 0.0% Not CoveredValero Energy Partners LP VLP NA $0.21 $0.21 $0.21 NA 0.0% 0.0%Western Refining Logistics, LP WNRL NA NA $0.29 $0.29 NA NA 0.0%World Point Terminals LP WPT NA $0.30 Not Covered $0.30 NA 0.0% Not CoveredSmall Cap Pipeline MLP Median 10.2% 2.1% 0.0%
Exterran Partners, L.P. EXLP $0.51 $0.53 $0.53 $0.53 3.9% 0.9% 0.0%Compressco Partners, L.P. GSJK $0.42 $0.43 Not Covered $0.44 4.2% 1.7% Not CoveredHi-Crush Partners LP HCLP $0.48 $0.49 Not Covered $0.51 7.4% 4.1% Not CoveredUSA Compression Partners LP USAC $0.43 $0.46 $0.47 $0.48 12.9% 4.3% 2.1%Oilfield Services MLP Median 5.8% 2.9% 1.1%
Access Midstream Partners, L.P. ACMP $0.45 $0.54 $0.54 $0.56 23.3% 3.7% 3.3%American Midstream Partners, LP AMID $0.43 $0.45 $0.45 $0.45 4.6% 0.0% 0.0%Atlas Pipeline Partners, L.P. APL $0.58 $0.62 $0.63 $0.62 6.9% 0.0% (0.8%)DCP Midstream Partners, LP DPM $0.69 $0.72 $0.73 $0.73 6.2% 1.7% 0.3%EQT Midstream Partners LP EQM $0.35 $0.43 $0.46 $0.46 31.4% 7.0% 0.0%Marlin Midstream Partners LP FISH NA $0.35 Not Covered $0.35 NA 0.0% Not CoveredMidcoast Energy Partners LP Class A MEP NA NA $0.31 $0.31 NA NA 0.0%MarkWest Energy Partners, L.P. MWE $0.82 $0.85 $0.86 $0.86 4.9% 1.2% 0.0%Targa Resources Partners LP NGLS $0.68 $0.73 $0.75 $0.75 9.9% 2.0% (0.3%)PVR Partners, L.P. PVR $0.55 $0.55 $0.55 $0.55 0.0% 0.0% 0.0%QEP Midstream Partners LP QEPM NA $0.25 $0.25 $0.26 NA 4.0% 4.0%Regency Energy Partners LP RGP $0.46 $0.47 $0.48 $0.48 3.3% 1.1% 0.0%Summit Midstream Partners LP SMLP $0.41 $0.46 Not Covered $0.48 17.1% 4.3% Not CoveredSouthcross Energy Partners, L.P. SXE $0.40 $0.40 $0.40 $0.40 0.0% 0.0% 0.0%Tallgrass Energy Partners LP TEP NA $0.30 Not Covered $0.32 NA 5.9% Not CoveredWestern Gas Partners, LP WES $0.52 $0.58 $0.60 $0.60 15.4% 3.4% 0.0%Crosstex Energy, L.P. XTEX $0.33 $0.34 $0.36 $0.36 9.1% 5.9% 1.4%Gathering & Processing Median 6.9% 1.9% 0.0%
Smal
l-Cap
Mid
stre
am M
LPs
Gat
herin
g &
Pro
cess
ing
Larg
e-C
ap P
ipel
ine
MLP
sO
ilfie
ld
Svc.
Continued on next page Note: On 3/10/14, the tickers for XTEX and XTXI were changed to ENLK and ENLC, respectively Source: Partnership Reports and Wells Fargo Securities, LLC estimates

WELLS FARGO SECURITIES, LLC MLP Monthly: March 2014 EQUITY RESEARCH DEPARTMENT
59
Q4'12A Q3'13A Q4'13E Q4'13A Percent Variance($MM, except per unit data) Ticker Distribution Distribution Distribution Distribution Yr/Yr Seq. From Est.
Atlas Resource Partners, L.P. ARP $0.48 $0.56 $0.60 $0.58 20.8% 3.6% (3.3%)BreitBurn Energy Partners L.P. BBEP $0.47 $0.49 $0.49 $0.49 4.8% 1.0% 0.0%Eagle Rock Energy Partners, L.P. EROC $0.22 $0.15 $0.15 $0.15 (31.8%) 0.0% 0.0%EV Energy Partners, L.P. EVEP $0.77 $0.77 $0.77 $0.77 0.5% 0.1% 0.0%Legacy Reserves LP LGCY $0.57 $0.59 $0.59 $0.59 3.5% 0.9% 0.0%Linn Energy, LLC LINE $0.73 $0.73 $0.73 $0.73 0.0% 0.0% 0.0%LinnCo. LLC LNCO $0.71 $0.73 $0.73 $0.73 2.1% 0.0% 0.0%LRR Energy, L.P. LRE $0.48 $0.49 $0.49 $0.49 2.1% 0.5% 0.0%Mid-Con Energy Partners, LP MCEP $0.50 $0.52 $0.52 $0.52 4.0% 0.0% 0.0%Memorial Production Partners LP MEMP $0.51 $0.55 $0.55 $0.55 8.4% 0.0% 0.0%New Source Energy Partners LP NSLP $0.53 $0.58 Not Covered $0.58 9.5% 0.0% Not CoveredQR Energy, LP QRE $0.49 $0.49 $0.49 $0.49 0.0% 0.0% 0.0%Vanguard Natural Resources, LLC VNR $0.61 $0.62 $0.63 $0.62 2.5% 0.0% (0.4%)Upstream MLP Median 2.5% 0.0% 0.0%
AmeriGas Partners, L.P. APU $0.80 $0.84 $0.84 $0.84 5.0% 0.0% 0.0%Ferrellgas Partners, L.P. FGP $0.50 $0.50 Not Covered $0.50 0.0% 0.0% Not CoveredStar Gas Partners, L.P. SGU $0.08 $0.08 Not Covered $0.08 6.5% 0.0% Not CoveredSuburban Propane Partners, L.P. SPH $0.88 $0.88 $0.90 $0.88 0.0% 0.0% (2.8%)Propane MLP Median 2.5% 0.0% (1.4%)
Capital Product Partners LP CPLP $0.23 $0.23 $0.23 $0.23 0.0% 0.0% 0.0%Golar LNG Partners LP GMLP $0.50 $0.52 $0.52 $0.52 4.5% 0.0% 1.5%KNOT Offshore Partners LP KNOP NA $0.44 Not Covered $0.44 NA 0.0% Not CoveredNavios Maritime Partners LP NMM $0.44 $0.44 $0.44 $0.44 0.0% 0.0% 0.0%Seadrill Partners LLC SDLP $0.39 $0.43 $0.45 $0.45 14.8% 4.1% 0.0%Teekay LNG Partners L.P. TGP $0.68 $0.68 $0.68 $0.69 2.5% 2.5% 1.8%Teekay Offshore Partners L.P. TOO $0.51 $0.53 $0.53 $0.54 5.1% 2.5% 2.5%Shipping MLP Median 3.5% 0.0% 0.7%
Alliance Resource Partners, L.P. ARLP $1.11 $1.18 $1.20 $1.20 8.1% 1.9% (0.1%)Natural Resource Partners L.P. NRP $0.55 $0.55 $0.55 $0.35 (36.4%) (36.4%) (36.4%)Oxford Resource Partners, LP OXF $0.00 $0.00 $0.00 $0.00 NA NA NARhino Resource Partners LP RNO $0.45 $0.45 Not Covered $0.45 0.0% 0.0% Not CoveredCoal MLP Median 0.0% 0.0% (18.2%)
Alon USA Partners LP ALDW $0.57 $0.00 Not Covered $0.18 (68.4%) NA Not CoveredCalumet Specialty Products Partners, L.P. CLMT $0.65 $0.69 Not Covered $0.69 5.4% 0.0% Not CoveredCVR Refining LP CVRR NA $0.30 Not Covered $0.45 NA 50.0% Not CoveredEmerge Energy Services LP EMES NA $0.86 Not Covered $1.00 NA 16.3% Not CoveredNorthern Tier Energy LP Class A NTI $1.27 $0.31 Not Covered $0.41 (67.7%) 32.3% Not CoveredOCI Partners LP OCIP NA $0.00 Not Covered $0.00 NA NA Not CoveredPetroLogistics LP PDH $0.28 $0.45 Not Covered $0.30 7.1% (33.3%) Not CoveredRentech Nitrogen Partners, L.P. RNF $0.75 $0.27 Not Covered $0.05 (93.3%) (81.5%) Not CoveredSunCoke Energy Partners LP SXCP $0.41 $0.43 Not Covered $0.48 15.2% 9.8% Not CoveredTerra Nitrogen Company, L.P. TNH $3.63 $2.02 Not Covered $2.10 (42.1%) 4.0% Not CoveredCVR Partners, LP UAN $0.19 $0.36 Not Covered $0.43 124.0% 19.4% Not CoveredNon-Traditional MLP Median (18.4%) 9.8%
Alliance Holdings GP, L.P. AHGP $0.74 $0.81 $0.83 $0.83 11.8% 2.5% (0.5%)Atlas Energy, L.P. ATLS $0.30 $0.46 $0.50 $0.46 53.3% 0.0% (7.5%)Crestw ood Equity Partners LP CEQP $0.29 $0.14 $0.14 $0.14 (52.6%) 1.9% 1.9%Energy Transfer Equity, L.P. ETE $0.32 $0.34 $0.34 $0.35 9.1% 3.0% 1.5%NuStar GP Holdings, LLC NSH $0.55 $0.55 $0.55 $0.55 0.0% 0.0% 0.0%Western Gas Equity Partners LP WGP $0.17 $0.21 $0.23 $0.23 40.2% 8.2% 1.6%General Partner (MLP) Median 10.4% 2.2% 0.7%
Enbridge Inc. ENB NA NA Not Covered Not Covered NA NA Not CoveredKinder Morgan, Inc. Class P KMI $0.37 $0.41 $0.41 $0.41 10.8% 0.0% 0.0%ONEOK, Inc. OKE $0.36 $0.38 $0.40 $0.40 11.1% 5.3% 0.0%Plains GP Holdings LP Class A PAGP NA $0.15 $0.15 $0.16 NA 7.2% 7.2%Spectra Energy Corp SE NA NA Not Covered Not Covered NA NA Not CoveredSemGroup Corporation Class A SEMG NA NA Not Covered Not Covered NA NA Not CoveredTeekay Corporation TK NA NA Not Covered Not Covered NA NA Not CoveredTarga Resources Corp. TRGP $0.46 $0.57 $0.61 $0.61 32.8% 6.6% 0.0%TransCanada Corporation TRP NA NA Not Covered Not Covered NA NA Not CoveredThe Williams Companies, Inc. WMB $0.33 $0.37 $0.38 $0.40 23.8% 9.9% 5.9%Crosstex Energy, Inc. XTXI $0.12 $0.13 $0.14 $0.15 25.0% 15.4% 7.1%General Partner (C-Corp) Median 23.8% 6.9% 3.0%
All MLPs Median 5.1% 1.2% 0.0%All MLPs (Excl. GPs) Median 5.1% 1.2% 0.0%
MLP
GPs
C-C
orp
GPs
Non
-Tra
ditio
nal
Coa
lSh
ipPr
opan
eU
pstr
eam
Note: On 3/10/14, the tickers for XTEX and XTXI were changed to ENLK and ENLC, respectively Source: Partnership Reports and Wells Fargo Securities, LLC estimates

WELLS FARGO SECURITIES, LLC Master Limited Partnerships EQUITY RESEARCH DEPARTMENT
60
Exhibit 67. Midstream MLP Exposure To Major Producing Regions
Tick
er
Barnett
Bossier
Cotton Vall
ey DJ Bas
inHay
nesvil
le Fayett
eville Powde
r Rive
rMar
cellu
s Uinta
Utica
San Ju
anWoodford
/ Ark
oma
Anadark
o / Hugo
ton
Eagle
Ford Granite
Was
hMiss
issippi
Lime
Offshore
Gas Piceance
Jonah
/ Pined
ale
Permian
Brown D
ense Eag
le Ford
Four C
orne
rs Monterrey Offs
hore Oil Niobrar
aPer
mian Willi
ston / B
akke
nTotal
AC
MP
GG
GG
-PG
GG
GG
G10
AM
IDG
G-P
2
APL
TG
-PG
-PG
-PG
-PG
-P-T
6
BKEP
T1
BWP
TT
TT
GT
G-P
7
CM
LPG
-PG
GG
-PG
5
DKL
G1
DPM
GG
-PG
-PG
4
EEP
G-P
-TG
-P-T
GG
-P-T
G-P
-TT
6
EPB
TT
TT
T5
EPD
G-T
G-T
TG
-P-T
G-P
-TG
-P-T
G-P
-TG
-P-T
TT
T11
EQM
G-T
1
ERO
CG
GG
-P3
ETP
G-P
-TG
-P-T
G-T
TG
G-P
-TT
G-P
-TT
G-P
-TG
-P-T
G-P
-T12
GEL
TT
2
GLP
G1
HEP
G1
KMP
G-P
-TG
-TG
GT
TG
-PT
TT
G-P
-TT
P-T
T14
MM
PT
T2
MW
EG
-PG
G-P
G-P
G-P
-TG
G-P
7
NGLS
G-P
G-P
G-P
G4
NRG
MT
T2
NST
1
OKS
TG
-TG
-P-T
G-P
G-P
-TG
-P-T
TT
TG
-P-T
10
PAA
TT
G-T
TT
TG
-TG
-T8
PVR
G-T
GG
-P3
QEP
MG
G-T
G3
RGP
TG
-P-T
TG
G-P
5
RRM
SG
-PT
G-T
3
SEP
G-T
T2
SMLP
GG
2
SXE
G-P
1
SXL
T1
TCP
T1
TEP
TP-
TT
3
TLLP
G-T
1
WES
GG
G-P
G-P
-TG
PG
PG
-PG
10
WNR
LG
-TG
-T2
WPZ
TT
TG
-P-T
G-P
G-P
-TP-
TG
-P-T
G-P
-TG
-P-T
T11
XTEX
G-P
-TG
-TG
-TG
-PP
P6
# G
athe
r9
54
19
23
93
32
65
127
34
54
81
00
02
37
117
# Pr
oces
s6
21
11
02
23
32
43
106
35
33
70
00
00
01
68
# Tr
ansp
ort
94
13
74
56
21
46
44
33
16
36
06
13
36
610
7
# To
tal
136
44
125
612
54
49
814
85
58
411
16
13
57
917
9
Le
ge
nd
:
T -
Tra
nsp
ort
ati
on
(Le
ast
Ris
ky
)
G -
Ga
the
rin
g
P -
Pro
ce
ssin
g (
Mo
st
Ris
ky
)
Dry
/ Mod
estly
Wet
Gas
Pla
ysNG
L-Ri
ch G
as P
lays
Oil
Play
s
Note: On 3/10/14, the tickers for XTEX and XTXI were changed to ENLK and ENLC, respectively Source: Partnership reports and Wells Fargo Securities, LLC
WELLS FARGO SECURITIES, LLC MLP Monthly: March 2014 EQUITY RESEARCH DEPARTMENT
61
Comp Tables

WELLS FARGO SECURITIES, LLC Master Limited Partnerships EQUITY RESEARCH DEPARTMENT
62
Market Data (All MLPs)Price Current 52-Week Market Enterprise 3-Month Tax Form: Primary
($MM, except per unit data) Ticker 2/28/2014 Distribution Low High Cap Value Avg. Vol. Est. Deferral Analyst
NuStar Energy L.P. NS $49.92 8.8% $4.38 $36.15 $54.95 $3,888 $6,282 438,369 K-1: 80% M. BlumEl Paso Pipeline Partners, L.P. EPB $30.05 8.7% $2.60 $29.46 $44.99 $6,551 $10,723 1,124,330 K-1: 80% M. BlumEnbridge Energy Management, L.L.C. EEQ $26.75 8.1% $2.17 $25.29 $31.10 - - 231,950 1099: 0% S. LuiEnbridge Energy Partners, L.P. Class A EEP $27.52 7.9% $2.17 $26.30 $33.49 $8,687 $13,772 846,853 K-1: 100% S. LuiKinder Morgan Management, LLC KMR $69.80 7.8% $5.44 $69.54 $85.13 - - 553,386 1099: 0% M. BlumKinder Morgan Energy Partners, L.P. KMP $74.27 7.3% $5.44 $73.25 $92.99 $31,761 $51,017 1,505,917 K-1: 90% M. BlumWilliams Partners L.P. WPZ $49.61 7.2% $3.57 $45.37 $54.66 $21,267 $29,701 704,851 K-1: 80% S. LuiEnergy Transfer Partners, L.P. ETP $55.53 6.6% $3.68 $45.16 $57.31 $20,874 $38,983 950,523 K-1: 80% M. BlumBuckeye Partners, L.P. BPL $73.23 5.9% $4.35 $55.37 $75.83 $7,819 $10,676 323,121 K-1: 80% M. BlumONEOK Partners, L.P. OKS $53.11 5.5% $2.92 $45.40 $57.84 $12,055 $17,387 456,256 K-1: 80% M. BlumSpectra Energy Partners, LP SEP $47.72 4.6% $2.19 $34.42 $51.00 $5,411 $8,787 207,568 K-1: 80% M. BlumPlains All American Pipeline, L.P. PAA $54.17 4.5% $2.46 $47.26 $59.52 $18,689 $26,326 1,055,246 K-1: 80% M. BlumEnterprise Products Partners L.P. EPD $67.11 4.2% $2.80 $55.31 $68.10 $60,471 $77,244 1,006,974 K-1: 90% M. BlumMagellan Midstream Partners, L.P. MMP $67.67 3.5% $2.34 $48.36 $70.99 $15,352 $17,589 508,828 K-1: 80% S. LuiBoardw alk Pipeline Partners, LP BWP $12.31 3.2% $0.40 $12.18 $33.00 $2,994 $6,328 2,071,720 K-1: 80% S. LuiSunoco Logistics Partners L.P. SXL $82.74 3.2% $2.65 $57.75 $83.82 $8,630 $10,941 191,746 K-1: 80% M. BlumLarge Cap Pipeline MLP Median 6.3% $10,371 $15,579 629,118 80%
Niska Gas Storage Partners LLC NKA $13.24 10.6% $1.40 $11.30 $17.00 $459 $1,103 129,500 K-1: 80% M. BlumArc Logistics Partners LP ARCX $20.15 7.7% $1.55 $18.69 $22.27 $245 $281 35,247 K-1: 70% Not CoveredLehigh Gas Partners LP LGP $26.72 7.5% $2.01 $20.46 $29.18 $402 $713 79,513 K-1: 60% Not CoveredMartin Midstream Partners L.P. MMLP $42.07 7.5% $3.14 $34.00 $48.90 $1,118 $1,769 84,205 K-1: 80% M. BlumCrestw ood Midstream Partners LP CMLP $22.39 7.3% $1.64 $20.40 $26.01 $2,170 $2,707 967,627 K-1: 80% M. BlumTC PipeLines, LP TCP $46.62 6.9% $3.24 $42.16 $52.61 $2,904 $4,455 130,809 K-1: 80% M. BlumGlobal Partners LP GLP $38.26 6.4% $2.45 $30.01 $40.99 $1,046 $1,929 27,512 K-1: 80% M. BlumTransMontaigne Partners L.P. TLP $41.30 6.3% $2.60 $38.70 $50.77 $672 $870 23,607 K-1: 80% SuspendedCheniere Energy Partners, L.P. CQP $28.44 6.0% $1.70 $23.70 $33.00 $9,644 $15,642 206,473 K-1: 80% Not CoveredHolly Energy Partners, L.P. HEP $33.60 6.0% $2.00 $29.55 $44.90 $1,971 $2,780 83,821 K-1: 75% M. BlumNGL Energy Partners LP NGL $36.26 5.9% $2.13 $23.80 $36.96 $2,351 $3,265 226,272 K-1: 80% M. BlumWorld Point Terminals LP WPT $21.00 5.7% $1.20 $17.26 $22.00 $692 $692 25,479 K-1: 80% Not CoveredBlueknight Energy Partners, L.P. BKEP $9.03 5.6% $0.51 $7.50 $9.50 $205 $479 31,043 K-1: 80% M. BlumSusser Petroleum Partners LP SUSP $35.41 5.5% $1.94 $26.80 $37.25 $776 $960 25,386 K-1: 55% S. LuiDelek Logistics Partners LP DKL $33.80 4.9% $1.66 $27.50 $35.96 $818 $979 70,452 K-1: 80% M. BlumRose Rock Midstream, L.P. RRMS $38.92 4.8% $1.86 $31.49 $42.18 $1,016 $1,020 40,221 K-1: 80% Not CoveredTallgrass Energy Partners LP TEP $31.33 4.0% $1.26 $20.53 $31.50 $1,256 $1,391 50,812 K-1: 80% Not CoveredWestern Refining Logistics, LP WNRL $29.25 3.9% $1.15 $23.12 $29.66 $1,334 $1,334 58,273 K-1: 80% M. BlumGenesis Energy, L.P. GEL $55.00 3.9% $2.14 $44.04 $56.80 $4,613 $5,725 220,183 K-1: 90% M. BlumTesoro Logistics LP TLLP $60.20 3.8% $2.26 $47.40 $71.92 $2,834 $3,743 331,355 K-1: 80% S. LuiOiltanking Partners, L.P. OILT $69.21 2.7% $1.88 $43.78 $70.48 $2,843 $3,017 49,024 K-1: 80% Not CoveredMPLX LP MPLX $48.81 2.6% $1.25 $32.53 $50.75 $3,607 $3,618 104,377 K-1: 80% M. BlumValero Energy Partners LP VLP $36.99 2.3% $0.85 $27.50 $40.60 $2,130 $2,130 402,402 K-1: 80% M. BlumPhillips 66 Partners LP PSXP $45.82 2.0% $0.90 $28.10 $48.58 $3,221 $3,221 138,683 K-1: 80% Not CoveredSmall Cap Midstream MLP Median 5.7% $1,295 $1,849 81,667 80%
Compressco Partners, L.P. GSJK $23.29 7.5% $1.75 $18.07 $25.72 $362 $376 9,719 K-1: 80% Not CoveredExterran Partners, L.P. EXLP $30.00 7.1% $2.13 $23.40 $32.39 $1,483 $2,203 100,508 K-1: 80% S. LuiUSA Compression Partners LP USAC $27.26 7.0% $1.92 $18.32 $28.73 $873 $1,264 43,130 K-1: 80% S. LuiHi-Crush Partners LP HCLP $37.65 5.4% $2.04 $17.44 $39.98 $1,098 $1,229 153,640 K-1: 40% Not CoveredOilfield Services MLP Median 7.1% $986 $1,246 71,819 80%
Southcross Energy Partners, L.P. SXE $17.60 9.1% $1.60 $16.16 $26.49 $430 $689 163,322 K-1: 80% M. BlumPVR Partners, L.P. PVR $26.84 8.2% $2.20 $22.08 $29.26 $2,603 $4,236 435,635 K-1: 80% M. BlumAtlas Pipeline Partners, L.P. APL $30.74 8.1% $2.48 $29.70 $40.06 $2,410 $4,066 593,150 K-1: 80% P. SatishMarlin Midstream Partners LP FISH $18.14 7.7% $1.40 $15.93 $20.25 $317 $318 53,284 K-1: 80% Not CoveredAmerican Midstream Partners, LP AMID $23.52 7.7% $1.81 $15.65 $28.95 $110 $232 111,470 K-1: 80% M. BlumRegency Energy Partners LP RGP $26.25 7.2% $1.90 $23.21 $29.52 $5,501 $8,477 588,235 K-1: 80% M. BlumMidcoast Energy Partners LP Class A MEP $20.46 6.1% $1.25 $16.96 $22.29 $925 $1,260 195,915 K-1: 80% S. LuiDCP Midstream Partners, LP DPM $48.80 6.0% $2.93 $40.61 $58.50 $4,050 $5,851 281,458 K-1: 70% M. BlumTarga Resources Partners LP NGLS $53.69 5.6% $2.99 $40.93 $56.94 $5,745 $8,543 344,077 K-1: 80% M. BlumMarkWest Energy Partners, L.P. MWE $63.85 5.4% $3.44 $55.67 $75.79 $9,089 $12,112 836,852 K-1: 80% M. BlumQEP Midstream Partners LP QEPM $21.37 4.9% $1.04 $21.33 $25.67 $1,141 $1,141 99,394 K-1: 80% M. BlumSummit Midstream Partners LP SMLP $40.58 4.7% $1.92 $22.15 $41.00 $2,147 $2,697 34,998 K-1: 80% Not CoveredCrosstex Energy, L.P. XTEX $30.89 4.7% $1.44 $16.65 $32.62 $3,274 $4,317 284,185 K-1: 80% S. LuiAccess Midstream Partners, L.P. ACMP $56.45 3.9% $2.22 $36.69 $59.19 $10,614 $13,625 423,168 K-1: 80% S. LuiWestern Gas Partners, LP WES $63.29 3.8% $2.40 $53.55 $65.16 $7,098 $8,616 294,450 K-1: 80% S. LuiEQT Midstream Partners LP EQM $65.91 2.8% $1.84 $35.26 $67.80 $2,942 $2,942 112,274 K-1: 80% M. BlumGathering & Processing MLP Median 5.8% $2,773 $4,151 282,821 80%
Eagle Rock Energy Partners, L.P. EROC $4.85 12.4% $0.60 $4.78 $10.52 $757 $1,956 1,000,693 K-1: 80% P. SatishLRR Energy, L.P. LRE $17.07 11.5% $1.96 $13.13 $18.45 $447 $692 104,127 K-1: 70% P. SatishQR Energy, LP QRE $17.54 11.1% $1.95 $14.76 $18.46 $1,427 $2,324 289,281 K-1: 80% P. SatishAtlas Resource Partners, L.P. ARP $21.66 10.7% $2.32 $18.30 $25.71 $1,487 $2,435 354,946 K-1: 90% SuspendedBreitBurn Energy Partners L.P. BBEP $19.99 9.9% $1.97 $14.01 $21.36 $2,053 $3,898 749,278 K-1: 75% P. SatishMemorial Production Partners LP MEMP $22.34 9.8% $2.20 $18.12 $22.85 $995 $1,488 446,424 K-1: 75% P. SatishLinnCo. LLC LNCO $30.48 9.5% $2.90 $23.03 $44.20 $1,060 $1,060 1,691,700 1099: 70% P. SatishNew Source Energy Partners LP NSLP $24.27 9.5% $2.30 $19.33 $25.00 $213 $280 27,859 K-1: 60% Not CoveredLinn Energy, LLC LINE $31.87 9.1% $2.90 $20.35 $39.47 $7,443 $13,956 1,764,700 K-1: 100% P. SatishLegacy Reserves LP LGCY $26.40 8.9% $2.36 $24.62 $29.49 $1,512 $2,356 143,415 K-1: 70% P. SatishEV Energy Partners, L.P. EVEP $35.08 8.8% $3.08 $30.53 $57.44 $1,494 $2,579 287,209 K-1: 75% P. SatishMid-Con Energy Partners, LP MCEP $23.57 8.7% $2.06 $21.04 $27.05 $455 $567 64,990 K-1: 60% P. SatishVanguard Natural Resources, LLC VNR $29.86 8.3% $2.49 $24.23 $31.50 $2,334 $3,292 389,388 K-1: 75% P. SatishUpstream MLP Median 9.5% $1,427 $2,324 354,946 75%
Suburban Propane Partners, L.P. SPH $43.08 8.1% $3.50 $41.01 $50.25 $2,600 $3,845 173,229 K-1: 80% S. LuiAmeriGas Partners, L.P. APU $42.37 7.9% $3.36 $41.11 $50.45 $3,934 $6,222 416,934 K-1: 75% S. LuiFerrellgas Partners, L.P. FGP $25.51 7.8% $2.00 $18.10 $25.67 $1,994 $3,315 172,213 K-1: 90% SuspendedStar Gas Partners, L.P. SGU $5.65 5.8% $0.33 $4.32 $5.94 $324 $466 71,927 K-1: 80% Not CoveredPropane MLP Median 7.9% $2,297 $3,580 172,721 80%
Navios Maritime Partners LP NMM $17.10 10.4% $1.77 $13.22 $19.70 $1,239 $1,584 638,876 1099: 31% M. WebberCapital Product Partners LP CPLP $10.76 8.6% $0.93 $7.55 $10.85 $1,073 $1,653 312,998 1099: 60% M. WebberGolar LNG Partners LP GMLP $30.21 6.9% $2.09 $27.55 $36.00 $1,707 $2,813 306,356 1099: 30% M. WebberTeekay LNG Partners L.P. TGP $41.67 6.6% $2.77 $38.12 $45.42 $2,936 $5,181 155,808 K-1: 70% M. WebberTeekay Offshore Partners L.P. TOO $32.76 6.6% $2.15 $27.56 $36.09 $2,742 $3,001 143,745 1099: 70% M. WebberKNOT Offshore Partners LP KNOP $28.75 6.1% $1.74 $20.68 $29.52 $492 $812 19,597 1099: 70% Not CoveredSeadrill Partners LLC SDLP $31.41 5.7% $1.78 $26.20 $34.30 $1,299 $2,520 268,588 1099: 80% M. WebberMarine MLP Median 6.6% $1,299 $2,520 268,588 70%
Rhino Resource Partners LP RNO $12.56 14.2% $1.78 $9.81 $14.83 $363 $534 91,972 K-1: 60% Not CoveredNatural Resource Partners L.P. NRP $15.12 9.3% $1.40 $14.80 $24.37 $1,660 $3,137 382,370 K-1: 65% S. DubinskyAlliance Resource Partners, L.P. ARLP $86.16 5.6% $4.79 $61.12 $86.76 $3,185 $3,971 72,207 K-1: 80% S. DubinskyOxford Resource Partners, LP OXF $1.18 0.0% $0.00 $1.08 $3.45 $29 $187 90,917 K-1: 75% S. DubinskyCoal MLP Median 9.3% $1,012 $1,835 91,445 70%
Calumet Specialty Products Partners, L.P CLMT $25.47 10.8% $2.74 $24.84 $40.25 $1,774 $2,764 413,789 K-1: 75% Not CoveredPetroLogistics LP PDH $12.91 9.3% $1.20 $10.37 $16.00 $1,752 $2,062 335,281 K-1: 80% Not CoveredEmerge Energy Services LP EMES $45.75 8.7% $4.00 $16.44 $47.98 $1,058 $1,142 123,222 K-1: 35% M. ConlanOCI Partners LP OCIP $24.76 8.4% $2.07 $16.08 $28.73 $1,975 $2,436 96,123 K-1: 70% Not CoveredCVR Partners, LP UAN $19.85 7.3% $1.44 $15.11 $27.50 $1,459 $1,456 347,303 K-1: 50% Not CoveredNorthern Tier Energy LP Class A NTI $24.18 6.8% $1.64 $17.83 $33.24 $2,218 $2,228 616,579 K-1: 50% Not CoveredCypress Energy Partners LP CELP $23.89 6.5% $1.55 $19.55 $26.00 $2 $85 152,220 K-1: 80% Not CoveredSunCoke Energy Partners LP SXCP $30.80 6.2% $1.90 $19.60 $31.86 $980 $1,308 40,646 K-1: 70% Not CoveredRentech Nitrogen Partners, L.P. RNF $18.43 5.9% $1.08 $16.90 $41.48 $734 $969 223,365 K-1: 60% Not CoveredCVR Refining LP CVRR $20.88 5.7% $1.20 $20.30 $35.98 $3,125 $3,745 431,757 K-1: 50% Not CoveredTerra Nitrogen Company, L.P. TNH $165.16 4.9% $8.08 $132.51 $237.00 $3,106 $3,019 39,911 K-1: 0% Not CoveredAlon USA Partners LP ALDW $14.24 0.0% $0.00 $10.25 $27.95 $911 $1,175 218,022 K-1: 50% Not CoveredNon-Traditional MLP Median 6.8% $1,605 $1,759 220,694 60%
NuStar GP Holdings, LLC NSH $30.04 7.3% $2.18 $19.34 $34.17 $1,280 $1,306 164,633 K-1: 80% M. BlumAlliance Holdings GP, L.P. AHGP $62.20 5.3% $3.31 $50.01 $66.27 $3,723 $3,723 38,915 K-1: 50% S. DubinskyAtlas Energy, L.P. ATLS $42.45 4.3% $1.84 $40.52 $55.89 $2,181 $2,403 354,320 K-1: 75% P. SatishCrestw ood Equity Partners LP CEQP $13.41 4.1% $0.55 $11.20 $16.89 $2,295 $2,685 455,659 K-1: 50% M. BlumEnergy Transfer Equity, L.P. ETE $43.65 3.2% $1.39 $26.20 $44.53 $24,505 $27,190 1,615,560 K-1: 60% M. BlumWestern Gas Equity Partners LP WGP $42.98 2.2% $0.93 $31.82 $44.27 $9,408 $9,408 129,299 K-1: 70% S. LuiGeneral Partner (MLP) Median 4.2% $3,009 $3,204 259,477 65%
Kinder Morgan, Inc. Class P KMI $31.85 5.1% $1.64 $31.45 $41.49 $33,968 $43,987 6,848,206 1099: 0% M. BlumTransCanada Corporation TRP $44.03 3.9% $1.73 $42.21 $49.65 $31,234 $57,838 545,959 1099: 0% Not CoveredWilliams Companies, Inc. WMB $41.30 3.9% $1.61 $31.25 $42.47 $28,386 $35,819 8,144,800 1099: 0% S. LuiSpectra Energy Corp SE $37.28 3.6% $1.35 $28.54 $38.73 $24,743 $38,869 3,093,387 1099: 0% Not CoveredEnbridge Inc. ENB $42.29 3.1% $1.31 $39.69 $48.41 $35,081 $68,303 939,679 1099: 0% Not CoveredONEOK, Inc. OKE $59.14 2.7% $1.60 $34.48 $61.78 $12,413 $14,689 1,614,404 1099: 0% M. BlumTarga Resources Corp. TRGP $96.76 2.5% $2.43 $60.01 $98.64 $4,115 $6,983 281,768 1099: 0% M. BlumPlains GP Holdings LP Class A PAGP $28.00 2.3% $0.64 $21.50 $28.54 $16,969 $17,469 822,909 1099: 100% M. BlumTeekay Corporation TK $59.75 2.1% $1.28 $32.69 $60.26 $4,172 $11,342 421,189 1099: 0% Not CoveredCrosstex Energy, Inc. XTXI $41.63 1.4% $0.60 $15.78 $42.88 $1,988 $2,035 258,601 1099: 0% S. LuiSemGroup Corporation Class A SEMG $67.32 1.3% $0.88 $44.78 $68.50 $2,739 $3,433 489,192 1099: 0% Not CoveredGeneral Partner (C-Corp) Median 2.7% $16,969 $17,469 822,909 0%
All MLPs Average 6.5% $4,276 $5,952 351,954 72%All MLPs Median 6.5% $1,985 $2,691 212,795 80%All MLPs Median (Excluding GPs) 6.6% All MLPs Sum: $443,671 $617,938
Source: Company data, FactSet and Wells Fargo Securities, LLC Date: 2/28/2014
Gat
herin
g &
Pro
cess
ing
MLP
sU
pstr
eam
MLP
sN
on-T
radi
tiona
lM
LP G
PsC
-Cor
p G
PsLa
rge
Cap
Pip
elin
e M
LPs
Prop
ane
Mar
ine
Coa
lSm
all &
Mid
Cap
Mid
stre
amO
ilfie
ld
Serv
.
CurrentYield
Note: On 3/10/14, the tickers for XTEX and XTXI were changed to ENLK and ENLC, respectively

WELLS FARGO SECURITIES, LLC MLP Monthly: March 2014 EQUITY RESEARCH DEPARTMENT
63
Ratings & AssumptionsPrice Valuation Range Our Valuation Assumptions Current Target 3-Yr Est.
Ticker 2/28/2014 Low High Rating ROR LT Growth P/DCF 2 Yield Yield Distrib CAGR
Kinder Morgan Management, LLC KMR $69.80 $81 $86 28% Outperform 8.5% 1.3% 14.5x 7.8% 6.7% 3.5%El Paso Pipeline Partners, L.P. EPB $30.05 $34 $37 27% Market Perform 8.0% 1.3% 12.5x 8.7% 7.3% 1.1%Boardw alk Pipeline Partners, LP BWP $12.31 $13 $16 21% Market Perform 9.5% 1.3% 10.5x 3.2% 2.8% (38.2%)Kinder Morgan Energy Partners, L.P. KMP $74.27 $81 $86 20% Market Perform 8.5% 1.3% 14.5x 7.3% 6.7% 3.5%Williams Partners L.P. WPZ $49.61 $53 $56 17% Outperform 8.5% 1.3% 15.5x 7.2% 6.7% 4.8%Enbridge Energy Management, L.L.C. EEQ $26.75 $28 $30 17% Market Perform 9.0% 1.3% 15.0x 8.1% 7.5% 0.0%NuStar Energy L.P. NS $49.92 $52 $55 16% Market Perform 9.5% 1.5% 13.0x 8.8% 8.2% 0.7%Enbridge Energy Partners, L.P. Class A EEP $27.52 $28 $30 13% Market Perform 9.0% 1.3% 15.0x 7.9% 7.5% 0.0%Magellan Midstream Partners, L.P. MMP $67.67 $72 $76 13% Outperform 7.5% 2.5% 22.0x 3.5% 3.5% 14.9%Energy Transfer Partners, L.P. ETP $55.53 $57 $61 13% Market Perform 9.0% 1.3% 12.0x 6.6% 6.4% 4.2%Plains All American Pipeline, L.P. PAA $54.17 $56 $59 11% Market Perform 7.5% 1.3% 18.0x 4.5% 4.5% 9.1%Enterprise Products Partners L.P. EPD $67.11 $69 $73 10% Outperform 7.5% 2.5% 17.0x 4.2% 4.1% 6.6%ONEOK Partners, L.P. OKS $53.11 $52 $56 7% Market Perform / V 8.5% 1.3% 16.0x 5.5% 5.6% 7.1%Buckeye Partners, L.P. BPL $73.23 $70 $74 4% Market Perform 9.5% 2.5% 15.5x 5.9% 6.2% 5.1%Sunoco Logistics Partners L.P. SXL $82.74 $80 $84 3% Market Perform 7.5% 1.3% 17.0x 3.2% 3.6% 18.3%Spectra Energy Partners, LP SEP $47.72 $40 $43 (8%) Market Perform 8.0% 1.3% 15.0x 4.6% 5.5% 7.9%Large Cap Pipeline MLP Median 13% 8.5% 1.3% 15.0x 6.3% 6.3% 4.5%
Crestw ood Midstream Partners LP CMLP $22.39 $26 $28 28% Outperform 9.0% 1.3% 15.0x 7.3% 6.3% 6.5%Niska Gas Storage Partners LLC NKA $13.24 $14 $16 24% Market Perform 10.0% 1.3% 8.0x 10.6% 9.3% 0.0%Valero Energy Partners LP VLP $36.99 $40 $43 15% Outperform / V 8.0% 1.3% 35.0x 2.3% 2.3% 22.0%Martin Midstream Partners L.P. MMLP $42.07 $43 $46 13% Market Perform 9.0% 1.3% 13.0x 7.5% 7.2% 3.4%NGL Energy Partners LP NGL $36.26 $37 $40 12% Outperform 9.5% 1.3% 15.5x 5.9% 5.9% 12.6%TC PipeLines, LP TCP $46.62 $47 $50 11% Market Perform 9.0% 1.9% 12.5x 6.9% 6.8% 3.5%Holly Energy Partners, L.P. HEP $33.60 $34 $36 10% Market Perform 8.5% 1.3% 15.0x 6.0% 5.9% 5.9%Susser Petroleum Partners LP SUSP $35.41 $36 $38 10% Outperform / V 8.5% 1.3% 14.0x 5.5% 5.5% 9.6%USA Compression Partners LP USAC $27.26 $27 $29 10% Outperform / V 9.0% 1.3% 14.0x 7.0% 7.1% 5.7%Tesoro Logistics LP TLLP $60.20 $61 $64 8% Outperform 8.0% 1.3% 20.0x 3.8% 3.9% 15.7%Western Refining Logistics, LP WNRL $29.25 $29 $31 7% Outperform / V 9.5% 1.3% 20.5x 3.9% 4.1% 14.4%Blueknight Energy Partners, L.P. BKEP $9.03 $8 $10 6% Market Perform 9.5% 1.3% 6.0x 5.6% 6.3% 17.7%Exterran Partners, L.P. EXLP $30.00 $28 $30 4% Market Perform 9.0% 1.3% 9.5x 7.1% 7.5% 3.2%Delek Logistics Partners LP DKL $33.80 $31 $34 1% Market Perform / V 9.5% 1.3% 12.0x 4.9% 5.4% 12.6%MPLX LP MPLX $48.81 $44 $47 (4%) Market Perform / V 8.0% 1.3% 29.0x 2.6% 3.0% 19.1%Genesis Energy, L.P. GEL $55.00 $49 $52 (4%) Market Perform 9.0% 2.5% 17.5x 3.9% 4.5% 10.6%Global Partners LP GLP $38.26 $32 $35 (6%) Market Perform 10.0% 1.3% 9.0x 6.4% 7.6% 7.2%Small Cap Midstream MLP Median 10% 9.0% 1.3% 14.0x 5.9% 5.9% 9.6%
American Midstream Partners, LP AMID $23.52 $29 $31 35% Outperform / V 9.5% 1.3% 13.0x 7.7% 6.2% 7.4%Atlas Pipeline Partners, L.P. APL $30.74 $37 $39 32% Outperform 10.0% 1.3% 14.0x 8.1% 6.5% 5.5%Southcross Energy Partners, L.P. SXE $17.60 $20 $22 28% Outperform / V 10.0% 1.3% 12.5x 9.1% 7.6% 3.4%QEP Midstream Partners LP QEPM $21.37 $25 $27 27% Outperform / V 9.0% 1.3% 17.0x 4.9% 4.3% 15.0%PVR Partners, L.P. PVR $26.84 $28 $31 18% Market Perform 10.0% 1.3% 10.0x 8.2% 7.5% 1.5%DCP Midstream Partners, LP DPM $48.80 $53 $56 18% Outperform 9.0% 1.3% 18.5x 6.0% 5.6% 8.4%Regency Energy Partners LP RGP $26.25 $27 $30 16% Market Perform 9.5% 1.3% 13.0x 7.2% 6.9% 7.1%Access Midstream Partners, L.P. ACMP $56.45 $61 $63 14% Outperform 7.5% 1.3% 17.0x 3.9% 3.8% 14.8%Midcoast Energy Partners LP Class A MEP $20.46 $21 $23 14% Outperform / V 10.0% 1.3% 13.0x 6.1% 5.7% 10.2%EQT Midstream Partners LP EQM $65.91 $71 $73 12% Outperform / V 8.0% 1.3% 21.0x 2.8% 2.9% 24.0%MarkWest Energy Partners, L.P. MWE $63.85 $66 $70 12% Market Perform 9.0% 2.5% 17.5x 5.4% 5.2% 5.8%Targa Resources Partners LP NGLS $53.69 $52 $55 5% Market Perform 9.0% 1.3% 15.5x 5.6% 5.8% 8.4%Western Gas Partners, LP WES $63.29 $60 $64 2% Market Perform 7.5% 1.3% 17.0x 3.8% 4.2% 12.9%Crosstex Energy, L.P. XTEX $30.89 $25 $27 (11%) Market Perform 8.0% 1.3% 16.5x 4.7% 5.6% 8.0%Gathering & Processing MLP Median 15% 9.0% 1.3% 16.0x 5.8% 5.6% 8.2%
Eagle Rock Energy Partners, L.P. EROC $4.85 $5 $6 26% Market Perform 10.5% 0.0% 9.0x 12.4% 10.9% (6.8%)BreitBurn Energy Partners L.P. BBEP $19.99 $21 $23 20% Outperform 10.0% 0.0% 10.5x 9.9% 9.0% 2.9%Legacy Reserves LP LGCY $26.40 $28 $30 19% Outperform 9.5% 0.0% 11.0x 8.9% 8.1% 3.0%LRR Energy, L.P. LRE $17.07 $17 $18 14% Outperform / V 11.0% 0.0% 8.0x 11.5% 11.3% 0.9%QR Energy, LP QRE $17.54 $17 $19 14% Market Perform 10.5% 0.0% 8.5x 11.1% 10.8% 0.0%LinnCo. LLC LNCO $30.48 $30 $33 13% Market Perform / V 8.8% 0.0% 10.0x 9.5% 9.2% 0.9%EV Energy Partners, L.P. EVEP $35.08 $35 $38 13% Market Perform / V 10.5% 0.0% 11.5x 8.8% 8.5% 3.0%Memorial Production Partners LP MEMP $22.34 $22 $24 13% Outperform / V 10.5% 0.0% 8.5x 9.8% 9.6% 2.8%Vanguard Natural Resources, LLC VNR $29.86 $30 $32 12% Market Perform 10.0% 0.0% 11.0x 8.3% 8.1% 3.9%Mid-Con Energy Partners, LP MCEP $23.57 $23 $25 11% Outperform / V 9.0% 0.0% 9.0x 8.7% 8.7% 1.5%Linn Energy, LLC LINE $31.87 $28 $31 2% Market Perform 9.5% 0.0% 9.5x 9.1% 9.8% 1.6%Upstream MLP Median 13% 10.3% 0.0% 9.3x 9.7% 9.2% 2.2%
Suburban Propane Partners, L.P. SPH $43.08 $48 $52 24% Outperform 9.0% 1.5% 12.5x 8.1% 7.2% 2.7%AmeriGas Partners, L.P. APU $42.37 $43 $46 13% Market Perform 9.0% 0.8% 10.0x 7.9% 7.9% 3.7%Propane MLP Median 19% 9.0% 1.1% 11.3x 8.0% 7.6% 3.2%
Golar LNG Partners LP GMLP $30.21 $36 $40 33% Outperform 9.0% 2.8% 12.5x 6.9% 5.8% 5.9%Seadrill Partners LLC SDLP $31.41 $38 $41 32% Outperform / V 9.0% 3.0% 14.0x 5.7% 5.1% 19.3%Navios Maritime Partners LP NMM $17.10 $18 $20 21% Outperform - 0.0% 0.0x 10.4% 9.3% 0.0%Teekay Offshore Partners L.P. TOO $32.76 $35 $38 18% Outperform 0.0% 0.0% 0.0x 6.6% 5.9% 8.6%Capital Product Partners LP CPLP $10.76 $11 $12 16% Outperform - 1.3% - 8.6% 8.4% 4.5%Teekay LNG Partners L.P. TGP $41.67 $42 $46 12% Market Perform 9.5% 2.3% 13.5x 6.6% 6.4% 4.0%Marine MLP Median 20% 9.0% 1.8% 12.5x 6.8% 6.2% 5.2%
Oxford Resource Partners, LP OXF $1.18 $1.50 $2.50 69% Market Perform / V NA NA NA - - -Natural Resource Partners L.P. NRP $15.12 $16 $19 25% Market Perform 11.0% 0.0% 10.0x 9.3% 8.0% (9.5%)Alliance Resource Partners, L.P. ARLP $86.16 $78 $86 1% Market Perform 9.5% 2.5% 9.5x 5.6% 6.1% 7.3%Coal MLP Median 25% 10.3% 1.3% 9.8x 7.4% 7.0% (1.1%)
Energy Transfer Equity, L.P. ETE $43.65 $52 $54 25% Outperform / V 9.0% 2.5% 24.5x 3.2% 2.7% 18.4%Atlas Energy, L.P. ATLS $42.45 $50 $52 25% Outperform 10.5% 1.3% 24.5x 4.3% 3.8% 18.8%Crestw ood Equity Partners LP CEQP $13.41 $14 $16 16% Outperform 9.0% 2.5% 27.0x 4.1% 3.8% 13.2%Western Gas Equity Partners LP WGP $42.98 $45 $49 12% Outperform / V 7.5% 2.5% 40.0x 2.2% 2.3% 27.1%NuStar GP Holdings, LLC NSH $30.04 $30 $32 10% Market Perform 9.5% 2.5% 14.0x 7.3% 7.0% 1.4%Alliance Holdings GP, L.P. AHGP $62.20 $60 $65 6% Market Perform 9.5% 3.0% 18.5x 5.3% 5.6% 9.1%General Partner (MLP) Median 14% 9.3% 2.5% 24.5x 4.2% 3.8% 15.8%
Williams Companies, Inc. WMB $41.30 $48 $51 24% Outperform 7.5% 2.5% 43.0x 3.9% 3.4% 17.6%Kinder Morgan, Inc. Class P KMI $31.85 $34 $37 17% Market Perform 7.5% 2.5% 20.0x 5.1% 4.8% 6.4%ONEOK, Inc. OKE $59.14 $60 $63 8% Outperform 7.5% 2.5% 21.5x 2.7% 3.7% 22.0%Targa Resources Corp. TRGP $96.76 $94 $98 2% Market Perform 8.0% 2.5% 30.0x 2.5% 2.8% 21.3%Plains GP Holdings LP Class A PAGP $28.00 $25 $27 (5%) Market Perform / V 6.5% 2.5% 36.0x 2.3% 2.6% 21.9%Crosstex Energy, Inc. XTXI $41.63 $31 $34 (20%) Market Perform 7.0% 2.5% 24.0x 1.4% 2.5% 28.8%General Partner (C-Corp) Median 5% 7.5% 2.5% 27.0x 2.6% 3.1% 21.6%
All MLPs Average 15% 9.0% 1.3% 14.4x 6.6% 6.3% 6.7%All MLPs Median 13% 9.0% 1.3% 14.0x 6.6% 6.3% 5.8%
Note: CPLP,GMLP,NMM,TOO, and TGP follow ed by Wells Fargo Securities analyst Michael Webber, CFA. ARLP, NRP, and OXF follow ed by Wells Fargo Securities analyst Sam DubinksyNote 1: Based on mid-point of valuation range and expected 12-month forw ard distributions.Note 2: Reflects P/EPS multiple for C-Corp GPs that do not report DCFSource: FactSet and Wells Fargo Securities, LLC estimates Date: 2/28/2014
Ups
trea
m M
LPs
Larg
e C
ap P
ipel
ine
MLP
sSm
all &
Mid
Cap
C-C
orp
GPs
Prop
.M
arin
eC
oal
MLP
GPs
Gat
herin
g &
Pro
cess
ing
MLP
s
Total ReturnPotential 1
Note: On 3/10/14, the tickers for XTEX and XTXI were changed to ENLK and ENLC, respectively
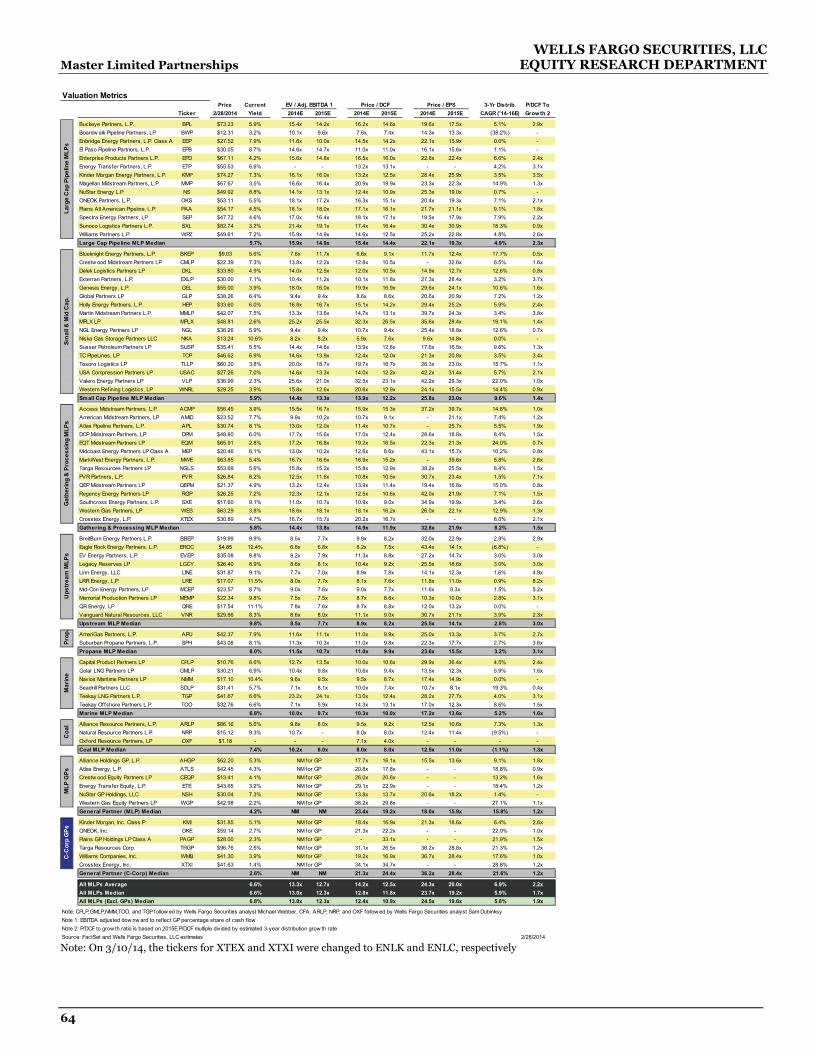
WELLS FARGO SECURITIES, LLC Master Limited Partnerships EQUITY RESEARCH DEPARTMENT
64
Valuation MetricsPrice Current EV / Adj. EBITDA 1 Price / DCF Price / EPS 3-Yr Distrib. P/DCF To
Ticker 2/28/2014 Yield 2014E 2015E 2014E 2015E 2014E 2015E CAGR ('14-16E) Grow th 2
Buckeye Partners, L.P. BPL $73.23 5.9% 15.4x 14.2x 16.2x 14.6x 19.6x 17.5x 5.1% 2.9xBoardw alk Pipeline Partners, LP BWP $12.31 3.2% 10.1x 9.6x 7.6x 7.4x 14.3x 13.3x (38.2%) -Enbridge Energy Partners, L.P. Class A EEP $27.52 7.9% 11.6x 10.0x 14.5x 14.2x 22.1x 15.9x 0.0% -El Paso Pipeline Partners, L.P. EPB $30.05 8.7% 14.6x 14.7x 11.0x 11.0x 16.1x 15.6x 1.1% -Enterprise Products Partners L.P. EPD $67.11 4.2% 15.6x 14.8x 16.5x 16.0x 22.8x 22.4x 6.6% 2.4xEnergy Transfer Partners, L.P. ETP $55.53 6.6% - - 13.2x 13.1x - - 4.2% 3.1xKinder Morgan Energy Partners, L.P. KMP $74.27 7.3% 16.1x 16.0x 13.2x 12.5x 28.4x 25.9x 3.5% 3.5xMagellan Midstream Partners, L.P. MMP $67.67 3.5% 16.6x 16.4x 20.9x 19.9x 23.3x 22.3x 14.9% 1.3xNuStar Energy L.P. NS $49.92 8.8% 14.1x 13.1x 12.4x 10.9x 25.3x 19.0x 0.7% -ONEOK Partners, L.P. OKS $53.11 5.5% 18.1x 17.2x 16.3x 15.1x 20.4x 19.3x 7.1% 2.1xPlains All American Pipeline, L.P. PAA $54.17 4.5% 18.1x 18.0x 17.1x 16.1x 21.7x 21.1x 9.1% 1.8xSpectra Energy Partners, LP SEP $47.72 4.6% 17.0x 16.4x 18.1x 17.1x 19.5x 17.9x 7.9% 2.2xSunoco Logistics Partners L.P. SXL $82.74 3.2% 21.4x 19.1x 17.4x 16.4x 30.4x 30.9x 18.3% 0.9xWilliams Partners L.P. WPZ $49.61 7.2% 15.9x 14.9x 14.6x 12.5x 25.2x 22.8x 4.8% 2.6xLarge Cap Pipeline MLP Median 5.7% 15.9x 14.9x 15.4x 14.4x 22.1x 19.3x 4.9% 2.3x
Blueknight Energy Partners, L.P. BKEP $9.03 5.6% 7.6x 11.7x 6.6x 9.1x 11.7x 12.4x 17.7% 0.5xCrestw ood Midstream Partners LP CMLP $22.39 7.3% 13.8x 12.2x 12.8x 10.5x - 32.6x 6.5% 1.6xDelek Logistics Partners LP DKL $33.80 4.9% 14.0x 12.5x 12.0x 10.5x 14.9x 12.7x 12.6% 0.8xExterran Partners, L.P. EXLP $30.00 7.1% 10.4x 11.2x 10.1x 11.8x 27.3x 28.4x 3.2% 3.7xGenesis Energy, L.P. GEL $55.00 3.9% 18.0x 16.0x 19.9x 16.9x 29.6x 24.1x 10.6% 1.6xGlobal Partners LP GLP $38.26 6.4% 9.4x 9.4x 8.6x 8.6x 20.6x 20.9x 7.2% 1.2xHolly Energy Partners, L.P. HEP $33.60 6.0% 16.8x 16.7x 15.1x 14.2x 29.4x 25.2x 5.9% 2.4xMartin Midstream Partners L.P. MMLP $42.07 7.5% 13.3x 13.6x 14.7x 13.1x 39.7x 24.3x 3.4% 3.8xMPLX LP MPLX $48.81 2.6% 25.2x 25.5x 32.3x 26.5x 35.6x 28.4x 19.1% 1.4xNGL Energy Partners LP NGL $36.26 5.9% 9.4x 9.4x 10.7x 9.4x 25.4x 18.8x 12.6% 0.7xNiska Gas Storage Partners LLC NKA $13.24 10.6% 8.2x 8.2x 5.9x 7.6x 9.6x 14.8x 0.0% -Susser Petroleum Partners LP SUSP $35.41 5.5% 14.4x 14.6x 13.9x 12.6x 17.6x 16.5x 9.6% 1.3xTC PipeLines, LP TCP $46.62 6.9% 14.6x 13.9x 12.4x 12.0x 21.3x 20.8x 3.5% 3.4xTesoro Logistics LP TLLP $60.20 3.8% 20.0x 18.7x 19.7x 16.7x 26.3x 23.0x 15.7% 1.1xUSA Compression Partners LP USAC $27.26 7.0% 14.6x 13.3x 14.0x 12.2x 42.2x 31.4x 5.7% 2.1xValero Energy Partners LP VLP $36.99 2.3% 25.6x 21.0x 32.5x 23.1x 42.2x 29.3x 22.0% 1.0xWestern Refining Logistics, LP WNRL $29.25 3.9% 15.8x 12.6x 20.6x 12.9x 24.1x 15.5x 14.4% 0.9xSmall Cap Pipeline MLP Median 5.9% 14.4x 13.3x 13.9x 12.2x 25.8x 23.0x 9.6% 1.4x
Access Midstream Partners, L.P. ACMP $56.45 3.9% 15.5x 16.7x 15.9x 15.3x 37.2x 39.7x 14.8% 1.0xAmerican Midstream Partners, LP AMID $23.52 7.7% 9.9x 10.2x 10.7x 9.1x - 21.1x 7.4% 1.2xAtlas Pipeline Partners, L.P. APL $30.74 8.1% 13.0x 12.0x 11.4x 10.7x - 25.7x 5.5% 1.9xDCP Midstream Partners, LP DPM $48.80 6.0% 17.7x 15.6x 17.0x 12.4x 28.6x 18.8x 8.4% 1.5xEQT Midstream Partners LP EQM $65.91 2.8% 17.2x 16.8x 19.2x 16.5x 22.3x 21.3x 24.0% 0.7xMidcoast Energy Partners LP Class A MEP $20.46 6.1% 13.0x 10.2x 12.6x 8.6x 43.1x 15.7x 10.2% 0.8xMarkWest Energy Partners, L.P. MWE $63.85 5.4% 16.7x 16.6x 16.9x 15.2x - 39.6x 5.8% 2.6xTarga Resources Partners LP NGLS $53.69 5.6% 15.8x 15.2x 15.8x 12.9x 38.2x 25.5x 8.4% 1.5xPVR Partners, L.P. PVR $26.84 8.2% 12.5x 11.6x 10.8x 10.5x 30.7x 23.4x 1.5% 7.1xQEP Midstream Partners LP QEPM $21.37 4.9% 13.2x 12.4x 13.9x 11.4x 19.4x 16.8x 15.0% 0.8xRegency Energy Partners LP RGP $26.25 7.2% 12.3x 12.1x 12.5x 10.6x 42.0x 21.9x 7.1% 1.5xSouthcross Energy Partners, L.P. SXE $17.60 9.1% 11.0x 10.7x 10.9x 9.0x 34.9x 19.9x 3.4% 2.6xWestern Gas Partners, LP WES $63.29 3.8% 18.6x 18.1x 18.1x 16.2x 26.0x 22.1x 12.9% 1.3xCrosstex Energy, L.P. XTEX $30.89 4.7% 16.7x 15.7x 20.2x 16.7x - - 8.0% 2.1xGathering & Processing MLP Median 5.8% 14.4x 13.8x 14.9x 11.9x 32.8x 21.9x 8.2% 1.5x
BreitBurn Energy Partners L.P. BBEP $19.99 9.9% 8.5x 7.7x 9.9x 8.2x 32.0x 22.9x 2.9% 2.9xEagle Rock Energy Partners, L.P. EROC $4.85 12.4% 6.8x 6.8x 8.2x 7.5x 43.4x 14.1x (6.8%) -EV Energy Partners, L.P. EVEP $35.08 8.8% 9.2x 7.9x 11.3x 8.8x 27.2x 14.7x 3.0% 3.0xLegacy Reserves LP LGCY $26.40 8.9% 8.6x 8.1x 10.4x 9.2x 25.5x 18.6x 3.0% 3.0xLinn Energy, LLC LINE $31.87 9.1% 7.7x 7.0x 8.9x 7.8x 14.1x 12.3x 1.6% 4.9xLRR Energy, L.P. LRE $17.07 11.5% 8.0x 7.7x 8.1x 7.6x 11.8x 11.0x 0.9% 8.2xMid-Con Energy Partners, LP MCEP $23.57 8.7% 9.0x 7.6x 9.0x 7.7x 11.6x 9.3x 1.5% 5.2xMemorial Production Partners LP MEMP $22.34 9.8% 7.5x 7.5x 8.7x 8.6x 10.3x 10.0x 2.8% 3.1xQR Energy, LP QRE $17.54 11.1% 7.8x 7.6x 8.7x 8.8x 12.0x 13.2x 0.0% -Vanguard Natural Resources, LLC VNR $29.86 8.3% 8.6x 8.0x 11.1x 9.0x 30.7x 21.1x 3.9% 2.3xUpstream MLP Median 9.8% 8.5x 7.7x 8.9x 8.2x 25.5x 14.1x 2.8% 3.0x
AmeriGas Partners, L.P. APU $42.37 7.9% 11.6x 11.1x 11.0x 9.9x 25.0x 13.3x 3.7% 2.7xSuburban Propane Partners, L.P. SPH $43.08 8.1% 11.3x 10.3x 11.0x 9.8x 22.3x 17.7x 2.7% 3.6xPropane MLP Median 8.0% 11.5x 10.7x 11.0x 9.9x 23.6x 15.5x 3.2% 3.1x
Capital Product Partners LP CPLP $10.76 8.6% 12.7x 13.5x 10.0x 10.6x 29.9x 36.4x 4.5% 2.4xGolar LNG Partners LP GMLP $30.21 6.9% 10.4x 9.8x 10.6x 9.4x 13.5x 12.3x 5.9% 1.6xNavios Maritime Partners LP NMM $17.10 10.4% 9.6x 9.5x 9.5x 8.7x 17.4x 14.9x 0.0% -Seadrill Partners LLC SDLP $31.41 5.7% 7.1x 8.1x 10.0x 7.4x 10.7x 8.1x 19.3% 0.4xTeekay LNG Partners L.P. TGP $41.67 6.6% 23.2x 24.1x 13.0x 12.4x 28.2x 27.7x 4.0% 3.1xTeekay Offshore Partners L.P. TOO $32.76 6.6% 7.1x 5.9x 14.3x 13.1x 17.0x 12.3x 8.6% 1.5xMarine MLP Median 6.8% 10.0x 9.7x 10.3x 10.0x 17.2x 13.6x 5.2% 1.6x
Alliance Resource Partners, L.P. ARLP $86.16 5.6% 9.8x 8.0x 9.5x 9.2x 12.5x 10.6x 7.3% 1.3xNatural Resource Partners L.P. NRP $15.12 9.3% 10.7x - 8.0x 8.0x 12.4x 11.4x (9.5%) -Oxford Resource Partners, LP OXF $1.18 - - - 7.1x 4.0x - - - -Coal MLP Median 7.4% 10.2x 8.0x 8.0x 8.0x 12.5x 11.0x (1.1%) 1.3x
Alliance Holdings GP, L.P. AHGP $62.20 5.3% NM for GP 17.7x 16.1x 15.5x 13.6x 9.1% 1.8xAtlas Energy, L.P. ATLS $42.45 4.3% NM for GP 20.8x 17.8x - - 18.8% 0.9xCrestw ood Equity Partners LP CEQP $13.41 4.1% NM for GP 26.0x 20.6x - - 13.2% 1.6xEnergy Transfer Equity, L.P. ETE $43.65 3.2% NM for GP 29.1x 22.9x - - 18.4% 1.2xNuStar GP Holdings, LLC NSH $30.04 7.3% NM for GP 13.8x 13.7x 20.6x 18.2x 1.4% -Western Gas Equity Partners LP WGP $42.98 2.2% NM for GP 38.2x 29.8x - - 27.1% 1.1xGeneral Partner (MLP) Median 4.2% NM NM 23.4x 19.2x 18.0x 15.9x 15.8% 1.2x
Kinder Morgan, Inc. Class P KMI $31.85 5.1% NM for GP 18.4x 16.9x 21.3x 18.6x 6.4% 2.6xONEOK, Inc. OKE $59.14 2.7% NM for GP 21.3x 22.2x - - 22.0% 1.0xPlains GP Holdings LP Class A PAGP $28.00 2.3% NM for GP - 33.1x - - 21.9% 1.5xTarga Resources Corp. TRGP $96.76 2.5% NM for GP 31.1x 26.5x 36.2x 28.8x 21.3% 1.2xWilliams Companies, Inc. WMB $41.30 3.9% NM for GP 19.2x 16.9x 36.7x 28.4x 17.6% 1.0xCrosstex Energy, Inc. XTXI $41.63 1.4% NM for GP 34.1x 34.7x - - 28.8% 1.2xGeneral Partner (C-Corp) Median 2.6% NM NM 21.3x 24.4x 36.2x 28.4x 21.6% 1.2x
All MLPs Average 6.6% 13.3x 12.7x 14.2x 12.5x 24.3x 20.0x 6.9% 2.2xAll MLPs Median 6.6% 13.0x 12.3x 12.8x 11.8x 23.7x 19.2x 5.9% 1.7xAll MLPs (Excl. GPs) Median 6.8% 13.0x 12.3x 12.4x 10.9x 24.5x 19.6x 5.8% 1.9x
Note: CPLP,GMLP,NMM,TOO, and TGP follow ed by Wells Fargo Securities analyst Michael Webber, CFA. ARLP, NRP, and OXF follow ed by Wells Fargo Securities analyst Sam DubinksyNote 1: EBITDA adjusted dow nw ard to reflect GP percentage share of cash f lowNote 2: P/DCF to grow th ratio is based on 2015E P/DCF multiple divided by estimated 3-year distribution grow th rateSource: FactSet and Wells Fargo Securities, LLC estimates 2/28/2014
Ups
trea
m M
LPs
Larg
e C
ap P
ipel
ine
MLP
sSm
all &
Mid
Cap
.C
-Cor
p G
PsPr
op.
Mar
ine
Coa
lM
LP G
PsG
athe
ring
& P
roce
ssin
g M
LPs
Note: On 3/10/14, the tickers for XTEX and XTXI were changed to ENLK and ENLC, respectively

WELLS FARGO SECURITIES, LLC MLP Monthly: March 2014 EQUITY RESEARCH DEPARTMENT
65
Overview Of Growth RatesDistribution / Dividend Growth Rates By Year Estimated Distribution CAGRs
Ticker 2013A 2014E 2015E 2016E 2017E 2018E 1-Yr ('14E) 3-Yr ('14-16E) 5-Yr ('14-18E)
Buckeye Partners, L.P. BPL 3.0% 4.7% 5.0% 5.6% 5.6% 5.3% 4.7% 5.1% 5.3%Boardw alk Pipeline Partners, LP BWP (20.3%) (76.4%) 0.0% 0.0% - 5.4% (76.4%) (38.2%) (1.5%)Enbridge Energy Partners, L.P. Class A EEP 0.5% 0.0% 0.0% 0.0% 1.8% 4.3% 0.0% 0.0% 1.2%El Paso Pipeline Partners, L.P. EPB 13.3% 2.0% 0.5% 0.8% 0.8% 0.8% 2.0% 1.1% 0.9%Enterprise Products Partners L.P. EPD 6.5% 6.4% 6.9% 6.7% 6.6% 6.7% 6.4% 6.6% 6.6%Energy Transfer Partners, L.P. ETP 1.0% 4.6% 4.7% 3.3% 2.8% 2.7% 4.6% 4.2% 3.6%Kinder Morgan Energy Partners, L.P. KMP 7.0% 4.7% 3.9% 2.0% 3.7% 5.1% 4.7% 3.5% 3.9%Magellan Midstream Partners, L.P. MMP 16.3% 20.4% 15.4% 9.1% 7.9% 7.8% 20.4% 14.9% 12.0%NuStar Energy L.P. NS 0.0% 0.0% 0.3% 1.7% 1.8% 1.8% 0.0% 0.7% 1.1%ONEOK Partners, L.P. OKS 7.4% 6.2% 7.3% 7.9% 7.9% 5.7% 6.2% 7.1% 7.0%Plains All American Pipeline, L.P. PAA 10.1% 10.0% 9.0% 8.3% 7.5% 7.2% 10.0% 9.1% 8.4%Spectra Energy Partners, LP SEP 6.3% 10.3% 7.0% 6.5% 6.1% 5.4% 10.3% 7.9% 7.1%Sunoco Logistics Partners L.P. SXL 25.8% 21.6% 19.1% 14.3% 9.3% 7.2% 21.6% 18.3% 14.2%Williams Partners L.P. WPZ 8.6% 6.0% 5.8% 2.6% 0.7% 4.1% 6.0% 4.8% 3.8%Large Cap Pipeline MLP Median 6.8% 5.3% 5.4% 4.5% 5.6% 5.4% 5.3% 4.9% 4.6%
Blueknight Energy Partners, L.P. BKEP 8.4% 24.7% 24.0% 5.3% 2.5% 2.5% 24.7% 17.7% 11.3%Crestw ood Midstream Partners LP CMLP 5.6% 5.9% 6.5% 7.0% 6.8% 5.8% 5.9% 6.5% 6.4%Delek Logistics Partners LP DKL 6.8% 12.0% 12.5% 13.1% 10.1% 6.0% 12.0% 12.6% 10.7%Exterran Partners, L.P. EXLP 4.0% 3.8% 3.3% 2.3% 1.7% 1.9% 3.8% 3.2% 2.6%Genesis Energy, L.P. GEL 10.6% 10.9% 10.5% 10.5% 10.3% 10.3% 10.9% 10.6% 10.5%Global Partners LP GLP 11.8% 8.5% 7.4% 5.8% 4.6% 3.1% 8.5% 7.2% 5.9%Holly Energy Partners, L.P. HEP 6.5% 6.1% 5.8% 5.8% 5.8% 5.8% 6.1% 5.9% 5.9%Martin Midstream Partners L.P. MMLP 1.9% 3.0% 3.7% 3.6% 3.5% 3.1% 3.0% 3.4% 3.4%MPLX LP MPLX 11.2% 19.9% 18.9% 18.3% 17.5% 17.0% 19.9% 19.1% 18.3%NGL Energy Partners LP NGL 19.3% 14.7% 13.0% 10.2% 8.3% 7.2% 14.7% 12.6% 10.6%Niska Gas Storage Partners LLC NKA 0.0% 0.0% 0.0% 0.0% 0.4% 2.8% 0.0% 0.0% 0.6%Susser Petroleum Partners LP SUSP 5.4% 10.6% 9.1% 9.0% 5.9% 5.0% 10.6% 9.6% 7.9%TC PipeLines, LP TCP 3.2% 3.6% 3.5% 3.5% 2.9% 3.1% 3.6% 3.5% 3.3%Tesoro Logistics LP TLLP 23.0% 17.8% 15.5% 13.9% 12.2% 8.2% 17.8% 15.7% 13.5%USA Compression Partners LP USAC 6.8% 11.3% 4.2% 1.9% 2.7% 4.1% 11.3% 5.7% 4.8%Valero Energy Partners LP VLP 0.0% 21.5% 22.3% 22.2% 22.2% 22.0% 21.5% 22.0% 22.0%Western Refining Logistics, LP WNRL 0.0% 13.5% 14.6% 15.1% 15.1% 15.2% 13.5% 14.4% 14.7%Small Cap Midstream MLP Median 6.5% 10.9% 9.1% 7.0% 5.9% 5.8% 10.9% 9.6% 7.9%
Access Midstream Partners, L.P. ACMP 19.4% 18.6% 15.1% 10.9% 11.0% 7.4% 18.6% 14.8% 12.5%American Midstream Partners, LP AMID 2.3% 6.2% 8.0% 7.9% 7.3% 6.8% 6.2% 7.4% 7.2%Atlas Pipeline Partners, L.P. APL 7.9% 3.1% 5.0% 8.6% 8.6% 6.6% 3.1% 5.5% 6.3%DCP Midstream Partners, LP DPM 6.0% 7.9% 9.0% 8.3% 8.1% 8.1% 7.9% 8.4% 8.3%EQT Midstream Partners LP EQM 18.6% 28.9% 23.6% 19.7% 15.6% 15.0% 28.9% 24.0% 20.4%Midcoast Energy Partners LP Class A MEP - 1.2% 15.4% 14.7% 11.0% 7.4% 1.2% 10.2% 9.8%MarkWest Energy Partners, L.P. MWE 5.0% 4.7% 4.8% 7.8% 8.5% 8.3% 4.7% 5.8% 6.8%Targa Resources Partners LP NGLS 10.9% 8.6% 8.4% 8.2% 6.9% 6.3% 8.6% 8.4% 7.7%PVR Partners, L.P. PVR 2.8% 0.7% 2.0% 1.8% 1.7% 0.9% 0.7% 1.5% 1.4%QEP Midstream Partners LP QEPM 0.0% 15.0% 15.0% 15.1% 14.1% 9.4% 15.0% 15.0% 13.7%Regency Energy Partners LP RGP 1.6% 7.0% 8.0% 6.2% 5.2% 3.9% 7.0% 7.1% 6.1%Southcross Energy Partners, L.P. SXE 0.0% 0.0% 4.7% 5.7% 4.5% 5.7% 0.0% 3.4% 4.1%Western Gas Partners, LP WES 16.3% 16.0% 13.8% 9.0% 8.8% 7.4% 16.0% 12.9% 10.9%Crosstex Energy, L.P. XTEX 2.7% 8.1% 8.7% 7.1% 5.1% 2.4% 8.1% 8.0% 6.3%Gathering & Processing MLP Median 5.0% 7.4% 8.6% 8.3% 8.3% 7.1% 7.4% 8.2% 7.5%
BreitBurn Energy Partners L.P. BBEP 4.6% 3.1% 3.1% 2.3% 2.7% 3.1% 3.1% 2.9% 2.9%Eagle Rock Energy Partners, L.P. EROC (15.9%) (18.9%) 0.0% 0.0% 0.0% 0.0% (18.9%) (6.8%) (4.1%)EV Energy Partners, L.P. EVEP 0.5% 0.5% 3.4% 5.0% 7.1% 6.3% 0.5% 3.0% 4.4%Legacy Reserves LP LGCY 3.6% 1.9% 3.5% 3.7% 4.1% 4.1% 1.9% 3.0% 3.5%Linn Energy, LLC LINE 0.0% 0.0% 2.1% 2.7% 2.6% 2.6% 0.0% 1.6% 2.0%LRR Energy, L.P. LRE 2.0% 1.3% 0.8% 0.8% 0.7% 0.7% 1.3% 0.9% 0.9%Mid-Con Energy Partners, LP MCEP 6.2% 1.7% 1.4% 1.3% 1.1% 1.0% 1.7% 1.5% 1.3%Memorial Production Partners LP MEMP 8.3% 3.9% 1.7% 2.9% 3.5% 3.3% 3.9% 2.8% 3.1%QR Energy, LP QRE 0.6% 0.0% 0.0% 0.0% 0.0% 0.0% 0.0% 0.0% 0.0%Vanguard Natural Resources, LLC VNR 3.0% 2.4% 3.7% 5.7% 5.8% 3.8% 2.4% 3.9% 4.3%Upstream MLP Median 3.0% 1.7% 2.1% 2.3% 2.6% 2.6% 1.7% 2.8% 2.9%
AmeriGas Partners, L.P. APU 5.0% 4.8% 4.8% 1.6% 1.6% 1.6% 4.8% 3.7% 2.9%Suburban Propane Partners, L.P. SPH 2.0% 2.4% 2.4% 3.3% 3.5% 3.2% 2.4% 2.7% 3.0%Propane MLP Median 3.5% 3.6% 3.6% 2.5% 2.5% 2.4% 3.6% 3.2% 2.9%
Capital Product Partners LP CPLP 0.0% 3.2% 7.3% 2.9% 0.0% - 3.2% 4.5% -Golar LNG Partners LP GMLP 13.2% 5.5% 7.6% 4.6% 5.4% 6.8% 5.5% 5.9% 6.0%Navios Maritime Partners LP NMM 0.3% 0.0% 0.0% 0.0% 0.0% - 0.0% 0.0% -Seadrill Partners LLC SDLP 8.2% 30.0% 19.5% 9.2% 0.0% - 30.0% 19.3% -Teekay LNG Partners L.P. TGP 0.6% 3.8% 4.2% 4.0% - - 3.8% 4.0% -Teekay Offshore Partners L.P. TOO 2.5% 5.7% 11.6% 8.7% - - 5.7% 8.6% -Marine MLP Median 1.6% 4.6% 7.4% 4.3% 0.0% 6.8% 4.6% 5.2% 6.0%
Alliance Resource Partners, L.P. ARLP 8.8% 8.1% 8.2% 5.6% 4.1% - 8.1% 7.3% -Natural Resource Partners L.P. NRP (9.1%) (30.0%) 5.7% 0.0% 8.1% - (30.0%) (9.5%) -Oxford Resource Partners, LP OXF - - - - - - - - -Coal MLP Median (0.2%) (10.9%) 7.0% 2.8% 6.1% - (10.9%) (1.1%) -
Alliance Holdings GP, L.P. AHGP 12.7% 10.4% 9.2% 7.7% 4.8% - 10.4% 9.1% -Atlas Energy, L.P. ATLS 56.1% 21.6% 17.6% 17.4% 25.5% 17.8% 21.6% 18.8% 19.9%Crestw ood Equity Partners LP CEQP - 10.2% 13.5% 16.1% 14.9% 14.9% 10.2% 13.2% 13.9%Energy Transfer Equity, L.P. ETE 6.2% 13.4% 26.2% 15.9% 11.1% 8.1% 13.4% 18.4% 14.8%NuStar GP Holdings, LLC NSH 3.3% 0.0% 0.7% 3.4% 3.5% 3.4% 0.0% 1.4% 2.2%Western Gas Equity Partners LP WGP 24.4% 36.7% 27.8% 17.6% 16.3% 13.5% 36.7% 27.1% 22.1%General Partner (MLP) Median 12.7% 11.9% 15.5% 16.0% 13.0% 13.5% 11.9% 15.8% 14.8%
Kinder Morgan, Inc. Class P KMI 14.3% 7.5% 7.6% 4.2% 1.7% 3.6% 7.5% 6.4% 4.9%ONEOK, Inc. OKE 14.7% 53.3% 9.2% 8.3% 10.7% 7.0% 53.3% 22.0% 16.5%Plains GP Holdings LP Class A PAGP - 27.2% 21.9% 16.8% 14.9% 12.1% 27.2% 21.9% 18.5%Targa Resources Corp. TRGP 34.6% 27.2% 20.5% 16.6% 14.2% 11.9% 27.2% 21.3% 18.0%Williams Companies, Inc. WMB 20.2% 21.4% 20.6% 11.2% 6.8% 6.4% 21.4% 17.6% 13.1%Crosstex Energy, Inc. XTXI 6.3% 56.9% 21.3% 12.4% 12.4% 12.2% 56.9% 28.8% 21.9%General Partner (C-Corp) Median 14.7% 27.2% 20.6% 11.8% 11.5% 9.5% 27.2% 21.6% 17.2%
All MLPs Average 6.9% 6.5% 8.2% 6.8% 6.4% 6.0% 6.5% 6.9% 7.1%All MLPs Median 5.5% 5.9% 6.7% 5.8% 5.4% 5.4% 5.9% 5.9% 6.0%All MLPs (Excl. GPs) Median 5.0% 5.6% 5.8% 5.7% 5.2% 5.3% 5.6% 5.8% 5.9%
Source: Company data and Wells Fargo Securities, LLC estimates Date: 2/28/2014
Ups
trea
m M
LPs
Larg
e C
ap P
ipel
ine
MLP
sSm
all &
Mid
Cap
.C
-Cor
p G
PsPr
op.
Mar
ine
Coa
lM
LP G
PsG
athe
ring
& P
roce
ssin
g M
LPs
Note: On 3/10/14, the tickers for XTEX and XTXI were changed to ENLK and ENLC, respectively

WELLS FARGO SECURITIES, LLC Master Limited Partnerships EQUITY RESEARCH DEPARTMENT
66
MLP Yield AnalysisAnnualized Distribution Implied Price Based On Current Yield Implied Yields Based On Current Price
Ticker Current Q4'14E Q4'15E Q4'16E Q4'17E Current Q4'14E Q4'15E Q4'16E Q4'17E Current Q4'14E Q4'15E Q4'16E Q4'17E
Buckeye Partners, L.P. BPL $4.35 $4.55 $4.79 $5.07 $5.35 $73 $77 $81 $85 $90 5.9% 6.2% 6.5% 6.9% 7.3%Boardw alk Pipeline Partners, LP BWP $0.40 $0.40 $0.40 $0.40 $1.52 $12 $12 $12 $12 $47 3.2% 3.2% 3.2% 3.2% 12.3%Enbridge Energy Partners, L.P. Class A EEP $2.17 $2.17 $2.17 $2.17 $2.25 $28 $28 $28 $28 $29 7.9% 7.9% 7.9% 7.9% 8.2%Enbridge Energy Management, L.L.C. EEQ $2.17 $2.17 $2.17 $2.17 $2.25 $27 $27 $27 $27 $28 8.1% 8.1% 8.1% 8.1% 8.4%El Paso Pipeline Partners, L.P. EPB $2.60 $2.60 $2.62 $2.64 $2.66 $30 $30 $30 $31 $31 8.7% 8.7% 8.7% 8.8% 8.9%Enterprise Products Partners L.P. EPD $2.80 $2.99 $3.19 $3.41 $3.63 $67 $72 $76 $82 $87 4.2% 4.5% 4.8% 5.1% 5.4%Energy Transfer Partners, L.P. ETP $3.68 $3.84 $4.02 $4.13 $4.24 $56 $58 $61 $62 $64 6.6% 6.9% 7.2% 7.4% 7.6%Kinder Morgan Energy Partners, L.P. KMP $5.44 $5.65 $5.89 $5.93 $6.27 $74 $77 $80 $81 $86 7.3% 7.6% 7.9% 8.0% 8.4%Kinder Morgan Management, LLC KMR $5.44 $5.65 $5.89 $5.93 $6.27 $70 $72 $76 $76 $80 7.8% 8.1% 8.4% 8.5% 9.0%Magellan Midstream Partners, L.P. MMP $2.34 $2.82 $3.15 $3.40 $3.66 $68 $82 $91 $98 $106 3.5% 4.2% 4.7% 5.0% 5.4%NuStar Energy L.P. NS $4.38 $4.38 $4.42 $4.50 $4.58 $50 $50 $50 $51 $52 8.8% 8.8% 8.9% 9.0% 9.2%ONEOK Partners, L.P. OKS $2.92 $3.16 $3.38 $3.66 $3.94 $53 $57 $61 $67 $72 5.5% 5.9% 6.4% 6.9% 7.4%Plains All American Pipeline, L.P. PAA $2.46 $2.69 $2.94 $3.17 $3.41 $54 $59 $65 $70 $75 4.5% 5.0% 5.4% 5.9% 6.3%Spectra Energy Partners, LP SEP $2.19 $2.35 $2.51 $2.67 $2.83 $48 $51 $55 $58 $62 4.6% 4.9% 5.2% 5.6% 5.9%Sunoco Logistics Partners L.P. SXL $2.65 $3.22 $3.78 $4.26 $4.58 $83 $101 $118 $133 $143 3.2% 3.9% 4.6% 5.1% 5.5%Williams Partners L.P. WPZ $3.57 $3.75 $3.98 $4.03 $4.03 $50 $52 $55 $56 $56 7.2% 7.6% 8.0% 8.1% 8.1%Large Cap Pipeline MLP Median 6.3% 6.6% 6.9% 7.2% 7.9%
Blueknight Energy Partners, L.P. BKEP $0.51 $0.69 $0.78 $0.80 $0.82 $9 - - - - 5.6% 7.6% 8.6% 8.9% 9.1%Crestw ood Midstream Partners LP CMLP $1.64 $1.75 $1.86 $2.00 $2.12 $22 $24 $25 $27 $29 7.3% 7.8% 8.3% 8.9% 9.5%Delek Logistics Partners LP DKL $1.66 $1.87 $2.11 $2.39 $2.59 $34 $38 $43 $49 $53 4.9% 5.5% 6.2% 7.1% 7.7%Exterran Partners, L.P. EXLP $2.13 $2.21 $2.27 $2.32 $2.36 $30 $31 $32 $33 $33 7.1% 7.4% 7.6% 7.7% 7.9%Genesis Energy, L.P. GEL $2.14 $2.38 $2.62 $2.90 $3.20 $55 $61 $67 $75 $82 3.9% 4.3% 4.8% 5.3% 5.8%Global Partners LP GLP $2.45 $2.67 $2.83 $2.99 $3.11 $38 $42 $44 $47 $49 6.4% 7.0% 7.4% 7.8% 8.1%Holly Energy Partners, L.P. HEP $2.00 $2.12 $2.24 $2.38 $2.51 $34 $36 $38 $40 $42 6.0% 6.3% 6.7% 7.1% 7.5%Martin Midstream Partners L.P. MMLP $3.14 $3.26 $3.38 $3.50 $3.62 $42 $44 $45 $47 $49 7.5% 7.7% 8.0% 8.3% 8.6%MPLX LP MPLX $1.25 $1.49 $1.77 $2.09 $2.45 $49 $58 $69 $82 $96 2.6% 3.1% 3.6% 4.3% 5.0%NGL Energy Partners LP NGL $2.13 $2.44 $2.72 $2.97 $3.21 $36 $42 $46 $51 $55 5.9% 6.7% 7.5% 8.2% 8.8%Niska Gas Storage Partners LLC NKA $1.40 $1.40 $1.40 $1.40 $1.42 $13 $13 $13 $13 $13 10.6% 10.6% 10.6% 10.6% 10.7%Susser Petroleum Partners LP SUSP $1.94 $2.10 $2.30 $2.50 $2.60 $35 $38 $42 $46 $47 5.5% 5.9% 6.5% 7.1% 7.3%TC PipeLines, LP TCP $3.24 $3.38 $3.46 $3.62 $3.72 $47 $49 $50 $52 $54 6.9% 7.3% 7.4% 7.8% 8.0%Tesoro Logistics LP TLLP $2.26 $2.62 $3.02 $3.42 $3.82 $60 $70 $80 $91 $102 3.8% 4.4% 5.0% 5.7% 6.3%USA Compression Partners LP USAC $1.92 $2.08 $2.12 $2.16 $2.22 $27 $30 $30 $31 $32 7.0% 7.6% 7.8% 7.9% 8.1%Valero Energy Partners LP VLP $0.85 $1.23 $1.29 $1.72 $1.99 $37 $54 $56 $75 $87 2.3% 3.3% 3.5% 4.6% 5.4%Western Refining Logistics, LP WNRL $1.15 $1.47 $1.53 $1.84 $2.08 $29 $37 $39 $47 $53 3.9% 5.0% 5.2% 6.3% 7.1%Small Cap Midstream MLP Median 5.9% 6.7% 7.4% 7.7% 7.9%
Access Midstream Partners, L.P. ACMP $2.22 $2.55 $2.93 $3.18 $3.58 $56 $65 $75 $81 $91 3.9% 4.5% 5.2% 5.6% 6.3%American Midstream Partners, LP AMID $1.81 $1.93 $2.09 $2.25 $2.41 $24 $25 $27 $29 $31 7.7% 8.2% 8.9% 9.6% 10.2%Atlas Pipeline Partners, L.P. APL $2.48 $2.60 $2.68 $2.99 $3.19 $31 $32 $33 $37 $40 8.1% 8.5% 8.7% 9.7% 10.4%DCP Midstream Partners, LP DPM $2.93 $3.19 $3.47 $3.75 $4.06 $49 $53 $58 $62 $68 6.0% 6.5% 7.1% 7.7% 8.3%EQT Midstream Partners LP EQM $1.84 $2.32 $2.84 $3.36 $3.84 $66 $83 $102 $120 $138 2.8% 3.5% 4.3% 5.1% 5.8%Midcoast Energy Partners LP Class A MEP $1.25 $1.31 $1.55 $1.75 $1.93 $20 $21 $25 $29 $32 6.1% 6.4% 7.6% 8.6% 9.4%MarkWest Energy Partners, L.P. MWE $3.44 $3.60 $3.80 $4.12 $4.50 $64 $67 $71 $76 $84 5.4% 5.6% 6.0% 6.5% 7.0%Targa Resources Partners LP NGLS $2.99 $3.23 $3.51 $3.79 $4.03 $54 $58 $63 $68 $72 5.6% 6.0% 6.5% 7.1% 7.5%PVR Partners, L.P. PVR $2.20 $2.24 $2.28 $2.32 $2.36 $27 $27 $28 $28 $29 8.2% 8.3% 8.5% 8.6% 8.8%QEP Midstream Partners LP QEPM $1.04 $1.24 $1.39 $1.59 $1.82 $21 $25 $29 $33 $37 4.9% 5.8% 6.5% 7.4% 8.5%Regency Energy Partners LP RGP $1.90 $2.06 $2.22 $2.34 $2.46 $26 $28 $31 $32 $34 7.2% 7.8% 8.5% 8.9% 9.4%Southcross Energy Partners, L.P. SXE $1.60 $1.60 $1.72 $1.80 $1.88 $18 $18 $19 $20 $21 9.1% 9.1% 9.8% 10.2% 10.7%Western Gas Partners, LP WES $2.40 $2.81 $3.13 $3.37 $3.68 $63 $74 $83 $89 $97 3.8% 4.4% 4.9% 5.3% 5.8%Crosstex Energy, L.P. XTEX $1.44 $1.50 $1.66 $1.72 $1.81 $31 $32 $36 $37 $39 4.7% 4.9% 5.4% 5.6% 5.9%Gathering & Processing MLP Median 5.8% 6.2% 6.8% 7.6% 8.4%
BreitBurn Energy Partners L.P. BBEP $1.97 $2.01 $2.08 $2.12 $2.18 $20 $20 $21 $22 $22 9.9% 10.1% 10.4% 10.6% 10.9%Eagle Rock Energy Partners, L.P. EROC $0.60 $0.60 $0.60 $0.60 $0.60 $5 $5 $5 $5 $5 12.4% 12.4% 12.4% 12.4% 12.4%EV Energy Partners, L.P. EVEP $3.08 $3.10 $3.26 $3.42 $3.70 $35 $35 $37 $39 $42 8.8% 8.8% 9.3% 9.7% 10.5%Legacy Reserves LP LGCY $2.36 $2.40 $2.49 $2.58 $2.69 $26 $27 $28 $29 $30 8.9% 9.1% 9.4% 9.8% 10.2%Linn Energy, LLC LINE $2.90 $2.90 $2.98 $3.06 $3.14 $32 $32 $33 $34 $35 9.1% 9.1% 9.4% 9.6% 9.9%LRR Energy, L.P. LRE $1.96 $1.97 $1.99 $2.00 $2.02 $17 $17 $17 $17 $18 11.5% 11.5% 11.7% 11.7% 11.8%Mid-Con Energy Partners, LP MCEP $2.06 $2.10 $2.12 $2.15 $2.17 $24 $24 $24 $25 $25 8.7% 8.9% 9.0% 9.1% 9.2%Memorial Production Partners LP MEMP $2.20 $2.22 $2.26 $2.34 $2.42 $22 $23 $23 $24 $25 9.8% 9.9% 10.1% 10.5% 10.8%QR Energy, LP QRE $1.95 $1.95 $1.95 $1.95 $1.95 $18 $18 $18 $18 $18 11.1% 11.1% 11.1% 11.1% 11.1%Vanguard Natural Resources, LLC VNR $2.49 $2.54 $2.67 $2.83 $2.99 $30 $30 $32 $34 $36 8.3% 8.5% 8.9% 9.5% 10.0%Upstream MLP Median 9.8% 9.9% 10.1% 10.5% 10.8%
AmeriGas Partners, L.P. APU $3.36 $3.52 $3.69 $3.75 $3.81 $42 $44 $47 $47 $48 7.9% 8.3% 8.7% 8.9% 9.0%Suburban Propane Partners, L.P. SPH $3.50 $3.64 $3.76 $3.89 $4.02 $43 $45 $46 $48 $50 8.1% 8.4% 8.7% 9.0% 9.3%Propane MLP Median 8.0% 8.4% 8.7% 8.9% 9.2%
Capital Product Partners LP CPLP $0.93 $0.97 $1.05 $1.01 $1.01 $11 $11 $12 $12 $12 8.6% 9.0% 9.8% 9.4% 9.4%Golar LNG Partners LP GMLP $2.09 $2.20 $2.34 $2.45 $2.62 $30 $32 $34 $35 $38 6.9% 7.3% 7.7% 8.1% 8.7%Navios Maritime Partners LP NMM $1.77 $1.77 $1.77 $1.77 $1.77 $17 $17 $17 $17 $17 10.4% 10.4% 10.4% 10.4% 10.4%Seadrill Partners LLC SDLP $1.78 $2.34 $2.73 $2.85 $2.85 $31 $41 $48 $50 $50 5.7% 7.4% 8.7% 9.1% 9.1%Teekay LNG Partners L.P. TGP $2.77 $2.84 $2.97 $0.00 $0.00 $42 $43 $45 $0 $0 6.6% 6.8% 7.1% - -Teekay Offshore Partners L.P. TOO $2.15 $2.42 $2.61 $0.00 $0.00 $33 $37 $40 $0 $0 6.6% 7.4% 8.0% - -Marine MLP Median 6.8% 7.4% 8.3% 9.2% 9.2%
Alliance Resource Partners, L.P. ARLP $4.79 $5.18 $5.61 $5.84 $6.08 $86 $93 $101 $105 $109 5.6% 6.0% 6.5% 6.8% 7.1%Natural Resource Partners L.P. NRP $1.40 $1.40 $1.48 $1.48 $1.60 $15 $15 $16 $16 $17 9.3% 9.3% 9.8% 9.8% 10.6%Oxford Resource Partners, LP OXF $0.00 $0.00 $0.00 $0.00 $0.00 - - - - - - - - - -Coal MLP Median 7.4% 7.6% 8.2% 8.3% 8.8%
Alliance Holdings GP, L.P. AHGP $3.31 $3.65 $3.84 $4.13 $4.33 $62 $69 $72 $78 $81 5.3% 5.9% 6.2% 6.6% 7.0%Atlas Energy, L.P. ATLS $1.84 $2.22 $2.46 $3.12 $3.72 $42 $51 $57 $72 $86 4.3% 5.2% 5.8% 7.3% 8.8%Crestw ood Equity Partners LP CEQP $0.55 $0.59 $0.70 $0.82 $0.90 $13 $14 $17 $20 $22 4.1% 4.4% 5.2% 6.1% 6.7%Energy Transfer Equity, L.P. ETE $1.39 $1.62 $2.03 $2.30 $2.54 $44 $51 $64 $72 $80 3.2% 3.7% 4.7% 5.3% 5.8%NuStar GP Holdings, LLC NSH $2.18 $2.18 $2.22 $2.30 $2.38 $30 $30 $31 $32 $33 7.3% 7.3% 7.4% 7.7% 7.9%Western Gas Equity Partners LP WGP $0.93 $1.26 $1.54 $1.77 $2.07 $43 $59 $72 $82 $96 2.2% 2.9% 3.6% 4.1% 4.8%General Partner (MLP) Median 4.2% 4.8% 5.5% 6.4% 6.8%
Kinder Morgan, Inc. Class P KMI $1.64 $1.76 $1.89 $1.95 $1.96 $32 $34 $37 $38 $38 5.1% 5.5% 5.9% 6.1% 6.2%ONEOK, Inc. OKE $1.60 $2.42 $2.62 $2.89 $3.18 $59 $89 $97 $107 $118 2.7% 4.1% 4.4% 4.9% 5.4%Plains GP Holdings LP Class A PAGP $0.64 $0.76 $0.90 $1.05 $1.19 $28 $33 $39 $46 $52 2.3% 2.7% 3.2% 3.8% 4.3%Targa Resources Corp. TRGP $2.43 $3.03 $3.59 $4.15 $4.71 $97 $121 $143 $165 $188 2.5% 3.1% 3.7% 4.3% 4.9%Williams Companies, Inc. WMB $1.61 $1.88 $2.24 $2.40 $2.56 $41 $48 $57 $62 $66 3.9% 4.6% 5.4% 5.8% 6.2%Crosstex Energy, Inc. XTXI $0.60 $0.80 $1.06 $1.11 $1.29 $42 $56 $74 $77 $90 1.4% 1.9% 2.5% 2.7% 3.1%General Partner (C-Corp) Median 2.6% 3.6% 4.1% 4.6% 5.1%
All MLPs Average 6.6% 7.0% 7.4% 7.8% 8.4%All MLPs Median 6.6% 7.3% 7.6% 7.9% 8.4%
Source: FactSet and Wells Fargo Securities, LLC estimates Date: 2/28/2014
Ups
trea
m M
LPs
Larg
e C
ap P
ipel
ine
MLP
sSm
all &
Mid
Cap
.C
-Cor
p G
PsPr
op.
Mar
ine
Coa
lM
LP G
PsG
athe
ring
& P
roce
ssin
g M
LPs
Note: On 3/10/14, the tickers for XTEX and XTXI were changed to ENLK and ENLC, respectively

WELLS FARGO SECURITIES, LLC MLP Monthly: March 2014 EQUITY RESEARCH DEPARTMENT
67
Overview Of Fiscal EstimatesEarnings Per Unit EBITDA ($MM) Distribution Per Unit Distrib. Coverage
Ticker FY2014E FY2015E FY2014E FY2015E FY2014E FY2015E FY2014E FY2015E
Buckeye Partners, L.P. BPL $3.73 $4.20 $772 $852 $4.48 $4.70 1.0x 1.1xBoardw alk Pipeline Partners, LP BWP $0.86 $0.93 $650 $668 $0.40 $0.40 - -Enbridge Energy Partners, L.P. Class A EEP $1.24 $1.73 $1,516 $1,882 $2.17 $2.17 0.9x 0.9xEl Paso Pipeline Partners, L.P. EPB $1.86 $1.92 $1,187 $1,278 $2.60 $2.61 1.0x 1.0xEnterprise Products Partners L.P. EPD $2.94 $2.99 $4,977 $5,310 $2.92 $3.12 1.4x 1.3xEnergy Transfer Partners, L.P. ETP NA NA $0 $0 $3.78 $3.96 1.1x 1.0xKinder Morgan Energy Partners, L.P. KMP $2.62 $2.87 $5,969 $6,575 $5.58 $5.80 1.0x 1.0xMagellan Midstream Partners, L.P. MMP $2.90 $3.04 $938 $991 $2.63 $3.03 1.2x 1.1xNuStar Energy L.P. NS $1.97 $2.63 $530 $597 $4.38 $4.40 0.9x 1.0xONEOK Partners, L.P. OKS $2.61 $2.75 $1,550 $1,813 $3.07 $3.30 1.0x 1.0xPlains All American Pipeline, L.P. PAA $2.50 $2.57 $2,253 $2,488 $2.62 $2.85 1.1x 1.1xSpectra Energy Partners, LP SEP $2.45 $2.67 $1,509 $1,705 $2.29 $2.45 1.1x 1.1xSunoco Logistics Partners L.P. SXL $2.72 $2.68 $882 $1,059 $3.00 $3.57 1.4x 1.2xWilliams Partners L.P. WPZ $1.97 $2.18 $3,104 $3,682 $3.69 $3.90 1.0x 1.0xLarge Cap Pipeline MLP Median 1.0x 1.0x
Blueknight Energy Partners, L.P. BKEP $0.77 $0.73 $76 $83 $0.61 $0.75 2.2x 1.3xCrestw ood Midstream Partners LP CMLP $0.36 $0.69 $504 $633 $1.71 $1.82 1.0x 1.1xDelek Logistics Partners LP DKL $2.27 $2.66 $81 $96 $1.80 $2.02 1.5x 1.6xExterran Partners, L.P. EXLP $1.10 $1.06 $267 $291 $2.18 $2.25 1.3x 1.1xGenesis Energy, L.P. GEL $1.86 $2.28 $317 $386 $2.29 $2.53 1.2x 1.3xGlobal Partners LP GLP $1.86 $1.83 $183 $189 $2.58 $2.77 1.7x 1.5xHolly Energy Partners, L.P. HEP $1.14 $1.34 $213 $234 $2.08 $2.20 1.1x 1.1xMartin Midstream Partners L.P. MMLP $1.06 $1.73 $152 $177 $3.22 $3.34 0.9x 1.0xMPLX LP MPLX $1.37 $1.72 $147 $192 $1.40 $1.67 1.1x 1.1xNGL Energy Partners LP NGL $1.43 $1.93 $414 $533 $2.31 $2.61 1.4x 1.4xNiska Gas Storage Partners LLC NKA $1.38 $0.90 $145 $130 $1.40 $1.40 1.6x 1.2xSusser Petroleum Partners LP SUSP $2.01 $2.14 $70 $86 $2.04 $2.23 1.2x 1.3xTC PipeLines, LP TCP $2.19 $2.25 $304 $343 $3.33 $3.44 1.1x 1.1xTesoro Logistics LP TLLP $2.29 $2.61 $299 $378 $2.49 $2.87 1.2x 1.2xUSA Compression Partners LP USAC $0.65 $0.87 $114 $141 $2.02 $2.11 1.0x 1.1xValero Energy Partners LP VLP $0.88 $1.26 $71 $107 $1.03 $1.26 1.1x 1.3xWestern Refining Logistics, LP WNRL $1.22 $1.89 $74 $129 $1.31 $1.50 1.1x 1.5xSmall Cap Midstream MLP Median 1.2x 1.2x
Access Midstream Partners, L.P. ACMP $1.52 $1.42 $1,086 $1,287 $2.42 $2.79 1.4x 1.2xAmerican Midstream Partners, LP AMID $0.05 $1.12 $50 $87 $1.88 $2.03 1.1x 1.2xAtlas Pipeline Partners, L.P. APL $0.50 $1.19 $391 $472 $2.53 $2.65 1.0x 1.1xDCP Midstream Partners, LP DPM $1.71 $2.59 $530 $769 $3.09 $3.37 0.9x 1.1xEQT Midstream Partners LP EQM $2.96 $3.09 $215 $310 $2.14 $2.65 1.5x 1.4xMidcoast Energy Partners LP Class A MEP $0.47 $1.30 $107 $228 $1.27 $1.46 1.3x 1.6xMarkWest Energy Partners, L.P. MWE $1.15 $1.61 $818 $1,022 $3.54 $3.71 1.0x 1.1xTarga Resources Partners LP NGLS $1.40 $2.11 $764 $927 $3.14 $3.41 1.1x 1.2xPVR Partners, L.P. PVR $0.88 $1.15 $430 $516 $2.22 $2.26 1.0x 1.1xQEP Midstream Partners LP QEPM $1.10 $1.27 $99 $127 $1.15 $1.32 1.3x 1.4xRegency Energy Partners LP RGP $0.62 $1.20 $1,147 $1,586 $2.00 $2.16 1.0x 1.1xSouthcross Energy Partners, L.P. SXE $0.50 $0.88 $64 $84 $1.60 $1.68 1.0x 1.2xWestern Gas Partners, LP WES $2.43 $2.86 $650 $815 $2.65 $3.01 1.2x 1.2xCrosstex Energy, L.P. XTEX $0.00 $0.13 $501 $700 $1.47 $1.59 1.0x 1.1xGathering & Processing MLP Median 1.1x 1.2x
BreitBurn Energy Partners L.P. BBEP $0.62 $0.87 $519 $636 $2.00 $2.06 1.0x 1.2xEagle Rock Energy Partners, L.P. EROC $0.11 $0.34 $221 $210 $0.60 $0.60 1.0x 1.1xEV Energy Partners, L.P. EVEP $1.29 $2.39 $284 $357 $3.09 $3.20 1.0x 1.2xLegacy Reserves LP LGCY $1.04 $1.42 $276 $308 $2.38 $2.46 1.1x 1.2xLinn Energy, LLC LINE $2.25 $2.59 $2,404 $2,747 $2.90 $2.96 1.2x 1.4xLRR Energy, L.P. LRE $1.44 $1.55 $93 $103 $1.97 $1.99 1.1x 1.1xMid-Con Energy Partners, LP MCEP $2.04 $2.52 $64 $78 $2.09 $2.12 1.2x 1.4xMemorial Production Partners LP MEMP $2.18 $2.24 $302 $339 $2.21 $2.25 1.2x 1.1xQR Energy, LP QRE $1.47 $1.33 $301 $334 $1.95 $1.95 1.0x 1.0xVanguard Natural Resources, LLC VNR $0.97 $1.41 $414 $513 $2.53 $2.62 1.1x 1.3xUpstream MLP Median 1.1x 1.2x
AmeriGas Partners, L.P. APU $1.70 $3.20 $630 $657 $3.48 $3.65 1.2x 1.1xSuburban Propane Partners, L.P. SPH $1.93 $2.43 $329 $370 $3.55 $3.64 1.1x 1.2xPropane MLP Median 1.1x 1.2x
Capital Product Partners LP CPLP $0.36 $0.30 $132 $130 $0.96 $1.03 1.3x 1.2xGolar LNG Partners LP GMLP $2.24 $2.47 $331 $392 $2.17 $2.34 1.3x 1.4xNavios Maritime Partners LP NMM $0.98 $1.15 $180 $190 $1.77 $1.77 1.0x 1.0xSeadrill Partners LLC SDLP $2.95 $3.86 $713 $808 $2.18 $2.61 1.6x 1.5xTeekay LNG Partners L.P. TGP $1.48 $1.50 $270 $270 $2.82 $2.94 1.3x 1.3xTeekay Offshore Partners L.P. TOO $1.93 $2.66 $506 $706 $2.22 $2.48 1.0x 1.0xMarine MLP Median 1.3x 1.3x
Alliance Resource Partners, L.P. ARLP $6.90 $8.15 $711 $800 $5.03 $5.45 1.5x 1.4xNatural Resource Partners L.P. NRP $1.22 $1.32 $293 $305 $1.40 $1.48 1.3x 1.4xOxford Resource Partners, LP OXF ($1.84) ($1.71) $37 $40 $0.00 $0.00 - -Coal MLP Median 1.4x 1.4x
Alliance Holdings GP, L.P. AHGP $4.01 $4.59 $557 $618 $3.51 $3.84 1.0x 1.0xAtlas Energy, L.P. ATLS NA NA $120 $138 $2.03 $2.39 1.0x 1.0xCrestw ood Equity Partners LP CEQP NA NA $113 $137 $0.58 $0.65 0.9x 1.0xEnergy Transfer Equity, L.P. ETE NA NA $1,006 $1,241 $1.51 $1.91 1.0x 1.0xNuStar GP Holdings, LLC NSH $1.46 $1.65 $94 $94 $2.18 $2.20 1.0x 1.0xWestern Gas Equity Partners LP WGP NA NA $246 $316 $1.12 $1.44 1.0x 1.0xGeneral Partner (MLP) Median 1.0x 1.0x
Kinder Morgan, Inc. Class P KMI $1.49 $1.72 $2,654 $2,924 $1.72 $1.85 1.1x 1.1xONEOK, Inc. OKE $2.78 $2.66 NA NA $2.33 $2.55 1.2x 1.0xPlains GP Holdings LP Class A PAGP $0.70 $0.85 $464 $565 $0.70 $0.85 - -Targa Resources Corp. TRGP $2.68 $3.35 $764 $926 $2.81 $3.38 1.1x 1.1xWilliams Companies, Inc. WMB $1.12 $1.45 $2,763 $3,429 $1.75 $2.11 1.2x 1.2xCrosstex Energy, Inc. XTXI NA NA $271 $257 $0.80 $0.97 1.5x 1.2xGeneral Partner (C-Corp) Median 1.2x 1.1x
All MLPs Average (Excl. GPs) 1.2x 1.2xAll MLPs Median (Excl. GPs) 1.1x 1.2x
Note: CPLP,GMLP,NMM,SDLP,TOO, and TGP follow ed by Wells Fargo Securities analyst Michael Webber, CFA. ARLP, NRP, and OXF follow ed by Wells Fargo Securities analyst Sam DubinskySource: Wells Fargo Securities, LLC estimates Date: 2/28/2014
Ups
trea
m M
LPs
Larg
e C
ap P
ipel
ine
MLP
sSm
all &
Mid
Cap
.C
-Cor
p G
PsPr
op.
Mar
ine
Coa
lM
LP G
PsG
athe
ring
& P
roce
ssin
g M
LPs
Note: On 3/10/14, the tickers for XTEX and XTXI were changed to ENLK and ENLC, respectively

WELLS FARGO SECURITIES, LLC Master Limited Partnerships EQUITY RESEARCH DEPARTMENT
68
Cash Flow StabilityFee-Based Cash Flow % Of Commodity Exposure Hedged
Ticker 2014E 2015E 2016E 2017E 2018E 5-Yr ∆ 2014E 2015E 2016E 2017E 2018E 5-Yr Avg.
Buckeye Partners, L.P. BPL 96% 96% 96% 96% 96% 0% - - - - - -Boardw alk Pipeline Partners, LP BWP 98% 98% 98% 98% 98% 0% - - - - - -Enbridge Energy Partners, L.P. Class A EEP 85% 84% 88% 87% 87% 2% 41% 0% 0% 0% 0% 8%El Paso Pipeline Partners, L.P. EPB 100% 100% 100% 100% 100% 0% - - - - - -Enterprise Products Partners L.P. EPD 87% 88% 88% 87% 87% (1%) - - - - - -Energy Transfer Partners, L.P. ETP - - - - - - - - - - - -Kinder Morgan Energy Partners, L.P. KMP 82% 84% 86% 87% 88% 6% 74% 52% 36% 19% 0% 36%Magellan Midstream Partners, L.P. MMP 84% 85% 86% 87% 88% 4% - - - - - -NuStar Energy L.P. NS 95% 96% 96% 96% 97% 1% - - - - - -ONEOK Partners, L.P. OKS 69% 70% 71% 71% 72% 3% 48% 0% 0% 0% 0% 10%Plains All American Pipeline, L.P. PAA 72% 72% 74% 78% 79% 8% - - - - - -Spectra Energy Partners, LP SEP 100% 100% 100% 100% 100% 0% - - - - - -Sunoco Logistics Partners L.P. SXL 85% 85% 85% 85% 85% 0% - - - - - -Williams Partners L.P. WPZ 83% 78% 80% 84% 84% 2% 0% 0% 0% 0% 0% 0%Large Cap Pipeline MLP Median 85% 85% 88% 87% 88% 1% 44% 0% 0% 0% 0% 9%
Blueknight Energy Partners, L.P. BKEP 100% 100% 100% 100% 100% 0% - - - - - -Crestw ood Midstream Partners LP CMLP 96% 97% 97% 97% 97% 1% 0% 0% 0% 0% 0% 0%Delek Logistics Partners LP DKL 90% 91% 92% 92% 92% 2% - - - - - -Exterran Partners, L.P. EXLP 100% 100% 100% 100% 100% 0% - - - - - -Genesis Energy, L.P. GEL 36% 36% 35% 35% 35% (0%) - - - - - -Global Partners LP GLP 5% 5% 5% 5% 5% 0% - - - - - -Holly Energy Partners, L.P. HEP 100% 100% 100% 100% 100% 0% - - - - - -Martin Midstream Partners L.P. MMLP 70% 70% 70% 70% 70% 0% - - - - - -MPLX LP MPLX 100% 100% 100% 100% 100% 0% - - - - - -NGL Energy Partners LP NGL 9% 9% 9% 9% 9% 1% - - - - - -Niska Gas Storage Partners LLC NKA 70% 72% 73% 73% 73% 3% - - - - - -Susser Petroleum Partners LP SUSP 64% 68% 71% 73% 74% 10% - - - - - -TC PipeLines, LP TCP 100% 100% 100% 100% 100% 0% - - - - - -Tesoro Logistics LP TLLP 100% 100% 100% 100% 100% 0% - - - - - -USA Compression Partners LP USAC 100% 100% 100% 100% 100% 0% - - - - - -Valero Energy Partners LP VLP 100% 100% 100% 100% 100% 0% - - - - - -Western Refining Logistics, LP WNRL 100% 100% 100% 100% 100% 0% - - - - - -Small Cap Midstream MLP Median 100% 100% 100% 100% 100% 0% 0% 0% 0% 0% 0% 0%
Access Midstream Partners, L.P. ACMP 100% 100% 100% 100% 100% 0% - - - - - -American Midstream Partners, LP AMID 77% 78% 79% 77% 78% 0% 0% 0% 0% 0% 0% 0%Atlas Pipeline Partners, L.P. APL 53% 50% 47% 44% 44% (9%) 78% 39% 3% 0% 0% 24%DCP Midstream Partners, LP DPM 53% 57% 57% 57% 59% 6% 73% 65% 8% 0% 0% 29%EQT Midstream Partners LP EQM 100% 100% 100% 100% 100% 0% - - - - - -Midcoast Energy Partners LP Class A MEP 42% 39% 39% 35% 35% (8%) 41% 0% 0% 0% 0% 8%MarkWest Energy Partners, L.P. MWE 70% 73% 75% 75% 76% 7% 61% 0% 0% 0% 0% 12%Targa Resources Partners LP NGLS 61% 61% 64% 63% 66% 5% 9% 0% 0% 0% 0% 2%PVR Partners, L.P. PVR 72% 71% 71% 74% 74% 3% 0% 0% 0% 0% 0% 0%QEP Midstream Partners LP QEPM 95% 96% 96% 97% 98% 3% 0% 0% 0% 0% 0% 0%Regency Energy Partners LP RGP 63% 61% 60% 58% 58% (5%) 1% 0% 0% 0% 0% 0%Southcross Energy Partners, L.P. SXE 69% 65% 64% 59% 61% (8%) 0% 0% 0% 0% 0% 0%Western Gas Partners, LP WES 75% 76% 76% 77% 77% 2% 100% 100% 100% 100% 100% 100%Crosstex Energy, L.P. XTEX 90% 90% 90% 88% 87% (3%) 6% 0% 0% 0% 0% 1%Gathering & Processing MLP Median 71% 72% 73% 74% 75% 0% 8% 0% 0% 0% 0% 2%
BreitBurn Energy Partners L.P. BBEP 0% 0% 0% 0% 0% 0% 77% 70% 55% 28% 2% 46%Eagle Rock Energy Partners, L.P. EROC 7% 0% 0% 0% 0% (7%) 69% 37% 29% 0% 0% 27%EV Energy Partners, L.P. EVEP 0% 0% 0% 0% 0% 0% 61% 53% 0% 0% 0% 23%Legacy Reserves LP LGCY 0% 0% 0% 0% 0% 0% 74% 37% 15% 4% 0% 26%Linn Energy, LLC LINE 0% 0% 0% 0% 0% 0% 64% 63% 61% 44% 7% 48%LRR Energy, L.P. LRE 0% 0% 0% 0% 0% 0% 81% 62% 55% 44% 0% 48%Mid-Con Energy Partners, LP MCEP 0% 0% 0% 0% 0% 0% 80% 11% 0% 0% 0% 18%Memorial Production Partners LP MEMP 0% 0% 0% 0% 0% 0% 81% 75% 60% 57% 51% 65%QR Energy, LP QRE 0% 0% 0% 0% 0% 0% 81% 66% 59% 46% 0% 50%Vanguard Natural Resources, LLC VNR 0% 0% 0% 0% 0% 0% 76% 65% 45% 20% 0% 41%Upstream MLP Median 0% 0% 0% 0% 0% 0% 77% 63% 45% 25% 0% 46%
AmeriGas Partners, L.P. APU 0% 0% 0% 0% 0% 0% - - - - - -Suburban Propane Partners, L.P. SPH 0% 0% 0% 0% 0% 0% - - - - - -Propane MLP Median 0% 0% 0% 0% 0% 0% - - - - - -
Capital Product Partners LP CPLP 100% 100% 100% 100% 100% 0% - - - - - -Golar LNG Partners LP GMLP 100% 100% 100% 100% 100% 0% - - - - - -Navios Maritime Partners LP NMM 100% 100% 100% 100% 100% 0% - - - - - -Seadrill Partners LLC SDLP 100% 100% 100% 100% 100% 0% - - - - - -Teekay LNG Partners L.P. TGP 100% 100% 100% 100% 100% 0% - - - - - -Teekay Offshore Partners L.P. TOO 100% 100% 100% 100% 100% 0% - - - - - -Marine MLP Median 100% 100% 100% 100% 100% 0% - - - - - -
Alliance Resource Partners, L.P. ARLP 0% 0% 0% 0% 0% 0% - - - - 0% 0%Natural Resource Partners L.P. NRP 0% 0% 0% 0% 0% 0% - - - - 0% 0%Oxford Resource Partners, LP OXF 0% 0% 0% 0% 0% 0% - - - - 0% 0%Coal MLP Median 0% 0% 0% 0% 0% 0% - - - - 0% 0%
Alliance Holdings GP, L.P. AHGP - - - - - - - - - - - -Atlas Energy, L.P. ATLS - - - - - - - - - - - -Crestw ood Equity Partners LP CEQP - - - - - - - - - - - -Energy Transfer Equity, L.P. ETE - - - - - - - - - - - -NuStar GP Holdings, LLC NSH - - - - - - - - - - - -Western Gas Equity Partners LP WGP - - - - - - - - - - - -General Partner (MLP) Median - - - - - - - - - - - -
Kinder Morgan, Inc. Class P KMI - - - - - - - - - - - -ONEOK, Inc. OKE - - - - - - - - - - - -Plains GP Holdings LP Class A PAGP - - - - - - - - - - - -Targa Resources Corp. TRGP - - - - - - - - - - - -Williams Companies, Inc. WMB - - - - - - - - - - - -Crosstex Energy, Inc. XTXI - - - - - - - - - - - -General Partner (C-Corp) Median - - - - - - - - - - - -
All MLPs Average (Excl. GPs) 62% 62% 62% 62% 63% 0% 49% 31% 20% 14% 5% 22%All MLPs Median (Excl. GPs) 76% 77% 77% 78% 79% 0% 63% 24% 0% 0% 0% 12%
Source: Wells Fargo Securities, LLC estimates
Ups
trea
m M
LPs
Larg
e C
ap P
ipel
ine
MLP
sSm
all &
Mid
Cap
Mid
stre
amC
-Cor
p G
PsPr
opa
Mar
ine
Coa
lM
LP G
PsG
athe
ring
& P
roce
ssin
g M
LPs
Note: On 3/10/14, the tickers for XTEX and XTXI were changed to ENLK and ENLC, respectively

WELLS FARGO SECURITIES, LLC MLP Monthly: March 2014 EQUITY RESEARCH DEPARTMENT
69
Growth Ests. Versus ConsensusOur 2014E Consensus 2014 Distrib. Ests. Our 2015E Consensus 2015 Distrib. Ests. Est. 3-Yr CAGR 1
Ticker Distrib. Median # Low High Distrib. Median # Low High Our Street # Var
Buckeye Partners, L.P. BPL $4.48 $4.48 12 $4.44 $4.60 $4.70 $4.70 11 $4.68 $4.91 5.1% 5.0% 6 0.1%Boardw alk Pipeline Partners, LP BWP $0.40 $0.40 13 $0.40 $0.40 $0.40 $0.40 13 $0.40 $0.60 (38.2%) (38.2%) 7 0.0%Enbridge Energy Partners, L.P. Class A EEP $2.17 $2.18 11 $2.17 $2.22 $2.17 $2.24 11 $2.17 $2.30 0.0% 2.3% 7 (2.3%)El Paso Pipeline Partners, L.P. EPB $2.60 $2.60 13 $2.60 $2.60 $2.61 $2.60 12 $2.60 $2.66 1.1% 0.6% 5 0.4%Enterprise Products Partners L.P. EPD $2.92 $2.91 17 $2.86 $2.97 $3.12 $3.10 16 $3.02 $3.21 6.6% 6.6% 7 0.0%Energy Transfer Partners, L.P. ETP $3.78 $3.79 14 $3.76 $3.95 $3.96 $3.97 13 $3.94 $4.42 4.2% 4.5% 5 (0.3%)Kinder Morgan Energy Partners, L.P. KMP $5.58 $5.58 14 $5.52 $5.59 $5.80 $5.82 12 $5.70 $5.86 3.5% 4.7% 5 (1.2%)Magellan Midstream Partners, L.P. MMP $2.63 $2.62 14 $2.51 $2.64 $3.03 $3.01 14 $2.79 $3.04 14.9% 15.0% 6 (0.1%)NuStar Energy L.P. NS $4.38 $4.38 12 $4.38 $4.38 $4.40 $4.39 12 $4.38 $4.49 0.7% 0.7% 5 (0.0%)ONEOK Partners, L.P. OKS $3.07 $3.07 14 $3.01 $3.07 $3.30 $3.31 14 $3.25 $3.33 7.1% 7.1% 6 0.0%Plains All American Pipeline, L.P. PAA $2.62 $2.61 20 $2.51 $2.64 $2.85 $2.86 18 $2.77 $2.93 9.1% 9.4% 6 (0.3%)Spectra Energy Partners, LP SEP $2.29 $2.29 11 $2.25 $2.46 $2.45 $2.45 10 $2.41 $2.45 7.9% 7.7% 6 0.2%Sunoco Logistics Partners L.P. SXL $3.00 $3.00 13 $2.69 $3.00 $3.57 $3.51 12 $3.28 $3.64 18.3% 18.3% 5 0.0%Williams Partners L.P. WPZ $3.69 $3.69 12 $3.63 $3.72 $3.90 $3.90 12 $3.82 $3.96 4.8% 5.1% 4 (0.3%)Large Cap Pipeline MLP Median 13 12 4.9% 5.1% 6 (0.0%)
Blueknight Energy Partners, L.P. BKEP $0.61 - 1 - - $0.75 - 0 - - - - 0 -Crestw ood Midstream Partners LP CMLP $1.71 $1.71 9 $1.69 $1.72 $1.82 $1.82 8 $1.79 $1.86 6.5% 6.6% 2 (0.1%)Delek Logistics Partners LP DKL $1.80 $1.80 5 $1.76 $1.86 $2.02 $2.00 4 $1.94 $2.18 12.6% 11.7% 2 0.8%Exterran Partners, L.P. EXLP $2.18 $2.18 7 $2.18 $2.21 $2.25 $2.26 7 $2.25 $2.30 3.2% 3.7% 3 (0.5%)Genesis Energy, L.P. GEL $2.29 $2.29 12 $2.23 $2.29 $2.53 $2.53 11 $2.47 $2.56 10.6% 10.7% 3 (0.1%)Global Partners LP GLP $2.58 $2.60 3 $2.49 $2.62 $2.77 - 0 - - - - 0 -Holly Energy Partners, L.P. HEP $2.08 $2.08 6 $2.08 $2.08 $2.20 $2.20 6 $2.18 $2.20 5.9% 5.7% 3 0.2%Martin Midstream Partners L.P. MMLP $3.22 $3.17 7 $3.17 $3.18 $3.34 $3.28 5 $3.21 $3.34 - - 1 -MPLX LP MPLX $1.40 $1.40 7 $1.34 $1.41 $1.67 $1.67 7 $1.63 $1.68 19.1% 19.1% 3 0.0%NGL Energy Partners LP NGL $2.31 $2.39 10 $2.31 $2.41 $2.61 $2.65 6 $2.57 $2.70 - - 1 -Niska Gas Storage Partners LLC NKA $1.40 $1.40 9 $1.40 $1.48 $1.40 $1.40 6 $1.40 $1.60 0.0% 0.0% 3 0.0%Susser Petroleum Partners LP SUSP $2.04 $2.09 11 $2.04 $2.30 $2.23 $2.33 11 $2.22 $2.76 9.6% 10.9% 3 (1.3%)TC PipeLines, LP TCP $3.33 $3.32 9 $3.23 $3.80 $3.44 $3.42 8 $3.24 $3.52 3.5% 3.0% 4 0.5%Tesoro Logistics LP TLLP $2.49 $2.48 10 $2.39 $2.55 $2.87 $2.84 10 $2.74 $2.99 15.7% 16.1% 4 (0.4%)USA Compression Partners LP USAC $2.02 $2.02 6 $1.95 $2.02 $2.11 $2.18 6 $2.03 $2.22 5.7% 7.3% 4 (1.6%)Valero Energy Partners LP VLP $1.03 $0.94 5 $0.89 $1.03 $1.26 $1.17 5 $1.08 $1.26 22.0% 19.6% 4 2.4%Western Refining Logistics, LP WNRL $1.31 $1.25 3 $1.23 $1.33 $1.50 $1.43 3 $1.41 $1.45 - - 1 -Small Cap Midstream MLP Median 7 6 8.0% 9.0% 3 (0.0%)
Access Midstream Partners, L.P. ACMP $2.42 $2.42 14 $2.26 $2.43 $2.79 $2.78 14 $2.68 $2.80 14.8% 15.1% 6 (0.3%)American Midstream Partners, LP AMID $1.88 $1.86 5 $1.85 $1.88 $2.03 $1.94 3 $1.90 $2.03 7.4% 5.9% 2 1.5%Atlas Pipeline Partners, L.P. APL $2.53 $2.54 9 $2.53 $2.75 $2.65 $2.70 9 $2.62 $3.06 5.5% 4.6% 4 0.9%DCP Midstream Partners, LP DPM $3.09 $3.08 8 $3.04 $4.16 $3.37 $3.29 8 $3.22 $4.55 8.4% 6.5% 4 1.9%EQT Midstream Partners LP EQM $2.14 $2.14 11 $2.02 $2.73 $2.65 $2.60 10 $2.46 $2.68 24.0% 22.3% 6 1.7%Midcoast Energy Partners LP Class A MEP $1.27 $1.32 8 $1.27 $1.45 $1.46 $1.53 8 $1.39 $1.68 10.2% 14.0% 5 (3.7%)MarkWest Energy Partners, L.P. MWE $3.54 $3.56 12 $3.53 $3.74 $3.71 $3.92 12 $3.79 $4.28 5.8% 7.8% 5 (2.0%)Targa Resources Partners LP NGLS $3.14 $3.14 17 $3.03 $3.38 $3.41 $3.41 15 $3.32 $3.76 8.4% 8.4% 6 0.0%PVR Partners, L.P. PVR $2.22 $2.20 3 $2.20 $2.22 $2.26 - 2 - - 1.5% 1.0% 2 0.4%QEP Midstream Partners LP QEPM $1.15 $1.15 3 $1.14 $1.15 $1.32 - 2 - - 15.0% 14.5% 2 0.6%Regency Energy Partners LP RGP $2.00 $2.00 11 $1.97 $2.18 $2.16 $2.14 9 $2.02 $2.28 7.1% 6.3% 4 0.8%Southcross Energy Partners, L.P. SXE $1.60 $1.60 6 $1.60 $1.60 $1.68 $1.64 6 $1.60 $1.68 - - 1 -Western Gas Partners, LP WES $2.65 $2.65 7 $2.60 $2.74 $3.01 $3.01 6 $2.92 $3.27 - - 1 -Crosstex Energy, L.P. XTEX $1.47 $1.47 8 $1.46 $1.54 $1.59 $1.59 6 $1.54 $1.63 8.0% 8.2% 4 (0.2%)Gathering & Processing MLP Median 8 8 8.2% 8.0% 4 0.5%
BreitBurn Energy Partners L.P. BBEP $2.00 $2.02 14 $1.97 $2.09 $2.06 $2.11 10 $1.97 $2.22 - - 1 -Eagle Rock Energy Partners, L.P. EROC $0.60 $0.60 6 $0.60 $0.62 $0.60 $0.63 4 $0.60 $0.66 - - 1 -EV Energy Partners, L.P. EVEP $3.09 $3.09 8 $3.08 $3.12 $3.20 $3.11 5 $3.08 $3.20 - - 0 -Legacy Reserves LP LGCY $2.38 $2.41 11 $2.36 $2.42 $2.46 $2.49 11 $2.36 $2.50 - - 1 -Linn Energy, LLC LINE $2.90 $2.90 10 $2.90 $3.18 $2.96 $3.03 8 $2.90 $3.41 - - 0 -LRR Energy, L.P. LRE $1.97 $1.99 8 $1.95 $1.99 $1.99 $2.03 6 $1.95 $2.03 - - 1 -Mid-Con Energy Partners, LP MCEP $2.09 $2.17 6 $2.09 $2.20 $2.12 $2.34 4 $2.18 $2.39 - - 0 -Memorial Production Partners LP MEMP $2.21 $2.24 6 $2.20 $2.32 $2.25 $2.28 4 $2.20 $2.33 - - 0 -QR Energy, LP QRE $1.95 $1.95 8 $1.95 $1.97 $1.95 $1.95 6 $1.95 $1.99 - - 0 -Vanguard Natural Resources, LLC VNR $2.53 $2.56 11 $2.49 $2.65 $2.62 $2.65 9 $2.49 $2.84 - - 0 -Upstream MLP Median 8 6 - - 0 -
AmeriGas Partners, L.P. APU $3.48 $3.45 9 $3.36 $3.49 $3.65 $3.62 9 $3.40 $3.66 3.7% 3.6% 6 0.1%Suburban Propane Partners, L.P. SPH $3.55 $3.55 9 $3.50 $3.58 $3.64 $3.66 9 $3.50 $3.70 2.7% 2.4% 6 0.3%Propane MLP Median 9 9 3.2% 3.0% 6 0.2%
Capital Product Partners LP CPLP $0.96 $0.93 10 $0.93 $0.99 $1.03 $0.95 10 $0.93 $1.04 4.5% 0.0% 3 4.5%Golar LNG Partners LP GMLP $2.17 $2.17 12 $2.13 $2.24 $2.34 $2.25 8 $2.19 $2.34 5.9% 2.9% 4 3.0%Navios Maritime Partners LP NMM $1.77 $1.77 10 $1.77 $1.80 $1.77 $1.77 9 $1.77 $1.92 0.0% 0.0% 3 0.0%Seadrill Partners LLC SDLP $2.18 $2.12 8 $0.00 $2.26 $2.61 $2.42 7 $0.00 $2.74 19.3% 12.7% 3 6.6%Teekay LNG Partners L.P. TGP $2.82 $2.79 7 $2.77 $2.86 $2.94 $2.85 7 $2.73 $3.01 4.0% 2.5% 4 1.5%Teekay Offshore Partners L.P. TOO $2.22 $2.21 7 $2.15 $2.22 $2.48 $2.32 6 $2.15 $2.48 8.6% 5.6% 3 3.1%Marine MLP Median 9 8 5.2% 2.7% 3 3.0%
Alliance Resource Partners, L.P. ARLP $5.03 $4.98 6 $4.81 $5.10 $5.45 $5.40 6 $5.05 $5.70 7.3% 6.6% 2 0.7%Natural Resource Partners L.P. NRP $1.40 $1.40 4 $1.40 $1.40 $1.48 $1.40 4 $1.40 $1.55 (9.5%) (11.2%) 3 1.7%Oxford Resource Partners, LP OXF $0.00 - 2 - - $0.00 - 1 - - - - 0 -Coal MLP Median 4 4 (1.1%) (2.3%) 2 1.2%
Alliance Holdings GP, L.P. AHGP $3.51 $3.49 3 $3.46 $3.52 $3.84 $3.84 3 $3.81 $3.90 - - 1 -Atlas Energy, L.P. ATLS $2.03 $2.01 4 $1.97 $2.41 $2.39 $2.51 4 $2.39 $3.18 18.8% 23.9% 2 (5.0%)Crestw ood Equity Partners LP CEQP $0.58 $0.58 8 $0.56 $0.62 $0.65 $0.66 7 $0.62 $0.85 13.2% 13.1% 2 0.1%Energy Transfer Equity, L.P. ETE $1.51 $1.51 7 $1.44 $1.60 $1.91 $1.90 8 $1.50 $2.08 18.4% 18.6% 4 (0.3%)NuStar GP Holdings, LLC NSH $2.18 $2.18 8 $2.18 $2.26 $2.20 $2.23 8 $2.18 $2.34 1.4% 2.4% 4 (1.0%)Western Gas Equity Partners LP WGP $1.12 $1.12 7 $1.09 $1.20 $1.44 $1.40 6 $1.34 $1.66 - - 0 -General Partner (MLP) Median 7 7 15.8% 15.9% 2 (0.6%)
Kinder Morgan, Inc. Class P KMI $1.72 $1.72 12 $1.69 $1.72 $1.85 $1.86 11 $1.80 $1.93 6.4% 8.1% 5 (1.7%)ONEOK, Inc. OKE $2.33 $2.33 12 $2.11 $2.33 $2.55 $2.57 11 $2.51 $2.67 22.0% 22.9% 6 (0.9%)Plains GP Holdings LP Class A PAGP $0.70 $0.73 14 $0.69 $0.79 $0.85 $0.90 13 $0.85 $1.00 21.9% 26.2% 6 (4.3%)Targa Resources Corp. TRGP $2.81 $2.81 14 $2.56 $2.88 $3.38 $3.43 13 $2.88 $3.66 21.3% 22.7% 6 (1.3%)Williams Companies, Inc. WMB $1.75 $1.75 12 $1.75 $1.84 $2.11 $2.11 12 $2.00 $2.20 17.6% 19.7% 4 (2.1%)Crosstex Energy, Inc. XTXI $0.80 $0.80 7 $0.70 $0.82 $0.97 $1.04 6 $0.82 $1.17 28.8% 38.3% 3 (9.5%)General Partner (C-Corp) Median 12 12 21.6% 22.8% 6 (1.9%)
All MLPs Average 7.2% 6.9% 3 0.2%All MLPs Median 6.9% 6.5% 3 0.0%
Note 1: CAGRs are only show n for companies w ith more than one estimate. Starting point for CAGR calculation is 2013 and ending point is 2016.Source: FactSet and Wells Fargo Securities, LLC estimates
Ups
trea
m M
LPs
Larg
e C
ap P
ipel
ine
MLP
sSm
all &
Mid
Cap
.C
-Cor
p G
PsPr
op.
Mar
ine
Coa
lM
LP G
PsG
athe
ring
& P
roce
ssin
g M
LPs
Note: On 3/10/14, the tickers for XTEX and XTXI were changed to ENLK and ENLC, respectively
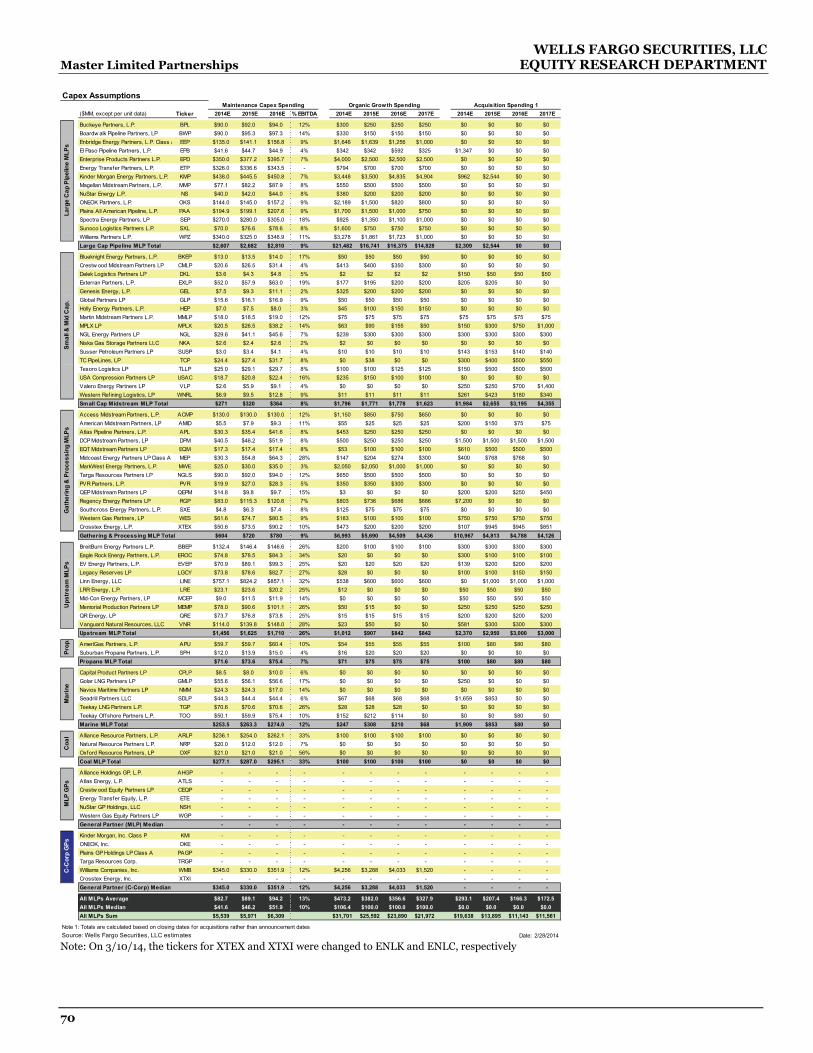
WELLS FARGO SECURITIES, LLC Master Limited Partnerships EQUITY RESEARCH DEPARTMENT
70
Capex AssumptionsMaintenance Capex Spending Organic Growth Spending Acquisition Spending 1
($MM, except per unit data) Ticker 2014E 2015E 2016E % EBITDA 2014E 2015E 2016E 2017E 2014E 2015E 2016E 2017E
Buckeye Partners, L.P. BPL $90.0 $92.0 $94.0 12% $300 $250 $250 $250 $0 $0 $0 $0Boardw alk Pipeline Partners, LP BWP $90.0 $95.3 $97.3 14% $330 $150 $150 $150 $0 $0 $0 $0Enbridge Energy Partners, L.P. Class A EEP $135.0 $141.1 $156.8 9% $1,646 $1,639 $1,256 $1,000 $0 $0 $0 $0El Paso Pipeline Partners, L.P. EPB $41.6 $44.7 $44.9 4% $342 $342 $592 $325 $1,347 $0 $0 $0Enterprise Products Partners L.P. EPD $350.0 $377.2 $395.7 7% $4,000 $2,500 $2,500 $2,500 $0 $0 $0 $0Energy Transfer Partners, L.P. ETP $326.0 $336.6 $343.5 - $794 $700 $700 $700 $0 $0 $0 $0Kinder Morgan Energy Partners, L.P. KMP $438.0 $445.5 $450.8 7% $3,448 $3,500 $4,835 $4,904 $962 $2,544 $0 $0Magellan Midstream Partners, L.P. MMP $77.1 $82.2 $87.9 8% $550 $500 $500 $500 $0 $0 $0 $0NuStar Energy L.P. NS $40.0 $42.0 $44.0 8% $380 $200 $200 $200 $0 $0 $0 $0ONEOK Partners, L.P. OKS $144.0 $145.0 $157.2 9% $2,189 $1,500 $820 $800 $0 $0 $0 $0Plains All American Pipeline, L.P. PAA $194.9 $199.1 $207.6 9% $1,700 $1,500 $1,000 $750 $0 $0 $0 $0Spectra Energy Partners, LP SEP $270.0 $280.0 $305.0 18% $925 $1,350 $1,100 $1,000 $0 $0 $0 $0Sunoco Logistics Partners L.P. SXL $70.0 $76.6 $78.6 8% $1,600 $750 $750 $750 $0 $0 $0 $0Williams Partners L.P. WPZ $340.0 $325.0 $346.9 11% $3,278 $1,861 $1,723 $1,000 $0 $0 $0 $0Large Cap Pipeline MLP Total $2,607 $2,682 $2,810 9% $21,482 $16,741 $16,375 $14,828 $2,309 $2,544 $0 $0
Blueknight Energy Partners, L.P. BKEP $13.0 $13.5 $14.0 17% $50 $50 $50 $50 $0 $0 $0 $0Crestw ood Midstream Partners LP CMLP $20.6 $26.5 $31.4 4% $413 $400 $350 $300 $0 $0 $0 $0Delek Logistics Partners LP DKL $3.6 $4.3 $4.8 5% $2 $2 $2 $2 $150 $50 $50 $50Exterran Partners, L.P. EXLP $52.0 $57.9 $63.0 19% $177 $195 $200 $200 $205 $205 $0 $0Genesis Energy, L.P. GEL $7.5 $9.3 $11.1 2% $325 $200 $200 $200 $0 $0 $0 $0Global Partners LP GLP $15.6 $16.1 $16.9 9% $50 $50 $50 $50 $0 $0 $0 $0Holly Energy Partners, L.P. HEP $7.0 $7.5 $8.0 3% $45 $100 $150 $150 $0 $0 $0 $0Martin Midstream Partners L.P. MMLP $18.0 $18.5 $19.0 12% $75 $75 $75 $75 $75 $75 $75 $75MPLX LP MPLX $20.5 $26.5 $38.2 14% $63 $90 $155 $50 $150 $300 $750 $1,000NGL Energy Partners LP NGL $29.6 $41.1 $45.6 7% $239 $300 $300 $300 $300 $300 $300 $300Niska Gas Storage Partners LLC NKA $2.6 $2.4 $2.6 2% $2 $0 $0 $0 $0 $0 $0 $0Susser Petroleum Partners LP SUSP $3.0 $3.4 $4.1 4% $10 $10 $10 $10 $143 $153 $140 $140TC PipeLines, LP TCP $24.4 $27.4 $31.7 8% $0 $38 $0 $0 $300 $400 $500 $550Tesoro Logistics LP TLLP $25.0 $29.1 $29.7 8% $100 $100 $125 $125 $150 $500 $500 $500USA Compression Partners LP USAC $18.7 $20.8 $22.4 16% $235 $150 $100 $100 $0 $0 $0 $0Valero Energy Partners LP VLP $2.6 $5.9 $9.1 4% $0 $0 $0 $0 $250 $250 $700 $1,400Western Refining Logistics, LP WNRL $6.9 $9.5 $12.8 9% $11 $11 $11 $11 $261 $423 $180 $340Small Cap Midstream MLP Total $271 $320 $364 8% $1,796 $1,771 $1,778 $1,623 $1,984 $2,655 $3,195 $4,355
Access Midstream Partners, L.P. ACMP $130.0 $130.0 $130.0 12% $1,150 $850 $750 $650 $0 $0 $0 $0American Midstream Partners, LP AMID $5.5 $7.9 $9.3 11% $55 $25 $25 $25 $200 $150 $75 $75Atlas Pipeline Partners, L.P. APL $30.3 $35.4 $41.6 8% $453 $250 $250 $250 $0 $0 $0 $0DCP Midstream Partners, LP DPM $40.5 $46.2 $51.9 8% $500 $250 $250 $250 $1,500 $1,500 $1,500 $1,500EQT Midstream Partners LP EQM $17.3 $17.4 $17.4 8% $53 $100 $100 $100 $610 $500 $500 $500Midcoast Energy Partners LP Class A MEP $30.3 $54.8 $64.3 28% $147 $204 $274 $300 $400 $768 $768 $0MarkWest Energy Partners, L.P. MWE $25.0 $30.0 $35.0 3% $2,050 $2,050 $1,000 $1,000 $0 $0 $0 $0Targa Resources Partners LP NGLS $90.0 $92.0 $94.0 12% $650 $500 $500 $500 $0 $0 $0 $0PVR Partners, L.P. PVR $19.9 $27.0 $28.3 5% $350 $350 $300 $300 $0 $0 $0 $0QEP Midstream Partners LP QEPM $14.8 $9.8 $9.7 15% $3 $0 $0 $0 $200 $200 $250 $450Regency Energy Partners LP RGP $83.0 $115.3 $120.6 7% $803 $736 $686 $686 $7,200 $0 $0 $0Southcross Energy Partners, L.P. SXE $4.8 $6.3 $7.4 8% $125 $75 $75 $75 $0 $0 $0 $0Western Gas Partners, LP WES $61.6 $74.7 $80.5 9% $183 $100 $100 $100 $750 $750 $750 $750Crosstex Energy, L.P. XTEX $50.6 $73.5 $90.2 10% $473 $200 $200 $200 $107 $945 $945 $851Gathering & Processing MLP Total $604 $720 $780 9% $6,993 $5,690 $4,509 $4,436 $10,967 $4,813 $4,788 $4,126
BreitBurn Energy Partners L.P. BBEP $132.4 $146.4 $146.6 26% $200 $100 $100 $100 $300 $300 $300 $300Eagle Rock Energy Partners, L.P. EROC $74.8 $78.5 $84.3 34% $20 $0 $0 $0 $300 $100 $100 $100EV Energy Partners, L.P. EVEP $70.9 $89.1 $99.3 25% $20 $20 $20 $20 $139 $200 $200 $200Legacy Reserves LP LGCY $73.8 $78.6 $82.7 27% $28 $0 $0 $0 $100 $100 $150 $150Linn Energy, LLC LINE $757.1 $824.2 $857.1 32% $538 $600 $600 $600 $0 $1,000 $1,000 $1,000LRR Energy, L.P. LRE $23.1 $23.6 $20.2 25% $12 $0 $0 $0 $50 $50 $50 $50Mid-Con Energy Partners, LP MCEP $9.0 $11.5 $11.9 14% $0 $0 $0 $0 $50 $50 $50 $50Memorial Production Partners LP MEMP $78.0 $90.6 $101.1 26% $50 $15 $0 $0 $250 $250 $250 $250QR Energy, LP QRE $73.7 $76.8 $73.8 25% $15 $15 $15 $15 $200 $200 $200 $200Vanguard Natural Resources, LLC VNR $114.0 $139.8 $148.0 28% $23 $50 $0 $0 $581 $300 $300 $300Upstream MLP Total $1,456 $1,625 $1,710 26% $1,012 $907 $842 $842 $2,370 $2,950 $3,000 $3,000
AmeriGas Partners, L.P. APU $59.7 $59.7 $60.4 10% $54 $55 $55 $55 $100 $80 $80 $80Suburban Propane Partners, L.P. SPH $12.0 $13.9 $15.0 4% $16 $20 $20 $20 $0 $0 $0 $0Propane MLP Total $71.6 $73.6 $75.4 7% $71 $75 $75 $75 $100 $80 $80 $80
Capital Product Partners LP CPLP $8.5 $8.0 $10.0 6% $0 $0 $0 $0 $0 $0 $0 $0Golar LNG Partners LP GMLP $55.6 $56.1 $56.6 17% $0 $0 $0 $0 $250 $0 $0 $0Navios Maritime Partners LP NMM $24.3 $24.3 $17.0 14% $0 $0 $0 $0 $0 $0 $0 $0Seadrill Partners LLC SDLP $44.3 $44.4 $44.4 6% $67 $68 $68 $68 $1,659 $853 $0 $0Teekay LNG Partners L.P. TGP $70.6 $70.6 $70.6 26% $28 $28 $28 $0 $0 $0 $0 $0Teekay Offshore Partners L.P. TOO $50.1 $59.9 $75.4 10% $152 $212 $114 $0 $0 $0 $80 $0Marine MLP Total $253.5 $263.3 $274.0 12% $247 $308 $210 $68 $1,909 $853 $80 $0
Alliance Resource Partners, L.P. ARLP $236.1 $254.0 $262.1 33% $100 $100 $100 $100 $0 $0 $0 $0Natural Resource Partners L.P. NRP $20.0 $12.0 $12.0 7% $0 $0 $0 $0 $0 $0 $0 $0Oxford Resource Partners, LP OXF $21.0 $21.0 $21.0 56% $0 $0 $0 $0 $0 $0 $0 $0Coal MLP Total $277.1 $287.0 $295.1 33% $100 $100 $100 $100 $0 $0 $0 $0
Alliance Holdings GP, L.P. AHGP - - - - - - - - - - - -Atlas Energy, L.P. ATLS - - - - - - - - - - - -Crestw ood Equity Partners LP CEQP - - - - - - - - - - - -Energy Transfer Equity, L.P. ETE - - - - - - - - - - - -NuStar GP Holdings, LLC NSH - - - - - - - - - - - -Western Gas Equity Partners LP WGP - - - - - - - - - - - -General Partner (MLP) Median - - - - - - - - - - - -
Kinder Morgan, Inc. Class P KMI - - - - - - - - - - - -ONEOK, Inc. OKE - - - - - - - - - - - -Plains GP Holdings LP Class A PAGP - - - - - - - - - - - -Targa Resources Corp. TRGP - - - - - - - - - - - -Williams Companies, Inc. WMB $345.0 $330.0 $351.9 12% $4,256 $3,288 $4,033 $1,520 - - - -Crosstex Energy, Inc. XTXI - - - - - - - - - - - -General Partner (C-Corp) Median $345.0 $330.0 $351.9 12% $4,256 $3,288 $4,033 $1,520 - - - -
All MLPs Average $82.7 $89.1 $94.2 13% $473.2 $382.0 $356.6 $327.9 $293.1 $207.4 $166.3 $172.5All MLPs Median $41.6 $46.2 $51.9 10% $106.4 $100.0 $100.0 $100.0 $0.0 $0.0 $0.0 $0.0All MLPs Sum $5,539 $5,971 $6,309 $31,701 $25,592 $23,890 $21,972 $19,638 $13,895 $11,143 $11,561
Note 1: Totals are calculated based on closing dates for acquisitions rather than announcement datesSource: Wells Fargo Securities, LLC estimates Date: 2/28/2014
Ups
trea
m M
LPs
Larg
e C
ap P
ipel
ine
MLP
sSm
all &
Mid
Cap
.C
-Cor
p G
PsPr
op.
Mar
ine
Coa
lM
LP G
PsG
athe
ring
& P
roce
ssin
g M
LPs
Note: On 3/10/14, the tickers for XTEX and XTXI were changed to ENLK and ENLC, respectively

WELLS FARGO SECURITIES, LLC MLP Monthly: March 2014 EQUITY RESEARCH DEPARTMENT
71
Equity Issuance And WACC 2014E Equity IssuanceActual YTD Estimated LT Equity Issuance WACC (50% weight) Max IDR Splits
($MM, except per unit data) Ticker Secondary Secondary + ATM = 2014E 2015E 2016E 2017E Ke Kd 1 WACC LP GP % To GP
Buckeye Partners, L.P. BPL $0 $200 $150 $350 $200 $0 $0 9.9% 4.0% 7.0% 100% 0% 0%Boardw alk Pipeline Partners, LP BWP $0 $0 $0 $0 $0 $0 $0 23.1% 4.1% 13.6% 50% 50% 9%Enbridge Energy Partners, L.P. Class A EEP $0 $0 $200 $200 $0 $0 $0 10.9% 3.2% 7.1% 50% 50% 17%Enbridge Energy Management, L.L.C. EEQ $0 $0 $145 $145 $156 $168 $185 11.2% 3.2% 7.2% 50% 50% 17%El Paso Pipeline Partners, L.P. EPB $0 $773 $175 $948 $175 $175 $200 13.0% 4.0% 8.5% 50% 50% 28%Enterprise Products Partners L.P. EPD $0 $500 $900 $1,400 $735 $735 $735 8.8% 3.0% 5.9% 100% 0% 0%Energy Transfer Partners, L.P. ETP $0 $0 $500 $500 $300 $300 $300 12.4% 4.0% 8.2% 50% 50% 33%Kinder Morgan Energy Partners, L.P. KMP $0 $500 $1,100 $1,600 $1,300 $500 $800 15.7% 5.5% 10.6% 50% 50% 44%Kinder Morgan Management, LLC KMR $0 $0 $730 $730 $820 $903 $1,012 16.7% 5.5% 11.1% 50% 50% 44%Magellan Midstream Partners, L.P. MMP $0 $0 $0 $0 $0 $0 $0 9.8% 3.0% 6.4% 100% 0% 0%NuStar Energy L.P. NS $0 $0 $0 $0 $0 $0 $200 11.5% 5.3% 8.4% 75% 25% 13%ONEOK Partners, L.P. OKS $0 $450 $250 $700 $700 $150 $100 12.2% 2.8% 7.5% 50% 50% 30%Plains All American Pipeline, L.P. PAA $0 $0 $500 $500 $500 $400 $150 11.5% 3.0% 7.3% 50% 50% 33%Spectra Energy Partners, LP SEP $0 $633 $0 $633 $675 $400 $400 9.3% 3.4% 6.3% 50% 50% 17%Sunoco Logistics Partners L.P. SXL $0 ($150) $150 $0 $0 $0 $0 11.7% 4.1% 7.9% 50% 50% 33%Williams Partners L.P. WPZ $0 $1,400 $0 $1,400 $250 $0 $0 10.6% 3.7% 7.2% 50% 50% 13%Large Cap Pipeline MLP Total / Median $0 $4,305 $4,800 $9,106 $5,811 $3,731 $4,082 11.5% 3.8% 7.4% 50% 50% 17%
Blueknight Energy Partners, L.P. BKEP $0 $0 $0 $0 $0 $0 $60 10.9% 4.2% 7.5% 50% 50% 2%Crestw ood Midstream Partners LP CMLP $0 $0 $0 $0 $300 $0 $300 11.9% 4.2% 8.1% 50% 50% 8%Delek Logistics Partners LP DKL $0 $0 $0 $0 $0 $50 $0 10.9% 4.2% 7.5% 50% 50% 2%Exterran Partners, L.P. EXLP $0 $162 $0 $162 $191 $98 $100 9.6% 4.2% 6.9% 50% 50% 8%Genesis Energy, L.P. GEL $0 $0 $0 $0 $150 $0 $0 10.3% 2.9% 6.6% 100% 0% 0%Global Partners LP GLP $0 $0 $0 $0 $0 $0 $0 10.1% 4.2% 7.2% 50% 50% 6%Holly Energy Partners, L.P. HEP $0 $75 $0 $75 $0 $0 $75 11.4% 4.8% 8.1% 50% 50% 23%Martin Midstream Partners L.P. MMLP $0 $75 $50 $125 $125 $50 $50 10.8% 2.7% 6.8% 50% 50% 11%MPLX LP MPLX $0 $0 $0 $0 $150 $375 $500 11.9% 4.2% 8.1% 50% 50% 2%NGL Energy Partners LP NGL $0 $300 $0 $300 $300 $300 $300 11.8% 4.2% 8.0% 50% 50% 6%Niska Gas Storage Partners LLC NKA $0 $6 $0 $6 $0 $0 $0 11.8% 6.6% 9.2% 50% 50% 2%Susser Petroleum Partners LP SUSP $0 $150 $0 $150 $0 $150 $0 9.7% 4.2% 7.0% 50% 50% 0%TC PipeLines, LP TCP $0 $150 $0 $150 $200 $250 $275 9.7% 4.0% 6.9% 75% 25% 2%Tesoro Logistics LP TLLP $0 $75 $0 $75 $250 $250 $250 11.1% 4.2% 7.7% 50% 50% 13%USA Compression Partners LP USAC $0 $125 $0 $125 $0 $0 $0 9.6% 4.2% 6.9% 50% 50% 2%Valero Energy Partners LP VLP $0 $0 $0 $0 $0 $350 $800 13.7% 4.2% 8.9% 50% 50% 2%Western Refining Logistics, LP WNRL $0 $0 $0 $0 $0 $90 $170 11.9% 4.2% 8.1% 50% 50% 0%Small Cap Midstream MLP Total / Median $0 $1,118 $50 $1,168 $1,666 $1,963 $2,880 10.9% 4.2% 7.5% 50% 50% 2%
Access Midstream Partners, L.P. ACMP $0 ($250) $250 $0 $0 $0 $0 10.6% 4.1% 7.3% 50% 50% 12%American Midstream Partners, LP AMID $91 $180 $0 $180 $75 $38 $38 12.9% 4.1% 8.5% 50% 50% 10%Atlas Pipeline Partners, L.P. APL $0 $0 $300 $300 $100 $0 $0 13.2% 4.1% 8.7% 50% 50% 11%DCP Midstream Partners, LP DPM $0 $922 $100 $1,022 $900 $700 $650 12.9% 4.2% 8.5% 50% 50% 25%EQT Midstream Partners LP EQM $0 $350 $0 $350 $250 $150 $150 12.5% 4.1% 8.3% 50% 50% 3%Midcoast Energy Partners LP Class A MEP $0 $0 $0 $0 $653 $653 $100 12.5% 4.1% 8.3% 50% 50% 0%MarkWest Energy Partners, L.P. MWE $0 $0 $1,500 $1,500 $1,000 $0 $0 10.3% 5.0% 7.7% 100% 0% 0%Targa Resources Partners LP NGLS $0 $0 $300 $300 $150 $150 $0 12.1% 4.0% 8.0% 50% 50% 27%PVR Partners, L.P. PVR $0 $0 $0 $0 $200 $150 $150 9.6% 3.3% 6.5% 100% 0% 0%QEP Midstream Partners LP QEPM $0 $0 $0 $0 $100 $125 $225 12.2% 4.1% 8.2% 50% 50% 2%Regency Energy Partners LP RGP $0 $4,735 $150 $4,885 $0 $0 $0 11.3% 4.2% 7.8% 50% 50% 5%Southcross Energy Partners, L.P. SXE $132 $138 $0 $138 $0 $0 $0 12.4% 4.1% 8.3% 50% 50% 2%Western Gas Partners, LP WES $0 $143 $125 $268 $340 $340 $361 10.4% 4.0% 7.2% 50% 50% 22%Crosstex Energy, L.P. XTEX $0 $0 $0 $0 $500 $325 $851 8.4% 4.1% 6.3% 50% 50% 7%Gathering & Processing Total / Median $223 $6,217 $2,725 $8,942 $4,268 $2,630 $2,524 12.1% 4.1% 8.1% 50% 50% 6%
BreitBurn Energy Partners L.P. BBEP $0 $225 $0 $225 $0 $0 $0 11.3% 5.8% 8.5% 98% 2% 0%Eagle Rock Energy Partners, L.P. EROC $0 $0 $0 $0 $50 $50 $50 12.6% 4.6% 8.6% 100% 0% 2%EV Energy Partners, L.P. EVEP $0 $0 $0 $0 $210 $150 $150 11.6% 5.7% 8.7% 75% 25% 2%Legacy Reserves LP LGCY $0 $100 $0 $100 $75 $75 $75 10.8% 5.7% 8.3% 100% 0% 0%Linn Energy, LLC LINE $0 $0 $0 $0 $700 $700 $700 10.3% 4.6% 7.5% 100% 0% 0%LRR Energy, L.P. LRE $0 $70 $0 $70 $20 $20 $20 11.9% 5.7% 8.8% 75% 25% 0%Mid-Con Energy Partners, LP MCEP $0 $0 $0 $0 $38 $13 $38 9.6% 5.7% 7.6% 98% 2% 2%Memorial Production Partners LP MEMP $0 $125 $0 $125 $250 $63 $125 11.2% 5.7% 8.5% 75% 25% 0%QR Energy, LP QRE $0 $140 $0 $140 $140 $140 $140 11.1% 5.7% 8.4% 100% 0% 0%Vanguard Natural Resources, LLC VNR $0 $0 $200 $200 $150 $150 $150 10.7% 5.8% 8.2% 100% 0% 0%Upstream MLP Total / Median $0 $900 $200 $1,100 $1,873 $1,640 $1,728 11.2% 5.7% 8.5% 98% 2% 0%
AmeriGas Partners, L.P. APU $342 $342 $0 $342 $0 $0 $0 10.4% 4.7% 7.6% 50% 50% 7%Suburban Propane Partners, L.P. SPH $0 $0 $0 $0 $0 $0 $0 10.5% 4.7% 7.6% 100% 0% 0%Propane MLP Total / Median $342 $342 $0 $342 $0 $0 $0 10.5% 4.7% 7.6% 75% 25% 4%
Capital Product Partners LP CPLP $0 $0 $0 $0 $0 $0 $0 - 5.7% - 50% 50% 2%Golar LNG Partners LP GMLP $0 $0 $0 $0 $0 $0 $0 11.9% 5.7% 8.8% 50% 50% 5%Navios Maritime Partners LP NMM $0 $0 $0 $0 $0 $0 $0 - 5.7% - 50% 50% 4%Seadrill Partners LLC SDLP $0 $830 $0 $830 $427 $0 $0 - 5.7% - 50% 50% 0%Teekay LNG Partners L.P. TGP $0 $128 $0 $128 $0 $0 $0 - 5.7% - 50% 50% 11%Teekay Offshore Partners L.P. TOO $0 $2,869 $0 $2,869 $3,206 $3,134 $0 - 5.7% - 50% 50% 8%Marine MLP Total / Median $0 $3,826 $0 $3,826 $3,633 $3,134 $0 11.9% 5.7% 8.8% 50% 50% 4%
Alliance Resource Partners, L.P. ARLP $0 $0 $0 $0 $0 $0 $0 - 5.7% - 50% 50% 41%Natural Resource Partners L.P. NRP $0 $0 $0 $0 $0 $0 $0 - 5.7% - 100% 0% 2%Oxford Resource Partners, LP OXF $0 $0 $0 $0 $0 $0 $0 - 5.7% - 50% 50% -Coal MLP Median Total / Median $0 $0 $0 $0 $0 $0 $0 - 5.7% - 50% 50% 22%
Alliance Holdings GP, L.P. AHGP $0 $0 $0 $0 $0 $0 $0 - 5.0% - GP GP NAAtlas Energy, L.P. ATLS $0 $0 $0 $0 $0 $0 $0 14.4% 5.0% 9.7% GP GP NACrestw ood Equity Partners LP CEQP $0 $0 $0 $0 $0 $0 $0 12.6% 5.0% 8.8% GP GP NAEnergy Transfer Equity, L.P. ETE $0 $0 $0 $0 $0 $0 $0 11.8% 5.0% 8.4% GP GP NANuStar GP Holdings, LLC NSH $0 $0 $0 $0 $0 $0 $0 9.9% 5.0% 7.4% GP GP NAWestern Gas Equity Partners LP WGP $0 $0 $0 $0 $0 $0 $0 12.6% 5.0% 8.8% GP GP NAGeneral Partner (MLP) Total / Median $0 $0 $0 $0 $0 $0 $0 12.6% 5.0% 8.8%
Kinder Morgan, Inc. Class P KMI $0 $0 $0 $0 $0 $0 $0 8.6% 5.0% 6.8% GP GP NAONEOK, Inc. OKE $0 $0 $0 $0 $0 $0 $0 9.1% 5.3% 7.2% GP GP NAPlains GP Holdings LP Class A PAGP $0 $0 $0 $0 $0 $0 $0 11.4% 5.0% 8.2% GP GP NATarga Resources Corp. TRGP $0 $0 $0 $0 $0 $0 $0 11.5% 5.0% 8.3% GP GP NAWilliams Companies, Inc. WMB $0 $300 $0 $300 $1,200 $0 $0 10.6% 4.8% 7.7% GP GP NACrosstex Energy, Inc. XTXI $0 $0 $0 $0 $0 $0 $0 10.0% 5.0% 7.5% GP GP NAGeneral Partner (C-Corp) Total / Median $0 $300 $0 $300 $1,200 $0 $0 10.3% 5.0% 7.6%
All MLPs Average (Excl. GPs) $8.2 $242.2 $112.7 $354.8 $250.0 $189.8 $162.5 11.5% 4.6% 8.0% 63% 37% 9%All MLPs Median (Excl. GPs) $0.0 $0.0 $0.0 $125.0 $125.0 $50.0 $50.0 11.3% 4.2% 8.0% 50% 50% 4%All MLPs Sum $565 $16,709 $7,775 $24,484 $17,250 $13,099 $11,213
Note 1: For MLPs w ith publicly-traded debt, Kd = yield to maturity of most recently issued tranche of 10-year senior notesNote 2: Projected amount of equity issuance (in units) divided by total projected trading volume for the year (daily average * 252)Source: Partnership reports, FactSet, and Wells Fargo Securities, LLC estimates
Ups
trea
m M
LPs
Larg
e C
ap P
ipel
ine
MLP
sSm
all &
Mid
Cap
.C
-Cor
p G
PsPr
op.
Mar
ine
Coa
lM
LP G
PsG
athe
ring
& P
roce
ssin
g M
LPs
Note: On 3/10/14, the tickers for XTEX and XTXI were changed to ENLK and ENLC, respectively

WELLS FARGO SECURITIES, LLC Master Limited Partnerships EQUITY RESEARCH DEPARTMENT
72
Sources & Uses Of Cash (2014E)Equity Financing Debt Financing Breakdow n Of
Organic Acquisition LT Debt Total Equity Excess LT Debt ST Debt Total Capex Financing($ in millions) Ticker Capex Capex Maturity Uses Raises Cash Flow Issuance & Other Sources Equity Debt
Buckeye Partners, L.P. BPL $300 $0 $275 $575 $350 $3 $0 $222 $575 >100% <0%Boardw alk Pipeline Partners, LP BWP $330 $0 $0 $330 $0 $296 $0 $34 $330 90% 10%Enbridge Energy Partners, L.P. Class A EEP $1,646 $0 $200 $1,846 $345 ($91) $1,080 $512 $1,846 15% 85%El Paso Pipeline Partners, L.P. EPB $342 $1,347 $0 $1,688 $948 $20 $0 $720 $1,688 57% 43%Enterprise Products Partners L.P. EPD $4,000 $0 $1,150 $5,150 $1,400 $1,067 $0 $2,683 $5,150 62% 38%Energy Transfer Partners, L.P. ETP $794 $0 $380 $1,174 $500 $128 $0 $546 $1,174 79% 21%Kinder Morgan Energy Partners, L.P. KMP $3,448 $962 $500 $4,910 $2,330 ($105) $2,200 $485 $4,910 50% 50%Magellan Midstream Partners, L.P. MMP $550 $0 $250 $800 $0 $137 $250 $413 $800 25% 75%NuStar Energy L.P. NS $380 $0 $0 $380 $0 ($28) $0 $408 $380 <0% >100%ONEOK Partners, L.P. OKS $2,189 $0 $16 $2,205 $700 $47 $500 $958 $2,205 34% 66%Plains All American Pipeline, L.P. PAA $1,700 $0 $0 $1,700 $500 $197 $750 $253 $1,700 41% 59%Spectra Energy Partners, LP SEP $925 $0 $0 $925 $633 $94 $0 $198 $925 79% 21%Sunoco Logistics Partners L.P. SXL $1,600 $0 $175 $1,775 $0 $183 $0 $1,592 $1,775 11% 89%Williams Partners L.P. WPZ $3,278 $0 $0 $3,278 $1,400 ($31) $1,500 $409 $3,278 42% 58%Large Cap Pipeline MLP Total $21,482 $2,309 $2,946 $26,736 $9,106 $1,918 $6,280 $9,433 $26,736 46% 54%
Blueknight Energy Partners, L.P. BKEP $50 $0 $0 $50 $0 $17 $0 $33 $50 35% 65%Crestw ood Midstream Partners LP CMLP $413 $0 $0 $413 $0 $9 $0 $404 $413 2% 98%Delek Logistics Partners LP DKL $2 $150 $0 $152 $0 $24 $0 $128 $152 16% 84%Exterran Partners, L.P. EXLP $177 $205 $0 $381 $162 $38 $350 ($169) $381 53% 47%Genesis Energy, L.P. GEL $325 $0 $0 $325 $0 $42 $250 $33 $325 13% 87%Global Partners LP GLP $50 $0 $115 $165 $0 $51 $0 $114 $165 >100% <0%Holly Energy Partners, L.P. HEP $45 $0 $0 $45 $75 $8 $0 ($38) $45 >100% <0%Martin Midstream Partners L.P. MMLP $75 $75 $0 $150 $125 ($11) $0 $36 $150 76% 24%MPLX LP MPLX $63 $150 $0 $213 $0 $8 $0 $205 $213 4% 96%NGL Energy Partners LP NGL $239 $300 $0 $539 $300 $86 $0 $152 $539 72% 28%Niska Gas Storage Partners LLC NKA $2 $0 $0 $2 $6 $28 $0 ($32) $2 >100% <0%Susser Petroleum Partners LP SUSP $10 $143 $0 $153 $150 $12 $0 ($9) $153 >100% <0%TC PipeLines, LP TCP $0 $300 $0 $300 $150 $25 $200 ($75) $300 58% 42%Tesoro Logistics LP TLLP $100 $150 $0 $250 $75 $31 $0 $144 $250 42% 58%USA Compression Partners LP USAC $235 $0 $0 $235 $125 ($4) $0 $114 $235 51% 49%Valero Energy Partners LP VLP $0 $250 $0 $250 $0 $6 $0 $244 $250 2% 98%Western Refining Logistics, LP WNRL $11 $261 $0 $272 $0 $5 $0 $267 $272 2% 98%Small Cap Midstream MLP Total $1,796 $1,984 $115 $3,896 $1,168 $378 $800 $1,550 $3,896 41% 59%
Access Midstream Partners, L.P. ACMP $1,150 $0 $0 $1,150 $0 $216 $500 $434 $1,150 19% 81%American Midstream Partners, LP AMID $55 $200 $0 $255 $180 $3 $0 $73 $255 71% 29%Atlas Pipeline Partners, L.P. APL $453 $0 $0 $453 $300 $11 $0 $142 $453 69% 31%DCP Midstream Partners, LP DPM $500 $1,500 $0 $2,000 $1,022 ($34) $500 $513 $2,000 49% 51%EQT Midstream Partners LP EQM $53 $610 $0 $663 $350 $65 $0 $248 $663 63% 37%Midcoast Energy Partners LP Class A MEP $147 $400 $0 $547 $0 $16 $250 $281 $547 3% 97%MarkWest Energy Partners, L.P. MWE $2,050 $0 $0 $2,050 $1,500 $30 $0 $520 $2,050 75% 25%Targa Resources Partners LP NGLS $650 $0 $0 $650 $300 $26 $0 $324 $650 50% 50%PVR Partners, L.P. PVR $350 $0 $0 $350 $0 ($2) $0 $352 $350 <0% >100%QEP Midstream Partners LP QEPM $3 $200 $0 $203 $0 $21 $0 $182 $203 10% 90%Regency Energy Partners LP RGP $803 $7,200 $0 $8,003 $4,885 $24 $0 $3,094 $8,003 61% 39%Southcross Energy Partners, L.P. SXE $125 $0 $0 $125 $138 ($1) $0 ($12) $125 >100% <0%Western Gas Partners, LP WES $183 $750 $0 $933 $268 $99 $500 $66 $933 39% 61%Crosstex Energy, L.P. XTEX $473 $107 $0 $580 $0 $14 $0 $566 $580 2% 98%Gathering & Processing MLP Total $6,993 $10,967 $0 $17,960 $8,942 $487 $1,750 $6,782 $17,960 52% 48%
BreitBurn Energy Partners L.P. BBEP $200 $300 $0 $500 $225 $10 $0 $265 $500 47% 53%Eagle Rock Energy Partners, L.P. EROC $20 $300 $0 $320 $0 ($1) $0 $321 $320 <0% >100%EV Energy Partners, L.P. EVEP $20 $139 $0 $159 $0 $0 $0 $158 $159 0% 100%Legacy Reserves LP LGCY $28 $100 $0 $128 $100 $10 $0 $18 $128 86% 14%Linn Energy, LLC LINE $538 $0 $205 $743 $0 $223 $750 ($230) $743 41% 59%LRR Energy, L.P. LRE $12 $50 $0 $62 $70 $3 $0 ($11) $62 >100% <0%Mid-Con Energy Partners, LP MCEP $0 $50 $0 $50 $0 $10 $0 $40 $50 20% 80%Memorial Production Partners LP MEMP $50 $250 $0 $300 $125 $22 $0 $153 $300 49% 51%QR Energy, LP QRE $15 $200 $0 $215 $140 $7 $0 $68 $215 68% 32%Vanguard Natural Resources, LLC VNR $23 $581 $0 $604 $200 $13 $0 $390 $604 35% 65%Upstream MLP Total $1,012 $2,370 $205 $5,465 $1,100 $319 $750 $3,296 $5,465 42% 58%
AmeriGas Partners, L.P. APU $54 $100 $0 $154 $0 $55 $0 $99 $154 36% 64%Suburban Propane Partners, L.P. SPH $16 $0 $0 $16 $0 $12 $0 $4 $16 74% 26%Propane MLP Total $71 $100 $0 $171 $0 $67 $0 $104 $171 39% 61%
Capital Product Partners LP CPLP $0 $0 $5 $5 $0 $26 $0 ($21) $5 - -Golar LNG Partners LP GMLP $0 $250 $60 $310 $0 $46 $203 $62 $310 18% 82%Navios Maritime Partners LP NMM $0 $0 $0 $0 $0 ($2) $0 $2 $0 - -Seadrill Partners LLC SDLP $67 $1,659 $747 $2,473 $830 $93 $1,324 $227 $2,473 53% 47%Teekay LNG Partners L.P. TGP $28 $0 $88 $116 $128 $64 $150 ($226) $116 >100% <0%Teekay Offshore Partners L.P. TOO $152 $0 $0 $152 $2,869 $10 $0 ($2,727) $152 >100% <0%Marine MLP Total $247 $1,909 $900 $3,056 $3,826 $237 $1,676 ($2,684) $3,056 >100% -
Alliance Resource Partners, L.P. ARLP $100 $0 $36 $136 $0 $149 $0 ($12) $136 >100% <0%Natural Resource Partners L.P. NRP $0 $0 $0 $0 $0 $47 $0 ($47) $0 - -Oxford Resource Partners, LP OXF $0 $0 $42 $42 $0 $3 $0 $38 $42 - -Coal MLP Total $100 $0 $78 $178 $0 $199 $0 ($22) $178 >100% -
Alliance Holdings GP, L.P. AHGP $0 $0 $0 $0 $0 $0 $0 $0 $0 - -Atlas Energy, L.P. ATLS $0 $0 $0 $0 $0 $0 $0 ($0) $0 - -Crestw ood Equity Partners LP CEQP $0 $0 $0 $0 $0 ($11) $0 $11 $0 - -Energy Transfer Equity, L.P. ETE $0 $0 $0 $0 $0 ($7) $0 $7 $0 - -NuStar GP Holdings, LLC NSH $0 $0 $0 $0 $0 ($0) $0 $0 $0 - -Western Gas Equity Partners LP WGP $0 $0 $0 $0 $0 $1 $0 ($1) $0 - -General Partner (MLP) Median $0 $0 $0 $0 $0 ($0) $0 $0 $0 - -
Kinder Morgan, Inc. Class P KMI $0 $0 $0 $0 $0 $169 $0 ($169) $0 - -ONEOK, Inc. OKE $0 $0 $0 $0 $0 $96 $0 ($96) $0 - -Plains GP Holdings LP Class A PAGP $0 $0 $0 $0 $0 $330 $0 ($330) $0 - -Targa Resources Corp. TRGP $0 $0 $0 $0 $0 $13 $0 ($13) $0 - -Williams Companies, Inc. WMB $4,256 $0 $0 $4,256 $300 $291 $0 $3,665 $4,256 14% 86%Crosstex Energy, Inc. XTXI $0 $0 $0 $0 $0 $69 $0 ($69) $0 - -General Partner (C-Corp) Median $0 $0 $0 $0 $0 $132 $0 ($82) $0 - -
All MLPs Sum $31,701 $19,638 $4,244 $57,461 $24,142 $3,587 $11,256 $18,476 $57,461 54% 46%
Note: KMP and EEP equity raises include KMR and EEQ PIK distributionsSource: Company data and Wells Fargo Securities, LLC estimates
Smal
l & M
id C
ap.
Prop
.M
arin
eC
oal
MLP
GPs
C-C
orp
GPs
Gat
herin
g &
Pro
cess
ing
MLP
sU
pstr
eam
MLP
s
=
Larg
e C
ap P
ipel
ine
MLP
s
+ + = + + +
Note: On 3/10/14, the tickers for XTEX and XTXI were changed to ENLK and ENLC, respectively
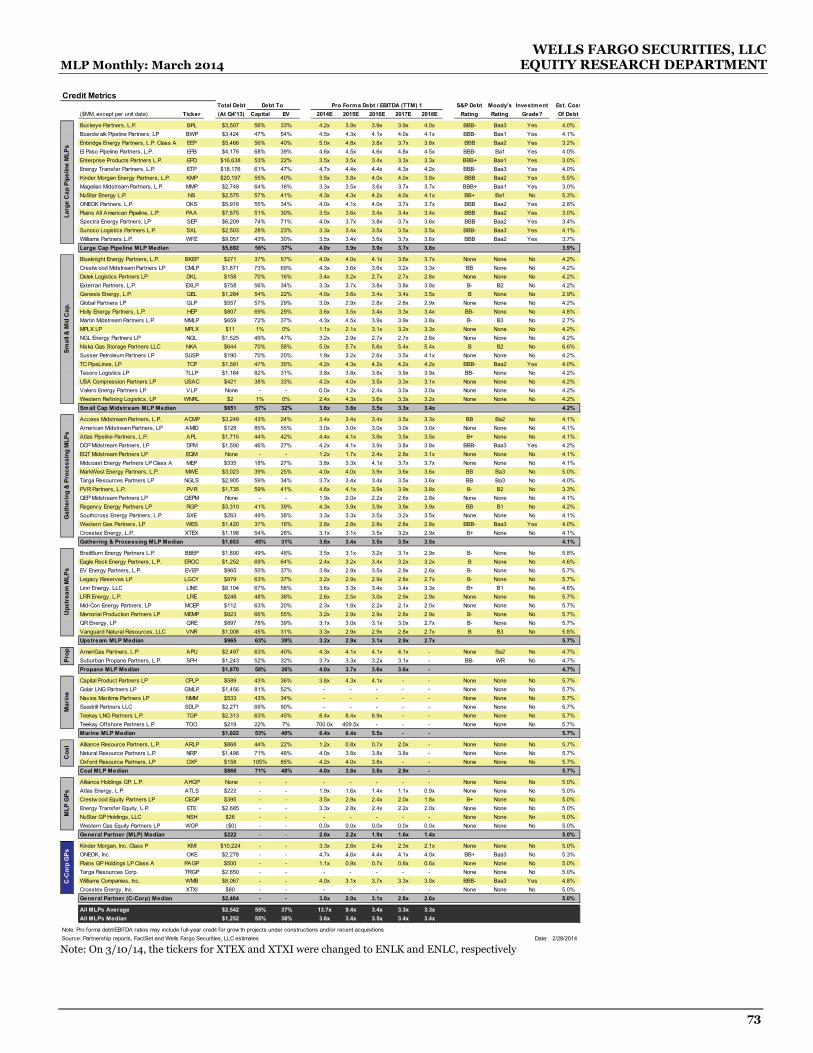
WELLS FARGO SECURITIES, LLC MLP Monthly: March 2014 EQUITY RESEARCH DEPARTMENT
73
Credit MetricsTotal Debt Debt To Pro Forma Debt / EBITDA (TTM) 1 S&P Debt Moody's Investment Est. Cost
($MM, except per unit data) Ticker (At Q4'13) Capital EV 2014E 2015E 2016E 2017E 2018E Rating Rating Grade? Of Debt
Buckeye Partners, L.P. BPL $3,507 56% 33% 4.2x 3.9x 3.9x 3.9x 4.0x BBB- Baa3 Yes 4.0%Boardw alk Pipeline Partners, LP BWP $3,424 47% 54% 4.5x 4.3x 4.1x 4.0x 4.1x BBB- Baa1 Yes 4.1%Enbridge Energy Partners, L.P. Class A EEP $5,466 56% 40% 5.0x 4.8x 3.8x 3.7x 3.8x BBB Baa2 Yes 3.2%El Paso Pipeline Partners, L.P. EPB $4,178 68% 39% 4.6x 4.5x 4.6x 4.8x 4.5x BBB- Ba1 Yes 4.0%Enterprise Products Partners L.P. EPD $16,638 53% 22% 3.5x 3.5x 3.4x 3.3x 3.3x BBB+ Baa1 Yes 3.0%Energy Transfer Partners, L.P. ETP $18,176 61% 47% 4.7x 4.4x 4.4x 4.3x 4.2x BBB- Baa3 Yes 4.0%Kinder Morgan Energy Partners, L.P. KMP $20,197 55% 40% 3.5x 3.8x 4.0x 4.0x 3.8x BBB Baa2 Yes 5.5%Magellan Midstream Partners, L.P. MMP $2,748 64% 16% 3.3x 3.5x 3.6x 3.7x 3.7x BBB+ Baa1 Yes 3.0%NuStar Energy L.P. NS $2,575 57% 41% 4.3x 4.3x 4.2x 4.0x 4.1x BB+ Ba1 No 5.3%ONEOK Partners, L.P. OKS $5,918 55% 34% 4.0x 4.1x 4.0x 3.7x 3.7x BBB Baa2 Yes 2.8%Plains All American Pipeline, L.P. PAA $7,875 51% 30% 3.5x 3.6x 3.4x 3.4x 3.4x BBB Baa2 Yes 3.0%Spectra Energy Partners, LP SEP $6,209 74% 71% 4.0x 3.7x 3.8x 3.7x 3.6x BBB Baa2 Yes 3.4%Sunoco Logistics Partners L.P. SXL $2,503 28% 23% 3.3x 3.4x 3.5x 3.5x 3.5x BBB- Baa3 Yes 4.1%Williams Partners L.P. WPZ $9,057 43% 30% 3.5x 3.4x 3.6x 3.7x 3.6x BBB Baa2 Yes 3.7%Large Cap Pipeline MLP Median $5,692 56% 37% 4.0x 3.9x 3.9x 3.7x 3.8x 3.9%
Blueknight Energy Partners, L.P. BKEP $271 37% 57% 4.0x 4.0x 4.1x 3.6x 3.7x None None No 4.2%Crestw ood Midstream Partners LP CMLP $1,871 73% 69% 4.3x 3.6x 3.6x 3.2x 3.3x BB None No 4.2%Delek Logistics Partners LP DKL $158 70% 16% 3.4x 3.2x 2.7x 2.7x 2.8x None None No 4.2%Exterran Partners, L.P. EXLP $758 56% 34% 3.3x 3.7x 3.8x 3.8x 3.8x B- B2 No 4.2%Genesis Energy, L.P. GEL $1,284 54% 22% 4.0x 3.6x 3.4x 3.4x 3.5x B None No 2.9%Global Partners LP GLP $557 57% 29% 3.0x 2.9x 2.8x 2.8x 2.9x None None No 4.2%Holly Energy Partners, L.P. HEP $807 69% 29% 3.6x 3.5x 3.4x 3.3x 3.4x BB- None No 4.8%Martin Midstream Partners L.P. MMLP $659 72% 37% 4.3x 4.5x 3.9x 3.9x 3.8x B- B3 No 2.7%MPLX LP MPLX $11 1% 0% 1.1x 2.1x 3.1x 3.2x 3.3x None None No 4.2%NGL Energy Partners LP NGL $1,525 49% 47% 3.2x 2.9x 2.7x 2.7x 2.6x None None No 4.2%Niska Gas Storage Partners LLC NKA $644 70% 58% 5.0x 5.7x 5.6x 5.4x 5.4x B B2 No 6.6%Susser Petroleum Partners LP SUSP $190 70% 20% 1.9x 3.2x 2.6x 3.5x 4.1x None None No 4.2%TC PipeLines, LP TCP $1,581 47% 35% 4.2x 4.3x 4.2x 4.2x 4.2x BBB- Baa2 Yes 4.0%Tesoro Logistics LP TLLP $1,164 82% 31% 3.8x 3.8x 3.8x 3.9x 3.9x BB- None No 4.2%USA Compression Partners LP USAC $421 38% 33% 4.2x 4.0x 3.5x 3.3x 3.1x None None No 4.2%Valero Energy Partners LP VLP None - - 0.0x 1.2x 2.4x 3.0x 3.0x None None No 4.2%Western Refining Logistics, LP WNRL $2 1% 0% 2.4x 4.3x 3.6x 3.3x 3.2x None None No 4.2%Small Cap Midstream MLP Median $651 57% 32% 3.6x 3.6x 3.5x 3.3x 3.4x 4.2%
Access Midstream Partners, L.P. ACMP $3,249 43% 24% 3.4x 3.4x 3.4x 3.5x 3.3x BB Ba2 No 4.1%American Midstream Partners, LP AMID $128 85% 55% 3.0x 3.0x 3.0x 3.0x 3.0x None None No 4.1%Atlas Pipeline Partners, L.P. APL $1,715 44% 42% 4.4x 4.1x 3.9x 3.5x 3.5x B+ None No 4.1%DCP Midstream Partners, LP DPM $1,590 46% 27% 4.2x 4.1x 3.9x 3.8x 3.8x BBB- Baa3 Yes 4.2%EQT Midstream Partners LP EQM None - - 1.2x 1.7x 2.4x 2.8x 3.1x None None No 4.1%Midcoast Energy Partners LP Class A MEP $335 18% 27% 3.8x 3.3x 4.1x 3.7x 3.7x None None No 4.1%MarkWest Energy Partners, L.P. MWE $3,023 39% 25% 4.0x 4.0x 3.9x 3.6x 3.6x BB Ba3 No 5.0%Targa Resources Partners LP NGLS $2,905 59% 34% 3.7x 3.4x 3.4x 3.5x 3.6x BB Ba3 No 4.0%PVR Partners, L.P. PVR $1,735 59% 41% 4.6x 4.1x 3.9x 3.9x 3.8x B- B2 No 3.3%QEP Midstream Partners LP QEPM None - - 1.9x 2.0x 2.2x 2.6x 2.8x None None No 4.1%Regency Energy Partners LP RGP $3,310 41% 39% 4.3x 3.9x 3.9x 3.9x 3.9x BB B1 No 4.2%Southcross Energy Partners, L.P. SXE $263 49% 38% 3.3x 3.3x 3.5x 3.2x 3.5x None None No 4.1%Western Gas Partners, LP WES $1,420 37% 16% 2.8x 2.8x 2.8x 2.8x 2.8x BBB- Baa3 Yes 4.0%Crosstex Energy, L.P. XTEX $1,198 54% 28% 3.1x 3.1x 3.5x 3.2x 2.9x B+ None No 4.1%Gathering & Processing MLP Median $1,653 45% 31% 3.6x 3.4x 3.5x 3.5x 3.5x 4.1%
BreitBurn Energy Partners L.P. BBEP $1,890 49% 48% 3.5x 3.1x 3.2x 3.1x 2.9x B- None No 5.8%Eagle Rock Energy Partners, L.P. EROC $1,252 69% 64% 2.4x 3.2x 3.4x 3.2x 3.2x B None No 4.6%EV Energy Partners, L.P. EVEP $965 50% 37% 3.8x 2.9x 3.5x 2.9x 2.6x B- None No 5.7%Legacy Reserves LP LGCY $879 63% 37% 3.2x 2.9x 2.9x 2.8x 2.7x B- None No 5.7%Linn Energy, LLC LINE $8,104 67% 58% 3.6x 3.3x 3.4x 3.4x 3.3x B+ B1 No 4.6%LRR Energy, L.P. LRE $248 48% 36% 2.6x 2.5x 3.0x 2.9x 2.9x None None No 5.7%Mid-Con Energy Partners, LP MCEP $112 63% 20% 2.3x 1.8x 2.2x 2.1x 2.0x None None No 5.7%Memorial Production Partners LP MEMP $823 66% 55% 3.2x 2.9x 2.9x 2.8x 2.9x B- None No 5.7%QR Energy, LP QRE $897 78% 39% 3.1x 3.0x 3.1x 3.0x 2.7x B- None No 5.7%Vanguard Natural Resources, LLC VNR $1,008 45% 31% 3.3x 2.9x 2.9x 2.8x 2.7x B B3 No 5.8%Upstream MLP Median $965 63% 39% 3.2x 2.9x 3.1x 2.9x 2.7x 5.7%
AmeriGas Partners, L.P. APU $2,497 63% 40% 4.3x 4.1x 4.1x 4.1x - None Ba2 No 4.7%Suburban Propane Partners, L.P. SPH $1,243 52% 32% 3.7x 3.3x 3.2x 3.1x - BB- WR No 4.7%Propane MLP Median $1,870 58% 36% 4.0x 3.7x 3.6x 3.6x - 4.7%
Capital Product Partners LP CPLP $589 43% 36% 3.8x 4.3x 4.1x - - None None No 5.7%Golar LNG Partners LP GMLP $1,456 81% 52% - - - - - None None No 5.7%Navios Maritime Partners LP NMM $533 43% 34% - - - - - None None No 5.7%Seadrill Partners LLC SDLP $2,271 69% 90% - - - - - None None No 5.7%Teekay LNG Partners L.P. TGP $2,313 63% 45% 8.4x 8.4x 6.9x - - None None No 5.7%Teekay Offshore Partners L.P. TOO $219 22% 7% 700.0x 409.5x - - - None None No 5.7%Marine MLP Median $1,022 53% 40% 8.4x 8.4x 5.5x - - 5.7%
Alliance Resource Partners, L.P. ARLP $868 44% 22% 1.2x 0.8x 0.7x 2.0x - None None No 5.7%Natural Resource Partners L.P. NRP $1,496 71% 48% 4.0x 3.8x 3.8x 3.8x - None None No 5.7%Oxford Resource Partners, LP OXF $158 105% 85% 4.2x 4.0x 3.8x - - None None No 5.7%Coal MLP Median $868 71% 48% 4.0x 3.8x 3.8x 2.9x - 5.7%
Alliance Holdings GP, L.P. AHGP None - - - - - - - None None No 5.0%Atlas Energy, L.P. ATLS $222 - - 1.9x 1.6x 1.4x 1.1x 0.9x None None No 5.0%Crestw ood Equity Partners LP CEQP $395 - - 3.5x 2.9x 2.4x 2.0x 1.8x B+ None No 5.0%Energy Transfer Equity, L.P. ETE $2,685 - - 3.3x 2.8x 2.4x 2.2x 2.0x None None No 5.0%NuStar GP Holdings, LLC NSH $26 - - - - - - - None None No 5.0%Western Gas Equity Partners LP WGP ($0) - - 0.0x 0.0x 0.0x 0.0x 0.0x None None No 5.0%General Partner (MLP) Median $222 - - 2.6x 2.2x 1.9x 1.6x 1.4x 5.0%
Kinder Morgan, Inc. Class P KMI $10,224 - - 3.3x 2.6x 2.4x 2.3x 2.1x None None No 5.0%ONEOK, Inc. OKE $2,278 - - 4.7x 4.6x 4.4x 4.1x 4.0x BB+ Baa3 No 5.3%Plains GP Holdings LP Class A PAGP $500 - - 1.1x 0.9x 0.7x 0.6x 0.6x None None No 5.0%Targa Resources Corp. TRGP $2,650 - - - - - - - None None No 5.0%Williams Companies, Inc. WMB $8,067 - - 4.0x 3.1x 3.7x 3.3x 3.0x BBB- Baa3 Yes 4.8%Crosstex Energy, Inc. XTXI $80 - - - - - - - None None No 5.0%General Partner (C-Corp) Median $2,464 - - 3.6x 2.9x 3.1x 2.8x 2.6x 5.0%
All MLPs Average $2,542 55% 37% 13.7x 9.4x 3.4x 3.3x 3.3xAll MLPs Median $1,252 55% 36% 3.6x 3.4x 3.5x 3.4x 3.4x
Note: Pro forma debt/EBITDA ratios may include full-year credit for grow th projects under constructions and/or recent acquisitionsSource: Partnership reports, FactSet and Wells Fargo Securities, LLC estimates Date: 2/28/2014
Ups
trea
m M
LPs
Larg
e C
ap P
ipel
ine
MLP
sSm
all &
Mid
Cap
.C
-Cor
p G
PsPr
op.
Mar
ine
Coa
lM
LP G
PsG
athe
ring
& P
roce
ssin
g M
LPs
Note: On 3/10/14, the tickers for XTEX and XTXI were changed to ENLK and ENLC, respectively

WELLS FARGO SECURITIES, LLC Master Limited Partnerships EQUITY RESEARCH DEPARTMENT
74
Price Performance (All MLPs)Price Price Performance (% ∆) Total Return Performance (% ∆)
Ticker 2/28/2014 WTD MTD QTD MTD QTD YTD TTM
Sunoco Logistics Partners L.P. SXL $82.74 1.8% 5.3% 9.6% 9.6% 6.1% 10.5% 10.5% 36.3%Magellan Midstream Partners, L.P. MMP $67.67 0.3% 1.8% 7.0% 7.0% 2.7% 7.9% 7.9% 39.3%Spectra Energy Partners, LP SEP $47.72 (2.5%) 7.7% 5.2% 5.2% 9.0% 6.4% 6.4% 34.9%Plains All American Pipeline, L.P. PAA $54.17 2.2% 7.3% 4.6% 4.6% 7.3% 5.8% 5.8% 3.3%Buckeye Partners, L.P. BPL $73.23 0.0% 0.3% 3.1% 3.1% 1.8% 4.7% 4.7% 39.1%Enterprise Products Partners L.P. EPD $67.11 2.7% 1.1% 1.2% 1.2% 1.1% 2.3% 2.3% 23.3%ONEOK Partners, L.P. OKS $53.11 (4.4%) 2.5% 0.9% 0.9% 2.5% 2.3% 2.3% 2.2%NuStar Energy L.P. NS $49.92 (2.4%) 0.8% (2.1%) (2.1%) 3.1% 0.0% 0.0% 6.4%Williams Partners L.P. WPZ $49.61 2.4% (1.0%) (2.5%) (2.5%) 0.8% (0.7%) (0.7%) 6.8%Energy Transfer Partners, L.P. ETP $55.53 3.3% 0.0% (3.0%) (3.0%) 1.7% (1.4%) (1.4%) 23.4%Enbridge Energy Management, L.L.C. EEQ $26.75 (0.6%) (3.4%) (4.9%) (4.9%) (3.4%) (4.9%) (4.9%) 5.3%Kinder Morgan Management, LLC KMR $69.80 (5.8%) (7.5%) (6.1%) (6.1%) (7.5%) (6.1%) (6.1%) (10.0%)Enbridge Energy Partners, L.P. Class A EEP $27.52 1.4% (6.3%) (7.9%) (7.9%) (4.5%) (6.0%) (6.0%) 7.2%Kinder Morgan Energy Partners, L.P. KMP $74.27 (5.3%) (6.6%) (7.9%) (7.9%) (6.6%) (6.2%) (6.2%) (8.8%)El Paso Pipeline Partners, L.P. EPB $30.05 0.1% (8.4%) (16.5%) (16.5%) (8.4%) (14.7%) (14.7%) (22.0%)Boardw alk Pipeline Partners, LP BWP $12.31 (5.2%) (50.0%) (51.8%) (51.8%) (49.6%) (51.4%) (51.4%) (47.2%)Large Cap Pipeline MLP Median 0.1% 0.2% (2.3%) (2.3%) 1.4% (0.3%) (0.3%) 6.6%
Phillips 66 Partners LP PSXP $45.82 (4.5%) 22.4% 20.8% 20.8% 22.4% 21.4% 21.4% NATallgrass Energy Partners LP TEP $31.33 11.8% 19.3% 20.5% 20.5% 19.3% 21.7% 21.7% NATesoro Logistics LP TLLP $60.20 3.8% 13.2% 15.0% 15.0% 13.2% 16.1% 16.1% 24.9%Western Refining Logistics, LP WNRL $29.25 2.2% 6.0% 13.1% 13.1% 6.9% 14.0% 14.0% NAOiltanking Partners, L.P. OILT $69.21 9.0% 8.8% 11.5% 11.5% 8.8% 12.3% 12.3% 61.6%MPLX LP MPLX $48.81 0.7% 6.1% 9.6% 9.6% 6.1% 10.3% 10.3% 52.9%World Point Terminals LP WPT $21.00 (1.3%) 7.5% 9.1% 9.1% 7.5% 10.6% 10.6% NAGlobal Partners LP GLP $38.26 (0.5%) (5.0%) 8.1% 8.1% (3.5%) 9.8% 9.8% 20.4%Valero Energy Partners LP VLP $36.99 (6.6%) 4.1% 7.4% 7.4% 4.1% 7.5% 7.5% NASusser Petroleum Partners LP SUSP $35.41 (2.0%) 2.3% 7.0% 7.0% 3.7% 8.4% 8.4% 27.8%Delek Logistics Partners LP DKL $33.80 1.5% 3.9% 6.8% 6.8% 3.9% 8.1% 8.1% 25.6%Blueknight Energy Partners, L.P. BKEP $9.03 0.3% 0.6% 6.1% 6.1% 0.6% 7.6% 7.6% 23.0%NGL Energy Partners LP NGL $36.26 (0.9%) 3.6% 5.1% 5.1% 3.6% 6.6% 6.6% 57.1%Genesis Energy, L.P. GEL $55.00 5.1% (0.1%) 4.6% 4.6% (0.1%) 5.6% 5.6% 24.2%Holly Energy Partners, L.P. HEP $33.60 2.2% 3.8% 3.9% 3.9% 3.8% 5.5% 5.5% (13.8%)Rose Rock Midstream, L.P. RRMS $38.92 2.6% 6.8% 0.6% 0.6% 6.8% 1.8% 1.8% 19.7%Cheniere Energy Partners, L.P. CQP $28.44 (0.5%) 1.6% (0.7%) (0.7%) 1.6% 0.8% 0.8% 25.6%Martin Midstream Partners L.P. MMLP $42.07 (3.9%) (3.1%) (1.7%) (1.7%) (1.3%) 0.1% 0.1% 30.4%TransMontaigne Partners L.P. TLP $41.30 (3.9%) (5.8%) (2.8%) (2.8%) (5.8%) (1.3%) (1.3%) (4.2%)TC PipeLines, LP TCP $46.62 (0.8%) 0.2% (3.7%) (3.7%) 0.2% (2.1%) (2.1%) 8.7%Lehigh Gas Partners LP LGP $26.72 (0.5%) (5.9%) (6.6%) (6.6%) (5.9%) (6.6%) (6.6%) 35.3%Arc Logistics Partners LP ARCX $20.15 (1.0%) (4.1%) (8.0%) (8.0%) (3.1%) (7.0%) (7.0%) NACrestw ood Midstream Partners LP CMLP $22.39 (4.6%) (3.1%) (10.0%) (10.0%) (1.3%) (8.4%) (8.4%) 0.3%OCI Partners LP OCIP $24.76 1.5% (4.2%) (10.3%) (10.3%) (4.2%) (10.3%) (10.3%) NANiska Gas Storage Partners LLC NKA $13.24 6.9% (14.1%) (10.3%) (10.3%) (11.8%) (7.9%) (7.9%) 24.0%Small Cap Midstream MLP Median (0.5%) 2.3% 5.1% 5.1% 3.6% 6.6% 6.6% 24.5%
Compressco Partners, L.P. GSJK $23.29 5.9% 2.5% 15.6% 15.6% 2.5% 17.8% 17.8% 32.4%USA Compression Partners LP USAC $27.26 2.2% (0.1%) 1.7% 1.7% (0.1%) 3.5% 3.5% 55.5%Exterran Partners, L.P. EXLP $30.00 2.5% 0.3% (0.8%) (0.8%) 2.1% 1.0% 1.0% 36.1%Hi-Crush Partners LP HCLP $37.65 0.4% 3.2% (0.9%) (0.9%) 3.2% 0.5% 0.5% 111.2%Oilfield Services MLP Median 2.3% 1.4% 0.5% 0.5% 2.3% 2.3% 2.3% 45.8%
EQT Midstream Partners LP EQM $65.91 0.7% 6.0% 12.1% 12.1% 6.0% 12.9% 12.9% 78.1%Crosstex Energy, L.P. XTEX $30.89 2.9% 12.4% 11.9% 11.9% 12.4% 13.2% 13.2% 91.2%Summit Midstream Partners LP SMLP $40.58 3.2% 6.8% 10.7% 10.7% 8.0% 12.0% 12.0% 88.2%Marlin Midstream Partners LP FISH $18.14 2.9% 4.9% 8.0% 8.0% 4.9% 10.1% 10.1% NAMidcoast Energy Partners LP Class A MEP $20.46 3.0% (2.6%) 4.4% 4.4% (1.8%) 5.2% 5.2% NATarga Resources Partners LP NGLS $53.69 0.8% 2.2% 2.7% 2.7% 2.2% 4.1% 4.1% 37.4%Western Gas Partners, LP WES $63.29 2.9% 6.4% 2.6% 2.6% 6.4% 3.6% 3.6% 19.6%PVR Partners, L.P. PVR $26.84 (3.1%) (4.3%) 0.0% 0.0% (2.3%) 2.1% 2.1% 25.2%Regency Energy Partners LP RGP $26.25 (3.5%) (4.3%) (0.0%) (0.0%) (2.6%) 1.8% 1.8% 18.2%Access Midstream Partners, L.P. ACMP $56.45 0.9% 0.7% (0.2%) (0.2%) 1.7% 0.8% 0.8% 57.1%Southcross Energy Partners, L.P. SXE $17.60 (1.0%) (1.3%) (2.4%) (2.4%) 0.9% (0.2%) (0.2%) (16.2%)DCP Midstream Partners, LP DPM $48.80 1.5% (2.8%) (3.1%) (3.1%) (1.4%) (1.6%) (1.6%) 27.2%MarkWest Energy Partners, L.P. MWE $63.85 (9.4%) (9.0%) (3.4%) (3.4%) (7.8%) (2.1%) (2.1%) 17.6%QEP Midstream Partners LP QEPM $21.37 (8.3%) (10.6%) (8.0%) (8.0%) (10.6%) (6.8%) (6.8%) NAAtlas Pipeline Partners, L.P. APL $30.74 (2.7%) (8.0%) (12.3%) (12.3%) (6.2%) (10.5%) (10.5%) 0.5%American Midstream Partners, LP AMID $23.52 (1.5%) (11.3%) (13.1%) (13.1%) (9.6%) (11.5%) (11.5%) 50.1%Gathering & Processing MLP Median 0.7% (2.0%) (0.0%) (0.0%) (0.2%) 1.9% 1.9% 27.2%
Atlas Resource Partners, L.P. ARP $21.66 4.5% (3.6%) 5.8% 5.8% (1.0%) 8.6% 8.6% 3.5%New Source Energy Partners LP NSLP $24.27 (0.1%) 2.1% 3.9% 3.9% 2.1% 6.3% 6.3% 30.9%Linn Energy, LLC LINE $31.87 (4.4%) (2.8%) 3.5% 3.5% (2.1%) 5.1% 5.1% (9.2%)EV Energy Partners, L.P. EVEP $35.08 (0.1%) (2.4%) 3.4% 3.4% (0.2%) 5.7% 5.7% (31.9%)Mid-Con Energy Partners, LP MCEP $23.57 1.6% 0.9% 3.2% 3.2% 3.1% 5.4% 5.4% 16.5%QR Energy, LP QRE $17.54 0.9% (1.3%) 2.5% 2.5% (0.4%) 4.4% 4.4% 11.0%Memorial Production Partners LP MEMP $22.34 2.1% 1.9% 1.8% 1.8% 4.4% 4.3% 4.3% 30.3%Vanguard Natural Resources, LLC VNR $29.86 (2.8%) (1.1%) 1.2% 1.2% (0.4%) 2.6% 2.6% 16.3%LRR Energy, L.P. LRE $17.07 (2.5%) 4.4% 0.2% 0.2% 4.4% 3.1% 3.1% 8.5%LinnCo. LLC LNCO $30.48 (3.2%) (5.3%) (1.1%) (1.1%) (4.6%) 0.5% 0.5% (15.0%)BreitBurn Energy Partners L.P. BBEP $19.99 (5.2%) (2.7%) (1.7%) (1.7%) (1.9%) (0.1%) (0.1%) 11.9%Legacy Reserves LP LGCY $26.40 0.2% 1.2% (6.3%) (6.3%) 1.2% (4.2%) (4.2%) 8.9%Eagle Rock Energy Partners, L.P. EROC $4.85 (5.6%) (12.1%) (18.5%) (18.5%) (9.4%) (16.0%) (16.0%) (41.3%)Upstream MLP Median (0.1%) (1.3%) 1.8% 1.8% (0.4%) 4.3% 4.3% 8.9%
Ferrellgas Partners, L.P. FGP $25.51 2.0% 4.2% 11.2% 11.2% 4.2% 11.2% 11.2% 33.6%Star Gas Partners, L.P. SGU $5.65 0.0% 0.0% 7.6% 7.6% 0.0% 9.2% 9.2% 35.3%AmeriGas Partners, L.P. APU $42.37 0.5% (1.1%) (4.9%) (4.9%) 0.8% (3.1%) (3.1%) 4.7%Suburban Propane Partners, L.P. SPH $43.08 (2.1%) (2.8%) (8.1%) (8.1%) (2.8%) (6.3%) (6.3%) 10.6%Propane MLP Median 0.2% (0.6%) 1.3% 1.3% 0.4% 3.1% 3.1% 22.1%
Capital Product Partners LP CPLP $10.76 2.6% 2.3% 2.8% 2.8% 4.5% 5.0% 5.0% 46.3%KNOT Offshore Partners LP KNOP $28.75 1.1% 7.3% 2.3% 2.3% 7.3% 3.8% 3.8% NASeadrill Partners LLC SDLP $31.41 (0.6%) 1.7% 1.3% 1.3% 3.2% 2.8% 2.8% 18.2%Golar LNG Partners LP GMLP $30.21 2.1% (0.8%) (0.1%) (0.1%) 0.9% 1.6% 1.6% 8.5%Teekay Offshore Partners L.P. TOO $32.76 3.1% 4.1% (1.0%) (1.0%) 4.1% 0.6% 0.6% 24.6%Teekay LNG Partners L.P. TGP $41.67 4.2% 3.0% (2.4%) (2.4%) 3.0% (0.8%) (0.8%) 13.4%Navios Maritime Partners LP NMM $17.10 1.9% (6.9%) (10.6%) (10.6%) (4.5%) (8.3%) (8.3%) 36.9%Marine MLP Median 2.1% 2.3% (0.1%) (0.1%) 3.2% 1.6% 1.6% 21.4%
Alliance Resource Partners, L.P. ARLP $86.16 5.3% 4.6% 11.9% 11.9% 6.0% 13.5% 13.5% 46.3%Rhino Resource Partners LP RNO $12.56 6.6% 8.7% 10.4% 10.4% 8.7% 14.3% 14.3% 2.1%Oxford Resource Partners, LP OXF $1.18 (4.1%) (6.3%) (4.1%) (4.1%) (6.3%) (4.1%) (4.1%) (54.4%)Natural Resource Partners L.P. NRP $15.12 0.8% (4.1%) (24.2%) (24.2%) (4.1%) (22.4%) (22.4%) (21.7%)Coal MLP Median 3.0% 0.3% 3.2% 3.2% 1.0% 4.7% 4.7% (9.8%)
Cypress Energy Partners LP CELP $23.89 3.2% 2.4% NA NA 2.4% NA NA NACVR Partners, LP UAN $19.85 0.2% 11.7% 20.6% 20.6% 14.1% 23.2% 23.2% (17.8%)Terra Nitrogen Company, L.P. TNH $165.16 (1.6%) 5.1% 17.1% 17.1% 6.4% 18.5% 18.5% (24.1%)SunCoke Energy Partners LP SXCP $30.80 (1.5%) 6.6% 13.7% 13.7% 8.3% 15.4% 15.4% 64.3%PetroLogistics LP PDH $12.91 6.0% 12.8% 10.8% 10.8% 15.4% 13.4% 13.4% (6.3%)Rentech Nitrogen Partners, L.P. RNF $18.43 3.2% 2.0% 4.7% 4.7% 2.3% 5.0% 5.0% (51.0%)Emerge Energy Services LP EMES $45.75 1.6% (1.5%) 3.2% 3.2% 0.6% 5.5% 5.5% NANorthern Tier Energy LP Class A NTI $24.18 0.7% (2.1%) (1.7%) (1.7%) (0.4%) (0.0%) (0.0%) (7.4%)Calumet Specialty Products Partners, L.P. CLMT $25.47 (6.2%) (12.4%) (2.1%) (2.1%) (12.4%) 0.5% 0.5% (26.5%)CVR Refining LP CVRR $20.88 (6.6%) (6.7%) (7.7%) (7.7%) (4.6%) (5.7%) (5.7%) (17.6%)OCI Partners LP OCIP $24.76 1.5% (4.2%) (10.3%) (10.3%) (4.2%) (10.3%) (10.3%) NAAlon USA Partners LP ALDW $14.24 (0.4%) (7.3%) (14.5%) (14.5%) (6.1%) (13.4%) (13.4%) (39.1%)Non-Traditional MLP Median 0.4% 0.2% 3.2% 3.2% 1.5% 5.0% 5.0% (17.8%)
Western Gas Equity Partners LP WGP $42.98 0.7% 4.4% 8.8% 8.8% 4.4% 9.4% 9.4% 28.9%NuStar GP Holdings, LLC NSH $30.04 (3.4%) 6.8% 6.9% 6.9% 8.7% 8.9% 8.9% 6.5%Energy Transfer Equity, L.P. ETE $43.65 1.6% 4.6% 6.8% 6.8% 5.5% 7.6% 7.6% 69.1%Alliance Holdings GP, L.P. AHGP $62.20 1.8% (0.5%) 6.1% 6.1% 0.8% 7.5% 7.5% 25.9%Crestw ood Equity Partners LP CEQP $13.41 3.3% 3.0% (3.0%) (3.0%) 4.1% (2.0%) (2.0%) 20.0%Atlas Energy, L.P. ATLS $42.45 1.1% (10.4%) (9.4%) (9.4%) (9.4%) (8.4%) (8.4%) 5.7%General Partner (MLP) Median 1.3% 3.7% 6.4% 6.4% 4.2% 7.6% 7.6% 23.0%
Teekay Corporation TK $59.75 8.0% 10.3% 24.5% 24.5% 10.3% 25.1% 25.1% 75.8%Crosstex Energy, Inc. XTXI $41.63 1.6% 11.0% 15.1% 15.1% 11.0% 15.5% 15.5% 152.8%Targa Resources Corp. TRGP $96.76 0.8% 7.2% 9.7% 9.7% 7.2% 10.4% 10.4% 62.2%ONEOK, Inc. OKE $59.14 (2.6%) (1.4%) 8.6% 8.6% (0.7%) 9.4% 9.4% 54.0%Williams Companies, Inc. WMB $41.30 (1.8%) 2.0% 7.1% 7.1% 2.0% 7.1% 7.1% 23.1%Spectra Energy Corp SE $37.28 (1.0%) 3.7% 4.7% 4.7% 4.6% 5.6% 5.6% 32.7%Plains GP Holdings LP Class A PAGP $28.00 1.3% 10.1% 4.6% 4.6% 10.1% 5.1% 5.1% NASemGroup Corporation Class A SEMG $67.32 8.3% 9.0% 3.2% 3.2% 9.0% 3.2% 3.2% 47.4%Enbridge Inc. ENB $42.29 (1.5%) 0.7% (3.2%) (3.2%) 1.5% (2.5%) (2.5%) (2.3%)TransCanada Corporation TRP $44.03 0.1% 1.4% (3.6%) (3.6%) 1.4% (3.6%) (3.6%) (1.5%)Kinder Morgan, Inc. Class P KMI $31.85 (3.6%) (6.4%) (11.5%) (11.5%) (6.4%) (10.4%) (10.4%) (9.8%)General Partner (C-Corp) Median 0.1% 3.7% 4.7% 4.7% 4.6% 5.6% 5.6% 40.0%
All MLPs Average 0.2% 0.1% 0.8% 0.8% 0.9% 2.3% 2.3% 17.1%All MLPs Median 0.7% 0.6% 1.3% 1.3% 1.6% 2.9% 2.9% 18.2%
WELLS FARGO SECURITIES MLP INDEX WMLP 617 (0.2%) (0.4%) (0.4%) (0.4%) 0.3% 1.0% 1.0% 14.7%S&P 500 STOCK INDEX SP50 1859 1.3% 4.3% 0.6% 0.6% 4.6% 1.0% 1.0% 25.4%S&P 500 UTILITIES IND G SP825 204 (0.5%) 2.8% 5.8% 5.8% 2.8% 5.8% 5.8% 8.1%MSCI US REIT INDEX PRICE-ONL RMZK 972 1.3% 4.6% 8.9% 8.9% 4.6% 8.9% 8.9% 2.7%
Note: WTD price performance ref lects the performance over the trailing 7 daysSource: FactSet, Standard & Poor's, and Wells Fargo Securities, LLC Date: 2/28/2014
Ups
trea
m M
LPs
Larg
e C
ap P
ipel
ine
MLP
sPr
opan
eSm
all &
Mid
Cap
Mid
stre
amO
ilfie
ld
Serv
.G
athe
ring
& P
roce
ssin
g M
LPs
Mar
ine
Coa
lN
on-T
radi
tiona
lM
LP G
PsC
-Cor
p G
PsIn
dice
s
YTD
Note: On 3/10/14, the tickers for XTEX and XTXI were changed to ENLK and ENLC, respectively
WELLS FARGO SECURITIES, LLC MLP Monthly: March 2014 EQUITY RESEARCH DEPARTMENT
75
Valuation Range Information:
ACMP Basis and Risks: Our valuation range is based on a blend of (1) our three-stage distribution discount model, which assumes a 7.5% ROR and a long-term growth rate of 1.25%, and (2) a price-to-distributable cash flow multiple of ~17x our 2014 estimate. Risks to the units trading below our range include execution risk related to organic growth initiatives, dependence on CHK as a primary customer, and rising interest rates. AHGP Basis and Risks: Our valuation range is based on a blend of (1) our three-stage distribution discount model, which assumes a required rate of return of 9.5% and a long-term growth rate of 3%, and (2) a price-to-DCF multiple of about 18.5 our 2014 estimate. Risks to AHGP trading below the valuation range include: (1) disappointing economic activity, (2) a decline in coal prices, (3) operational and regulatory risk related to development projects, (4) fuel switching based on low natural gas prices and (5) rising interest rates. AMID Basis and Risks: Our valuation range is based on a blend of (1) our three-stage distribution discount model, which assumes a required rate of return of 9.5% and a long-term growth rate of 1.25%, and (2) a price-to-distributable cash flow multiple of ~13x our 2014 estimate. Risks to AMID trading below our valuation range include size/timing of potential dropdowns, hurricanes, re-contracting, and a decline in commodity prices. APL Basis and Risks: Our valuation range is based on a blend of (1) our three-stage distribution discount model, which assumes a required rate of return of 10.0% and a long-term growth rate of 1.25%, and (2) a price-to-distributable cash flow multiple of ~14.0x our 2014 estimate. Risks to the stock trading in our range include a decline in NGL prices, a slowdown in drilling activity within APL's regions, and/or rising interest rates. APU Basis and Risks: Our valuation range is based on a blend of (1) our three-stage DDM, which assumes a required ROR of 9% and a long-term growth rate of 0.75%, and (2) a price-to-DCF multiple of ~10x our FY'15 estimate. Risks include (1) unseasonably warm weather, (2) execution risk related to the integration of acquisitions, (3) a potential equity overhang from ETP's plans to divest its LP interest over time, and (4) volume/profit margin erosion in response to higher energy prices. ARCX Basis and Risks: Our valuation range is based on a blend of (1) our three-stage distribution discount model, which assumes a 10.0% required rate of return and a long-term growth rate of 1.25%, and (2) a price-to-distributable cash flow multiple of approximately 10x our 2014 estimate. Risks to the units trading below our range include (1) relatively short weighted average remaining term of customer service agreements (i.e., ~3 years), (2) counterparty credit risk, and (3) rising interest rates. ARLP Basis and Risks: Our valuation range is based on a blend of (1) our three-stage distribution discount model, which assumes a required rate of return of 9.5% and a long-term growth rate of 2.5%, and (2) a price-to-distributable cash flow multiple of ~9.5x our 2014 estimate. Risks to ARLP trading below our valuation range include: disappointing economic activity, a decline in coal prices, operational risk, regulatory risk, delays in adding production, low natural gas prices and higher interest rates. ATLS Basis and Risks: Our valuation range is based on a blend of (1) our three-stage distribution discount model, which assumes a required rate of return of 10.5% and a long-term growth rate of 1.25%, and (2) a price-to-distributable cash flow multiple of ~24.5x our 2014 estimate. Risks to the stock trading below our range include a decline in commodity prices, a slowdown in drilling activity within APL's operation regions, dependence on acquisitions to fuel growth at underlying MLPs, and/or difficulty in fund raising. BBEP Basis and Risks: Our valuation range is based on a blend of (1) our three-stage distribution discount model, which assumes a 10% required rate of return and a long-term growth rate of 0% and (2) a price-to-distributable cash flow multiple of about 10.5x our 2014 estimate. Risks to the units trading below our valuation range include a decline in commodity prices, technical selling pressure from secondary offerings, and the inability to hedge at favorable prices in future periods. BKEP Basis and Risks: Our valuation range is based on a blend of (1) our three-stage distribution discount model, which assumes a required rate of return of 9.5% and a long-term growth rate of 1.25%, and (2) a price-to-distributable cash flow multiple of 6x our 2014 estimate. Risks to our valuation range include counterparty credit risk, lower crude oil and asphalt volumes, and rising interest rates. BPL Basis and Risks: Our valuation range is based on a blend of (1) our three-stage distribution discount model, which assumes a required rate of return of 9.5% and a long-term growth rate of 2.5%, and (2) a price-to-distributable cash flow multiple of ~15.5x our 2014E. Risks to the stock trading below our range include an adverse settlement with airline shippers, a weak economy, the inability to complete third-party acquisitions to support growth, and rising interest rates.
WELLS FARGO SECURITIES, LLC Master Limited Partnerships EQUITY RESEARCH DEPARTMENT
76
BWP Basis and Risks: Our valuation range is based on a blend of (1) our three-stage distribution discount model, which assumes a required rate of return of 9.5% and a long-term growth rate of 1.25%, and (2) an EV-to-EBITDA multiple of ~10.5x our 2014 estimate. Risks to the units trading below our valuation range include recontracting pipeline capacity, execution of organic growth projects, and regulatory risk. CEQP Basis and Risks: Our valuation range is based on a blend of (1) our three-stage distribution discount model, which assumes a 9.0% required rate of return and a long-term growth rate of 2.5%, and (2) a price-to-distributable cash flow multiple of approximately 27x our 2014 DCF/unit estimate. Risks to CEQP trading in our valuation range include (1) a decline in commodity prices and drilling activity, (2) a slowdown in acquisitions or growth projects at the MLP, and (3) rising interest rates. CMLP Basis and Risks: Our valuation range is based on a blend of (1) our three-stage distribution discount model, which assumes a required rate of return of 9.0% and a long-term growth rate of 1.25%, and (2) a price-to-distributable cash flow multiple of approximately 15x our 2014 estimate. Risks to CMLP trading in our valuation range include (1) a decline in commodity prices and drilling activity, (2) a slowdown in acquisitions or growth projects, and (3) rising interest rates. DKL Basis and Risks: Our valuation range is based on a blend of (1) our three-stage discounted free-cash flow model, which assumes a 9.5% required rate of return and a long-term growth rate of 1.25%, and (2) a price-to-distributable cash flow multiple of approximately 11x our 2014 estimate. Risks to the units trading below our range include (1) reliance on the GP Sponsor for growth, (2) a potential change in control at the GP, and (3) capital market access. DPM Basis and Risks: Our valuation range is based on a blend of (1) our three-stage distribution discount model, which assumes a required rate of return of 9.0% and a long-term growth rate of 1.25%, and (2) a price-to-DCF multiple of ~19x our 2014 estimate. Risks to the units trading in our range include the inability to find suitable investments, dependence on DCP Midstream for growth, supply risk, liquidity, and rising interest rates. EEP Basis and Risks: Our valuation range is based on a blend of (1) our three-stage distribution discount model, which assumes a required rate of return of 9.5% and a long-term growth rate of 1.25%, and (2) a price-to-DCF multiple of ~15x our 2014 estimate. Risks to units trading in our valuation range include stagnant Canadian and U.S. drilling activity, execution risk on acquisitions and expansion projects, and offloading of volumes to competing pipelines. EEQ Basis and Risks: Our valuation range is based on a blend of (1) our three-stage distribution discount model, which assumes a required rate of return of 9.5% and a long-term growth rate of 1.25%, and (2) a price-to-distributable cash flow multiple of ~15x our 2014 estimate. Risks to units trading in our valuation range include stagnant Canadian and U.S. drilling activity, execution risk on acquisitions and expansion projects. EPB Basis and Risks: Our valuation range is based on a blend of (1) our three-stage distribution discount model, which assumes a required rate of return of 8% and a long-term growth rate of 1.25%, and (2) a price-to-distributable cash flow multiple of about 12.5x our 2014 estimate. Risks to the units trading below our valuation range include a slower-than-forecasted rate of dropdown acquisitions, re-contracting, and rising interest rates. EPD Basis and Risks: Our valuation range is based on a blend of (1) our three-stage distribution discount model, which assumes a required rate of return of 7.5% and a long-term growth rate of 2.5%, and (2) a price-to-DCF multiple of ~17x our 2014 estimate. Risks to EPD trading in our range include weakness in the petro-chem industry, low or negative frac spreads, and a decline or delay in deepwater GoM production. EQM Basis and Risks: Our valuation range is based on a blend of (1) our three-stage distribution discount model, which assumes a 8.0% required rate of return and a long-term growth rate of 1.25%, and (2) a price-to-distributable cash flow multiple of about 21x our 2014 estimate. Risks to the units trading below our range include a decline in commodity prices and production levels, dependence upon acquisitions to fuel growth, and lower rates upon contract renewal. EROC Basis and Risks: Our valuation range is based on a blend of (1) our three-stage distribution discount model, which assumes a required rate of return of 10.5% and a long-term growth rate of 1.25%, and (2) a price-to-distributable cash flow multiple of ~9x our 2014 estimate. Risks to the stock trading below our range include (1) a decline in commodity prices, (2) lower volumes due to a slowdown in drilling activity within EROC's operating regions, and/or (3) variability in organic drilling results.

WELLS FARGO SECURITIES, LLC MLP Monthly: March 2014 EQUITY RESEARCH DEPARTMENT
77
ETE Basis and Risks: Our valuation range is based on a blend of (1) our three-stage distribution discount model, which assumes a required rate of return of 9.0% and a long-term growth rate of 2.5% and a price-to-distributable cash flow multiple of 24.5x our 2014 estimate and (2) option value for potential projects. Risks to ETE achieving our valuation range include: (1) execution risk related to growth projects (e.g. Lake Charles LNG), (2) narrow natural gas basis differentials, and (3) commodity prices (gas and NGL). ETP Basis and Risks: Our valuation range is based on a blend of (1) our three-stage distribution discount model, which assumes a required rate of return of 9.0% and a long-term growth rate of 1.25% and a price-to-distributable cash flow multiple of 12.0x our 2014 estimate and (2) option value for potential projects. Risks to ETP achieving our valuation range include: (1) execution risk related to growth projects, (2) narrow natural gas basis differentials, and (3) commodity prices (gas and NGL). Risks to ETP achieving our valuation range include: (1) execution risk related to growth projects, (2) narrow natural gas basis differentials, and (3) commodity prices. EVEP Basis and Risks: Our valuation range is based on a blend of (1) our three-stage distribution discount model, which assumes a required rate of return of 10.5% and a long-term growth rate of 0%, and (2) a price-to-distributable cash flow multiple of about 12.0x our 2014 estimate. Risks to the units trading below our valuation range include execution risk around midstream build-out in the Utica Shale, a sustained decline in gas prices, and the dependence upon acquisitions to fuel growth. EXLP Basis and Risks: Our valuation range is based on a blend of (1) our three-stage distribution discount model, which assumes a required rate of return of 9% and a long-term growth rate of 1.25%, and (2) a price-to-distributable cash flow multiple of 9.5x our 2014 estimate. Risks to the units trading below our valuation range include dependence on acquisitions to fuel growth, weakening of domestic demand for compression services, and rising interest rates. GEL Basis and Risks: Our valuation range is based on a blend of (1) our three-stage distribution discount model, which assumes a required ROR of 9.0% and a long-term growth rate of 2.5%, and (2) a price-to-distributable cash flow multiple of 17.5x our 2014 estimate. Risks to GEL trading in the valuation range include (1) a decline or delay in deepwater Gulf of Mexico production, (2) integration of acquisitions, (3) a slowdown in the mining and/or pulp and paper industries, and (4) a decline in onshore crude oil drilling activity. GLP Basis and Risks: Our valuation range is based on a blend of (1) our three-stage distribution discount model, which assumes a required rate of return of 10% and a long-term growth rate of 1.25%, and (2) a price-to-DCF multiple of ~9x our 2014 estimate. Risks to the stock trading below our range include (1) a reduction in demand for gasoline due to conservation and a slowdown in the economy, (2) continued backwardation in refined products/distillate markets; (3) unseasonably warm weather, and (4) execution risk related to integration of acquisitions. HEP Basis and Risks: Our valuation range is based on a blend of (1) our three-stage distribution discount model, which assumes a required ROR of 8.5% and a long-term growth rate of 1.25%, and (2) a price-to-distributable cash flow multiple of 15x our 2014 estimate. Risks to HEP trading in the valuation range include a (1) deterioration in refining fundamentals, (2) customer concentration with Holly Frontier Corporation (HFC) and Alon, (3) geographic concentration in the Rockies, Southwest, and Mid-Continent regions of the U.S., and (4) reliance on HFC for growth opportunities. KMI Basis and Risks: Our valuation range is based on a blend of (1) our three-stage dividend discount model, which assumes a required rate of return of 7.5% and a long-term growth rate of 2.5%, and (2) a price-to-distributable cash flow multiple of 20x our 2014 estimate. Risks to KMI trading below our valuation range include execution risk related to the company asset divestiture plan, potential IDR waivers, a decline in crude oil prices, and rising interest rates. KMP Basis and Risks: Our valuation range is based on a blend of (1) our three-stage distribution discount model, which assumes a required rate of return of 8.5% and a long-term growth rate of 1.25%, and (2) a price-to-distributable cash flow multiple of 14.5x our 2014 estimate. Risks to the units trading in our valuation range include (1) lower crude oil prices, (2) rising interest rates, and (3) narrower basis differentials between gas trading hubs in Texas. KMR Basis and Risks: Our valuation range is based on a blend of (1) our three-stage distribution discount model, which assumes a required rate of return of 8.5% and a long-term growth rate of 1.25%, and (2) a price-to-distributable cash flow multiple of 14.5x our 2014 estimate. Risks to the units trading in our valuation range include (1) lower crude oil prices, (2) rising interest rates, and (3) narrower basis differentials between gas trading hubs in Texas.

WELLS FARGO SECURITIES, LLC Master Limited Partnerships EQUITY RESEARCH DEPARTMENT
78
LGCY Basis and Risks: Our valuation range is based on a blend of (1) our three-stage distribution discount model, which assumes a required rate of return of 9.5% and a long-term growth rate of 0%, and (2) a price-to-distributable cash flow multiple of ~11x our 2014 estimate. Risks to the units trading below our range include a sustained decline in crude oil prices and dependence upon acquisitions to fuel growth. LINE Basis and Risks: Our valuation range is based on a blend of (1) our three-stage distribution discount model, which assumes a 9.5% required rate of return and a long-term growth rate of 0%, and (2) a price-to-DCF multiple of about 10.0x our 2014 estimate. Risks to the units trading below our range include a dependence on acquisitions for growth, decreasing commodity prices, and the inability to hedge at favorable prices. LNCO Basis and Risks: Our valuation range is based on (1) our three-stage dividend discount model, which assumes a 8.75% required rate of return and a long-term growth rate of 0.0%, and (2) a price-to-distributable cash flow multiple of about 10.5x our 2014 estimate. Risks to the shares trading below our range include a reduction in the tax deferral shield at LINE (e.g. repeal of IDCs), a potential increase in dividend tax rates, decreasing commodity prices, and variability around drilling. LRE Basis and Risks: Our valuation range is based on a blend of (1) our three-stage distribution discount model, which assumes an 11% required rate of return and a long-term growth rate of 0%, and (2) a price-to-distributable cash flow multiple of about 8.0x our 2014 estimate. Risks to the units trading below our range include a decline in commodity prices, dependence upon acquisitions to fuel growth, and the inability to hedge at favorable prices. MCEP Basis and Risks: Our valuation range is based on a blend of (1) our three-stage distribution discount model, which assumes a 9.0% required rate of return and a long-term growth rate of 0%, and (2) a price-to-distributable cash flow multiple of about 10.0x our 2014 estimate. Risks to the units trading below our range include a decline in crude oil prices and variability in the rate of waterflood-supported production growth. MEMP Basis and Risks: Our valuation range is based on a blend of (1) our three-stage distribution discount model, which assumes a 10.5% required rate of return and a long-term growth rate of 0%, and (2) a 2014E price-to-DCF multiple of ~8.5x. Risks to the units trading below our range include a decline in commodity prices, dependence upon acquisitions to fuel growth, and the inability to hedge at favorable prices. MEP Basis and Risks: Our valuation range is based on a blend of (1) our three-stage distribution discount model, which assumes a 10.0% required rate of return and a long-term growth rate of 1.25%, and (2) a price-to-DCF multiple of approximately 13.0x our 2014 estimate. Risks to our valuation range include lower NGL prices, reliance on GP sponsor, slower than forecasted volume growth, and execution on growth projects. MMLP Basis and Risks: Our valuation range is based on a blend of (1) our three-stage distribution discount model, which assumes a required ROR of 9% and a required rate of return of 1.25%, and (2) a price-to-DCF multiple of ~13.5x our 2014 estimate. Risks to MMLP trading in the valuation range include (1) a continuation of weak natural gas storage fundamentals, (2) a decline in offshore Gulf of Mexico drilling activity, (3) hurricanes, (4) a decrease in fertilizer demand, and (5) its relatively small size. MMP Basis and Risks: Our valuation range is based on a blend of (1) our three-stage distribution discount model, which assumes a ROR of return of 7.5% and a long-term growth rate of 2.5%, and (2) a price-to-DCF multiple of ~22x our 2014 estimate. Risks to the units trading below our valuation range include the ability to identify and execute on organic projects, rising interest rates, and a slowing economy. MPLX Basis and Risks: Our valuation range is based on a blend of (1) our three-stage discounted free-cash flow model, which assumes a required rate of return of 8.0% and a long-term growth rate of 1.25%, and (2) a price-to-distributable cash flow multiple of about 27.5x our 2014 estimate. Risks to the units trading below our range include reliance on the GP sponsor as the key customer (~89% of revenue) and principal source of growth, deterioration in refining fundamentals, and geographic concentration. MWE Basis and Risks: Our valuation range is based on a blend of (1) our three-stage distribution discount model, which assumes a required rate of return of 9.0% and a long-term growth rate of 2.5%, and (2) a price-to-distributable cash flow multiple of ~17.5x our 2014 estimate. Risks to the units trading in our range include lower than anticipated Marcellus volume growth, a decline in commodity prices, execution risk related to acquisitions, and rising interest rates.

WELLS FARGO SECURITIES, LLC MLP Monthly: March 2014 EQUITY RESEARCH DEPARTMENT
79
NGL Basis and Risks: Our valuation range is based on a blend of (1) our three-stage distribution discount model, which assumes a required rate of return of 9.5% and a long-term growth rate of 1.25%, and (2) a price-to-distributable cash flow multiple of ~16x our FY 2014 estimate. Risks to the stock trading below our range include (1) unseasonably warm weather; (2) potential competitive pressures in Water Services, and (3) execution risk related to the integration of acquisitions. NGLS Basis and Risks: Our valuation range is based on a blend of (1) our three-stage distribution discount model, which assumes a required rate of return of 9.0% and a long-term growth rate of 1.25%, and (2) a price-to-distributable cash flow multiple of ~15.5x our 2014 estimate. Risks to the units trading below our valuation range include execution risk related to integrating acquisitions and completing organic growth projects, a decline in commodity prices, and rising interest rates. NKA Basis and Risks: Our valuation range is based on a blend of (1) our three-stage distribution discount model, which assumes a required rate of return of 10% and a long-term distribution growth rate of 1.25%, and (2) a price-to-DCF multiple of ~8x our FY'15 DCF per unit estimate. Risks to the units trading below our range include (1) delays/cost overruns on expansion projects, (2) an overbuild of natural gas storage, and (3) reduced gas price volatility. NRP Basis and Risks: Our range is based on a blend of (1) a three-stage distribution discount model, which assumes a required ROR of 11% and a long-term growth rate of 0%, and (2) a price to DCF multiple of 10x our 2014 estimate. Risks to NRP trading below the valuation range include a decline in coal prices and production. NS Basis and Risks: Our valuation range is based on a blend of (1) our three-stage distribution discount model, which assumes a required rate of return of 9.5% and a long-term growth rate of 1.5%, and (2) a price-to-distributable cash flow multiple of ~13x our 2014 estimate. Risks to the units trading in our valuation range include unplanned refinery turnarounds, regulatory, and rising interest rates. NSH Basis and Risks: Our valuation range is based on a blend of (1) our three-stage distribution discount model, which assumes a required rate of return of 9.5% and a long-term growth rate of 2.5%, and (2) a price-to-distributable cash flow multiple of ~14x our 2014 estimate. Risks to the units trading in our valuation range include unplanned refinery turnarounds and rising interest rates. OKE Basis and Risks: Our valuation range is based on a combination of (1) our three-stage dividend discount model, which assumes a required rate of return of 7.5% and a long-term growth rate of 2.5% and (2) a price-to-DCF multiple of 21.5x our 2014 estimate. Risks to our valuation range include growth at OKS, NGL prices, and weather. OKS Basis and Risks: Our valuation range is based on a blend of (1) our three-stage distribution discount model, which assumes a required rate of return of 8.5% and a long-term growth rate of 1.25%, and (2) a price-to-DCF multiple of ~16x our 2014 estimate. Risks to OKS units not trading in our valuation range include (1) execution risk related to completing organic growth projects on time and within budget, (2) NGL product pricing differentials, and (3) commodity prices. OXF Basis and Risks: We value shares at an EV/EBITDA multiple of ~4-5X our 2014 estimate. We see room for multiple expansion if Oxford proves it can generate stable distributable cash flow. Risks: Oxford lacks the scale and customer depth of many of its mining peers, which could result in weaker earnings in tough coal markets. Balance sheet concerns could resurface if coal fundamentals deteriorate. PAA Basis and Risks: Our valuation range is based on a blend of (1) our three-stage distribution discount model, which assumes a required rate of return of 7.5% and a long-term growth rate of 1.25%, and (2) a price-to-distributable cash flow multiple of 18.0x our 2014 estimate. Risks to PAA trading in our valuation range include potential losses from hedging activities, narrower lease gathering margins, and crude supply shortfalls. PAGP Basis and Risks: Our valuation range is based on a blend of (1) our three-stage dividend discount model, which assumes a required rate of return of 6.5% and a long-term growth rate of 2.5%, and (2) a price-to-distributable cash flow multiple of 36x our 2014 estimate. Risks to our valuation range include narrower crude price and quality differentials, slower than forecasted growth at PAA, and potential GP subsidies. PVR Basis and Risks: Our valuation range is based on our RGP valuation range multiplied by Regency's proposed buy-out offer for PVR. Risks to PVR trading in our valuation range include (1) an extended decline in commodity prices and reduction in the level of drilling activity in the Marcellus, (2) a slowdown in acquisitions or growth projects, and (3) rising interest rates.

WELLS FARGO SECURITIES, LLC Master Limited Partnerships EQUITY RESEARCH DEPARTMENT
80
QEPM Basis and Risks: Our valuation range is based on a blend of (1) our three-stage distribution discount model, which assumes a 9.0% required rate of return and a long-term growth rate of 1.25%, and (2) a price-to-distributable cash flow multiple of approximately 16.5x our 2014 DCF/unit estimate. Risks to the units trading below our range include a decline in production levels, dependence on QEP as the MLP's key customer, and dependence on acquisitions to fuel growth. QRE Basis and Risks: Our valuation range is based on a blend of (1) our three-stage distribution discount model, which assumes a 10.5% required rate of return and a long-term growth rate of 0%, and (2) a price-to-distributable cash flow multiple of about 7x our 2014 estimate. Risks to the units trading below our range include a decline in commodity prices, dependence upon acquisitions to fuel growth, access to capital markets, and the inability to hedge at favorable prices. RGP Basis and Risks: Our valuation range is based on a blend of (1) our three-stage distribution discount model, which assumes a required rate of return of 9.5% and a long-term growth rate of 1.25%, and (2) a price-to-distributable cash flow multiple of ~13x our 2014 estimate. Risks to the units trading below our valuation range include a slower-than-forecasted rate of investments, a decline in commodity prices, and rising interest rates. SEP Basis and Risks: Our valuation range is based on a blend of (1) our three-stage distribution discount model, which assumes a required rate of return of 8.0% and a long-term growth rate of 1.25%, and (2) a price-to-distributable cash flow multiple of ~15x our 2014 estimate. Risks to the units trading below our valuation range include recontracting at lower pipeline rates, reduced demand for natural gas, and rising interest rates. SPH Basis and Risks: Our valuation range is based on a blend of (1) our three-stage distribution discount model, which assumes a required ROR of 9% and a long-term growth rate of 1.5%, and (2) a price-to-distributable cash flow multiple of about 12.5x our FY 2014 estimate. Risks to the units trading below our range include: (1) unseasonably warm weather, (2) execution risk related to the integration of acquisitions and (3) volume/profit margin erosion in response to higher energy prices. SUSP Basis and Risks: Our valuation range is based on a blend of (1) our three-stage DDM, which assumes a ROR of 8.5% and a long-term growth rate of 1.25%, and (2) a price-to-DCF multiple of about 14x our 2014 estimate. Risks to the units trading below our range include a material decline in motor fuel demand, geographic concentration in Texas, and reliance on SUSS as the primary customer and source of drop-downs. SXE Basis and Risks: Our valuation range is based on a blend of (1) our three-stage dividend discount model, which assumes a required rate of return of 10.0% and a long-term growth rate of 1.25%, and (2) a price-to-distributable cash flow multiple of about 13x our 2014 estimate. Risks to the units trading below our range include: growth capex execution, low commodity prices/declining production and geographic/customer concentration. SXL Basis and Risks: Our valuation range is based on a blend of (1) our three-stage distribution discount model, which assumes a required rate of return of 7.5% and a long-term growth rate of 1.25%, and (2) a price-to-distributable cash flow multiple of ~17x our 2014 estimate. To note, our DDM calculation includes $2/unit of upside tied to the potential Trunkline conversion project. Risks to the units trading below our valuation range include customer concentration, refinery turnarounds, and rising interest rates. TCP Basis and Risks: Our valuation range is based on a blend of (1) our three-stage distribution discount model, which assumes a 9.0% required rate of return and a long-term growth rate of 1.875%, and (2) a price-to-distributable cash flow multiple of 12.5x our 2014 estimate. Risks to the units trading below our range include weaker natural gas fundamentals, slower than forecast pace of dropdowns, and re-contracting risks. TEP Basis and Risks: Our valuation range is based on a blend of (1) our three-stage distribution discount model, which assumes (1) an 8.5% required rate of return and a long-term growth rate of 1.25% and (2) a price-to-distributable cash flow multiple of approximately 22x our 2014 DCF/unit estimate. Risks to the units trading below our range include geographic concentration in the Rockies, re-contracting risk, and the ability to complete dropdowns. TLLP Basis and Risks: Our valuation range is based on (1) our three-stage distribution discount model, which assumes a required rate of return of 8.0% and a long-term growth rate of 1.25%, and (2) a price-to-DCF multiple of 20x our 2014 estimate. Risks to the units trading below our valuation range include a slower-than-forecasted rate of acquisitions, dependence on TSO, and geographic concentration.
WELLS FARGO SECURITIES, LLC MLP Monthly: March 2014 EQUITY RESEARCH DEPARTMENT
81
TRGP Basis and Risks: Our valuation range is based on a blend of (1) our three-stage distribution discount model, which assumes a required rate of return of 8.0% and a long-term growth rate of 2.5%, and (2) a price-to-distributable cash flow multiple of ~30x our 2014 estimate. Risks to TRGP trading below our valuation range include execution risk related to integrating acquisitions and completing organic growth projects (at NGLS), a decline in commodity prices, and rising interest rates. USAC Basis and Risks: Our valuation range is based on a blend of (1) our three-stage distribution discount model, which assumes a 9.0% ROR and a long-term growth rate of 1.25%, and (2) a price-to-DCF multiple of approximately 14x our 2014 estimate. Risks to the units trading below our range include execution risk related to acquisitions and organic growth investments, customer concentration, ability to secure/renew customer contracts and a potential steep decline in U.S. natural gas production/demand. VLP Basis and Risks: Our valuation range is based on a blend of (1) our three-stage distribution discount model, which assumes a 8.0% required rate of return and a long-term growth rate of 1.25%, and (2) a price-to-distributable cash flow multiple of 35x our 2014 estimate. Risks to the units trading below our range include (1) reliance on the GP sponsor for growth, (2) customer concentration, and (3) capital market access. VNR Basis and Risks: Our valuation range is based on a blend of (1) our three-stage distribution discount model, which assumes a 10% required rate of return and a long-term 0% growth rate, and (2) a price-to-distributable cash flow multiple of about 11x our 2014 estimate. Risks to the units trading below our range include a decline in commodity prices, dependence upon acquisitions to fuel growth, and the inability to hedge at favorable prices. WES Basis and Risks: Our valuation range is based on a blend of (1) our three-stage distribution discount model, which assumes a required rate of return of 7.5% and a long-term growth rate of 1.25%, and (2) a price-to-distributable cash flow multiple of about 17x our 2014 estimate. Risks to the units trading below our valuation range include a slower than forecast rate of dropdowns, customer concentration, and rising interest rates. WGP Basis and Risks: Our valuation range is based on a blend of (1) our three-stage distribution discount model, which assumes a required rate of return of 7.5% and a long-term growth rate of 2.5%, and (2) a price-to-DCF multiple of approximately 40x our 2014 estimate. Risks to the units trading below our range include (1) executing on acquisitions (drop-downs) and completing organic growth projects (at WES), (2) lower volumes due to a slowdown in drilling activity within WES' operating regions, and (3) dependence on APC as a key customer and source of future drop-downs. WMB Basis and Risks: Our valuation range is based on a combination of (1) our three-stage dividend discount model, which assumes a required rate of return of 7.5% and a long-term growth rate of 2.5% and (2) a price-to-earnings multiple of 43x our 2014 estimate. Risks to our valuation range include commodity prices, execution related to acquisitions and organic growth projects, and an adverse regulatory environment. WNRL Basis and Risks: Our valuation range is based on a blend of (1) our three-stage distribution discount model, which assumes a 9.0% required rate of return and a long-term growth rate of 1.25%, and (2) a price-to-distributable cash flow multiple of ~23x our 2014 estimate. Risks to the units trading below our range include (1) reliance on the GP sponsor for growth, (2) geographic and customer concentration, and (3) capital market access. WPZ Basis and Risks: Our valuation range is based on: (1) a three-stage distribution discount model assuming a 8.5% required rate of return and a 1.25% long-term growth rate and (2) a price-to-DCF multiple of approximately 15.5x our 2014 DCF per unit estimate. Risks to WPZ trading below our valuation range include sensitivity to commodity prices, an adverse regulatory environment, and rising interest rates. XTEX Basis and Risks: Our valuation range is based on: (1) a three-stage distribution discount model assuming an 8.0% required rate of return and a 1.25% long-term growth rate and (2) a price-to-distributable cash flow multiple of ~20.0x our 2014 estimate. Risks to ENLK trading below our valuation range include competition in the Texas-Louisiana gas market, lower processing margins, and interest rates. XTXI Basis and Risks: Our valuation range is based on a blend of (1) our three-stage dividend discount model, which assumes a required rate of return of 7.0% and a long-term growth rate of 2.5% and (2) a price-to-distributable cash flow multiple of ~33x our 2014 estimate. Risks to ENLC trading below our valuation range include potential conflicts of interest, competition in the Texas-Louisiana natural gas market, and interest rates.

WELLS FARGO SECURITIES, LLC Master Limited Partnerships EQUITY RESEARCH DEPARTMENT
82
CPLP Basis and Risks: Our valuation range is based on our 2014 distribution estimate of $0.93/unit and a target forward yield of 8-9%. Risks include exposure to volatile shipping rates and asset values, increasing global capacity, and dilution from incentive shares. GMLP Basis and Risks: Our valuation range is based on a blend of (1) our 3-stage distribution discount model (assumes ROR of 9.5% and a LT growth rate of 2.75%), and (2) a P/DCF multiple of ~14.0x our 2014 estimate, and (3) our 2014 distribution estimate of $2.16/unit and a target forward yield of 5.5-6.0%. Risks to GMLP trading include competition in the FSRU market, dependency on acquisitions, global delays in liquefaction and environmental/governmental regulations. NMM Basis and Risks: Our valuation range is based on its current annual distribution of $1.77/unit and a forward dividend yield of 9.0%-10.0%, which still represents a discount to our Marine MLP average, reflecting a lack of visible growth. Risks include volatile day rates and asset values, increasing capacity, and marine disasters. SDLP Basis and Risks: Our valuation range is based on a 13.5x multiple on our 2014E DCF/unit estimate of $3.05, our 3-stage DDM with a long-term growth rate of 3.0% and our 2014 distribution estimate of $2.18/unit and a target forward yield of 5.25-5.75%. Risks include a lack of direct MLP comparables, global economic weakness, and drilling rig operating risk. TGP Basis and Risks: Our valuation range is based on a blend of (1) our three-stage distribution discount model, which assumes a required ROR of 9.5% and a long-term growth rate of 2.25%,(2) a price-to-distributable cash flow multiple of 13.75x our 2014 estimate, and (3) our 2014 distribution estimate of $2.82/unit and a target forward yield of 6.25-6.75%. Risks include newbuild delivery delays, lower-than-expected LNG demand, and high financial leverage. TOO Basis and Risks: Our valuation range is based on a blend of (1) our three-stage distribution discount model, which assumes a required ROR of 9.5% and a long-term growth rate of 2.25%, and (2) our 2014 distribution estimate of $2.22/unit and a target forward yield of 6.0-6.5%. Primary risks include a potential deceleration demand for offshore vessels, dependence on Teekay Corporation to provide future financing, growth through acquisitions, regulatory issues, and vessel operational risks.

WELLS FARGO SECURITIES, LLC MLP Monthly: March 2014 EQUITY RESEARCH DEPARTMENT
83
Required Disclosures
To view price charts for all companies rated in this document, please go to https://www.wellsfargo.com/research or write to
7 Saint Paul Street, 1st Floor, R1230-011, Baltimore, MD 21202 ATTN: Research Publications
Additional Information Available Upon Request
I certify that: 1) All views expressed in this research report accurately reflect my personal views about any and all of the subject securities or issuers discussed; and 2) No part of my compensation was, is, or will be, directly or indirectly, related to the specific recommendations or views expressed by me in this research report. Wells Fargo Securities, LLC maintains a market in the common stock of QEP Midstream Partners, LP, Plains GP Holdings, L.P.,
Midcoast Energy Partners, L.P., Valero Energy Partners LP, Tallgrass Energy Partners, LP, Western Gas Equity Partners, LP, Mid-Con Energy Partners, L.P., MPLX, L.P., USA Compression Partners, LP, LinnCo LLC, Delek Logistics Partners, LP, Southcross Energy Partners, L.P., NGL Energy Partners LP, Oxford Resource Partners, L.P., American Midstream Partners, L.P., LRR Energy, L.P., Memorial Production Partners, L.P., EQT Midstream Partners, L.P., Susser Petroleum Partners, LP, Seadrill Partners LLC, NuStar GP Holdings, LLC, Global Partners, L.P., El Paso Pipeline Partners, L.P., Western Gas Partners, L.P., TC Pipelines, L.P., LINN Energy, LLC, Niska Gas Storage Partners, LLC, Navios Maritime Partners, L.P., Access Midstream Partners, L.P., QR Energy, L.P., Targa Resources Corp., Golar LNG Partners, LP, Tesoro Logistics L.P., Natural Resource Partners L.P., Enbridge Energy Management, L.L.C., AmeriGas Partners, L.P., Buckeye Partners, L.P., MarkWest Energy Partners, L.P., Atlas Pipeline Partners, L.P., Magellan Midstream Partners, L.P., The Williams Companies, Inc., Sunoco Logistics Partners L.P., Enbridge Energy Partners, L.P., ONEOK, Inc., Enterprise Products Partners L.P., Kinder Morgan Energy Partners, L.P., Plains All American Pipeline, L.P., ONEOK Partners, L.P., Suburban Propane Partners, L.P., Kinder Morgan Management, LLC, Kinder Morgan, Inc., Energy Transfer Partners, L.P., Crestwood Equity Partners LP, PVR Partners L.P., Boardwalk Pipeline Partners, L.P., Teekay LNG Partners, L.P., DCP Midstream Partners, L.P., Williams Partners L.P., EnLink Midstream Partners, L.P., EnLink Midstream, LLC, Regency Energy Partners, L.P., Energy Transfer Equity, L.P., Alliance Resource Partners, L.P., Alliance Holdings GP, L.P., Atlas Energy, L.P., NuStar Energy, L.P., Exterran Partners, L.P., EV Energy Partners, L.P., BreitBurn Energy Partners L.P., Eagle Rock Energy Partners, L.P., Targa Resources Partners, L.P., Spectra Energy Partners, L.P., Legacy Reserves, L.P., Blueknight Energy Partners, L.P., Holly Energy Partners, L.P., Genesis Energy, L.P., Martin Midstream Partners, L.P., Vanguard Natural Resources, LLC.
Wells Fargo Securities, LLC or its affiliates managed or comanaged a public offering of securities for Vanguard Natural Resources, LLC, Genesis Energy, L.P., Holly Energy Partners, L.P., Legacy Reserves, L.P., Spectra Energy Partners, L.P., Targa Resources Partners, L.P., Eagle Rock Energy Partners, L.P., BreitBurn Energy Partners L.P., EV Energy Partners, L.P., Exterran Partners, L.P., Regency Energy Partners, L.P., EnLink Midstream Partners, L.P., Williams Partners L.P., DCP Midstream Partners, L.P., Teekay LNG Partners, L.P., Boardwalk Pipeline Partners, L.P., PVR Partners L.P., Kinder Morgan, Inc., Suburban Propane Partners, L.P., ONEOK Partners, L.P., Kinder Morgan Energy Partners, L.P., Enterprise Products Partners L.P., Magellan Midstream Partners, L.P., Atlas Pipeline Partners, L.P., Buckeye Partners, L.P., AmeriGas Partners, L.P., Enbridge Energy Management, L.L.C., Natural Resource Partners L.P., Tesoro Logistics L.P., Golar LNG Partners, LP, Access Midstream Partners, L.P., Navios Maritime Partners, L.P., TC Pipelines, L.P., Western Gas Partners, L.P., Seadrill Partners LLC, EQT Midstream Partners, L.P., Memorial Production Partners, L.P., NGL Energy Partners LP, Southcross Energy Partners, L.P., Tallgrass Energy Partners, LP, Valero Energy Partners LP, Midcoast Energy Partners, L.P., Plains GP Holdings, L.P., QEP Midstream Partners, LP, Arc Logistics Partners LP, Western Refining Logistics, LP within the past 12 months.
Wells Fargo Securities, LLC or its affiliates intends to seek or expects to receive compensation for investment banking services in the next three months from Western Refining Logistics, LP, QEP Midstream Partners, LP, Plains GP Holdings, L.P., Valero Energy Partners LP, Tallgrass Energy Partners, LP, Southcross Energy Partners, L.P., Delek Logistics Partners, LP, LinnCo LLC, USA Compression Partners, LP, MPLX, L.P., Mid-Con Energy Partners, L.P., Western Gas Equity Partners, LP, NGL Energy Partners LP, American Midstream Partners, L.P., Memorial Production Partners, L.P., LRR Energy, L.P., EQT Midstream Partners, L.P., Susser Petroleum Partners, LP, Western Gas Partners, L.P., El Paso Pipeline Partners, L.P., Global Partners, L.P., NuStar GP Holdings, LLC, TC Pipelines, L.P., Niska Gas Storage Partners, LLC, Capital Product Partners L.P., LINN Energy, LLC, Navios Maritime Partners, L.P., Access Midstream Partners, L.P., QR Energy, L.P., Golar LNG Partners, LP, Targa Resources Corp., Tesoro Logistics L.P., AmeriGas Partners, L.P., Buckeye Partners, L.P., MarkWest Energy Partners, L.P., Atlas Pipeline Partners, L.P., Magellan Midstream Partners, L.P., The Williams Companies, Inc., ONEOK, Inc., Enbridge Energy Partners, L.P., Sunoco Logistics Partners L.P., Enterprise Products Partners L.P., Kinder Morgan Energy Partners, L.P., ONEOK Partners, L.P., Plains All American Pipeline, L.P., Suburban Propane Partners, L.P., Kinder Morgan Management, LLC, Kinder Morgan, Inc., PVR Partners L.P., Crestwood Equity Partners LP, Energy Transfer Partners, L.P., Boardwalk Pipeline Partners, L.P., DCP

WELLS FARGO SECURITIES, LLC Master Limited Partnerships EQUITY RESEARCH DEPARTMENT
84
Midstream Partners, L.P., Williams Partners L.P., EnLink Midstream Partners, L.P., Regency Energy Partners, L.P., EnLink Midstream, LLC, Alliance Holdings GP, L.P., Alliance Resource Partners, L.P., Energy Transfer Equity, L.P., Exterran Partners, L.P., NuStar Energy, L.P., Atlas Energy, L.P., EV Energy Partners, L.P., BreitBurn Energy Partners L.P., Eagle Rock Energy Partners, L.P., Targa Resources Partners, L.P., Spectra Energy Partners, L.P., Legacy Reserves, L.P., Blueknight Energy Partners, L.P., Holly Energy Partners, L.P., Teekay Offshore Partners, L.P., Genesis Energy, L.P., Martin Midstream Partners, L.P., Vanguard Natural Resources, LLC.
Wells Fargo Securities, LLC or its affiliates received compensation for investment banking services from Vanguard Natural Resources, LLC, Martin Midstream Partners, L.P., Genesis Energy, L.P., Holly Energy Partners, L.P., Legacy Reserves, L.P., Spectra Energy Partners, L.P., Targa Resources Partners, L.P., Eagle Rock Energy Partners, L.P., BreitBurn Energy Partners L.P., EV Energy Partners, L.P., NuStar Energy, L.P., Exterran Partners, L.P., Regency Energy Partners, L.P., EnLink Midstream Partners, L.P., Williams Partners L.P., DCP Midstream Partners, L.P., Teekay LNG Partners, L.P., Boardwalk Pipeline Partners, L.P., Energy Transfer Partners, L.P., PVR Partners L.P., Kinder Morgan, Inc., Suburban Propane Partners, L.P., Plains All American Pipeline, L.P., ONEOK Partners, L.P., Kinder Morgan Energy Partners, L.P., Enterprise Products Partners L.P., Enbridge Energy Partners, L.P., The Williams Companies, Inc., Magellan Midstream Partners, L.P., Atlas Pipeline Partners, L.P., MarkWest Energy Partners, L.P., Buckeye Partners, L.P., AmeriGas Partners, L.P., Natural Resource Partners L.P., Enbridge Energy Management, L.L.C., Tesoro Logistics L.P., Golar LNG Partners, LP, QR Energy, L.P., Access Midstream Partners, L.P., Navios Maritime Partners, L.P., Capital Product Partners L.P., TC Pipelines, L.P., Western Gas Partners, L.P., Seadrill Partners LLC, EQT Midstream Partners, L.P., Memorial Production Partners, L.P., NGL Energy Partners LP, Western Gas Equity Partners, LP, USA Compression Partners, LP, Southcross Energy Partners, L.P., Tallgrass Energy Partners, LP, Valero Energy Partners LP, Plains GP Holdings, L.P., Midcoast Energy Partners, L.P., QEP Midstream Partners, LP, Western Refining Logistics, LP, Arc Logistics Partners LP in the past 12 months.
Wells Fargo Securities, LLC and/or its affiliates, have beneficial ownership of 1% or more of any class of the common stock of LRR Energy, L.P., QR Energy, L.P., EnLink Midstream, LLC.
Regency Energy Partners, L.P., Exterran Partners, L.P., NuStar Energy, L.P., Boardwalk Pipeline Partners, L.P., Teekay LNG Partners, L.P., DCP Midstream Partners, L.P., Williams Partners L.P., EnLink Midstream Partners, L.P., EV Energy Partners, L.P., BreitBurn Energy Partners L.P., Eagle Rock Energy Partners, L.P., Targa Resources Partners, L.P., Spectra Energy Partners, L.P., Legacy Reserves, L.P., Holly Energy Partners, L.P., Genesis Energy, L.P., Martin Midstream Partners, L.P., Vanguard Natural Resources, LLC, Enbridge Energy Management, L.L.C., Natural Resource Partners L.P., AmeriGas Partners, L.P., Buckeye Partners, L.P., MarkWest Energy Partners, L.P., Atlas Pipeline Partners, L.P., Magellan Midstream Partners, L.P., The Williams Companies, Inc., Enbridge Energy Partners, L.P., Enterprise Products Partners L.P., Kinder Morgan Energy Partners, L.P., ONEOK Partners, L.P., Plains All American Pipeline, L.P., Suburban Propane Partners, L.P., Kinder Morgan, Inc., PVR Partners L.P., Energy Transfer Partners, L.P., QR Energy, L.P., Navios Maritime Partners, L.P., Access Midstream Partners, L.P., Golar LNG Partners, LP, Tesoro Logistics L.P., Western Gas Partners, L.P., TC Pipelines, L.P., Capital Product Partners L.P., Memorial Production Partners, L.P., NGL Energy Partners LP, EQT Midstream Partners, L.P., Seadrill Partners LLC, Southcross Energy Partners, L.P., USA Compression Partners, LP, Western Gas Equity Partners, LP, Arc Logistics Partners LP, Western Refining Logistics, LP, QEP Midstream Partners, LP, Midcoast Energy Partners, L.P., Plains GP Holdings, L.P., Valero Energy Partners LP, Tallgrass Energy Partners, LP currently is, or during the 12-month period preceding the date of distribution of the research report was, a client of Wells Fargo Securities, LLC. Wells Fargo Securities, LLC provided investment banking services to Regency Energy Partners, L.P., Exterran Partners, L.P., NuStar Energy, L.P., Boardwalk Pipeline Partners, L.P., Teekay LNG Partners, L.P., DCP Midstream Partners, L.P., Williams Partners L.P., EnLink Midstream Partners, L.P., EV Energy Partners, L.P., BreitBurn Energy Partners L.P., Eagle Rock Energy Partners, L.P., Targa Resources Partners, L.P., Spectra Energy Partners, L.P., Legacy Reserves, L.P., Holly Energy Partners, L.P., Genesis Energy, L.P., Martin Midstream Partners, L.P., Vanguard Natural Resources, LLC, Enbridge Energy Management, L.L.C., Natural Resource Partners L.P., AmeriGas Partners, L.P., Buckeye Partners, L.P., MarkWest Energy Partners, L.P., Atlas Pipeline Partners, L.P., Magellan Midstream Partners, L.P., The Williams Companies, Inc., Enbridge Energy Partners, L.P., Enterprise Products Partners L.P., Kinder Morgan Energy Partners, L.P., ONEOK Partners, L.P., Plains All American Pipeline, L.P., Suburban Propane Partners, L.P., Kinder Morgan, Inc., PVR Partners L.P., Energy Transfer Partners, L.P., QR Energy, L.P., Navios Maritime Partners, L.P., Access Midstream Partners, L.P., Golar LNG Partners, LP, Tesoro Logistics L.P., Western Gas Partners, L.P., TC Pipelines, L.P., Capital Product Partners L.P., Memorial Production Partners, L.P., NGL Energy Partners LP, EQT Midstream Partners, L.P., Seadrill Partners LLC, Southcross Energy Partners, L.P., USA Compression Partners, LP, Western Gas Equity Partners, LP, Arc Logistics Partners LP, Western Refining Logistics, LP, QEP Midstream Partners, LP, Midcoast Energy Partners, L.P., Plains GP Holdings, L.P., Valero Energy Partners LP, Tallgrass Energy Partners, LP.
Tallgrass Energy Partners, LP, Southcross Energy Partners, L.P., LRR Energy, L.P., QR Energy, L.P., Plains All American Pipeline, L.P., ONEOK Partners, L.P., Kinder Morgan Energy Partners, L.P., The Williams Companies, Inc., Magellan Midstream Partners, L.P., Spectra Energy Partners, L.P., Eagle Rock Energy Partners, L.P. currently is, or during the 12-month period preceding the date of distribution of the research report was, a client of Wells Fargo Securities, LLC. Wells Fargo Securities, LLC provided noninvestment banking securities-related services to Tallgrass Energy Partners, LP, Southcross Energy Partners, L.P., LRR Energy, L.P., QR Energy, L.P., Plains All American Pipeline, L.P., ONEOK Partners, L.P., Kinder Morgan Energy Partners, L.P., The Williams Companies, Inc., Magellan Midstream Partners, L.P., Spectra Energy Partners, L.P., Eagle Rock Energy Partners, L.P.
Eagle Rock Energy Partners, L.P., Spectra Energy Partners, L.P., Blueknight Energy Partners, L.P., Atlas Energy, L.P., Magellan Midstream Partners, L.P., ONEOK, Inc., Atlas Pipeline Partners, L.P., Kinder Morgan Energy Partners, L.P., ONEOK Partners, L.P., Plains All American Pipeline, L.P., Crestwood Equity Partners LP, LINN Energy, LLC, Western Gas Partners, L.P., EQT

WELLS FARGO SECURITIES, LLC MLP Monthly: March 2014 EQUITY RESEARCH DEPARTMENT
85
Midstream Partners, L.P., Southcross Energy Partners, L.P., Tallgrass Energy Partners, LP, Valero Energy Partners LP, Western Refining Logistics, LP currently is, or during the 12-month period preceding the date of distribution of the research report was, a client of Wells Fargo Securities, LLC. Wells Fargo Securities, LLC provided nonsecurities services to Eagle Rock Energy Partners, L.P., Spectra Energy Partners, L.P., Blueknight Energy Partners, L.P., Atlas Energy, L.P., Magellan Midstream Partners, L.P., ONEOK, Inc., Atlas Pipeline Partners, L.P., Kinder Morgan Energy Partners, L.P., ONEOK Partners, L.P., Plains All American Pipeline, L.P., Crestwood Equity Partners LP, LINN Energy, LLC, Western Gas Partners, L.P., EQT Midstream Partners, L.P., Southcross Energy Partners, L.P., Tallgrass Energy Partners, LP, Valero Energy Partners LP, Western Refining Logistics, LP.
An affiliate of Wells Fargo Securities, LLC has received compensation for products and services other than investment banking services from LRR Energy, L.P., Oxford Resource Partners, L.P., Atlas Pipeline Partners, L.P., AmeriGas Partners, L.P., Energy Transfer Equity, L.P., Blueknight Energy Partners, L.P., Vanguard Natural Resources, LLC in the past 12 months.
Wells Fargo Securities, LLC received compensation for products or services other than investment banking services from Blueknight Energy Partners, L.P., Spectra Energy Partners, L.P., Eagle Rock Energy Partners, L.P., Atlas Energy, L.P., Atlas Pipeline Partners, L.P., ONEOK, Inc., Magellan Midstream Partners, L.P., The Williams Companies, Inc., Crestwood Equity Partners LP, Plains All American Pipeline, L.P., ONEOK Partners, L.P., Kinder Morgan Energy Partners, L.P., LRR Energy, L.P., EQT Midstream Partners, L.P., Southcross Energy Partners, L.P., Western Gas Partners, L.P., LINN Energy, LLC, QR Energy, L.P., Western Refining Logistics, LP, Valero Energy Partners LP, Tallgrass Energy Partners, LP in the past 12 months.
Wells Fargo Securities, LLC or its affiliates has a significant financial interest in Tallgrass Energy Partners, LP, Valero Energy Partners LP, Midcoast Energy Partners, L.P., QR Energy, L.P., Access Midstream Partners, L.P., Tesoro Logistics L.P., Targa Resources Corp., LINN Energy, LLC, TC Pipelines, L.P., El Paso Pipeline Partners, L.P., LinnCo LLC, Delek Logistics Partners, LP, Susser Petroleum Partners, LP, Memorial Production Partners, L.P., Kinder Morgan Energy Partners, L.P., Enterprise Products Partners L.P., ONEOK Partners, L.P., Plains All American Pipeline, L.P., Crestwood Equity Partners LP, Energy Transfer Partners, L.P., Kinder Morgan, Inc., Suburban Propane Partners, L.P., Kinder Morgan Management, LLC, The Williams Companies, Inc., Magellan Midstream Partners, L.P., ONEOK, Inc., Enbridge Energy Partners, L.P., Sunoco Logistics Partners L.P., Atlas Pipeline Partners, L.P., MarkWest Energy Partners, L.P., Buckeye Partners, L.P., AmeriGas Partners, L.P., Energy Transfer Equity, L.P., Regency Energy Partners, L.P., EnLink Midstream, LLC, EnLink Midstream Partners, L.P., Williams Partners L.P., DCP Midstream Partners, L.P., Eagle Rock Energy Partners, L.P., BreitBurn Energy Partners L.P., EV Energy Partners, L.P., Targa Resources Partners, L.P., Legacy Reserves, L.P., Teekay Offshore Partners, L.P., Vanguard Natural Resources, LLC, Martin Midstream Partners, L.P., Genesis Energy, L.P.
Wells Fargo Securities, LLC or its affiliates intends to seek or expects to receive compensation for investment banking services in the next three months from an affiliate of Genesis Energy, L.P., Martin Midstream Partners, L.P., Vanguard Natural Resources, LLC, Teekay Offshore Partners, L.P., Targa Resources Partners, L.P., Spectra Energy Partners, L.P., EV Energy Partners, L.P., BreitBurn Energy Partners L.P., DCP Midstream Partners, L.P., Teekay LNG Partners, L.P., Boardwalk Pipeline Partners, L.P., Williams Partners L.P., EnLink Midstream Partners, L.P., EnLink Midstream, LLC, Regency Energy Partners, L.P., Energy Transfer Equity, L.P., Alliance Resource Partners, L.P., NuStar Energy, L.P., Exterran Partners, L.P., AmeriGas Partners, L.P., Buckeye Partners, L.P., MarkWest Energy Partners, L.P., Sunoco Logistics Partners L.P., Enbridge Energy Partners, L.P., ONEOK, Inc., Magellan Midstream Partners, L.P., The Williams Companies, Inc., Kinder Morgan Management, LLC, Suburban Propane Partners, L.P., Kinder Morgan, Inc., Energy Transfer Partners, L.P., Crestwood Equity Partners LP, PVR Partners L.P., Plains All American Pipeline, L.P., ONEOK Partners, L.P., Enterprise Products Partners L.P., Kinder Morgan Energy Partners, L.P., Memorial Production Partners, L.P., LRR Energy, L.P., NGL Energy Partners LP, Susser Petroleum Partners, LP, EQT Midstream Partners, L.P., Delek Logistics Partners, LP, LinnCo LLC, Southcross Energy Partners, L.P., Western Gas Equity Partners, LP, MPLX, L.P., El Paso Pipeline Partners, L.P., Global Partners, L.P., Western Gas Partners, L.P., TC Pipelines, L.P., LINN Energy, LLC, Targa Resources Corp., Tesoro Logistics L.P., Access Midstream Partners, L.P., QR Energy, L.P., Western Refining Logistics, LP, QEP Midstream Partners, LP.
Wells Fargo Securities, LLC or its affiliates managed or co-managed a public offering of securities for an affiliate of QEP Midstream Partners, LP, Tesoro Logistics L.P., Targa Resources Corp., TC Pipelines, L.P., El Paso Pipeline Partners, L.P., Western Gas Equity Partners, LP, Southcross Energy Partners, L.P., Delek Logistics Partners, LP, Kinder Morgan Energy Partners, L.P., Enterprise Products Partners L.P., ONEOK Partners, L.P., Kinder Morgan, Inc., Kinder Morgan Management, LLC, The Williams Companies, Inc., ONEOK, Inc., Exterran Partners, L.P., EnLink Midstream, LLC, EnLink Midstream Partners, L.P., Williams Partners L.P., Boardwalk Pipeline Partners, L.P., Spectra Energy Partners, L.P., Targa Resources Partners, L.P., Teekay Offshore Partners, L.P. within the past 12 months.
Wells Fargo Securities, LLC or its affiliates received compensation for investment banking services from an affiliate of Teekay Offshore Partners, L.P., Targa Resources Partners, L.P., Spectra Energy Partners, L.P., Boardwalk Pipeline Partners, L.P., Williams Partners L.P., EnLink Midstream Partners, L.P., EnLink Midstream, LLC, Energy Transfer Equity, L.P., Exterran Partners, L.P., ONEOK, Inc., The Williams Companies, Inc., Kinder Morgan Management, LLC, Kinder Morgan, Inc., ONEOK Partners, L.P., Enterprise Products Partners L.P., Kinder Morgan Energy Partners, L.P., Delek Logistics Partners, LP, Southcross Energy Partners, L.P., Western Gas Equity Partners, LP, El Paso Pipeline Partners, L.P., Western Gas Partners, L.P., TC Pipelines, L.P., Targa Resources Corp., Tesoro Logistics L.P., QEP Midstream Partners, LP in the past 12 months.
Wells Fargo Securities, LLC is acting as financial advisor to The Lacede Group, Inc in the announced purchase of the Southern Union Company's Missouri Gas Energy and New England Gas Company divisions. The Southern Union Company is an affiliate of Energy Transfer Partners, LP and Energy Transfer Equity, LP. This transaction is subject to regulatory approvals.
A member of Research Management currently has a long position in the securities of Energy Transfer Partners, L.P., Plains All American Pipeline, L.P.

WELLS FARGO SECURITIES, LLC Master Limited Partnerships EQUITY RESEARCH DEPARTMENT
86
ACMP: Risks to the units trading below our range include execution risk related to organic growth initiatives, dependence on CHK as a primary customer, and rising interest rates. AHGP: Risks to AHGP trading below the valuation range include: (1) disappointing economic activity, (2) a decline in coal prices, (3) operational and regulatory risk related to development projects, (4) fuel switching based on low natural gas prices and (5) rising interest rates. AMID: Risks to AMID trading below our valuation range include size/timing of potential dropdowns, hurricanes, re-contracting, and a decline in commodity prices. APL: Risks to the stock trading in our range include a decline in NGL prices, a slowdown in drilling activity within APL's regions, and/or rising interest rates. APU: Risks include (1) unseasonably warm weather, (2) execution risk related to the integration of acquisitions, (3) a potential equity overhang from ETP's plans to divest its LP interest over time, and (4) volume/profit margin erosion in response to higher energy prices. ARCX: Risks to the units trading below our range include (1) relatively short weighted average remaining term of customer service agreements (i.e., ~3 years), (2) counterparty credit risk, and (3) rising interest rates. ARLP: Risks to ARLP trading below our valuation range include: disappointing economic activity, a decline in coal prices, operational risk, regulatory risk, delays in adding production, low natural gas prices and higher interest rates. ATLS: Risks to the stock trading below our range include a decline in commodity prices, a slowdown in drilling activity within APL's operation regions, dependence on acquisitions to fuel growth at underlying MLPs, and/or difficulty in fund raising. BBEP: Risks to the units trading below our valuation range include a decline in commodity prices, technical selling pressure from secondary offerings, and the inability to hedge at favorable prices in future periods. BKEP: Risks to our valuation range include counterparty credit risk, lower crude oil and asphalt volumes, and rising interest rates. BPL: Risks to the stock trading below our range include an adverse settlement with airline shippers, a weak economy, the inability to complete third-party acquisitions to support growth, and rising interest rates. BWP: Risks to the units trading below our valuation range include recontracting pipeline capacity, execution of organic growth projects, and regulatory risk. CEQP: Risks to CEQP trading in our valuation range include (1) a decline in commodity prices and drilling activity, (2) a slowdown in acquisitions or growth projects at the MLP, and (3) rising interest rates. CMLP: Risks to CMLP trading in our valuation range include (1) a decline in commodity prices and drilling activity, (2) a slowdown in acquisitions or growth projects, and (3) rising interest rates. CPLP: Risks include exposure to volatile shipping rates and asset values, increasing global capacity, and dilution from incentive shares. DKL: Risks to the units trading below our range include (1) reliance on the GP Sponsor for growth, (2) a potential change in control at the GP, and (3) capital market access. DPM: Risks to the units trading in our range include the inability to find suitable investments, dependence on DCP Midstream for growth, supply risk, liquidity, and rising interest rates. EEP: Risks to units trading in our valuation range include stagnant Canadian and U.S. drilling activity, execution risk on acquisitions and expansion projects, and offloading of volumes to competing pipelines. EEQ: Risks to units trading in our valuation range include stagnant Canadian and U.S. drilling activity, execution risk on acquisitions and expansion projects. EPB: Risks to the units trading below our valuation range include a slower-than-forecasted rate of dropdown acquisitions, re-contracting, and rising interest rates. EPD: Risks to EPD trading in our range include weakness in the petro-chem industry, low or negative frac spreads, and a decline or delay in deepwater GoM production. EQM: Risks to the units trading below our range include a decline in commodity prices and production levels, dependence upon acquisitions to fuel growth, and lower rates upon contract renewal. EROC: Risks to the stock trading below our range include (1) a decline in commodity prices, (2) lower volumes due to a slowdown in drilling activity within EROC's operating regions, and/or (3) variability in organic drilling results. ETE: Risks to ETE achieving our valuation range include: (1) execution risk related to growth projects (e.g. Lake Charles LNG), (2) narrow natural gas basis differentials, and (3) commodity prices (gas and NGL). ETP: Risks to ETP achieving our valuation range include: (1) execution risk related to growth projects, (2) narrow natural gas basis differentials, and (3) commodity prices. EVEP: Risks to the units trading below our valuation range include execution risk around midstream build-out in the Utica Shale, a sustained decline in gas prices, and the dependence upon acquisitions to fuel growth. EXLP: Risks to the units trading below our valuation range include dependence on acquisitions to fuel growth, weakening of domestic demand for compression services, and rising interest rates. GEL: Risks to GEL trading in the valuation range include (1) a decline or delay in deepwater Gulf of Mexico production, (2) integration of acquisitions, (3) a slowdown in the mining and/or pulp and paper industries, and (4) a decline in onshore crude oil drilling activity. GLP: Risks to the stock trading below our range include (1) a reduction in demand for gasoline due to conservation and a slowdown in the economy, (2) continued backwardation in refined products/distillate markets; (3) unseasonably warm weather, and (4) execution risk related to integration of acquisitions. GMLP: Risks to GMLP trading include competition in the FSRU market, dependency on acquisitions, global delays in liquefaction and environmental/governmental regulations.

WELLS FARGO SECURITIES, LLC MLP Monthly: March 2014 EQUITY RESEARCH DEPARTMENT
87
HEP: Risks to HEP trading in the valuation range include a (1) deterioration in refining fundamentals, (2) customer concentration with Holly Frontier Corporation (HFC) and Alon, (3) geographic concentration in the Rockies, Southwest, and Mid-Continent regions of the U.S., and (4) reliance on HFC for growth opportunities. KMI: Risks to KMI trading below our valuation range include execution risk related to the company asset divestiture plan, potential IDR waivers, a decline in crude oil prices, and rising interest rates. KMP: Risks to the units trading in our valuation range include (1) lower crude oil prices, (2) rising interest rates, and (3) narrower basis differentials between gas trading hubs in Texas. KMR: Risks to the units trading in our valuation range include (1) lower crude oil prices, (2) rising interest rates, and (3) narrower basis differentials between gas trading hubs in Texas. LGCY: Risks to the units trading below our range include a sustained decline in crude oil prices and dependence upon acquisitions to fuel growth. LINE: Risks to the units trading below our range include a dependence on acquisitions for growth, decreasing commodity prices, and the inability to hedge at favorable prices. LNCO: Risks to the shares trading below our range include a reduction in the tax deferral shield at LINE (e.g. repeal of IDCs), a potential increase in dividend tax rates, decreasing commodity prices, and variability around drilling. LRE: Risks to the units trading below our range include a decline in commodity prices, dependence upon acquisitions to fuel growth, and the inability to hedge at favorable prices. MCEP: Risks to the units trading below our range include a decline in crude oil prices and variability in the rate of waterflood-supported production growth. MEMP: Risks to the units trading below our range include a decline in commodity prices, dependence upon acquisitions to fuel growth, and the inability to hedge at favorable prices. MEP: Risks to our valuation range include lower NGL prices, reliance on GP sponsor, slower than forecasted volume growth, and execution on growth projects. MMLP: Risks to MMLP trading in the valuation range include (1) a continuation of weak natural gas storage fundamentals, (2) a decline in offshore Gulf of Mexico drilling activity, (3) hurricanes, (4) a decrease in fertilizer demand, and (5) its relatively small size. MMP: Risks to the units trading below our valuation range include the ability to identify and execute on organic projects, rising interest rates, and a slowing economy. MPLX: Risks to the units trading below our range include reliance on the GP sponsor as the key customer (~89% of revenue) and principal source of growth, deterioration in refining fundamentals, and geographic concentration. MWE: Risks to the units trading in our range include lower than anticipated Marcellus volume growth, a decline in commodity prices, execution risk related to acquisitions, and rising interest rates. NGL: Risks to the stock trading below our range include (1) unseasonably warm weather; (2) potential competitive pressures in Water Services, and (3) execution risk related to the integration of acquisitions. NGLS: Risks to the units trading below our valuation range include execution risk related to integrating acquisitions and completing organic growth projects, a decline in commodity prices, and rising interest rates. NKA: Risks to the units trading below our range include (1) delays/cost overruns on expansion projects, (2) an overbuild of natural gas storage, and (3) reduced gas price volatility. NMM: Risks include volatile day rates and asset values, increasing capacity, and marine disasters. NRP: Risks to NRP trading below the valuation range include a decline in coal prices and production. NS: Risks to the units trading in our valuation range include unplanned refinery turnarounds, regulatory, and rising interest rates. NSH: Risks to the units trading in our valuation range include unplanned refinery turnarounds and rising interest rates. OKE: Risks to our valuation range include growth at OKS, NGL prices, and weather. OKS: Risks to OKS units not trading in our valuation range include (1) execution risk related to completing organic growth projects on time and within budget, (2) NGL product pricing differentials, and (3) commodity prices. OXF: Risks: Oxford lacks the scale and customer depth of many of its mining peers, which could result in weaker earnings in tough coal markets. Balance sheet concerns could resurface if coal fundamentals deteriorate. PAA: Risks to PAA trading in our valuation range include potential losses from hedging activities, narrower lease gathering margins, and crude supply shortfalls. PAGP: Risks to our valuation range include narrower crude price and quality differentials, slower than forecasted growth at PAA, and potential GP subsidies. PVR: Risks to PVR trading in our valuation range include (1) an extended decline in commodity prices and reduction in the level of drilling activity in the Marcellus, (2) a slowdown in acquisitions or growth projects, and (3) rising interest rates. QEPM: Risks to the units trading below our range include a decline in production levels, dependence on QEP as the MLP's key customer, and dependence on acquisitions to fuel growth. QRE: Risks to the units trading below our range include a decline in commodity prices, dependence upon acquisitions to fuel growth, access to capital markets, and the inability to hedge at favorable prices. RGP: Risks to the units trading below our valuation range include a slower-than-forecasted rate of investments, a decline in commodity prices, and rising interest rates. SDLP: Risks include a lack of direct MLP comparables, global economic weakness, and drilling rig operating risk. SEP: Risks to the units trading below our valuation range include recontracting at lower pipeline rates, reduced demand for natural gas, and rising interest rates. SPH: Risks to the units trading below our range include: (1) unseasonably warm weather, (2) execution risk related to the
WELLS FARGO SECURITIES, LLC Master Limited Partnerships EQUITY RESEARCH DEPARTMENT
88
Wells Fargo Securities, LLC does not compensate its research analysts based on specific investment banking transactions. Wells Fargo Securities, LLC’s research analysts receive compensation that is based upon and impacted by the overall profitability and revenue of the firm, which includes, but is not limited to investment banking revenue. STOCK RATING 1=Outperform: The stock appears attractively valued, and we believe the stock's total return will exceed that of the market over the next 12 months. BUY 2=Market Perform: The stock appears appropriately valued, and we believe the stock's total return will be in line with the market over the next 12 months. HOLD 3=Underperform: The stock appears overvalued, and we believe the stock's total return will be below the market over the next 12 months. SELL
SECTOR RATING O=Overweight: Industry expected to outperform the relevant broad market benchmark over the next 12 months. M=Market Weight: Industry expected to perform in-line with the relevant broad market benchmark over the next 12 months. U=Underweight: Industry expected to underperform the relevant broad market benchmark over the next 12 months.
VOLATILITY RATING V = A stock is defined as volatile if the stock price has fluctuated by +/-20% or greater in at least 8 of the past 24 months or if the analyst expects significant volatility. All IPO stocks are automatically rated volatile within the first 24 months of trading.
integration of acquisitions and (3) volume/profit margin erosion in response to higher energy prices. SUSP: Risks to the units trading below our range include a material decline in motor fuel demand, geographic concentration in Texas, and reliance on SUSS as the primary customer and source of drop-downs. SXE: Risks to the units trading below our range include: growth capex execution, low commodity prices/declining production and geographic/customer concentration. SXL: Risks to the units trading below our valuation range include customer concentration, refinery turnarounds, and rising interest rates. TCP: Risks to the units trading below our range include weaker natural gas fundamentals, slower than forecast pace of dropdowns, and re-contracting risks. TEP: Risks to the units trading below our range include geographic concentration in the Rockies, re-contracting risk, and the ability to complete dropdowns. TGP: Risks include newbuild delivery delays, lower-than-expected LNG demand, and high financial leverage. TLLP: Risks to the units trading below our valuation range include a slower-than-forecasted rate of acquisitions, dependence on TSO, and geographic concentration. TOO: Primary risks include a potential deceleration demand for offshore vessels, dependence on Teekay Corporation to provide future financing, growth through acquisitions, regulatory issues, and vessel operational risks. TRGP: Risks to TRGP trading below our valuation range include execution risk related to integrating acquisitions and completing organic growth projects (at NGLS), a decline in commodity prices, and rising interest rates. USAC: Risks to the units trading below our range include execution risk related to acquisitions and organic growth investments, customer concentration, ability to secure/renew customer contracts and a potential steep decline in U.S. natural gas production/demand. VLP: Risks to the units trading below our range include (1) reliance on the GP sponsor for growth, (2) customer concentration, and (3) capital market access. VNR: Risks to the units trading below our range include a decline in commodity prices, dependence upon acquisitions to fuel growth, and the inability to hedge at favorable prices. WES: Risks to the units trading below our valuation range include a slower than forecast rate of dropdowns, customer concentration, and rising interest rates. WGP: Risks to the units trading below our range include (1) executing on acquisitions (drop-downs) and completing organic growth projects (at WES), (2) lower volumes due to a slowdown in drilling activity within WES' operating regions, and (3) dependence on APC as a key customer and source of future drop-downs. WMB: Risks to our valuation range include commodity prices, execution related to acquisitions and organic growth projects, and an adverse regulatory environment. WNRL: Risks to the units trading below our range include (1) reliance on the GP sponsor for growth, (2) geographic and customer concentration, and (3) capital market access. WPZ: Risks to WPZ trading below our valuation range include sensitivity to commodity prices, an adverse regulatory environment, and rising interest rates. XTEX: Risks to ENLK trading below our valuation range include competition in the Texas-Louisiana gas market, lower processing margins, and interest rates. XTXI: Risks to ENLC trading below our valuation range include potential conflicts of interest, competition in the Texas-Louisiana natural gas market, and interest rates.
WELLS FARGO SECURITIES, LLC MLP Monthly: March 2014 EQUITY RESEARCH DEPARTMENT
89
As of: March 10, 2014
49% of companies covered by Wells Fargo Securities, LLC Equity Research are rated Outperform.
Wells Fargo Securities, LLC has provided investment banking services for 47% of its Equity Research Outperform-rated companies.
49% of companies covered by Wells Fargo Securities, LLC Equity Research are rated Market Perform.
Wells Fargo Securities, LLC has provided investment banking services for 35% of its Equity Research Market Perform-rated companies.
3% of companies covered by Wells Fargo Securities, LLC Equity Research are rated Underperform.
Wells Fargo Securities, LLC has provided investment banking services for 13% of its Equity Research Underperform-rated companies.
Important Information for Non-U.S. Recipients
EEA – The securities and related financial instruments described herein may not be eligible for sale in all jurisdictions or to certain categories of investors. For recipients in the EEA, this report is distributed by Wells Fargo Securities International Limited (“WFSIL”). WFSIL is a U.K. incorporated investment firm authorized and regulated by the Financial Conduct Authority. For the purposes of Section 21 of the UK Financial Services and Markets Act 2000 (“the Act”), the content of this report has been approved by WFSIL a regulated person under the Act. WFSIL does not deal with retail clients as defined in the Markets in Financial Instruments Directive 2007. The FCA rules made under the Financial Services and Markets Act 2000 for the protection of retail clients will therefore not apply, nor will the Financial Services Compensation Scheme be available. This report is not intended for, and should not be relied upon by, retail clients.

WELLS FARGO SECURITIES, LLC Master Limited Partnerships EQUITY RESEARCH DEPARTMENT
90
Australia – Wells Fargo Securities, LLC is exempt from the requirements to hold an Australian financial services license in respect of the financial services it provides to wholesale clients in Australia. Wells Fargo Securities, LLC is regulated under U.S. laws which differ from Australian laws. Any offer or documentation provided to Australian recipients by Wells Fargo Securities, LLC in the course of providing the financial services will be prepared in accordance with the laws of the United States and not Australian laws.
Hong Kong – This report is issued and distributed in Hong Kong by Wells Fargo Securities Asia Limited (“WFSAL”), a Hong Kong incorporated investment firm licensed and regulated by the Securities and Futures Commission to carry on types 1, 4, 6 and 9 regulated activities (as defined in the Securities and Futures Ordinance, “the SFO”). This report is not intended for, and should not be relied on by, any person other than professional investors (as defined in the SFO). Any securities and related financial instruments described herein are not intended for sale, nor will be sold, to any person other than professional investors (as defined in the SFO).
Japan – This report is distributed in Japan by Wells Fargo Securities (Japan) Co., Ltd, registered with the Kanto Local Finance Bureau to conduct broking and dealing of type 1 and type 2 financial instruments and agency or intermediary service for entry into investment advisory or discretionary investment contracts. This report is intended for distribution only to professional investors (Tokutei Toushika) and is not intended for, and should not be relied upon by, ordinary customers (Ippan Toushika).
The ratings stated on the document are not provided by rating agencies registered with the Financial Services Agency of Japan (JFSA) but by group companies of JFSA-registered rating agencies. These group companies may include Moody’s Investors Services Inc, Standard & Poor’s Rating Services and/or Fitch Ratings. Any decisions to invest in securities or transactions should be made after reviewing policies and methodologies used for assigning credit ratings and assumptions, significance and limitations of the credit ratings stated on the respective rating agencies’ websites.
About Wells Fargo Securities, LLC Wells Fargo Securities is the trade name for the capital markets and investment banking services of Wells Fargo & Company and its subsidiaries, including but not limited to Wells Fargo Securities, LLC, a U.S. broker-dealer registered with the U.S. Securities and Exchange Commission and a member of NYSE, FINRA, NFA and SIPC, Wells Fargo Institutional Securities, LLC, a member of FINRA and SIPC, Wells Fargo Prime Services, LLC, a member of FINRA, NFA and SIPC, Wells Fargo Bank, N.A. and Wells Fargo Securities International Limited, authorized and regulated by the Financial Conduct Authority.
Wells Fargo Securities, LLC is a U.S. broker-dealer registered with the U.S. Securities and Exchange Commission and a member of the New York Stock Exchange, the Financial Industry Regulatory Authority and the Securities Investor Protection Corp.
This report is for your information only and is not an offer to sell, or a solicitation of an offer to buy, the securities or instruments named or described in this report. Interested parties are advised to contact the entity with which they deal, or the entity that provided this report to them, if they desire further information. The information in this report has been obtained or derived from sources believed by Wells Fargo Securities, LLC, to be reliable, but Wells Fargo Securities, LLC, does not represent that this information is accurate or complete. Any opinions or estimates contained in this report represent the judgment of Wells Fargo Securities, LLC, at this time, and are subject to change without notice. For the purposes of the U.K. Financial Conduct Authority's rules, this report constitutes impartial investment research. Each of Wells Fargo Securities, LLC, and Wells Fargo Securities International Limited is a separate legal entity and distinct from affiliated banks.. Copyright © 2014 Wells Fargo Securities, LLC.
SECURITIES: NOT FDIC-INSURED/NOT BANK-GUARANTEED/MAY LOSE VALUE

This page intentionally left blank.

This page intentionally left blank.

This page intentionally left blank.

WELLS FARGO SECURITIES, LLC
EQUITY RESEARCH DEPARTMENT
Wells Fargo Securities, LLC Institutional Sales Offices
Wells Fargo Securities, LLC One Boston Place
Suite 2700 Boston, MA 02108
(877) 238-4491
Wells Fargo Securities, LLC 10 S. Wacker Drive
18th Floor Chicago, IL 60606
(312) 345-1187
Wells Fargo Securities, LLC 375 Park Avenue
New York, NY 10152-0005 (800) 876-5670
Wells Fargo Securities, LLC
550 California Street SAC Tower, 6th Floor, Suite 625 San Francisco, CA 94104-1004
Wells Fargo Securities International Limited 1 Plantation Place
30 Fenchurch Street London, EC3M 3BD
44-207-962-2879


Sam J. Pearlstein Todd M. Wickwire Co-Head of Equity Research (212) 214-5054 Co-Head of Equity Research (410) 625-6393 [email protected] [email protected]
March 10, 2014
ENERGY
Exploration & Production David R. Tameron (303) 863-6891 Gord0n Douthat, CFA (303) 863-6920
Brad Carpenter, CFA (303) 863-6894 Jamil Bhatti, CFA (303) 863-6880
Master Limited Partnerships Michael J. Blum (212) 214-5037 Sharon Lui, CPA (212) 214-5035 Praneeth Satish (212) 214-8056
Eric Shiu (212) 214-5038 Ned Baramov (212) 214-8021 David Freeland (212) 214-5050
Utilities Neil Kalton, CFA (314) 875-2051 Sarah Akers, CFA (314) 875-2040
Jonathan Reeder (314) 875-2052 Glen F. Pruitt (314) 875-2047 Peter Flynn (314) 875-2049
Oilfield Services and Drilling Matthew D. Conlan, CFA (212) 214-5044
Tom W. Rhee, CFA, FRM (212) 214-8012
Refiners & Integrateds Roger D. Read (713) 577-2542
Lauren Hendrix (713) 577-2543
HEALTH CARE
Biotechnology Brian C. Abrahams, M.D. (212) 214-8060
Matthew J. Andrews (617) 603-4218 Shin Kang, PhD (212) 214-5036
Healthcare Facilities Gary Lieberman, CFA (212) 214-8013
Ryan Halsted (212) 214-8022
Healthcare IT & Distribution Jamie Stockton, CFA (901) 271-5551
Stephen Lynch (901) 271-5552 Nathan Weissman (901) 271-5553
Life Science Tools & Services Tim Evans (212) 214-8010
Luke E. Sergott (212) 214-8027
Managed Care Peter H. Costa (617) 603-4222
Polly Sung, CFA (617) 603-4324 Brian Fitzgerald (617) 603-4277
Medical Technology Larry Biegelsen (212) 214-8015
Lei Huang (212) 214-8039 Craig W. Bijou (212) 214-8038 David Y. Brill (212) 214-8042
Pharmaceuticals Michael Faerm (212) 214-8026
FINANCIAL SERVICES
Brokers/Exchanges/Asset Managers Christopher Harris, CFA (443) 263-6513
Nathan Burk, CFA (314) 875-2055 Andrew Bond (443) 263-6526
Insurance John Hall (212) 214-8032 Elyse Greenspan, CFA (212) 214-8031
Kenneth Hung, CFA, ASA (212) 214-8023 Rashmi H. Patel, CFA (212) 214-8034
Specialty Finance Joel J. Houck, CFA (443) 263-6521 Jonathan Bock, CFA (443) 263-6410
Vivek Agrawal (443) 263-6563 Ronald Jewsikow (443) 263-6449 Charles Nabhan (443) 263-6578 Gregory Nelson (443) 263-6553
U.S. Banks Matt H. Burnell (212) 214-5030 Herman Chan (212) 214-8037
Jason Harbes, CFA (212) 214-8068
MEDIA & TELECOMMUNICATIONS
Advertising Peter Stabler (415) 396-4478
Ignatius Njoku (415) 396-4064 Steve Cho (415) 396-6056
Media & Cable Marci Ryvicker, CFA, CPA (212) 214-5010 Eric Katz (212) 214-5011
Stephan Bisson (212) 214-8033 Satellite Communications
Andrew Spinola (212) 214-5012
Telecommunication Services - Wireless/Wireline Jennifer M. Fritzsche (312) 920-3548
Caleb Stein (312) 845-9797 John Huh (212) 2148044
REAL ESTATE, GAMING & LODGING
Gaming Cameron McKnight (212) 214-5046 Barry Jonas (212) 214-8066
Rich Cummings (212) 214-8030
Healthcare/Manufactured Housing/Self Storage Todd Stender (212) 214-8067
Philip DeFelice, CFA (443) 263-6442
Lodging/Multifamily/Retail Jeffrey J. Donnelly, CFA (617) 603-4262
Dori Kesten (617) 603-4233 Robert LaQuaglia, CFA, CMT (617) 603-4263 Tamara Fique (443) 263-6568
Office/Industrial/Infrastructure Brendan Maiorana, CFA (443) 263-6516
Young Ku, CFA (443) 263-6564 Blaine Heck, CFA (443) 263-6529
STRATEGY Equity Strategy
Gina Martin Adams, CFA, CMT (212) 214-8043 Peter Chung (212) 214-8063
Strategic Indexing Daniel A. Forth (704) 410-3233
RETAIL RESEARCH MARKETING Retail Research Marketing
Colleen Hansen (410) 625-6378
Diane Schumaker-KriegGlobal Head of Research, Economics & Strategy
(212) 214-5070 / (704) 410-1801 [email protected]
Paul Jeanne, CFA, CPA Lisa HausnerAssociate Director of Research Global Head of Publishing (443) 263-6534 / (212) 214-8054 (443) 263-6522 [email protected] [email protected]
CONSUMER Beverage/Tobacco
Bonnie Herzog (212) 214-5051 Jessica Gerberi, CFA (212) 214-5029 Adam Scott (212) 214-8064
Cosmetics, Household & Personal Care Chris Ferrara, CFA, CPA (212) 214-8050 Joe Lachky, CFA (314) 875-2042
Zachary Fadem, CPA (212) 214-8018
Education Trace A. Urdan (415) 947-5470
Jeffrey Lee (415) 396-4328
Food John Baumgartner, CFA (212) 214-5015
Kristina Westura (212) 214-5028
Homebuilding/Building Products Adam Rudiger, CFA (617) 603-4260
Joey Matthews, CPA (415) 396-3873
Leisure Timothy Conder, CPA (314) 875-2041
Karen Wang (314) 875-2556 Marc J. Torrente (314) 875-2557
Restaurants & Foodservice Jeff Farmer, CFA (617) 603-4314
Imran Ali (617) 603-4315 Jay Donnelly (617) 603-4207
Retail Matt Nemer (415) 396-3938 Kate Wendt (415) 396-3977 Trisha Dill, CFA (312) 920-3594
Omair Asif (415) 222-1159 Maren Kasper (415) 396-3194
Evren Kopelman, CFA (212) 214-8024 Connie Wang (212) 214-5024
Paul Lejuez, CPA, CFA (212) 214-5072 Tracy Kogan (212) 214-8065 Justin C. Matthews (212) 214-8059
TECHNOLOGY & SERVICES
Applied Technologies Andrew Spinola (212) 214-5012
Communication Technology Jess Lubert, CFA (212) 214-5013
Michael Kerlan (212) 214-8052 Gray Powell, CFA (212) 214-8048
Priya Parasuraman (617) 603-4269
Information & Business Services William A. Warmington, Jr. (617) 603-4283
Internet Peter Stabler (415) 396-4478
Ignatius Njoku (415) 396-4064 Steve Cho (415) 396-6056
IT & BPO Services Ed Caso, CFA (443) 263-6524
Richard Eskelsen, CFA (410) 625-6381 Tyler Scott (443) 263-6540
IT Hardware Maynard Um (212) 214-8008
Munjal Shah (212) 214-8061 Santosh Sankar (212) 214-8007
Semiconductors David Wong, CFA, PhD (212) 214-5007
Amit Chanda (314) 875-2045 Parker Paulin (212) 214-5066
Software/Internet, Technology Jason Maynard (415) 947-5472
Karen Russillo (415) 396-3505
Transaction Processing Timothy W. Willi (314) 875-2044
Robert Hammel (314) 875-2053 Alan Donatiello, CFA (314) 875-2054
INDUSTRIAL Aerospace & Defense
Sam J. Pearlstein (212) 214-5054 Gary S. Liebowitz, CFA (212) 214-5055
Michael D. Conlon (212) 214-5056
Automotive/Electrical and Industrial Products Rich Kwas, CFA (410) 625-6370 David H. Lim (443) 263-6565
Deepa Raghavan, CFA (443) 263-6517
Chemicals Frank J. Mitsch (212) 214-5022
Sabina Chatterjee (212) 214-8049 Maggie Cheung (212) 214-8011
Containers & Packaging Chris Manuel (216) 643-2966
Gabe S. Hajde (216) 643-2967 Nikita V. Bely (216) 643-2968
Diversified Industrials Allison Poliniak-Cusic, CFA (212) 214-5062
Michael L. McGinn (212) 214-5052
Machinery Andrew Casey (617) 603-4265
Justin Ward (617) 603-4268 Sara Magers, CFA (617) 603-4270
Metals & Mining Sam Dubinsky (212) 214-5043
Amir Chaudhri (212) 214-5045
Shipping, Equipment Leasing, & Marine MLPs Michael Webber, CFA (212) 214-8019
Donald D. McLee (212) 214-8029 Sameed Musvee (212) 214-8040
Transportation Anthony P. Gallo, CFA (410) 625-6319
Casey S. Deak (443) 263-6579