equity research cardiology - baylor...
TRANSCRIPT

Equity Research
30 October 2006Americas/United States
Medical Supplies & Devices
UNDERWEIGHT
Cardiology Maturity Here to Stay
• Initiating coverage at Underweight. We are initiating coverage of the Medical Supplies & Devices—Cardiology sector with an Underweight stance. We believe that the core cardiology markets are more mature than appreciated, particularly the market for implantable cardioverter defibrillators (ICDs).
• Core markets slowing. Drug-eluting stents (DES) for angioplasty and ICDs for primary prevention of sudden cardiac death were rapidly accepted in 2003-05, and we believe incremental adoption will largely cease for stents and slow considerably for ICDs. Further, we do not see new treatment areas, such as peripheral vascular disease, atrial fibrillation, or neurostimulation driving a return to historical top-line growth of 15-20%, or even double digits, in the near term.
• ICD expectations still too high. We estimate that the number of patients accessible for primary prevention for ICDs is 15% smaller than is widely believed. Women, minorities, and patients not under the care of cardiologists are not likely to receive devices, and companies will have a difficult time accelerating referrals for treatment. We forecast 2005-10 U.S. and global market growth at 3% and 5%, respectively, compared with 6% and 8% for consensus.
• Companies face difficult marketing challenges to reinvigorate growth. Our view of the structure of the heart failure population implies that the companies will need to market to a 16-160x larger and less accessible group of physicians than they have reached before and they will need to deliver a message of insurance, not acute care, like the balance of their therapies.
• Valuation low for a reason. While the sector typically trades at a 50% premium to the P/FE of the S&P 500, it now is near historical lows at a 31% premium. Given the sector’s challenges to growth, we anticipate the sector to remain at a relatively low 25% premium for the next 6-12 months as sales and earnings expectations continue to adjust downward.
• We expect divergent share price performance within the group:
Boston Scientific—Outperform, target: $19 (19% upside). We see a favorable risk/reward trade-off, with valuation reflecting a severe scenario for Boston Scientific’s ICD business and the integration of Guidant.
St. Jude Medical—Underperform, target: $28 (18% downside). Expectations are based on overly optimistic ICD market growth and share forecasts, setting STJ up to miss 2008 consensus by 15-20%. We see the potential for an acquisition by a larger company, such as JNJ, as the only reason to own this stock, but an unlikely event.
Medtronic—Neutral, target: $53 (9% upside). While its valuation is attractive versus historical benchmarks, we see near-term volatility based on negative ICD earnings revisions and positive launches at its Spinal and Vascular businesses.
IMPORTANT DISCLOSURES, ANALYST CERTIFICATIONS AND INFORMATION ON TRADE ALERTS AND ANALYST MODEL PORTFOLIOS ARE IN THE DISCLOSURE APPENDIX. U.S. Disclosure: Credit Suisse does and seeks to do business with companies covered in its research reports. As a result, investors should be aware that the Firm may have a conflict of interest that could affect the objectivity of this report. Investors should consider this report as only a single factor in making their investment decision. Customers of Credit Suisse in the United States can receive independent, third party research on the company or companies covered in this report, at no cost to them, where such research is available. Customers can access this independent research at www.credit-suisse.com/ir or call 1 877 291 2683 or email [email protected] to request a copy of this research.
research team
Marshall Gordon Research Analyst 212 325 5210 [email protected]
Thijs Spoor Research Analyst 212 538 8045 [email protected]
Rodny Nacier Research Analyst 212 538 8046 [email protected]
Cardiology 30 October 2006
2
Table of Contents
Executive Summary ..........................................................................................................4 The Goldilocks Era of Cardiology Is Past......................................................................4 Growth Rates Will Not Be Robust Through 2010..........................................................5
Cardiac Rhythm Management—No Return to Robust Growth.........................................8 We Forecast 5% Annual CRM Market Growth..............................................................9 Heart Failure Epidemiology Implies Smaller Available Market .....................................9 Primary Prevention Penetration Should Peak at 65-70% ...........................................10
Total Heart Failure Patient Numbers Are Reasonable ...................................................12 Coronary Disease Survival Means More Heart Failure...............................................12 Heart Failure in the United States—5 Million Symptomatic Individuals ......................14 The Faint of Heart—1.3 Million People with Low Ejection Fraction ............................15
Fewer Heart Failure Patients Are Accessible .................................................................16 Market Estimation Approach Different, but Trying to Measure the Same Variables...16 Women Likely to Get Less Cardiac Care Than Men...................................................18 Almost Half of Heart Failure Patients Are Not Cared for by Cardiologists ..................20 African-American Patients Also Get Less Cardiac Care.............................................26
Natural Limits to the Adoption of Therapies....................................................................29 Only Two-Thirds of Heart Failure Patients Get Ejection Fraction Measurements ......29 Optimal Medical Therapy for Heart Failure Peaks at 75%..........................................30 ICD Use for Secondary Prevention Remains at 60%..................................................31
ICD Growth Will Be Harder to Drive................................................................................32 Changing Medical Biases Will Take a Long Time.......................................................32 Insurance Is More Difficult to Sell Than Treatment .....................................................32 New Patients Mean Marketing to New Physicians......................................................33
Credit Suisse Global CRM Market Forecast...................................................................36 U.S. New Implant Growth at 3% through 2010 ...........................................................38 U.S. Unit Price Erosion to Continue at 1-2%—Innovation Will Not Keep ASP Level .39 U.S. ICD Revenue to Grow at 6.6% through 2010......................................................40 U.S. Market Share Moves Slowly Back to Pre-Recall Equilibrium..............................41 RoW Market Smaller, but Growing Faster ..................................................................42
Stent Market Also at Maturity..........................................................................................44 Worldwide Unit Demand Growth Will Slow .................................................................45 Pricing Erosion Should Intensify with Competition......................................................46 Market Share to Shift to New Competitors, Especially Xience/Promus ......................47 Johnson & Johnson—Cypher Dethroned....................................................................47 Boston Scientific-Promus’es to Be a Credible Number 2............................................48 Abbott-Xience—A New Market Leader Emerging.......................................................49 Medtronic Endeavors to Do Well.................................................................................49 ZoMaxx—Short Lived, Now Extinct.............................................................................50
Sector Should Remain at Historical Low Valuation ........................................................52 Forward Price-to-Earnings (P/E) Valuation Methodology ...........................................52 Reduced Sector Premium to Market Warranted .........................................................53

Cardiology 30 October 2006
3
Trough Valuation Consistent with Broader Healthcare Sector Metrics .......................54 HOLT Valuation Suggests Further Downside .............................................................55
Cardiology 30 October 2006
4
Executive Summary We are initiating coverage of the Cardiology sector of Medical Supplies & Devices, which includes Medtronic, Boston Scientific and St. Jude Medical, with a sector Underweight stance. Based on our in-depth analysis of the epidemiology of heart failure and its relationship to the market for implantable cardioverter defibrillators (ICDs), we believe that the core markets for devices to treat cardiac conditions, especially ICDs, are more mature than appreciated by investors. We anticipate that there will be additional downward sales and earnings revisions. Therefore, despite the sector trading near the bottom of its historical multiple relative to the S&P 500 at only a 31% premium, we see limited stock appreciation potential and substantial continuing volatility for the group as a whole over the next 6-12 months.
We think, however, that different degrees of optimism and pessimism are reflected in the share prices of the individual companies that make up the sector. We see Boston Scientific discounting a very severe scenario, allowing us to rate it Outperform, albeit on a relative basis to its peers. St. Jude, on the other hand, reflects optimism about market size and share, unjustified in our opinion, and we rate it Underperform. Finally, Medtronic, the largest cardiology company, needs market growth to meet expectations, and we rate it Neutral, with a negative bias until expectations adjust downward.
The Goldilocks Era of Cardiology Is Past The practice of cardiology has been transformed since 2000 through the rapid adoption of new interventional medical technologies—the drug-eluting stent (DES) and the ICD. Following the launch of the Cypher DES in 2003, the interventional cardiology community worldwide quickly embraced the use of DES to enhance the outcome of balloon angioplasty and stenting, increasing the potential stent market to two to three times its original size on an absolute dollar basis. In electrophysiology, the MADIT II and, more important, the Sudden Cardiac Death in Heart Failure Trial (SCD-HeFT) paved the way for reimbursement and broad use of ICDs to prevent Sudden Cardiac Death (SCD) in patients who were at risk for such events but had not yet experienced one. Not only did these innovative technologies materially improve health outcomes, but they greatly benefited the manufacturers of these devices. From 2001-05, sales by the leading cardiology device companies—Medtronic, Boston Scientific, Guidant, St. Jude Medical, and Johnson & Johnson’s Cordis Division—doubled (see Exhibit 1), catalyzing strong outperformance of the shares of these companies. (See Exhibit 2.)

Cardiology 30 October 2006
5
Exhibit 1: Cardiology Company Revenue, 2001–10
$US in millions
Exhibit 2: Cardiology Company Stock Price Performance,
2000–06 Year to Date
$35,294
$28,023
$14,417
18%
23%
20%
12%
4%4%
5% 5% 5%
$0
$10,000
$20,000
$30,000
$40,000
2001 2002 2003 2004 2005 2006 2007 2008 2009 2010
Co
re C
ard
iolo
gy
Ind
ust
ry S
ales
($m
m)
0%
5%
10%
15%
20%
25%
Yo
Y G
row
th R
ate (%)
Core Cardiology Industry Sales ($mm) YoY Growth Rate (%)
185
225
67
99
0
50
100
150
200
250
2000 2001 2002 2003 2004 2005 2006
Sto
ck P
rice
Per
form
ance
(I
ndex
ed 2
000=
100)
Core Cardiology - Equal Weighted S&P 500 Source: Company data, Credit Suisse estimates. Source: Company data, Credit Suisse estimates.
Growth Rates Will Not Be Robust through 2010 We believe that the market for medical devices to treat cardiovascular disease has reached a period of maturity, more so than is reflected in today’s share prices of the core cardiology companies. For the DES market, there appears to be a broad consensus among investors around the weak prospects for the stent business. We agree with the majority view that the global market will be flat to declining and that new competitors, such as Abbott and Medtronic, will capture share and erode prices.
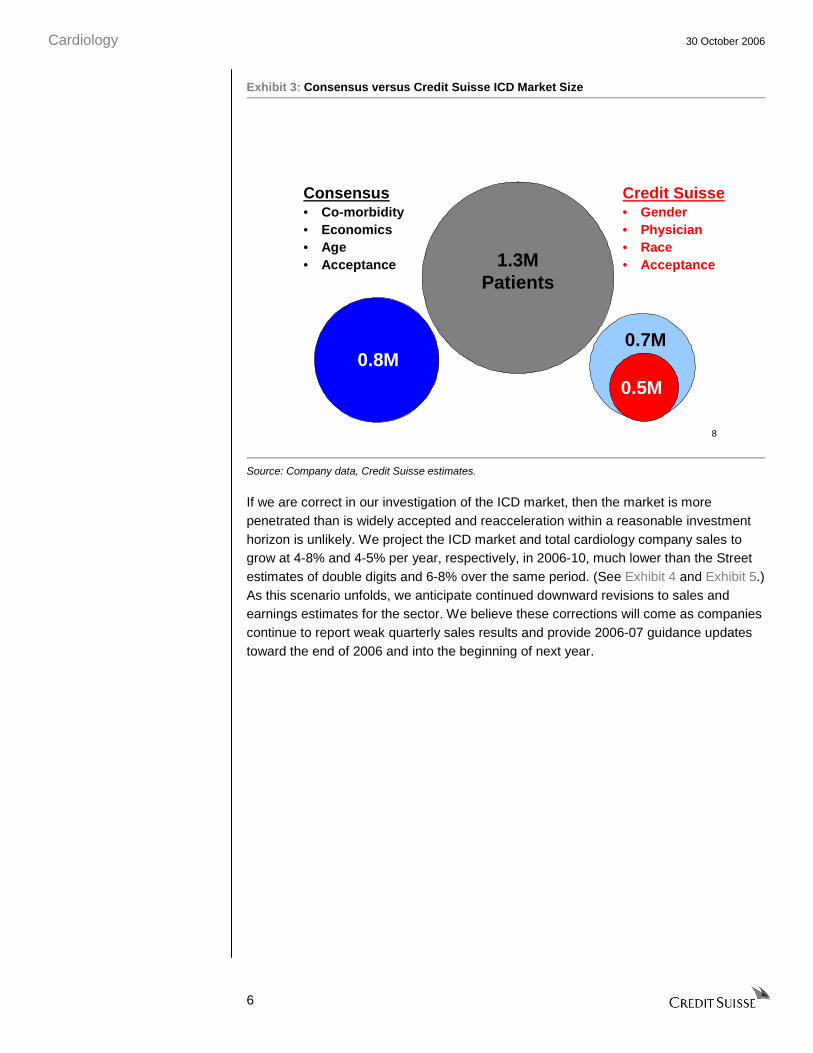
There is controversy, however, over the trajectory of the U.S. and global ICD market. The U.S. market has slowed from 15-20% growth in 2005 to 5% contraction in the most recent quarter, catalyzing 30-40% declines in the stocks in the sector thus far in 2006. Our analysis of the U.S. ICD market, which accounted for over 75% of the global market in 2005, suggests that it will not return to robust growth. Our view stands in contrast to what the companies and many investors think at the present time. We believe that the patient pool for the primary prevention of SCD is 15% smaller than previously assumed because major cardiology companies will have difficulty accessing women, minorities, and the patients under the care of noncardiologists; this group makes up a significant proportion of the pool of potential patients. (See Exhibit 3.) Further, getting device therapy to these patients requires overcoming long-standing medical practice biases and building expensive sales capabilities that the companies currently do not have.
Cardiology 30 October 2006
6
Exhibit 3: Consensus versus Credit Suisse ICD Market Size
8
1.3MPatients
0.8M
Consensus• Co-morbidity• Economics• Age• Acceptance
0.7M
0.5M
Credit Suisse• Gender• Physician• Race• Acceptance
Source: Company data, Credit Suisse estimates.
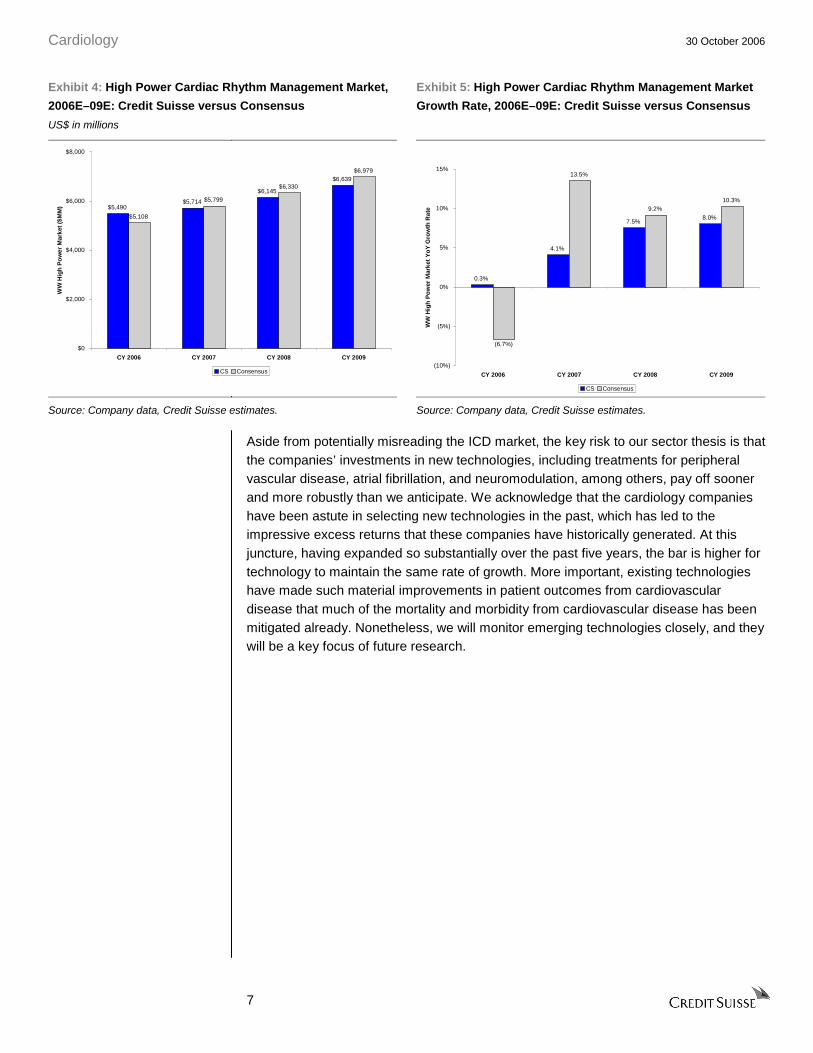
If we are correct in our investigation of the ICD market, then the market is more penetrated than is widely accepted and reacceleration within a reasonable investment horizon is unlikely. We project the ICD market and total cardiology company sales to grow at 4-8% and 4-5% per year, respectively, in 2006-10, much lower than the Street estimates of double digits and 6-8% over the same period. (See Exhibit 4 and Exhibit 5.) As this scenario unfolds, we anticipate continued downward revisions to sales and earnings estimates for the sector. We believe these corrections will come as companies continue to report weak quarterly sales results and provide 2006-07 guidance updates toward the end of 2006 and into the beginning of next year.
Cardiology 30 October 2006
7
Exhibit 4: High Power Cardiac Rhythm Management Market,
2006E–09E: Credit Suisse versus Consensus
US$ in millions
Exhibit 5: High Power Cardiac Rhythm Management Market
Growth Rate, 2006E–09E: Credit Suisse versus Consensus
$5,490$5,714
$6,145
$6,639
$5,108
$5,799
$6,330
$6,979
$0
$2,000
$4,000
$6,000
$8,000
CY 2006 CY 2007 CY 2008 CY 2009
WW
Hig
h P
ow
er M
arke
t ($
MM
)
CS Consensus
0.3%
4.1%
7.5%8.0%
13.5%
9.2%10.3%
(6.7%)
(10%)
(5%)
0%
5%
10%
15%
CY 2006 CY 2007 CY 2008 CY 2009
WW
Hig
h P
ow
er M
arke
t Y
oY
Gro
wth
Rat
e
CS Consensus
Source: Company data, Credit Suisse estimates. Source: Company data, Credit Suisse estimates.
Aside from potentially misreading the ICD market, the key risk to our sector thesis is that the companies’ investments in new technologies, including treatments for peripheral vascular disease, atrial fibrillation, and neuromodulation, among others, pay off sooner and more robustly than we anticipate. We acknowledge that the cardiology companies have been astute in selecting new technologies in the past, which has led to the impressive excess returns that these companies have historically generated. At this juncture, having expanded so substantially over the past five years, the bar is higher for technology to maintain the same rate of growth. More important, existing technologies have made such material improvements in patient outcomes from cardiovascular disease that much of the mortality and morbidity from cardiovascular disease has been mitigated already. Nonetheless, we will monitor emerging technologies closely, and they will be a key focus of future research.
Cardiology 30 October 2006
8
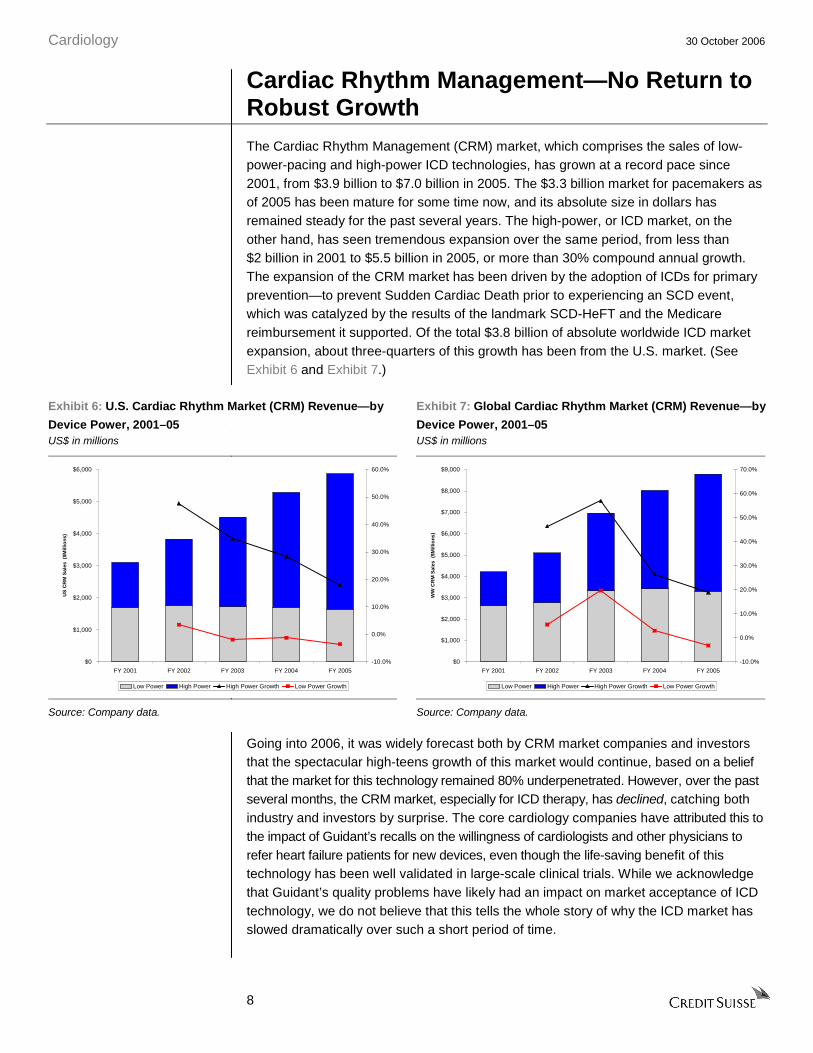
Cardiac Rhythm Management—No Return to Robust Growth The Cardiac Rhythm Management (CRM) market, which comprises the sales of low-power-pacing and high-power ICD technologies, has grown at a record pace since 2001, from $3.9 billion to $7.0 billion in 2005. The $3.3 billion market for pacemakers as of 2005 has been mature for some time now, and its absolute size in dollars has remained steady for the past several years. The high-power, or ICD market, on the other hand, has seen tremendous expansion over the same period, from less than $2 billion in 2001 to $5.5 billion in 2005, or more than 30% compound annual growth. The expansion of the CRM market has been driven by the adoption of ICDs for primary prevention—to prevent Sudden Cardiac Death prior to experiencing an SCD event, which was catalyzed by the results of the landmark SCD-HeFT and the Medicare reimbursement it supported. Of the total $3.8 billion of absolute worldwide ICD market expansion, about three-quarters of this growth has been from the U.S. market. (See Exhibit 6 and Exhibit 7.)
Exhibit 6: U.S. Cardiac Rhythm Market (CRM) Revenue—by
Device Power, 2001–05 US$ in millions
Exhibit 7: Global Cardiac Rhythm Market (CRM) Revenue—by
Device Power, 2001–05 US$ in millions
$0
$1,000
$2,000
$3,000
$4,000
$5,000
$6,000
FY 2001 FY 2002 FY 2003 FY 2004 FY 2005
US
CR
M S
ales
($M
illio
ns)
-10.0%
0.0%
10.0%
20.0%
30.0%
40.0%
50.0%
60.0%
Low Power High Power High Power Growth Low Power Growth
$0
$1,000
$2,000
$3,000
$4,000
$5,000
$6,000
$7,000
$8,000
$9,000
FY 2001 FY 2002 FY 2003 FY 2004 FY 2005
WW
CR
M S
ales
($M
illio
ns)
-10.0%
0.0%
10.0%
20.0%
30.0%
40.0%
50.0%
60.0%
70.0%
Low Power High Power High Power Growth Low Power Growth
Source: Company data. Source: Company data.
Going into 2006, it was widely forecast both by CRM market companies and investors that the spectacular high-teens growth of this market would continue, based on a belief that the market for this technology remained 80% underpenetrated. However, over the past several months, the CRM market, especially for ICD therapy, has declined, catching both industry and investors by surprise. The core cardiology companies have attributed this to the impact of Guidant’s recalls on the willingness of cardiologists and other physicians to refer heart failure patients for new devices, even though the life-saving benefit of this technology has been well validated in large-scale clinical trials. While we acknowledge that Guidant’s quality problems have likely had an impact on market acceptance of ICD technology, we do not believe that this tells the whole story of why the ICD market has slowed dramatically over such a short period of time.

Cardiology 30 October 2006
9
We Forecast 5% Annual CRM Market Growth We do not see the market reaccelerating back to its historical growth rate, but rather to 2-7% annually, or a compound annual growth rate of 5% through 2010, slightly above the rate of expansion of the incidence of heart failure in the population. (See Exhibit 8 and Exhibit 9.) Our market forecast is predicated on our analysis of who makes up the population of heart failure patients and which physicians provide care to these individuals. We believe that the ICD primary prevention market, which accounts for the majority of the CRM growth opportunity, is approximately 15% smaller than does consensus. We also see saturation of the market earlier than the majority of investors for two reasons: (1) We estimate that primary prevention market penetration is not 35%, but rather 42%, based on our smaller assessment of market size. (2) We forecast adoption of ICD technology reach a ceiling at 65-70% rather than the unstated assumption from the industry that 100% of eligible patients should receive a device.
Exhibit 8: U.S. Cardiac Rhythm Management Revenue, 2003–10E US$ in millions
Exhibit 9: Global Cardiac Rhythm Management Revenue, 2003–10E US$ in millions
$0
$1,000
$2,000
$3,000
$4,000
$5,000
$6,000
$7,000
$8,000
FY 2003 FY 2004 FY 2005 FY 2006E FY 2007E FY 2008E FY 2009E FY 2010E
US
CR
M S
ales
($0
00s)
-10.0%
-5.0%
0.0%
5.0%
10.0%
15.0%
20.0%
25.0%
30.0%
35.0%
40.0%
Low Power High Power High Power Growth Low Power Growth
$0
$2,000
$4,000
$6,000
$8,000
$10,000
$12,000
FY 2003 FY 2004 FY 2005 FY 2006E FY 2007E FY 2008E FY 2009E FY 2010E
WW
CR
M S
ales
($0
00s)
-10.0%
0.0%
10.0%
20.0%
30.0%
40.0%
50.0%
60.0%
70.0%
Low Power High Power High Power Growth Low Power Growth
Source: Company data, Credit Suisse estimates. Source: Company data, Credit Suisse estimates.
Heart Failure Epidemiology Implies Smaller Available Market We believe that consensus assumptions about ICD primary prevention market size are overestimated, and as a result that the degree of market penetration is overestimated. Many have estimated the size of the primary prevention patient pool by examining the total population of heart failure patients and excluding people who are too sick or cannot afford a device. From a base of 1.3 million heart-failure patients with a weak heart (defined as an ejection fraction less than 35%), these reductions, 20% for comorbidity and 15% for economics, or 35% in total, imply a current pool of 850,000 patients for whom an ICD is indicated. (See Exhibit 10.) Given a base of slightly more than 400,000 implanted devices, of which 180,000 are implanted in secondary prevention patients, consensus analysis implies 35% market penetration. In our opinion, initial results from these catch-all reductions in the overall patient pool have not been well validated by independent data sources.

Cardiology 30 October 2006
10
Exhibit 10: Consensus View of Available ICD Primary
Prevention Population
patients in 000s
Exhibit 11: Credit Suisse View of Available ICD Primary
Prevention Population
patients in 000s
854
1,313
0
500
1,000
1,500
Primary PreventionPopulation
Co-morbidity Economics Total
Pri
mar
y P
reve
nti
on
Pat
ien
t P
op
ula
tio
n (
000'
s)
-35%
723
1,313
0
500
1,000
1,500
Primary PreventionPopulation
Women Treating Physician Race Total
Pri
mar
y P
reve
nti
on
Pat
ien
t P
op
ula
tion
(00
0's)
-45%
Source: Company data, Credit Suisse estimates. Source: Company data, Credit Suisse estimates.
As an alternative to the traditional method of looking at the market, we used demographic variables and treating physicians to examine the size of the available pool of primary prevention patients. We use specific estimates from published data sources on heart failure epidemiology and treatment, as well as on invasive and pharmacologic cardiology treatments more broadly, to support our market estimates. We believe the indicated ICD primary prevention population is reduced from 1.3 million to 723,000 patients. (See Exhibit 11.) Our exclusions imply the U.S. primary prevention ICD market appears to be 42% penetrated in 2006, rather than 35% as believed by consensus.
Specifically, we believe that three variables are good proxy for the exclusions from the primary prevention pool:
• Gender. Women are 60% less likely to receive an ICD than men, and they make up 55% of the heart failure population.
• Treating physician. Patients who are not under the care of a cardiologist are 50% less likely to receive an ICD than patients who are, and 30-40% of heart failure patients never even receive a cardiology consult.
• Race. African-Americans are 30% less likely to receive an ICD than whites, and they account for 15% of the heart failure population.
Primary Prevention Penetration Should Peak at 65-70% We forecast that the adoption of ICD technology among indicated patients will reach only 65-70%, whereas consensus appears to accept that eventually all indicated patients will receive devices. The adoption of invasive medical technology, even those that are life saving, is rarely 100%. In the case of ICDs, we see three close proxies: the adoption of testing for ejection fraction; the adoption of optimal pharmaceutical therapy for heart failure; and the penetration of ICDs in the secondary prevention population. Levels of penetration for all of these similar interventions reached a plateau at around 65-70%, and we do not believe that primary prevention ICD therapy will differ materially.

Cardiology 30 October 2006
11
Our Key ICD Market Assumptions are as follows:
• Growth of incident heart disease population is 3-4%, in-line with age and population growth.
United States
• The primary prevention market is 723,000 total patients, of which 300,000, or 42%, have received devices. Our estimate of market size is 15% smaller than that of CRM consensus and the companies.
• The secondary prevention market is estimated at 300,000 total patients, of which 180,000, or 60%, receive devices. Given the number of years ICD technology has been available, the penetration in this market has reached its peak.
• Growth in patients being referred in to electrophysiologists recovers, but more in-line with the growth in the prevalence of the disease.
• Peak penetration of eligible and available patients will be 65-70%; consistent with the adoption of pharmaceuticals in heart failure patients and ICD therapy in the primary prevention cohort.
• We forecast that 60,000 CRT-D devices will be implanted in 2006, representing 34% of the secondary prevention pool. The proportion of patients receiving CRT-D devices will remain at around one-third of high-power patients.
• Pricing declines of 1-2% annually will more than offset market growth in unit demand.
Europe/RoW
• Growth in patients being referred in to electrophysiologists is steadily increasing with the change in demographics as well as a continued acceptance of the technologies as the national healthcare systems increase their willingness and correspondingly their budgets to pay for the technology.
• Prices in-line with the United States, mild decline on the same device price with some mix shift to new devices and more expensive BiV pacing to offset this.
Cardiology 30 October 2006
12
Total Heart Failure Patient Numbers Are Reasonable We agree with the market’s view of the number of total, symptomatic, and weak heart (low ejection fraction) heart failure patients. It is widely accepted, based on reports from a number of reliable medical and disease specific sources, that there are approximately 65-70 million individuals who suffer from some stage of heart failure in the United States. Further, we accept standard proportions of patients who are symptomatic and in need of appropriate medical care, largely Stage C heart failure as defined by the American Heart Association. Therefore, we believe that there are approximately 5 million individuals with symptomatic heart failure in the United States. Finally, we believe of the 5 million people with symptomatic heart failure, 1.3 million, or 26%, have weak hearts, defined as having an ejection fraction—the standard measure of cardiac output—of less than 35%. This group of individuals represents the core market for primary prevention ICD therapy as this EF threshold is one of the key qualifying criteria as defined in MADIT-2 and SCD-HeFT for suitability to receive a device and as such is part of the required patient workup to qualify for reimbursement.
Coronary Disease Survival Means More Heart Failure We forecast the growth rate of heart failure at 3%, in-line with the growth rate of ischemic heart disease. Patients with coronary artery disease (CAD) are developing congestive heart failure (CHF) as they survive the circulatory disorder, and they are now dying from complications secondary to CHF. The result of better interventions for CAD through the rapid innovations and the acceptance of balloon angioplasty and the drug eluting stent revolution mean that more and more patients are now able to survive blockages of the coronary arteries that 20 years ago would have been fatal. Heart failure patients, those who have a stretching of the cardiac muscle and a decrease in cardiac output, remain asymptomatic until the heart starts a process known as remodeling. This stretching causes scarring and trauma and is thought to lead to a degradation in the conductive pathways of the heart. Remodeling gives rise to the risk of SCD, which occurs when the electrical system of the heart shuts down, stopping it from beating. The growing epidemic in the developed world has now become the onset of heart failure as exacerbated by hypertension and prior myocardial ischemia. (See Exhibit 13.)

Cardiology 30 October 2006
13
Exhibit 12: Evolution of Heart Disease and the Corresponding Medical Devices
Congenital Heart Disease
Coronary Artery Disease CAD
Acute Myocardial Infarction AMI
Congestive Heart Failure
CHF
Sudden CardiacDeath SCD
Blood Chemistry
High Blood Pressure
Stable Angina
Stents
ICD’s
Congenital Heart Disease
Coronary Artery Disease CAD
Acute Myocardial Infarction AMI
Congestive Heart Failure
CHF
Sudden CardiacDeath SCD
Blood Chemistry
High Blood Pressure
Stable Angina
Stents
ICD’s
Source: Company data, Credit Suisse estimates.
Exhibit 13: Mortality in Cardiology
150
200
250
300
350
‘80 ‘85 ‘90 ‘95 ‘0020
30
40
50
60Deaths due to CHF
Deaths due to AMI
AMI Deaths (000) CHF Deaths (000)
150
200
250
300
350
‘80 ‘85 ‘90 ‘95 ‘0020
30
40
50
60Deaths due to CHF
Deaths due to AMI
AMI Deaths (000) CHF Deaths (000)
150
200
250
300
350
‘80 ‘85 ‘90 ‘95 ‘0020
30
40
50
60Deaths due to CHF
Deaths due to AMI
AMI Deaths (000) CHF Deaths (000)
Source: American Heart Association, Credit Suisse estimates.

Cardiology 30 October 2006
14
Heart Failure in the United States—5 Million Symptomatic Individuals Heart failure is a burgeoning global epidemic with a particularly high burden in developed nations where patients are surviving ischemic heart disease. The American Heart Association currently estimates that 46 million people have Stage A “heart failure.” These are patients who are at high risk of disease, but do not have any structural heart disease or symptoms of heart failure. These patients typically have several comorbidities such as hypertension, CAD, and diabetes, among others. Owing to the dynamic nature of the disease (see Exhibit 12), we believe that this population will continue to grow at 3%, in-line with the growth of the aging population and the number of CAD survivors becoming heart failure patients.
Exhibit 14: American Heart Association Classification
Stage A
At high risk for heart failure but
without structural heart disease or symptoms of HF
e.g. Patients with: - hypertension
- CAD
- diabetes
or
Patients
- using cardiotoxins
- with FHx CM
Structuralheart
disease
Stage B
Structural heart disease but without
symptoms of HF
e.g. Patients with: - previous MI
- LV systolic dysfunction
- asymptomatic valvular disease
Stage C
Structural heart disease with prior
or current symptoms of HF
e.g. Patients with: - known structural heart disease
- shortness of breath & fatigue, reduced exercise tolerance
Developmt
of symptoms
of HF
Stage D
Refractory HF requiring
specialised interventions
Patients who have marked symptoms at rest despite maximal medical therapy (e.g. those who are recurrently hospitalised or cannot be safely discharged from the hospital without specialised interventions)
Refractorysymptoms
of HFat rest
46M 15M 5M 25-40,000
Source: 2004 Update, American Heart Association.
It is estimated that 5 million people in the United States have symptomatic heart failure based on the American Heart Association definition. (See Exhibit 14.) Patients with active disease, however, will present in a variety of fashions and are further classified according to various staging scales, the most widely used being the New York Heart Association (NYHA) class, which ranges from 1 (asymptomatic) to 4 (symptomatic at rest). Given the large numbers of patients involved, it is important to try and segregate the patient population further, as the treatment patterns, medical therapy, and device referral patterns all result from the initial classification of patients by the severity of their disease. Since broad stroke implantation of ICDs in this 5 million population cohort is irresponsible from the point of view of both cost effectiveness and appropriateness of treatment, landmark trials such as MADIT II and SCD-HeFT have served to limit use by identifying the patients appropriate for implantable cardioverter defibrillator therapy.

Cardiology 30 October 2006
15
The Faint of Heart—1.3 Million People with Low Ejection Fraction The 5 million Stage C heart failure patients are spread out across a clinical continuum for disease progression. One of the more prognostic techniques available to assess and stratify these patients involves the use of ejection fraction (EF) to assess the functional capacity of the heart. This clinical parameter can be assessed in a variety of ways, with the most common being via ultrasound and the more accurate being through a stress nuclear scan. The ejection fraction parameter, owing to its quantitative nature and the readily available equipment to perform the procedure, is one of the qualifying/ inclusionary criteria for patients eligible for ICD therapy. The distribution of EF scores across Stage C patients is not uniform and generally the less healthy patients on a NYHA class tend to have worse EF results. (See Exhibit 15.) We estimate the percentage breakdown in these patients according to overall assumptions of the disease burden in the published literature, and our analysis is consistent with the overall estimates of ejection fraction measurement in the CHF population discussed by the major CRM companies.
Exhibit 15: Patient Stratification by Ejection Fraction and NYHA Class
patients in 000s
C la ss I C las s 2 C la ss 3 Class4
1,5 46 1 ,8 0 3 1 ,54 6 25 8 T ota l = 5 ,15 3
0
2 0
4 0
6 0
8 0
1 00 %
E F< 35 %E F> 35 %
Source: Company data, Credit Suisse estimates.

Cardiology 30 October 2006
16
Fewer Heart Failure Patients Are Accessible At the core of our below-consensus ICD market projection is our unique look at the epidemiology of symptomatic heart failure and its treatment. Based on our review of quantitative public data, we calculate that the primary prevention ICD market is 15% smaller than is currently accepted by the industry or consensus. We arrive at our conclusion because we use alternative proxies for the exclusions from the 1.3 million symptomatic patients with weak hearts (ejection fractions below 35%). Instead of the broadly embraced 35% exclusion for patients that are too sick for or cannot afford an ICD (Exhibit 16), we examine patient gender and race and treating physician to find that 45% of patients should be excluded from the available patient pool for ICDs. (See Exhibit 17.) Therefore, we estimate that the primary prevention patient pool is approximately 720,000 patients, not the more than 850,000 estimated by the companies in the industry and The Wall Street Journal.
Exhibit 16: Consensus View of Available ICD Primary
Prevention Population
patients in 000s
Exhibit 17: Credit Suisse View of Available ICD Primary
Prevention Population
patients in 000s
854
1,313
0
500
1,000
1,500
Primary PreventionPopulation
Co-morbidity Economics Total
Pri
mar
y P
reve
nti
on
Pat
ien
t P
op
ula
tio
n (
000'
s)
-35%
723
1,313
0
500
1,000
1,500
Primary PreventionPopulation
Women Treating Physician Race Total
Pri
mar
y P
reve
nti
on
Pat
ien
t P
op
ula
tio
n (
000'
s)
-45%
Source: Company data, Credit Suisse estimates. Source: Company data, Credit Suisse estimates.
Market Estimation Approach Different, but Trying to Measure the Same Variables To evaluate the prospects for ICD sales, we are looking to quantify the group of patients for which device therapy is indicated, as well as likely to be used. As we discuss above, we accept the broader view that there are 1.3 million individuals eligible for ICDs placed for the primary prevention of SCD. We differ from consensus, however, as to how we view the exclusions for the likelihood of implantation of ICDs.
Many ICD market observers consider comorbidities, (socio)economics, age, and patient acceptance to calculate the group of patients unlikely to receive devices. However, we found a paucity of quantitative data to support the conventional wisdom that these variables excluded 35% of the total pool of eligible patients. Therefore, as an alternative, we analyzed the eligible patients along the more tangible lines of gender, race, treating physician, and geography. For these key variables, we found a substantial body of

Cardiology 30 October 2006
17
literature, directly related to ICDs and heart failure, as well as other invasive and medical cardiology treatments. This literature confirmed that certain groups of patients—women, African-Americans, and patients not treated by cardiologists—were less likely to receive devices. Further, we believe that the exclusions generated by gender, race, and treating physician are the forces underlying the traditional variables used to estimate the market size. (See Exhibit 18.)
Exhibit 18: Approach to Estimation of ICD/Heart Failure Market Exclusions—Credit Suisse
versus Traditional Variables
GeographyTreating Physician
Economics
AgeRace
Co-Morbidity
Patient Acceptance
Gender
Traditional VariablesCS Variables
GeographyTreating Physician
Economics
AgeRace
Co-Morbidity
Patient Acceptance
Gender
Traditional VariablesCS Variables
Source: Credit Suisse analysis.
Specifically, we believe that the exclusion for ICD therapy based on gender is related to comorbidity, age, and patient and/or physician acceptance. Women with heart failure typically are older than men with the disease, and consequently have a higher burden of other ailments. Race, in our judgment, is also tied to comorbidity burden, as well as physical proximity and financial access to medical care. In addition, both race and gender are influenced by unfortunate, but long-standing social biases in the U.S. medical system. Finally, the physician who treats a patient for heart failure, whether he or she is a cardiologist or not, is linked to physical proximity and financial access to care, as well as comorbidity burden. Therefore, while we are using our own variables as proxies for the traditional exclusions for ICD implantation, we believe we are capturing the reasons that patients do not receive care when indicated and eligible.
Cardiology 30 October 2006
18
Women Likely to Get Less Cardiac Care Than Men Women make up a slight majority (55%) of the patient population with symptomatic heart failure, and we estimate that, as a group, they have a 60% lower chance of receiving an ICD than comparable men. Women tend to present with heart failure later in the disease cycle (i.e., sicker) and thus their heart failure will not be the most urgent patient management need. Women, in healthcare systems around the world, also experience negative biases that affect their diagnoses and treatment patterns, and we have not seen any data that lead us to believe that this is different in the population of heart failure patients. After controlling for age, mortality and all other factors, we calculate that the exclusion for women being less likely to receive devices reduces the 1.3 million patient population eligible for ICDs by 300,000 patients.
In the healthcare system in general and in cardiology specifically, women are not managed the same way as men are. Only 20% of women consider heart disease to be their greatest health risk, yet the disease accounts for 35% of all deaths. In fact, 62% of women who die suddenly of a heart attack had no prior symptoms. It has been well documented that there are biases inherent in the healthcare system against women and how they are treated across the disease spectrum.
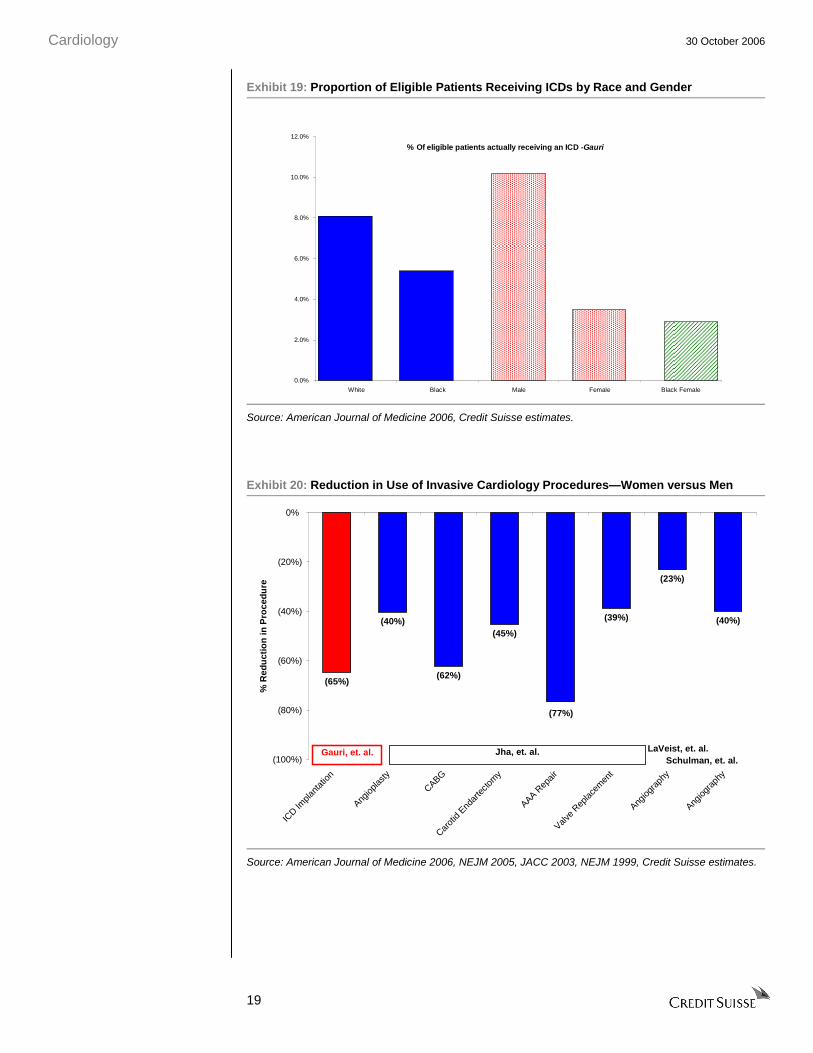
A number of large observational studies have evaluated differences in treatment patterns for common cardiac disease and procedures based on patient gender. These studies strongly suggest that, matched for other variables, women receive half to one-third of the care that men do. For ICDs, in particular, a review of CMS data (Gauri, et al., American Journal of Medicine, 2006) demonstrated that women received ICDs for the same diagnoses (ICD-9 codes) at a rate 65% less than that of men. (See Exhibit 19.) Studies of the use of other common and well-established surgical interventions for cardiac disease, such as angioplasty, coronary artery bypass graft (CABG), and valve replacement, among others, support a reduction of this magnitude in use of procedures for women as compared to men. (See Exhibit 20.)
Cardiology 30 October 2006
19
Exhibit 19: Proportion of Eligible Patients Receiving ICDs by Race and Gender
% Of eligible patients actually receiving an ICD -Gauri
0.0%
2.0%
4.0%
6.0%
8.0%
10.0%
12.0%
White Black Male Female Black Female
Source: American Journal of Medicine 2006, Credit Suisse estimates.
Exhibit 20: Reduction in Use of Invasive Cardiology Procedures—Women versus Men
(65%)
(40%)
(62%)
(45%)
(39%)
(23%)
(40%)
(77%)
(100%)
(80%)
(60%)
(40%)
(20%)
0%
ICD Im
plant
ation
Angiop
lasty
CABG
Carot
id End
arte
ctom
y
AAA Rep
air
Valve
Replac
emen
t
Angiog
raph
y
Angiog
raph
y
% R
edu
ctio
n in
Pro
ced
ure
Jha, et. al.Gauri, et. al. LaVeist, et. al.Schulman, et. al.
Source: American Journal of Medicine 2006, NEJM 2005, JACC 2003, NEJM 1999, Credit Suisse estimates.

Cardiology 30 October 2006
20
In the large pools of data looking at how men and women present differently with the disease, certain factors may explain why men are treated more aggressively, as well as more often by a cardiologist. Men tend to present more frequently with ischemic conditions, which can be diagnosed on exercise or seen through related symptoms. Women, on the other hand, are more likely to present with hearts that are dilated from chronic and undertreated hypertension, which is perceived as less pressing and possibly less appropriate for preventative ICD therapy. Also, women typically present to physicians for evaluation when they are either older, later in the heart failure disease process, or both, and therefore, women tend to have greater comorbidity burdens than their male counterparts.
Finally, we acknowledge the unfortunate fact that there may be gender bias on the part of treating physicians. In one recent study (Schulman, et al., New England Journal of Medicine, 1999), male and female actors presented to physicians with identical symptoms, case histories, and risk factors, but physicians prescribed different recommendations for treatment. Women generally received less treatment, or at least less aggressive treatment, than men. To be sure, women’s hearts are different than men’s in that they are smaller, and have a more complicated vasculature, and the presentation and symptoms of cardiac disorders present differently. While the underlying social reasons that women do not receive treatment on a par with men are beyond the scope of our analysis, we believe this phenomenon has carried over to the ICD market and to the degree of acceptance of device therapy for women.
Almost Half of Heart Failure Patients Are Not Cared for by Cardiologists Not all heart failure patients receive medical attention from a cardiologist, and we believe that this affects the type of care that they ultimately receive. Heart failure is a chronic disease, and without an SCD event, the disease is characterized by a slow progression of declining cardiac function. Many heart failure patients may not perceive a need to see a cardiologist because their symptoms are being managed, rather than treating the direct failure of their heart muscle. We would contrast this to coronary artery disease, where patients present with acute symptoms that require immediate medical attention, typically from specialized interventional cardiologists.
As a result, of the 5 million individuals with symptomatic heart failure, only 20% receive the majority of their care from a cardiologist, with another 40-50% receiving a consultation from a cardiologist about their condition. Among the 1.3 million symptomatic heart failure patients with low ejection fractions, however, we estimate approximately 70% receive care from or a consultation by a cardiologist. We consider this to be one of the most significant barriers to adoption of ICDs, as the adherence to heart failure treatment guidelines, including those endorsing preventative ICD therapy based on SCD-HeFT results, are lower in the noncardiology community. Available data suggest that noncardiologists do not prescribe optimal pharmaceutical therapy and recommend fewer invasive cardiac surgical procedures. We estimate that noncardiologists are 50% less likely to recommend ICD therapy. We further calculate that the exclusion for noncardiologists being less likely to recommend device therapy reduces the 1.3 million patient population eligible for ICDs by 160,000 patients.

Cardiology 30 October 2006
21
We summarize what we estimate as the structure of the ICD eligible patient population in Exhibit 21.
Exhibit 21: Structure of the Heart Failure Market by Treating Physician
Primary CarePhysicians: 160,000Patients: 390k w/out ICD
CardiologistsPhysicians: 16,000Patients: 470k w/out ICD
Electrophysiologists(EPs)Physicians: 1,000Patients: 440k w/ICDs
Likelihood of ICD
Implantation Increases
Primary CarePhysicians: 160,000Patients: 390k w/out ICD
CardiologistsPhysicians: 16,000Patients: 470k w/out ICD
Electrophysiologists(EPs)Physicians: 1,000Patients: 440k w/ICDs
Likelihood of ICD
Implantation Increases
Source: Company data, Credit Suisse estimates.
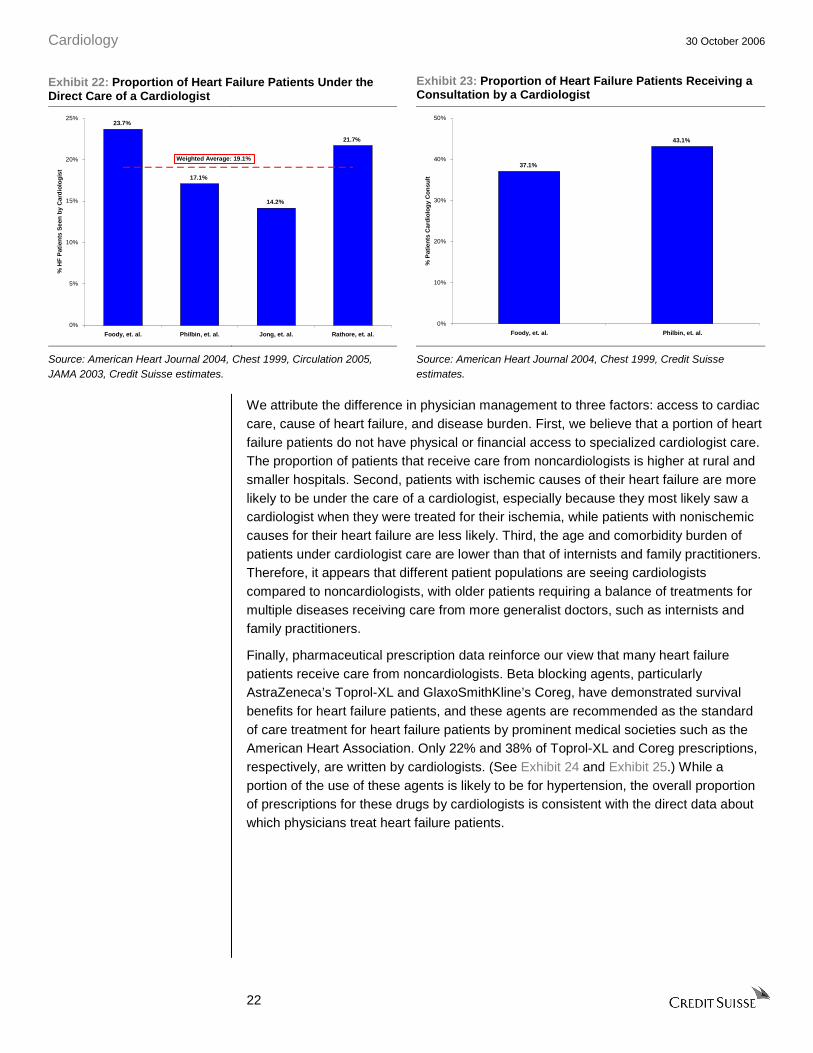
Forty Percent of Heart Failure Patients Do Not Receive Cardiologist Care Of the 5 million patients in the symptomatic heart failure prevalence pool, we estimate that only 50-60% receive any care from a cardiologist. Large-scale observational studies of patients hospitalized for heart failure, which we believe are representative of the ICD eligible population, show that 14-29% of patients, or an average of 19%, have a cardiologist as the provider of the majority of their medical treatment in the hospital. (See Exhibit 22.) Internists, primary care physicians, family practitioners, or, to a lesser extent, physicians of noncardiac specialties manage the balance of the patients. These same studies indicate that an additional 30-40% of symptomatic hospitalized heart failure patients receive a consultation from a cardiologist. (See Exhibit 23.) This leaves 40-50% of patients receiving no care from a cardiologist for their heart failure.
Cardiology 30 October 2006
22
Exhibit 22: Proportion of Heart Failure Patients Under the Direct Care of a Cardiologist
Exhibit 23: Proportion of Heart Failure Patients Receiving a Consultation by a Cardiologist
23.7%
17.1%
14.2%
21.7%
0%
5%
10%
15%
20%
25%
Foody, et. al. Philbin, et. al. Jong, et. al. Rathore, et. al.
% H
F P
atie
nts
See
n b
y C
ard
iolo
gis
t
Weighted Average: 19.1%
37.1%
43.1%
0%
10%
20%
30%
40%
50%
Foody, et. al. Philbin, et. al.
% P
atie
nts
Car
dio
log
y C
on
sult
Source: American Heart Journal 2004, Chest 1999, Circulation 2005, JAMA 2003, Credit Suisse estimates.
Source: American Heart Journal 2004, Chest 1999, Credit Suisse estimates.
We attribute the difference in physician management to three factors: access to cardiac care, cause of heart failure, and disease burden. First, we believe that a portion of heart failure patients do not have physical or financial access to specialized cardiologist care. The proportion of patients that receive care from noncardiologists is higher at rural and smaller hospitals. Second, patients with ischemic causes of their heart failure are more likely to be under the care of a cardiologist, especially because they most likely saw a cardiologist when they were treated for their ischemia, while patients with nonischemic causes for their heart failure are less likely. Third, the age and comorbidity burden of patients under cardiologist care are lower than that of internists and family practitioners. Therefore, it appears that different patient populations are seeing cardiologists compared to noncardiologists, with older patients requiring a balance of treatments for multiple diseases receiving care from more generalist doctors, such as internists and family practitioners.
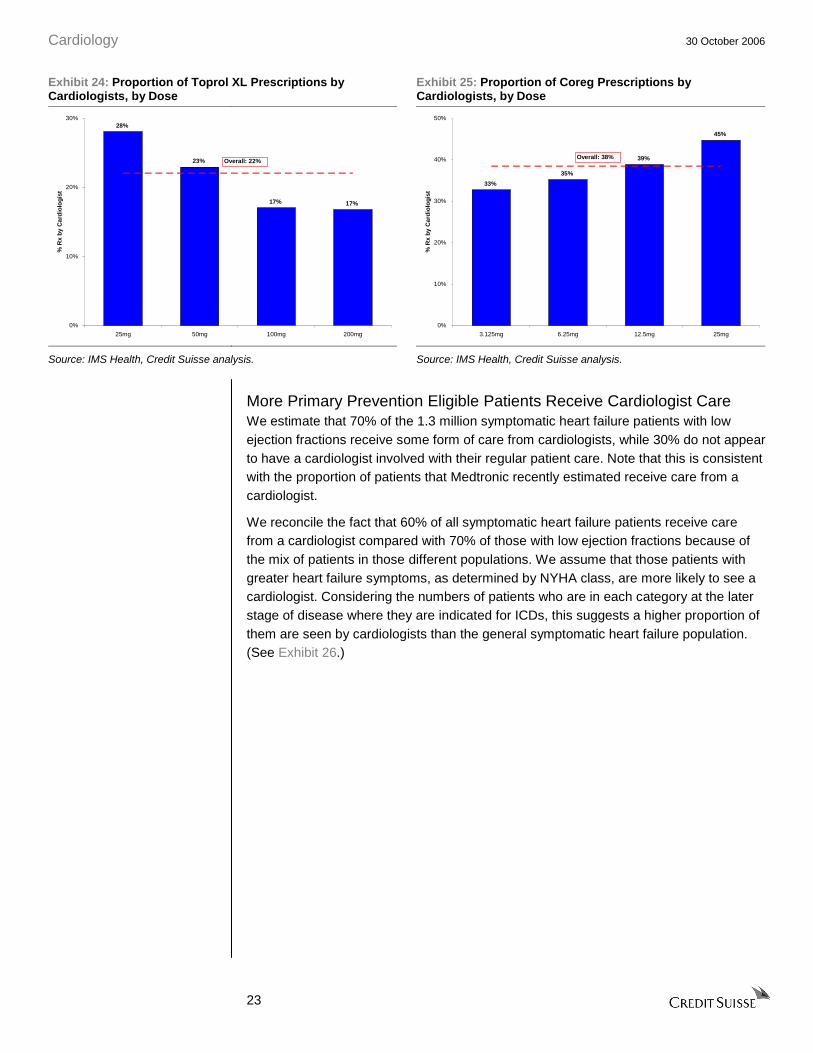
Finally, pharmaceutical prescription data reinforce our view that many heart failure patients receive care from noncardiologists. Beta blocking agents, particularly AstraZeneca’s Toprol-XL and GlaxoSmithKline’s Coreg, have demonstrated survival benefits for heart failure patients, and these agents are recommended as the standard of care treatment for heart failure patients by prominent medical societies such as the American Heart Association. Only 22% and 38% of Toprol-XL and Coreg prescriptions, respectively, are written by cardiologists. (See Exhibit 24 and Exhibit 25.) While a portion of the use of these agents is likely to be for hypertension, the overall proportion of prescriptions for these drugs by cardiologists is consistent with the direct data about which physicians treat heart failure patients.
Cardiology 30 October 2006
23
Exhibit 24: Proportion of Toprol XL Prescriptions by Cardiologists, by Dose
Exhibit 25: Proportion of Coreg Prescriptions by Cardiologists, by Dose
28%
23%
17% 17%
0%
10%
20%
30%
25mg 50mg 100mg 200mg
% R
x b
y C
ard
iolo
gis
t
Overall: 22%
33%
35%
39%
45%
0%
10%
20%
30%
40%
50%
3.125mg 6.25mg 12.5mg 25mg
% R
x b
y C
ard
iolo
gis
t
Overall: 38%
Source: IMS Health, Credit Suisse analysis. Source: IMS Health, Credit Suisse analysis.
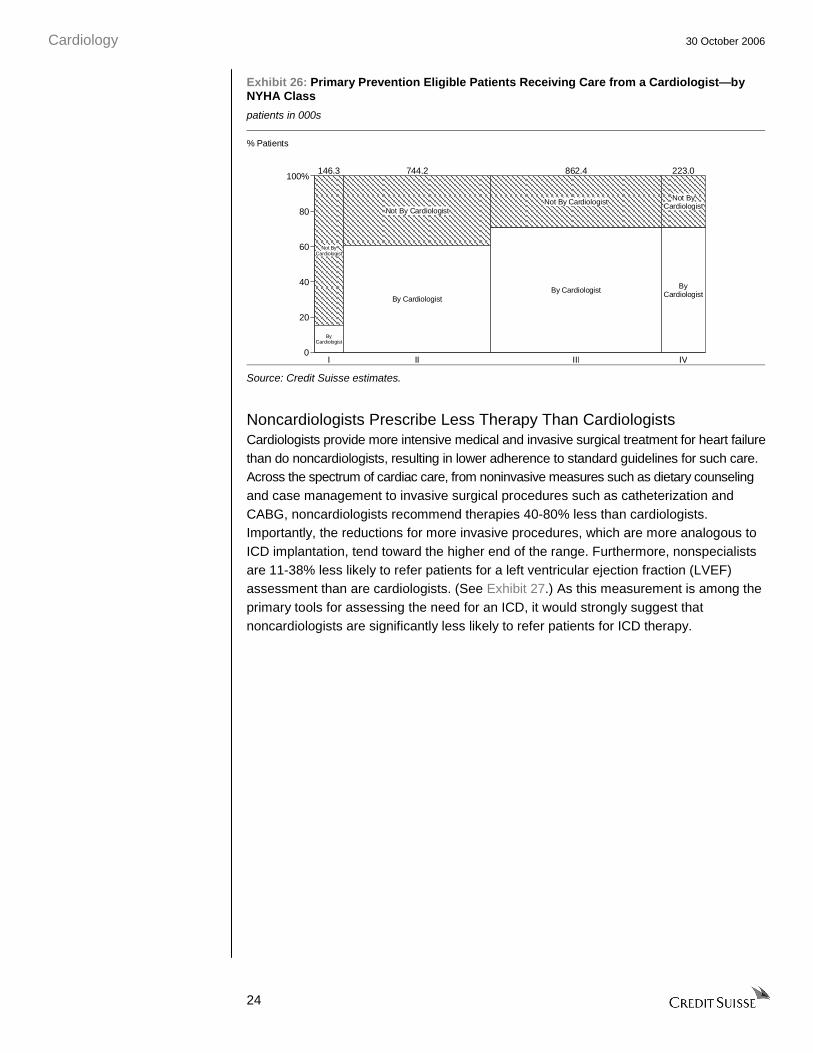
More Primary Prevention Eligible Patients Receive Cardiologist Care We estimate that 70% of the 1.3 million symptomatic heart failure patients with low ejection fractions receive some form of care from cardiologists, while 30% do not appear to have a cardiologist involved with their regular patient care. Note that this is consistent with the proportion of patients that Medtronic recently estimated receive care from a cardiologist.
We reconcile the fact that 60% of all symptomatic heart failure patients receive care from a cardiologist compared with 70% of those with low ejection fractions because of the mix of patients in those different populations. We assume that those patients with greater heart failure symptoms, as determined by NYHA class, are more likely to see a cardiologist. Considering the numbers of patients who are in each category at the later stage of disease where they are indicated for ICDs, this suggests a higher proportion of them are seen by cardiologists than the general symptomatic heart failure population. (See Exhibit 26.)
Cardiology 30 October 2006
24
Exhibit 26: Primary Prevention Eligible Patients Receiving Care from a Cardiologist—by NYHA Class
patients in 000s
Not ByCardiologist
ByCardiologist
Not By Cardiologist
By Cardiologist
Not By Cardiologist
By Cardiologist
Not ByCardiologist
ByCardiologist
I II III IV
146.3 744.2 862.4 223.0
0
20
40
60
80
100%
% Patients
Source: Credit Suisse estimates.
Noncardiologists Prescribe Less Therapy Than Cardiologists Cardiologists provide more intensive medical and invasive surgical treatment for heart failure than do noncardiologists, resulting in lower adherence to standard guidelines for such care. Across the spectrum of cardiac care, from noninvasive measures such as dietary counseling and case management to invasive surgical procedures such as catheterization and CABG, noncardiologists recommend therapies 40-80% less than cardiologists. Importantly, the reductions for more invasive procedures, which are more analogous to ICD implantation, tend toward the higher end of the range. Furthermore, nonspecialists are 11-38% less likely to refer patients for a left ventricular ejection fraction (LVEF) assessment than are cardiologists. (See Exhibit 27.) As this measurement is among the primary tools for assessing the need for an ICD, it would strongly suggest that noncardiologists are significantly less likely to refer patients for ICD therapy.

Cardiology 30 October 2006
25
Exhibit 27: Reduction in Left Ventricle Ejection Fraction (EF) Assessment—by Physician Type
Exhibit 28: Reduction in Cardiology Care Recommendations—by Physician Type
(11%)
(28%)
(37%)
(17%)
(40%)
(30%)
(20%)
(10%)
0%
Foody, et. al. Philbin, et. al. Edep, et. al.
% R
edu
ctio
n in
LV
EF
Ass
essm
ent
Internist GP/FP/Other Comb. Other
(100%)
(80%)
(60%)
(40%)
(20%)
0%
Stress
test
Cathe
teriz
ation
CHF doc
umen
ted
Echo/
vent
riculo
gram
Dietar
y con
sult
Case
man
agem
ent
Cathe
teriz
ation PCI
CABG
% R
edu
ctio
n in
Pro
ced
ure
/Use
Internist GP/FP/Other Comb. Other
Foody, et. al. Philbin, et. al. Jong, et. al.
Source: 27 American Medical Journal, 2005; Chest, 1999; JACC, 1997. Source: 28 American Medical Journal, 2005; Chest, 1999; Circulation, 2005.
Like interventional procedure care, primary care physicians and internists do not prescribe heart failure patients the standard of care medications endorsed by treatment guidelines as consistently as do cardiologists. After accounting for all other variables, noncardiologists are 10-25% less likely to prescribe Angioensin Converting Enzyme (ACE) inhibitors to symptomatic heart failure patients (see Exhibit 29), and this class of drugs has long been established as the gold standard of pharmacologic treatment for heart failure. Further, noncardiologists prescribe beta blockers 23-50% less than cardiologists. (See Exhibit 30.) As a more recently established therapy for heart failure, we believe that beta blocker prescription rates are more indicative of the difference in ICD use between cardiologists and noncardiologists, but we would argue that, given the invasive nature of ICD therapy, adoption of ICD use would be even lower among noncardiologists than drug therapy.
Exhibit 29: Reduction in Angiotensin Converting Enzyme (ACE) Inhibitor Prescription, by Physician Type
Exhibit 30: Reduction in Beta-Blocker Prescription, by Physician Type
(4%)
0%
(11%)
0%
(10%)
(25%)
(2%)
(16%)
(6%)
(30%)
(25%)
(20%)
(15%)
(10%)
(5%)
0%
5%
Foody, et. al. Philbin, et. al. Jong, et. al. Edep, et. al.
% R
edu
ctio
n in
AC
E R
x at
Dis
char
ge
Internist GP/FP/Other Comb. Other
(23%)
(27%)
(32%)
(50%)
(26%)
(38%)
(41%)
(60%)
(50%)
(40%)
(30%)
(20%)
(10%)
0%
Foody, et. al. Philbin, et. al. Jong, et. al.
% R
edu
ctio
n in
B-B
lock
er R
x at
Dis
char
ge
Internist GP/FP/Other Comb. Other
Source: 29 American Medical Journal, 2005; Chest, 1999; JACC, 1997; Circulation, 2005.
Source: 30 American Medical Journal, 2005; Chest, 1999; Circulation, 2005.

Cardiology 30 October 2006
26
We ascribe the difference in care to two factors: lower awareness of recommended therapies and different treatment goals for different patient populations. Our research, admittedly anecdotal, indicates that primary care physicians have less awareness of the results of the landmark SCD-HeFT trial and the preventative benefits of ICD therapy. Cardiologists who are not in the catchment area for an electrophysiologist appear to be aware of the guidelines, but an ICD is not likely to be in their consideration set until a patient develops electrical disturbances, rather than looking specifically at SCD risk factors, particularly low ejection fraction.
Additionally, we noticed differences between the patient populations seen by cardiologists and internists and family practitioners. With older and sicker patients, noncardiologists are probably more focused on nonheart failure symptoms and outcomes. This would lead to ICDs being considered only after the patients were considered stable with regard to their diabetes, renal disease, and hypertension.
African-American Patients Also Get Less Cardiac Care The burden of heart disease is disproportionately high among the African-American community in the United States. Heart disease is still the leading cause of death for African-Americans, and the death rate for African Americans from heart disease is 31% higher than for Caucasians. Recently published observational studies demonstrate that African-American patients are 30-40% less likely to receive ICD therapy than Caucasian patients with the same clinical presentation. (See Exhibit 31.) Public sources further show that African-Americans make up 12% of the U.S. population, and are overrepresented in the heart failure population, accounting for 15% of all patients. We determine that the exclusion for African-Americans being less likely to receive device therapy reduces the 1.3 million patient population eligible for ICDs by 50,000 patients.
We identified three independent, peer reviewed studies using observational data seeking to quantify the differences in ICD implantation rates between African-Americans and Whites. After controlling for age, geographical variables, and socioeconomic factors, these studies demonstrated that there was a 30-80% decrease in the likelihood of an African-American patient receiving an ICD relative to a comparable White patient.

Cardiology 30 October 2006
27
Exhibit 31: Reduction in ICD Use—White versus African-American Patients
(32%)
(81%)
(31%)
(42%)
(100%)
(80%)
(60%)
(40%)
(20%)
0%
Gauri, et. al. Voigt, et. al. Groeneveld, et. al. Groeneveld, et. al.
% R
edu
ctio
n in
ICD
Imp
lan
tati
on
Median: (37%)
Source: 31 Am Journal of Medicine, 2006; JACC, 2004; Circ, 2003; JACC, 2005.
Other studies show that racial differences in care are not isolated to ICD therapy, but extend across the spectrum of cardiac care. In fact, African-Americans are 30-70% less likely to receive many well-established cardiovascular interventions, including angioplasty, CABG, and valve replacement surgery. (See Exhibit 32.)

Cardiology 30 October 2006
28
Exhibit 32: Reduction in Cardiology Care Recommendations—White versus African-
American Patients
(30%)
(58%)
(67%) (68%)
(62%)
(13%)
(32%)(35%)
(62%)
(40%)
(80%)
(60%)
(40%)
(20%)
0%
Angiop
lasty
CABG
Carot
id End
arte
ctom
y
AAA Rep
air
Valve
Replac
emen
t
Angiop
lasty
CABGEith
er
Angiog
raph
y
Angiog
raph
y
% R
edu
ctio
n in
Pro
ced
ure
Jha, et. al. Peterson, et. al. LaVeist, et. al.Schulman, et. al.
Source: 32 NEJM, 2005; NEJM, 1997; JACC, 2003; NEJM, 1999.
The difference in cardiac care between African-Americans and Whites can be partially attributed to higher comorbidity burdens among the African-American population. Studies have also shown that the comorbidity burden for whites when diagnosed with heart disease is statistically significantly lower with whites than blacks. The prevalence of having any two risk factors for heart disease and stroke (high blood pressure, high cholesterol, diabetes, being a smoker, physically inactive, and obesity) was highest among African Americans (49%). It is difficult to separate out the causative versus the correlative issues in this field, as there are degrees of severity along the disease cascade for respiratory, renal, and metabolic issues, which tie in to the overall disease burden and thus may render the patients “too sick” for an ICD.
African-American patients also tend to be situated in lower-income areas with less generous insurance coverage, and they are less likely to have ischemic heart disease. As a result, African-American heart failure patients are up against intrinsic barriers in the system to get them into the cascade of appropriate evaluation to receive a device. That said, there is a decrease in the utilization of the technology in this population unexplained by the comorbidity burden, and we sadly suspect that this stems from systemic or societal issues.
Cardiology 30 October 2006
29
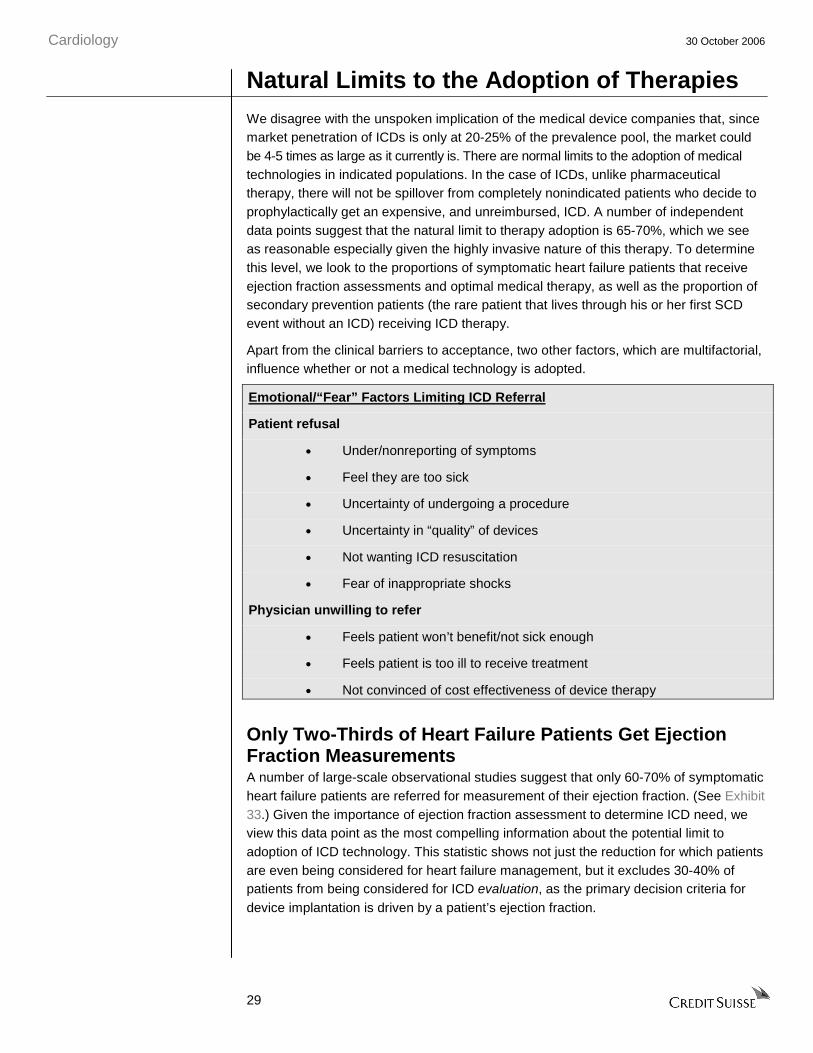
Natural Limits to the Adoption of Therapies We disagree with the unspoken implication of the medical device companies that, since market penetration of ICDs is only at 20-25% of the prevalence pool, the market could be 4-5 times as large as it currently is. There are normal limits to the adoption of medical technologies in indicated populations. In the case of ICDs, unlike pharmaceutical therapy, there will not be spillover from completely nonindicated patients who decide to prophylactically get an expensive, and unreimbursed, ICD. A number of independent data points suggest that the natural limit to therapy adoption is 65-70%, which we see as reasonable especially given the highly invasive nature of this therapy. To determine this level, we look to the proportions of symptomatic heart failure patients that receive ejection fraction assessments and optimal medical therapy, as well as the proportion of secondary prevention patients (the rare patient that lives through his or her first SCD event without an ICD) receiving ICD therapy.
Apart from the clinical barriers to acceptance, two other factors, which are multifactorial, influence whether or not a medical technology is adopted.
Emotional/“Fear” Factors Limiting ICD Referral
Patient refusal
• Under/nonreporting of symptoms
• Feel they are too sick
• Uncertainty of undergoing a procedure
• Uncertainty in “quality” of devices
• Not wanting ICD resuscitation
• Fear of inappropriate shocks
Physician unwilling to refer
• Feels patient won’t benefit/not sick enough
• Feels patient is too ill to receive treatment
• Not convinced of cost effectiveness of device therapy
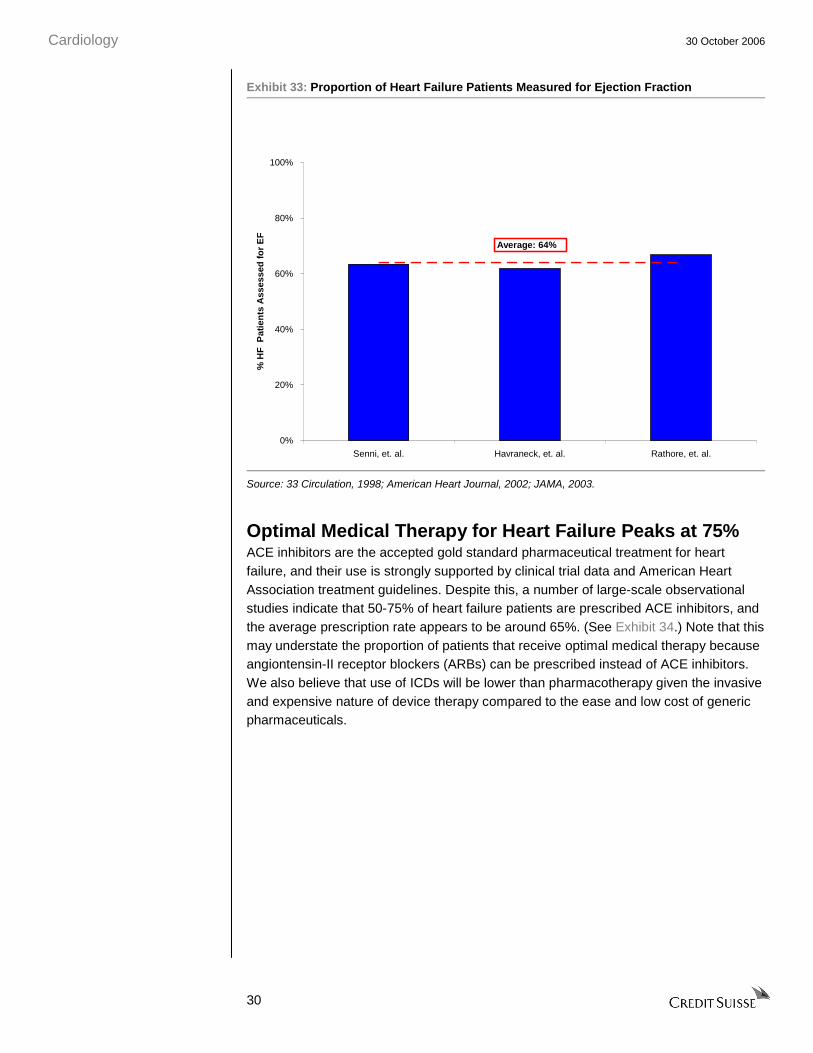
Only Two-Thirds of Heart Failure Patients Get Ejection Fraction Measurements A number of large-scale observational studies suggest that only 60-70% of symptomatic heart failure patients are referred for measurement of their ejection fraction. (See Exhibit 33.) Given the importance of ejection fraction assessment to determine ICD need, we view this data point as the most compelling information about the potential limit to adoption of ICD technology. This statistic shows not just the reduction for which patients are even being considered for heart failure management, but it excludes 30-40% of patients from being considered for ICD evaluation, as the primary decision criteria for device implantation is driven by a patient’s ejection fraction.
Cardiology 30 October 2006
30
Exhibit 33: Proportion of Heart Failure Patients Measured for Ejection Fraction
0%
20%
40%
60%
80%
100%
Senni, et. al. Havraneck, et. al. Rathore, et. al.
% H
F P
atie
nts
Ass
esse
d f
or
EF
Average: 64%
Source: 33 Circulation, 1998; American Heart Journal, 2002; JAMA, 2003.
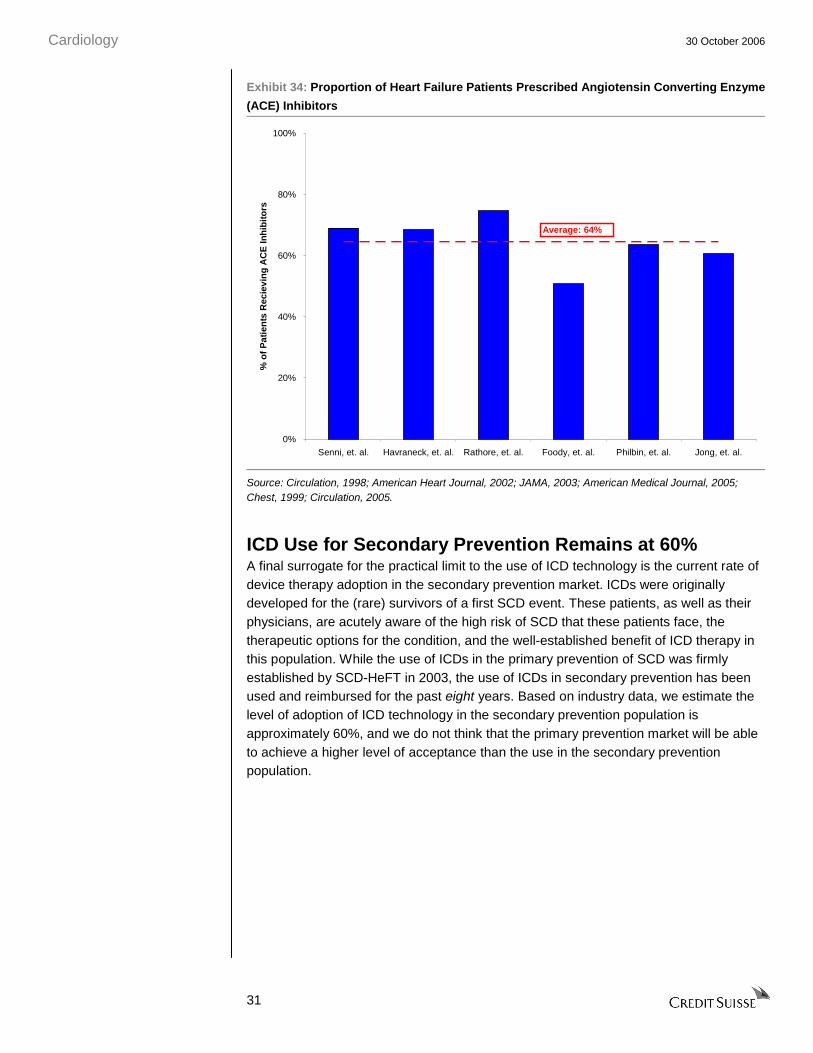
Optimal Medical Therapy for Heart Failure Peaks at 75% ACE inhibitors are the accepted gold standard pharmaceutical treatment for heart failure, and their use is strongly supported by clinical trial data and American Heart Association treatment guidelines. Despite this, a number of large-scale observational studies indicate that 50-75% of heart failure patients are prescribed ACE inhibitors, and the average prescription rate appears to be around 65%. (See Exhibit 34.) Note that this may understate the proportion of patients that receive optimal medical therapy because angiontensin-II receptor blockers (ARBs) can be prescribed instead of ACE inhibitors. We also believe that use of ICDs will be lower than pharmacotherapy given the invasive and expensive nature of device therapy compared to the ease and low cost of generic pharmaceuticals.
Cardiology 30 October 2006
31
Exhibit 34: Proportion of Heart Failure Patients Prescribed Angiotensin Converting Enzyme
(ACE) Inhibitors
0%
20%
40%
60%
80%
100%
Senni, et. al. Havraneck, et. al. Rathore, et. al. Foody, et. al. Philbin, et. al. Jong, et. al.
% o
f P
atie
nts
Rec
ievi
ng
AC
E In
hib
ito
rs
Average: 64%
Source: Circulation, 1998; American Heart Journal, 2002; JAMA, 2003; American Medical Journal, 2005; Chest, 1999; Circulation, 2005.
ICD Use for Secondary Prevention Remains at 60% A final surrogate for the practical limit to the use of ICD technology is the current rate of device therapy adoption in the secondary prevention market. ICDs were originally developed for the (rare) survivors of a first SCD event. These patients, as well as their physicians, are acutely aware of the high risk of SCD that these patients face, the therapeutic options for the condition, and the well-established benefit of ICD therapy in this population. While the use of ICDs in the primary prevention of SCD was firmly established by SCD-HeFT in 2003, the use of ICDs in secondary prevention has been used and reimbursed for the past eight years. Based on industry data, we estimate the level of adoption of ICD technology in the secondary prevention population is approximately 60%, and we do not think that the primary prevention market will be able to achieve a higher level of acceptance than the use in the secondary prevention population.
Cardiology 30 October 2006
32
ICD Growth Will Be Harder to Drive Given our view on the structure of the market for primary prevention ICD use, we believe that it will be challenging for the existing companies to re-invigorate the growth of the market. It would appear that a significant proportion of the “low-hanging fruit” in the primary prevention population—clinically appropriate males already under the care of cardiologists—has been harvested. In fact, we estimate that the penetration rate among these individuals could be as high as 70%. To drive a sufficient number of incremental referrals to reaccelerate the ICD market, the CRM companies will need to change long-standing gender and race biases in the way medicine is practiced. The CRM companies will also need to reach far beyond their traditional specialty physician bases to a large, diverse physician audience. Finally, the companies will need to promote expensive preventative therapy, rather than the relative benefits of one device over another.
We currently see Medtronic and other companies beginning the process of reaching out to the ICD referral network. However, we believe that it will take some time for the CRM companies to recruit the marketing and sales talent that they need to establish effective programs and implement these in the marketplace. Even more important, it will take the promotional efforts a significant amount of time to affect referral patterns, especially given the deeply rooted practice patterns that the companies seek to modify.
Changing Medical Biases Will Take a Long Time Based on our review of heart failure epidemiology, we believe that a significant contributor to the slowdown in the growth of the U.S. ICD market is a lower rate of device use among women and African-Americans, compared to their male and White counterparts. While a portion of the difference in ICD use can be attributed to medical factors such as age and comorbidity burden, which would suggest that device adoption should be lower in these groups, we sadly infer that social biases may play a meaningful role, as well. If this is the case, the CRM companies will need to implement marketing programs to promote device use in these patient populations. We know that there are campaigns such as “Go Red for Women,” conducted by established medical societies such as the American Heart Association, to improve care for women with cardiac conditions, but that these efforts have made only small changes in the practice of medicine thus far. In addition, physician treatment biases are not overt, and encouraging changes among individuals must be done carefully and with nuance. Therefore, we would expect any company-driven marketing efforts, which are typically met with skepticism by physicians, will take two to three years to have an impact on device referral patterns.
Insurance Is More Difficult to Sell Than Treatment Until now, the CRM companies have largely focused their marketing and sales efforts on either promoting the benefits of specific devices to highly focused specialist physicians, such as electrophysiologists, or to selling acute treatments in other portions of their businesses, such as stents for coronary artery disease. (See Exhibit 35.) The task of marketing ICD therapy for primary prevention is a considerably different task. ICD implantation for primary prevention of SCD is a prophylactic intervention, unlike

Cardiology 30 October 2006
33
almost any other product that the CRM companies have experience marketing. In contrast to telling doctors and patients to have a procedure that will immediately alleviate symptoms or improve critical laboratory measures, ICD implantation is strictly an expensive preventative measure. In addition, ICDs have the potential for a particularly unpleasant inappropriate (shock) therapy, and its implementation is invasive. As a result, nonspecialists and patients will have a tough time trying to understand how receiving an invasive procedure, getting an implant that “may need to be recalled,” and dealing with the issues of not getting near magnetic fields, caution with electrical sources, metal detectors, etc., is an improvement on unseen and unfelt risk factors. Thus, we believe that the marketing of ICDs for primary prevention will be a challenge, even for large companies such as Medtronic.
Exhibit 35: Comparison of CRM Company Target Markets Market Disease/ Symptoms Treatment/Prophylaxis
ICDs Enlarged heart, post-MI scarring Prevention of Chance of Sudden Death
Cardiac stents Acute MI Treatment
CABG equipment Acute MI Treatment
Atrial fibrillation Fainting Treatment
Neurostimulation Parkinsons’s tremors Treatment
Severe chronic pain
Pacing Slow heartbeat Treatment
Spine Chronic debilitating pain Treatment
Source: Credit Suisse analysis.
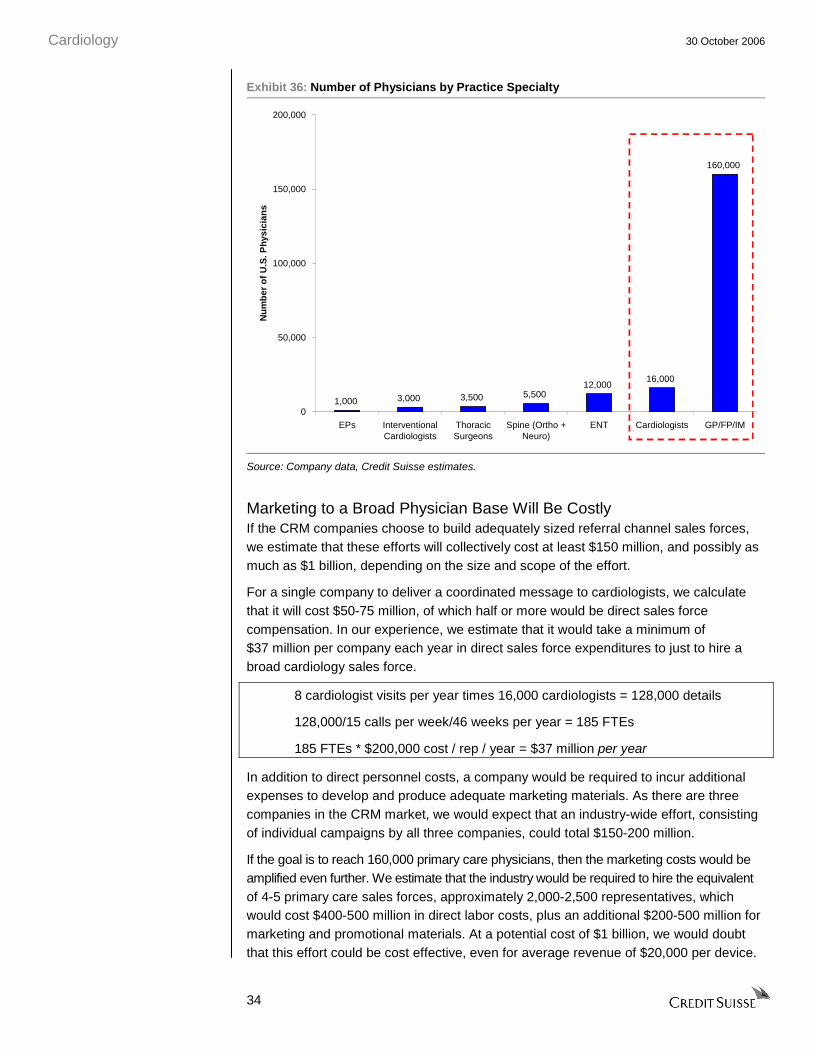
New Patients Mean Marketing to New Physicians Beyond the difficulty of delivering a new type of message to physicians, the CRM companies now need to target a much larger and unfamiliar physician base than they have ever done to re-invigorate the referral process for ICDs. To reach the majority of heart failure patient physicians, it will be essential for the device companies to market to all U.S. cardiologists and to the larger community of primary care physicians, including internists and family practitioners. We do not believe that investors or the companies appreciate the magnitude of this challenge, nor do they appreciate the level of competition for these physicians’ time. Current CRM company sales force efforts are spent on implanting electrophysiologists, or in the case of other products, groups of specialty physicians or surgeons numbering in the single-digit thousands. (See Exhibit 36.) While these energies have been useful (as evidenced by the rate of growth of sales and adoption to date), the expansion of the sales force to access the referring communities of physicians requires efforts 16-160 times that of the companies’ current efforts. Moreover, gaining access to busy cardiologists or primary care physicians, who are already inundated with practice concerns and marketing calls by pharmaceutical company representatives, will be much tougher than marketing to their core specialty physician bases.
Cardiology 30 October 2006
34
Exhibit 36: Number of Physicians by Practice Specialty
1,000 3,000 3,500 5,50012,000
16,000
160,000
0
50,000
100,000
150,000
200,000
EPs InterventionalCardiologists
ThoracicSurgeons
Spine (Ortho +Neuro)
ENT Cardiologists GP/FP/IM
Nu
mb
er o
f U
.S. P
hys
icia
ns
Source: Company data, Credit Suisse estimates.
Marketing to a Broad Physician Base Will Be Costly If the CRM companies choose to build adequately sized referral channel sales forces, we estimate that these efforts will collectively cost at least $150 million, and possibly as much as $1 billion, depending on the size and scope of the effort.
For a single company to deliver a coordinated message to cardiologists, we calculate that it will cost $50-75 million, of which half or more would be direct sales force compensation. In our experience, we estimate that it would take a minimum of $37 million per company each year in direct sales force expenditures to just to hire a broad cardiology sales force.
8 cardiologist visits per year times 16,000 cardiologists = 128,000 details
128,000/15 calls per week/46 weeks per year = 185 FTEs
185 FTEs * $200,000 cost / rep / year = $37 million per year
In addition to direct personnel costs, a company would be required to incur additional expenses to develop and produce adequate marketing materials. As there are three companies in the CRM market, we would expect that an industry-wide effort, consisting of individual campaigns by all three companies, could total $150-200 million.
If the goal is to reach 160,000 primary care physicians, then the marketing costs would be amplified even further. We estimate that the industry would be required to hire the equivalent of 4-5 primary care sales forces, approximately 2,000-2,500 representatives, which would cost $400-500 million in direct labor costs, plus an additional $200-500 million for marketing and promotional materials. At a potential cost of $1 billion, we would doubt that this effort could be cost effective, even for average revenue of $20,000 per device.

Cardiology 30 October 2006
35
We further believe that the time to have made the push would have been three years ago when the shift in clinical practice started to take place. At that time, the message would have been well received whereas now it will be seen as a promotion to sell more devices. We further think that the sales representatives will have difficulty convincing physicians that they have not practiced good medicine up until now in the evaluation, monitoring, and management of patients with heart failure.
Educational Roadblocks for Physicians
Cardiologists
• Awareness of the SCD-HeFT-based heart failure treatment guidelines
• Evaluation of patients who fit the SCD-HeFT guidelines, including the measurement of ejection fraction Uncertainty of undergoing a procedure
• Referral of patients to electrophysiologists for evaluation and implantation
General practitioners (Internists/ Family Medicine)
• Awareness of the SCD-HeFT-based heart failure treatment guidelines
• Evaluation of patients who fit the SCD-HeFT guidelines, including the measurement of ejection fraction Uncertainty of undergoing a procedure
Cardiology 30 October 2006
36
Credit Suisse Global CRM Market Forecast We project the global CRM market to be $8.8 billion in 2006. The global ICD market is estimated to be 231,000 implants, with $5.5 billion in revenues in 2006, growing to 325,000 implants and $7.1 billion in revenues in 2010, which represents 9% compound growth in the number of patients and 7% growth in revenues. The global low-power market is stable with a 1-2% compound annual growth rate, growing from $3.3 billion in 2005-06 to $3.6 billion in 2010. (See Exhibit 37 and Exhibit 38.)
The total U.S. CRM market is projected to grow from $5.9 billion to $6.7 billion dollars from 2005-10, with the ICD (high power) market growing from $4.2 billion to $5.0 billion in the same time period. Total ICD implants are expected to grow from 170,000 patients in 2006 to 230,000 by 2010. (See Exhibit 39 and Exhibit 40.)
Price and mix changes in the units sold are expected to account for the disparity between absolute dollar and unit growth. We forecast competitive pressures will continue to fuel the historical price declines seen on a like-for-like unit basis, partially offset by the companies’ ability to add device features, such as patient monitoring, improved telemetry, and ease of programming, to offset the negative price effect.
We see the share in the ICD market reverting back to the division of units to each competitor prior to Guidant’s recalls. St. Jude appears to have increased its market share in recent quarter based on Guidant’s misfortunes, rather than through its inherent competitive positioning. We see the long-term sustainable competitive hierarchy of the major players as Medtronic, 50%; Boston Scientific, 30%; and St. Jude, 20%; and as a result, we see Boston Scientific regaining 6% share by 2010, with losses split equally between St. Jude and Medtronic.
We review the details of our forecast, and we focus on the ICD market by geography, in the following section. We include our model in exhibits in an appendix at the end of this note.

Cardiology 30 October 2006
37
Exhibit 37: Worldwide Cardiac Rhythm Management Revenue, 2003–10E
US$ in millions
Exhibit 38: Worldwide ICD Revenue, 2003–10E
US$ in millions
$0
$2,000
$4,000
$6,000
$8,000
$10,000
$12,000
FY 2003 FY 2004 FY 2005 FY 2006E FY 2007E FY 2008E FY 2009E FY 2010E
WW
CR
M S
ales
($M
illio
ns)
-10.0%
0.0%
10.0%
20.0%
30.0%
40.0%
50.0%
60.0%
70.0%
Low Power High Power High Power Growth Low Power Growth
$0
$1,000
$2,000
$3,000
$4,000
$5,000
$6,000
$7,000
$8,000
FY 2003 FY 2004 FY 2005 FY 2006E FY 2007E FY 2008E FY 2009E FY 2010E
WW
Hig
h P
ower
Sal
es ($
Mill
ion
s)
MDT GDT STJ
Source: Company data, Credit Suisse estimates. Source: Company data, Credit Suisse estimates.
Exhibit 39: U.S. Cardiac Rhythm Management Revenue, 2003–10E
US$ in millions
Exhibit 40: U.S. ICD Revenue, 2003–10E
US$ in millions
$0
$1,000
$2,000
$3,000
$4,000
$5,000
$6,000
$7,000
$8,000
FY 2003 FY 2004 FY 2005 FY 2006E FY 2007E FY 2008E FY 2009E FY 2010E
US
CR
M S
ales
($M
illio
ns)
-10.0%
-5.0%
0.0%
5.0%
10.0%
15.0%
20.0%
25.0%
30.0%
35.0%
40.0%
Low Power High Power High Power Growth Low Power Growth
$0
$1,000
$2,000
$3,000
$4,000
$5,000
$6,000
FY 2003 FY 2004 FY 2005 FY 2006E FY 2007E FY 2008E FY 2009E FY 2010E
US
HP
Sal
es (
$Mill
ion
s)
MDT GDT STJ
Source: Company data, Credit Suisse estimates. Source: Company data, Credit Suisse estimates.
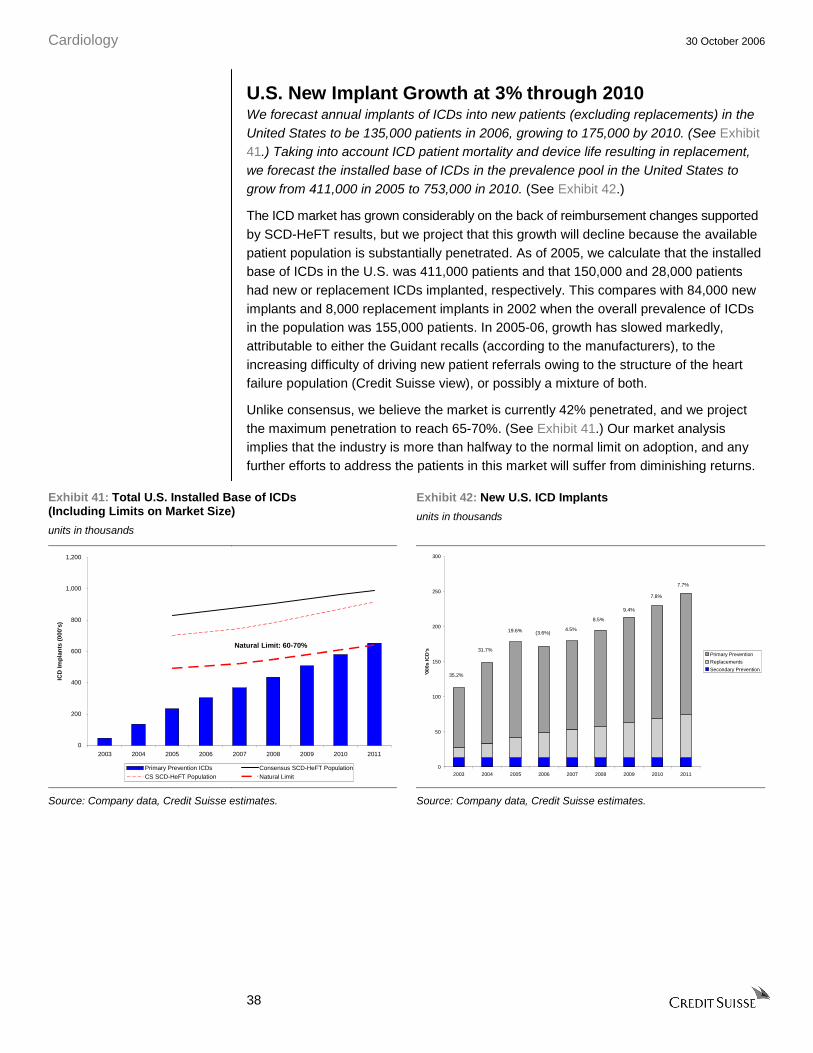
Cardiology 30 October 2006
38
U.S. New Implant Growth at 3% through 2010 We forecast annual implants of ICDs into new patients (excluding replacements) in the United States to be 135,000 patients in 2006, growing to 175,000 by 2010. (See Exhibit 41.) Taking into account ICD patient mortality and device life resulting in replacement, we forecast the installed base of ICDs in the prevalence pool in the United States to grow from 411,000 in 2005 to 753,000 in 2010. (See Exhibit 42.)
The ICD market has grown considerably on the back of reimbursement changes supported by SCD-HeFT results, but we project that this growth will decline because the available patient population is substantially penetrated. As of 2005, we calculate that the installed base of ICDs in the U.S. was 411,000 patients and that 150,000 and 28,000 patients had new or replacement ICDs implanted, respectively. This compares with 84,000 new implants and 8,000 replacement implants in 2002 when the overall prevalence of ICDs in the population was 155,000 patients. In 2005-06, growth has slowed markedly, attributable to either the Guidant recalls (according to the manufacturers), to the increasing difficulty of driving new patient referrals owing to the structure of the heart failure population (Credit Suisse view), or possibly a mixture of both.
Unlike consensus, we believe the market is currently 42% penetrated, and we project the maximum penetration to reach 65-70%. (See Exhibit 41.) Our market analysis implies that the industry is more than halfway to the normal limit on adoption, and any further efforts to address the patients in this market will suffer from diminishing returns.
Exhibit 41: Total U.S. Installed Base of ICDs (Including Limits on Market Size)
units in thousands
Exhibit 42: New U.S. ICD Implants
units in thousands
0
200
400
600
800
1,000
1,200
2003 2004 2005 2006 2007 2008 2009 2010 2011
ICD
Imp
lan
ts (
000'
s)
Primary Prevention ICDs Consensus SCD-HeFT PopulationCS SCD-HeFT Population Natural Limit
Natural Limit: 60-70%
7.7%
7.8%
9.4%
8.5%
4.5%(3.6%)19.6%
31.7%
35.2%
0
50
100
150
200
250
300
2003 2004 2005 2006 2007 2008 2009 2010 2011
'000
s IC
D's
Primary Prevention
Replacements
Secondary Prevention
Source: Company data, Credit Suisse estimates. Source: Company data, Credit Suisse estimates.

Cardiology 30 October 2006
39
U.S. Unit Price Erosion to Continue at 1-2%—Innovation Will Not Keep ASP Level We forecast U.S. revenue per unit implanted to decline by 1-2% per year as premiums charged for new features and incremental use of CRT-D devices will not offset like-for-like unit price erosion as it has in the past three years.
We expect competitive and reimbursement pressures to keep prices in the market flat to slightly down on the average revenue per ICD. The major companies have managed to consistently roll out new products with new features into this market. Core ICD technology remains largely unchanged to date, where the device is implanted with leads into the myocardium such that it can sense an electrical imbalance and then can correct it if necessary according to a defined algorithm. Innovation in the field has focused on shrinking the devices, extending battery life, and making them more adaptable—reprogrammable without explanation and “smarter” so that the device doesn’t do too much to the patient’s heart. As such, the average lifecycle for a specific version of a device has been around two years before it is made obsolete by additional iteration. When looking at the pricing data across each vendor, it is clear that they have not been able to command price premiums by innovating and adding features in the ICDs per se (see Exhibit 43); rather, the innovation has created the right shift in product mix to keep the revenues hovering on average above $20,000 per device and $25,000 per patient. (See Exhibit 44.) While the specific revenues per device are declining, the overall revenue per patient has been slowing at a much slower rate, as the revenue per patient also includes revenues from the leads, which are implanted into the heart, and innovation continues in the leads and their related delivery systems.
Exhibit 43: Pricing Trends for ICDs Exhibit 44: Overall High Power ASP—After Adjusting for Mix
$10,000
$12,000
$14,000
$16,000
$18,000
$20,000
$22,000
$24,000
Jun-
00
Sep-0
0
Dec-0
0
Mar
-01
Jun-
01
Sep-0
1
Dec-0
1
Mar
-02
Jun-
02
Sep-0
2
Dec-0
2
Mar
-03
Jun-
03
Sep-0
3
Dec-0
3
Mar
-04
Jun-
04
Sep-0
4
Dec-0
4
Mar
-05
Jun-
05
Sep-0
5
Dec-0
5
ICD
AS
P
St. Jude Medtronic Guidant Total
$10,000
$12,000
$14,000
$16,000
$18,000
$20,000
$22,000
$24,000
Jun-
00
Sep-0
0
Dec-0
0
Mar
-01
Jun-
01
Sep-0
1
Dec-0
1
Mar
-02
Jun-
02
Sep-0
2
Dec-0
2
Mar
-03
Jun-
03
Sep-0
3
Dec-0
3
Mar
-04
Jun-
04
Sep-0
4
Dec-0
4
Mar
-05
Jun-
05
Sep-0
5
Dec-0
5
Mar
-06
Hig
h P
ow
er A
SP
St. Jude Medtronic Guidant Total
Source: Company data, Credit Suisse estimates. Source: Company data, Credit Suisse estimates.
The adoption of Cardiac Resynchronization Therapy with Defibrillator backup (CRT-D) has been a positive mix contributor to realized unit price since the introduction of the technology in 2002. We estimate that the conversion of 30-35% of the units in the U.S. high-power market has added several percentage points to average realized revenue per implant growth in 2003-05. In 2006, it appears that the incremental adoption of this technology has reached a plateau at the current level of around one-third of the high-power market, and we forecast the proportion of these devices implanted annually to slowly fade downward as the newer patients referred into the ICD are likely to be less sick and need less sophisticated devices. (See Exhibit 45.)
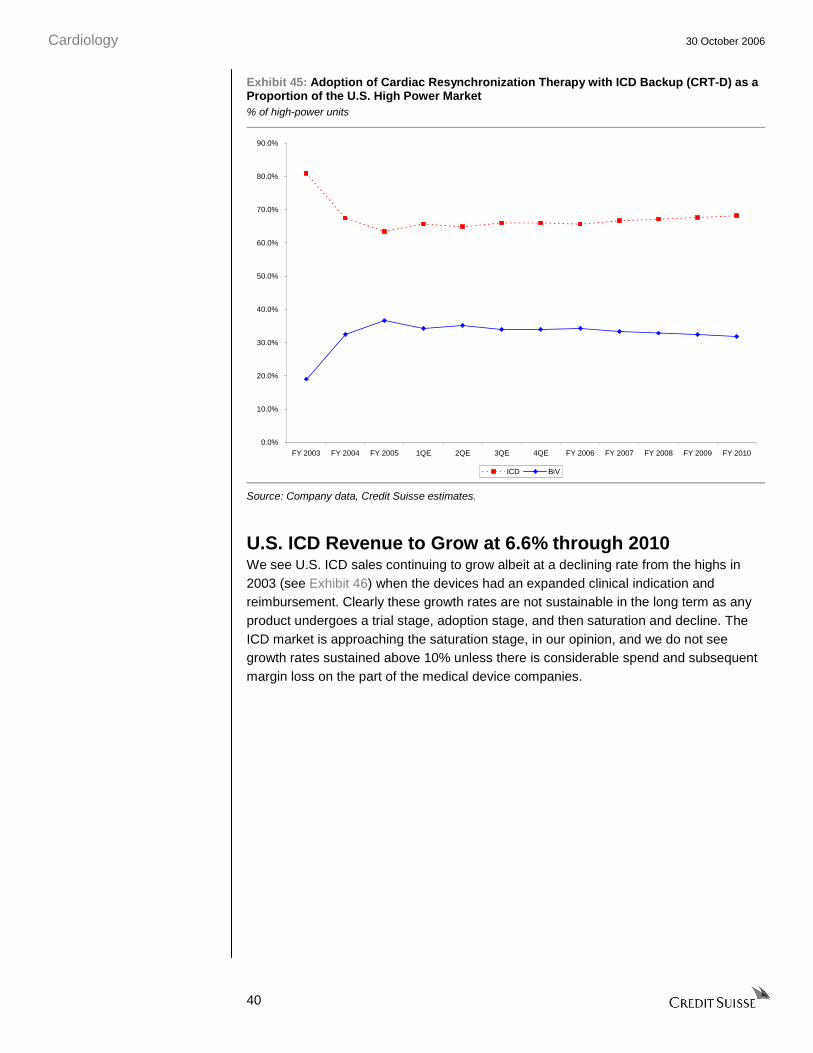
Cardiology 30 October 2006
40
Exhibit 45: Adoption of Cardiac Resynchronization Therapy with ICD Backup (CRT-D) as a Proportion of the U.S. High Power Market % of high-power units
0.0%
10.0%
20.0%
30.0%
40.0%
50.0%
60.0%
70.0%
80.0%
90.0%
FY 2003 FY 2004 FY 2005 1QE 2QE 3QE 4QE FY 2006 FY 2007 FY 2008 FY 2009 FY 2010
ICD BiV
Source: Company data, Credit Suisse estimates.
U.S. ICD Revenue to Grow at 6.6% through 2010 We see U.S. ICD sales continuing to grow albeit at a declining rate from the highs in 2003 (see Exhibit 46) when the devices had an expanded clinical indication and reimbursement. Clearly these growth rates are not sustainable in the long term as any product undergoes a trial stage, adoption stage, and then saturation and decline. The ICD market is approaching the saturation stage, in our opinion, and we do not see growth rates sustained above 10% unless there is considerable spend and subsequent margin loss on the part of the medical device companies.
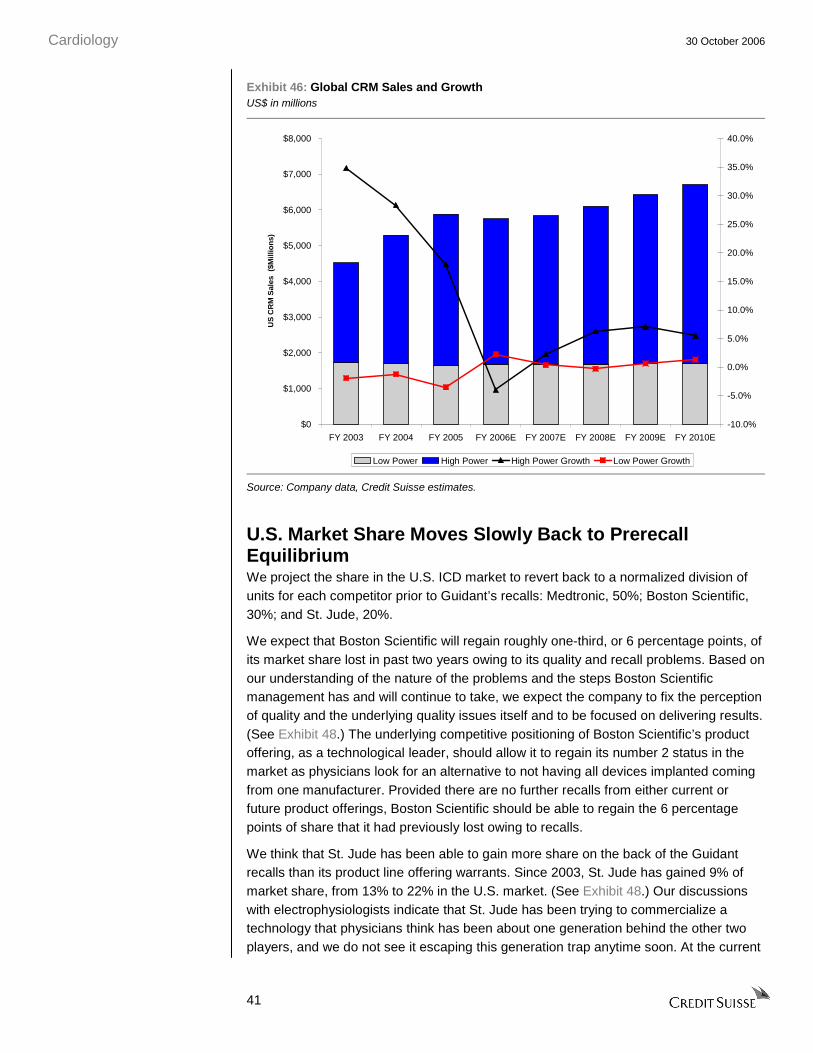
Cardiology 30 October 2006
41
Exhibit 46: Global CRM Sales and Growth US$ in millions
$0
$1,000
$2,000
$3,000
$4,000
$5,000
$6,000
$7,000
$8,000
FY 2003 FY 2004 FY 2005 FY 2006E FY 2007E FY 2008E FY 2009E FY 2010E
US
CR
M S
ales
($M
illio
ns)
-10.0%
-5.0%
0.0%
5.0%
10.0%
15.0%
20.0%
25.0%
30.0%
35.0%
40.0%
Low Power High Power High Power Growth Low Power Growth
Source: Company data, Credit Suisse estimates.
U.S. Market Share Moves Slowly Back to Prerecall Equilibrium We project the share in the U.S. ICD market to revert back to a normalized division of units for each competitor prior to Guidant’s recalls: Medtronic, 50%; Boston Scientific, 30%; and St. Jude, 20%.
We expect that Boston Scientific will regain roughly one-third, or 6 percentage points, of its market share lost in past two years owing to its quality and recall problems. Based on our understanding of the nature of the problems and the steps Boston Scientific management has and will continue to take, we expect the company to fix the perception of quality and the underlying quality issues itself and to be focused on delivering results. (See Exhibit 48.) The underlying competitive positioning of Boston Scientific’s product offering, as a technological leader, should allow it to regain its number 2 status in the market as physicians look for an alternative to not having all devices implanted coming from one manufacturer. Provided there are no further recalls from either current or future product offerings, Boston Scientific should be able to regain the 6 percentage points of share that it had previously lost owing to recalls.
We think that St. Jude has been able to gain more share on the back of the Guidant recalls than its product line offering warrants. Since 2003, St. Jude has gained 9% of market share, from 13% to 22% in the U.S. market. (See Exhibit 48.) Our discussions with electrophysiologists indicate that St. Jude has been trying to commercialize a technology that physicians think has been about one generation behind the other two players, and we do not see it escaping this generation trap anytime soon. At the current
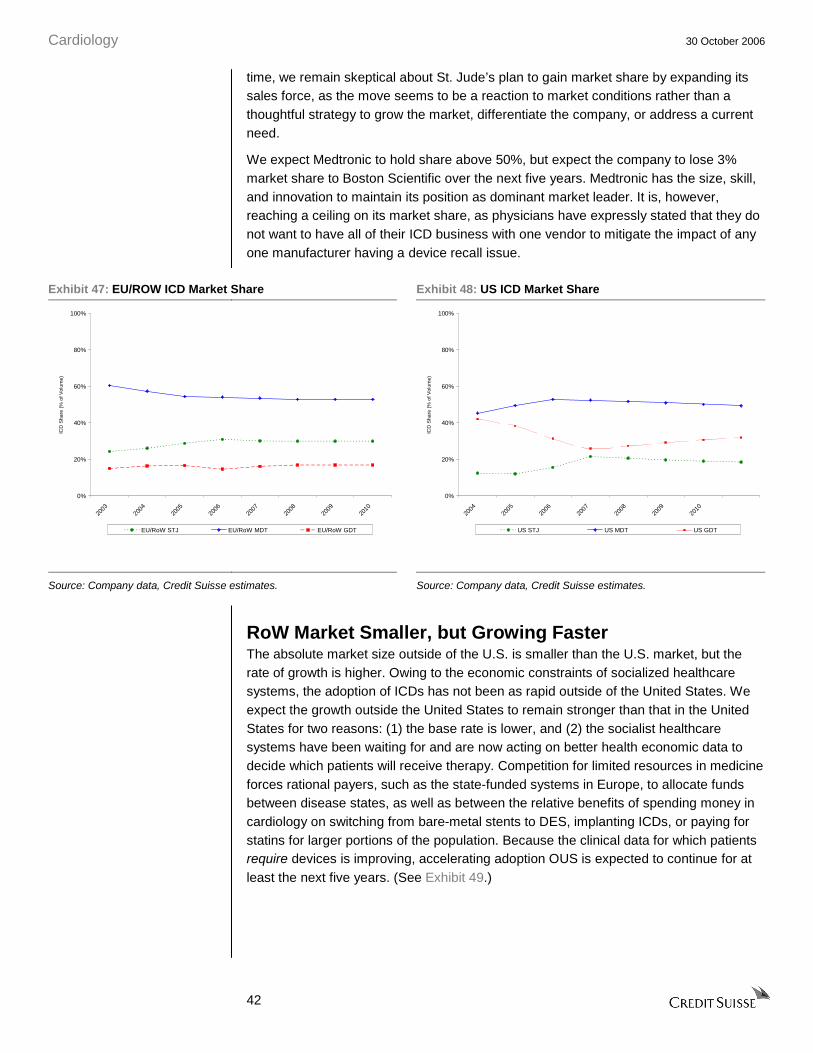
Cardiology 30 October 2006
42
time, we remain skeptical about St. Jude’s plan to gain market share by expanding its sales force, as the move seems to be a reaction to market conditions rather than a thoughtful strategy to grow the market, differentiate the company, or address a current need.
We expect Medtronic to hold share above 50%, but expect the company to lose 3% market share to Boston Scientific over the next five years. Medtronic has the size, skill, and innovation to maintain its position as dominant market leader. It is, however, reaching a ceiling on its market share, as physicians have expressly stated that they do not want to have all of their ICD business with one vendor to mitigate the impact of any one manufacturer having a device recall issue.
Exhibit 47: EU/ROW ICD Market Share Exhibit 48: US ICD Market Share
0%
20%
40%
60%
80%
100%
2003
2004
2005
2006
2007
2008
2009
2010
ICD
Sha
re (
% o
f Vol
ume)
EU/RoW STJ EU/RoW MDT EU/RoW GDT
0%
20%
40%
60%
80%
100%
2004
2005
2006
2007
2008
2009
2010
ICD
Sha
re (
% o
f Vol
ume)
US STJ US MDT US GDT
Source: Company data, Credit Suisse estimates. Source: Company data, Credit Suisse estimates.
RoW Market Smaller, but Growing Faster The absolute market size outside of the U.S. is smaller than the U.S. market, but the rate of growth is higher. Owing to the economic constraints of socialized healthcare systems, the adoption of ICDs has not been as rapid outside of the United States. We expect the growth outside the United States to remain stronger than that in the United States for two reasons: (1) the base rate is lower, and (2) the socialist healthcare systems have been waiting for and are now acting on better health economic data to decide which patients will receive therapy. Competition for limited resources in medicine forces rational payers, such as the state-funded systems in Europe, to allocate funds between disease states, as well as between the relative benefits of spending money in cardiology on switching from bare-metal stents to DES, implanting ICDs, or paying for statins for larger portions of the population. Because the clinical data for which patients require devices is improving, accelerating adoption OUS is expected to continue for at least the next five years. (See Exhibit 49.)
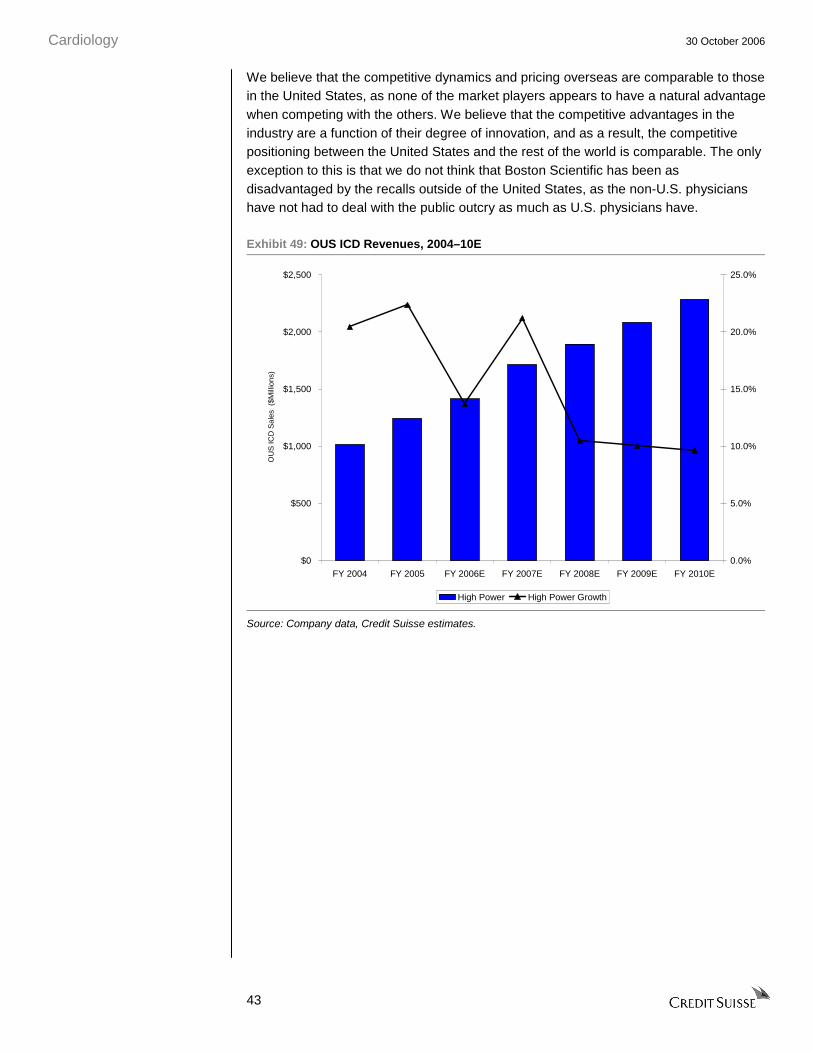
Cardiology 30 October 2006
43
We believe that the competitive dynamics and pricing overseas are comparable to those in the United States, as none of the market players appears to have a natural advantage when competing with the others. We believe that the competitive advantages in the industry are a function of their degree of innovation, and as a result, the competitive positioning between the United States and the rest of the world is comparable. The only exception to this is that we do not think that Boston Scientific has been as disadvantaged by the recalls outside of the United States, as the non-U.S. physicians have not had to deal with the public outcry as much as U.S. physicians have.
Exhibit 49: OUS ICD Revenues, 2004–10E
$0
$500
$1,000
$1,500
$2,000
$2,500
FY 2004 FY 2005 FY 2006E FY 2007E FY 2008E FY 2009E FY 2010E
OU
S IC
D S
ales
($M
illio
ns)
0.0%
5.0%
10.0%
15.0%
20.0%
25.0%
High Power High Power Growth
Source: Company data, Credit Suisse estimates.
Cardiology 30 October 2006
44
Stent Market Also at Maturity In 2002-05, the worldwide interventional cardiology market, specifically that of cardiac stents, has experienced exceptional growth. The DES revolution has not only multiplied the revenue realized per unit in the market but also expanded the use of angioplasty and stenting to a larger proportion of patients treated for CAD. Much of the incremental revenue opportunity in the United States has been realized as DES technology has been rapidly adopted as the standard of care. International cardiologists have been less aggressive in using angioplasty to manage CAD patients, and they also employ a smaller percentage of DES use relative to bare metal stents (BMS), given government funding pressures. (See Exhibit 51.)
We view the global DES market as maturing, particularly in the United States. We believe that the total market in the United States has reached a revenue peak due to slower procedure growth, almost complete conversion to DES from BMS, and increasing price competition. Competitive forces will further drive down price and offset the modest growth of procedures and units. Thus, we expect total U.S. stent revenues to trend down to $2.6 billion by 2010. Internationally, we forecast penetration of DES to continue to grow modestly; however, price declines should keep the value of the market around $2.0 billion through 2010.
Our Key DES Market Assumptions Are as Follows:
• Growth of incident CAD population is 3-4%, in-line with age and population growth.
United States
• Growth in patients undergoing angiography and angioplasty with a stent yields a 4% annual growth in the unit demand for stents.
• DES penetration of the overall stent market will reach a plateau of 95% by 2010 from 87% in 2005.
• Pricing declines of 7-9% annually will more than offset market growth in unit demand.
Europe/RoW
• Growth in patients undergoing angiography and angioplasty with a stent yields an 11% annual growth in the unit demand for stents.
• DES penetration of the overall stent market will plateau at around 70% in 2010 from the 50% in 2005, with uptake limited by budget constraints from national healthcare systems.
• Prices approximately 20-30% lower than in the United States owing to earlier competitive pressures.

Cardiology 30 October 2006
45
Worldwide Unit Demand Growth Will Slow We forecast that the growth rate of stenting procedures, and subsequently DES, will slow in all of the world’s major markets. The explosion in the use of DES and the available clinical population appear to now be approaching the normal limit of growth of CAD, which is tracking the aging of the population in the United States, Europe, and Japan. (See Exhibit 50.) Further, DES technology has almost fully displaced BMS, so we see little future expansion of the group of patients treated with DES.
Exhibit 50: Global DES Stent Volumes
stents in 000s
Exhibit 51: DES Penetration of Total Stent Units
0
1,000
2,000
3,000
4,000
5,000
2003 2004 2005 FY 2006 FY 2007 FY 2008 FY 2009 FY 2010
WW
Ste
nt
Un
it V
olu
me
(000
s)
US DES EU/RoW DES Japan DES
0%
20%
40%
60%
80%
100%
2003 2004 2005 2006 2007 2008 2009 2010
DE
S P
enet
rati
on
(%
of
To
tal V
olu
me)
US EU/RoW Japan
Source: Company data, Credit Suisse estimates. Source: Company data, Credit Suisse estimates.
The U.S. and Japanese markets have quickly and decisively embraced DES, and further gains are limited. We forecast DES penetration to increase from around 87% in 2005 to 95% in 2010 in the United States and 75-85% over the same period in Japan. (See Exhibit 51.) We do not forecast that any market will reach 100% DES penetration based on the limitations of current stent platforms to treat highly complex lesions (e.g., bifurcations), diffuse disease, or diseases in very small or tortuous vessels. New stents are being designed for very particular niche purposes, and not all of them may be drug eluting. Europe and other rational payer systems have not adopted DES as readily as the U.S. healthcare system has, despite having broader and earlier access to the technology. While European cardiologists would prefer to implant a DES in all patients, the fixed budgets of healthcare systems force physicians to evaluate stent cost efficiency. As prices decline with more competition, however, we anticipate fixed budget European payers will be able to afford a greater number of DES, with penetration expanding from around 50% in 2005 to 70% in 2010.

Cardiology 30 October 2006
46
Pricing Erosion Should Intensify with Competition As competition heats up in the DES market, we anticipate increasing pressure to lower DES prices. We estimate an effective DES price of approximately $2,200 in the United States in 2005 and, based on historical and trends seen for both BMS and DES, we are forecasting progressive price reductions to $1,400 by 2010. Similarly, we predict that prices in Europe and Japan will decline from $1,800 to $900 and from $2,900 to $2,000, respectively, over the same time period. (See Exhibit 52.)
Exhibit 52: Drug Eluting Stent ASP by Region $000s per stent
Exhibit 53: Drug Eluting Stent ASP by Company and Region $000s per stent
$0.500
$1.000
$1.500
$2.000
$2.500
$3.000
$3.500
2003
2004
2005
2006
2007
2008
2009
2010
DE
S P
rice
($0
00s
per
Ste
nt)
US EU/RoW Japan
$0.500
$1.000
$1.500
$2.000
$2.500
$3.000
$3.500
2003 2004 2005 2006 2007 2008 2009 2010
DE
S P
rice
($0
00s
per
Ste
nt)
J&J - U.S. Boston Scientific - U.S. J&J - EU/RoWBoston Scientific - EU/RoW Abbott - EU/RoW J&J - Japan
Source: Company data, Credit Suisse estimates. Source: Company data, Credit Suisse estimates.
We observed pricing pressures at only two companies, as Johnson & Johnson and Boston Scientific vied for share with products that were relatively undifferentiated in the minds of cardiologists. Prices have dropped markedly in Europe and in the United States in the past three years since the launch highs of around $3,200 in 2003. (See Exhibit 53.) We expect the pricing declines to continue as new players, such as Medtronic, Abbott, and Conor, enter the market and use price to gain share. Of particular note, Abbott and Boston Scientific will be competing against one another with the exact same stent platform, Xience/Promus, and price is the only avenue for differentiation between the two in the near term.
We further believe the European market will be a leading indicator as to future pricing dynamics in the United States. As competition intensifies in Europe and various marketing, clinical and pricing strategies are tested in the various markets, products will have strong competitive positioning by the time they are launched in the United States. Yet, the competitive tactics, constrained budgets, government tender processes, and lower willingness to pay tend to drive down European prices faster than in the United States.
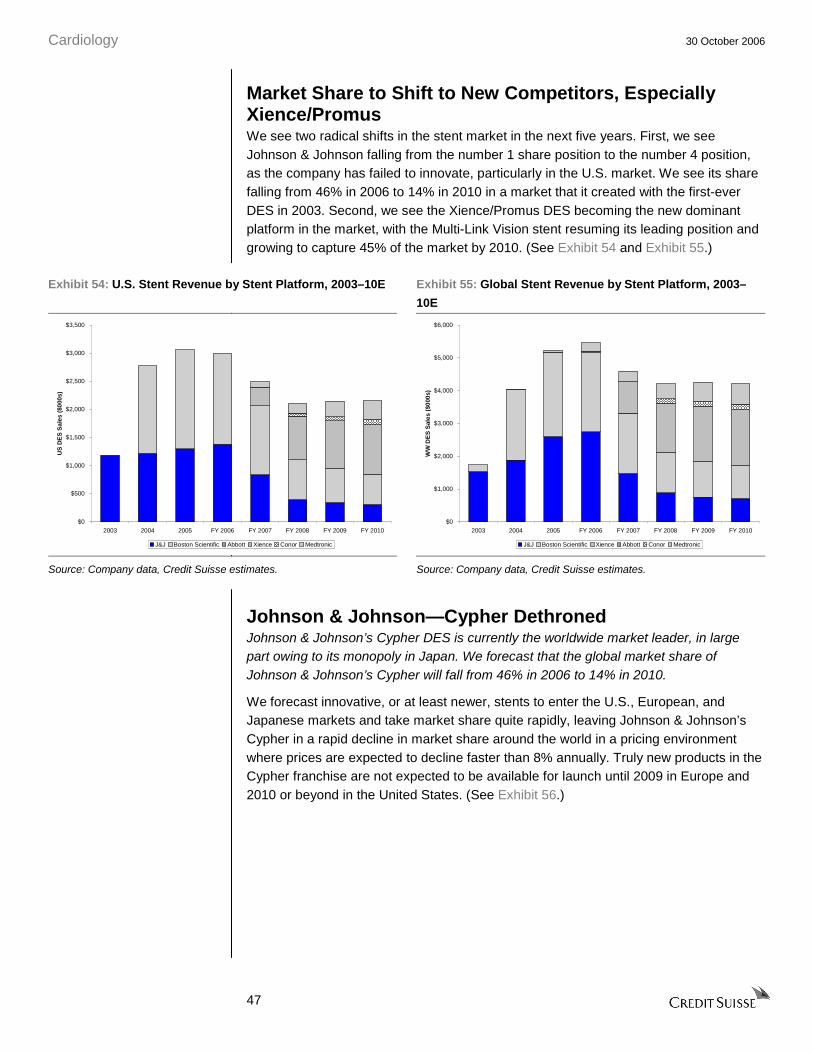
Cardiology 30 October 2006
47
Market Share to Shift to New Competitors, Especially Xience/Promus We see two radical shifts in the stent market in the next five years. First, we see Johnson & Johnson falling from the number 1 share position to the number 4 position, as the company has failed to innovate, particularly in the U.S. market. We see its share falling from 46% in 2006 to 14% in 2010 in a market that it created with the first-ever DES in 2003. Second, we see the Xience/Promus DES becoming the new dominant platform in the market, with the Multi-Link Vision stent resuming its leading position and growing to capture 45% of the market by 2010. (See Exhibit 54 and Exhibit 55.)
Exhibit 54: U.S. Stent Revenue by Stent Platform, 2003–10E Exhibit 55: Global Stent Revenue by Stent Platform, 2003–
10E
$0
$500
$1,000
$1,500
$2,000
$2,500
$3,000
$3,500
2003 2004 2005 FY 2006 FY 2007 FY 2008 FY 2009 FY 2010
US
DE
S S
ales
($0
00s)
J&J Boston Scientific Abbott Xience Conor Medtronic
$0
$1,000
$2,000
$3,000
$4,000
$5,000
$6,000
2003 2004 2005 FY 2006 FY 2007 FY 2008 FY 2009 FY 2010
WW
DE
S S
ales
($0
00s)
J&J Boston Scientific Xience Abbott Conor Medtronic
Source: Company data, Credit Suisse estimates. Source: Company data, Credit Suisse estimates.
Johnson & Johnson—Cypher Dethroned Johnson & Johnson’s Cypher DES is currently the worldwide market leader, in large part owing to its monopoly in Japan. We forecast that the global market share of Johnson & Johnson’s Cypher will fall from 46% in 2006 to 14% in 2010.
We forecast innovative, or at least newer, stents to enter the U.S., European, and Japanese markets and take market share quite rapidly, leaving Johnson & Johnson’s Cypher in a rapid decline in market share around the world in a pricing environment where prices are expected to decline faster than 8% annually. Truly new products in the Cypher franchise are not expected to be available for launch until 2009 in Europe and 2010 or beyond in the United States. (See Exhibit 56.)

Cardiology 30 October 2006
48
Exhibit 56: Johnson & Johnson Drug-Eluting Stent Pipeline
PotentialProject Filing Approval InnovationCypher NXT 4Q 2006-
1Q 20072H 2007 Enhanced delivery system
Cypher Elite 2007 2008 Enhanced delivery system plus revised stainless steel stent platform
Cypher Neo After 2009 After 2010 New cobalt chromium stent with different elution polymer formulation
Source: Company data.
In the near term (2006-08), we perceive that intervening DES introductions represent more modest incremental adjustments to the existing Cypher system to improve deliverability, and not fundamental redesigns of the system. However, the information provided about the NXT and Elite systems at the company’s investor day was limited, and Johnson & Johnson did not provide clinical data or physician impressions or discussions of its new technologies. Therefore, a real evaluation of the technologies for these two systems remains difficult at this time. Finally, management briefly mentioned a number of additional programs, including additional large and small Cypher sizes, a new bioabsorbable elution polymer, and multiple drug eluting stents, but did not provide clear timelines for these projects.
Boston Scientific-Promus’es to Be a Credible Number 2 We see Boston Scientific maintaining a leadership position in the stent market by hedging sales of Taxus with that of Xience/Promus. We forecast that the market shares will be 21% for Taxus and 18% for Promus, Boston Scientific’s version of the Xience DES, in 2010.
Boston Scientific has innovated well in the DES field, built key relationships with its physicians, and continued to reinvest in the clinical data for its franchise. Continued innovation is essential over the next five years so that as all the currently approved stents become obsolete, Boston Scientific will have the next-generation replacement stent ready for commercialization. The Taxus platform continues to evolve with a “cadence” of new product introductions every 18 months in either Europe or the US. The Taxus Liberté stent is currently marketed in Europe and will not arrive in the United States until after the FDA warning letters are lifted for the stent business. The Liberté is a second/third generation stent with an improved polymer coating over the Express and is designed to be thinner, stronger, and more flexible than its predecessors—the Taxus and Taxus Express. Boston Scientific has shown a high level of competence in rounding out its clinical trial framework and as such we expect it to be a dominant player in the market with either the Taxus or Xience platforms over the next three to five years.
Following on from its acquisition of Guidant’s CRM business, Boston Scientific sold Guidant’s vascular business including the Xience stent to Abbott, although it retains the commercial rights to co-market Xience under the Promus trade name. We think that it is well hedged in this approach (see our discussion of Xience below) to be able to fulfill clinical demand and at the same time maintain a leadership position in the field.
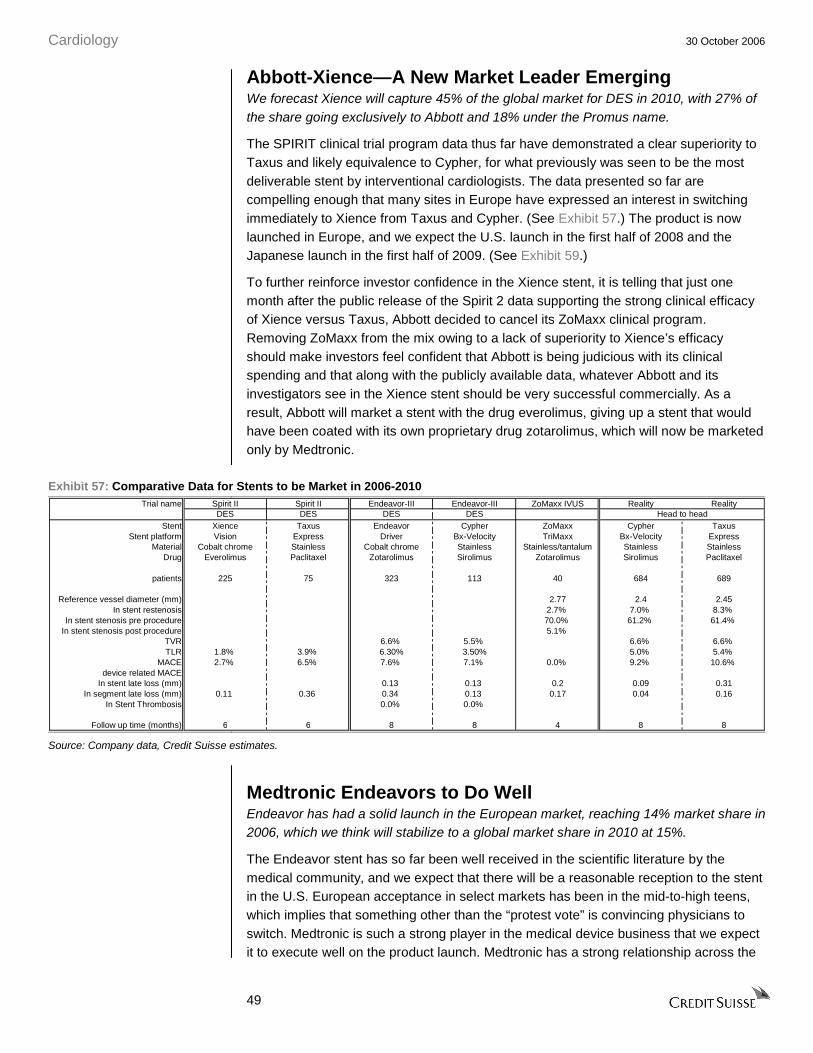
Cardiology 30 October 2006
49
Abbott-Xience—A New Market Leader Emerging We forecast Xience will capture 45% of the global market for DES in 2010, with 27% of the share going exclusively to Abbott and 18% under the Promus name.
The SPIRIT clinical trial program data thus far have demonstrated a clear superiority to Taxus and likely equivalence to Cypher, for what previously was seen to be the most deliverable stent by interventional cardiologists. The data presented so far are compelling enough that many sites in Europe have expressed an interest in switching immediately to Xience from Taxus and Cypher. (See Exhibit 57.) The product is now launched in Europe, and we expect the U.S. launch in the first half of 2008 and the Japanese launch in the first half of 2009. (See Exhibit 59.)
To further reinforce investor confidence in the Xience stent, it is telling that just one month after the public release of the Spirit 2 data supporting the strong clinical efficacy of Xience versus Taxus, Abbott decided to cancel its ZoMaxx clinical program. Removing ZoMaxx from the mix owing to a lack of superiority to Xience’s efficacy should make investors feel confident that Abbott is being judicious with its clinical spending and that along with the publicly available data, whatever Abbott and its investigators see in the Xience stent should be very successful commercially. As a result, Abbott will market a stent with the drug everolimus, giving up a stent that would have been coated with its own proprietary drug zotarolimus, which will now be marketed only by Medtronic.
Exhibit 57: Comparative Data for Stents to be Market in 2006-2010 Trial name Spirit II Spirit II Endeavor-III Endeavor-III ZoMaxx IVUS Reality Reality
DES DES DES DESStent Xience Taxus Endeavor Cypher ZoMaxx Cypher Taxus
Stent platform Vision Express Driver Bx-Velocity TriMaxx Bx-Velocity ExpressMaterial Cobalt chrome Stainless Cobalt chrome Stainless Stainless/tantalum Stainless Stainless
Drug Everolimus Paclitaxel Zotarolimus Sirolimus Zotarolimus Sirolimus Paclitaxel
patients 225 75 323 113 40 684 689
Reference vessel diameter (mm) 2.77 2.4 2.45In stent restenosis 2.7% 7.0% 8.3%
In stent stenosis pre procedure 70.0% 61.2% 61.4%In stent stenosis post procedure 5.1%
TVR 6.6% 5.5% 6.6% 6.6%TLR 1.8% 3.9% 6.30% 3.50% 5.0% 5.4%
MACE 2.7% 6.5% 7.6% 7.1% 0.0% 9.2% 10.6%device related MACE
In stent late loss (mm) 0.13 0.13 0.2 0.09 0.31In segment late loss (mm) 0.11 0.36 0.34 0.13 0.17 0.04 0.16
In Stent Thrombosis 0.0% 0.0%
Follow up time (months) 6 6 8 8 4 8 8
Head to head
Source: Company data, Credit Suisse estimates.
Medtronic Endeavors to Do Well Endeavor has had a solid launch in the European market, reaching 14% market share in 2006, which we think will stabilize to a global market share in 2010 at 15%.
The Endeavor stent has so far been well received in the scientific literature by the medical community, and we expect that there will be a reasonable reception to the stent in the U.S. European acceptance in select markets has been in the mid-to-high teens, which implies that something other than the “protest vote” is convincing physicians to switch. Medtronic is such a strong player in the medical device business that we expect it to execute well on the product launch. Medtronic has a strong relationship across the
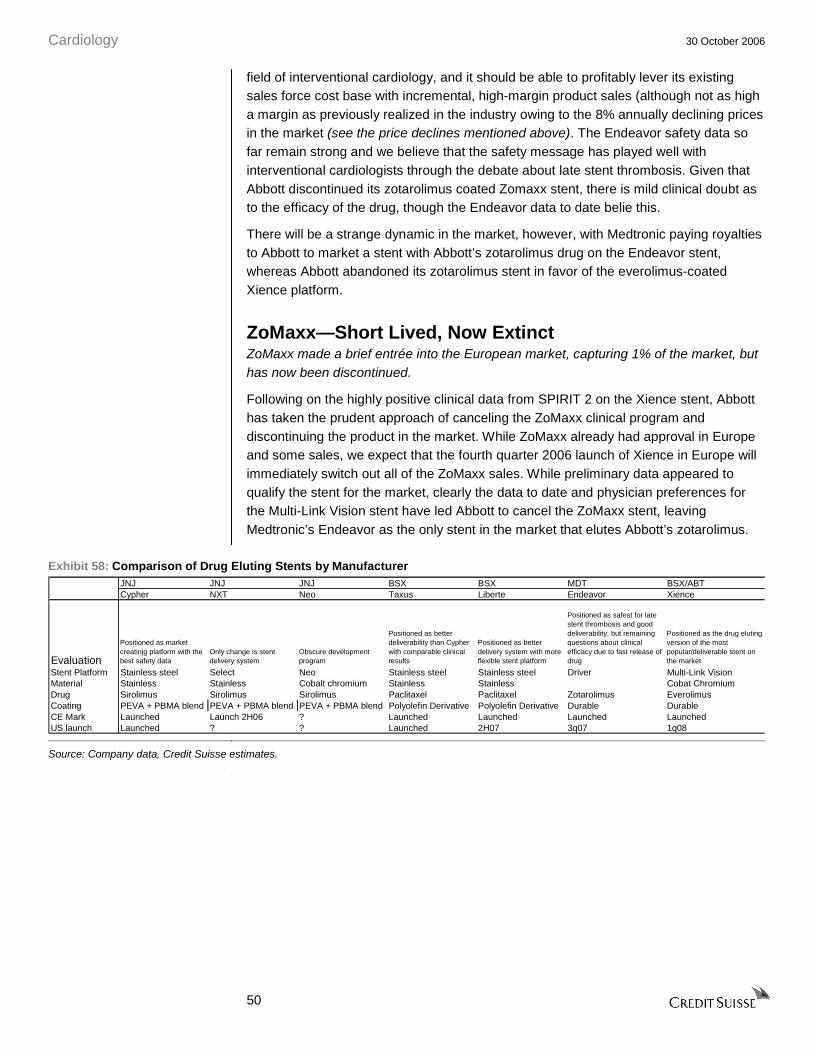
Cardiology 30 October 2006
50
field of interventional cardiology, and it should be able to profitably lever its existing sales force cost base with incremental, high-margin product sales (although not as high a margin as previously realized in the industry owing to the 8% annually declining prices in the market (see the price declines mentioned above). The Endeavor safety data so far remain strong and we believe that the safety message has played well with interventional cardiologists through the debate about late stent thrombosis. Given that Abbott discontinued its zotarolimus coated Zomaxx stent, there is mild clinical doubt as to the efficacy of the drug, though the Endeavor data to date belie this.
There will be a strange dynamic in the market, however, with Medtronic paying royalties to Abbott to market a stent with Abbott’s zotarolimus drug on the Endeavor stent, whereas Abbott abandoned its zotarolimus stent in favor of the everolimus-coated Xience platform.
ZoMaxx—Short Lived, Now Extinct ZoMaxx made a brief entrée into the European market, capturing 1% of the market, but has now been discontinued.
Following on the highly positive clinical data from SPIRIT 2 on the Xience stent, Abbott has taken the prudent approach of canceling the ZoMaxx clinical program and discontinuing the product in the market. While ZoMaxx already had approval in Europe and some sales, we expect that the fourth quarter 2006 launch of Xience in Europe will immediately switch out all of the ZoMaxx sales. While preliminary data appeared to qualify the stent for the market, clearly the data to date and physician preferences for the Multi-Link Vision stent have led Abbott to cancel the ZoMaxx stent, leaving Medtronic’s Endeavor as the only stent in the market that elutes Abbott’s zotarolimus.
Exhibit 58: Comparison of Drug Eluting Stents by Manufacturer JNJ JNJ JNJ BSX BSX MDT BSX/ABTCypher NXT Neo Taxus Liberte Endeavor Xience
Evaluation
Positioned as market creatinjg platform with the best safety data
Only change is stent delivery system
Obscure development program
Positioned as better deliverability than Cypher with comparable clinical results
Positioned as better delivery system with more flexible stent platform
Positioned as safest for late stent thrombosis and good deliverability, but remaining questions about clinical efficacy due to fast release of drug
Positioned as the drug eluting version of the most popular/deliverable stent on the market
Stent Platform Stainless steel Select Neo Stainless steel Stainless steel Driver Multi-Link VisionMaterial Stainless Stainless Cobalt chromium Stainless Stainless Cobat ChromiumDrug Sirolimus Sirolimus Sirolimus Paclitaxel Paclitaxel Zotarolimus EverolimusCoating PEVA + PBMA blend PEVA + PBMA blend PEVA + PBMA blend Polyolefin Derivative Polyolefin Derivative Durable DurableCE Mark Launched Launch 2H06 ? Launched Launched Launched LaunchedUS launch Launched ? ? Launched 2H07 3q07 1q08
Source: Company data, Credit Suisse estimates.

Cardiology
30 October 2006
51
Exhibit 59: Time Line for Stent Approvals Historical 1q06 2q06 3q06 4q06 1q07 2q07 3q07 4q07 1q08 2q08 3q08 4q08 1q09
USBSX Taxus liberte 2H06 Taxus Liberte launchGuidant Xience launch 1H08 Xience launch
EuropeAbbot (Zomaxx) Launch expected 4q06 Phase I Results CE mark ZoMaxx CancelledAbbott (Xience) Launch expected 4q06 Xience launchMedtronic Approved
JapanGuidant Xience launch 1H09 Xience launc
Historical 1q06 2q06 3q06 4q06 1q07 2q07 3q07 4q07 1q08 2q08 3q08 4q08 1q09Zomaxx I vs. TaxusEU pivotal 400 pts Results CE Results
Zomaxx II 9month FUUS pivotal 1670 pts Enrolling Close trial Results
File Launch
Historical 1q06 2q06 3q06 4q06 1q07 2q07 3q07 4q07 1q08 2q08 3q08 4q08 1q09Spirit II vs. TaxusEU pivotal 300 pts Closed 11/05 Data consolidated Submission Launch
Preliminary Results Data report Approval
Spirit III vs.Taxus FilingUS pivotal 1002 pts Enrolling Closed 3/15/06 Data consolidation Report TCT
Spirit III vs. TaxusJapan registry Enrolling Close enrolling Data consolidation Submission Approval Launch
Spirit IV vs.Taxus(special pt pops) Begin recruiting
Source: Company data, Credit Suisse estimates.

Cardiology 30 October 2006
52
Sector Should Remain at Historical Low Valuation The core group of cardiology companies, which includes Medtronic, Boston Scientific, St. Jude Medical, and until earlier this year, Guidant, has historically traded at a 50% premium to the forward price-to-earnings (P/E) multiple relative to that of the S&P 500. This valuation has been predicated on the significant growth opportunities open to these companies in their application of technology to treat the major problem of cardiovascular disease. With high teens or greater annual growth in sales and earnings, the cardiology group consistently offered investors much faster growth than the broader market and warranted a 50-100% forward P/E premium.
Our below-consensus view of the slowing growth prospects of core cardiology markets, particularly the market for ICDs, leads us to believe that the cardiology group is reaching business maturity, and this has important implications for the valuation of the sector. While it is difficult to fairly judge valuation in the context of shifting industry fundamentals, our analysis supports a materially reduced valuation for the sector group. We anticipate that the sector will trade at a reduced 25% premium to the forward P/E multiple over the next 12 months, a level that represents the bottom of the valuation range for the sector over the past 10 years. The low historical valuation that we believe is appropriate for the sector confirms our Underweight rating for the cardiology sector.
Finally, our reduced valuation premium is consistent with the trading range for companies with similar growth prospects in other product-based segments of healthcare, and it also appears somewhat generous relative to the warranted valuation indicated by Credit Suisse’s proprietary HOLT discounted cash flow-based methodology.
For explanations of our individual company valuations, please refer to our company initiation notes published separately from our sector initiation.
Forward Price-to- Earnings (P/E) Valuation Methodology We have found that growth prospects of the sector, as well those of individual companies, are a statistically powerful indicator of share performance. Therefore, we use the growth rates implied by our industry and company forecasts to inform our selections of relative forward P/E multiples for the sector relative to the S&P 500 and individual stocks relative to the sector. We combine our specific company forecasts and our selected relative P/E multiples to determine 12-month target prices for each company in our coverage group.
Specifically, for individual stocks in our coverage group, we assign a targeted P/FE multiple of the next calendar year’s earnings compared with the sector multiple, which we set relative to the P/FE multiple we expect for the S&P 500. This target P/FE multiple considers the company’s growth outlook compared with that of its peers—a stronger outlook justifies a premium, while a weaker outlook a discount.
We utilize the forward 4 quarters as our future12-month period for our earnings base and P/E multiple. Therefore, we currently base our target prices and target multiples on second half 2007/first half 2008 EPS projections.
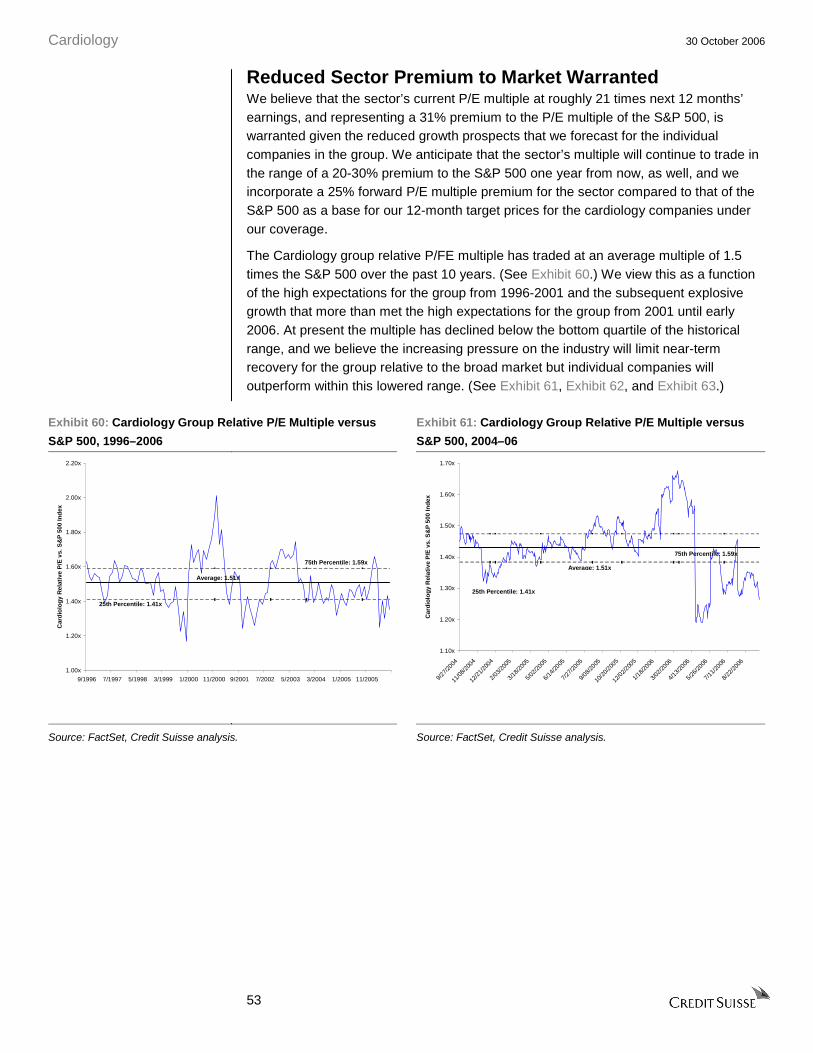
Cardiology 30 October 2006
53
Reduced Sector Premium to Market Warranted We believe that the sector’s current P/E multiple at roughly 21 times next 12 months’ earnings, and representing a 31% premium to the P/E multiple of the S&P 500, is warranted given the reduced growth prospects that we forecast for the individual companies in the group. We anticipate that the sector’s multiple will continue to trade in the range of a 20-30% premium to the S&P 500 one year from now, as well, and we incorporate a 25% forward P/E multiple premium for the sector compared to that of the S&P 500 as a base for our 12-month target prices for the cardiology companies under our coverage.
The Cardiology group relative P/FE multiple has traded at an average multiple of 1.5 times the S&P 500 over the past 10 years. (See Exhibit 60.) We view this as a function of the high expectations for the group from 1996-2001 and the subsequent explosive growth that more than met the high expectations for the group from 2001 until early 2006. At present the multiple has declined below the bottom quartile of the historical range, and we believe the increasing pressure on the industry will limit near-term recovery for the group relative to the broad market but individual companies will outperform within this lowered range. (See Exhibit 61, Exhibit 62, and Exhibit 63.)
Exhibit 60: Cardiology Group Relative P/E Multiple versus
S&P 500, 1996–2006
Exhibit 61: Cardiology Group Relative P/E Multiple versus
S&P 500, 2004–06
1.00x
1.20x
1.40x
1.60x
1.80x
2.00x
2.20x
9/1996 7/1997 5/1998 3/1999 1/2000 11/2000 9/2001 7/2002 5/2003 3/2004 1/2005 11/2005
Car
dio
log
y R
elat
ive
P/E
vs.
S&
P 5
00 In
dex
Average: 1.51x
75th Percentile: 1.59x
25th Percentile: 1.41x
1.10x
1.20x
1.30x
1.40x
1.50x
1.60x
1.70x
9/27/2
004
11/0
8/200
4
12/2
1/200
4
2/03/2
005
3/18/2
005
5/02/2
005
6/14/2
005
7/27/2
005
9/08/2
005
10/2
0/200
5
12/0
2/200
5
1/18/2
006
3/02/2
006
4/13/2
006
5/26/2
006
7/11/2
006
8/22/2
006
Car
dio
log
y R
elat
ive
P/E
vs.
S&
P 5
00 In
dex
Average: 1.51x
75th Percentile: 1.59x
25th Percentile: 1.41x
Source: FactSet, Credit Suisse analysis. Source: FactSet, Credit Suisse analysis.
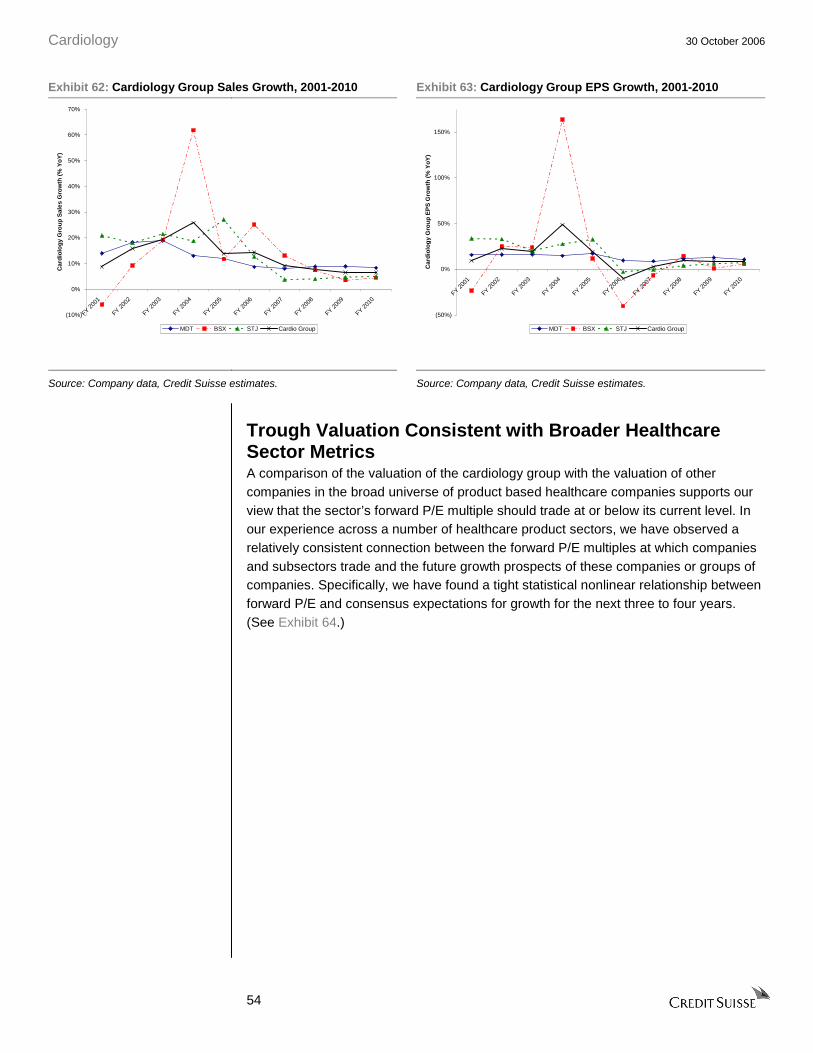
Cardiology 30 October 2006
54
Exhibit 62: Cardiology Group Sales Growth, 2001-2010 Exhibit 63: Cardiology Group EPS Growth, 2001-2010
(10%)
0%
10%
20%
30%
40%
50%
60%
70%
FY 200
1
FY 2
002
FY 2
003
FY 200
4
FY 200
5
FY 200
6
FY 200
7
FY 200
8
FY 2
009
FY 201
0
Car
dio
log
y G
rou
p S
ales
Gro
wth
(%
Yo
Y)
MDT BSX STJ Cardio Group
(50%)
0%
50%
100%
150%
FY 2001
FY 2002
FY 2003
FY 20
04
FY 20
05
FY 20
06
FY 2007
FY 2008
FY 2009
FY 2010
Car
dio
log
y G
rou
p E
PS
Gro
wth
(%
Yo
Y)
MDT BSX STJ Cardio Group
Source: Company data, Credit Suisse estimates. Source: Company data, Credit Suisse estimates.
Trough Valuation Consistent with Broader Healthcare Sector Metrics A comparison of the valuation of the cardiology group with the valuation of other companies in the broad universe of product based healthcare companies supports our view that the sector’s forward P/E multiple should trade at or below its current level. In our experience across a number of healthcare product sectors, we have observed a relatively consistent connection between the forward P/E multiples at which companies and subsectors trade and the future growth prospects of these companies or groups of companies. Specifically, we have found a tight statistical nonlinear relationship between forward P/E and consensus expectations for growth for the next three to four years. (See Exhibit 64.)

Cardiology 30 October 2006
55
Exhibit 64: Healthcare Product Company Forward P/E Multiples and Growth Rates
y = 11.101e4.7821x
R2 = 0.807
0x
10x
20x
30x
40x
50x
(10%) 0% 10% 20%
EPS Growth (FY1-FY4)
FY
+1 P
/FE
US Pharma EU Pharma Medtech Biotech Specialty/Generic
Source: FactSet, Credit Suisse analysis.
Using the current numerical relationship and our forecast for Medtronic, the sector benchmark, we derive an appropriate multiple for the cardiology group of approximately 20 times forward earnings. We observe that consensus earnings expectations for a number of companies are in the same 12% range as are Medtronic’s, including Abbott, Alcon, Amgen, BiogenIdec and Zimmer, and the multiples for these companies range from 19 to 22 times forward earnings.
HOLT Valuation Suggests Further Downside With forward P/E multiples in flux owing to uncertainty around earnings expectations, we have benchmarked our multiple-based valuation against discounted cash flow valuations for the individual stocks in the cardiology group. To this end, we use Credit Suisse’s proprietary HOLT valuation framework. The HOLT methodology suggests that warranted values for the cardiology group are 13-35% lower than the current prices and 11-40% below our target prices. (See Exhibit 65.) We believe that the downside implied by an intrinsic valuation methodology, such as HOLT, further reinforces our Underweight stance for the sector.

Cardiology 30 October 2006
56
Exhibit 65: Current Price versus Credit Suisse Target Price versus HOLT Target Price US$
$0.00
$10.00
$20.00
$30.00
$40.00
$50.00
$60.00
MDT BSX STJ
Prices
Current Price CS Target HOLT Target
Source: Company data, Credit Suisse estimates.
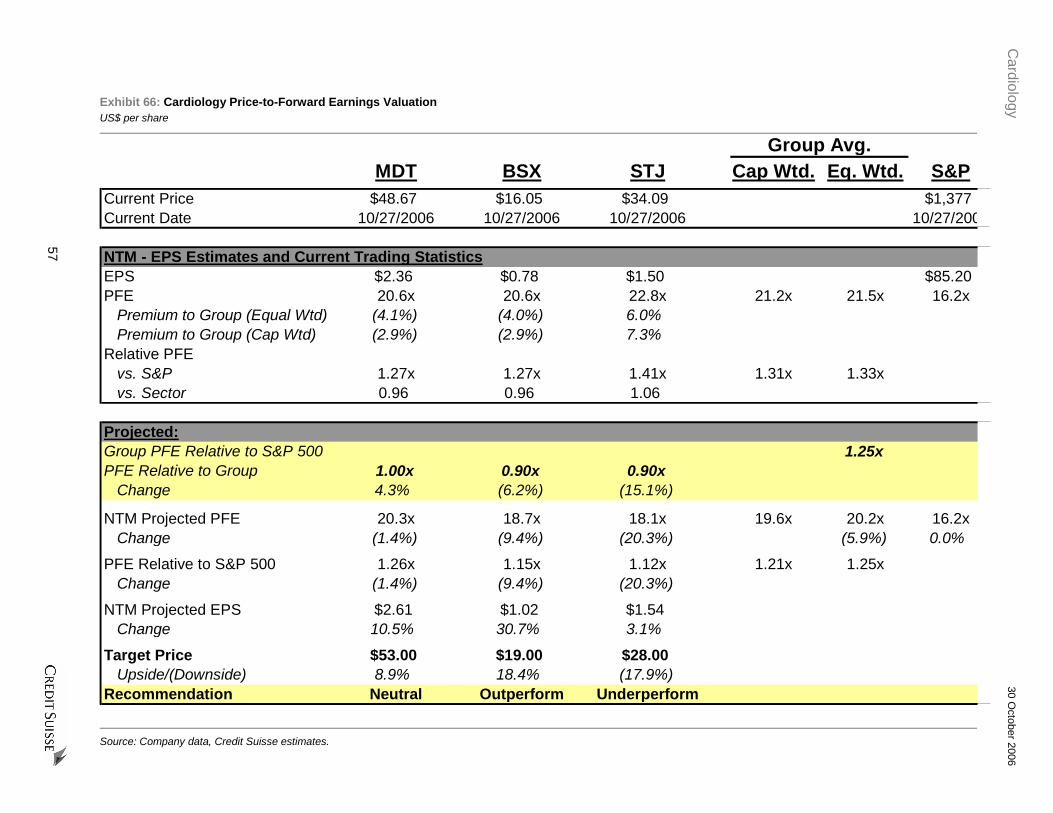
Cardiology
30 October 2006
57
Exhibit 66: Cardiology Price-to-Forward Earnings Valuation US$ per share
Group Avg.MDT BSX STJ Cap Wtd. Eq. Wtd. S&P
Current Price $48.67 $16.05 $34.09 $1,377Current Date 10/27/2006 10/27/2006 10/27/2006 10/27/200
NTM - EPS Estimates and Current Trading StatisticsEPS $2.36 $0.78 $1.50 $85.20PFE 20.6x 20.6x 22.8x 21.2x 21.5x 16.2x
Premium to Group (Equal Wtd) (4.1%) (4.0%) 6.0%Premium to Group (Cap Wtd) (2.9%) (2.9%) 7.3%
Relative PFEvs. S&P 1.27x 1.27x 1.41x 1.31x 1.33xvs. Sector 0.96 0.96 1.06
Projected:Group PFE Relative to S&P 500 1.25xPFE Relative to Group 1.00x 0.90x 0.90x
Change 4.3% (6.2%) (15.1%)
NTM Projected PFE 20.3x 18.7x 18.1x 19.6x 20.2x 16.2xChange (1.4%) (9.4%) (20.3%) (5.9%) 0.0%
PFE Relative to S&P 500 1.26x 1.15x 1.12x 1.21x 1.25xChange (1.4%) (9.4%) (20.3%)
NTM Projected EPS $2.61 $1.02 $1.54Change 10.5% 30.7% 3.1%
Target Price $53.00 $19.00 $28.00Upside/(Downside) 8.9% 18.4% (17.9%)
Recommendation Neutral Outperform Underperform
Source: Company data, Credit Suisse estimates.

Cardiology
30 October 2006
58
Exhibit 67: United States Cardiac Rhythm Management Market Forecast, 2004–0E US$ in millions, unless otherwise stated
2006Mar-06 Jun-06 Sep-06 Dec-06 CAGR
FY 2004 FY 2005 1QE 2QE 3QE 4QE FY 2006 FY 2007 FY 2008 FY 2009 FY 2010 2005-10HF Population (000's) 4,854 5,000 1,288 1,288 1,288 1,288 5,150 5,305 5,464 5,628 5,796 3.0%
YoY Growth 3.0% 3.0% 3.0% 3.0% 3.0% 3.0% 3.0% 3.0% 3.0% 3.0% 3.0%% Prevalence Receiving Device 9.7% 9.9% 9.8% 9.7% 9.7% 9.7% 9.7% 9.7% 9.8% 10.0% 10.2%
Cardiac Rhythm Devices 469.4 496.6 125.7 125.2 124.9 124.9 500.8 516.5 537.5 564.9 593.4 3.6%% Low Power 68.3% 64.3% 64.2% 66.8% 66.8% 66.3% 66.0% 65.5% 64.1% 62.6% 61.6%% High Power 31.7% 35.7% 35.8% 33.2% 33.2% 33.7% 34.0% 34.5% 36.0% 37.5% 38.5%%growth CRM 11.0% 5.8% 0.8% 3.1% 4.1% 5.1% 5.1%%growth HP 31.7% 19.1% (4.0%) 4.5% 8.6% 9.5% 7.9%HP % HF 3.1% 3.5% 3.3% 3.4% 3.5% 3.8% 3.9%
Low Power UnitsSingle Chamber 61.3 58.2 14.6 15.1 15.1 15.1 59.8 59.1 57.8 58.3 58.4 0.1%Dual Chamber 247.4 253.5 64.4 66.9 66.7 66.2 264.3 274.2 282.3 291.5 303.1 3.6%CRT-P 11.7 7.5 1.6 1.7 1.6 1.5 6.4 5.2 4.1 3.5 3.7 (13.5%)
Total 320.4 319.2 80.7 83.7 83.4 82.8 330.5 338.6 344.3 353.3 365.2 2.7%Device Share
Single Chamber 19.2% 18.2% 18.1% 18.0% 18.1% 18.2% 18.1% 17.4% 16.8% 16.5% 16.0%Dual Chamber 77.2% 79.4% 79.9% 80.0% 80.0% 80.0% 80.0% 81.0% 82.0% 82.5% 83.0%CRT-P 3.7% 2.4% 2.0% 2.0% 1.9% 1.8% 1.9% 1.6% 1.2% 1.0% 1.0%
High Power UnitsICD 100.5 112.5 29.6 26.9 27.4 27.8 111.7 118.6 129.7 143.1 155.4 6.7%BiV 48.5 64.9 15.5 14.6 14.1 14.3 58.5 59.4 63.5 68.5 72.7 2.3%
Total 149.0 177.4 45.1 41.6 41.5 42.1 170.2 178.0 193.2 211.5 228.2 5.2%Device Share
ICD 67.5% 63.4% 65.7% 64.8% 66.0% 66.0% 65.6% 66.6% 67.1% 67.6% 68.1%BiV 32.5% 36.6% 34.3% 35.2% 34.0% 34.0% 34.4% 33.4% 32.9% 32.4% 31.9%
Source: Company data, Credit Suisse estimates.

Cardiology
30 October 2006
59
Exhibit 67: United States Cardiac Rhythm Management Market Forecast, 2004–10E continued US$ in millions, unless otherwise stated
2006Mar-06 Jun-06 Sep-06 Dec-06 CAGR
FY 2004 FY 2005 1QE 2QE 3QE 4QE FY 2006 FY 2007 FY 2008 FY 2009 FY 2010 2005-10High Power MarketICD UnitsSTJ 16.1 23.2 6.3 6.3 6.2 6.1 24.9 25.3 26.4 27.7 29.3 4.8%MDT 46.2 56.8 15.5 14.2 16.2 15.6 61.4 65.4 70.3 76.1 81.1 7.4%GDT 38.2 32.6 7.8 6.4 5.0 6.1 25.4 27.8 33.0 39.3 45.0 6.7%
Total 100.5 112.5 29.6 26.9 27.4 27.8 111.7 118.6 129.7 143.1 155.4 6.7%ICD Share
STJ 16.0% 20.6% 21.4% 23.5% 22.5% 22.0% 22.3% 21.4% 20.4% 19.4% 18.9%MDT 46.0% 50.5% 52.2% 52.7% 59.1% 56.0% 55.0% 55.2% 54.2% 53.2% 52.2%GDT 38.0% 28.9% 26.4% 23.8% 18.4% 22.0% 22.7% 23.5% 25.5% 27.5% 29.0%
BiV UnitsSTJ 2.7 10.3 2.2 2.2 2.2 2.1 8.8 8.8 10.2 10.8 11.3 1.9%MDT 26.2 33.9 8.0 7.4 7.6 7.9 31.0 32.8 34.7 37.2 39.3 3.0%GDT 19.6 20.7 5.2 5.0 4.3 4.2 18.8 17.8 18.7 20.5 22.2 1.4%
Total 48.5 64.9 15.5 14.6 14.1 14.3 58.5 59.4 63.5 68.5 72.7 2.3%BiV Share
STJ 5.6% 15.8% 14.4% 15.2% 15.4% 15.0% 15.0% 14.8% 16.0% 15.8% 15.5%MDT 53.9% 52.3% 51.9% 50.4% 54.2% 55.5% 53.0% 55.2% 54.6% 54.3% 54.0%GDT 40.5% 31.9% 33.7% 34.5% 30.4% 29.5% 32.1% 30.0% 29.4% 30.0% 30.5%
% BiVSTJ 15.9% 31.1% 26.0% 26.0% 26.0% 26.0% 26.0% 25.8% 27.8% 28.0% 27.8%MDT 36.2% 37.5% 34.2% 34.2% 32.1% 33.8% 33.6% 33.4% 33.0% 32.8% 32.6%GDT 33.9% 38.9% 40.0% 44.0% 46.0% 40.9% 42.5% 39.1% 36.1% 34.3% 33.0%
High Power UnitsSTJ 18.8 33.4 8.5 8.5 8.3 8.3 33.7 34.1 36.6 38.5 40.6 4.0%MDT 72.4 90.7 23.5 21.6 23.8 23.5 92.4 98.2 105.0 113.3 120.4 5.8%GDT 57.8 53.2 13.0 11.5 9.3 10.3 44.2 45.6 51.7 59.8 67.2 4.8%
Total 149.0 177.4 45.1 41.6 41.5 42.1 170.2 178.0 193.2 211.5 228.2 5.2%High Power Share
STJ 12.6% 18.9% 19.0% 20.6% 20.1% 19.6% 19.8% 19.2% 18.9% 18.2% 17.8%MDT 48.6% 51.1% 52.1% 51.9% 57.4% 55.8% 54.3% 55.2% 54.3% 53.5% 52.8%GDT 38.8% 30.0% 28.9% 27.6% 22.5% 24.6% 25.9% 25.6% 26.8% 28.3% 29.4%
Source: Company data, Credit Suisse estimates.

Cardiology
30 October 2006
60
Exhibit 67: United States Cardiac Rhythm Management Market Forecast, 2004–10E continued US$ in millions, unless otherwise stated
2006Mar-06 Jun-06 Sep-06 Dec-06 CAGR
FY 2004 FY 2005 1QE 2QE 3QE 4QE FY 2006 FY 2007 FY 2008 FY 2009 FY 2010 2005-10High Power MarketICD PriceSTJ $21,750 $20,955 $21,005 $21,425 $21,425 $21,317 $21,292 $21,052 $20,631 $20,218 $19,814 (1.1%)MDT 22,404 22,181 22,243 22,132 22,021 21,911 22,074 21,637 21,204 20,780 20,365 (1.7%)GDT 21,957 20,926 21,553 21,445 21,231 21,125 21,359 20,856 20,439 20,030 19,630 (1.3%)
Average $22,130 $21,565 $21,796 $21,802 $21,741 $21,607 $21,737 $21,329 $20,893 $20,465 $20,048 (1.4%)
QoQ/YoY Price ChangeSTJ (2.9%) (3.7%) 0.8% 2.0% 0.0% (0.5%) 1.6% (1.1%) (2.0%) (2.0%) (2.0%)MDT (6.3%) (1.0%) (2.2%) (0.5%) (0.5%) (0.5%) (0.5%) (2.0%) (2.0%) (2.0%) (2.0%)GDT (9.7%) (4.7%) (0.5%) (0.5%) (1.0%) (0.5%) 2.1% (2.4%) (2.0%) (2.0%) (2.0%)
Average (7.2%) (2.6%) (1.1%) 0.0% (0.3%) (0.6%) 0.8% (1.9%) (2.0%) (2.0%) (2.0%)
BiV Premium vs. ICDSTJ 28.8% 38.1% 35.6% 37.5% 37.5% 37.5% 37.5% 37.5% 37.5%MDT 24.3% 27.2% 29.3% 28.0% 28.0% 28.0% 28.0% 28.0% 28.0%GDT 29.0% 27.3% 25.0% 25.0% 25.0% 25.0% 25.0% 25.0% 25.0%
Average 26.7% 28.9%
High Power ASPSTJ $22,657 $23,413 $22,947 $23,513 $23,514 $23,395 $23,341 $23,087 $22,780 $22,342 $21,876 (1.3%)MDT 24,382 24,435 24,475 24,251 24,000 23,984 24,175 23,659 23,166 22,690 22,225 (1.9%)GDT 24,133 23,133 23,709 23,804 23,673 23,282 23,626 22,894 22,285 21,748 21,250 (1.7%)
Average $24,068 $23,852 $23,964 $23,976 $23,829 $23,697 $23,868 $23,353 $22,857 $22,361 $21,875 (1.7%)
QoQ/YoY Price ChangeSTJ 1.0% 3.3% (3.2%) 2.5% 0.0% (0.5%) (0.3%) (1.1%) (1.3%) (1.9%) (2.1%)MDT (0.8%) 0.2% (2.5%) (0.9%) (1.0%) (0.1%) (1.1%) (2.1%) (2.1%) (2.1%) (2.1%)GDT (5.4%) (4.1%) 1.7% 0.4% (0.6%) (1.6%) 2.1% (3.1%) (2.7%) (2.4%) (2.3%)
Average (2.6%) (0.9%) 4.0% (1.0%) (0.0%) (2.6%) 0.1% (2.2%) (2.1%) (2.2%) (2.2%)
High Power RevenueSTJ $426 $783 $196 $201 $196 $193 $786 $788 $833 $860 $888 2.6%MDT 1,764 2,216 575 523 572 564 2,233 2,323 2,431 2,570 2,675 3.8%GDT 1,395 1,232 309 273 221 241 1,044 1,045 1,152 1,300 1,428 3.0%
Total High Power $3,585 $4,231 $1,080 $997 $989 $997 $4,063 $4,156 $4,417 $4,730 $4,991 3.4%
Source: Company data, Credit Suisse estimates.
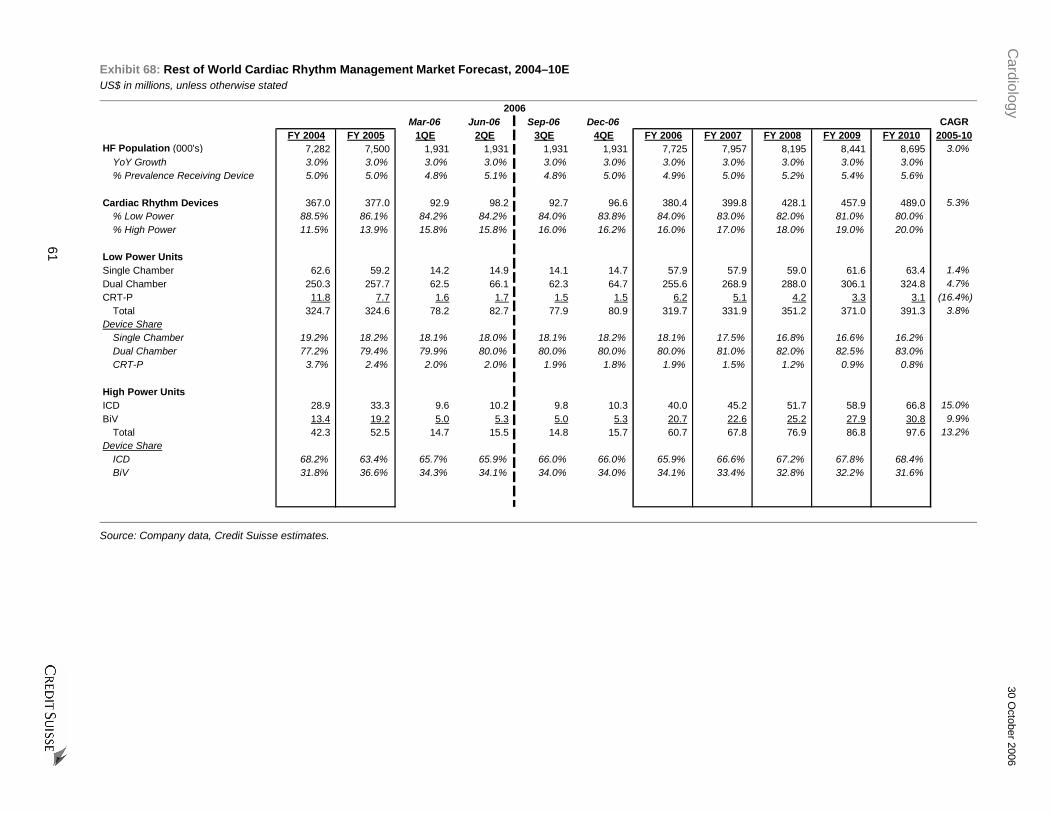
Cardiology
30 October 2006
61
Exhibit 68: Rest of World Cardiac Rhythm Management Market Forecast, 2004–10E US$ in millions, unless otherwise stated
2006Mar-06 Jun-06 Sep-06 Dec-06 CAGR
FY 2004 FY 2005 1QE 2QE 3QE 4QE FY 2006 FY 2007 FY 2008 FY 2009 FY 2010 2005-10HF Population (000's) 7,282 7,500 1,931 1,931 1,931 1,931 7,725 7,957 8,195 8,441 8,695 3.0%
YoY Growth 3.0% 3.0% 3.0% 3.0% 3.0% 3.0% 3.0% 3.0% 3.0% 3.0% 3.0%% Prevalence Receiving Device 5.0% 5.0% 4.8% 5.1% 4.8% 5.0% 4.9% 5.0% 5.2% 5.4% 5.6%
Cardiac Rhythm Devices 367.0 377.0 92.9 98.2 92.7 96.6 380.4 399.8 428.1 457.9 489.0 5.3%% Low Power 88.5% 86.1% 84.2% 84.2% 84.0% 83.8% 84.0% 83.0% 82.0% 81.0% 80.0%% High Power 11.5% 13.9% 15.8% 15.8% 16.0% 16.2% 16.0% 17.0% 18.0% 19.0% 20.0%
Low Power UnitsSingle Chamber 62.6 59.2 14.2 14.9 14.1 14.7 57.9 57.9 59.0 61.6 63.4 1.4%Dual Chamber 250.3 257.7 62.5 66.1 62.3 64.7 255.6 268.9 288.0 306.1 324.8 4.7%CRT-P 11.8 7.7 1.6 1.7 1.5 1.5 6.2 5.1 4.2 3.3 3.1 (16.4%)
Total 324.7 324.6 78.2 82.7 77.9 80.9 319.7 331.9 351.2 371.0 391.3 3.8%Device Share
Single Chamber 19.2% 18.2% 18.1% 18.0% 18.1% 18.2% 18.1% 17.5% 16.8% 16.6% 16.2%Dual Chamber 77.2% 79.4% 79.9% 80.0% 80.0% 80.0% 80.0% 81.0% 82.0% 82.5% 83.0%CRT-P 3.7% 2.4% 2.0% 2.0% 1.9% 1.8% 1.9% 1.5% 1.2% 0.9% 0.8%
High Power UnitsICD 28.9 33.3 9.6 10.2 9.8 10.3 40.0 45.2 51.7 58.9 66.8 15.0%BiV 13.4 19.2 5.0 5.3 5.0 5.3 20.7 22.6 25.2 27.9 30.8 9.9%
Total 42.3 52.5 14.7 15.5 14.8 15.7 60.7 67.8 76.9 86.8 97.6 13.2%Device Share
ICD 68.2% 63.4% 65.7% 65.9% 66.0% 66.0% 65.9% 66.6% 67.2% 67.8% 68.4%BiV 31.8% 36.6% 34.3% 34.1% 34.0% 34.0% 34.1% 33.4% 32.8% 32.2% 31.6%
Source: Company data, Credit Suisse estimates.
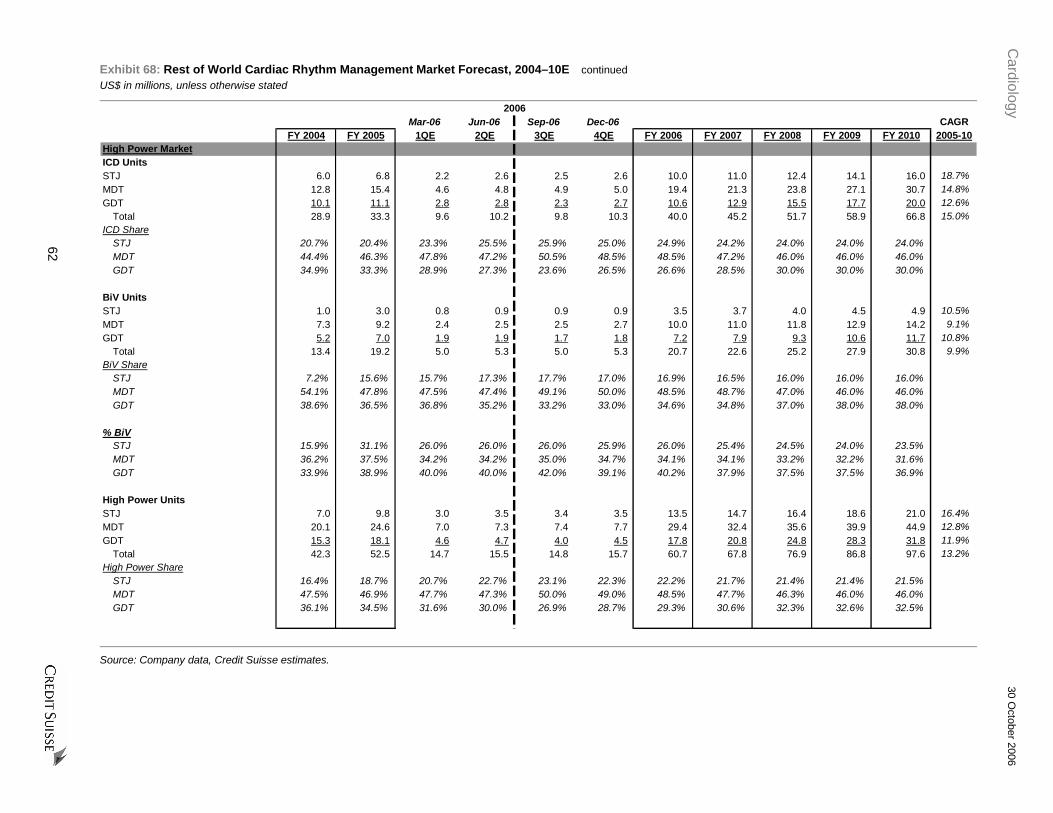
Cardiology
30 October 2006
62
Exhibit 68: Rest of World Cardiac Rhythm Management Market Forecast, 2004–10E continued
US$ in millions, unless otherwise stated
2006Mar-06 Jun-06 Sep-06 Dec-06 CAGR
FY 2004 FY 2005 1QE 2QE 3QE 4QE FY 2006 FY 2007 FY 2008 FY 2009 FY 2010 2005-10High Power MarketICD UnitsSTJ 6.0 6.8 2.2 2.6 2.5 2.6 10.0 11.0 12.4 14.1 16.0 18.7%MDT 12.8 15.4 4.6 4.8 4.9 5.0 19.4 21.3 23.8 27.1 30.7 14.8%GDT 10.1 11.1 2.8 2.8 2.3 2.7 10.6 12.9 15.5 17.7 20.0 12.6%
Total 28.9 33.3 9.6 10.2 9.8 10.3 40.0 45.2 51.7 58.9 66.8 15.0%ICD Share
STJ 20.7% 20.4% 23.3% 25.5% 25.9% 25.0% 24.9% 24.2% 24.0% 24.0% 24.0%MDT 44.4% 46.3% 47.8% 47.2% 50.5% 48.5% 48.5% 47.2% 46.0% 46.0% 46.0%GDT 34.9% 33.3% 28.9% 27.3% 23.6% 26.5% 26.6% 28.5% 30.0% 30.0% 30.0%
BiV UnitsSTJ 1.0 3.0 0.8 0.9 0.9 0.9 3.5 3.7 4.0 4.5 4.9 10.5%MDT 7.3 9.2 2.4 2.5 2.5 2.7 10.0 11.0 11.8 12.9 14.2 9.1%GDT 5.2 7.0 1.9 1.9 1.7 1.8 7.2 7.9 9.3 10.6 11.7 10.8%
Total 13.4 19.2 5.0 5.3 5.0 5.3 20.7 22.6 25.2 27.9 30.8 9.9%BiV Share
STJ 7.2% 15.6% 15.7% 17.3% 17.7% 17.0% 16.9% 16.5% 16.0% 16.0% 16.0%MDT 54.1% 47.8% 47.5% 47.4% 49.1% 50.0% 48.5% 48.7% 47.0% 46.0% 46.0%GDT 38.6% 36.5% 36.8% 35.2% 33.2% 33.0% 34.6% 34.8% 37.0% 38.0% 38.0%
% BiVSTJ 15.9% 31.1% 26.0% 26.0% 26.0% 25.9% 26.0% 25.4% 24.5% 24.0% 23.5%MDT 36.2% 37.5% 34.2% 34.2% 35.0% 34.7% 34.1% 34.1% 33.2% 32.2% 31.6%GDT 33.9% 38.9% 40.0% 40.0% 42.0% 39.1% 40.2% 37.9% 37.5% 37.5% 36.9%
High Power UnitsSTJ 7.0 9.8 3.0 3.5 3.4 3.5 13.5 14.7 16.4 18.6 21.0 16.4%MDT 20.1 24.6 7.0 7.3 7.4 7.7 29.4 32.4 35.6 39.9 44.9 12.8%GDT 15.3 18.1 4.6 4.7 4.0 4.5 17.8 20.8 24.8 28.3 31.8 11.9%
Total 42.3 52.5 14.7 15.5 14.8 15.7 60.7 67.8 76.9 86.8 97.6 13.2%High Power Share
STJ 16.4% 18.7% 20.7% 22.7% 23.1% 22.3% 22.2% 21.7% 21.4% 21.4% 21.5%MDT 47.5% 46.9% 47.7% 47.3% 50.0% 49.0% 48.5% 47.7% 46.3% 46.0% 46.0%GDT 36.1% 34.5% 31.6% 30.0% 26.9% 28.7% 29.3% 30.6% 32.3% 32.6% 32.5%
Source: Company data, Credit Suisse estimates.

Cardiology
30 October 2006
63
Exhibit 68: Rest of World Cardiac Rhythm Management Market Forecast, 2004–10E continued US$ in millions, unless otherwise stated
2006Mar-06 Jun-06 Sep-06 Dec-06 CAGR
FY 2004 FY 2005 1QE 2QE 3QE 4QE FY 2006 FY 2007 FY 2008 FY 2009 FY 2010 2005-10High Power MarketICD PriceSTJ $21,750 $20,455 $20,005 $19,904 $19,904 $19,805 $19,901 $19,557 $19,166 $18,782 $18,407 (2.1%)MDT 22,404 22,181 22,243 22,132 22,021 21,911 22,073 21,636 21,203 20,779 20,364 (1.7%)GDT 21,957 20,926 21,553 21,445 21,338 21,232 21,395 20,960 20,541 20,130 19,728 (1.2%)
Average $22,113 $21,411 $21,522 $21,376 $21,311 $21,204 $21,351 $20,939 $20,516 $20,105 $19,703 (1.6%)
QoQ/YoY Price ChangeSTJ (2.9%) (6.0%) (1.6%) (0.5%) 0.0% (0.5%) (2.7%) (1.7%) (2.0%) (2.0%) (2.0%)MDT (6.3%) (1.0%) (2.2%) (0.5%) (0.5%) (0.5%) (0.5%) (2.0%) (2.0%) (2.0%) (2.0%)GDT (9.7%) (4.7%) (0.5%) (0.5%) (0.5%) (0.5%) 2.2% (2.0%) (2.0%) (2.0%) (2.0%)
Average (7.1%) (3.2%) (1.7%) (0.7%) (0.3%) (0.5%) (0.3%) (1.9%) (2.0%) (2.0%) (2.0%)
BiV Premium vs. ICD - Assume Parity w/USSTJ 28.8% 38.1% 35.6% 37.5% 37.5% 37.5% 37.5% 37.5% 37.5%MDT 24.3% 27.2% 29.3% 28.0% 28.0% 28.0% 28.0% 28.0% 28.0%GDT 29.0% 27.3% 25.0% 25.0% 25.0% 25.0% 25.0% 25.0% 25.0%
Average 26.7% 28.9%
High Power ASPSTJ $22,641 $22,854 $21,855 $21,845 $21,845 $21,732 $21,818 $21,421 $20,928 $20,474 $20,030 (2.6%)MDT 24,393 24,432 24,475 24,251 24,179 24,039 24,231 23,701 23,177 22,651 22,164 (1.9%)GDT 24,103 23,177 23,709 23,590 23,579 23,306 23,547 22,947 22,469 22,019 21,547 (1.4%)
Average $24,000 $23,705 $23,691 $23,506 $23,478 $23,314 $23,494 $22,976 $22,468 $21,979 $21,505 (1.9%)
QoQ/YoY Price ChangeSTJ 1.0% 0.9% (5.6%) (0.0%) 0.0% (0.5%) (4.5%) (1.8%) (2.3%) (2.2%) (2.2%)MDT (0.9%) 0.2% (2.5%) (0.9%) (0.3%) (0.6%) (0.8%) (2.2%) (2.2%) (2.3%) (2.2%)GDT (5.5%) (3.8%) 1.7% (0.5%) (0.0%) (1.2%) 1.6% (2.5%) (2.1%) (2.0%) (2.1%)
Average (2.5%) (1.2%) 3.3% (2.3%) (0.9%) (3.4%) (0.9%) (2.2%) (2.2%) (2.2%) (2.2%)
High Power RevenueSTJ $158 $224 $66 $77 $75 $76 $294 $315 $344 $381 $420 13.4%MDT 490 601 171 178 180 184 713 767 826 905 995 10.6%GDT 368 419 110 110 94 105 419 476 558 623 684 10.3%
Total High Power $1,016 $1,244 $348 $365 $349 $365 $1,427 $1,558 $1,728 $1,909 $2,100 11.0%
Source: Company data, Credit Suisse estimates.

Cardiology 30 October 2006
64
Exhibit 69: U.S. ICD Market Penetration Forecast, 2004-11E CAGR
FY 2004 FY 2005 FY 2006 FY 2007 FY 2008 FY 2009 FY 2010 FY 2011 2005-10Heart Failure PopulationClass I 1,456 1,500 1,545 1,591 1,639 1,688 1,739 1,791 3.0%Class II 1,699 1,750 1,803 1,857 1,912 1,970 2,029 2,090 3.0%Class III 1,456 1,500 1,545 1,591 1,639 1,688 1,739 1,791 3.0%Class IV 243 250 258 265 273 281 290 299 3.0%
Total HF 4,854 5,000 5,150 5,305 5,464 5,628 5,796 5,970 3.0%YoY Growth 3.0% 3.0% 3.0% 3.0% 3.0% 3.0% 3.0% 3.0%
Class I 30.0% 30.0% 30.0% 30.0% 30.0% 30.0% 30.0% 30.0%Class II 35.0% 35.0% 35.0% 35.0% 35.0% 35.0% 35.0% 35.0%Class III 30.0% 30.0% 30.0% 30.0% 30.0% 30.0% 30.0% 30.0%Class IV 5.0% 5.0% 5.0% 5.0% 5.0% 5.0% 5.0% 5.0%
CHF Population (EF<35%)Class I 146 150 155 159 164 169 174 179 3.0%Class II 510 525 541 557 574 591 609 627 3.0%Class III 728 750 773 796 820 844 869 896 3.0%Class IV 218 225 232 239 246 253 261 269 3.0%
Total CHF (EF<35%) 1,602 1,650 1,700 1,750 1,803 1,857 1,913 1,970 3.0%
Class I 10.0% 10.0% 10.0% 10.0% 10.0% 10.0% 10.0% 10.0%Class II 30.0% 30.0% 30.0% 30.0% 30.0% 30.0% 30.0% 30.0%Class III 50.0% 50.0% 50.0% 50.0% 50.0% 50.0% 50.0% 50.0%Class IV 90.0% 90.0% 90.0% 90.0% 90.0% 90.0% 90.0% 90.0%
Average 33.0% 33.0% 33.0% 33.0% 33.0% 33.0% 33.0% 33.0%
SCD-HeFT Indicated Population 1,238 1,275 1,313 1,353 1,393 1,435 1,478 1,522 3.0% % HF (EF<35%) 77.3% 77.3% 77.3% 77.3% 77.3% 77.3% 77.3% 77.3%
SCD-HeFT Expansion of Core ICD EF<35%,Class II-III, Narrow QRS
874 900 927 955 983 1,013 1,043 1,075 3.0%
CHF Population (EF<35%), Wide QRSClass I 9 9 9 10 10 10 10 11 3.0%Class II 102 105 108 112 115 118 122 126 3.0%Class III 364 375 386 398 410 422 435 448 3.0%Class IV 131 135 139 143 148 152 157 161 3.0%
Total HF (EF<35%, WQRS) 606 624 643 662 682 703 724 745 3.0%
Class I 6.0% 6.0% 6.0% 6.0% 6.0% 6.0% 6.0% 6.0%Class II 20.1% 20.1% 20.1% 20.1% 20.1% 20.1% 20.1% 20.1%Class III 50.0% 50.0% 50.0% 50.0% 50.0% 50.0% 50.0% 50.0%Class IV 60.0% 60.0% 60.0% 60.0% 60.0% 60.0% 60.0% 60.0%
Average 37.8% 37.8% 37.8% 37.8% 37.8% 37.8% 37.8% 37.8%
COMPANION Indicated Population 364 375 386 398 410 422 435 448 3.0%% HF (EF<35%, WQRS) 60.1% 60.1% 60.1% 60.1% 60.1% 60.1% 60.1% 60.1%
Source: Company data, Credit Suisse estimates.

Cardiology 30 October 2006
65
Exhibit 69: U.S. ICD Market Penetration Forecast, 2004-11E continued CAGR
FY 2004 FY 2005 FY 2006 FY 2007 FY 2008 FY 2009 FY 2010 FY 2011 2005-10Primary Prevention PopulationClass I 167 167 167 167 167 167 167 167 0.0%Class II 167 167 167 167 167 167 167 167 0.0%Class III 108 108 108 108 108 108 108 108 0.0%Class IV 9 9 9 9 9 9 9 9 0.0%
Primary Prevention 450 450 450 450 450 450 450 450 0.0%
Class I 37.0% 37.0% 37.0% 37.0% 37.0% 37.0% 37.0% 37.0%Class II 37.0% 37.0% 37.0% 37.0% 37.0% 37.0% 37.0% 37.0%Class III 24.0% 24.0% 24.0% 24.0% 24.0% 24.0% 24.0% 24.0%Class IV 2.0% 2.0% 2.0% 2.0% 2.0% 2.0% 2.0% 2.0%
Prim. Prev. Overlap with HF EF<35%Class I 147 147 147 147 147 147 147 147 0.0%Class II 148 148 148 148 148 148 148 148 0.0%Class III 96 96 96 96 96 96 96 96 0.0%Class IV 9 9 9 9 9 9 9 9 0.0%
Primary Overlap with HF EF<35% 400 400 400 400 400 400 400 400 0.0%
Class I 88.0% 88.0% 88.0% 88.0% 88.0% 88.0% 88.0% 88.0%Class II 89.0% 89.0% 89.0% 89.0% 89.0% 89.0% 89.0% 89.0%Class III 89.0% 89.0% 89.0% 89.0% 89.0% 89.0% 89.0% 89.0%Class IV 100.0% 100.0% 100.0% 100.0% 100.0% 100.0% 100.0% 100.0%
Average 88.9% 88.9% 88.9% 88.9% 88.9% 88.9% 88.9% 88.9%
Primary Overlap with HF EF<35%, WQRSClass I 44 44 44 44 44 44 44 44 0.0%Class II 59 59 59 59 59 59 59 59 0.0%Class III 67 67 67 67 67 67 67 67 0.0%Class IV 7 7 7 7 7 7 7 7 0.0%
Primary Overlap with HF EF<35%, WQRS 178 178 178 178 178 178 178 178 0.0%
Class I 30.0% 30.0% 30.0% 30.0% 30.0% 30.0% 30.0% 30.0%Class II 40.0% 40.0% 40.0% 40.0% 40.0% 40.0% 40.0% 40.0%Class III 70.0% 70.0% 70.0% 70.0% 70.0% 70.0% 70.0% 70.0%Class IV 80.0% 80.0% 80.0% 80.0% 80.0% 80.0% 80.0% 80.0%
Average 44.4% 44.4% 44.4% 44.4% 44.4% 44.4% 44.4% 44.4%
Source: Company data, Credit Suisse estimates.

Cardiology 30 October 2006
66
Exhibit 69: U.S. ICD Market Penetration Forecast, 2004-11E continued CAGR
FY 2004 FY 2005 FY 2006 FY 2007 FY 2008 FY 2009 FY 2010 FY 2011 2005-10ExclusionsSCD-HeFT Population 1,238 1,275 1,313 1,353 1,393 1,435 1,478 1,522 3.0%
Gender 357 367 379 390 385 381 377 370 0.5%Treating Physician 151 156 160 165 170 176 182 188 3.2%Race 49 50 52 53 55 52 49 50 (0.5%)
Total Exclusions 556 573 590 608 611 609 608 608 1.2%
Net Population 681 702 723 745 783 826 870 914 4.4%46.3% 58.6% 66.5% 72.8% 78.1% 82.6% 86.5% 90.4%
GenderRevised Population - Gender Only 829 854 880 906 953 1,001 1,051 1,104 4.2%
% Reduced Population 67.0% 67.0% 67.0% 67.0% 68.4% 69.8% 71.1% 72.5%
Women as % of PopulationOverall 55.0% 55.0% 55.0% 55.0% 55.0% 55.0% 55.0% 55.0%
% Reduction Women vs. Men 60.0% 60.0% 60.0% 60.0% 57.5% 55.0% 52.5% 50.0%
Treating PhysicianRevised Population - Treating Physician Only 1,065 1,097 1,130 1,164 1,199 1,235 1,272 1,310 3.0%
% Reduced Population 86.0% 86.0% 86.0% 86.0% 86.0% 86.0% 86.0% 86.0%
% No-Cardiologist or ConsultOverall 41.8% 41.8% 41.8% 41.8% 41.8% 41.8% 41.8% 41.8%Class II & II Only 27.9% 27.9% 27.9% 27.9% 27.9% 27.9% 27.9% 27.9%
% Reduction Non-Cardiologist vs. Cardiologist 50.0% 50.0% 50.0% 50.0% 50.0% 50.0% 50.0% 50.0%
RaceRevised Population - Race Only 1,182 1,218 1,254 1,292 1,331 1,376 1,423 1,465 3.2%
% Reduced Population 95.5% 95.5% 95.5% 95.5% 95.5% 95.9% 96.3% 96.3%
% African-AmericanOverall 15.0% 15.0% 15.0% 15.0% 15.0% 15.0% 15.0% 15.0%
% Reduction African-American vs. Caucasian 30.0% 30.0% 30.0% 30.0% 30.0% 27.5% 25.0% 25.0%
Overlap AdjustmentRaw RedcutionRace 56 57 59 61 63 59 55 57 (0.7%)Gender 408 421 433 446 441 434 427 419 0.3%Physician Awareness 173 178 183 189 195 200 206 213 3.0%Available 601 619 637 656 695 741 789 834 5.0%
Overlap 81 83 86 88 87 84 81 80 (0.5%)% Overlap 12.7% 12.7% 12.7% 12.7% 12.5% 12.2% 11.8% 11.6%
Source: Company data, Credit Suisse estimates.

Cardiology 30 October 2006
67
Exhibit 69: U.S. ICD Market Penetration Forecast, 2004-11E continued CAGR
FY 2004 FY 2005 FY 2006 FY 2007 FY 2008 FY 2009 FY 2010 FY 2011 2005-10SaturationInstalled Base 226 315 411 480 542 611 682 753 16.7%Current Implants 149 177 170 178 193 212 228 246 5.2%Replacements (21) (28) (35) (40) (43) (49) (55) (60) 14.0%Net New Implants 128 149 135 138 150 163 174 186 3.1%Mortality in implant population (39) (53) (66) (76) (81) (92) (102) (113) 14.0%End of period total 315 411 480 542 611 682 753 826 12.9%% Penetration in HF Population 6.5% 8.2% 9.3% 10.2% 11.2% 12.1% 13.0% 13.8%
Replacement Rate 8.0% 8.0% 8.0% 8.0% 8.0% 8.0% 8.0% 8.0%Mortality in Implant Population 15.0% 15.0% 15.0% 15.0% 15.0% 15.0% 15.0% 15.0%
(4.0%) 4.5% 8.6% 9.5% 7.9% 7.7%Secondary PreventionPopulation 300 300Use 180 180 180 180 180 180 180 180 0.0%% Penetration 60.0% 60.0%
Primary PreventionSCD-HeFT Population 1,238 1,275 1,313 1,353 1,393 1,435 1,478 1,522 3.0%Use 135 231 300 362 431 502 573 646 19.9%% Penetration 10.9% 18.1% 22.9% 26.8% 30.9% 35.0% 38.8% 42.4%
Net SCD-HeFT Population 681 702 723 745 783 826 870 914 4.4%Use 135 231 300 362 431 502 573 646 19.9%% Penetration 19.8% 32.9% 41.6% 48.7% 55.1% 60.8% 65.9% 70.7%
Y on Y Growth of Use 194.9% 71.0% 29.9% 20.7% 18.9% 16.5% 14.2% 12.7% (27.5%)
Source: Company data, Credit Suisse estimates.

Cardiology 30 October 2006
68
Exhibit 70: U.S. Drug-Eluting Stent Market Forecast, 2004–11E US$ in millions, unless otherwise stated
CAGRFY 2004 FY 2005 FY 2006 FY 2007 FY 2008 FY 2009 FY 2010 FY 2011 2005-10
AngiographyPatients 1,090 1,119 1,129 1,152 1,175 1,198 1,222 1,247 1.8%
YoY Growth 18% 3% 1% 2% 2% 2% 2% 2%Procedures/Patient/Yr 1.03 1.03 1.03 1.03 1.03 1.03 1.03 1.03 0.0%Total Procedures 1,119 1,149 1,159 1,182 1,206 1,230 1,255 1,280 1.8%
StentsTotal Stenting Procedures 1,006 1,040 1,060 1,088 1,121 1,150 1,179 1,209 2.6%
% Angio w/Stent 90% 91% 91% 92% 93% 94% 94% 95%Stents/Procedure 1.52 1.55 1.58 1.59 1.60 1.61 1.62 1.63 0.9%Total Stents 1,529 1,611 1,675 1,729 1,794 1,852 1,910 1,971 3.5%
% of AnnualTotal Stent Revenue $3,186 $3,271 $3,224 $3,092 $3,002 $2,850 $2,751 $2,665 (3.4%)
Drug Eluting StentsDES Volume
J&J/Cordis 478 598 669 678 474 247 222 215 (18.0%)Boston Scientific/Taxus 644 797 777 797 695 445 393 377 (13.2%)Abbott/Zomaxx NM Xience 316 742 769 807 NM Conor 0 49 68 90 NM Medtronic 8 95 165 256 305 NM
Total Drug Eluting Stents 1,122 1,395 1,446 1,483 1,579 1,648 1,710 1,794 4.2%Total ( % of Stent Market) 73% 87% 86% 86% 88% 89% 90% 91%
DES Market ShareJ&J/Cordis 42.6% 42.9% 46.3% 45.7% 30.0% 15.0% 13.0% 12.0%Boston Scientific/Taxus 57.4% 57.1% 53.7% 53.7% 44.0% 27.0% 23.0% 21.0%Abbott/ZomaxxXience 20.0% 45.0% 45.0% 45.0%Conor 3.0% 4.0% 5.0%Medtronic 0.5% 6.0% 10.0% 15.0% 17.0%
DES PriceJ&J/Cordis $2.549 $2.169 $2.065 $1.915 $1.762 $1.603 $1.491 $1.386 (7.2%)Boston Scientific/Taxus 2.421 2.210 2.081 1.929 1.775 1.615 1.502 1.397 (7.4%)Abbott/Zomaxx 1.775 1.615 1.502 1.397Xience 1.775 1.615 1.502 1.397Conor 1.775 1.615 1.502 1.397Medtronic 1.870 1.721 1.566 1.456 1.354
Average $2.475 $2.193 $2.074 $1.922 $1.767 $1.608 $1.494 $1.388 (7.4%)
QoQ Change in DES PriceJ&J/Cordis (22.5%) (14.9%) (4.8%) (7.3%) (8.0%) (9.0%) (7.0%) (7.0%)Boston Scientific/Taxus (8.7%) (5.9%) (7.3%) (8.0%) (9.0%) (7.0%) (7.0%)Abbott/Zomaxx (9.0%) (7.0%) (7.0%)Xience (9.0%) (7.0%) (7.0%)Conor (9.0%) (7.0%) (7.0%)Medtronic (8.0%) (9.0%) (7.0%) (7.0%)
Average (24.7%) (11.4%) (5.4%) (7.3%) (8.0%) (9.0%) (7.1%) (7.1%)
DES RevenueJ&J/Cordis $1,219 $1,297 $1,381 $1,299 $834 $396 $331 $298 (23.9%)Boston Scientific/Taxus 1,558 1,762 1,617 1,537 1,233 719 591 526 (19.6%)Abbott/ZomaxxXience 560 1,198 1,156 1,127Conor 80 103 125Medtronic 14 163 258 373 413
Total DES Revenue $2,777 $3,059 $2,999 $2,850 $2,791 $2,650 $2,554 $2,490 (3.5%)
Source: Company data, Credit Suisse estimates.

Cardiology 30 October 2006
69
Exhibit 71: Rest of World (excluding Japan) Drug-Eluting Stent Market Forecast, 2004–11E US$ in millions, unless otherwise stated
CAGRFY 2004 FY 2005 FY 2006 FY 2007 FY 2008 FY 2009 FY 2010 FY 2011 2005-10
AngiographyPatients 1,170 1,217 1,268 1,326 1,332 1,399 1,468 1,542 3.8%
YoY Growth 4% 4% 4% 5% 5% 5% 5% 5%Procedures/Patient/Yr 1.03 1.03 1.03 1.03 1.03 1.03 1.03 1.03 0.0%Total Procedures 1,201 1,249 1,302 1,361 1,367 1,436 1,507 1,583 3.8%
StentsTotal Stenting Procedures 1,109 1,169 1,224 1,279 1,285 1,350 1,417 1,488 3.9%
% Angio w/Stent 92% 94% 94% 94% 94% 94% 94% 94%Stents/Procedure 1.51 1.60 1.60 1.60 1.60 1.60 1.60 1.60 0.0%Total Stents 1,675 1,870 1,958 2,047 2,056 2,159 2,267 2,381 3.9%Total Stent Revenue $1,739 $2,160 $2,308 $2,094 $1,916 $1,908 $1,884 $1,854 (2.7%)
Drug Eluting StentsDES Volume
J&J/Cordis 235 400 422 316 258 246 247 259 (9.2%)Boston Scientific/Taxus 335 492 556 445 299 304 339 356 (7.2%)Abbott/Zomaxx 6 14 10 0 0 0 0 0 (100.0%)Xience 27 378 611 651 694 728 NM Conor 72 77 81 NM Medtronic 7 36 185 155 163 174 185 194 NM
Total Drug Eluting Stents 583 941 1,200 1,295 1,357 1,447 1,542 1,619 10.4%Total ( % of Stent Market) 35% 50% 61% 63% 66% 67% 68% 68%
DES Market ShareJ&J/Cordis 40.3% 42.5% 35.1% 24.4% 19.0% 17.0% 16.0% 16.0%Boston Scientific/Taxus 57.4% 52.3% 46.3% 34.3% 22.0% 21.0% 22.0% 22.0%Abbott/Zomaxx 1.0% 1.5% 0.9% 0.0% 0.0% 0.0% 0.0% 0.0%Xience 2.3% 29.2% 45.0% 45.0% 45.0% 45.0%Conor 2.0% 5.0% 5.0% 5.0%Medtronic 1.2% 3.8% 15.4% 12.0% 12.0% 12.0% 12.0% 12.0%
DES PriceJ&J/Cordis $2.172 $1.948 $1.751 $1.437 $1.322 $1.216 $1.119 $1.030 (10.5%)Boston Scientific/Taxus 1.760 1.616 1.471 1.332 1.225 1.127 1.037 0.954 (8.5%)Abbott/Zomaxx 1.351 1.320 1.202 1.088 1.001 0.921 0.847 0.780 (8.5%)Xience 1.088 1.001 0.921 0.847 0.780 NM Conor 0.921 0.847 0.780 NM Medtronic 1.161 0.860 1.580 1.430 1.316 1.211 1.114 1.025 NM
Average $1.916 $1.757 $1.580 $1.300 $1.129 $1.049 $0.965 $0.887 (5.6%)
Change in DES PriceJ&J/Cordis (16.4%) (10.3%) (10.1%) (17.9%) (8.0%) (8.0%) (8.0%) (8.0%)Boston Scientific/Taxus (24.6%) (8.2%) (8.9%) (9.5%) (8.0%) (8.0%) (8.0%) (8.0%)Abbott/Zomaxx (8.9%) (9.5%) (8.0%) (8.0%) (8.0%) (8.0%)Xience (8.0%) (8.0%) (8.0%) (8.0%)Conor (8.0%) (8.0%) (8.0%)Medtronic (9.5%) (8.0%) (8.0%) (8.0%) (8.0%)
Average (25.6%) (8.3%) (10.1%) (17.7%) (13.1%) (7.1%) (8.1%) (8.0%)
DES RevenueJ&J/Cordis $507 $779 $743 $457 $341 $299 $276 $267 (18.7%)Boston Scientific/Taxus 586 794 816 594 366 343 352 340 (15.0%)Abbott/Zomaxx 8 18 12 0 0 0 0 0Xience 31 409 611 600 588 568 NM Conor 67 65 63 NM Medtronic 8 60 291 222 214 210 206 199 NM
Total DES Revenue $1,109 $1,651 $1,892 $1,682 $1,533 $1,518 $1,487 $1,436 (2.1%)
Source: Company data, Credit Suisse estimates.
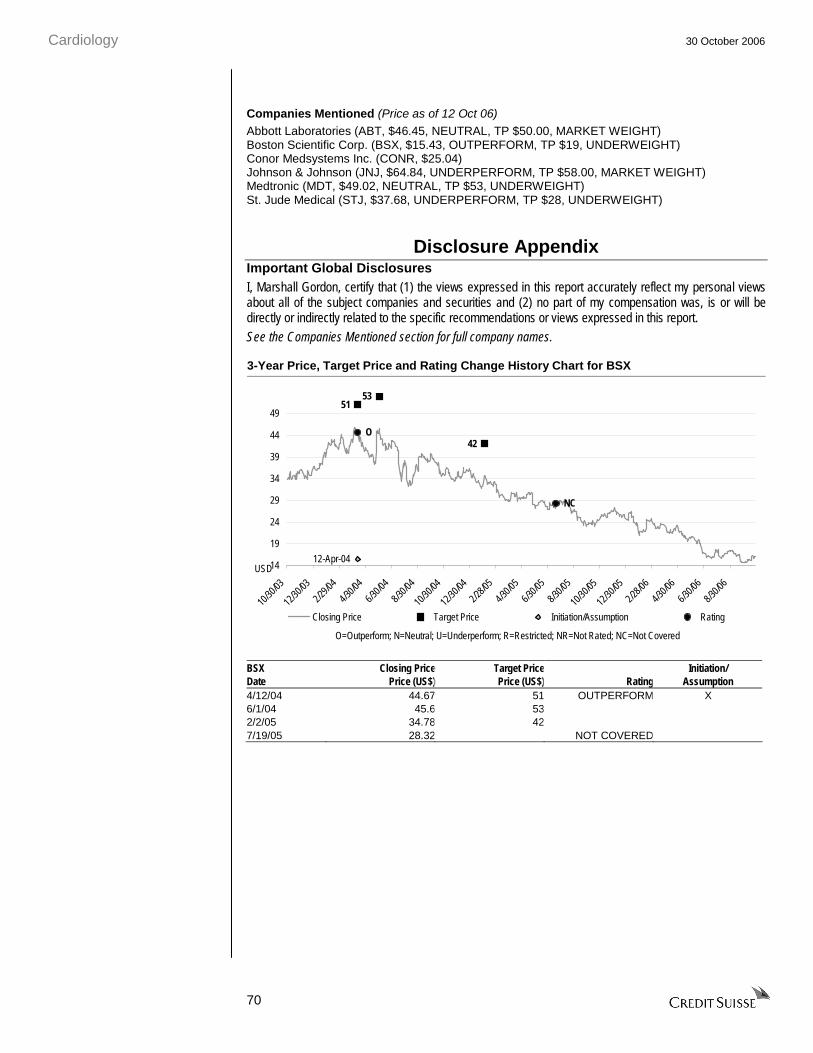
Cardiology 30 October 2006
70
Companies Mentioned (Price as of 12 Oct 06)
Abbott Laboratories (ABT, $46.45, NEUTRAL, TP $50.00, MARKET WEIGHT) Boston Scientific Corp. (BSX, $15.43, OUTPERFORM, TP $19, UNDERWEIGHT) Conor Medsystems Inc. (CONR, $25.04) Johnson & Johnson (JNJ, $64.84, UNDERPERFORM, TP $58.00, MARKET WEIGHT) Medtronic (MDT, $49.02, NEUTRAL, TP $53, UNDERWEIGHT) St. Jude Medical (STJ, $37.68, UNDERPERFORM, TP $28, UNDERWEIGHT)
Disclosure Appendix Important Global Disclosures I, Marshall Gordon, certify that (1) the views expressed in this report accurately reflect my personal views about all of the subject companies and securities and (2) no part of my compensation was, is or will be directly or indirectly related to the specific recommendations or views expressed in this report.
See the Companies Mentioned section for full company names.
3-Year Price, Target Price and Rating Change History Chart for BSX
53
42
12-Apr-04
51
O
NC
14
19
24
29
34
39
44
49
10/30
/03
12/30
/03
2/29/0
4
4/30/0
4
6/30/0
4
8/30/0
4
10/30
/04
12/30
/04
2/28/0
5
4/30/0
5
6/30/0
5
8/30/0
5
10/30
/05
12/30
/05
2/28/0
6
4/30/0
6
6/30/0
6
8/30/0
6
Closing Price Target Price Initiation/Assumption Rating
USD
O=Outperform; N=Neutral; U=Underperform; R=Restricted; NR=Not Rated; NC=Not Covered
BSX Closing Price Target Price Initiation/ Date Price (US$) Price (US$) Rating Assumption 4/12/04 44.67 51 OUTPERFORM X 6/1/04 45.6 53 2/2/05 34.78 42 7/19/05 28.32 NOT COVERED

Cardiology 30 October 2006
71
3-Year Price, Target Price and Rating Change History Chart for MDT
5758
12-Apr-04
62
O
N NC
42
44
46
48
50
52
54
56
58
60
62
10/30
/03
12/30
/03
2/29/0
4
4/30/0
4
6/30/0
4
8/30/0
4
10/30
/04
12/30
/04
2/28/0
5
4/30/0
5
6/30/0
5
8/30/0
5
10/30
/05
12/30
/05
2/28/0
6
4/30/0
6
6/30/0
6
8/30/0
6
Closing Price Target Price Initiation/Assumption Rating
USD
O=Outperform; N=Neutral; U=Underperform; R=Restricted; NR=Not Rated; NC=Not Covered
MDT Closing Price Target Price Initiation/ Date Price (US$) Price (US$) Rating Assumption 4/12/04 49.53 62 OUTPERFORM X 8/19/04 49.48 57 9/29/04 51.77 58 2/22/05 52.02 NEUTRAL 7/19/05 51.98 NOT COVERED
3-Year Price, Target Price and Rating Change History Chart for STJ
42
39.5 4042
45
12-Apr-04
38
41.5
O
N
NC
28
33
38
43
48
53
10/30
/03
12/30
/03
2/29/0
4
4/30/0
4
6/30/0
4
8/30/0
4
10/30
/04
12/30
/04
2/28/0
5
4/30/0
5
6/30/0
5
8/30/0
5
10/30
/05
12/30
/05
2/28/0
6
4/30/0
6
6/30/0
6
8/30/0
6
Closing Price Target Price Initiation/Assumption Rating
USD
O=Outperform; N=Neutral; U=Underperform; R=Restricted; NR=Not Rated; NC=Not Covered
STJ Closing Price Target Price Initiation/ Date Price (US$) Price (US$) Rating Assumption 4/12/04 37.4 41.5 NEUTRAL X 4/22/04 38.76 42 8/10/04 32.435 38 OUTPERFORM 9/29/04 37.75 39.5 11/23/04 38.27 40 11/29/04 38.46 42 2/11/05 40.4 45 7/19/05 43.75 NOT COVERED

Cardiology 30 October 2006
72
The analyst(s) responsible for preparing this research report received compensation that is based upon various factors including Credit Suisse's total revenues, a portion of which are generated by Credit Suisse's investment banking activities. Analysts’ stock ratings are defined as follows***: Outperform: The stock’s total return is expected to exceed the industry average* by at least 10-15% (or more, depending on perceived risk) over the next 12 months. Neutral: The stock’s total return is expected to be in line with the industry average* (range of ±10%) over the next 12 months. Underperform**: The stock’s total return is expected to underperform the industry average* by 10-15% or more over the next 12 months.
*The industry average refers to the average total return of the analyst's industry coverage universe (except with respect to Asia/Pacific, Latin America and Emerging Markets, where stock ratings are relative to the relevant country index, and Credit Suisse Small and Mid-Cap Advisor stocks, where stock ratings are relative to the regional Credit Suisse Small and Mid-Cap Advisor investment universe. **In an effort to achieve a more balanced distribution of stock ratings, the Firm has requested that analysts maintain at least 15% of their rated coverage universe as Underperform. This guideline is subject to change depending on several factors, including general market conditions. ***For Australian and New Zealand stocks a 7.5% threshold replaces the 10% level in all three rating definitions.
Restricted: In certain circumstances, Credit Suisse policy and/or applicable law and regulations preclude certain types of communications, including an investment recommendation, during the course of Credit Suisse's engagement in an investment banking transaction and in certain other circumstances. Volatility Indicator [V]: A stock is defined as volatile if the stock price has moved up or down by 20% or more in a month in at least 8 of the past 24 months or the analyst expects significant volatility going forward. All Credit Suisse Small and Mid-Cap Advisor stocks are automatically rated volatile. All IPO stocks are automatically rated volatile within the first 12 months of trading.
Analysts’ coverage universe weightings* are distinct from analysts’ stock ratings and are based on the expected performance of an analyst’s coverage universe** versus the relevant broad market benchmark***: Overweight: Industry expected to outperform the relevant broad market benchmark over the next 12 months. Market Weight: Industry expected to perform in-line with the relevant broad market benchmark over the next 12 months. Underweight: Industry expected to underperform the relevant broad market benchmark over the next 12 months. *Credit Suisse Small and Mid-Cap Advisor stocks do not have coverage universe weightings. **An analyst’s coverage universe consists of all companies covered by the analyst within the relevant sector. ***The broad market benchmark is based on the expected return of the local market index (e.g., the S&P 500 in the U.S.) over the next 12 months. Credit Suisse’s distribution of stock ratings (and banking clients) is:
Global Ratings Distribution Outperform/Buy* 40% (60% banking clients) Neutral/Hold* 43% (58% banking clients) Underperform/Sell* 15% (52% banking clients) Restricted 3%
*For purposes of the NYSE and NASD ratings distribution disclosure requirements, our stock ratings of Outperform, Neutral, and Underperform most closely correspond to Buy, Hold, and Sell, respectively; however, the meanings are not the same, as our stock ratings are determined on a relative basis. (Please refer to definitions above.) An investor's decision to buy or sell a security should be based on investment objectives, current holdings, and other individual factors.
Credit Suisse’s policy is to update research reports as it deems appropriate, based on developments with the subject company, the sector or the market that may have a material impact on the research views or opinions stated herein.
Credit Suisse's policy is only to publish investment research that is impartial, independent, clear, fair and not misleading. For more detail please refer to Credit Suisse's Policies for Managing Conflicts of Interest in connection with Investment Research: http://www.csfb.com/research-and-analytics/disclaimer/managing_conflicts_disclaimer.html
Cardiology 30 October 2006
73
Credit Suisse does not provide any tax advice. Any statement herein regarding any US federal tax is not intended or written to be used, and cannot be used, by any taxpayer for the purposes of avoiding any penalties.
See the Companies Mentioned section for full company names. Price Target: (12 months) for (BSX) Method: We set our 12-month price target for BSX of $19 using next 12 months (NTM) price to forward earnings (P/E) 12 months forward. We forecast NTM (second half of 2007 and first half of 2008) EPS of $1.02 (inclusive of option expense), and we apply an 19x P/E multiple. Our multiple is based on a 20x P/E multiple for the cardiology industry in our medical supplies and devices sector and a 10% discount of BSX relative to the multiple of the other companies due to the company’s operating and growth challenges. Our 20x multiple represents a 25% premium to the S&P 500, at the bottom of the 10-year historical range, given the growth challenges for the industry. Risks: Key risks to the achievement of our $19 target price for BSX are: (1) U.S. implantable cardioverter defibrillator (ICD) market volume continues to contract, (2) BSX issues additional recalls of its cardiac rhythm management (CRM) products, (3) BSX delays launch of drug-eluting stent (DES) products in 2007, (4) worse-than-expected deterioration of the global DES market, and (5) the company fails to realize integration synergies opportunities from its Guidant acquisition. Price Target: (12 months) for (MDT) Method: We set our 12-month price target for MDT of $53 using next 12 months (NTM) price to forward earnings (P/E) 12 months forward, applying a 20x P/E multiple to our fiscal 2008 EPS forecast of $2.61 (inclusive of option expense). Our multiple is based on a 20x P/E multiple for the cardiology industry of the medical supplies and devices sector, and MDT should trade near the multiple because of its benchmark status. Our cardiology industry multiple represents a 25% premium to the S&P 500 multiple, at the bottom of the industry’s 10-year historical range, given its growth challenges. Risks: Key risks to the achievement of our $53 target price for MDT are: (1) the U.S. implantable cardioverter defibrillator (ICD) market reaccelerates to meet analysts consensus expectations, (2) unforeseen upside for MDT’s spinal surgery and interventional cardiology franchises, and (3) MDT management uses restructuring and mergers and acquisition activity to raise EPS. Price Target: (12 months) for (STJ) Method: We set our 12-month price target for STJ of $28 using next 12 months (NTM) price to forward earnings (P/E) 12 months forward. We forecast NTM (second half 2007 to first half 2008) EPS of $1.54 (inclusive of option expense), and we apply an 18x P/E multiple. Our multiple is based on a 20x P/E multiple for the cardiology industry of the medical supplies and devices sector and a 10% discount of STJ relative to the multiple of the sector based on the company’s relatively weak competitive position in the cardiac rhythm management (CRM) market and undiversified business model. Our 20x cardiology industry multiple represents a 25% premium to the S&P 500 multiple, at the bottom of the sector’s 10-year historical range, given its growth challenges. Risks: Key risks to the achievement of our $28 target price for STJ are: (1) the U.S. implantable cardioverter defibrillator (ICD) market reaccelerates to meet analysts’ consensus expectations, (2) STJ gains meaningful market share with new sales hires, and (3) STJ is acquired for a 30-40% premium.
See the Companies Mentioned section for full company names. Credit Suisse expects to receive or intends to seek investment banking related compensation from the subject company (BSX, MDT, STJ) within the next 3 months. As of the date of this report, Credit Suisse Securities (USA) LLC makes a market in the securities of the subject company (BSX, MDT, STJ). Important Regional Disclosures The analyst(s) involved in the preparation of this report have not visited the material operations of the subject company (BSX, MDT, STJ) within the past 12 months.
Restrictions on certain Canadian securities are indicated by the following abbreviations: NVS--Non-Voting shares; RVS--Restricted Voting Shares; SVS--Subordinate Voting Shares. Individuals receiving this report from a Canadian investment dealer that is not affiliated with Credit Suisse should be advised that this report may not contain regulatory disclosures the non-affiliated Canadian investment dealer would be required to make if this were its own report. For Credit Suisse Securities (Canada), Inc.'s policies and procedures regarding the dissemination of equity research, please visit http://www.csfb.com/legal_terms/canada_research_policy.shtml.
As of the date of this report, Credit Suisse acts as a market maker or liquidity provider in the equities securities that are the subject of this report.

Cardiology 30 October 2006
74
CS may have issued a Trade Alert regarding this security. Trade Alerts are short term trading opportunities identified by an analyst on the basis of market events and catalysts, while stock ratings reflect an analyst's investment recommendations based on expected total return over a 12-month period relative to the relevant coverage universe. Because Trade Alerts and stock ratings reflect different assumptions and analytical methods, Trade Alerts may differ directionally from the analyst's stock rating. The author(s) of this report maintains a CS Model Portfolio that he/she regularly adjusts. The security or securities discussed in this report may be a component of the CS Model Portfolio and subject to such adjustments (which, given the composition of the CS Model Portfolio as a whole, may differ from the recommendation in this report, as well as opportunities or strategies identified in Trading Alerts concerning the same security). The CS Model Portfolio and important disclosures about it are available at www.credit-suisse.com/ti. For disclosure information on other companies mentioned in this report, please visit the website at www.credit-suisse.com/researchdisclosures or call +1 (877) 291-2683. Disclaimers continue on next page.

HS0291.doc
Disclaimers
References in this report to Credit Suisse or CS include all of the subsidiaries and affiliates of Credit Suisse, a Swiss bank, operating under its investment banking division. For more information on our structure, please follow the below link: http://www.credit-suisse.com/who_we_are/en/structure.html. This report is not directed to, or intended for distribution to or use by, any person or entity who is a citizen or resident of or located in any locality, state, country or other jurisdiction where such distribution, publication, availability or use would be contrary to law or regulation or which would subject Credit Suisse, the Swiss bank, or its subsidiaries or its affiliates (“CS”) to any registration or licensing requirement within such jurisdiction. All material presented in this report, unless specifically indicated otherwise, is under copyright to CS. None of the material, nor its content, nor any copy of it, may be altered in any way, transmitted to, copied or distributed to any other party, without the prior express written permission of CS. All trademarks, service marks and logos used in this report are trademarks or service marks or registered trademarks or service marks of CS or its affiliates. The information, tools and material presented in this report are provided to you for information purposes only and are not to be used or considered as an offer or the solicitation of an offer to sell or to buy or subscribe for securities or other financial instruments. CS may not have taken any steps to ensure that the securities referred to in this report are suitable for any particular investor. CS will not treat recipients as its customers by virtue of their receiving the report. The investments or services contained or referred to in this report may not be suitable for you and it is recommended that you consult an independent investment advisor if you are in doubt about such investments or investment services. Nothing in this report constitutes investment, legal, accounting or tax advice or a representation that any investment or strategy is suitable or appropriate to your individual circumstances or otherwise constitutes a personal recommendation to you. CS does not offer advice on the tax consequences of investment and you are advised to contact an independent tax adviser. Please note in particular that the bases and levels of taxation may change. CS believes the information and opinions in the Disclosure Appendix of this report are accurate and complete. Information and opinions presented in the other sections of the report were obtained or derived from sources CS believes are reliable, but CS makes no representations as to their accuracy or completeness. Additional information is available upon request. CS accepts no liability for loss arising from the use of the material presented in this report, except that this exclusion of liability does not apply to the extent that liability arises under specific statutes or regulations applicable to CS. This report is not to be relied upon in substitution for the exercise of independent judgment. CS may have issued, and may in the future issue, a trading call regarding this security. Trading calls are short term trading opportunities based on market events and catalysts, while stock ratings reflect investment recommendations based on expected total return over a 12-month period relative to the relevant coverage universe. Because trading calls and stock ratings reflect different assumptions and analytical methods, trading calls may differ directionally from the stock rating. In addition, CS may have issued, and may in the future issue, other reports that are inconsistent with, and reach different conclusions from, the information presented in this report. Those reports reflect the different assumptions, views and analytical methods of the analysts who prepared them and CS is under no obligation to ensure that such other reports are brought to the attention of any recipient of this report. CS is involved in many businesses that relate to companies mentioned in this report. These businesses include specialized trading, risk arbitrage, market making, and other proprietary trading. Past performance should not be taken as an indication or guarantee of future performance, and no representation or warranty, express or implied, is made regarding future performance. Information, opinions and estimates contained in this report reflect a judgement at its original date of publication by CS and are subject to change without notice. The price, value of and income from any of the securities or financial instruments mentioned in this report can fall as well as rise. The value of securities and financial instruments is subject to exchange rate fluctuation that may have a positive or adverse effect on the price or income of such securities or financial instruments. Investors in securities such as ADR’s, the values of which are influenced by currency volatility, effectively assume this risk. Structured securities are complex instruments, typically involve a high degree of risk and are intended for sale only to sophisticated investors who are capable of understanding and assuming the risks involved. The market value of any structured security may be affected by changes in economic, financial and political factors (including, but not limited to, spot and forward interest and exchange rates), time to maturity, market conditions and volatility, and the credit quality of any issuer or reference issuer. Any investor interested in purchasing a structured product should conduct their own investigation and analysis of the product and consult with their own professional advisers as to the risks involved in making such a purchase. Some investments discussed in this report have a high level of volatility. High volatility investments may experience sudden and large falls in their value causing losses when that investment is realised. Those losses may equal your original investment. Indeed, in the case of some investments the potential losses may exceed the amount of initial investment, in such circumstances you may be required to pay more money to support those losses. Income yields from investments may fluctuate and, in consequence, initial capital paid to make the investment may be used as part of that income yield. Some investments may not be readily realisable and it may be difficult to sell or realise those investments, similarly it may prove difficult for you to obtain reliable information about the value, or risks, to which such an investment is exposed. This report may provide the addresses of, or contain hyperlinks to, websites. Except to the extent to which the report refers to website material of CS, CS has not reviewed the linked site and takes no responsibility for the content contained therein. Such address or hyperlink (including addresses or hyperlinks to CS’s own website material) is provided solely for your convenience and information and the content of the linked site does not in any way form part of this document. Accessing such website or following such link through this report or CS’s website shall be at your own risk. This report is issued and distributed in Europe (except Switzerland) by Credit Suisse Securities (Europe) Limited, One Cabot Square, London E14 4QJ, England, which is regulated in the United Kingdom by The Financial Services Authority (“FSA”). This report is being distributed in Germany by Credit Suisse Securities (Europe) Limited Niederlassung Frankfurt am Main regulated by the Bundesanstalt fuer Finanzdienstleistungsaufsicht ("BaFin"). This report is being distributed in the United States by Credit Suisse Securities (USA) LLC ; in Switzerland by Credit Suisse; in Canada by Credit Suisse Securities (Canada), Inc..; in Brazil by Banco de Investimentos Credit Suisse (Brasil) S.A.; in Japan by Credit Suisse Securities (Japan) Limited; elsewhere in Asia/Pacific by whichever of the following is the appropriately authorised entity in the relevant jurisdiction: Credit Suisse (Hong Kong) Limited, Credit Suisse Equities (Australia) Limited , Credit Suisse Securities (Thailand) Limited, Credit Suisse Securities (Malaysia) Sdn Bhd, Credit Suisse Singapore Branch and elsewhere in the world by the relevant authorised affiliate of the above. Research on Taiwanese securities produced by Credit Suisse Taipei Branch has been prepared by a registered Senior Business Person. Research provided to residents of Malaysia is authorised by the Head of Research for Credit Suisse Securities (Malaysia) Sdn. Bhd., to whom they should direct any queries on +603 2723 2020. In jurisdictions where CS is not already registered or licensed to trade in securities, transactions will only be effected in accordance with applicable securities legislation, which will vary from jurisdiction to jurisdiction and may require that the trade be made in accordance with applicable exemptions from registration or licensing requirements. Non-U.S. customers wishing to effect a transaction should contact a CS entity in their local jurisdiction unless governing law permits otherwise. U.S. customers wishing to effect a transaction should do so only by contacting a representative at Credit Suisse Securities (USA) LLC in the U.S. Please note that this report was originally prepared and issued by CS for distribution to their market professional and institutional investor customers. Recipients who are not market professional or institutional investor customers of CS should seek the advice of their independent financial advisor prior to taking any investment decision based on this report or for any necessary explanation of its contents. This research may relate to investments or services of a person outside of the UK or to other matters which are not regulated by the FSA or in respect of which the protections of the FSA for private customers and/or the UK compensation scheme may not be available, and further details as to where this may be the case are available upon request in respect of this report. Any Nielsen Media Research material contained in this report represents Nielsen Media Research's estimates and does not represent facts. NMR has neither reviewed nor approved this report and/or any of the statements made herein. Copyright 2006 CREDIT SUISSE and/or its affiliates. All rights reserved.
ASIA/PACIFIC: +852 2101-6000 EUROPE: +44 (20) 7888-8888 UNITED STATES OF AMERICA: +1 (212) 325-2000

OUTSIDE RESEARCHThe attached third party research report is being provided to you courtesy of Raymond James & Associates solelyfor informative purposes. Any person receiving this report from Raymond James & Associates and/or its affiliatesshould direct all questions and requests for additional information to their Financial Advisor and may not contactany analyst or representative of the third party research provider. Neither Raymond James & Associates nor anythird party research provider is responsible for any action or inaction you may take as a result of reviewing thisreport or for the consequences of said action or inaction.
ADDITIONAL DISCLOSUREComplete risk and disclosure information for those companies which Raymond James & Associates also providesresearch coverage is available at www.rjcapitalmarkets.com/SearchForDisclosures_main.asp.
RJA expects to receive or intends to seek compensation for investment banking services from the subjectcompanies in the next three months.
All information current as of 11/2/2006
The Raymond James Financial Center880 Carillon Parkway
P.O. Box 12749St. Petersburg, FL 33733-2749