equity release contracts with varying payments
TRANSCRIPT

552 Prague Economic Papers, 2021, 30 (5), 552–574, https://doi.org/10.18267/j.pep.784
EQUIT Y RELEASE CONTR AC TS WITH VARYING PAYMENTS
Agnieszka Marciniuka
Abstract1 Equity release contracts allow property owners to receive a financial benefit in exchange for surrendering their real estate to a company. The benefits depend on the life expectancy of owners, the real value of properties, and the rate of interest. These parameters are not the same throughout the years. The aim of the paper is to analyse varying payments of equity release contracts which have already been offered to customers for several years in Poland. A recalculation procedure year by year is proposed applying the actuarial and financial methods. This paper estimates the potential advantages of reverse annuity and reverse mortgage contracts in a changing economic environment. The calculations were made based on actual Polish market data, including the Svensson model of spot interest rate. It is shown that there is considerable scope for increasing retirement income; however, the exact amounts may be unknown. The advantages for customers resulting from changes in parameters and valorization are shown, as well as the risk associated with equity release.
Keywords: Equity release contracts, reverse annuity contract, reverse mortgage, valori-zation rate, spot interest rate, Svensson model JEL Classification: C50, C60, G17, G22, I13, J10
1. Introduction and Motivation
Demographic changes have been observed all over the world for decades. Life expectancy is increasing. People live much longer, and the European population is ageing. This is caused by the huge development and progress in medicine, and by the growing awareness in society of proper nutrition and healthy lifestyles. The growth of the elderly people’s dependency ratio leads to an excessive burden of social expenditure placed on the working-age population. The social insurance pensions are meagre, and they may be insufficient for the elderly to live through their old age with dignity. All these factors
a Wroclaw University of Economics and Business, Faculty of Economics and Finance, Wroclaw, Poland
Email: [email protected]

Prague Economic Papers, 2021, 30 (5), 552–574, https://doi.org/10.18267/j.pep.784 553
strongly suggest that in the future, the pension funding gap will be a key social issue in many countries; therefore, the possibility of obtaining additional financial resources for older people is a very important matter.
Many people have their own properties (flats or houses). Most of them do not want to sell their properties and move from their home. Therefore, markets in different countries propose so-called equity release products for the retired (Hanewald et al., 2016). The market for this product is growing, which reflects the ageing of the population (Blake et al., 2013). Since 2005, public awareness has also been growing in respect of this issue. Many more people have become familiar with the idea of funding the costs of old age by drawing on equity in housing (Marciniuk et al., 2020). Different varieties of these products exist in many countries (e.g., Spain, Ireland, France, Germany, Italy and Poland); however, the UK market, where such contracts were introduced in the early 1990s, is still the largest European market for equity release contracts (Shao et al., 2015).
In the literature, the practical aspect and valuation of equity release contracts are widely discussed. Two main types of these products are distinguished: the loan model (reverse mortgage scheme) and the sale model (home reversion scheme) (Shao et al., 2015). The valuation of equity release contracts is well specified, especially in the case of the loan model. Lee et al. (2012) propose a specific analytical valuation framework with mortality risk, interest rate risk and housing price risk. The pricing of a reverse mortgage without redemption right was studied by Ma et al. (2017). The authors used a jump-diffusion process to represent the housing price dynamics, the Vasicek model to drive the instantaneous interest rate, and the force mortality model to describe the longevity risk. Dowd et al. (2019) considered the valuation process for a non-negative equity guarantee in a reverse mortgage scheme and a loan model with such a guarantee.
It could occur that the total loan amount exceeds the real value of a property. A well-known example is the case of Jeanne Calment in France, the world’s longest-living woman, whose lawyer offered her a kind of equity release contract when she was already 90 years old. She outlived her lawyer, whose heirs continued to pay the annuity until her death in 1997 at the age of 122. The total annuity payments were more than twice the property’s value (Whitney, 1997). Kolbe and Zagst (2010) described a consistent valuation framework for reverse mortgages based on reduced-form intensity models as used in the developed credit risk modelling. The authors calculated the probability that the total loan amount exceeds the house value at the termination of the contract. They derived the amount of the maximum payment which can be made to the homeowner under certain constraints.
Until recently, the equity release contract was available to individuals. Married life annuities or insurance for married couples were analysed by Dębicka and Marciniuk

Prague Economic Papers, 2021, 30 (5), 552–574, https://doi.org/10.18267/j.pep.784554
(2014), Marciniuk (2017a), and Marciniuk and Zimkova (2018). The Markov chain and copulas were used to model the structure of the dependence between the future life of spouses (Heilpern, 2014; Luciano et al., 2016; Dębicka et al., 2020). In Marciniuk (2017b), the reverse annuity was applied to derive two lemmas used to determine marriage benefits payable more than once a year, especially in the Last Surviving Status and Joint Life Status.
The benefit of equity release depends on the owner’s age, their future lifespan and the real value of their properties, which, in turn, is determined by the place where the owner lives. The literature considers the risk of changes in real estate value or the time-dependent interest rate in the current year, but the benefits are constant (Marciniuk, 2017b). A lower interest rate means a lesser equity release payment. The place of residence determines the value of the property as well as the amounts paid out. The change of spot interest rate is used in the analysis of insurance benefits (Gubalova et al., 2017) and life annuity (Charupat et al., 2016), but not in the case of equity release contracts. Kowalczyk-Rólczyńska (2020) specified the frequency of payments and the indexation rate designated at the beginning of the home reversal model contract only for the reverse annuity contract taking into account just the indexed factor, and also calculated a fixed benefit. These changes are taken into account statically just at the beginning of the benefit contract.
The interest rate, the real value of the property and future life expectancy are con- tinuously changing; hence, the benefit of equity release contracts should also be valuated and indexed. Thus, this article aims to determine and analyse the potential advantages of individual equity release contracts with varying payments using the Svensson model of interest rate, considering the change of different parameters based on real-life Polish data. This article mainly covers dynamic changes, i.e., how the benefit payments for the specific person change each year of the contract term. In addition, the valuation model is extended to the second contract – a reverse mortgage. A recalculation procedure year by year is proposed, applying the actuarial and financial methods.
The structure of the paper is as follows. After this introductory section, Sections 2 and 3 set out the methodological approach and the data. Section 4 contains the empirical results and other findings. Section 5 provides the conclusions and final remarks.
2. Methodology
Two main types of equity release products exist in Poland: the loan model and the sale model. In the loan model (reverse mortgage scheme), the buyer takes out a loan, using the property as security. The right to the property passes to the buyer 12 months after the death of the owner. Furthermore, the heirs can buy the property in this time. This is
Prague Economic Papers, 2021, 30 (5), 552–574, https://doi.org/10.18267/j.pep.784 555
a reverse mortgage contract, in which the benefit is paid out for n years. In the sale model (home reversion scheme), the buyer exchanges the property for the promise of a certain sum at regular intervals until the buyer dies. The transfer of the ownership to the company takes place after the signing of the notarial act. This is a reverse annuity contract, in which the benefit is paid out for the whole lifetime.
Primarily, to calculate the benefits of the reverse mortgage, the contract must specify the following points (Reverse Mortgage Act, 2014):
the age of the property’s owner x, the real value of the estate W and reduction factor α (α ∊ (0%, 100%]), the date, frequency (m,m > 0) and method of benefit payments, the interest rate and the way of its determination, the conditions of interest rate changes.
In turn, the reverse annuity contract should determine the benefit indexation method, for example, by using the consumer price index or another constant interest rate.
The interest rate, the real value of the estate, the consumer price index and the future life expectancy are continuously changing; hence, the payment of equity release contracts requires changes and valorization.
2.1. Determination of benefit payments
In general, the benefit b is determined using the equivalent principal from the following equation (Bowers et al., 1986, Hardy et al., 2019):
E (α × W) = E(b × Z) , (1)
where Z means the discounted value of all future payments.
Thus
Wb
E Z
. (2)
It is necessary to determine E(Z). The expected value of Z is specified in different variants. In the traditional variant, a yearly benefit is paid in the constant amount of 1 monetary
unit at the beginning of a year as long as the beneficiary is alive. Then the expected value of all future benefits Z is designated as an actuarial value of individual whole-life annuity as follows (Bowers et al., 1986):
0( ) k
x k xk
E Z a v p
, (3)

Prague Economic Papers, 2021, 30 (5), 552–574, https://doi.org/10.18267/j.pep.784556
where v is the yearly discounting factor and k px is the probability that the person at age x is alive at least k years.
In cases where the benefit is paid m (m > 0) times yearly in the constant amount of 1 / m financial at the beginning of a sub-period of a year as long as the beneficiary is alive, the E(Z) is calculated using an actuarial value of whole-life annuity for a person at age x as follows:
0( )
km m
x k m xk
E Z a v p
, (4)
where k/m px is the probability that the beneficiary at age x is alive at least k sub-periods of a year.
To offset the effect of inflation on the annuity, the amount is increased using the va- lorization rate q(q ≥ 0) . It assumes a geometrical increase in the annuity (cf. Kellison, 1991; Burnecki et al., 2002; Dickson et al., 2019). In this case, the expected value of all future benefits Z is equal to the actuarial value of the individual whole-life annuity increasing in geometric progression, which is determined by the following formulas
0
( ) 1 k kx k x
kE Z Ia q v p
. (5)
By analogy, the expected value of all future benefits paid, is specified using the ac- tuarial value of term-of-life annuity, respectively
the yearly benefit in the constant amount 1
: |0
( )n
kx n k x
kE Z a v p
, (6)
the periodically benefit in the constant amount
1
: |0
km nm m
x n k m xk
a v p
, (7)
the yearly increasing benefit
1
: |0
( ) 1n
k kx n k x
kE Z Ia q v p
. (8)
Formulas (3), (4) and (5) are connected with the reverse annuity contract, and the others with the reverse mortgage.
It is obvious that benefit payments are calculated at the beginning of the contract, so the valorization rate is set at the moment t = 0. However, different parameters change and consequently the recalculation is possible, but only for the reverse mortgage, in line with Polish regulations.

Prague Economic Papers, 2021, 30 (5), 552–574, https://doi.org/10.18267/j.pep.784 557
Shown below is a proposition of benefit payment recalculation. For this purpose, the financial methods of loan repayment are used (Kellison, 1991). Let b̈ : |x n mean yearly reverse mortgage benefit, which is paid at the beginning of a year. The discounting factor from the time t to the moment t is denoted by vt,T .
The recurrent benefit recalculation procedure is as follows:
moment t = 0 1
0,: | : |1: |
, 1n
k k xx n x nkx n
Wb a v pa
moment t = 1
120,1: |
1, 1 11: 1| 1: 1|11: 1
, 1n
x nk k xx n x n
kx n
W b vb a v p
a
moment t = 2
1 130,1 1,2: | 1: 1|
2, 2 22: 2| 2: 2|12: 2|
, 1nx n x n
k k xx n x nkx n
W b v b vb a v p
a
, …, etc.
moment t = n –1 1 11
1 1, 1 , 1: |
001:1| 1:1|
1:1|
, 1
n nn
k k k kx k n kkk z k
x n x nx n
W v b vb a
a
, …, etc.
Hence the following lemma:
Lemma 1The -term yearly reverse mortgage benefit for a person at age x, which pays one financial unit at the beginning of a year, is calculated at the moment t (t = 0, 1, 2, ..., n – 1)
: |: |
x nx n
Wba
, for t = 0, (9)
1 111 1, 1 , 1: |
00: |
: |
t tt
k k k kx k n kkk z k
x t n tx t n t
W v b vb
a
, for t = 1, 2, ..., n – 1 , (10)
where : |x t n ta
is an actuarial value of term-of-life annuity, which is determined at the moment (t = 0, 1, 2, ..., n – 1) using the following formula:
z, z +1
z, z +1

Prague Economic Papers, 2021, 30 (5), 552–574, https://doi.org/10.18267/j.pep.784558
1
,: |1
1n t
t k t k x tx t n tk
a v p
. (11)
Proof:It is easy to prove Lemma 1 recursively. Let us assume that Equation (11) is correct for t = s (s = 1, 2, ..., n – 2) . Moreover, K(s) means capital at the moment s.
At the moment t = s + 1, the amount is calculated as follows:
1 1, 1 , 1: | : | : | : |
1: 1|1: 1| 1: 1| 1: 1|
( )( 1) s s s sx s n s x s n s x s n s x s n s
x s n sx s n s x s n s x s n s
K s b v b a b vK sba a a
.
From Equation (10) for t = s (s = 1, 2, ..., n – 2) it is known that1 11
1 1, 1 , 1: | : | : |
00
s ss
k k z zx s n s x s n s x k n kkk z k
b a W v b v
.
Hence
1, 1: | : | : |
1: 1|1: 1|
1 111 1 1, 1 , 1 , 1: | : |
00
1: 1|
1, 1
0
s sx s n s x s n s x s n s
x s n sx s n s
s ss
k k z z s sx k n k x s n skk z k
x s n s
s
k k xk
b a b vb
a
W v b v b v
a
W v b
1, 1: | : |
0
1: 1|
,
ss
z zk n k x s n sk z k
x s n s
v b
a
which ends the proof.
The application of Lemma 1 gives the possibility to recalculate the reverse mortgage benefit with the rate of interest, the real value of the probability and the survival probability change, presented in a numerical part of this article. Theoretically, but not practised on the Polish market, the same procedure could be used to recalculate the benefit of a reverse annuity contract. In that case, only the valorization interest rate could be changed.
2.2 Interest rate
To calculate the benefit, the rate of interest i or the discounting factor v = (1 + i)–1 is necessary. In the traditional actuarial literature, it is assumed that the interest rate is fixed
Prague Economic Papers, 2021, 30 (5), 552–574, https://doi.org/10.18267/j.pep.784 559
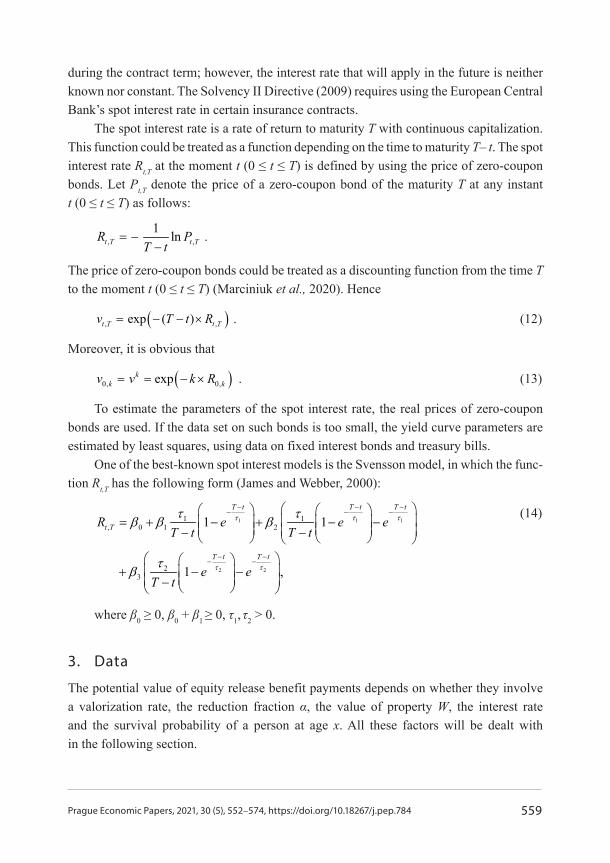
during the contract term; however, the interest rate that will apply in the future is neither known nor constant. The Solvency II Directive (2009) requires using the European Central Bank’s spot interest rate in certain insurance contracts.
The spot interest rate is a rate of return to maturity T with continuous capitalization. This function could be treated as a function depending on the time to maturity T– t. The spot interest rate Rt,T at the moment t (0 ≤ t ≤ T) is defined by using the price of zero-coupon bonds. Let Pt,T denote the price of a zero-coupon bond of the maturity T at any instant t (0 ≤ t ≤ T) as follows:
, ,1 lnt T t TR P
T t
.
The price of zero-coupon bonds could be treated as a discounting function from the time Tto the moment t (0 ≤ t ≤ T) (Marciniuk et al., 2020). Hence
, ,exp ( )t T t Tv T t R . (12)
Moreover, it is obvious that
0, 0,expkk kv v k R . (13)
To estimate the parameters of the spot interest rate, the real prices of zero-coupon bonds are used. If the data set on such bonds is too small, the yield curve parameters are estimated by least squares, using data on fixed interest bonds and treasury bills.
One of the best-known spot interest models is the Svensson model, in which the func- tion Rt,T has the following form (James and Webber, 2000):
1 1 1
2 2
1 1, 0 1 2
23
1 1
1 ,
T t T t T t
t T
T t T t
R e e eT t T t
e eT t
(14)
where β0 ≥ 0, β0 + β1 ≥ 0, τ1, τ2 > 0.
3. Data
The potential value of equity release benefit payments depends on whether they involve a valorization rate, the reduction fraction α, the value of property W, the interest rate and the survival probability of a person at age x. All these factors will be dealt with in the following section.

Prague Economic Papers, 2021, 30 (5), 552–574, https://doi.org/10.18267/j.pep.784560
The numerical calculations are based on the period 2009 –2019. The real interest rate function for the Svensson model, which depends on time, is available from the European Central Bank. The market value of property in years is taken from the Polish primary1 and secondary2 market. The life tables and the consumer price index are from Statistics Poland.
3.1 Spot interest rate
The parameters of the function Rt,T can be estimated by least squares, using real market data related to the yield to maturity on zero-coupon and fixed-interest bonds for each country of the euro area. The best-fitting model of spot interest for the euro area real data follows the European Central Bank3. The functions Rt,T for 2009–2018, determined by Equation (14), are shown in Figure 1. The parameters of Rt,T are presented in Table 1.
Figure 1: Spot interest rate in 2009–2018
Source: Own research on the basis on https://www.ecb.europa.eu/
One can observe a decrease in the interest rate during the considered period. If the rate of interest is lower, the benefit payments of equity release decrease. These changes could be unprofitable for customers. The epidemiological situation in 2020 caused an even greater plunge in the interest rate; therefore, the considerations only refer to earlier years.
1 https://stat.gov.pl/obszary-tematyczne/przemysl-budownictwo-srodki-trwale/budownictwo/cena-1-m2-powierzchni-uzytkowej-budynku-mieszkalnego-oddanego-do-uzytkowania,8,1.html
2 https://businessinsider.com.pl/finanse/ceny-mieszkan-w-polsce/jhk5r2j3 https://www.ecb.europa.eu/stats/financial_markets_and_interest_rates/euro_area_yield_curves/
html/index.en.html
43.5
32.5
21.5
1–0.5
–00.5
1
R(0
,T)
0 1 2 3 4 5 6 7 8 9 10
time to maturity T in year

Prague Economic Papers, 2021, 30 (5), 552–574, https://doi.org/10.18267/j.pep.784 561
Table 1: Parameters of spot interest rate
Parameters
Time β0
β1
β2
β3
τ1
τ2
2 January 2009 0.108792 1.611718 10.426767 –0.958181 12.040810 0.750536
4 January 2010 3.519283 –3.068811 7.034122 –0.906928 7.850378 0.270181
3 January 2011 3.314164 –2.813316 9.800351 –7.871491 4.080560 2.368589
2 January 2012 3.223000 –3.213000 6.369753 –5.830986 3.629880 2.119828
2 January 2013 1.357593 –1.268692 24.725118 –21.803698 5.570258 4.253324
2 January 2014 2.487967 –2.363560 23.809434 –22.473467 4.562237 3.744783
2 January 2015 0.515507 0.505507 23.514243 –21.737949 7.218427 6.016489
4 January 2016 2.142562 –2.649562 19.953238 –24.067787 1.656860 1.814525
2 January 2017 1.450341 –2.274341 11.885632 –16.084991 1.336620 1.574650
2 January 2018 1.816761 –2.566761 23.674568 –27.225068 1.861103 1.933418
2 January 2019 1.221214 –1.807831 11.656415 –14.777648 1.847354 1.929795
Source: Own research on the basis on https://www.ecb.europa.eu/
3.2 Market value of real estate in Poland
To calculate the amounts of equity release, the real value of the real estate is necessary. Statistics Poland provides only average prices per square metre on flats. Figure 2 presents these euro prices in the first quarter of each of the years from 2008 to 2019. However, the price per square metre of a flat depends on the location. More such data are available from the secondary market, which shows large differences in property prices. Several Polish cities were selected. Figure 3 shows the price per square metre of housing in euros in these cities in December 2018 in relation to the average price of a flat in Poland. These prices are similar to those on the real primary market in these places.
Figure 3 shows that the real costs of buying a flat could be even twice as high as those indicated by the data on average housing prices in Poland, which has a significant impact on the amount of the equity release benefit payments. Unfortunately, the secondary market data in the analysed period were not available from the same source. Moreover, the study concerned the general view on benefit payments and their changes, and the analysis was based only on the average housing prices in Poland.

Prague Economic Papers, 2021, 30 (5), 552–574, https://doi.org/10.18267/j.pep.784562
Figure 2: Average price per square metre of a flat in euros in first quarter during
2008–2019
Source: Own research on the basis on https://stat.gov.pl/
Figure 3: Price per square metre of a flat in euros in December 2018
Source: Own research on the basis on https://businessinsider.com.pl/finanse/ceny–mieszkan–w–polsce/jhk5r2j
3.3 Future life expectancy in Poland
From the mid–twentieth century, a considerable increase in life expectancy has been observed. The length of future life expectancy has stabilized in the last ten years, which can
0
200
400
600
800
1000
1200
2008 2009 2010 2011 2012 2013 2014 2015 2016 2017 2018 2019
year
aver
age
pric
e pe
rsqu
are
met
re
of a
flat
0
500
000
500
000
500
1,200
1,000
800
400
200
0
2,500
2,000
1,500
1,000
500
0

Prague Economic Papers, 2021, 30 (5), 552–574, https://doi.org/10.18267/j.pep.784 563
be seen in Figure 4. For the elderly, the life expectancy increased by about one year during this time. The increase in the expected life expectancy causes an increase in the annuity actuarial value, which reduces the value of equity release benefit payments.
Figure 4: Future life expectancy in 2009–2018
Source: Own research on the basis on https://stat.gov.pl/
All the described components affect the value of benefit payments. Various numerical examples are presented in the next section to investigate what most influences the amount of the benefits and how.
4. Numerical Results and Findings
This section presents numerical examples using the market data presented above. The annual benefit payments of equity release in euros were calculated for a range of circumstances, using own programs written in MATLAB. It is assumed in all examples that α = 50%.
Let x denote the person’s age and the real value of property W be 166,296 euros. This is a real price of a hundred-square-metre flat in Wrocław. The parameters of the Svensson model for 2 January 2019 are taken from Table 1. Table 2 reveals the annual payments from a reverse annuity contract separately for men and women for different x ∊ {60, 65, 70, 75, 80, 85} and a valorization rate q ∊ {0%, 2%, 5%, 10%} at moment t = 0.
man at 60 man at 75 woman at 60 woman at 75
17.9 18.3 18.5 18.6 18.7 19.2 19.0 19.3 19.2 19.1
9.2 9.5 9.7 9.7 9.8 10.1 10.0 10.3 10.2 10.2
23.2 23.5 23.8 23.8 23,9 24.3 24.1 24.5 24.3 24.2
11.6 11.9 12.1 12.2 12.3 12.6 12.6 12.8 12.8 12.7
5
10
15
20
25
30
2009 2010 2011 2012 2013 2014 2015 2016 2017 2018year
life
expe
ctan
cy

Prague Economic Papers, 2021, 30 (5), 552–574, https://doi.org/10.18267/j.pep.784564
Table 2: Annual benefit of reverse annuity contract for property valued at 166,296 euros
q = 0% q = 2% q = 5% q = 10%
Man Woman Man Woman Man Woman Man Woman
60 4,494.1 3,643.9 3,556.6 2,781.6 2,389.3 1,759.1 1,082.4 715.2
65 5,311.3 4,278.8 4,352.2 3,401.1 3,118.1 2,317.4 1,642.1 1,103.1
70 6,385.2 5,170.8 5,408.5 4,273.9 4,113.2 3,123.6 2,432.3 1,720.3
75 7,923.4 6,485.4 6,924.5 5,564.2 5,562.9 4,340.4 3,685.6 2,729.2
80 10,147.0 8,554.5 9,125.3 7,598.5 7,700.1 6,288.0 5,634.5 4,446.3
85 13,214.0 11,663.0 12,193.0 10,685.0 10,743.0 9,310.7 8,562.8 7,280.3
Source: Own research
It can be observed that men receive higher benefit payments, because they live shorter than women. The annuity decreases as the valorization rate q rises. For the youngest people, the payment when q = 10% is over four (for a man) and five times (for a woman) higher than for when q = 0. These differences are so huge only in the early years of the contract. When q = 0, the benefit is paid in the same amount for the entire time of the contract. How-ever, for the other q > 0 the valorised benefits increase exponentially with the rising t.These valorised annual payments are presented for a 60-year-old man in the following 30 years in Figure 5. The figure shows that when q is higher, older people can receive a much higher annuity.
Figure 5: Annual annuity for a man at 60 for different q ∊ {0%, 2%, 5%, 10%}
Source: Own research
0
2000
4000
6000
8000
10000
12000
14000
16000
18000
20000
0 5 10 15 20 25 30 35year
0%
2%
5%
10%
bene
fi t
20,000
18,000
16,000
14,000
12,000
10,000
8,000
6,000
4,000
2,000
0
Prague Economic Papers, 2021, 30 (5), 552–574, https://doi.org/10.18267/j.pep.784 565
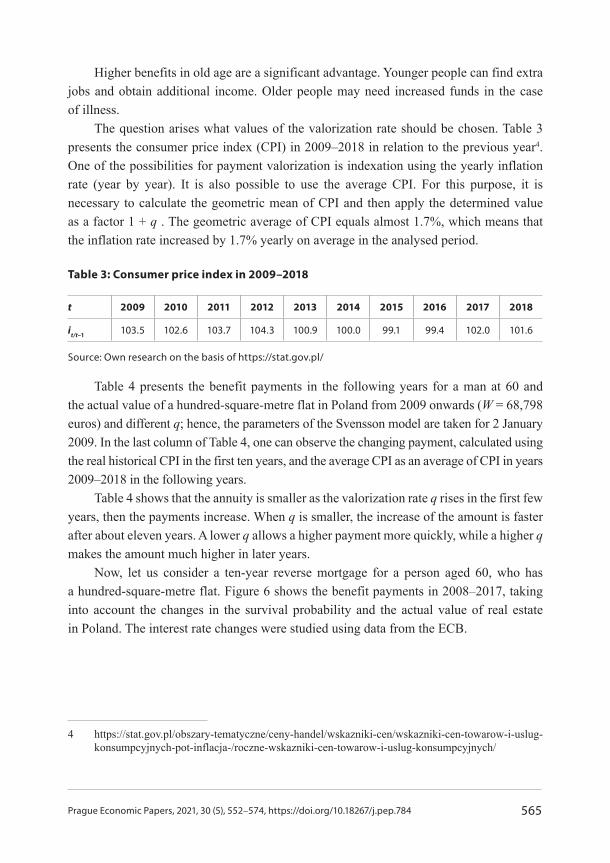
Higher benefits in old age are a significant advantage. Younger people can find extra jobs and obtain additional income. Older people may need increased funds in the case of illness.
The question arises what values of the valorization rate should be chosen. Table 3 presents the consumer price index (CPI) in 2009–2018 in relation to the previous year4. One of the possibilities for payment valorization is indexation using the yearly inflation rate (year by year). It is also possible to use the average CPI. For this purpose, it is necessary to calculate the geometric mean of CPI and then apply the determined value as a factor 1 + q . The geometric average of CPI equals almost 1.7%, which means that the inflation rate increased by 1.7% yearly on average in the analysed period.
Table 3: Consumer price index in 2009–2018
t 2009 2010 2011 2012 2013 2014 2015 2016 2017 2018
it/t–1103.5 102.6 103.7 104.3 100.9 100.0 99.1 99.4 102.0 101.6
Source: Own research on the basis of https://stat.gov.pl/
Table 4 presents the benefit payments in the following years for a man at 60 and the actual value of a hundred-square-metre flat in Poland from 2009 onwards (W = 68,798 euros) and different q; hence, the parameters of the Svensson model are taken for 2 January 2009. In the last column of Table 4, one can observe the changing payment, calculated using the real historical CPI in the first ten years, and the average CPI as an average of CPI in years 2009–2018 in the following years.
Table 4 shows that the annuity is smaller as the valorization rate q rises in the first few years, then the payments increase. When q is smaller, the increase of the amount is faster after about eleven years. A lower q allows a higher payment more quickly, while a higher qmakes the amount much higher in later years.
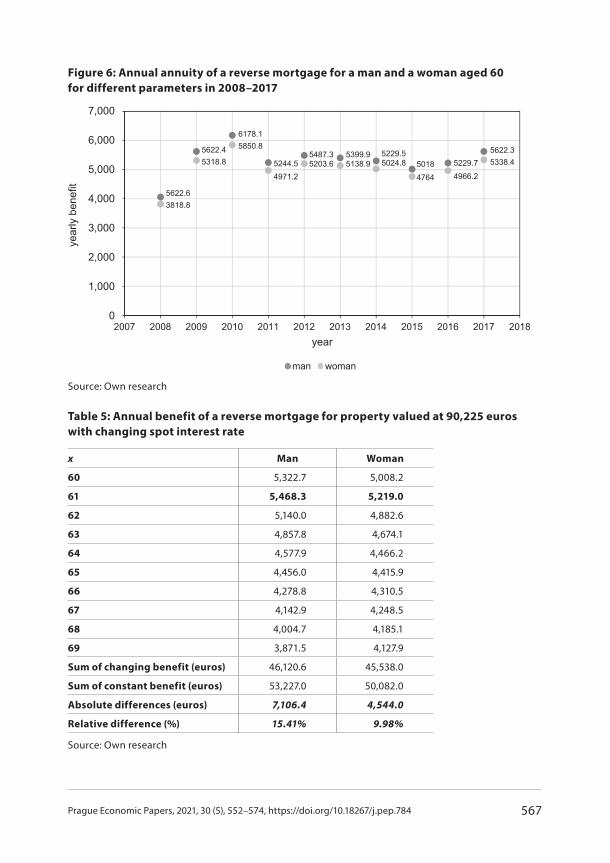
Now, let us consider a ten-year reverse mortgage for a person aged 60, who has a hundred-square-metre flat. Figure 6 shows the benefit payments in 2008–2017, taking into account the changes in the survival probability and the actual value of real estate in Poland. The interest rate changes were studied using data from the ECB.
4 https://stat.gov.pl/obszary-tematyczne/ceny-handel/wskazniki-cen/wskazniki-cen-towarow-i-uslug-konsumpcyjnych-pot-inflacja-/roczne-wskazniki-cen-towarow-i-uslug-konsumpcyjnych/

Prague Economic Papers, 2021, 30 (5), 552–574, https://doi.org/10.18267/j.pep.784566
Table 4: Annual benefit of reverse annuity contract for a property valued at 68,798 euros
0% 2% 5% 1.7% CPI and 1.7%
2009 2,137.1 1,714.9 1,179.6 1,775.0 1,775.0
2010 2,137.1 1,749.2 1,238.6 1,805.2 1,837.1
2011 2,137.1 1,784.2 1,300.5 1,835.9 1,884.9
2012 2,137.1 1,819.9 1,365.5 1,867.1 1,954.6
2013 2,137.1 1,856.3 1,433.8 1,898.8 2,038.7
2014 2,137.1 1,893.4 1,505.5 1,931.1 2,057.0
2015 2,137.1 1,931.3 1,580.8 1,963.9 2,057.0
2016 2,137.1 1,969.9 1,659.8 1,997.3 2,038.5
2017 2,137.1 2,009.3 1,742.8 2,031.3 2,026.3
2018 2,137.1 2,049.5 1,829.9 2,065.8 2,066.8
2019 2,137.1 2,082.1 1,880.2 2,100.9 2,099.9
2020 2,137.1 2,119.3 1,952.3 2,136.6 2,135.6
2021 2,137.1 2,156.5 2,024.4 2,173.0 2,171.9
2022 2,137.1 2,193.6 2,096.5 2,209.9 2,208.8
2023 2,137.1 2,230.8 2,168.6 2,247.5 2,246.4
Source: Own research
The benefit payments have changed significantly. A very high increase in the value of real estate in the first two analysed years caused a significant rise in benefit payments, which were approximately 38.53% in 2009 and 9.89% in 2010 compared to the previous year. Then, the level of payments stabilized with slight deviations. In 2017 the benefit was 7.5% higher than in 2016. This situation shows that the value of the property has a significant impact on the amount of payments. Therefore, the following examples demonstrate the benefit payments under the assumption of different changing economic conditions for people who enter into a ten–year reverse mortgage contract at 60. Lemma 1 is applied for this purpose. However, in this case, the actual value of a property changes every year, so it is necessary to use W(t) instead of W like we did in proof of this lemma. The benefit of a reverse mortgage is calculated from the equivalence principle as follows:
11,1: 1|
: |: | : |
( 1)( ) t tx t n t
x t n tx t n t x t n t
W t b vW tba a
for t = 1, 2, ..., n – 1 , (15)
where : |x nb and : |x t n ta
are determined be the use of Equations (9) and (11).
Prague Economic Papers, 2021, 30 (5), 552–574, https://doi.org/10.18267/j.pep.784 567
Figure 6: Annual annuity of a reverse mortgage for a man and a woman aged 60
for different parameters in 2008–2017
Source: Own research
Table 5: Annual benefit of a reverse mortgage for property valued at 90,225 euros
with changing spot interest rate
x Man Woman
60 5,322.7 5,008.2
61 5,468.3 5,219.0
62 5,140.0 4,882.6
63 4,857.8 4,674.1
64 4,577.9 4,466.2
65 4,456.0 4,415.9
66 4,278.8 4,310.5
67 4,142.9 4,248.5
68 4,004.7 4,185.1
69 3,871.5 4,127.9
Sum of changing benefit (euros) 46,120.6 45,538.0
Sum of constant benefit (euros) 53,227.0 50,082.0
Absolute differences (euros) 7,106.4 4,544.0
Relative difference (%) 15.41% 9.98%
Source: Own research
man woman
year
ly b
enefi
t
7,000
6,000
5,000
4,000
3,000
2,000
1,000
0
5622.35338.45229.7
4966.250184764
5229.55024.8
5399.95138.9
5487.35203.65244.5
4971.2
6178.15850.85622.4
5318.8
5622.63818.8
Prague Economic Papers, 2021, 30 (5), 552–574, https://doi.org/10.18267/j.pep.784568
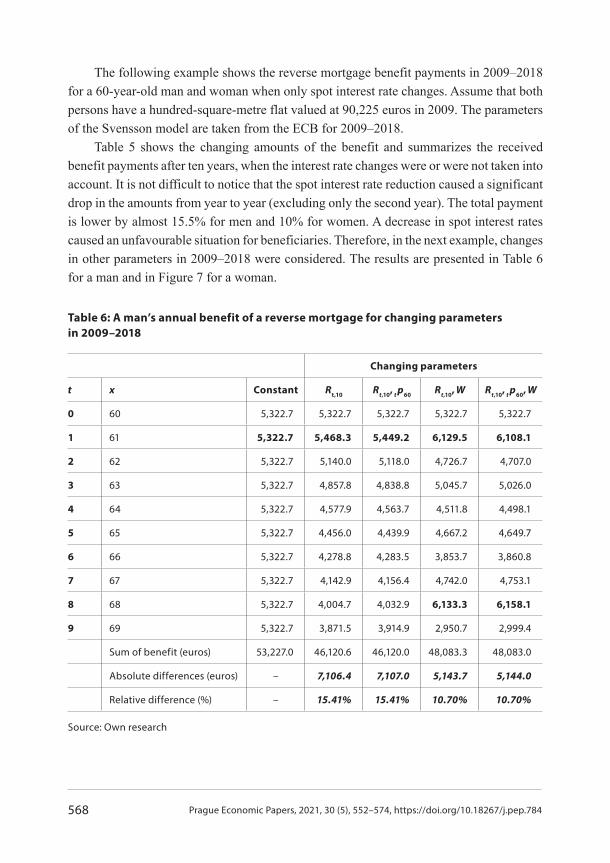
The following example shows the reverse mortgage benefit payments in 2009–2018 for a 60-year-old man and woman when only spot interest rate changes. Assume that both persons have a hundred-square-metre flat valued at 90,225 euros in 2009. The parameters of the Svensson model are taken from the ECB for 2009–2018.
Table 5 shows the changing amounts of the benefit and summarizes the received benefit payments after ten years, when the interest rate changes were or were not taken into account. It is not difficult to notice that the spot interest rate reduction caused a significant drop in the amounts from year to year (excluding only the second year). The total payment is lower by almost 15.5% for men and 10% for women. A decrease in spot interest rates caused an unfavourable situation for beneficiaries. Therefore, in the next example, changes in other parameters in 2009–2018 were considered. The results are presented in Table 6 for a man and in Figure 7 for a woman.
Table 6: A man’s annual benefit of a reverse mortgage for changing parameters
in 2009–2018
Changing parameters
t x Constant Rt,10
Rt,10,
t p60 Rt,10
, W Rt,10
, t p60
, W
0 60 5,322.7 5,322.7 5,322.7 5,322.7 5,322.7
1 61 5,322.7 5,468.3 5,449.2 6,129.5 6,108.1
2 62 5,322.7 5,140.0 5,118.0 4,726.7 4,707.0
3 63 5,322.7 4,857.8 4,838.8 5,045.7 5,026.0
4 64 5,322.7 4,577.9 4,563.7 4,511.8 4,498.1
5 65 5,322.7 4,456.0 4,439.9 4,667.2 4,649.7
6 66 5,322.7 4,278.8 4,283.5 3,853.7 3,860.8
7 67 5,322.7 4,142.9 4,156.4 4,742.0 4,753.1
8 68 5,322.7 4,004.7 4,032.9 6,133.3 6,158.1
9 69 5,322.7 3,871.5 3,914.9 2,950.7 2,999.4
Sum of benefit (euros) 53,227.0 46,120.6 46,120.0 48,083.3 48,083.0
Absolute differences (euros) – 7,106.4 7,107.0 5,143.7 5,144.0
Relative difference (%) – 15.41% 15.41% 10.70% 10.70%
Source: Own research

Prague Economic Papers, 2021, 30 (5), 552–574, https://doi.org/10.18267/j.pep.784 569
Figure 7: A woman’s annual benefit of a reverse mortgage for changing parameters
in 2009–2018
Source: Own research
The second benefit payment is significantly higher when the spot interest rate and the real value of property change. The following years bring losses in the value of benefit payments, except for the eighth year, when a large increase in the property value resulted in a significant increase in the amount (the last two columns of Table 6, and the penultimate year in Figure 7). This example shows that the parameter W has a huge impact on the amount of benefit, which fluctuates more but is still lower than for the constant case (about 10.7% for a man and 3.74% for a woman). The future life expectancy changes did not make a visible difference (the second, third, fourth and fifth functions (columns) take similar values). Therefore, only three lines are visible in Figure 7.
The last example focused on the period 2008–2017. The value of the flat was the smallest in 2008; therefore, the benefits started from a lower level. The payment is calculated for a man and a woman at 60 with constant and changing financial parameters. The results are presented in Table 7.
Table 7 shows that the benefit payments were higher in the determined period when the parameters changed. Only in the seventh year of the contract duration was it observed that changes in parameters resulted in a slightly lower benefit; however, the difference is not significant, which was better for the clients. One can see that after five years, the payment for a woman is higher than for a man, and it is also more profitable for a woman. The total payments, calculated under the assumption of changing parameters, are significantly
7,000
6,000
5,000
4,000
3,000
2,000
1,000
0

Prague Economic Papers, 2021, 30 (5), 552–574, https://doi.org/10.18267/j.pep.784570
higher than the total constant benefits. The differences are 26.85% for a man and 35.24% for a woman.
Table 7: Annual benefit of a reverse mortgage for changing parameters in 2008–2017
Benefit for a man Benefit for a woman
Parameters Parameters
T x ConstantChanging
Rt,10,
t p60,
W Constant
Changing
Rt,10,
t p60,
W
0 60 4,058.6 4,058.6 3,818.8 3,818.8
1 61 4,058.6 5,535.3 3,818.8 5,285.2
2 62 4,058.6 5,947.2 3,818.8 5,763.4
3 63 4,058.6 4,510.7 3,818.8 4,455.3
4 64 4,058.6 4,934.9 3,818.8 4,915.6
5 65 4,058.6 4,530.6 3,818.8 4,593.1
6 66 4,058.6 4,689.5 3,818.8 4,798.3
7 67 4,058.6 3,761.8 3,818.8 3,953.0
8 68 4,058.6 5,213.5 3,818.8 5,447.6
9 69 4,058.6 8,303.0 3,818.8 8,616.0
Sum of benefit (euros) 40,586.0 51,485.1 38,188.0 51,646.3
Absolute differences (euros) – –10,899.1 – –13,458.3
Relative difference (%) – –26.85% – –35.24%
Source: Own research
The changes in parameters significantly affect the amount of benefits, but they are not always favourable for the clients. Moreover, the amounts are also unknown, which may discourage them from entering into a reverse mortgage, whereas the valorization of benefits is advantageous for clients, especially in old age.
5. Conclusion
This paper considers two equity release contracts with varying payments that are currently available in Poland, namely the reverse annuity contract and the reverse mortgage. The financial methods of loan repayment are used to recalculate the benefit payments

Prague Economic Papers, 2021, 30 (5), 552–574, https://doi.org/10.18267/j.pep.784 571
of a reverse mortgage. For this purpose, Lemma 1 is proved. This is a new proposition. Moreover, a valorization rate is applied to calculate the benefit payment of a reverse annuity contract. The calculations also cover the putative advantages and disadvantages that would arise if the arrangements took into account changes in some parameters. The absolute amount of the annuity depends on the flat value, which varies with the location and year. For a given value of a flat, the benefit payment varies with the owner’s age and the survival probability, and also varies according to the spot interest rate and valorization rate.
All the calculations were made using market-generated data from 2008 to 2019 and the author’s own interfaces written in MATLAB. The numerical examples show that applying a lower indexation rate results in weaker annuity growth year by year. A higher valorization value results in a low value of the annuity in the initial years of the contract, and in old age it brings significantly higher payments. This is undoubtedly an additional financial resource, especially for elderly people who may already live alone and often in ill health. In practice, the valorization of the reverse mortgage benefit payments is not possible; hence, changes of various parameters were applied. The examples also show that the spot interest rate, declining for years, had a significant impact on the amount of the benefit, as well as the value of real estate, which increased significantly in Poland in 2009. Depending on the period under consideration, these changes may be beneficial for clients, but it does not have to be so. A higher initial value of the property causes the payment to decrease from year to year. In the examples provided, the differences between total variable and total constant benefits vary from 10% to almost 16% for men and from 3.5% to 10% for women. A lower starting value of the property increased the changing benefit by around 27% for men and 35% for women. As seen from the presented calculations, the changes in benefit payments do not have to be favourable for clients. The uncertainty of obtaining profits may result in a reluctance to conclude such a contract. In future research, consideration may be given to examining the level of permissible changes in benefit payments.
Equity release contracts carry big risks for their purchasers and providers, but create significant additional financial resources for elderly people. This can be a boon when social pensions are low by allowing property owners to access some of their property equity to boost their pensions without relocating. Obviously, the transfer of real estate to a company does not have to be optimal for the elderly or their children. However, many older people have no children and therefore no one to whom they can give their inheritance. The birth rate has been decreasing consistently, so the problem may become more significant. Sometimes parents do not have good relations with their children. Moreover, nowadays it is possible to travel around the world, so young people go abroad and stay there because they have found a better job. Often they do not maintain contact with
Prague Economic Papers, 2021, 30 (5), 552–574, https://doi.org/10.18267/j.pep.784572
their parents or do not help them financially. It may happen that their parents’ properties deteriorate, and that older people suffer from a decline in health and may require additional financial resources. Yet they do not want to move from their home, and in such a situation the equity release contracts carry significant advantages. Furthermore, the heirs can buy the property in up to 12 months after the owner’s death in the case of a reverse mortgage.
ReferencesBlake, D., Cairns, A., Coughlan, A., et al. (2013). The New Life Market. The Journal of Risk and
Insurance, 80(3), 501–557, https://doi.org/10.1111/j.1539–6975.2012.01514.x
Bowers, N. L., Gerber, H. U., Hickman, J. C., et al. (1986). Actuarial Mathematics. Itasca, Illinois: The Society of Actuaries.
Burnecki, K., Marciniuk, A., Weron, A. (2004). On Annuities under Random Rates of Interest with Payments Varying in Arithmetic and Geometric Progression. Probability and Mathematical Statistics, 24(1), 1–15.
Charupat, N., Kamstra, M. J., Milevsky, M. A. (2016). The Sluggish and Asymmetric Reaction of Life Annuity Prices to Changes in Interest Rate. The Journal of Risk and Insurance, 83(3), 519–555, https://doi.org/10.1111/jori.12061
Dębicka, J., Heilpern, S., Marciniuk, A. (2020). Application of Copulas to Modelling of Marriage Annuity Contracts. Prague Economic Papers, 29(4), 445–468, https://doi.org/10.18267/j.pep.745
Dębicka, J., Marciniuk, A. (2014). Comparison of Reverse Annuity Contract and Reverse Mortgage on the Polish Market, in Rusnak, Z., Zmyślona, B., eds., 17th AMSE. Applications of Mathematics and Statistics in Economics. International Science Conference: Poland, 27–31 August 2014. Conference Proceedings Full Text Paper. Wrocław: Wrocław University of Economics Press, pp. 55–64. ISBN 978–83–7695–421–9, https://doi.org/10.15611/amse.2014.17.06
Dickson, D. C. C., Hardy, M. R., Waters, H. R. (2019). Actuarial Mathematics for Life ContingentRisks. third edition, Cambridge: Cambridge University Press, https://doi.org/10.1017/ 9781108784184
Dowd, K., Buckner, D., Blake, D., et al. (2019). The Valuation of No–negative Equity Guarantees and Equity Release Mortgages. Economics Letters, 184, https://doi.org/10.1016/j.econlet.2019.108669
European Central Bank (2018). Yield Curve Index. Frankfurt am Main: European Central Bank [Retrieved 2018-02-05] Available at: https://www.ecb.europa.eu/stats/financial_markets_and_interest_rates/euro_area_yield_curves/html/index.en.html
Gubalová, J., Medveová, P., Špirková, J. (2018). Will Life Insurance Products Meet Our Expectation?, in Hronova S., ed., Applications of Mathematics and Statistics in Economics 2018, Conference Proceedings. Prague: Oeconomica Publishing House, pp. 200–201.

Prague Economic Papers, 2021, 30 (5), 552–574, https://doi.org/10.18267/j.pep.784 573
Hanewald, K., Post, T., Sherris, M. (2016). Portfolio Choice in Retirement – What is the Optimal Home Equity Release Product? The Journal of Risk and Insurance, 83(2), 421–446, https://doi.org/10.1111/jori.12068
Heilpern, S. (2014). Multiple Life Insurance – Pension Calculation. Proceedings of 17th Applications of Mathematics and Statistics in Economics 2015 International Scientific Conference. Poland, 27–31 August, 2014, pp. 114–122, https://doi.org/10.15611/amse.2014.17.12
James, J., Webber, N. (2000). Interest Rate Modelling. New York: John Wiley & Sons. ISBN 978-0-471-97523-6.
Kellison, S. C. (1991). The Theory of Interest. 2nd Edition, Irwin, Illinois: Homewood.
Kolbe, A., Zagst, R. (2010). Valuation of Reverse Mortgages Under (Limited) Default Risk. European Journal of Finance, 16(4), 305–327, https://doi.org/10.1080/13518470903211640
Kowalczyk–Rólczyńska, P. (2020). Valuation of Benefits Paid of Equity Release Products in the Context of the Changing Financial Requirement of Elderly Persons. Economics and Sociology, 13(1), 74–89, https://doi.org/10.14254/2071–789X.2020/13–1/5
Lee, Y.–T., Wang, C.–W., Huang, H.–C. (2012). On the Valuation of Reverse Mortgages with Regular Tenure Payments. Insurance Mathematics and Economics, 51(2), 430–441, https://doi.org/10.1016/j.insmatheco.2012.06.008
Luciano, E., Spreeuw, J., Vigna, E. (2016). Spouses’ Dependence across Generations and Pricing Impact on Reversionary Annuities. Risks, 4(2), 1–18, https://doi.org/10.3390/risks4020016
Ma, LN., Zhang, JX., Kannan, D. (2017). Fair Pricing of Reverse Mortgage without Redemption Right. Dynamic System and Applications, 26(3–4), 473–497, https://doi.org/10.12732/dsa.v26i34.6
Marciniuk, A. (2017a). Analiza ryzyka renty hipotecznej i odwróconego kredyty hipotecznego. Śląski Przegląd Statystyczny, 15(21), 169–182, https://doi.org/10.1561./sps.2017.15.08
Marciniuk, A. (2017b). Marriage Reverse Annuity Contract and Reverse Mortgage – Application of a Generalized Model of Reversionary Annuity, in Gardoń, A., Kozyra, C., Mazurek, E., eds., Applications of Mathematics and Statistics in Economics 2017. Conference Proceedings. Wrocław: Wrocław University of Economics Press, pp. 297–306. ISBN 978–83–7695–693–0, https://doi.org/10.15611/amse.2017.20.24
Marciniuk, A., Zimková, E. (2018). Analysis of Potential Marriage Reverse Annuity Contracts Benefit in Slovak Republic, in Hronova, S., ed., Applications of Mathematics and Statistics in Economics 2018, Conference Proceedings. Prague: Oeconomica Publishing House Press, pp. 200–201.
Marciniuk, A., Zimková, E., Farkašovský, V., et al. (2020). Valuation of Equity Release Contracts in Czech Republic, Republic of Poland and Slovak Republic. Prague Economic Papers, 29(5), 505–521, https://doi.org/10.18267/j.pep.743
Reverse mortgage act (2014). Dziennik Ustaw Rzeczypospolitej Polskiej, poz. 1585. Warszawa, 14.11.2014. [Retrieved 2020-01-20] Available at: http://isap.sejm.gov.pl/isap.nsf/DocDetails.xsp?id=WDU20140001585

Prague Economic Papers, 2021, 30 (5), 552–574, https://doi.org/10.18267/j.pep.784574
Shao, A. W., Hannewald, K., Sherris, M. (2015). Reverse Mortgage Pricing and Risk Analysis Allowing for Idiosyncratic House Price. Insurance: Mathematics and Economics, 63, 76–90, https://doi.org/10.1016/j.insmatheco.2015.03.026
Whitney, C. R. (1997). Jeanne Calment, World`s Elder, Dies at 122. New York Times, 5. 8. 1997. Available at: https://www.nytimes.com/1997/08/05/world/jeanne-calment-world-s-elder-dies-at-122.html