equity portfolio strategies - week 5. topics today - passive equity strategies - active equity...
TRANSCRIPT

Equity Portfolio Strategies
- Week 5

Topics Today
-Passive Equity Strategies-Active Equity Strategies

Generic Portfolio Management Strategies
Passive equity portfolio management– Usually tries to track an index over time– Hope to match market performance of the
selected index – Portfolio only needs to change as composition
of index changes.– Manager is judged on how well they track the
target index Active equity portfolio management
– Attempts to outperform a passive benchmark portfolio on a risk-adjusted basis

Exhibit 16.1

Passive Equity Portfolio Management Strategies
Since trying to replicate the performance of an index, process of stock selection is largely automatic. No need for analysts or other expensive research.
Costs of passive approach tiny compared to costs of active approach
Costs of active management (1 to 2 percent p.a.) make it difficult for active to beat passive on a risk-adjusted basis
Thus the main rationale for the passive approach is its substantial cost advantage over the active approach
Passive Equity Portfolio Management Strategies
Investors are unable to purchase the market index directly
Not a simple process to track a market index closely
Three basic techniques:– Full replication– Sampling– Quadratic optimization or programming
Passive Equity Portfolio Management Strategies
Full ReplicationTo ensure close tracking, all securities in the
index are purchased in proportion to their weights in the index
This leads to numerous transactions, especially as dividends have to be reinvested.
Numerous transactions leads to more transaction costs

Passive Equity Portfolio Management Strategies
SamplingFund invests in a ‘representative’ sample of the
stocks in the index in proportion to the stocks’ weights in that index
This leads to less transactions than with full replication, resulting in lower commissions
Sampling creates ‘tracking errors’ (the differences between portfolio returns and the corresponding index returns)
Tracking errors can be reduced by using a larger sample, but costs will then be larger

Passive Equity Portfolio Management Strategies
Quadratic Optimization Uses historical return data on the stocks in the
index to find a portfolio with less stocks than the index that will minimize tracking error
Suffers from the problem that the portfolio weights that minimise past tracking error may not minimise future tracking error
So there are no guarantees of close tracking with this method.

Methods of Index Portfolio Investing Index Funds
– In an indexed portfolio, the fund manager will typically attempt to replicate the composition of the particular index exactly
– The fund manager will buy the exact securities comprising the index in their exact weights
– Change those positions anytime the composition of the index itself is changed
– Low trading and management expense ratios– The advantage of index mutual funds is that
they provide an inexpensive way for investors to acquire a diversified portfolio

Methods of Index Portfolio Investing
Exchange-Traded Funds (ETF)– EFTs are depository receipts that give investors
a pro rata claim on the capital gains and cash flows of the securities that are held in deposit by a financial institution that issued the certificates
– A significant advantage of ETFs over index mutual funds is that they can be bought and sold (and short sold) like common stock
– The notable example of ETFsStandard & Poor’s 500 Depository Receipts
(SPDRs)iSharesSector ETFs

Active Equity Portfolio Management Strategies
Active managers are successful for their investors if they consistently earn a portfolio return that exceeds the return of an appropriate passive benchmark portfolio, net of transaction costs, on a risk-adjusted basis
Why?Success is not easy. Active managers have the
burden of higher costs than passive managersNeed to choose an appropriate benchmark
Fundamental Strategies
Top-Down versus Bottom-Up Approaches– Top-Down
Broad country and asset class allocationsSector allocation decisionsIndividual securities selection
Fundamental Strategies
Top-Down versus Bottom-Up Approaches– Top-Down
Broad country and asset class allocationsSector allocation decisionsIndividual securities selection
– Bottom-UpEmphasizes the selection of securities without
any initial market or sector analysisForm a portfolio of equities that can be
purchased at a substantial discount to what his or her valuation model indicates they are worth

Active Equity Portfolio Management Strategies
Three basic StrategiesMarket timing – tactical asset allocation: shifting
funds into and out of stocks, bonds, and T-bills depending on broad market forecasts and estimated risk premiums
sector rotation: Shifting funds among different equity sectors and industries or among investment styles to catch hot concepts before the market does (a ‘top-down’ strategy)
Style Investing: Selecting individual stocks, based on on one or more characteristics of each company

Active Equity Portfolio Management Strategies
Two Global Strategies Identify countries with markets that appear
undervalued or overvalued and weight the portfolio accordingly (another ‘top-down’ strategy)
Manage a global portfolio from an industry perspective rather than from a country perspective

Active Equity Portfolio Management Strategies
Sector RotationTries to take advantage of the herd mentality of
many investors by exiting popular sectors and seeking to identify and invest in other sectors that might become popular next.
May base on macroeconomic trends or forecasts Difficult to do well. E.g. Tech stocks have become expensive (in P/E
terms) again, but drug stocks look cheap.e.g., housing sector vulnerable to interest rate
increases which seem more likely than not.

Style Investing
Tests of efficient market models have uncovered anomalies that suggest that the market does not behave as one market but rather is segmented (e.g. low P/B do better)
Market segments are groups of stocks with similar characteristics that tend to perform similarly
market segments can be divided into top-down (sectors and industries) and bottom-up classifications (e.g., P/E ratio)
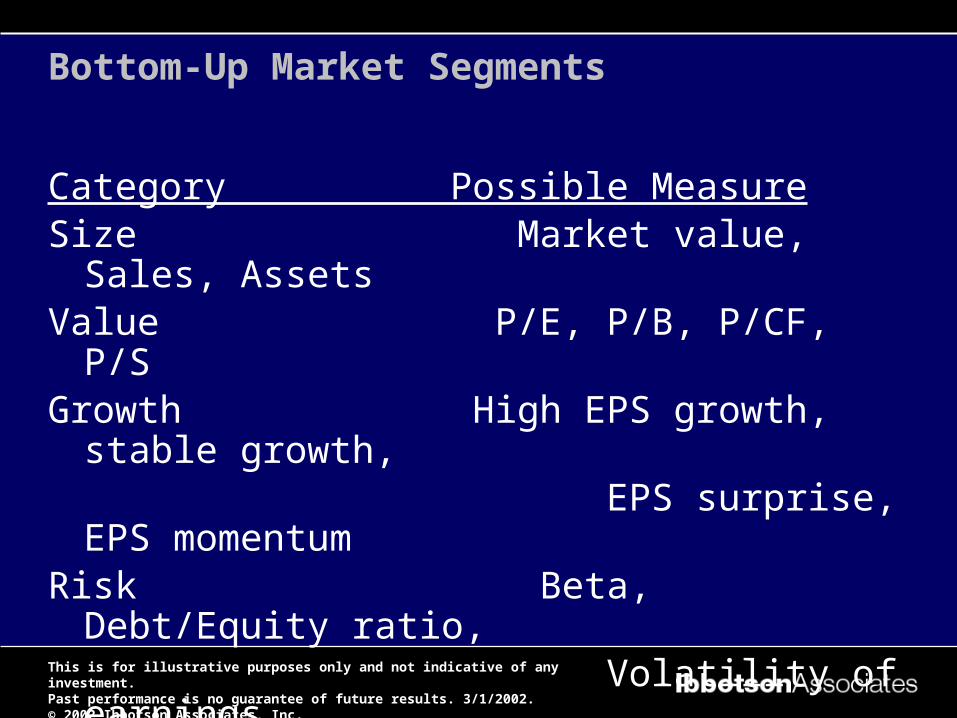
Bottom-Up Market Segments
Category Possible MeasureSize Market value, Sales, AssetsValue P/E, P/B, P/CF, P/SGrowth High EPS growth, stable growth, EPS surprise, EPS momentumRisk Beta, Debt/Equity ratio, Volatility of earnings

Hypothetical value of $1 invested at year-end 1925. Assumes reinvestment of income and no transaction costs or taxes.
1925-2001
$10
EndingWealth
3.1%
AverageReturnInflation
Small versus Large Stocks
$.10
$1
$10
$100
$1,000
$10,000
$17 3.8%
Treasury Bills
$51 5.3%
Government Bonds
$7,860 12.5%Small Company Stocks
10.7%Large Company Stocks $2,279
1925 1935 1945 1955 1965 1975 1985 2001
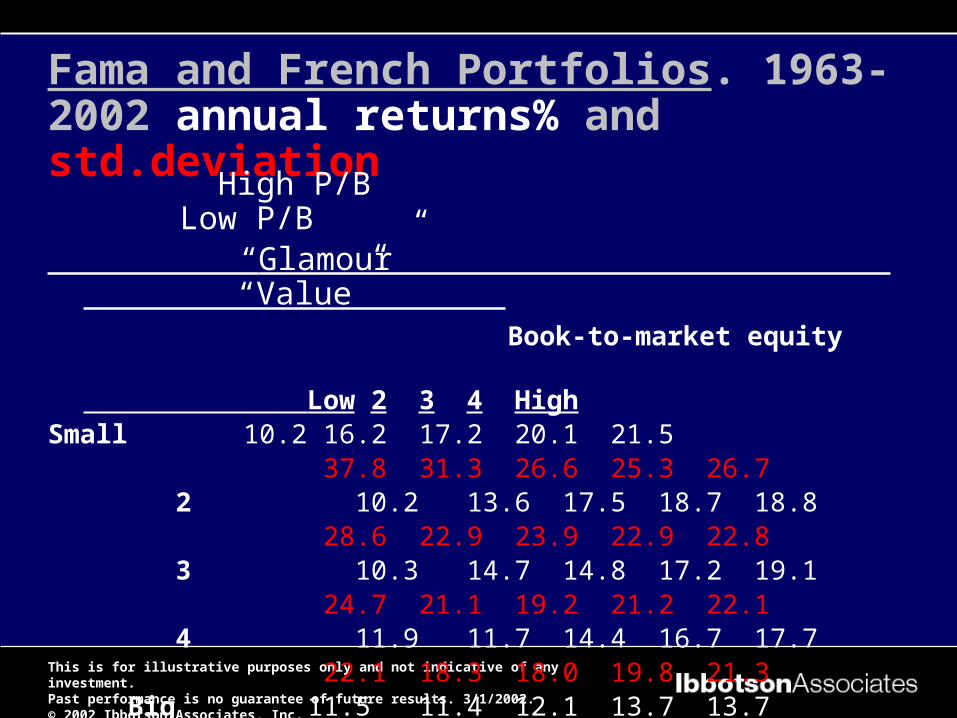
Fama and French Portfolios. 1963-2002 annual returns% and std.deviation
High P/B Low P/B “Glamour” “Value” Book-to-market equity
Low 2 3 4 HighSmall 10.2 16.2 17.2 20.1 21.5
37.8 31.3 26.6 25.3 26.7 2 10.2 13.6 17.5 18.7 18.8
28.6 22.9 23.9 22.9 22.8 3 10.3 14.7 14.8 17.2 19.1
24.7 21.1 19.2 21.2 22.1 4 11.9 11.7 14.4 16.7 17.7
22.1 18.3 18.0 19.8 21.3 Big 11.5 11.4 12.1 13.7 13.7
19.7 16.9 15.8 16.8 19.0

Style Investing
Construct a portfolio that invests in one of these market segments
e.g. Small-cap stocks, low-P/E stocks, etc…Value stocks (those that appear to be under-
priced according to various measures)– e.g. Low Price/Book value or Price/Earnings
ratiosGrowth stocks (above-average earnings per
share increases)– High P/E, possibly a price momentum strategy

Growth Stocks
Growth stocks are stocks of companies that have historically been able to grow their businesses faster than the average company and are expected to continue that growth. Growth is measured by observing the growth of company earnings, sales, or other factors.
Because growth companies are expected to grow faster than average, investors are willing to pay more for the stock of these companies than for value stocks relative to current earnings. These companies often pay little or no dividend because they are using most of their available cash to re-invest in the business to help it continue to grow.

Value Stocks
Value stocks are stocks of companies that have had historically slower growth of earnings or sales, or have recently experienced trouble of some kind causing a fall in stock price.
Many investors consider value companies to include turnaround opportunities, where a change in management, business strategy, or other factors could increase prospects and earnings for the company.
Value Stocks 2
Because current prospects for value stocks are not as robust as for growth stocks, value stocks sell for lower multiples of price-to-book and price-to-earnings.
Since growth prospects for value stocks are judged by the market to be relatively modest, the dividend yield is typically higher, which helps to attract and retain investors.

What Are Growth and Value Stocks?
Growth Stocks High growth rate of earnings,
sales Usually have high price-to-book,
price-to-earnings ratios Paying lower or no dividends
Risks Future growth does not occur as
expected Price-to-book, price-to-earnings
ratios decline unexpectedly
Value Stocks Slower growth of earnings and
sales Low price-to-book, price-to-
earnings ratios Higher dividend yields Turnaround opportunities
Risks Evaluation of stock as good
value is misread Difficult to stick to value policy
when prices are beaten down
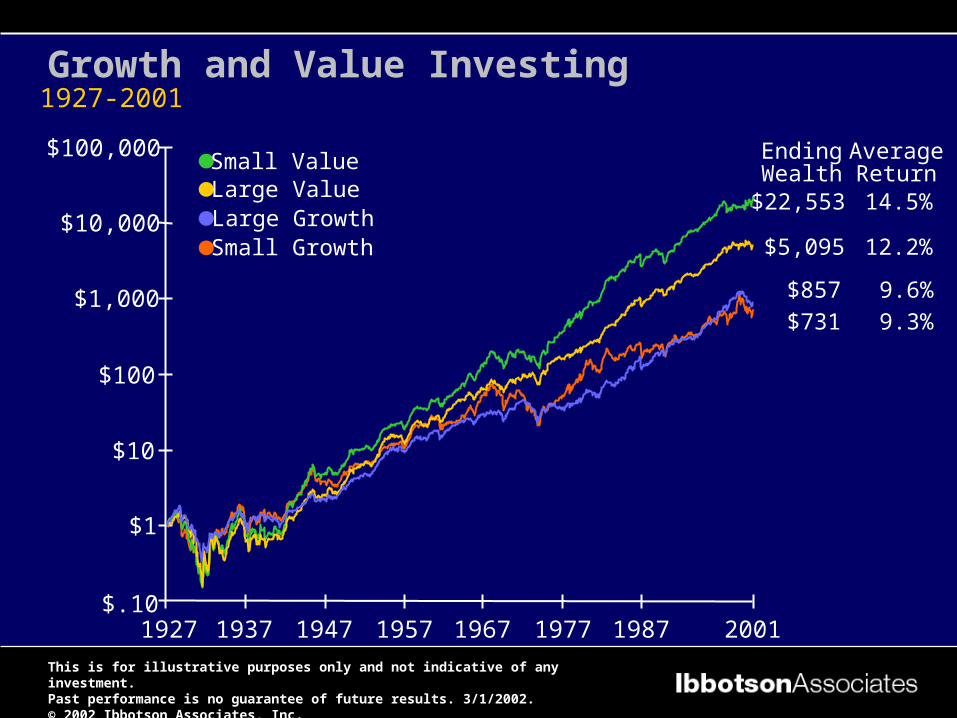
1927-2001Growth and Value Investing
1927 1937 1947 1957 1967 1977 1987 2001
$857
EndingWealth
$5,095
9.6%
AverageReturn
12.2%Large GrowthLarge Value
$.10
$1
$10
$100
$1,000
$10,000
$100,000
$731 9.3%
Small Growth
Small Value
$22,553 14.5%
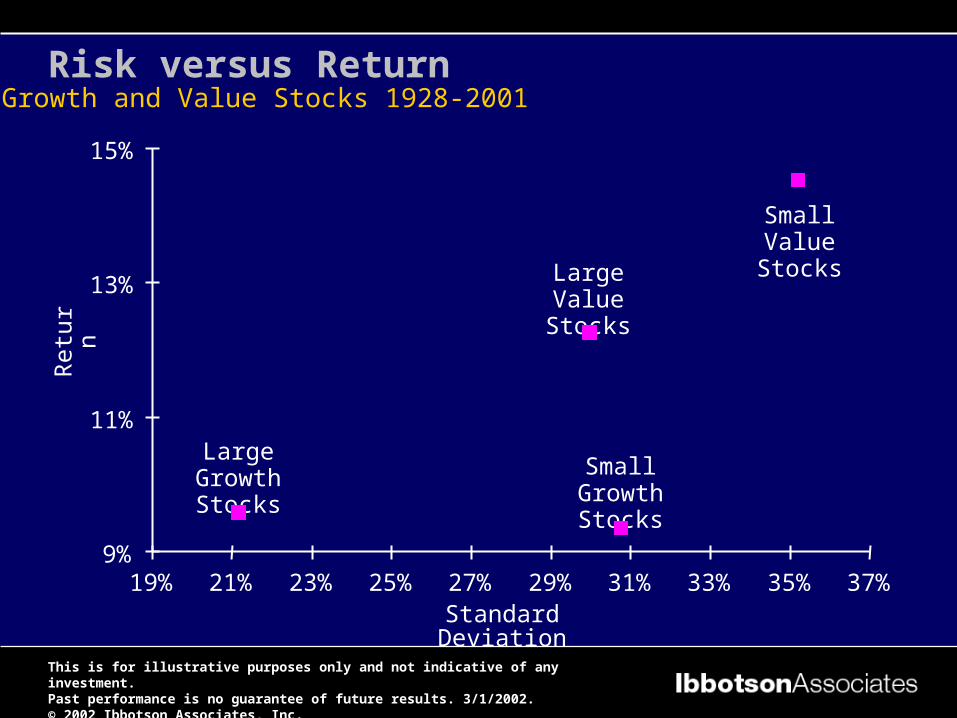
Growth and Value Stocks 1928-2001
Standard Deviation
Risk versus Return
9%
11%
13%
15%
Ret
urn
Large Value Stocks
Small Growth Stocks
Small Value Stocks
Large Growth Stocks
19% 21% 23% 25% 27% 29% 31% 33% 35% 37%
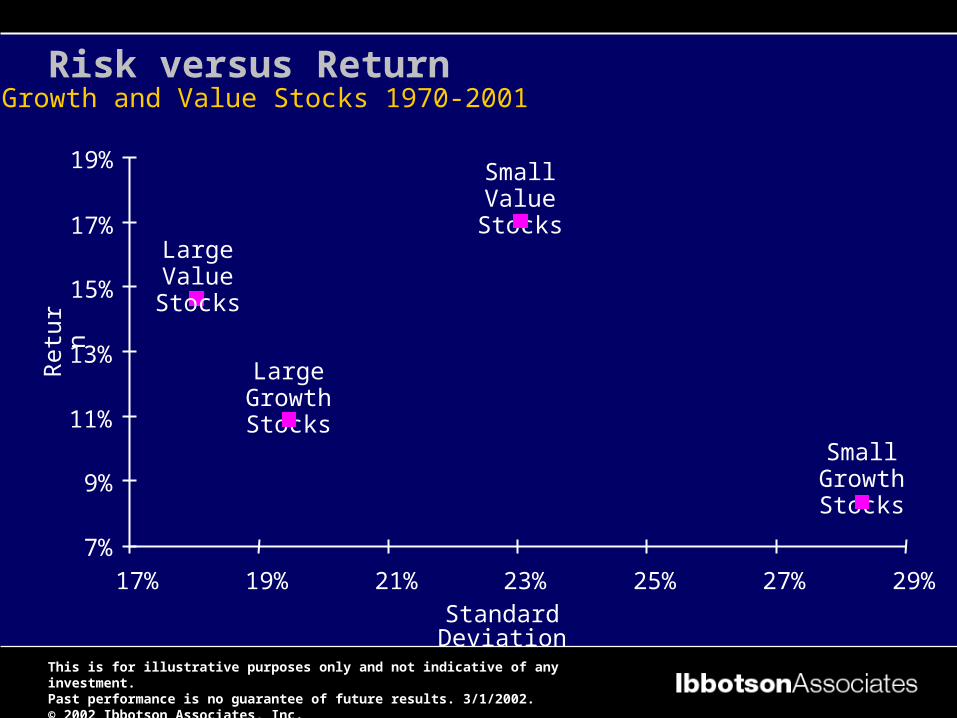
Growth and Value Stocks 1970-2001
Standard Deviation
Risk versus ReturnR
etur
n
7%
9%
15%
17%
19%
17% 19% 21% 23% 25% 27% 29%
Small Growth Stocks
Small Value Stocks
Large Growth Stocks
Large Value Stocks
11%
13%

*1920s based on the years 1928-1929. **Based on the years 2000-2001.
Compound Annual Rates of Return by DecadeGrowth and Value by Decade
-15%
-10%
-5%
0%
5%
10%
15%
20%
25%
1920s* 1930s 1940s 1950s 1960s 1970s 1980s 1990s 2000s**
All Growth Stocks
All Value Stocks

One-Year Growth and Value Trends 1928-2001
Based on the period 1928-2001. Data calculated using 12-month returns.
Large Growth
Ann
ual P
rem
ium
sGrowth versus Value Stocks
0%
40%
80%
120%
160%
200%
1928 1938 1948 1958 1968 1978 1988
Large Value
2001

Ann
ual P
rem
ium
s
0%
5%
10%
15%
20%
25%
30%
1930 1940 1950 1960 1970 1980 1990 2001
Three-Year Growth and Value Trends 1928-2001
Large Growth
Based on the period 1928-2001. Data calculated using 36-month returns.
Growth versus Value Stocks
Large Value
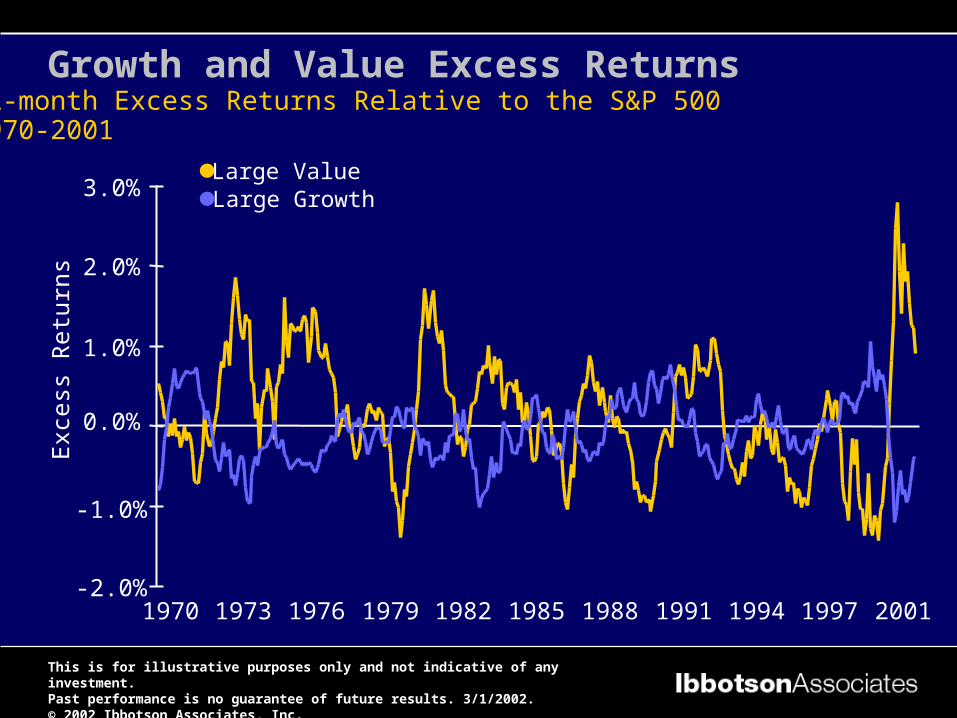
12-month Excess Returns Relative to the S&P 5001970-2001
-2.0%
-1.0%
0.0%
1.0%
2.0%
3.0%
1970 1973 1976 1979 1982 1985 1988 1991 1994 1997 2001
Exc
ess
Ret
urns
Large GrowthLarge Value
Growth and Value Excess Returns

Year-end 1998–February 2001
$1,021
$1,136
$900
$1,000
$1,100
$1,200
$1,300
$1,400
Dec-98 Jun-99 Dec-99 Jun-00 Feb-01
$1,094
Diversified PortfolioLarge Value
Large Growth
Diversified portfolio represented by 50% growth stocks and 50% value stocks.
Growth and Value Diversification Benefits

Major ‘Bottom-Up’ Investment Styles
Common styles are based around size and value-growth distinctions: Large Cap-Value, Large Cap-Growth, Small Cap-Value and Small Cap-Growth
GARP (growth at a reasonable price)GARP attempts to cross the growth/value boundary by
searching for growth stocks that appear undervalued, or undervalued stocks that have unappreciated growth potential
Style-Neutral: tries to construct a portfolio with an even balance of value and growth stocks, small and large stocks

Exhibit 16.20

Other Investment Styles
Some styles based on Technical Analysis
Most common of these is Momentum Investing. Uses measures of relative strength such as relative return over the last six months. In such a case, the fund might only invest in stocks within the highest 6-month return decile, for example.

More on Value and Growth Investment Styles
Classifications such as Value = Low P/B are too simplistic and naïve
An intelligent investor will pay more (in P/B terms, for example, or P/E etc.) the better the business is. Thus there should be a trade-off between the quality of the business and its price. Value is not a one-dimensional concept

QARP
Some of the more successful investors (e.g. Warren Buffett) employ a more-sophisticated investment style that can be described as Quality at a Reasonable Price (QARP).
This name implies that the higher the quality of the business the higher the price you should be prepared to pay.
Such investors recognise that there is a tradeoff between quality and price. They usually leave themselves a margin of safety in case their analysis is wrong. (The price they are prepared to pay is always less than what they think it is worth.)

QARP
But what is the “quality of a business” ?
What are the features of a high quality business?

Buffett on Growth and Value
Most analysts feel they must choose between two approaches customarily thought to be in opposition: ‘value’ and ‘growth’. Many investment professionals see any mixing of the two as a form of intellectual cross-dressing. We view that as fuzzy thinking in which, it must be confessed, I myself engaged some years ago. In our opinion, the two approaches are joined at the hip: growth is always a component in the calculation of value, constituting a variable whose importance can range from negligible to enormous and whose impact can be negative as well as positive.

Buffett on Growth and Value (2)
In addition, we think the very term ‘value investing’ is redundant. What is ‘investing’ if it is not the act of seeking value at least sufficient to justify the amount paid? Consciously paying more for a stock than its calculated value--in the hope that it can soon be sold for a still-higher price--should be labeled speculation which is neither illegal, immoral nor, in our view, financially fattening. Whether appropriate or not, the term ‘value investing’ is widely used. Typically it connotes the purchase of stocks having attributes such as a low ratio of price to book value, a low P/E ratio, or a high dividend yield.

Buffett on Growth and Value (3)
Unfortunately, such characteristics, even if they appear in combination, are far from determinative as to whether an investor is indeed buying something for what it is worth and is therefore truly operating on the principle of obtaining value in his investments. Correspondingly, opposite characteristics--a high P/E ratio, price to book and low dividend yield--are in no way inconsistent with a ‘value’ purchase. Similarly, business growth, per se, tells us little about value. It’s true that growth often has a positive impact on value. But such an effect is far from certain. For example investors have poured money into the domestic airline business to finance profitless growth.