equity markets and alternative investments …...equity markets and alternative investments teaching...
TRANSCRIPT
Equity Markets and Alternative Investments Teaching Program 2017-2018 Week 10 – November 21, 2017
Private Equity and Financial Sponsors: Investment Cycle, Domestic vs International
Marco Morelli - Chief Executive Officer, Banca Monte dei Paschi di Siena SpA
Global Global Global
1
Private Equity Funds: Who’s Who?
Pan-European Local Global
2
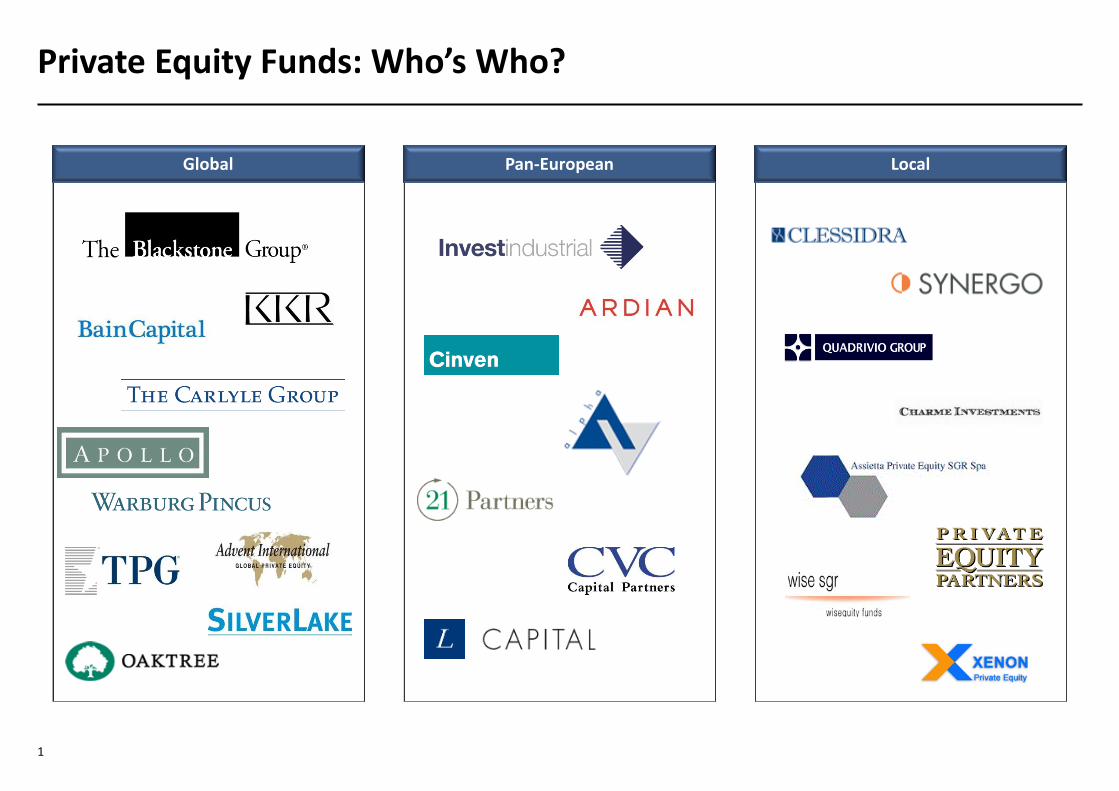
Typical Limited Partnership Fund Structure What is a Private Equity Fund?
Investors (Limited Partners or LPs) fund the limited partnership by contributing capital in the form of equity / debt (which can be called in at a later stage in tranches)
General Partners (owned by the managers) receive a Management fee (generally proportionate to the amount invested by the partnership) to sustain the management costs (personnel costs, advisory costs, etc)
Investments are made under the management of the General Partners or GPs
When an investment is disposed, proceeds are received by the limited partnership
The partnership repays the LPs’ loans and distributes profit to the LPs
If the performance of the fund is in line or above the returns set up during the fund-raising, the GPs receive a performance-related compensation (share of profits on the realisation of investments, also call carried interest)
1
2
3
4
5
6
General Partner
Manager Investors
Target Companies
1
Limited Partnership
5
6
3
2
Capital and Loans
Repayment of loans and profit
distributions
Investments Disposal Proceeds 4
3
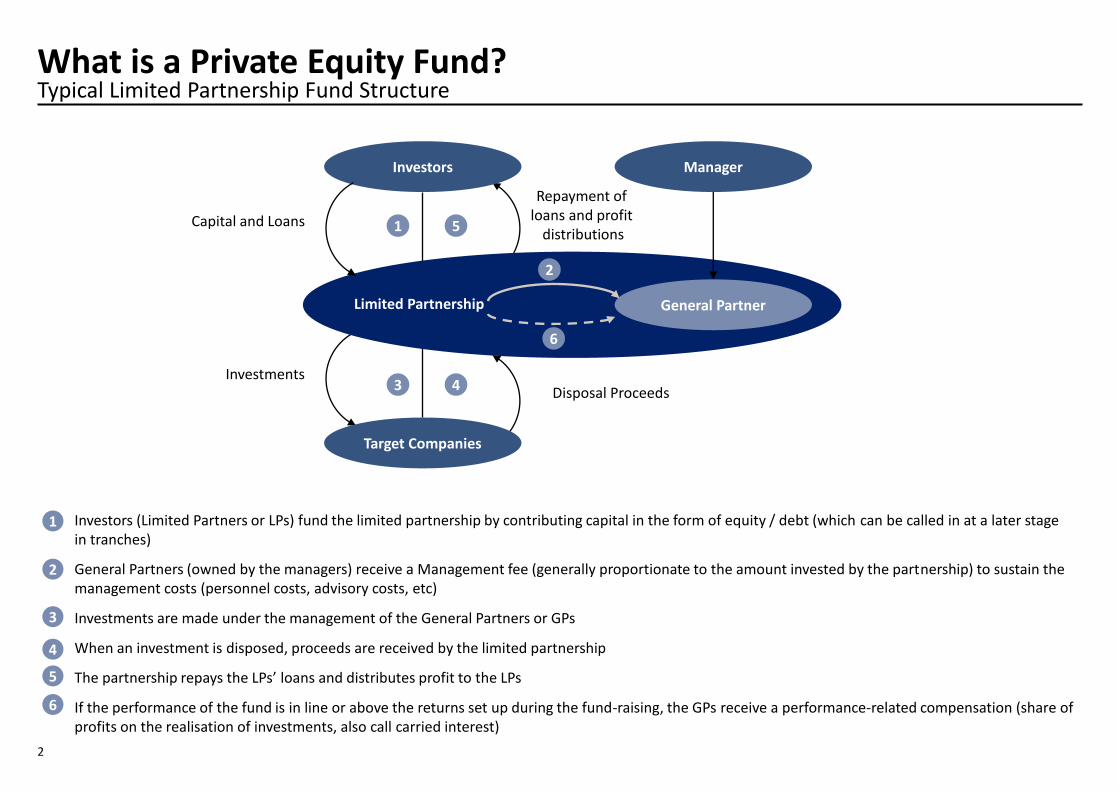
How do Private Equity Funds Operate?
Target Identification Target Acquisition Hold Period Exit
Scout for “unturned stones”,
participate to large auctions for
know assets
Clear turnaround situation/high
growth opportunities attractive
Business plan development
Level of leverage, determined by
market appetite for sector and
“run-rate” EBITDA
Well incentivised
management team
Highly focused on cash
generation / EBITDA expansion
Typically seek to pull out
any excess cash day one
Allow management to execute
business plan when delivering –
take rapid action when targets
missed
Focus on maintaining an
optimal capital structure
(e.g. recapitalisation allowing
dividend payment to
equity holders)
Will consider consolidation/
roll-up/break-up options
Typical hold period 3–5 years
Early exits to capture IPO
windows and strategic
approaches increasingly common
Exit route (e.g. IPO, trade sale,
secondary buy-out) motivated by
maximum returns
Increasing trend for
secondary/tertiary sponsor
transactions
Typically a sponsor targets an IRR
in the region of 20-25% and a
cash-on-cash return in the region
of 2.0x–2.5x
The Standard “Investment Cycle”
4
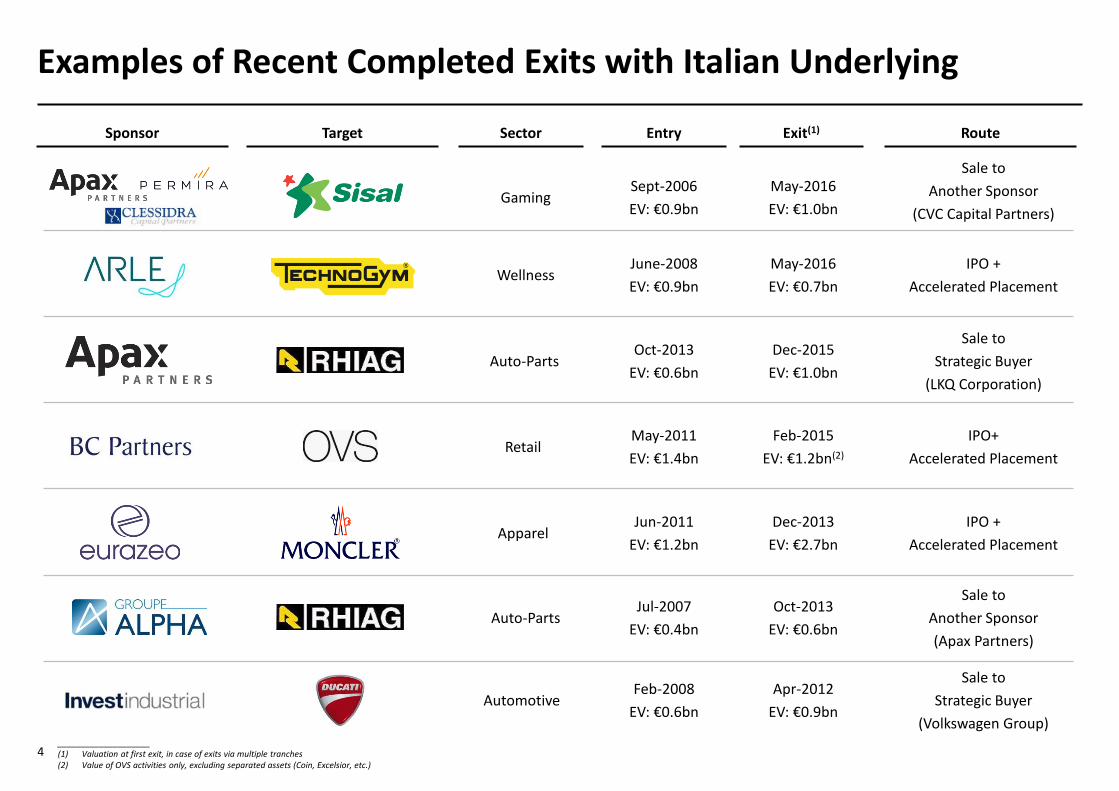
Examples of Recent Completed Exits with Italian Underlying
Target Route Sponsor Entry Exit(1) Sector
IPO +
Accelerated Placement
Jun-2011
EV: €1.2bn
Dec-2013
EV: €2.7bn Apparel
IPO+
Accelerated Placement
May-2011
EV: €1.4bn
Feb-2015
EV: €1.2bn(2) Retail
Sale to
Another Sponsor
(Apax Partners)
Jul-2007
EV: €0.4bn
Oct-2013
EV: €0.6bn Auto-Parts
____________________ (1) Valuation at first exit, in case of exits via multiple tranches (2) Value of OVS activities only, excluding separated assets (Coin, Excelsior, etc.)
Sale to
Strategic Buyer
(Volkswagen Group)
Feb-2008
EV: €0.6bn
Apr-2012
EV: €0.9bn Automotive
Sale to
Strategic Buyer
(LKQ Corporation)
Dec-2015
EV: €1.0bn Auto-Parts
Oct-2013
EV: €0.6bn
June-2008
EV: €0.9bn
May-2016
EV: €0.7bn Wellness
IPO +
Accelerated Placement
Sept-2006
EV: €0.9bn
May-2016
EV: €1.0bn Gaming
Sale to
Another Sponsor
(CVC Capital Partners)
5
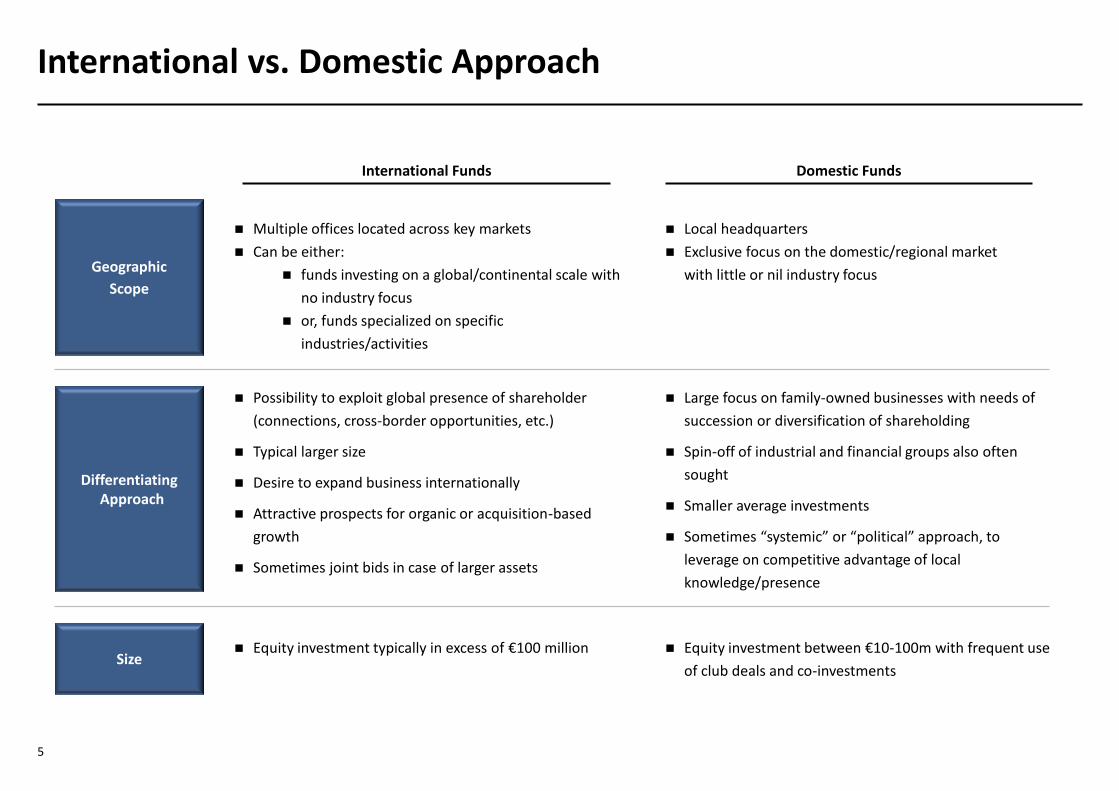
International vs. Domestic Approach
Differentiating Approach
Multiple offices located across key markets
Can be either:
funds investing on a global/continental scale with
no industry focus
or, funds specialized on specific
industries/activities
International Funds Domestic Funds
Local headquarters
Exclusive focus on the domestic/regional market
with little or nil industry focus
Equity investment typically in excess of €100 million Equity investment between €10-100m with frequent use
of club deals and co-investments
Possibility to exploit global presence of shareholder
(connections, cross-border opportunities, etc.)
Typical larger size
Desire to expand business internationally
Attractive prospects for organic or acquisition-based
growth
Sometimes joint bids in case of larger assets
Large focus on family-owned businesses with needs of
succession or diversification of shareholding
Spin-off of industrial and financial groups also often
sought
Smaller average investments
Sometimes “systemic” or “political” approach, to
leverage on competitive advantage of local
knowledge/presence
Size
Geographic
Scope
€
6
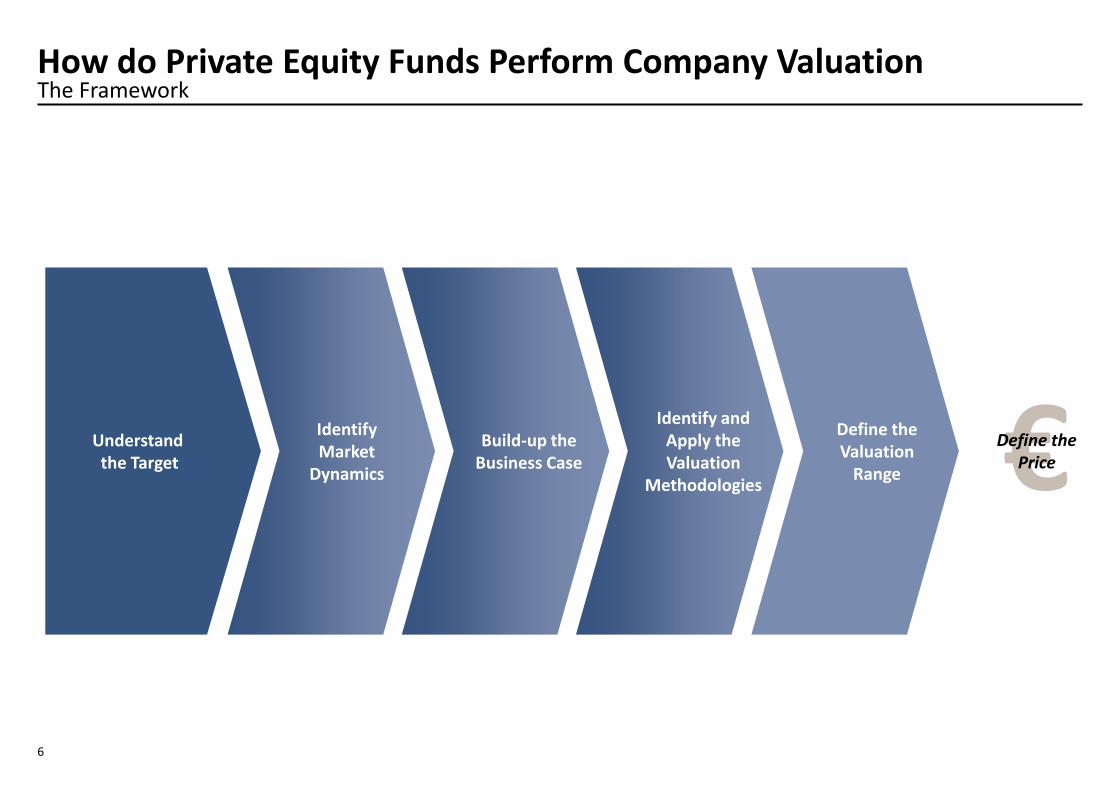
The Framework How do Private Equity Funds Perform Company Valuation
Define the Price
Identify Market
Dynamics
Build-up the Business Case
Identify and Apply the Valuation
Methodologies
Define the Valuation
Range
Understand the Target
7
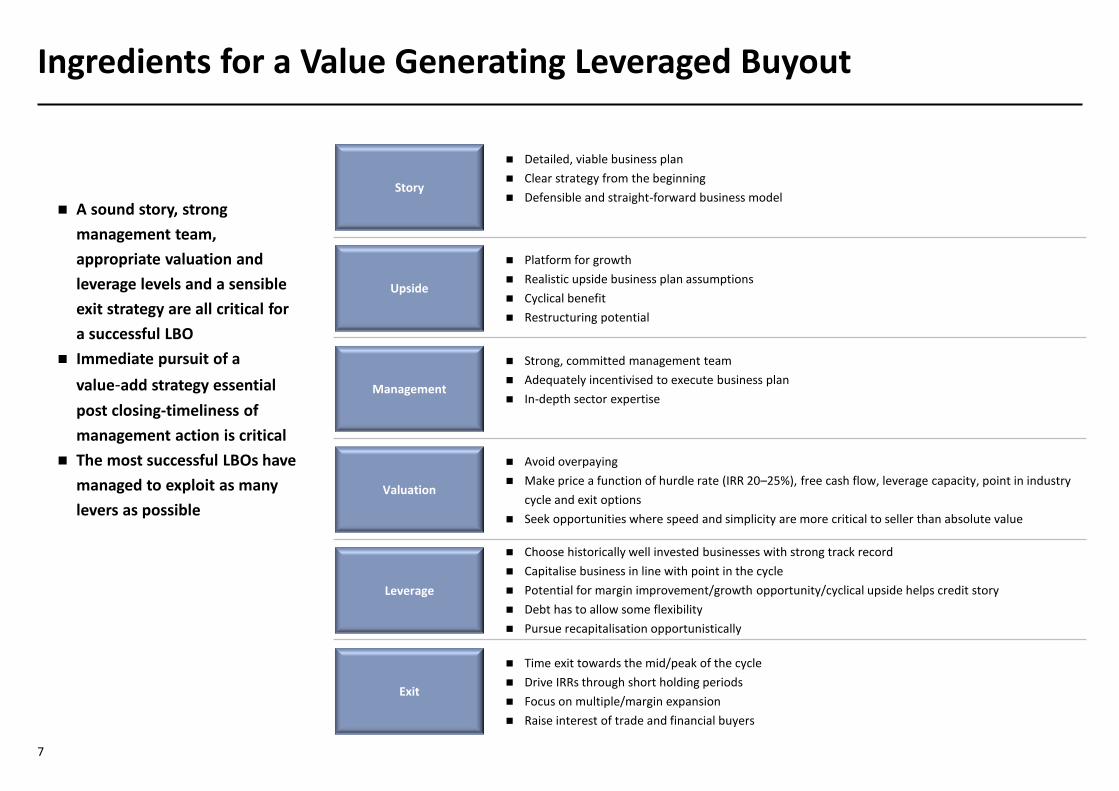
Ingredients for a Value Generating Leveraged Buyout
A sound story, strong
management team,
appropriate valuation and
leverage levels and a sensible
exit strategy are all critical for
a successful LBO
Immediate pursuit of a
value-add strategy essential
post closing-timeliness of
management action is critical
The most successful LBOs have
managed to exploit as many
levers as possible
Story
Management
Detailed, viable business plan
Clear strategy from the beginning
Defensible and straight-forward business model
Exit
Leverage
Valuation
Upside
Platform for growth
Realistic upside business plan assumptions
Cyclical benefit
Restructuring potential
Strong, committed management team
Adequately incentivised to execute business plan
In-depth sector expertise
Avoid overpaying
Make price a function of hurdle rate (IRR 20–25%), free cash flow, leverage capacity, point in industry
cycle and exit options
Seek opportunities where speed and simplicity are more critical to seller than absolute value
Choose historically well invested businesses with strong track record
Capitalise business in line with point in the cycle
Potential for margin improvement/growth opportunity/cyclical upside helps credit story
Debt has to allow some flexibility
Pursue recapitalisation opportunistically
Time exit towards the mid/peak of the cycle
Drive IRRs through short holding periods
Focus on multiple/margin expansion
Raise interest of trade and financial buyers
8
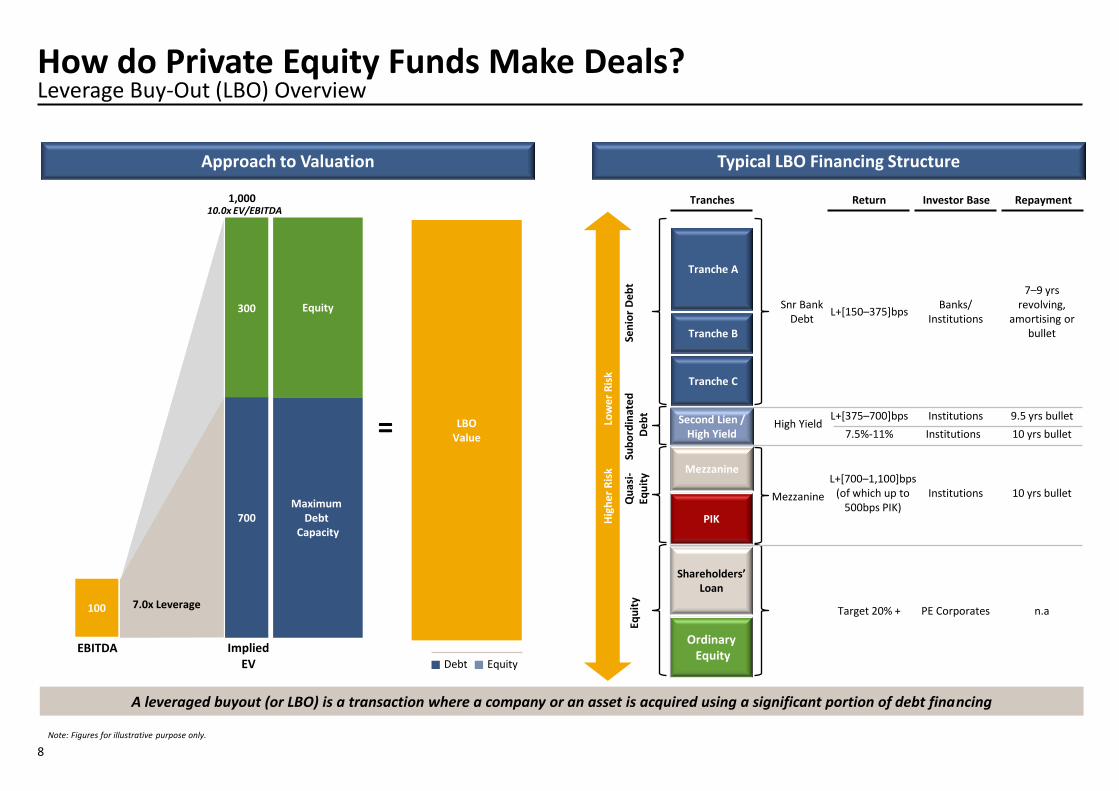
Leverage Buy-Out (LBO) Overview How do Private Equity Funds Make Deals?
Approach to Valuation Typical LBO Financing Structure
A leveraged buyout (or LBO) is a transaction where a company or an asset is acquired using a significant portion of debt financing
Note: Figures for illustrative purpose only.
Ordinary Equity
Shareholders’ Loan
PIK
Mezzanine
Second Lien / High Yield
Tranche C
Tranche B
Tranche A
Qu
asi-
Eq
uit
y Eq
uit
y
10.0x EV/EBITDA
Equity Debt
= LBO Value
7.0x Leverage
Equity 300
100
Maximum Debt
Capacity 700
1,000
Hig
he
r R
isk
Lo
we
r R
isk
Sub
ord
inat
ed
D
eb
t Se
nio
r D
eb
t
Tranches Return Investor Base Repayment
L+[150–375]bps Banks/
Institutions
7–9 yrs revolving,
amortising or bullet
Snr Bank Debt
L+[375–700]bps Institutions 9.5 yrs bullet High Yield
Mezzanine
7.5%-11% Institutions 10 yrs bullet
L+[700–1,100]bps (of which up to
500bps PIK) Institutions 10 yrs bullet
Target 20% + PE Corporates n.a
EBITDA Implied EV
9
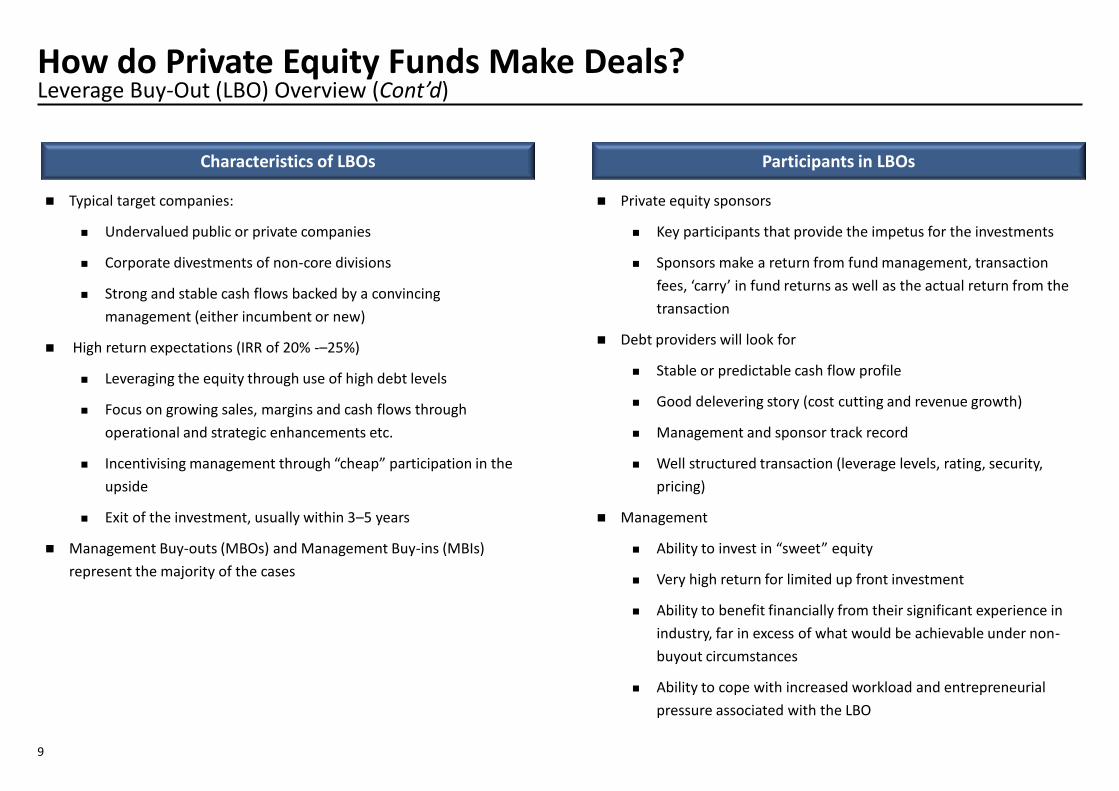
Leverage Buy-Out (LBO) Overview (Cont’d) How do Private Equity Funds Make Deals?
Typical target companies:
Undervalued public or private companies
Corporate divestments of non-core divisions
Strong and stable cash flows backed by a convincing
management (either incumbent or new)
High return expectations (IRR of 20% -–25%)
Leveraging the equity through use of high debt levels
Focus on growing sales, margins and cash flows through
operational and strategic enhancements etc.
Incentivising management through “cheap” participation in the
upside
Exit of the investment, usually within 3–5 years
Management Buy-outs (MBOs) and Management Buy-ins (MBIs)
represent the majority of the cases
Characteristics of LBOs Participants in LBOs
Private equity sponsors
Key participants that provide the impetus for the investments
Sponsors make a return from fund management, transaction
fees, ‘carry’ in fund returns as well as the actual return from the
transaction
Debt providers will look for
Stable or predictable cash flow profile
Good delevering story (cost cutting and revenue growth)
Management and sponsor track record
Well structured transaction (leverage levels, rating, security,
pricing)
Management
Ability to invest in “sweet” equity
Very high return for limited up front investment
Ability to benefit financially from their significant experience in
industry, far in excess of what would be achievable under non-
buyout circumstances
Ability to cope with increased workload and entrepreneurial
pressure associated with the LBO
10
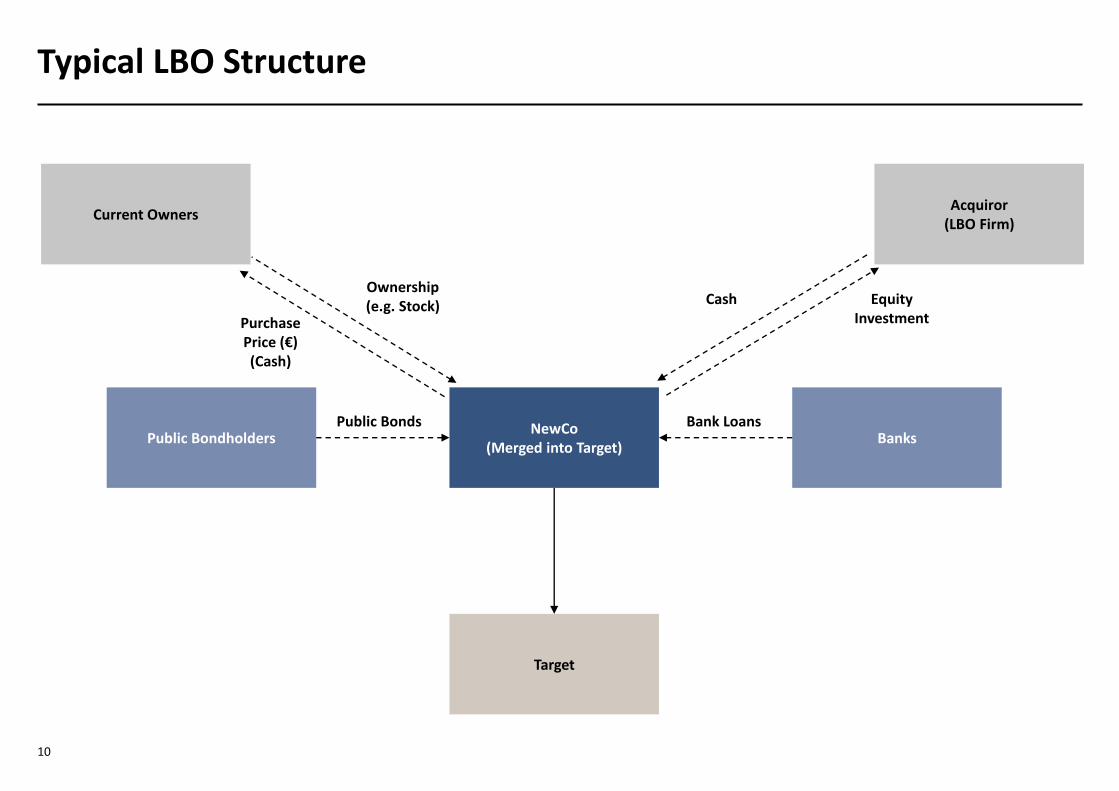
Typical LBO Structure
NewCo (Merged into Target)
Target
Public Bondholders Banks
Current Owners Acquiror
(LBO Firm)
Purchase Price (€) (Cash)
Equity Investment
Public Bonds Bank Loans
Cash Ownership (e.g. Stock)
11
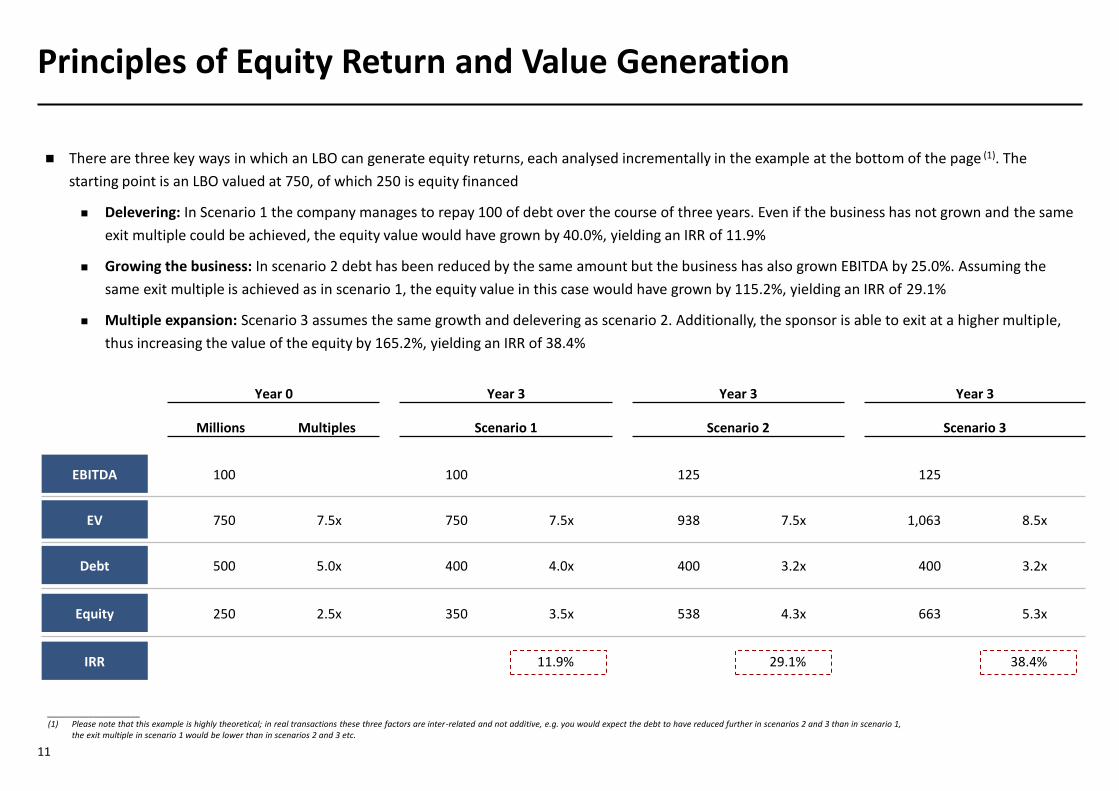
Principles of Equity Return and Value Generation
There are three key ways in which an LBO can generate equity returns, each analysed incrementally in the example at the bottom of the page (1). The
starting point is an LBO valued at 750, of which 250 is equity financed
Delevering: In Scenario 1 the company manages to repay 100 of debt over the course of three years. Even if the business has not grown and the same
exit multiple could be achieved, the equity value would have grown by 40.0%, yielding an IRR of 11.9%
Growing the business: In scenario 2 debt has been reduced by the same amount but the business has also grown EBITDA by 25.0%. Assuming the
same exit multiple is achieved as in scenario 1, the equity value in this case would have grown by 115.2%, yielding an IRR of 29.1%
Multiple expansion: Scenario 3 assumes the same growth and delevering as scenario 2. Additionally, the sponsor is able to exit at a higher multiple,
thus increasing the value of the equity by 165.2%, yielding an IRR of 38.4%
____________________ (1) Please note that this example is highly theoretical; in real transactions these three factors are inter-related and not additive, e.g. you would expect the debt to have reduced further in scenarios 2 and 3 than in scenario 1,
the exit multiple in scenario 1 would be lower than in scenarios 2 and 3 etc.
Year 0 Year 3 Year 3 Year 3
Millions Multiples Scenario 1 Scenario 2 Scenario 3
EBITDA 100 100 125 125
EV 750 7.5x 750 7.5x 938 7.5x 1,063 8.5x
Debt 500 5.0x 400 4.0x 400 3.2x 400 3.2x
Equity 250 2.5x 350 3.5x 538 4.3x 663 5.3x
IRR 11.9% 29.1% 38.4%
12
Execution Structure of an LBO
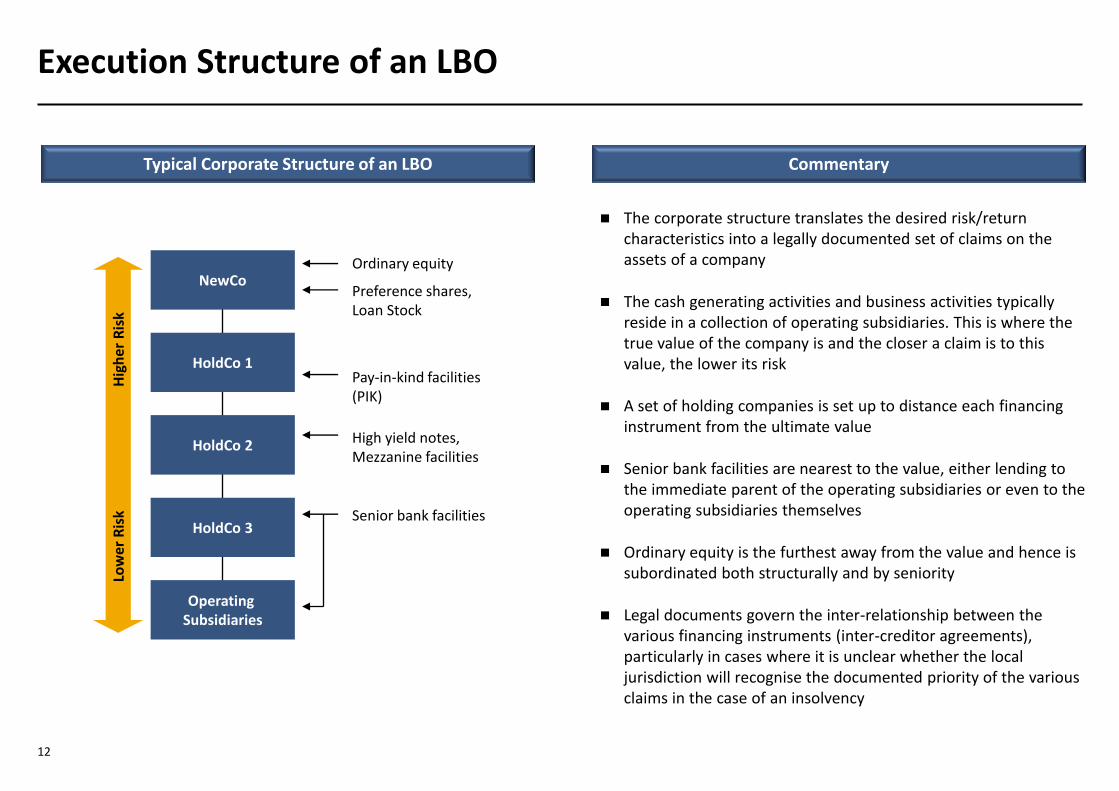
The corporate structure translates the desired risk/return characteristics into a legally documented set of claims on the assets of a company
The cash generating activities and business activities typically reside in a collection of operating subsidiaries. This is where the true value of the company is and the closer a claim is to this value, the lower its risk
A set of holding companies is set up to distance each financing instrument from the ultimate value
Senior bank facilities are nearest to the value, either lending to the immediate parent of the operating subsidiaries or even to the operating subsidiaries themselves
Ordinary equity is the furthest away from the value and hence is subordinated both structurally and by seniority
Legal documents govern the inter-relationship between the various financing instruments (inter-creditor agreements), particularly in cases where it is unclear whether the local jurisdiction will recognise the documented priority of the various claims in the case of an insolvency
Typical Corporate Structure of an LBO Commentary
NewCo
HoldCo 1
HoldCo 2
HoldCo 3
Operating Subsidiaries
Ordinary equity
Preference shares, Loan Stock
Pay-in-kind facilities (PIK)
High yield notes, Mezzanine facilities
Senior bank facilities
Low
er R
isk
H
igh
er R
isk
13
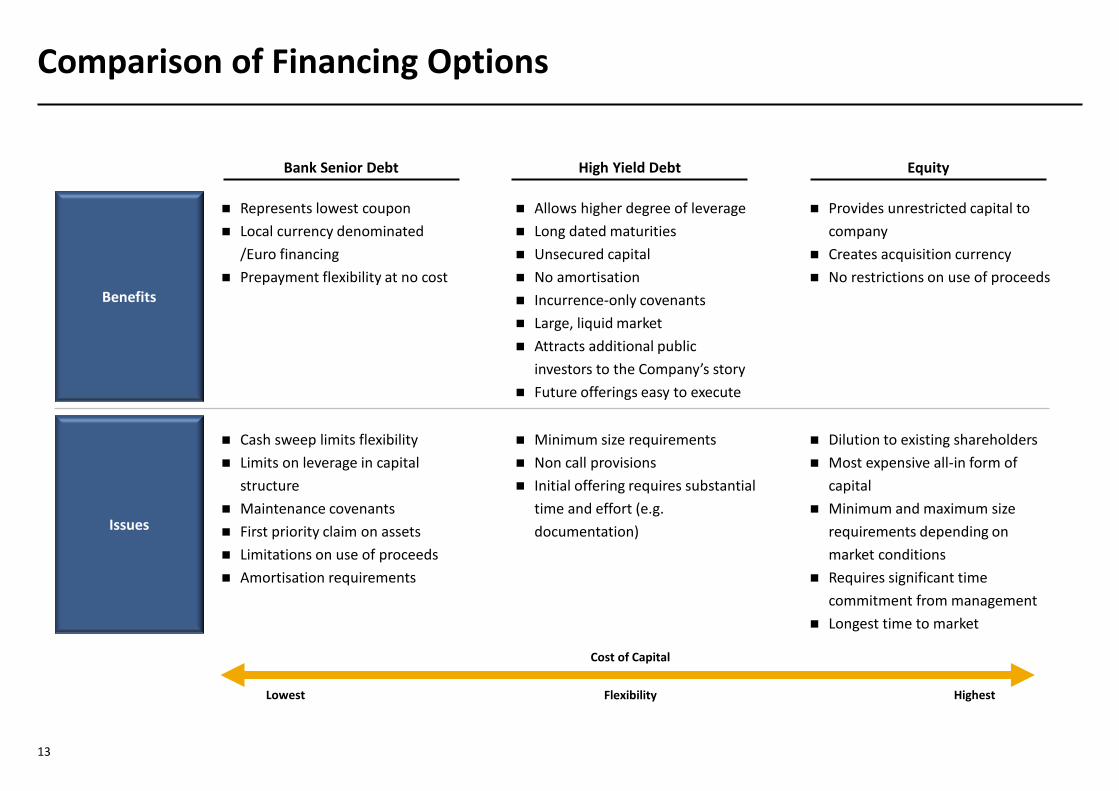
Comparison of Financing Options
Benefits
Issues
Represents lowest coupon
Local currency denominated
/Euro financing
Prepayment flexibility at no cost
Bank Senior Debt
Cash sweep limits flexibility
Limits on leverage in capital
structure
Maintenance covenants
First priority claim on assets
Limitations on use of proceeds
Amortisation requirements
High Yield Debt
Allows higher degree of leverage
Long dated maturities
Unsecured capital
No amortisation
Incurrence-only covenants
Large, liquid market
Attracts additional public
investors to the Company’s story
Future offerings easy to execute
Minimum size requirements
Non call provisions
Initial offering requires substantial
time and effort (e.g.
documentation)
Equity
Provides unrestricted capital to
company
Creates acquisition currency
No restrictions on use of proceeds
Dilution to existing shareholders
Most expensive all-in form of
capital
Minimum and maximum size
requirements depending on
market conditions
Requires significant time
commitment from management
Longest time to market
Cost of Capital
Lowest Highest Flexibility
14
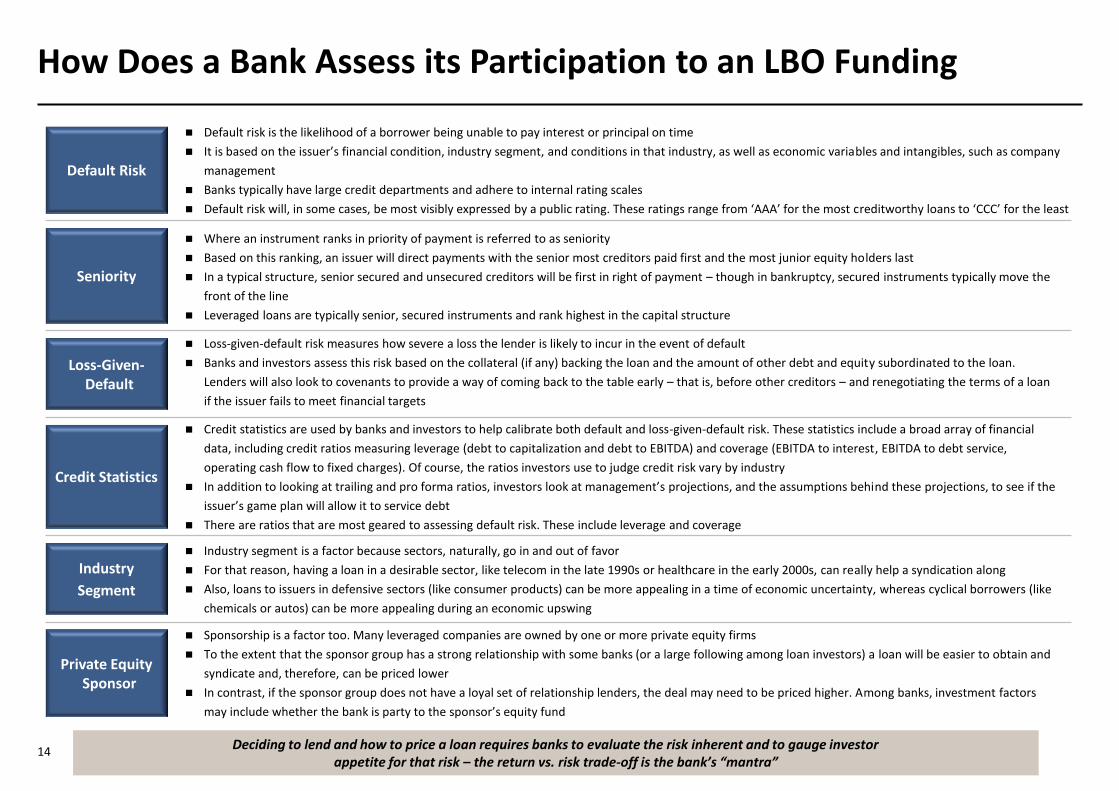
How Does a Bank Assess its Participation to an LBO Funding
Default Risk
Default risk is the likelihood of a borrower being unable to pay interest or principal on time
It is based on the issuer’s financial condition, industry segment, and conditions in that industry, as well as economic variables and intangibles, such as company
management
Banks typically have large credit departments and adhere to internal rating scales
Default risk will, in some cases, be most visibly expressed by a public rating. These ratings range from ‘AAA’ for the most creditworthy loans to ‘CCC’ for the least
Deciding to lend and how to price a loan requires banks to evaluate the risk inherent and to gauge investor appetite for that risk – the return vs. risk trade-off is the bank’s “mantra”
Seniority
Where an instrument ranks in priority of payment is referred to as seniority
Based on this ranking, an issuer will direct payments with the senior most creditors paid first and the most junior equity holders last
In a typical structure, senior secured and unsecured creditors will be first in right of payment – though in bankruptcy, secured instruments typically move the
front of the line
Leveraged loans are typically senior, secured instruments and rank highest in the capital structure
Loss-Given-Default
Loss-given-default risk measures how severe a loss the lender is likely to incur in the event of default
Banks and investors assess this risk based on the collateral (if any) backing the loan and the amount of other debt and equity subordinated to the loan.
Lenders will also look to covenants to provide a way of coming back to the table early – that is, before other creditors – and renegotiating the terms of a loan
if the issuer fails to meet financial targets
Credit Statistics
Credit statistics are used by banks and investors to help calibrate both default and loss-given-default risk. These statistics include a broad array of financial
data, including credit ratios measuring leverage (debt to capitalization and debt to EBITDA) and coverage (EBITDA to interest, EBITDA to debt service,
operating cash flow to fixed charges). Of course, the ratios investors use to judge credit risk vary by industry
In addition to looking at trailing and pro forma ratios, investors look at management’s projections, and the assumptions behind these projections, to see if the
issuer’s game plan will allow it to service debt
There are ratios that are most geared to assessing default risk. These include leverage and coverage
Industry
Segment
Industry segment is a factor because sectors, naturally, go in and out of favor
For that reason, having a loan in a desirable sector, like telecom in the late 1990s or healthcare in the early 2000s, can really help a syndication along
Also, loans to issuers in defensive sectors (like consumer products) can be more appealing in a time of economic uncertainty, whereas cyclical borrowers (like
chemicals or autos) can be more appealing during an economic upswing
Private Equity Sponsor
Sponsorship is a factor too. Many leveraged companies are owned by one or more private equity firms
To the extent that the sponsor group has a strong relationship with some banks (or a large following among loan investors) a loan will be easier to obtain and
syndicate and, therefore, can be priced lower
In contrast, if the sponsor group does not have a loyal set of relationship lenders, the deal may need to be priced higher. Among banks, investment factors
may include whether the bank is party to the sponsor’s equity fund
15
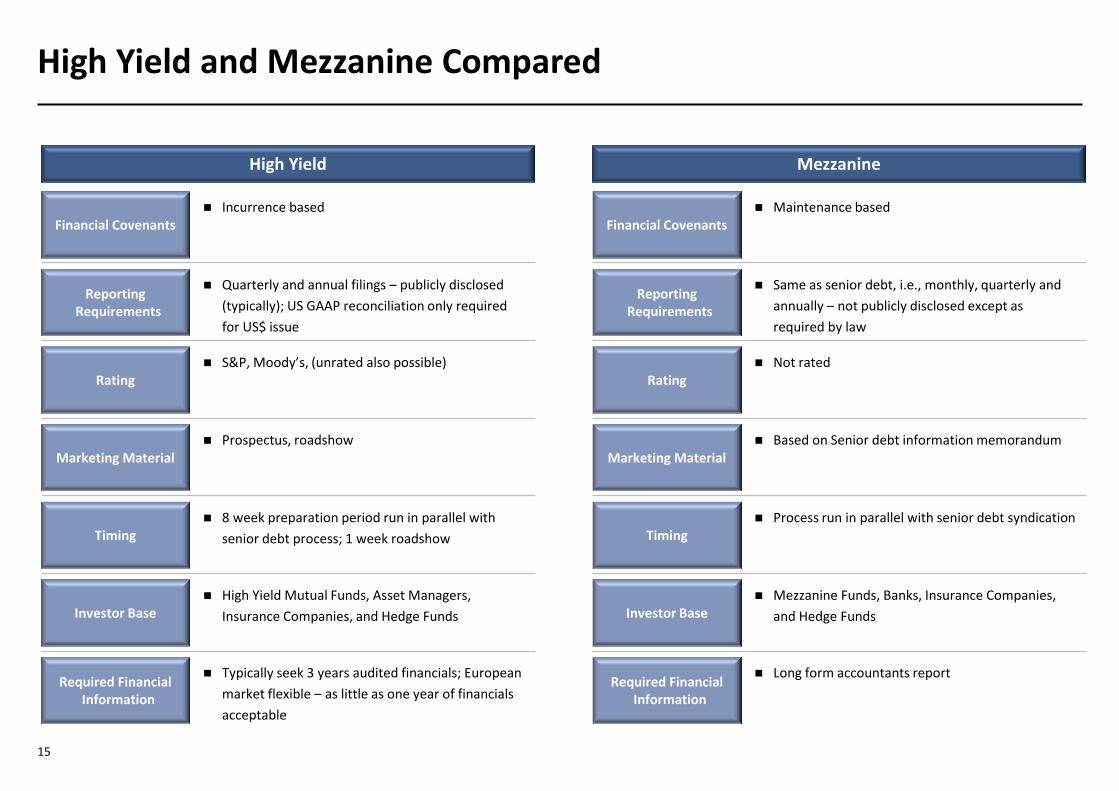
High Yield and Mezzanine Compared
High Yield Mezzanine
Financial Covenants
Rating
Incurrence based
Required Financial Information
Investor Base
Timing
Marketing Material
Reporting Requirements
Quarterly and annual filings – publicly disclosed
(typically); US GAAP reconciliation only required
for US$ issue
S&P, Moody’s, (unrated also possible)
Prospectus, roadshow
8 week preparation period run in parallel with
senior debt process; 1 week roadshow
High Yield Mutual Funds, Asset Managers,
Insurance Companies, and Hedge Funds
Typically seek 3 years audited financials; European
market flexible – as little as one year of financials
acceptable
Financial Covenants
Rating
Maintenance based
Required Financial Information
Investor Base
Timing
Marketing Material
Reporting Requirements
Same as senior debt, i.e., monthly, quarterly and
annually – not publicly disclosed except as
required by law
Not rated
Based on Senior debt information memorandum
Process run in parallel with senior debt syndication
Mezzanine Funds, Banks, Insurance Companies,
and Hedge Funds
Long form accountants report