equity house fmcg sector local research house...
TRANSCRIPT

Asiamoney’s
2013
Best Domestic
Equity House
Spotlight
2 October 2015
Disclosure: Bahana Securities does and seeks to do business with companies covered in its research reports. Investors should consider this report as only a single factor
in making their investment decision.
Please see the important disclaimer information on the back of this report
2014
Finance Asia's
Best
Equity House
Alpha
Southeast Asia
2014 Best
Research Call
FMCG Sector
Asiamoney's
2013
Best Domestic
Equity House
2015
Institutional
Investors
Highest Ranked
Local Research
House
2015
Global
Banking & Finance
Review
Best Research
House
Tiphone Mobile Indonesia Sector: Telecommunication (Overweight)
BUY (Unchanged)
Rating momentum*:
Leonardo Henry Gavaza, CFA E-mail: [email protected] Phone: +6221 250 5081 ext. 3608
Price:IDR715–TP:IDR1,180 (From IDR1,060)
TP/consensus: 104%; TP momentum*: JCI:4,207
Reseller galore
Market share gain on extensive presence and excellent performance
Tiphone Mobile Indonesia (TELE), Telkomsel’s largest voucher distributor with
a 13% market share, is set to experience substantial revenue growth in the
next few years following its Simpatindo acquisition (Telkomsel’s voucher
distributor; 8% market share), in our view. Helped by TELE’s extensive
presence across the archipelago, with 180k active resellers and 27 clusters
that have continued to perform in the top tier among the 220 Telkomsel
clusters, TELE has been named the best Telkomsel distributor for 10 years in a
row. As Telkomsel has lowered the number of its clusters to 130 (3Q15), we
expect TELE to gain a larger area. As Telkomsel ranks its distributors regularly,
TELE, as of June this year, had managed to assume 2 additional clusters in
the Sumatera region from another voucher distributor whose performance
disappointed. Hence, we expect TELE’s voucher distribution market share to
improve from 18% in 1H15 to 20% in 2015F and 30% in 2017F.
Improving revenue sustainability through channel expansion
Telkomsel has three distribution channels: conventional, through resellers;
modern, through mini markets and super markets; and machine-to-machine
(M2M), through ATMs and Internet banking. TELE already has a strong presence
in the conventional and modern channels. In 2015, TELE is expanding into M2M
distribution, having recently signed an agreement with several private banks to
channel its voucher business using several banking platforms. This operation is
expected to start in 2H15, with annual sales guidance of around IDR3tn (15% of
TELE’s total annual voucher sales). Despite lower margins from the modern and
M2M channels, we expect these distribution network to help TELE diversify its
revenue stream and improve revenue sustainability ahead.
Handset bundling to provide growth
Following the acquisition of a 25% stake in TELE by PINS, a subsidiary of
Telekomunikasi Indonesia (TLKM IJ-IDR2,620, BUY-TP: IDR3,675), we expect
greater synergies from the handset bundling program as Telkomsel plans to
increase the total number of its smartphone users. Furthermore, TELE
distributes several popular handset brands such as Samsung, Blackberry, LG
and HTC, as well as its own brand, Tiphone. We estimate that strong growth in
3G handsets would result in 2015 handset distribution revenue of IDR6.4tn,
+18% y-y, before rising to IDR7tn in 2016, +10% y-y.
Sustained growth on defensive nature; BUY on higher IDR1,180 TP
In line with our OVERWEIGHT rating on the telco sector, we expect sentiment
on TELE to remain positive at this stage of the market cycle, supported by its
defensive nature. We see TELE entering a new growth phase on expansion of
its voucher and handset businesses. Overall, we expect TELE’s 2015F net profit
to reach IDR382bn, up 25% y-y, before rising 25% y-y to IDR479bn in 2016F.
Based on our DCF methodology (WACC: 10%), we assign a 12-month target
price of IDR1,180 (IDR1,060 previously) in line with our 4-9% upgrade in
2015F-16F net profit estimates. With 65% upside potential and 11%
underperformance in the past 3 months (exhibit 4), we reaffirm our BUY rating
on TELE. Risks: lower-than-expected revenue growth and operating margins.
Exhibit 1. Company information
Market cap (IDRbn/USDmn) : 5,091/347.6
3M avg.daily t.o.(IDRbn/USDmn) : 2.4/0.2
Bloomberg code : TELE IJ Source: Bloomberg
Exhibit 2. Shareholder information
Tiphone Mobile Group (%) : 77
Est. free float (%)
: 23 Source: Bloomberg
Exhibit 3. Key forecasts and valuations
Per 31 Dec 2014 2015F 2016F 2017F
Revenues (IDRb) 14,590 19,465 25,223 31,960
EBITDA (IDRb) 528 582 710 902
EBIT (IDRb) 507 602 732 926
Net profit (IDRb) 305 382 479 632
EPS (IDR) 43.3 54.3 68.1 89.8
EPS growth (%) 3.4 25.4 25.4 31.8
EV/EBITDA (x) 11.6 10.9 9.0 7.1
P/E (x) 16.5 13.2 10.5 8.0
FCFPS (IDR) (137) (14) (2) 17
FCF yield (%) (19.1) (2.0) (0.2) 2.3
BVPS (IDR) 355 399 454 527
P/BV (x) 2.0 1.8 1.6 1.4
DPS (IDR) 10 14 17 22
Div. yield (%) 1.4 1.9 2.4 3.1
ROAA (%) 7.2 7.3 8.2 9.7
ROAE (%) 15.7 14.4 16.0 18.3
EBIT margin (%) 3.5 3.1 2.9 2.9
Net gearing (%) 48.1 45.9 43.5 35.9
Source: Company, Bloomberg, Bahana estimates
Note: Pricing as of close on 02 October 2015; n.m. = not meaningful
Exhibit 4. Relative share price performance
Source: Bloomberg, Bahana
(3.4)
(5.1)
(11.4)
(2.6)
(1.1)
(6.6)
(12)
(10)
(8)
(6)
(4)
(2)
0
(12)
(10)
(8)
(6)
(4)
(2)
0
ytd 1M 3M 6M 9M 12M
(%) (%)
tele IJ relative to JCI

2 October 2015
PT Bahana Securities – Equity Research – Tiphone Mobile Indonesia 2
2014
Finance Asia's
Best
Equity House
Alpha
Southeast Asia
2014 Best
Research Call
FMCG Sector
Asiamoney's
2013
Best Domestic
Equity House
2015
Institutional
Investors
Highest Ranked
Local Research
House
2015
Global
Banking & Finance
Review
Best Research
House

2 October 2015
PT Bahana Securities – Equity Research – Tiphone Mobile Indonesia 3
2014
Finance Asia's
Best
Equity House
Alpha
Southeast Asia
2014 Best
Research Call
FMCG Sector
Asiamoney's
2013
Best Domestic
Equity House
2015
Institutional
Investors
Highest Ranked
Local Research
House
2015
Global
Banking & Finance
Review
Best Research
House
TABLE OF CONTENTS
INVESTMENT THESIS ………………………………………………………………………………………………………………………………………………………
FINANCIAL OUTLOOK ………………………………………………………………………………………………………………………………………………………
INVESTMENT RISKS ……………………………………………………………………………………………………………
MANAGEMENT PROFILE ………………………………………………………………………………………………………………
INDUSTRY ANALYSIS ……………………………………………………………………………………………………………………………
VALUATION …………………………………………………………………………………………………………………………
RECOMMENDATION ……………………………………………………………………………………………………………
P&L, BALANCE SHEET, RATIO ……………………………………………………………………………………………
5
9
10
12
14
16
17
18

2 October 2015
PT Bahana Securities – Equity Research – Tiphone Mobile Indonesia 4
2014
Finance Asia's
Best
Equity House
Alpha
Southeast Asia
2014 Best
Research Call
FMCG Sector
Asiamoney's
2013
Best Domestic
Equity House
2015
Institutional
Investors
Highest Ranked
Local Research
House
2015
Global
Banking & Finance
Review
Best Research
House
2 October 2015
PT Bahana Securities – Equity Research – Tiphone Mobile Indonesia 5
2014
Finance Asia's
Best
Equity House
Alpha
Southeast Asia
2014 Best
Research Call
FMCG Sector
Asiamoney's
2013
Best Domestic
Equity House
2015
Institutional
Investors
Highest Ranked
Local Research
House
2015
Global
Banking & Finance
Review
Best Research
House
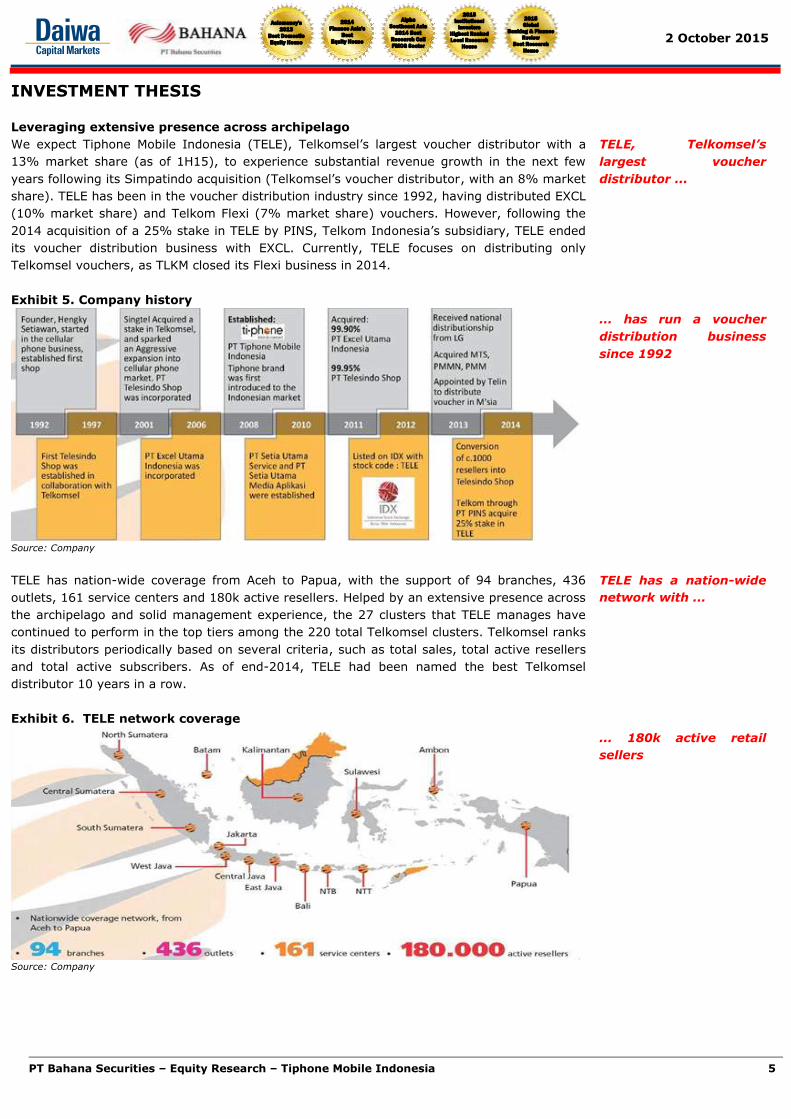
INVESTMENT THESIS Leveraging extensive presence across archipelago
We expect Tiphone Mobile Indonesia (TELE), Telkomsel’s largest voucher distributor with a
13% market share (as of 1H15), to experience substantial revenue growth in the next few
years following its Simpatindo acquisition (Telkomsel’s voucher distributor, with an 8% market
share). TELE has been in the voucher distribution industry since 1992, having distributed EXCL
(10% market share) and Telkom Flexi (7% market share) vouchers. However, following the
2014 acquisition of a 25% stake in TELE by PINS, Telkom Indonesia’s subsidiary, TELE ended
its voucher distribution business with EXCL. Currently, TELE focuses on distributing only
Telkomsel vouchers, as TLKM closed its Flexi business in 2014.
Exhibit 5. Company history
Source: Company
TELE has nation-wide coverage from Aceh to Papua, with the support of 94 branches, 436
outlets, 161 service centers and 180k active resellers. Helped by an extensive presence across
the archipelago and solid management experience, the 27 clusters that TELE manages have
continued to perform in the top tiers among the 220 total Telkomsel clusters. Telkomsel ranks
its distributors periodically based on several criteria, such as total sales, total active resellers
and total active subscribers. As of end-2014, TELE had been named the best Telkomsel
distributor 10 years in a row.
Exhibit 6. TELE network coverage
Source: Company
TELE, Telkomsel’s
largest voucher
distributor ...
... has run a voucher
distribution business
since 1992
TELE has a nation-wide
network with ...
... 180k active retail
sellers

2 October 2015
PT Bahana Securities – Equity Research – Tiphone Mobile Indonesia 6
2014
Finance Asia's
Best
Equity House
Alpha
Southeast Asia
2014 Best
Research Call
FMCG Sector
Asiamoney's
2013
Best Domestic
Equity House
2015
Institutional
Investors
Highest Ranked
Local Research
House
2015
Global
Banking & Finance
Review
Best Research
House
In line with Telkomsel’s move to improve efficiency, the company plans to lower the number of
clusters to 130 in 4Q15. As Telkomsel would use its historical distribution ranking system to
appoint voucher distributors to its new clusters, we expect TELE to gain a larger area.
Furthermore, TELE just assumed 2 more clusters in the Sumatera region from another voucher
distributor that booked disappointing performance in June. Overall, we expect TELE’s
Telkomsel’s voucher distribution market share to improve from 18% in 1H15 to 20% in 2015F
and continue to rise to 30% in 2017F.
Exhibit 7. TELE voucher revenue, 2013-17F
Source: Company, Bahana Estimates
We expect TELE’s
voucher distribution
market share to reach
30% in 2017F ...
... with revenue of
IDR23.5tn in 2017F
8,1168,799
12,631
17,607
23,460
4,000
6,000
8,000
10,000
12,000
14,000
16,000
18,000
20,000
22,000
24,000
26,000
2013 2014 2015F 2016F 2017F
(IDRbn)

2 October 2015
PT Bahana Securities – Equity Research – Tiphone Mobile Indonesia 7
2014
Finance Asia's
Best
Equity House
Alpha
Southeast Asia
2014 Best
Research Call
FMCG Sector
Asiamoney's
2013
Best Domestic
Equity House
2015
Institutional
Investors
Highest Ranked
Local Research
House
2015
Global
Banking & Finance
Review
Best Research
House
Improving revenue sustainability through channel expansion
Telkomsel has three distribution channels: conventional, through resellers; modern, through
mini markets and super market; and machine-to-machine (M2M) through ATMs and Internet
banking. Currently, TELE has a strong presence in the conventional market, as a main distributor
in 27 clusters out of Telkomsel’s total of 220 clusters. TELE’s areas are located throughout the
country, from Medan (North Sumatra) and Ketapang (West Kalimantan) to Jayapura (Papua). In
the modern channel, TELE has around an 80% share, as it sells vouchers through several strong
modern markets, including Indomaret, Alfamart, Carrefour, Superindo, Foodhall and several
others.
Exhibit 8. TELE modern channel partners
Source: Bahana
In 2015, TELE is expanding into M2M distribution as it recently signed an agreement with several
private banks to channel its voucher business using several banking platforms. This operation is
expected to start in 2H15, with annual sales guidance of around IDR3tn (30% of TELE’s total
annual voucher sales). Despite lower margins from the modern and M2M channels, we expect
this growth to provide revenue diversification for TELE, improving its revenue sustainability.
Exhibit 9. TELE M2M partners
Source: Company
TELE has a strong
presence in the
conventional channel
through its resellers,
and in the modern
channel through...
... Indomaret, Alfamaret
and Carrefour, among
others
In 2015, TELE is
expanding into the M2M
segment, through
agreements with...
... several private banks,
including BCA, CIMB
Niaga and Danamon
2 October 2015
PT Bahana Securities – Equity Research – Tiphone Mobile Indonesia 8
2014
Finance Asia's
Best
Equity House
Alpha
Southeast Asia
2014 Best
Research Call
FMCG Sector
Asiamoney's
2013
Best Domestic
Equity House
2015
Institutional
Investors
Highest Ranked
Local Research
House
2015
Global
Banking & Finance
Review
Best Research
House
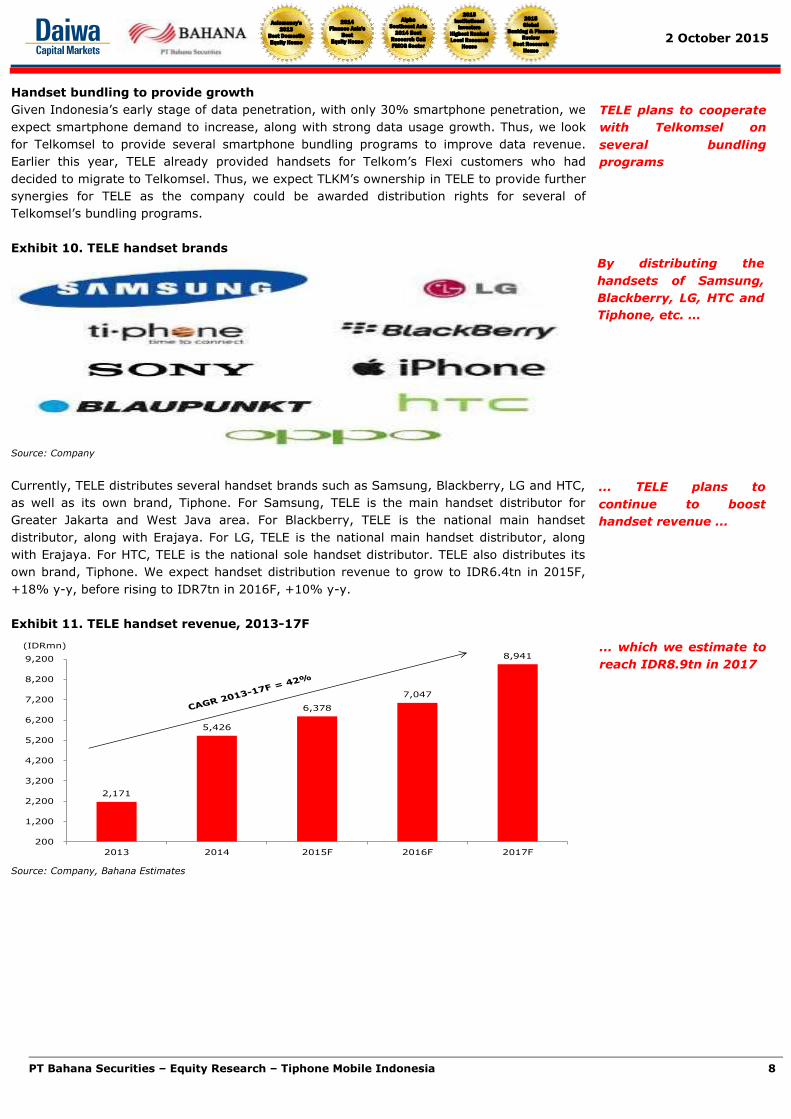
Handset bundling to provide growth
Given Indonesia’s early stage of data penetration, with only 30% smartphone penetration, we
expect smartphone demand to increase, along with strong data usage growth. Thus, we look
for Telkomsel to provide several smartphone bundling programs to improve data revenue.
Earlier this year, TELE already provided handsets for Telkom’s Flexi customers who had
decided to migrate to Telkomsel. Thus, we expect TLKM’s ownership in TELE to provide further
synergies for TELE as the company could be awarded distribution rights for several of
Telkomsel’s bundling programs.
Exhibit 10. TELE handset brands
Source: Company
Currently, TELE distributes several handset brands such as Samsung, Blackberry, LG and HTC,
as well as its own brand, Tiphone. For Samsung, TELE is the main handset distributor for
Greater Jakarta and West Java area. For Blackberry, TELE is the national main handset
distributor, along with Erajaya. For LG, TELE is the national main handset distributor, along
with Erajaya. For HTC, TELE is the national sole handset distributor. TELE also distributes its
own brand, Tiphone. We expect handset distribution revenue to grow to IDR6.4tn in 2015F,
+18% y-y, before rising to IDR7tn in 2016F, +10% y-y.
Exhibit 11. TELE handset revenue, 2013-17F
Source: Company, Bahana Estimates
TELE plans to cooperate
with Telkomsel on
several bundling
programs
By distributing the
handsets of Samsung,
Blackberry, LG, HTC and
Tiphone, etc. …
... TELE plans to
continue to boost
handset revenue ...
... which we estimate to
reach IDR8.9tn in 2017
2,171
5,426
6,378
7,047
8,941
200
1,200
2,200
3,200
4,200
5,200
6,200
7,200
8,200
9,200
2013 2014 2015F 2016F 2017F
(IDRmn)

2 October 2015
PT Bahana Securities – Equity Research – Tiphone Mobile Indonesia 9
2014
Finance Asia's
Best
Equity House
Alpha
Southeast Asia
2014 Best
Research Call
FMCG Sector
Asiamoney's
2013
Best Domestic
Equity House
2015
Institutional
Investors
Highest Ranked
Local Research
House
2015
Global
Banking & Finance
Review
Best Research
House
FINANCIAL OUTLOOK Voucher business to support revenue growth
Supported by an improved voucher distribution market share as well as solid Telkomsel
revenue growth, we expect TELE’s voucher revenue to grow 40-44% y-y in 2015F-16F. For
the handset distribution segment, we expect more conservative revenue growth of 10-18% y-
y in 2015F-16F. Thus, we upgrade our 2015F-16F revenue expectation for TELE by 8-27% to
take into account its higher revenue from voucher business due to more clusters as well as
new deals with several private banks. All in all, we expect TELE to book 2015F revenue of
IDR19.5tn, +33% y-y, before continuing to grow 30% y-y to IDR25tn in 2016F. As most of
TELE’s distributors are small resellers selling low-nominal vouchers, TELE consistently books
lucrative vouchers margins. In 2015F-16F, we expect TELE to book gross margins of 4.97-
5.15% despite tight competition in the handset distribution business. We estimate
manageable operating expenses to translate into solid operating margins of 2.9-3.1% in
2015F-16F.
Exhibit 12. TELE earnings revisions, 2015F-17F
Source: Company, Bahana Estimates
Sustained solid net profit growth expected
As TELE is still in a significant growth phase, we expect its working capital needs to remain
above IDR250bn in both 2015F and 2016F. That said, we expect TELE to spend only around
IDR25bn each in 2015F-16F on capital expenditure, as the distribution business does not
require a huge fixed asset investment. In line with our upgrade in revenue, we also upgrade
our 2015F-16F net profit by 4-9%. Helped by solid EBIT generation, we expect TELE to record
2015F net profit of IDR382bn, +25% y-y, before continuing to grow 25% y-y to IDR479bn in
2016F.
Exhibit 13. TELE net profit, 2013-17F
Source: Company, Bahana Estimates
On the back of increased
market share in voucher
business coupled with
solid growth in
Telkomsel’s revenue...
... we upgrade 2015F-
16F net profit by 4-9%
Supported by solid EBIT
generation ...
... we expect TELE to
record 2016F net profit
of IDR479bn, +25% y-y
295 305
382
479
632
100
200
300
400
500
600
700
2013 2014 2015F 2016F 2017F
(IDRbn)
2015F 2016F 2017F 2015F 2016F 2017F 2015F 2016F 2017F
Revenue (IDRb) 18,113 19,936 - 19,465 25,223 31,960 7.5 26.5 -
EBITDA 552 639 - 582 710 902 5.3 11.2 -
EBITDA margin (%) 3.0 3.2 - 3.0 2.8 2.8
Opt profit (IDRb) 573 661 - 602 732 926 5.1 10.8 -
Opt margin (%) 3.2 3.3 - 3.1 2.9 2.9
Net profit (IDRb) 366 440 - 382 479 632 4.3 8.9 -
Net margin (%) 2.0 2.2 - 2.0 1.9 2.0
EPS (IDR) 52 63 - 54 68 90 4.3 8.9 -
Old New Change (%)

2 October 2015
PT Bahana Securities – Equity Research – Tiphone Mobile Indonesia 10
2014
Finance Asia's
Best
Equity House
Alpha
Southeast Asia
2014 Best
Research Call
FMCG Sector
Asiamoney's
2013
Best Domestic
Equity House
2015
Institutional
Investors
Highest Ranked
Local Research
House
2015
Global
Banking & Finance
Review
Best Research
House
INVESTMENT RISKS
Dependence on retail/sales agents
As a distributor of mobile phones and pulses, the company and its subsidiaries are highly
dependent on the activities and results of the retail/sales agents in selling the company’s
products. The lower product sales of the company and its subsidiary to retail/sales agents
could materially and adversely affect the company’s financial performance, operational
activities, and prospects.
Changes in mobile phone technology
Mobile phones and other electronic devices have developed rapidly. As more advanced
technology emerges that differs from the products sold by the company and its subsidiary,
competitors’ mobile phones could materially, negatively, and directy affect the company’s
sales and result in unsold inventory.
Changes in consumer preferences
The increasing variety of brands and mobile phone features may influence a company’s
consumer preferences to move to another brand if the company does not actively renew their
products. These risks could materially and negatively affect the company’s financial
performance, operational activities, and prospects.
Changes in government regulations
The telecommunications sector is heavily regulated. Currently, the company’s main activities
in the trade of telecommunications equipment relates to mobile phones. If there is a change in
government regulations related to mobile phones, it could materially and adversely affect the
company’s financial performance, operational activities, and prospects.
Competition in mobile phone sales
Business competition in mobile phone sales is high. Various brands of mobile phones already
are sold freely, including cellular phones owned by the company. The increasing number of
brands offered freely could affect the company’s market share. These risks could materially
and negatively affect the company’s financial performance, operational activities, and
prospects.
Fluctuations in foreign exchange rates
The company faces the risk of fluctuations in foreign exchange rates as the company has a
USD47mn loan in a foreign currency to conduct its business activities. In addition, The
weakening of the rupiah could have a negatively material impact on the company’s business
activities, financial condition, and results of company’s operations.
Seasonal consumer purchasing patterns
The demand for mobile phones is seasonal, and is typically higher around holidays and feast
days, when new technologies are introduced by manufacturers as well as competitors,
depending on economic conditions, and the availability of products is at reasonable prices.
Seasonal buying patterns could materially and adversely affect the company’s cash flow.
Highly dependent on
retail/sales agents
Changes in mobile
technology are dynamic
Increases in brands and
mobile phone features
could affect consumer
preferences
Changes in government
telecommunications
regulations could affect
operational activities
Market share could be
affected by the
increasing number of
competitors in mobile
phone sales
The risk of fluctuations
in foreign exchange
rates may affect
revenue
Seasonal consumer
buying patterns …

2 October 2015
PT Bahana Securities – Equity Research – Tiphone Mobile Indonesia 11
2014
Finance Asia's
Best
Equity House
Alpha
Southeast Asia
2014 Best
Research Call
FMCG Sector
Asiamoney's
2013
Best Domestic
Equity House
2015
Institutional
Investors
Highest Ranked
Local Research
House
2015
Global
Banking & Finance
Review
Best Research
House
Inability to launch innovations of products and services
One of the factors that may affect sales is the company’s ability to develop and launch new
products and services in accordance with prevailing trends. If the company is unable to
provide such products, it could lose market share and competitiveness, adversely affecting
growth, revenue and prospects.
Decrease in product quality
The company does not produce its own cell phone, so there is the possibility of a decline in
product quality. This could cause a decline in market share and competitiveness, which could
materially and adversely affect the company’s financial performance, operational activities,
and prospects.
Changes in management and key employees
Currently, the company’s performance is influenced by the performance by management and
the employees. Changes in management and key employees could materially and negatively
affect the company’s financial performance, operational activities, and prospects.
.. affect ability to launch
product and service
innovations, affecting
sales
A decrease in product
quality could cause a
decline in market share
Changes in management
and key employees
could affect
performance

2 October 2015
PT Bahana Securities – Equity Research – Tiphone Mobile Indonesia 12
2014
Finance Asia's
Best
Equity House
Alpha
Southeast Asia
2014 Best
Research Call
FMCG Sector
Asiamoney's
2013
Best Domestic
Equity House
2015
Institutional
Investors
Highest Ranked
Local Research
House
2015
Global
Banking & Finance
Review
Best Research
House
MANAGEMENT PROFILE
Name and current position Previous position
Work experience in
industry
(years)
Board of Commissioners
1. Hengky Setiawan
(President Commissioner)
Director of PT Telesindo Shop
Director of PT Setia Utama Investama
Director of PT Setia Utama Towerindo
Director of PT Akses Makmur Bersama
20
2. Ferry Setiawan
(Commissioner)
Director of PT Setia Utama Media Aplikasi
Director of PT Esa Utama Inti Persada
Director of PT Pulsa Inti Nasional
Director of PT Excel Utama Indonesia
13
3. Mustapa Wangsaatmadja
(Commissioner)
President Director of PT PINS Indonesia
Commissioner of PT Admedika
Head of Department of Tech Recitation –
MASTEL
VP Innovation Strategy & Synergy of
Telekomunikasi Indonesia (Persero)
25
4. Lukman Hadikusumo
(Independent Commissioner)
Financial Consultant of PT Global Teleshop
President Director of PT Perkasa Finance
President Director of Bank Bumiputera
Money market group Head of Citibank
10
5. Achmad Herlanto Anggono
(Independent Commissioner) Audit Commitee and Risk Management of Bank
ANZ
Audit Commitee and Risk Management of PT
Energi Mega Persada Tbk
Compliance Director and Risk Management of
Bank Maybank Indocorp
Expert Group on Financial Operations
Management SBM ITB
-
Total working experience (years) 79
Average working experience (years) 14 Source: Company

2 October 2015
PT Bahana Securities – Equity Research – Tiphone Mobile Indonesia 13
2014
Finance Asia's
Best
Equity House
Alpha
Southeast Asia
2014 Best
Research Call
FMCG Sector
Asiamoney's
2013
Best Domestic
Equity House
2015
Institutional
Investors
Highest Ranked
Local Research
House
2015
Global
Banking & Finance
Review
Best Research
House
Name and current position Previous position
Work experience in
industry
(years)
Board of Directors
1. Tan Lie Pin
(President Director)
Vice President Director of TELE
Vice Director Business Development of PT
Telesindo Shop
Country Manager (Koordinator Wilayah) of PT
Telechoice Indonesia
Sales Director of PT Teletama Artha Mandiri
18
2. Rukmono Cahyadi
(Business Development
Director)
GM Sales Regional Sales Central Java and
Yogyakarta of PT Telkomsel
GM Product Pricing of PT Telkomsel
GM Device Management of PT Telkomsel
GM Sales North Sumatera Region of PT
Telkomsel
24
3. Andry Ryanto
(Marketing Director)
General Manager of PT Telesindo Shop
Balikpapan
Branch Manager of PT Telesindo Shop Bandung
Sales Manager of PT Cahaya Hyundai
Coordinator Sales of PT Auto Cipta Karya Isuzu
13
4. Meiyati Jawidjaja
(Finance Director/
Independent Director)
GM Finance & Accounting PT Telesindo Shop
Audit Manager of PT Paragon
Head of Internal Audit of PT Primaswadana
Perkasa
Finance Manager of PT Rasa Indoselera
8
Total working experience (years) 63
Average working experience (years) 16
Source: Company

2 October 2015
PT Bahana Securities – Equity Research – Tiphone Mobile Indonesia 14
2014
Finance Asia's
Best
Equity House
Alpha
Southeast Asia
2014 Best
Research Call
FMCG Sector
Asiamoney's
2013
Best Domestic
Equity House
2015
Institutional
Investors
Highest Ranked
Local Research
House
2015
Global
Banking & Finance
Review
Best Research
House
INDUSTRY ANALYSIS
Data migration period to benefit smartphone sellers
Over the past few years, the telecom industry has been experiencing a move from its legacy
business, which consists of voice and SMS, to digital business. This move has accelerated over
the past two years, as sector data usage has increased 8 times from 1Q13 to 4Q14 (exhibit
12). Given Indonesia’s early stage of data penetration, with only 50% data users and 30%
smartphone penetration, we believe data segment revenue should continue to boost the
sector’s long-term revenue growth. Thus, we think low smartphone penetration brings huge
opportunities for smartphone sellers such as TELE to benefit from the expected growth in
smartphone demand.
Exhibit 14. Sector data usage, 2Q13-2Q15
Source: Company
Telkomsel continues to dominate
In the past few quarters, ISAT has gained subscribers and revenue market share from EXCL,
as ISAT has a more robust network following its modernization phase, while EXCL is focusing
on its new value strategy. However, with a total subscriber base of 141mn (as of 3M15),
representing a 55% market share among the big 3, Telkomsel has maintained its dominance
in the telecom sector. Furthermore, Telkomsel has maintained its price leadership, as shown
by its high ARPU of IDR39k, much higher than those of ISAT and EXCL of around IDR29k.
Exihibit 15. Big 3 subscribers, 2Q13-2Q15
Source: Company
Expected increase in
smartphone penetration
rate ...
... should support data
usage to continue its
strong growth phase
Telkomsel continues to
be the dominant player
...
... with the total number
of subscribers reaching
141mn and a 55%
market share among the
big 3
0
20
40
60
80
100
120
140
0
10
20
30
40
50
60
2Q13 3Q13 4Q13 1Q14 2Q14 3Q14 4Q14 1Q15 2Q15
EXCL ISAT TLKM (RHS)
(Petabytes) (Petabytes)
120.0
125.0
130.0
135.0
140.0
145.0
40.0
45.0
50.0
55.0
60.0
65.0
70.0
2Q13 3Q13 4Q13 1Q14 2Q14 3Q14 4Q14 1Q15 2Q15
EXCL ISAT TLKM (RHS)
(mn subs) (mn subs)

2 October 2015
PT Bahana Securities – Equity Research – Tiphone Mobile Indonesia 15
2014
Finance Asia's
Best
Equity House
Alpha
Southeast Asia
2014 Best
Research Call
FMCG Sector
Asiamoney's
2013
Best Domestic
Equity House
2015
Institutional
Investors
Highest Ranked
Local Research
House
2015
Global
Banking & Finance
Review
Best Research
House
Telkomsel’s strong revenue growth to support voucher business
Supported by strong data usage growth, Telkomsel booked a strong revenue CAGR of 11% in
2011-14. As of 3M15, Telkomsel’s revenue grew 12% y-y, with data usage growth of 110% y-
y. We expect this trend to continue as smartphone penetration is still low and expected long-
term GDP growth still looks attractive at 5% y-y in 2015F-17F, as 50% of the country’s
population is around 10-34 years old (young, productive and high-consuming age group).
Furthermore, around 98% of total Telkomsel subscribers are pre-paid customers who use
vouchers to top up their balances. Thus, we expect Telkomsel to see strong revenue growth to
improve voucher demand.
Exhibit 16. Telkomsel revenue, 2012-2015F & 6M14-6M15
Source: Company
Telkomsel has three main voucher distribution channels
Telkomsel has three distribution channels – conventional, modern and M2M. In the conventional
segment, Telkomsel divides Indonesia into 220 clusters, and appoints one voucher distributor for
every cluster. The voucher distributor then uses a huge number of resellers to sell vouchers to
customers. In the modern market segment, the vouchers are sold through modern channels
such as minimarkets, super markets and department stores. In the M2M segment, vouchers are
sold through banking channels such as ATMs, Internet banking and mobile banking.
In terms of margins, distributors in the conventional segment usually see higher margins than
distributors in the modern and M2M channels, as low-nominal-value vouchers are usually more
popular in the conventional segment while high-nominal-value vouchers usually are more
popular in the modern and M2M segments. In the voucher distribution industry, the lower the
nominal value, the higher the margin.
Exhibit 17. Telkomsel voucher distribution channels
Source: Company
With 98% Telkomsel’s
subscribers still using
top-ups, we expect
voucher demand to
continue to see solid
growth ...
... in line with
Telkomsel’s strong
revenue growth
3 distribution channels
Conventional segment
margins are typically
higher than those of
other segments
Distribution channels
77,143
82,967
89,696
98,258
50,000
60,000
70,000
80,000
90,000
100,000
2012 2013 2014 2015F
(IDRbn)
43,542
48,840
40,500
42,000
43,500
45,000
46,500
48,000
49,500
6M14 6M15
(IDRbn)

2 October 2015
PT Bahana Securities – Equity Research – Tiphone Mobile Indonesia 16
2014
Finance Asia's
Best
Equity House
Alpha
Southeast Asia
2014 Best
Research Call
FMCG Sector
Asiamoney's
2013
Best Domestic
Equity House
2015
Institutional
Investors
Highest Ranked
Local Research
House
2015
Global
Banking & Finance
Review
Best Research
House
VALUATION
Looks attractively valued, with solid growth prospects
In terms of valuation, regional peers are trading at a 2016F PE of 9.7x with expected EPS
growth of 20% y-y. Despite trading above the regional average at a 2016F PE of 10.5x (8%
premium to regional peers), TELE still looks attractive on expected strong growth, as its 2016F
EPS growth of 25% y-y is much higher than the peer expectation of 20% y-y. Compare to its
regional peers, TELE also has stronger 2016F ROE of 16.0% (regional peers average: 9.6%).
Thus, at this stage of the market cycle, we believe that TELE is attractively valued given its
sustained solid growth ahead as well as attractive ROE.
Exhibit 18. Telco retail companies: regional valuation, 2016F
M a rk e t C a p 2 0 16 F 2 0 16 F 2 0 16 F 2 0 16 F 2 0 16 F 2 0 16 F
C o m pa ny ( U S D bn)
IN D O N E S IA 0 .5 9 .3 2 2 .0 8 .2 1.3 0 .4 14 .3
Erajaya Swasem bada 0.1 5.6 11.2 5.5 0.5 0.5 8.9
T ipho ne M o bile Indo nes ia 0.3 10.5 25.4 9.0 1.6 0.4 16.0
A S IA 7 .5 9 .7 2 0 .3 9 .0 1.0 0 .4 9 .3
Synnex Techno lo gy 1.6 9.1 11.6 15.5 1.1 0.8 12.7
D igital C hina 1.0 16.0 na 14.8 1.0 na 6.8
R edingto n India 0.7 10.1 35.5 7.6 1.6 0.3 16.8
Ingram M ic ro 4.2 8.3 26.1 5.3 0.8 0.3 7.4
G lo ba l we igh t e d a v e ra ge 8 .0 9 .7 2 0 .4 8 .9 1.0 0 .4 9 .6
P E R ( x) E P S gwt . ( %) E V / E B IT D A ( x) P B V ( x) P E G ( x) R O E ( x)
Source: Bloomberg, *Bahana estimates for Indonesia companies
TELE trades at a
premium to...
... regional telco retail
peers, which trade at a
2016F PE of 9.7x with
expected EPS growth of
20% y-y

2 October 2015
PT Bahana Securities – Equity Research – Tiphone Mobile Indonesia 17
2014
Finance Asia's
Best
Equity House
Alpha
Southeast Asia
2014 Best
Research Call
FMCG Sector
Asiamoney's
2013
Best Domestic
Equity House
2015
Institutional
Investors
Highest Ranked
Local Research
House
2015
Global
Banking & Finance
Review
Best Research
House
RECOMMENDATION
BUY with TP of IDR1,180
In line with our OVERWEIGHT rating in the telco sector, we expect sentiment on TELE,
supported by its defensive nature, to remain positive at this stage of the market cycle. We
believe that TLKM’s 25% ownership in TELE will benefit TELE in the longer term as we expect
significant synergies. We believe TELE is entering a new growth phase as it grows its voucher
and handset businesses. Based on our DCF methodology (WACC: 10%), we assign a 12-
month target price of IDR1,180 (IDR1,060 previously) in line with our 4-9% upgrade in
2015F-16F net profit estimates. At our target price, TELE trades at 2016 PE of 17.5x, which is
justified in our view as we now see TELE as a both a telco and a consumer play, given its
massive distribution outlets of 180k accross Indonesia. With 65% upside potential and 11%
underperformance in the past 3 months (exhibit 4), we reaffirm our BUY rating on TELE.
TELE is a BUY

2 October 2015
PT Bahana Securities – Equity Research – Tiphone Mobile Indonesia 18
2014
Finance Asia's
Best
Equity House
Alpha
Southeast Asia
2014 Best
Research Call
FMCG Sector
Asiamoney's
2013
Best Domestic
Equity House
2015
Institutional
Investors
Highest Ranked
Local Research
House
2015
Global
Banking & Finance
Review
Best Research
House
P&L, BALANCE SHEET & RATIOS
Tiphone Indonesia Year to 31 December 2013 2014 2015F 2016F 2017F PROFIT & LOSS (IDRb) Sales 10,485 14,590 19,465 25,223 31,960 Gross profit 628 819 1,003 1,252 1,582 EBITDA 452 528 582 710 902 Depreciation 15 20 20 22 24 EBIT 437 507 602 732 926 Net interest inc./(expense) (55) (121) (123) (130) (128) Forex gain/ (losses) - - - - - Other income/ (expense) 11 25 30 36 44 Pre-tax profit 393 412 509 639 842 Taxes (99) (107) (127) (160) (210) Minority interest (0) 0 0 0 0 Extraordinary gain/(losses)
Net profit 295 305 382 479 632
BALANCE SHEET (IDRb) Cash and equivalents 493 638 499 448 531 S-T investments - - - - - Trade receivables 1,301 1,642 1,854 2,193 2,557 Inventories 661 949 1,154 1,410 1,688 Fixed assets 156 145 153 153 152 Other assets 844 1,644 1,839 1,932 1,974 Total assets 3,455 5,018 5,499 6,136 6,901 Interest bearing liabilities 1,476 1,753 1,788 1,838 1,864 Trade payables 533 673 803 999 1,215 Other liabilities 59 93 100 106 117 Total liabilities 2,069 2,518 2,690 2,943 3,197 Minority interest 0 1 1 2 3 Shareholders' equity 1,387 2,499 2,809 3,193 3,705
CASH FLOW (IDRb) EBIT 437 507 602 732 926 Depreciation 15 20 20 22 24 Working capital (731) (489) (285) (399) (450) Other operating items (848) (983) (412) (342) (359) Operating cash flow (1,128) (944) (75) 13 142 Net capital expenditure (59) (17) (23) (24) (25) Free cash flow (1,187) (961) (98) (11) 116
Equity raised/(bought) 33 807 - - - Net borrowings 1,299 277 35 50 26 Other financing (47) 22 (75) (91) (113) Net cash flow 98 145 (139) (51) 29 Cash flow at beginning 395 493 638 499 448 Cash flow at end 493 638 499 448 477
RATIOS ROAE (%) 23.6 15.7 14.4 16.0 18.3 ROAA (%) 12.3 7.2 7.3 8.2 9.7 EBITDA margin (%) 4.3 3.6 3.0 2.8 2.8 EBIT margin (%) 4.2 3.5 3.1 2.9 2.9 Net margin (%) 2.8 2.1 2.0 1.9 2.0 Payout ratio (%) - 23.4 25.0 25.0 25.0 Interest coverage (x) 7.9 4.2 4.9 5.6 7.2 Net gearing (%) 70.9 48.1 45.9 43.5 35.9 Debts to assets (%) 42.7 34.9 32.5 30.0 27.0 Debtor turnover (days) 45 41 35 32 29 Creditor turnover (days) 20 18 16 15 15 Inventory turnover (days) 15 15 16 17 18
MAJOR ASSUMPTIONS Vouchers and starter kit 8,116 8,799 12,631 17,607 23,460 Cellphones 2,171 5,426 6,378 7,047 7,788
Telkomsel market share 13% 13% 20% 25% 30%
Source: Company, Bahana estimates
2015F-16F net profit to increase by 25% y-y
Cash levels expected to remain stable at around IDR400-500bn in the next two years
Working capital needs to remain
above IDR250bn in 2015-16F
Lower margin in 2016F on higher
revenue from M2M business
Voucher market share to reach 30% in 2017F

Fakhrul Fulvian
[email protected] 3602
Melvin Mikha Reminov
[email protected] Associate
ext 3621
Research: +62 21 250 5081
Harry [email protected]
Senior Associate DirectorHead of Research
Strategy, Consumer
ext 3600direct: +62 21 250 5735
Dealing Room: +62 21 527 0808 (Foreign Institutional)
Teguh Hartanto
[email protected] Director
Deputy Head of Research
Banks, Cement, Aviationext 3610
Leonardo Henry Gavaza, [email protected]
Senior Research ManagerAuto, Heavy equipment, Telco
ext 3608
Chandra Widjanarka
[email protected] Analyst
ext 1252
+62 21 250 5508 (Domestic Institutional)
Ashish Agrawal
[email protected] President
Institutional Equity Salesext 2550 / 2553
Reynard Poernawan
[email protected] Equity Sales
ext 2528
John M. Dasaad
[email protected] Sales
ext 2549
Yohanes Adhi Handoko
[email protected], Surabaya Branch
ext 7250
Suwardi Widjaja
[email protected] Sales
ext 2548
Amelia Husada
[email protected] President
Institutional Equity Salesext 2552
Michael W Setjoadi [email protected]
Research AnalystConsumer, Healthcare, Poultry
ext 3613
Nurul Farida
[email protected] Sales
ext 2543
Adrian Mahendra Putra
[email protected] AnalystIndustrial Estate
ext 3614
Hanna Marionda
[email protected] Trader
ext 2525
Adriana Kosasih
[email protected] Executive
ext 2541
Ari Santosa
[email protected] Trader
ext 2554
Adi Saputra
[email protected] & Fixed Income Associate
ext 3693
Robin Sutanto
[email protected] Analyst
Propertyext 3620
Agustinus Reza Kirana
[email protected] Analyst
Plantations, Shipping, Transportationext 3616
Research AnalystCement, Infratructure,Toll roads
ext 3605
Muhammad Wafi
[email protected] Analyst
ext 3609
+62 31 535 2788 (Surabaya Branch)
Arandi [email protected]
Research AnalystCoal, Metals, Oil & Gas
ext 3619
Head of Equity Sales & TradingInstitutional Equity Sales
ext 2545
Made Ayu Wijayati
[email protected] Executive
ext 3607
Sanni Satrio Dwi Utomo
[email protected] Associate
ext 3611
Andre Natala Susanto
[email protected] Associate
ext 3601
Bagus Adi Yoga Prawira
[email protected] AnalystConsumer, Media
ext 3604
Zefanya Halim
[email protected] Manager
ext 3612
Novianty Permata Sari
ext 3618
Renaldy Effendy
[email protected] Associate
ext 3606
Head Office Surabaya Branch
Graha Niaga, 19th Floor Wisma BII, Ground Floor
Jl. Jend. Sudirman Kav. 58 Jl. Pemuda 60-70
Jakarta 12190 Surabaya 60271
Indonesia Indonesia
Tel. 62 21 250 5081 Tel. 62 31 535 2788
Fax. 62 21 522 6049 http://www.bahana.co.id Fax. 62 31 546 1157

Important Disclosures and Disclaimer This publication is prepared by PT.Bahana Securities and reviewed by Daiwa Securities Group Inc. and/or its affiliates, and distributed outside Indonesia by Daiwa Securities Group Inc. and/or its affiliates, except to the extent expressly provided herein. Certain copies of this publication may be distributed inside and outside of Indonesia by PT. Bahana Securities in accordance with relevant laws and regulations. This publication and the contents hereof are intended for information purposes only, and may be subject to change without further notice. Any use, disclosure, distribution, dissemination, copying, printing or reliance on this publication for any other purpose without our prior consent or approval is strictly prohibited. Any review does not constitute a full verification of the publication and merely provides a minimum check. Neither Daiwa Securities Group Inc. nor any of its respective parent, holding, subsidiaries or affiliates, nor any of its respective directors, officers, servants and employees, represent nor warrant the accuracy or completeness of the information contained herein or as to the existence of other facts which might be significant, and will not accept any responsibility or liability whatsoever for any use of or reliance upon this publication or any of the contents hereof. Neither this publication, nor any content hereof, constitute, or are to be construed as, an offer or solicitation of an offer to buy or sell any of the securities or investments mentioned herein in any country or jurisdiction nor, unless expressly provided, any recommendation or investment opinion or advice. Any view, recommendation, opinion or advice expressed in this publication constitutes the views of the analyst(s) named herein and does not necessarily reflect those of Daiwa Securities Group Inc. and/or its affiliates nor any of its respective directors, officers, servants and employees except where the publication states otherwise. This research report is not to be relied upon by any person in making any investment decision or otherwise advising with respect to, or dealing in, the securities mentioned, as it does not take into account the specific investment objectives, financial situation and particular needs of any person.
Neither Daiwa Securities Group Inc. nor any of its affiliates is licensed to undertake any business within the Republic of Indonesia. Any display of any trade name or logo of the Daiwa Securities Group Inc. on this publication shall not be deemed to be an undertaking of any business within the Republic of Indonesia.
Daiwa Securities Group Inc., its subsidiaries or affiliates, or its or their respective directors, officers and employees from time to time may have trades as principals, or have positions in, or have other interests in the securities of the company under research including market making activities, derivatives in respect of such securities or may have also performed investment banking and other services for the issuer of such securities. The following are additional disclosures.
Ownership of Securities
For “Ownership of Securities” information, please visit BlueMatrix disclosure link at https://daiwa3.bluematrix.com/sellside/Disclosures.action.
Investment Banking Relationship
For “Investment Banking Relationship”, please visit BlueMatrix disclosure link at https://daiwa3.bluematrix.com/sellside/Disclosures.action.
Japan
Daiwa Securities Co. Ltd. and Daiwa Securities Group Inc.
Daiwa Securities Co. Ltd. is a subsidiary of Daiwa Securities Group Inc.
Investment Banking Relationship
Within the preceding 12 months, The subsidiaries and/or affiliates of Daiwa Securities Group Inc. * has lead-managed public offerings and/or secondary offerings (excluding straight bonds) of the securities of the following companies: Modern Land (China) Co. Ltd (1107 HK); econtext Asia Ltd (1390 HK); Accordia Golf Trust (AGT SP); Hua Hong Semiconductor Ltd (1347 HK); GF Securities Co Ltd (1776 HK); Mirae Asset Life Insurance Co Ltd (085620 KS).
*Subsidiaries of Daiwa Securities Group Inc. for the purposes of this section shall mean any one or more of:
• Daiwa Capital Markets Hong Kong Limited (大和資本市場香港有限公司)
• Daiwa Capital Markets Singapore Limited
• Daiwa Capital Markets Australia Limited
• Daiwa Capital Markets India Private Limited
• Daiwa-Cathay Capital Markets Co., Ltd.
• Daiwa Securities Capital Markets Korea Co., Ltd
Disclosure of Interest of Bahana Securities
Investment Banking Relationship
Within the preceding 12 months, Bahana Securities has lead-managed public offerings and/or secondary offerings (excluding straight bonds) of the securities of the following companies: J Resources Asia Pasific Tbk PT (PSAB IJ); Waskita Karya Persero Tbk PT (WSKT IJ); Adhi Karya Persero Tbk PT (ADHI IJ); PP Properti Tbk PT (PPRO IJ); Merdeka Copper Gold Tbk PT (MDKA IJ); Anabatic Technologies Tbk PT (ATIC IJ).
Hong Kong
This research is distributed in Hong Kong by Daiwa Capital Markets Hong Kong Limited (大和資本市場香港有限公司) (“DHK”) which is regulated by the Hong Kong Securities and Futures Commission. Recipients of this research in Hong Kong may contact DHK in respect of any matter arising from or in connection with this research.
Relevant Relationship (DHK)
DHK may from time to time have an individual employed by or associated with it serves as an officer of any of the companies under its research coverage.
Singapore
This research is distributed in Singapore by Daiwa Capital Markets Singapore Limited and it may only be distributed in Singapore to accredited investors, expert investors and institutional investors as defined in the Financial Advisers Regulations and the Securities and Futures Act (Chapter 289), as amended from time to time. By virtue of distribution to these category of investors, Daiwa Capital Markets Singapore Limited and its representatives are not required to comply with Section 36 of the Financial Advisers Act (Chapter 110) (Section 36 relates to disclosure of Daiwa Capital Markets Singapore Limited’s interest and/or its representative’s interest in securities). Recipients of this research in Singapore may contact Daiwa Capital Markets Singapore Limited in respect of any matter arising from or in connection with the research.
Australia
This research is distributed in Australia by Daiwa Capital Markets Australia Limited and it may only be distributed in Australia to wholesale investors within the meaning of the Corporations Act. Recipients of this research in Australia may contact Daiwa Capital Markets Stockbroking Limited in respect of any matter arising from or in connection with the research.
India
This research is distributed in India to Institutional Clients only by Daiwa Capital Markets India Private Limited (Daiwa India) which is an intermediary registered with Securities & Exchange Board of India as a Stock Broker, Merchant Bank and Research Analyst. Daiwa India, its Research Analyst and their family members and its associates do not have any financial interest save as disclosed or other undisclosed material conflict of interest in the securities or derivatives of any companies under coverage. Daiwa India and its associates may have received compensation for any products other than Investment Banking (as disclosed) or brokerage services from the subject company in this report during the past 12 months. Unless otherwise stated in BlueMatrix disclosure link at https://daiwa3.bluematrix.com/sellside/Disclosures.action, Daiwa India and its associates do not hold more than 1% of any companies covered in this research report.
There is no material disciplinary action against Daiwa India by any regulatory authority impacting equity research analysis activities as of the date of this report.

Taiwan
This research is distributed in Taiwan by Daiwa-Cathay Capital Markets Co., Ltd and it may only be distributed in Taiwan to institutional investors or specific investors who have signed recommendation contracts with Daiwa-Cathay Capital Markets Co., Ltd in accordance with the Operational Regulations Governing Securities Firms Recommending Trades in Securities to Customers. Recipients of this research in Taiwan may contact Daiwa-Cathay Capital Markets Co., Ltd in respect of any matter arising from or in connection with the research.
Philippines
This research is distributed in the Philippines by DBP-Daiwa Capital Markets Philippines, Inc. which is regulated by the Philippines Securities and Exchange
Commission and the Philippines Stock Exchange, Inc. Recipients of this research in the Philippines may contact DBP-Daiwa Capital Markets Philippines, Inc.
in respect of any matter arising from or in connection with the research. DBP-Daiwa Capital Markets Philippines, Inc. recommends that investors
independently assess, with a professional advisor, the specific financial risks as well as the legal, regulatory, tax, accounting, and other consequences of a proposed transaction. DBP-Daiwa Capital Markets Philippines, Inc. may have positions or may be materially interested in the securities in any of the markets
mentioned in the publication or may have performed other services for the issuers of such securities.
For relevant securities and trading rules please visit SEC and PSE link at http://www.sec.gov.ph/irr/AmendedIRRfinalversion.pdf and
http://www.pse.com.ph/ respectively.
United Kingdom
This research report is produced by Daiwa Capital Markets Europe Limited and/or its affiliates and is distributed in the European Union, Iceland, Liechtenstein, Norway and Switzerland. Daiwa Capital Markets Europe Limited is authorised and regulated by The Financial Conduct Authority (“FCA”) and is a member of the London Stock Exchange, Eurex and NYSE Liffe.
This publication is intended for investors who are not Retail Clients in the United Kingdom within the meaning of the Rules of the FCA and should not therefore be distributed to such Retail Clients in the United Kingdom. Should you enter into investment business with Daiwa Capital Markets Europe’s affiliates outside the United Kingdom, we are obliged to advise that the protection afforded by the United Kingdom regulatory system may not apply; in particular, the benefits of the Financial Services Compensation Scheme may not be available.
Daiwa Capital Markets Europe Limited has in place organisational arrangements for the prevention and avoidance of conflicts of interest. Our conflict management policy is available at http://www.uk.daiwacm.com/about-us/corporate-governance-regulatory.
Germany
This document is distributed in Germany by Daiwa Capital Markets Europe Limited, Niederlassung Frankfurt which is regulated by BaFin (Bundesanstalt fuer Finanzdienstleistungsaufsicht) for the conduct of business in Germany.
Bahrain
This research material is distributed by Daiwa Capital Markets Europe Limited, Bahrain Branch, regulated by The Central Bank of Bahrain and holds Investment Business Firm – Category 2 license and having its official place of business at the Bahrain World Trade Centre, South Tower, 7th floor, P.O. Box 30069, Manama, Kingdom of Bahrain. Tel No. +973 17534452 Fax No. +973 535113
This material is provided as a reference for making investment decisions and is not intended to be a solicitation for investment. Investment decisions should be made at your own discretion and risk. Accordingly, no representation or warranty, express or implied, is made as to and no reliance should be placed on the fairness, accuracy, completeness or correctness of the information and opinions contained in this document, Content herein is based on information available at the time the research material was prepared and may be amended or otherwise changed in the future without notice. All information is intended for the private use of the person to whom it is provided without any liability whatsoever on the part of Daiwa Capital Markets Europe Limited, Bahrain Branch, any associated company or the employees thereof. If you are in doubt about the suitability of the product or the research material itself, please consult your own financial adviser. Daiwa Capital Markets Europe Limited, Bahrain Branch retains all rights related to the content of this material, which may not be redistributed or otherwise transmitted without prior consent.
United States
This report is distributed in the U.S. by Daiwa Capital Markets America Inc. (DCMA). It may not be accurate or complete and should not be relied upon
as such. It reflects the preparer’s views at the time of its preparation, but may not reflect events occurring after its preparation; nor does it reflect
PT.Bahana Securities’ or DCMA’s views at any time. Neither PT.Bahana Securities, DCMA nor the preparer has any obligation to update this report
or to continue to prepare research on this subject. This report is not an offer to sell or the solicitation of any offer to buy securities. Unless this report
says otherwise, any recommendation it makes is risky and appropriate only for sophisticated speculative investors able to incur significant losses.
Readers should consult their financial advisors to determine whether any such recommendation is consistent with their own investment objectives,
financial situation and needs. This report does not recommend to U.S. recipients the use of any of PT.Bahana Securities’ or DCMA’s non-U.S. affiliates to effect trades in any security and is not supplied with any understanding that U.S. recipients of this report will direct commission business to
such non-U.S. entities. Unless applicable law permits otherwise, non-U.S. customers wishing to effect a transaction in any securities referenced in this
material should contact a Daiwa entity in their local jurisdiction. Most countries throughout the world have their own laws regulating the types of
securities and other investment products which may be offered to their residents, as well as a process for doing so. As a result, the securities
discussed in this report may not be eligible for sales in some jurisdictions. Customers wishing to obtain further information about this report should
contact DCMA: Daiwa Capital Markets America Inc., Financial Square, 32 Old Slip, New York, New York 10005 (Tel no. 212-612-7000).
Ownership of Securities
For “Ownership of Securities” information please visit BlueMatrix disclosure Link at https://daiwa3.bluematrix.com/sellside/Disclosures.action .
Investment Banking Relationships
For “Investment Banking Relationships” please visit BlueMatrix disclosure link at https://daiwa3.bluematrix.com/sellside/Disclosures.action.
DCMA Market Making
For “DCMA Market Making” please visit BlueMatrix disclosure link at https://daiwa3.bluematrix.com/sellside/Disclosures.action.
Research Analyst Conflicts
For updates on “Research Analyst Conflicts” please visit BlueMatrix disclosure link at https://daiwa3.bluematrix.com/sellside/Disclosures.action. The
principal research analysts who prepared this report have no financial interest in securities of the issuers covered in the report, are not (nor are any members of their household) an officer, director or advisory board member of the issuer(s) covered in the report, and are not aware of any material
relevant conflict of interest involving the analyst or DCMA, and did not receive any compensation from the issuer during the past 12 months except as
noted: no exceptions.
Research Analyst Certification
For updates on “Research Analyst Certification” and “Rating System” please visit BlueMatrix disclosure link at
https://daiwa3.bluematrix.com/sellside/Disclosures.action. The views about any and all of the subject securities and issuers expressed in this
Research Report accurately reflect the personal views of the research analyst(s) primarily responsible for this report (or the views of the firm
producing the report if no individual analysts[s] is named on the report); and no part of the compensation of such analyst(s) (or no part of the
compensation of the firm if no individual analyst[s)] is named on the report) was, is, or will be directly or indirectly related to the specific recommendations or views contained in this Research Report.

For stocks and sectors in Indonesia covered by Bahana Securities, the following rating system is in effect:
Stock ratings are based on absolute upside or downside, which is the difference between the target price and the current market price. Unless otherwise specified, these ratings are set with a 12-month horizon. It is possible that future price volatility may cause a temporary mismatch between upside/downside for a stock based on the market price and the formal rating. "Buy": the price of the security is expected to increase by 10% or more. "Hold": the price of the security is expected to range from an increase of less than 10% to a decline of less than 5%. "Reduce": the price of the security is expected to decline by 5% or more.
Sector ratings are based on fundamentals for the sector as a whole. Hence, a sector may be rated “Overweight” even though its constituent stocks are all rated “Reduce”; and a sector may be rated “Underweight” even though its constituent stocks are all rated “Buy”. “Overweight”: positive fundamentals for the sector. “Neutral”: neither positive nor negative fundamentals for the sector. “Underweight”: negative fundamentals for the sector.
Ownership of Securities For “Ownership of Securities” information, please visit BlueMatrix disclosure Link at https://daiwa3.bluematrix.com/sellside/Disclosures.action .
Investment Banking Relationships For “Investment Banking Relationship”, please visit BlueMatrix disclosure Link at https://daiwa3.bluematrix.com/sellside/Disclosures.action . Relevant Relationships (Bahana Securities) Bahana Securities may from time to time have an individual employed by or associated with it serves as an officer of any of the companies under its research coverage.
Bahana Securities market making Bahana Securities may from time to time make a market in securities covered by this research.
Additional information may be available upon request.
Japan - additional notification items pursuant to Article 37 of the Financial Instruments and Exchange Law
(This Notification is only applicable where report is distributed by Daiwa Securities Co. Ltd.)
If you decide to enter into a business arrangement with us based on the information described in materials presented along with this document, we ask you to pay close attention to the following items.
In addition to the purchase price of a financial instrument, we will collect a trading commission* for each transaction as agreed beforehand with you. Since
commissions may be included in the purchase price or may not be charged for certain transactions, we recommend that you confirm the commission for
each transaction.
In some cases, we may also charge a maximum of ¥ 2 million (including tax) per year as a standing proxy fee for our deposit of your securities, if you are
a non-resident of Japan.
For derivative and margin transactions etc., we may require collateral or margin requirements in accordance with an agreement made beforehand with
you. Ordinarily in such cases, the amount of the transaction will be in excess of the required collateral or margin requirements.
There is a risk that you will incur losses on your transactions due to changes in the market price of financial instruments based on fluctuations in interest
rates, exchange rates, stock prices, real estate prices, commodity prices, and others. In addition, depending on the content of the transaction, the loss
could exceed the amount of the collateral or margin requirements. There may be a difference between bid price etc. and ask price etc. of OTC derivatives handled by us.
Before engaging in any trading, please thoroughly confirm accounting and tax treatments regarding your trading in financial instruments with such experts
as certified public accountants.
*The amount of the trading commission cannot be stated here in advance because it will be determined between our company and you based on current
market conditions and the content of each transaction etc.
When making an actual transaction, please be sure to carefully read the materials presented to you prior to the execution of agreement, and to take responsibility for your own decisions regarding the signing of the agreement with us.
Corporate Name: Daiwa Securities Co. Ltd.
Financial instruments firm: chief of Kanto Local Finance Bureau (Kin-sho) No.108
Memberships: Japan Securities Dealers Association, Financial Futures Association of Japan
Japan Securities Investment Advisers Association
Type II Financial Instruments Firms Association