equitable access and progress in secondary schools in india
TRANSCRIPT
Equitable Access and Progress in Secondary Schools in India: A Policy Imperative for
Sustainable Development
Renu Singh Country Director, Young Lives, India
UKFIET conference, Oxford, 16 Sept 2015
Context
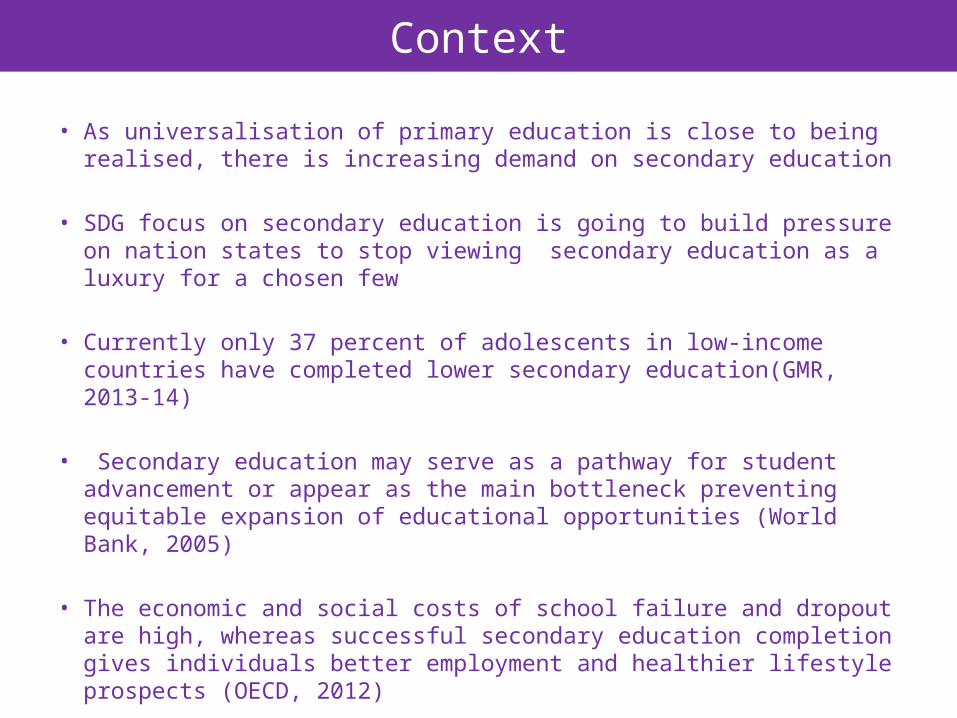
• As universalisation of primary education is close to being realised, there is increasing demand on secondary education
• SDG focus on secondary education is going to build pressure on nation states to stop viewing secondary education as a luxury for a chosen few
• Currently only 37 percent of adolescents in low-income countries have completed lower secondary education(GMR, 2013-14)
• Secondary education may serve as a pathway for student advancement or appear as the main bottleneck preventing equitable expansion of educational opportunities (World Bank, 2005)
• The economic and social costs of school failure and dropout are high, whereas successful secondary education completion gives individuals better employment and healthier lifestyle prospects (OECD, 2012)

Policy Perspective - India
• The CABE Committee Report (2005) highlighted that ‘universal secondary education is a pre-condition for equitable social development, widening participation in India’s democratic functioning, building up of an enlightened secular republic, and be globally competitive’(p.14).
• To meet the challenge of dramatically improving access, equity and quality of secondary education simultaneously the government launched a centrally sponsored scheme for secondary education, Rashtriya Madhyamik Shiksha Abhiyan (RMSA, 2009).
• The scheme seeks to enhance enrolment in classes IX and X by providing a secondary school within 5 kms of every habitation, to improve quality of education imparted at secondary level by ensuring all secondary schools conform to prescribed/ standard norms, to remove gender, socio-economic and disability barriers and to achieve near universal enrolment in secondary level education with GER exceeding 90% by 2017

Expansion in Secondary Education
2001-02 2005-06 2009-10 2013-140
50,000
100,000
150,000
200,000
250,000
133,492
159,667
190,643
237,111
Numbers of Secondary / Higher Secondary Schools
Tota
l Num
bers
Source: Education for All - India, NUEPA, 2014
Expansion in Secondary Education
2001-02 2005-06 2009-10 2013-140
10
20
30
40
50
60
70
80
90
100
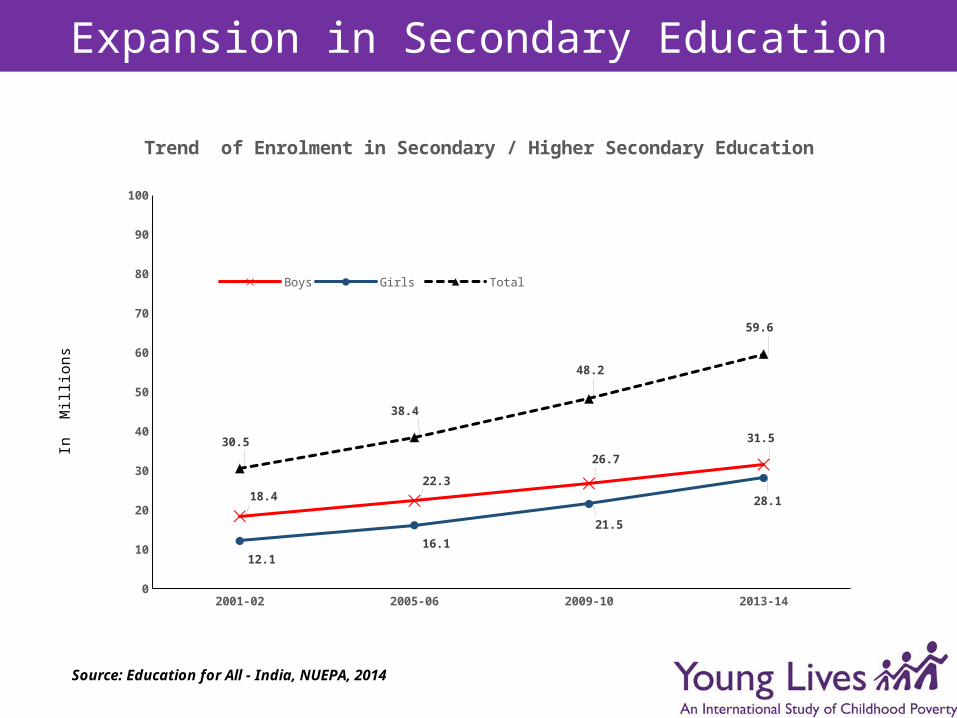
18.422.3
26.7
31.5
12.116.1
21.5
28.1
30.5
38.4
48.2
59.6
Trend of Enrolment in Secondary / Higher Secondary Education
Boys Girls Total
In M
illio
ns
Source: Education for All - India, NUEPA, 2014
6
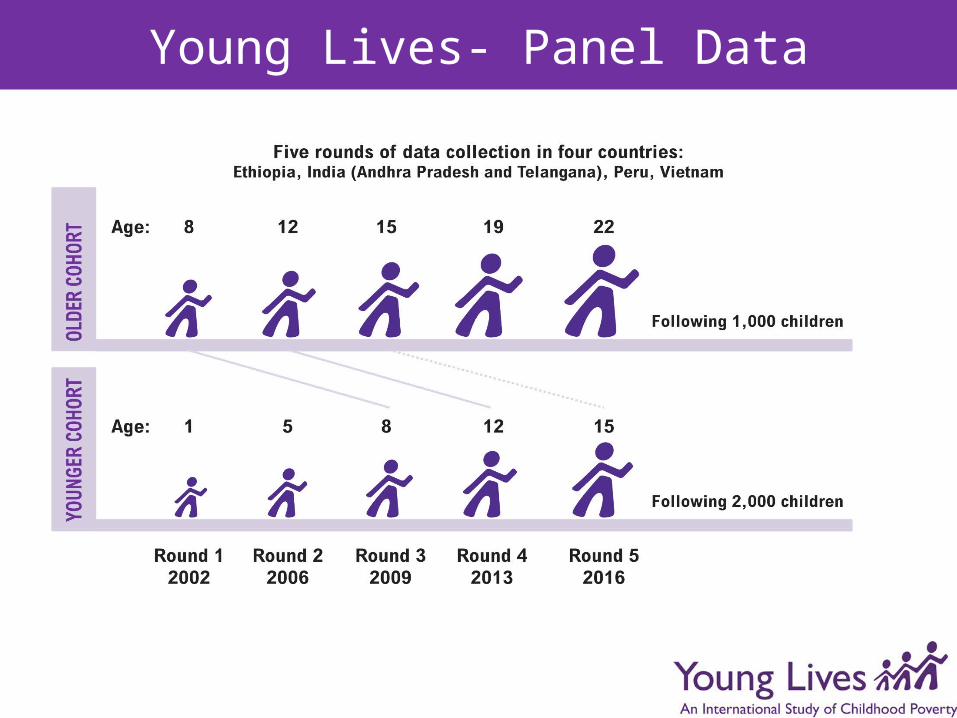
Young Lives- Panel Data

Sampling Methodology Young Lives (India)
Roughly equal numbers of boys and girls
Selection of sentinel sites/mandals – poor and ‘non-poor’ sites in each district (ranked using economic, human development and infrastructure indicators)
Mix of urban and rural sites • 4 districts (Andhra Pradesh) and 3
districts (Telangana)• 20 sentinel sites• 98 communities
Young Lives is tracking 3,000 children (2,000 Younger Cohort and 1,000 Older Cohort) in Andhra Pradesh (now Andhra Pradesh and Telangana) over 15 years
Children randomly selected (100 Younger Cohort and 50 Older Cohort children per site)
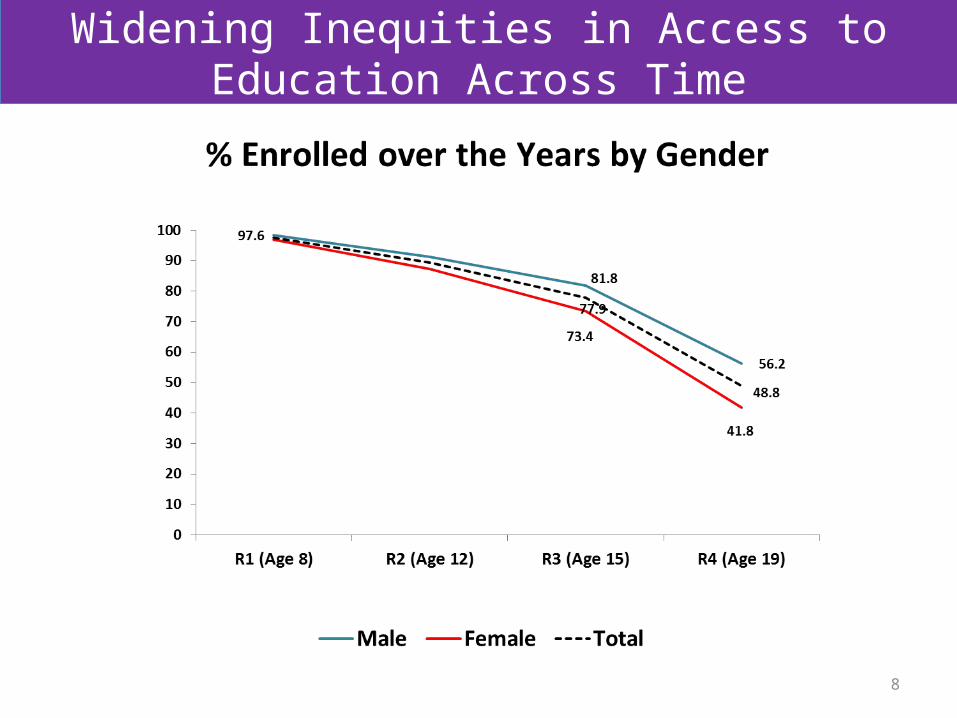
Widening Inequities in Access to Education Across Time
8

Widening Disparities in Enrolment based on Wealth Across Time
9
Total Bottom Tercile Middle Tercile Top Tercile0
10
20
30
40
50
60
70
80
90
100 97.4 96.5 98.2 97.6
88.8
81.7
90.993.9
77.4
69.573.2
89.8
48.6
34.7
44.5
66.9
Age 8 (2002) Age 12 (2005) Age 15 (2009) Age 19 (2013)
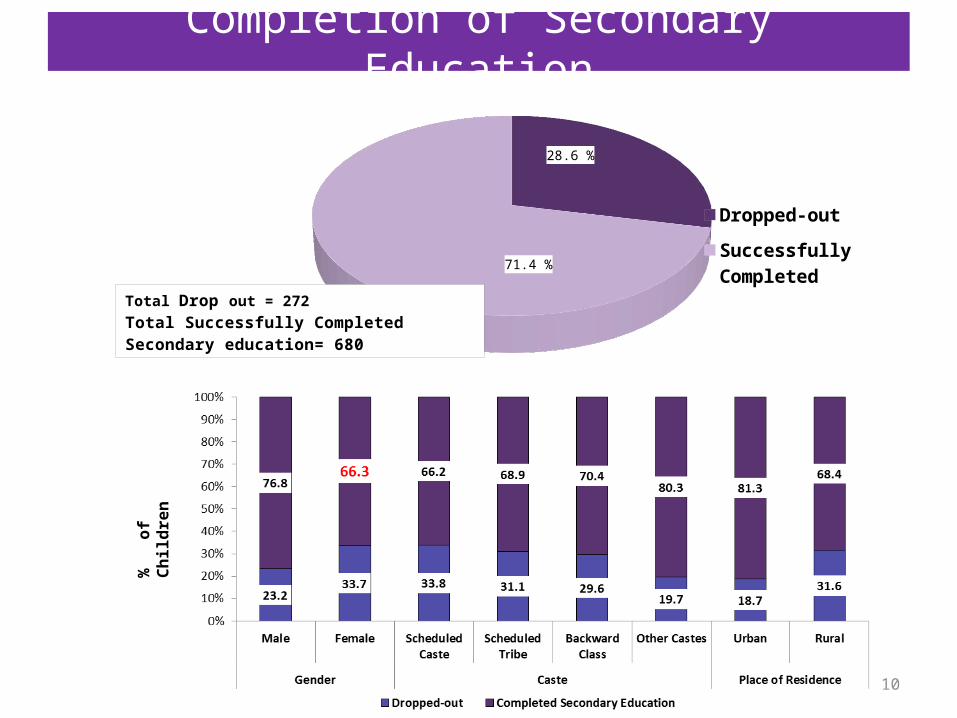
Completion of Secondary Education
10
28.6 %
71.4 %
Dropped-out
Successfully Completed
Total Drop out = 272Total Successfully Completed Secondary education= 680
%
of
C
hild
ren
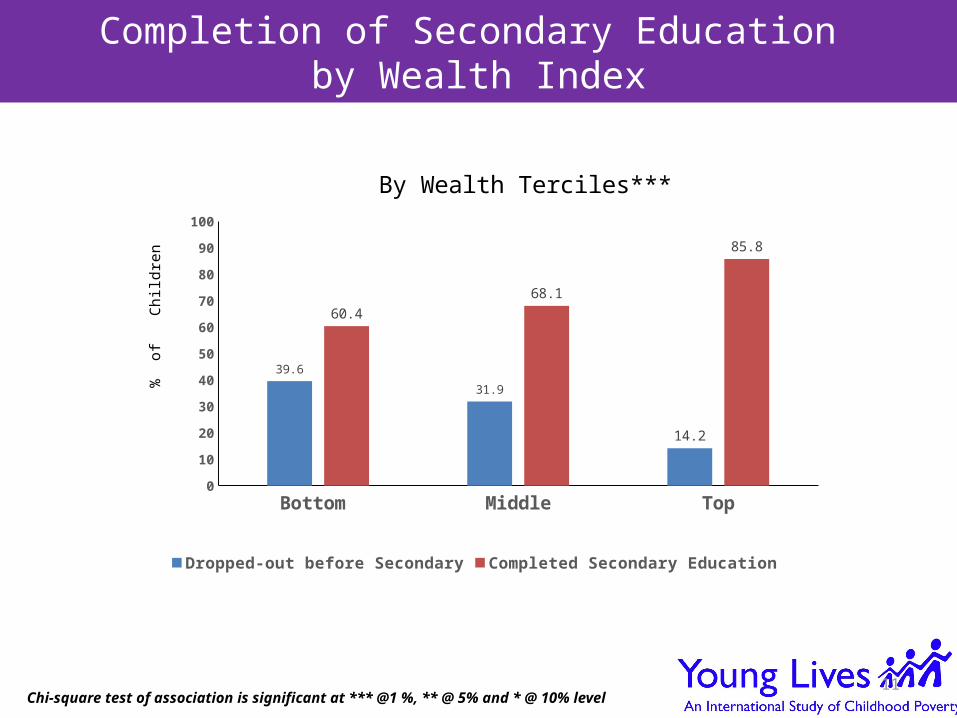
Completion of Secondary Education by Wealth Index
11
Bottom Middle Top0
10
20
30
40
50
60
70
80
90
100
39.6
31.9
14.2
60.468.1
85.8
By Wealth Terciles***
Dropped-out before Secondary Completed Secondary Education
% o
f C
hild
ren
Chi-square test of association is significant at *** @1 %, ** @ 5% and * @ 10% level
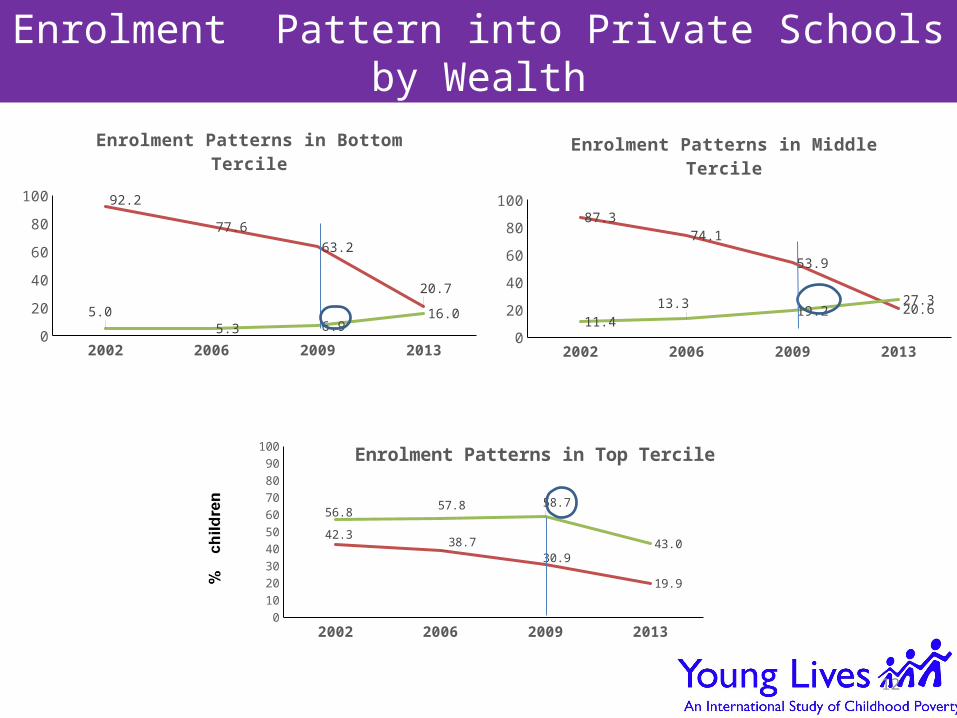
Enrolment Pattern into Private Schools by Wealth
12
2002 2006 2009 20130
102030405060708090
100 92.2
77.6
63.2
20.7
5.05.3 6.9
16.0
Enrolment Patterns in Bottom Tercile
2002 2006 2009 20130
102030405060708090
10087.3
74.1
53.9
20.611.4
13.3 19.227.3
Enrolment Patterns in Middle Tercile
2002 2006 2009 20130
102030405060708090
100
42.3 38.730.9
19.9
56.8 57.8 58.7
43.0
Enrolment Patterns in Top Tercile
Public Private
Costs Associated with Private Schooling
• The mother of Supraja (OC, urban location) shares that her daughter has changed three private schools and says that:
“We have to raise money somehow and pay her school fees and later on try to clear the incurred loans. ... This is very burdensome. We will not have any savings as we spend everything on education. Strictly speaking, even people of our status cannot afford these schools. Now we have to send our child to even lower rung [private] schools ... the difference in the fees between [the] two types of schools ranges from 5,000 to 10,000 [rupees] and the quality of education offered is very different. There is a lot of disparity.”
• Another mother notes rising expenditure as children move to higher grades: “… loans will remain pending… interest on them would be increasing… but my husband says that even if we don’t have to eat, he wants to educate (the children) We remained illiterate, if they study well, they will become well to-do.”
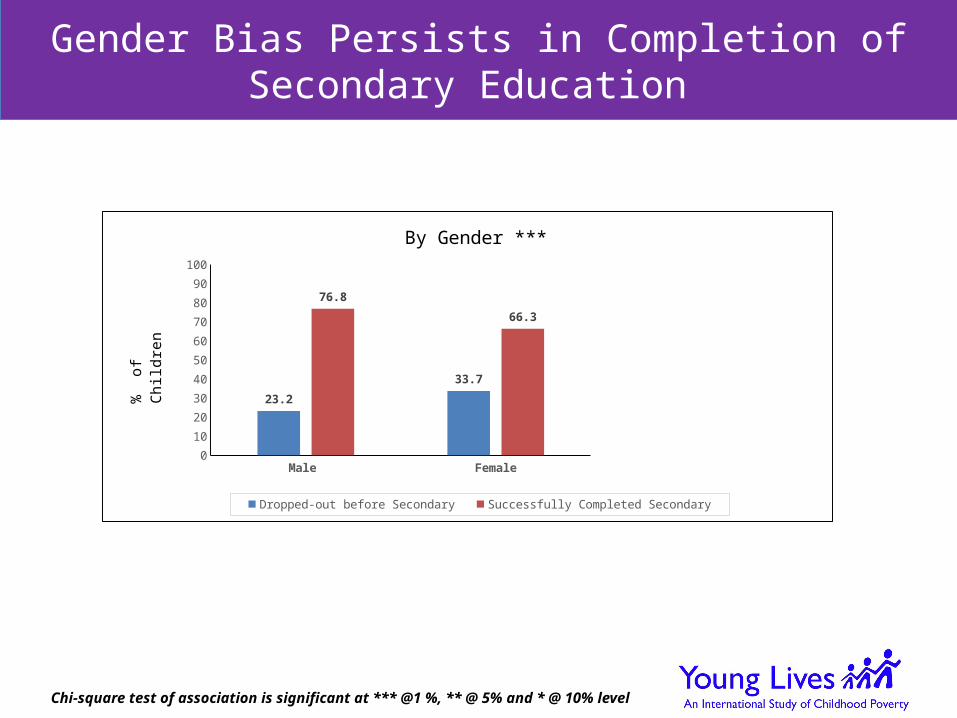
Gender Bias Persists in Completion of Secondary Education
14Chi-square test of association is significant at *** @1 %, ** @ 5% and * @ 10% level
Male Female0
10
20
30
40
5060
70
80
90
100
23.2
33.7
76.8
66.3
By Gender ***
Dropped-out before Secondary Successfully Completed Secondary
% o
f C
hild
ren

Gender Inequities Persist For Varied Reasons
Latha is a BC girl living in Katur, a rural poor mandal in Rayalseema region belonging to poorest tercile. Her parents are agricultural labourers and she has two elder brothers.Latha dropped out of school in Grade 7 and continued to help with domestic chores as well as working on daily wages harvesting groundnuts, weeding etc. Latha explains that she left school because Grade 7 i.e. upper primary school was not available in her village and she had to walk very long distance to the nearest high school. She wishes her parents had allowed her to continue studies. Latha’s mother explains that she would have liked Latha to study up to Grade 10, but her elder son ran away with a girl, without their (family) blessings therefore “we did not send the girl (to school) fearing that she too may do something similar… by having friendship with different people.”
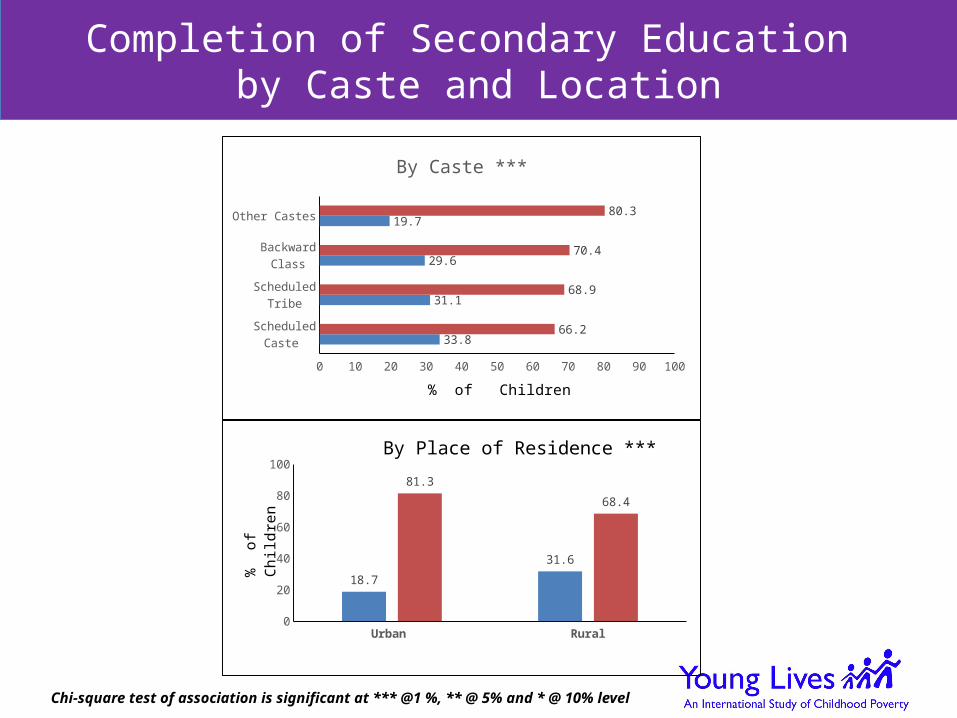
Completion of Secondary Education by Caste and Location
16Chi-square test of association is significant at *** @1 %, ** @ 5% and * @ 10% level
Scheduled Caste
Scheduled Tribe
Backward Class
Other Castes
0 10 20 30 40 50 60 70 80 90 100
33.8
31.1
29.6
19.7
66.2
68.9
70.4
80.3
By Caste ***
% of Children
Urban Rural0
102030405060708090
100
18.7
31.6
81.3
68.4
By Place of Residence ***
% o
f C
hild
ren

Completion of Secondary Education by Household Factors
Upto 5 Members 6 to 7 Members More than 7 Members
0102030405060708090
100
16.9
30.0
42.5
83.1
70.0
57.5
Household Size ***
Dropped-out before Secondary Successfully Completed Secondary
% o
f C
hild
ren
No Education
Primary
Middle
Secondary & Above
0 10 20 30 40 50 60 70 80 90 100
36.8
33.0
24.2
8.4
63.2
67.0
75.8
91.6
Father's Education***
% of Children
No Education
Primary
Middle
Secondary & Above
0 10 20 30 40 50 60 70 80 90 100
35.3
16
13.3
5.1
64.7
84
86.8
94.9
Mother's Education ***
% of Children
Chi-square test of association is significant at *** @1 %, ** @ 5% and * @ 10% level

Reasons for leaving School - R4
18Source: Young Lives Survey Data
% o
f
Chi
ldre
n
0
5
10
15
20
25
30
35
40
4.9
33.035.0
9.4
2.50.5
14.8
6.5
14.718.3
10.8
3.2
33.0
13.6
Male Female

Early Marriage Persists
19Source: Young Lives Survey Data
Marriage and Fertility at age 19 (2013)Boys % Girls %
Single (never married) 456 98.1 308 63.2
Married or cohabiting* 9 1.9 174 35.7
Widowed, divorced or separated 0 0.0 5 1.0
Total 465 487
Has had a child 6 102
* Only 1 young man was living with his partner, not yet married.
15.1
47.5
24.0
13.4
None Elementary Secondary Higher Secondary
Higest Educational Level Attained by OC Married Female Who Discontinued Studies
Among all the married girls(179), only 12 (6.7%) were continuing education
after marriage
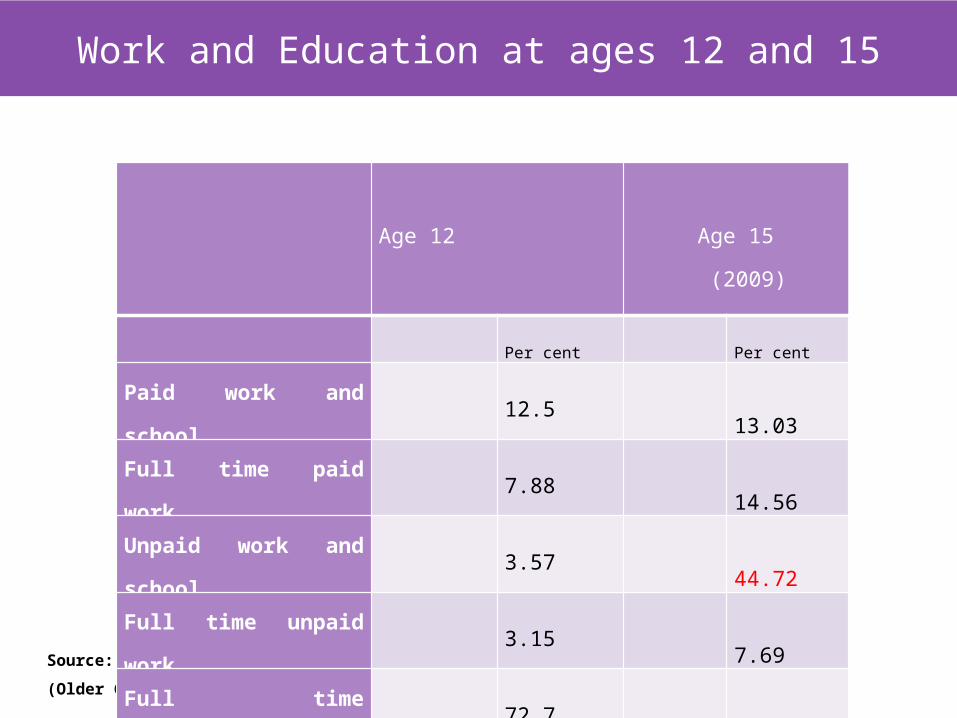
Work and Education at ages 12 and 15
Source: Young Lives, Round 2 and 3 (Older Cohort)
Age 12 (2006)
Age 15 (2009)
Per cent Per cent
Paid work and school 12.5 13.03
Full time paid work 7.88 14.56
Unpaid work and school 3.57 44.72
Full time unpaid work 3.15 7.69
Full time education 72.7 19.49
Not in school or work .2 0.51

Domestic and Paid Work affects Secondary Schooling
Chi-square test of association is significant at *** @1 %, ** @ 5% and * @ 10% level
0 Hr
1 Hr
2 Hrs
3 Hrs and more
0 10 20 30 40 50 60 70 80 90 100
19.4
25.1
39
65.5
80.6
74.9
61
34.5
Hours Spent on Domestic Chores***
Successfully Completed Secondary Dropped-out before Secondary
% of Children
No Yes0
102030405060708090
100
22.7
51.6
77.3
48.5
Paid Work at Age 12 ***
% o
f C
hild
ren
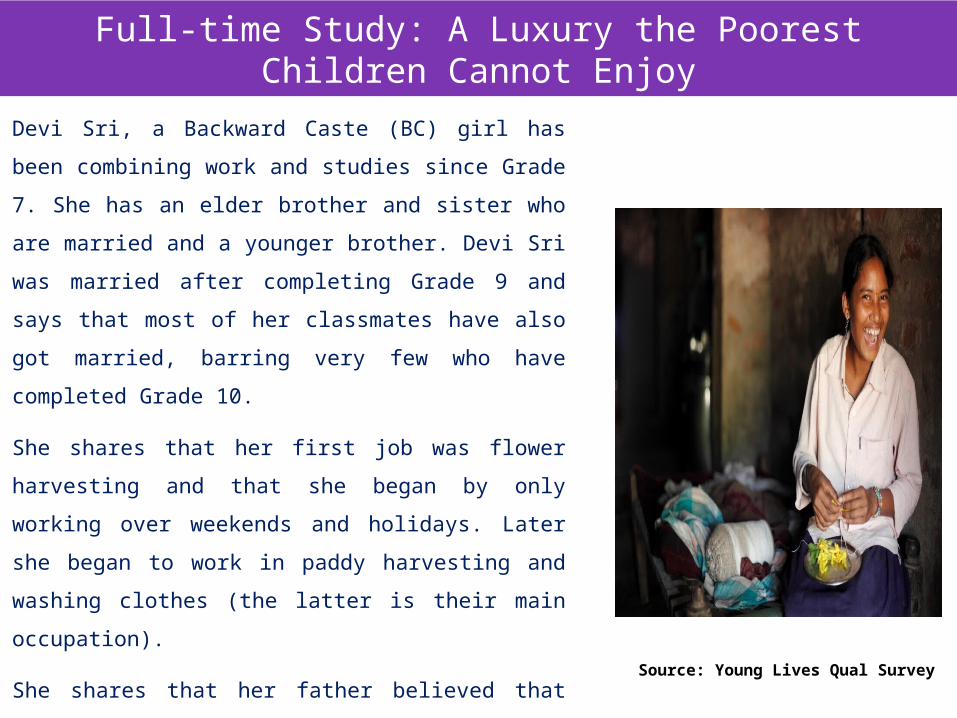
Full-time Study: A Luxury the Poorest Children Cannot Enjoy
Source: Young Lives Qual Survey
Devi Sri, a Backward Caste (BC) girl has been combining
work and studies since Grade 7. She has an elder brother
and sister who are married and a younger brother. Devi Sri
was married after completing Grade 9 and says that most
of her classmates have also got married, barring very few
who have completed Grade 10.
She shares that her first job was flower harvesting and that
she began by only working over weekends and holidays.
Later she began to work in paddy harvesting and washing
clothes (the latter is their main occupation).
She shares that her father believed that the children
should not do ‘hard work’, but her mother felt “that we were
poor and used to send us (sister and Devi Sri) for work to
make as much money as we could, even though it was
difficult.”
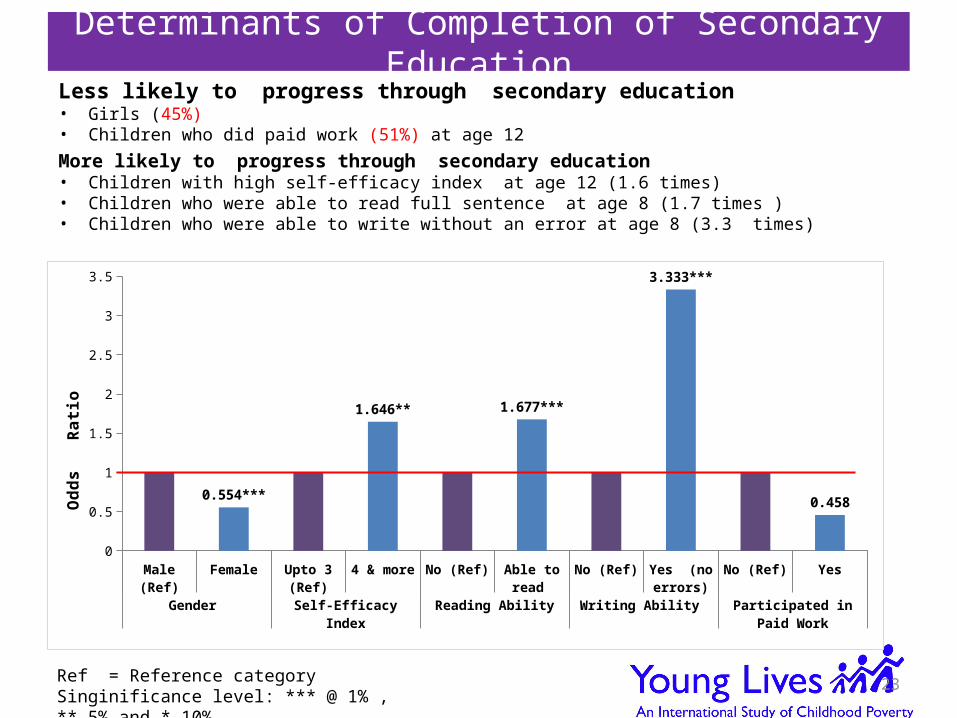
Determinants of Completion of Secondary Education
23
Male (Ref) Female Upto 3 (Ref) 4 & more No (Ref) Able to read No (Ref) Yes (no errors)
No (Ref) Yes
Gender Self-Efficacy Index Reading Ability Writing Ability Participated in Paid Work
0
0.5
1
1.5
2
2.5
3
3.5
0.554***
1.646** 1.677***
3.333***
0.458
Odd
s R
atio
Ref = Reference categorySinginificance level: *** @ 1% , ** 5% and * 10%
Less likely to progress through secondary education• Girls (45%)• Children who did paid work (51%) at age 12More likely to progress through secondary education• Children with high self-efficacy index at age 12 (1.6 times) • Children who were able to read full sentence at age 8 (1.7 times ) • Children who were able to write without an error at age 8 (3.3 times)

Policy Imperatives
• Clearly a multitude of factors related to individual, household and socio-demographics have a cumulative effect in supporting or disrupting successful progression through secondary education – therefore a multi-pronged and cross-sectoral approach is required to ensure equity in secondary education
• Acknowledging that secondary education is a key link between education and economic development, preparing young adolescents to learn necessary life skills requires a responsive curriculum and learning environment at school and home
• Gender discrimination and social customs such as child marriage and dowry needs to be addressed by deconstructing and challenging existing social norms
• Poorest children must be provided access to early learning, composite schools with adequate resources for the child (scholarships and residential facilities) and social protection for the households, to ensure that the ‘last child’ is reached

Thank you!
25