equilibrium, profits, and adjustment in a competitive market chapter 8 j. f. o’connor
TRANSCRIPT
Equilibrium, Profits, and Adjustment in a Competitive
Market
Chapter 8
J. F. O’Connor

Major Questions
• How do profits guide resource allocation in a market system?
• How does a change in price affect profit?
• What are the two functions of price?
• How does profit seeking by firms lead to a socially efficient outcome?

Industry Equilibrium• Short-run
• Industry is in equilibrium if:– Each firm is maximizing profit – For the market, quantity supplied equals quantity demanded.
• Consider our example of the glass bottle making industry. We need to look at both the typical firm and the market.

Typical Firm
• Price of output $45
• Profit maximum at output of 500
• Compute economic profit two ways:
• Profit = Total Revenue – Total Variable Cost – Fixed Cost
• Profit = [ Price – Average Total Cost]*Quantity
•
• Economic profit 5(45-29) = 80

Profit MaximizationPrice of output $45, Labor $10 per hour
0
10
20
30
40
50
60
70
80
MR=Price
MC
ATC
0 100 200 300 400 500 600 700
$/u
nit
Output of Bottles

The Market
• Demand is given to the industry. It is shown in the next slide.
• The industry has 200 producers, identical to the typical firm. Industry supply is 200 times the supply of our typical firm.
• Equilibrium price is $45 and quantity is 100,000.

The Market for Glass Bottles
0
10
20
30
40
50
60
70
80
90
Demand Supply
70 80 90 100 110 120 130 140
$/h
un
dre
d
Thousands

Equilibrium in the Short Run
• Quantity demanded is equal to quantity supplied
• Each firm is maximizing profit • Is this equilibrium going to continue over
the long run? NO because the firms in the industry are enjoying positive economic profit. This will attract new firms. Let us see what happens if 75 new firms enter.
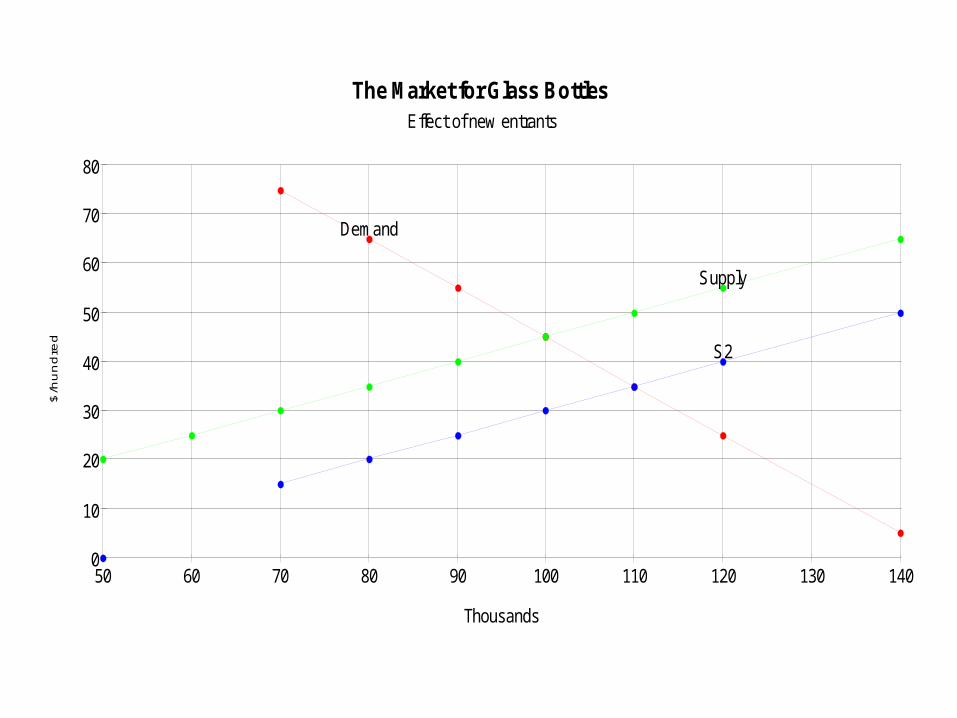
The Market for Glass Bottles Effect of new entrants
0
10
20
30
40
50
60
70
80
Demand
Supply
S2
50 60 70 80 90 100 110 120 130 140
$/h
un
dre
d
Thousands

The Effect of Entrants
• Entry of new firms shifts supply curve to the right. Equilibrium price falls to $35.
• Typical firm now finds that 400 units of out maximizes profit.
• Economic profit is still positive, (35-26.25)400
• More firms will enter until profit is zero!

The Market for Glass Bottles Long-run equilibrium
0
10
20
30
40
50
60
70
80
Demand
Supply
S2
S3
50 60 70 80 90 100 110 120 130 140
$/h
un
dre
d
Thousands

Industry Long-run Equilibrium
• Entry continues until economic profit is zero, that is when price is $25.
• Equilibrium is 120 thousand. There are 400 firms, each producing 300 units.
• Each is maximizing profit (P=MC) and its economic profit is zero.

Profit MaximizationPrice of output $25, Labor $10 per hour
0
10
20
30
40
50
60
70
80
MR=Price
MC
ATC
0 100 200 300 400 500 600 700
$/u
nit
Output of Bottles

Profits in the Adjustment Process
• Started with an industry where economic profits were being made. This attracted new firms and, as a result, price decreased and the output of existing firms decreased. This continued until economic profit was zero. Price was then equal to minimum average total cost. (See graph)
• Positive profits attract resources; negative profits repel resources.
• Why were there positive profits to begin with? Could have been caused by an increase in demand or a reduction in costs, due to a decline in input prices or a technological advance.
• Given that the industry is in long-run equilibrium. What would be the adjustment if the demand decreased by 30 thousand?

The Market for Glass Bottles Decrease in demand of 30K
0
10
20
30
40
50
60
70
80
Demand
Supply
50 60 70 80 90 100 110 120 130 140
$/h
un
dre
d
Thousands

The Adjustment Process
• Price falls to about $19. The typical firm reduces its output to about 240 and finds that it is experiencing economic losses because $19 is less than its average total cost.
• Firms start to leave the industry. This moves the supply curve to the left. This continues until economic losses are eliminated, namely, when price increases to $25
• Each firm produces 300 units and there are 300 firms.

Profit MaximizationPrice of output $19, Labor $10 per hour
0
10
20
30
40
50
60
70
80
MR=Price
MC
ATC
0 100 200 300 400 500 600 700
$/u
nit
Output of Bottles

The Market for Glass Bottles Decrease in demand of 30K
0
10
20
30
40
50
60
70
80
Demand
Supply
D2
S2
50 60 70 80 90 100 110 120 130 140
$/h
un
dre
d
Thousands
Prices and Profits
• Price rations existing supplies and causes them to go to the buyers who value them most highly.
• Price through its effect on profit guides the allocation of resources to the production of goods that are in demand. Its movement signals to firms whether to increase or decrease production.

Equilibrium
• When a market is in equilibrium, then there are no additional opportunities in that market for individuals to gain. Remember, if a market is not in equilibrium, then there are opportunities for gain open to the participants. Suppose that there is excess demand. Then, there are buyers whose reservation prices exceed those of sellers, and trade will be mutually beneficial. A market in equilibrium has exhausted such opportunities.

Social Efficiency (Optimum)
• A socially efficient (optimal) outcome is one where it is not possible to improve the well-being of one person without making someone else worse off.
• Is the equilibrium in a perfectly competitive market system a socially efficient (optimal) outcome? Yes, under certain circumstances. Which are?

The Invisible Hand
• Remember that the demand curve gives he marginal benefit of the good for the consumer and the supply curve gives the marginal (opportunity) cost of producing the good.
• The key is that the marginal benefit for each consumer is the same as that for society and that the marginal cost for each producer is the same as that for society.