equilibrium price -market
TRANSCRIPT
8/2/2019 Equilibrium Price -Market
http://slidepdf.com/reader/full/equilibrium-price-market 1/6
arket Equilibrium Price
In this note we bring the forces of supply and demand together to consider the determination
of equilibrium prices.
The Concept of Market Equilibrium
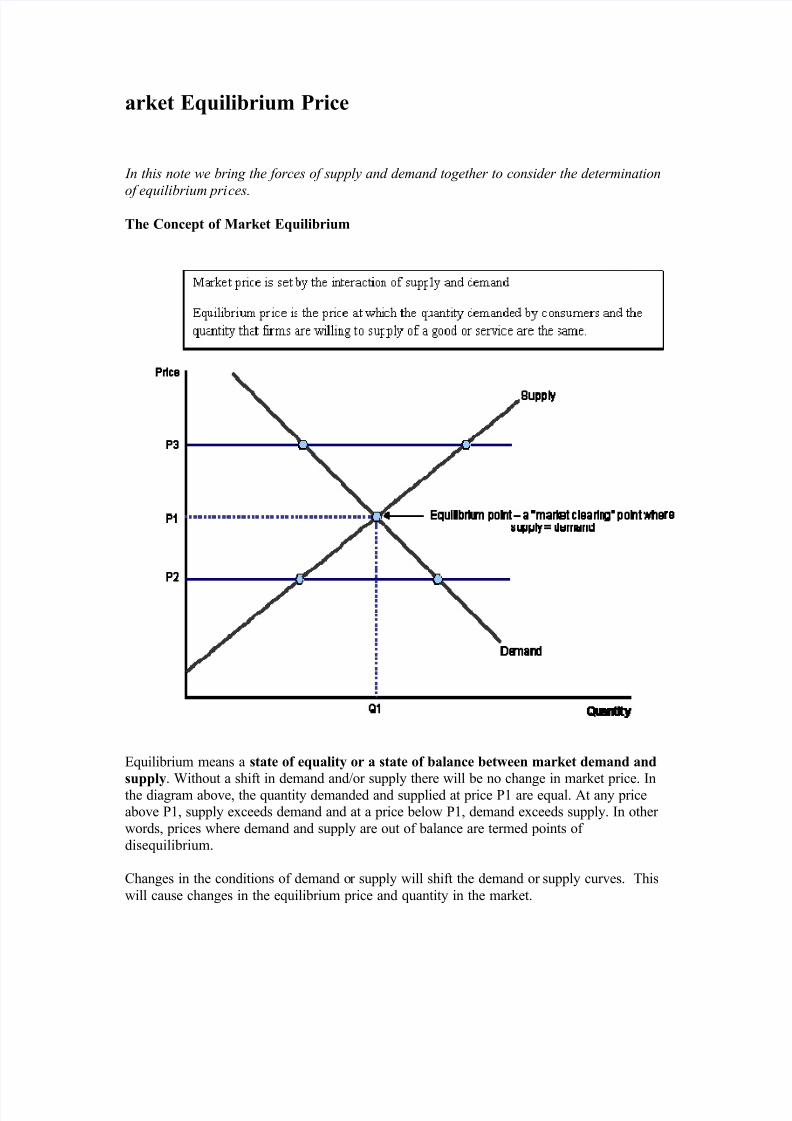
Equilibrium means a state of equality or a state of balance between market demand and
supply. Without a shift in demand and/or supply there will be no change in market price. In
the diagram above, the quantity demanded and supplied at price P1 are equal. At any price
above P1, supply exceeds demand and at a price below P1, demand exceeds supply. In other
words, prices where demand and supply are out of balance are termed points of
disequilibrium.
Changes in the conditions of demand or supply will shift the demand or supply curves. This
will cause changes in the equilibrium price and quantity in the market.

8/2/2019 Equilibrium Price -Market
http://slidepdf.com/reader/full/equilibrium-price-market 2/6
Demand and supply schedules can be represented in a table. The example below provides anillustration of the concept of equilibrium. The weekly demand and supply schedules for T-
shirts (in thousands) in a city are shown in the next table:
Price per unit (£) 8 7 6 5 4 3 2 1
Demand (000s) 6 8 10 12 14 16 18 20
Supply (000s) 18 16 14 12 10 8 6 4
New Demand
(000s)
10 12 14 16 18 20 22 24
New Supply (000s) 26 24 22 20 18 16 14 12
1. The equilibrium price is £5 where demand and supply are equal at 12,000 units
2. If the current market price was £3 ± there would be excess demand for 8,000 units
3. If the current market price was £8 ± there would be excess supply of 12,000 units4. A change in fashion causes the demand for T-shirts to rise by 4,000 at each price. The
next row of the table shows the higher level of demand. Assuming that the supplyschedule remains unchanged, the new equilibrium price is £6 per tee shirt with an
equilibrium quantity of 14,000 units5. The entry of new producers into the market causes a rise in supply of 8,000 T-shirts at
each price. The new equilibrium price becomes £4 with 18,000 units bought and sold
Changes in Market Demand and Equilibrium Price
The demand curve may shift to the right (increase) for several reasons:
1. A rise in the price of a substitute or a fall in the price of a complement
2. An increase in consumers¶ income or their wealth
8/2/2019 Equilibrium Price -Market
http://slidepdf.com/reader/full/equilibrium-price-market 3/6
3. Changing consumer tastes and preferences in favour of the product4. A fall in interest rates (i.e. borrowing rates on bank loans or mortgage interest rates)
5. A general rise in consumer confidence and optimism
The outward shift in the demand curve causes a movement (expansion) along the supplycurve and a rise in the equilibrium price and quantity. Firms in the market will sell more at a
higher price and therefore receive more in total revenue.
The reverse effects will occur when there is an inward shift of demand. A shift in the demand
curve does not cause a shift in the supply curve! Demand and supply factors are assumed to
be independent of each other although some economists claim this assumption is no longer
valid!
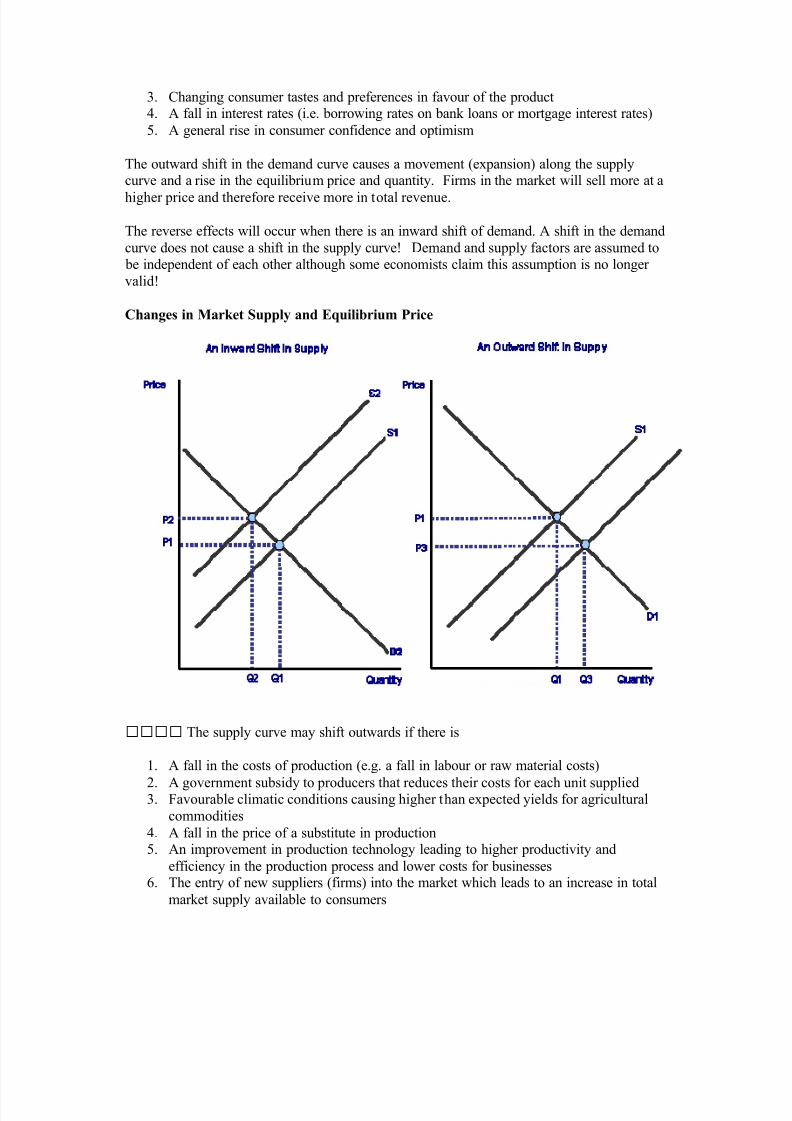
Changes in Market Supply and Equilibrium Price
The supply curve may shift outwards if there is
1. A fall in the costs of production (e.g. a fall in labour or raw material costs)
2. A government subsidy to producers that reduces their costs for each unit supplied3. Favourable climatic conditions causing higher than expected yields for agricultural
commodities
4. A fall in the price of a substitute in production5. An improvement in production technology leading to higher productivity and
efficiency in the production process and lower costs for businesses6. The entry of new suppliers (firms) into the market which leads to an increase in total
market supply available to consumers
8/2/2019 Equilibrium Price -Market
http://slidepdf.com/reader/full/equilibrium-price-market 4/6
The outward shift of the supply curve increases the supply available in the market at each price and with a given demand curve, there is a fall in the market equilibrium price from P1
to P3 and a rise in the quantity of output bought and sold from Q1 to Q3. The shift in supplycauses an expansion along the demand curve.
Important note for the exams:
A shift in the supply curve does not cause a shift in the demand curve. Instead we move along
(up or down) the demand curve to the new equilibrium position.
A fall in supply might also be caused by the exit of firms from an industry perhaps because
they are not making a sufficiently high rate of return by operating in a particular market.
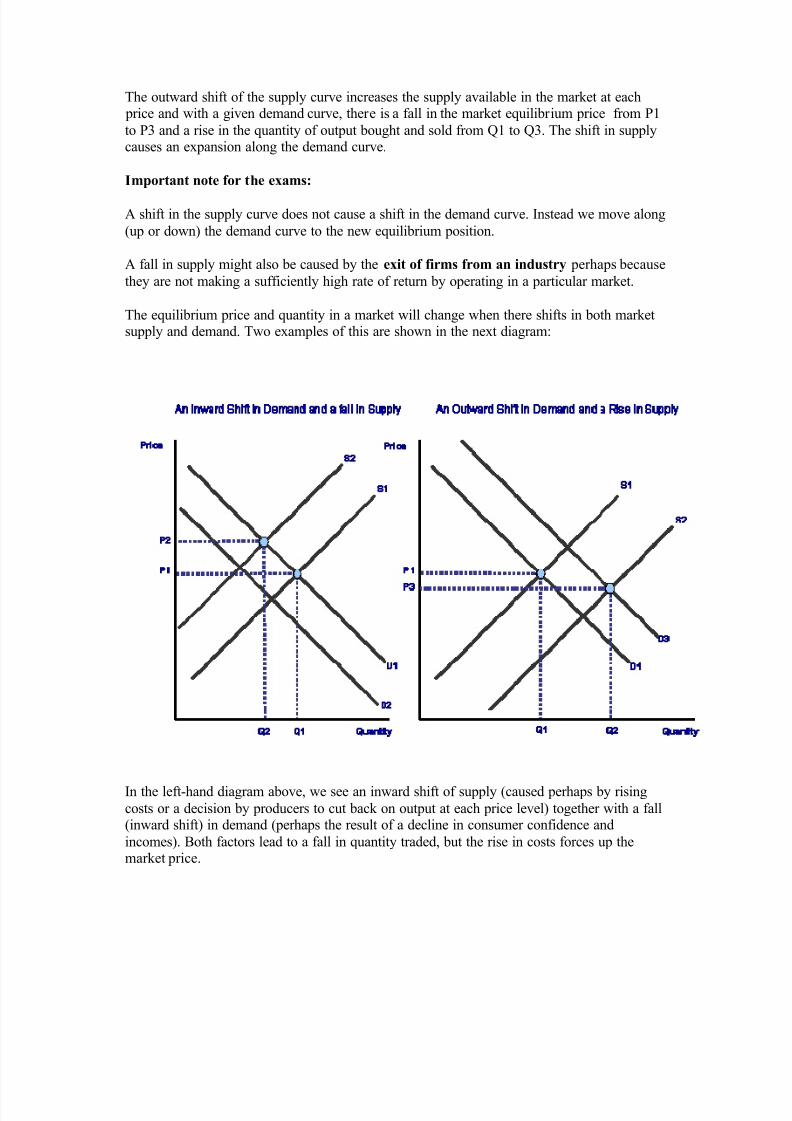
The equilibrium price and quantity in a market will change when there shifts in both marketsupply and demand. Two examples of this are shown in the next diagram:
In the left-hand diagram above, we see an inward shift of supply (caused perhaps by rising
costs or a decision by producers to cut back on output at each price level) together with a fall(inward shift) in demand (perhaps the result of a decline in consumer confidence and
incomes). Both factors lead to a fall in quantity traded, but the rise in costs forces up themarket price.
8/2/2019 Equilibrium Price -Market
http://slidepdf.com/reader/full/equilibrium-price-market 5/6
The second example on the right shows a rise in demand from D1 to D3 but a much bigger increase in supply from S1 to S2. The net result is a fall in equilibrium price (from P1 to P3)
and an increase in the equilibrium quantity traded in the market.
Moving from one market equilibrium to another
Changes in equilibrium prices and quantities do not happen instantaneously! The shifts insupply and demand outlined in the diagrams in previous pages are reflective of changes in
conditions in the market. So an outward shift of demand (depending upon supply conditions)
leads to a short term rise in price and a fall in available stocks. The higher price then acts as
an incentive for suppliers to raise their output (termed as an expansion of supply) causing a
movement up the short term supply curve towards the new equilibrium point.
We tend to use these diagrams to illustrate movements in market prices and quantities ± thisis known as comparative static analysis. The reality in most markets and industries is much
more complex. For a start, many firms have imperfect knowledge about their demand curves ± they do not know precisely how demand reacts to changes in price or the true level of
demand at each and every price level. Likewise, constructing accurate supply curves requires
detailed information on production costs and these may not be available.
The importance of price elasticity of demand
The price elasticity of demand will influence the effects of shifts in supply on the equilibrium
price and quantity in a market. This is illustrated in the next two diagrams. In the left hand
diagram below we have drawn a highly elastic demand curve. We see an outward shift of
supply ± which leads to a large rise in equilibrium price and quantity and only a relatively
small change in the market price. In the right hand diagram, a similar increase in supply is
drawn together with an inelastic demand curve. Here the effect is more on the price. There is
a sharp fall in the price and only a relatively small expansion in the equilibrium quantity.

8/2/2019 Equilibrium Price -Market
http://slidepdf.com/reader/full/equilibrium-price-market 6/6
Author: Geoff Riley, Eton College, September 2006