equality of opportunity in indonesia final of...prices of mining commodities rather than estate...
TRANSCRIPT

Working Paper June 2017
Equality of Opportunity in Indonesia

1
Acknowledgements The discussion paper was drafted by Arief Anshory Yusuf, Executive Director, SDGs Center -Universitas Padjadjaran. Research assistance from Anissa Rahmawati is greatly appreciated. The author also received guidance and comments by Imogen Howells, Nina Loncar, Grace Puliyel and Ermina Sokou. This paper was prepared under a capacity-development project entitled “Time for equality: Strengthening the Institutional Framework of Social Policies”, which is led by ECLAC and being implemented in collaboration with ECA, ECE, ESCAP and ESCWA.
ST/ESCAP/2792
Disclaimer
The views expressed in this paper are those of the authors and do not necessarily reflect the views and policies of the United Nations or other international agencies. The publication has been issued without formal editing. Reproduction and dissemination of material in this publication for educational or other noncommercial purposes are authorized without prior written permission from the copyright holder, provided that the source is fully acknowledged. For further information on this publication, please contact:
Social Development Division Economic and Social Commission for Asia and the Pacific United Nations Building Rajadamnern Nok Avenue Bangkok 10200, Thailand Email: [email protected] Website: www.unescap.org

2
Abstract
Indonesia has experienced an unprecedented rise in inequality in income over the last two decades. Yet, the extent of inequality of opportunities and how it progresses over time is little understood. This paper analyzes data from various sources and over a span of at least 15 years to better understand the status and trend of inequality of opportunities in Indonesia. The finding suggests that between 2000-2015, there is a strong evidence of a rise in inequality of opportunity in various dimensions, such as health, education and employment. It shows, for example, that although development achievements have been positive on average in all areas of interest, mixed progress has been seen in the convergence of groups within Indonesian society. For example, the gap in the number of schooling years between the top 10 percent and the bottom 40 percent is quite large and seems to have worsened during the last 15 years. In the health sector, interregional disparities (both within and outside Java, and between urban and rural areas) are still large and have persisted over time. Access to water and sanitation between income groups (the top 10 percent to the bottom 40 percent) is also very unequal. Lastly, in the area of employment, the degree of formality in the Indonesian labor market, even in the national average, has not improved for the last 15 years. Informality also remains concentrated in non-Java and rural areas, as well as within the poorest 40 percent of the population. Policy recommendations are discussed.

3
Contents
Chapter 1: Income inequality in Indonesia ------------------------------------------------------------------ 5
1.1 Lower economic growth and higher inequality: a twin challenge --------------------------- 5
1.2 Recent drivers of income inequality -------------------------------------------------------------- 5
1.3 The SDG impetus ------------------------------------------------------------------------------------- 7
Chapter 2. Status and trend of equality of opportunity in Indonesia ---------------------------------- 8
2.1 Education ----------------------------------------------------------------------------------------------- 8
Net enrollment rates -------------------------------------------------------------------------------------- 8
Years of schooling ----------------------------------------------------------------------------------------- 9
Literacy ------------------------------------------------------------------------------------------------------ 9
Pupil-teacher ratio ---------------------------------------------------------------------------------------- 10
Education spending --------------------------------------------------------------------------------------- 10
Summary: education sector ----------------------------------------------------------------------------- 10
2.2 Health -------------------------------------------------------------------------------------------------- 10
Life expectancy -------------------------------------------------------------------------------------------- 10
Child mortality -------------------------------------------------------------------------------------------- 11
Child malnutrition ---------------------------------------------------------------------------------------- 11
Number of physicians ------------------------------------------------------------------------------------ 12
Morbidity: HIV prevalence ------------------------------------------------------------------------------ 12
Births assisted by skilled health workers ------------------------------------------------------------- 12
Out-of-pocket health expenditure -------------------------------------------------------------------- 13
Summary: health sector ---------------------------------------------------------------------------------- 13
2.3 Employment ---------------------------------------------------------------------------------------------- 13
Labour force participation rate ------------------------------------------------------------------------ 13
Employment to population ratio ----------------------------------------------------------------------- 13
Unemployment rate -------------------------------------------------------------------------------------- 14
Informal employment ------------------------------------------------------------------------------------ 14
Self-employment ------------------------------------------------------------------------------------------ 14
Summary: employment sector-------------------------------------------------------------------------- 14
2.4 Water and sanitation -------------------------------------------------------------------------------- 15
Water ------------------------------------------------------------------------------------------------------- 15
2.5 Energy -------------------------------------------------------------------------------------------------- 15
Energy use -------------------------------------------------------------------------------------------------- 15
4
Access to electricity -------------------------------------------------------------------------------------- 15
2.6 Political participation -------------------------------------------------------------------------------- 16
Chapter 3: Inequality of opportunities facing those “furthest behind” ------------------------------- 18
3.1 Multidimensional Poverty Index ---------------------------------------------------------------------- 18
3.2 Methodology --------------------------------------------------------------------------------------------- 18
3.3 Findings on prevalence of multidimensional poverty --------------------------------------------- 20
3.4 Implications for inequality and differenet income groups --------------------------------------- 24
3.5 Concluding remarks ------------------------------------------------------------------------------------ 26
Chapter 4. Social policies to reduce poverty and inequality in Indonesia ---------------------------- 27
4.1 Social policies before the Asian Financial Crisis (AFC) ------------------------------------------ 27
4.2 Social policies as a response to the AFC ----------------------------------------------------------- 28
4.3 Social policies following the AFC, 2000-2014 ----------------------------------------------------- 28
4.4 Beyond risk-coping mechanisms ---------------------------------------------------------------------- 31
4.3 Towards more sustainable social policy reform --------------------------------------------------- 33
Chapter 5. Recommended areas of action to reduce inequality of opportunities ----------------- 40
5.1 Committing to global development targets as a guiding development framework --------- 40
5.2 Increasing the share of social spending in national budget -------------------------------------- 41
5.3 Scaling up conditional cash transfers for human capital development ------------------------ 41
5.4 Identification and scaling-up of local government best practices ------------------------------- 42
Appendix 1. Indicators of equality of opportunity of Indonesia, 2000-2015 --------------------- 43
Appendix 2. Data description ----------------------------------------------------------------------------- 49
References ----------------------------------------------------------------------------------------------------- 56

5
Chapter 1: Income inequality in Indonesia
1.1 Lower economic growth and higher inequality: a twin challenge Over the past 15 years, Indonesia has made economic leaps. GDP per capita in 2015 was 85 per cent higher than in 2000, averaging growth of four per cent per year. This growth contributed to poverty reduction of some half a percentage point per year, bringing poverty incidence in 2015 to 11.2 per cent, compared to 19.1 per cent in 2000 (using the national poverty line). However, during that same time, income inequality as measured by the Gini coefficient increased from 0.30 to 0.40 in 2015. In comparison to the previous 15 years of development (1985-2000), the per capita income growth and poverty reduction in the period 2000-2015 was actually not as pronounced. During the 1980s and 1990s, Indonesia became synonymous with a development success story. It increased real income per capita by almost four times and reduced poverty incidence from 40 per cent to 11 per cent in only two decades (1976-1996).1 This progress was attributed, to a large extent, to the stable economic growth of seven per cent per year during the 1980s and 1990s. Since then, growth slowed down to less than six per cent per year, and later to five per cent per year. This slowdown has dampened the country’s aspiration to reach higher-middle income status in the near future. Slower economic growth has been driven by both internal and external factors. The decade of 2000s saw the recovery from the Asian Financial Crisis (AFC); a shock that affected many East and South-East Asian countries. Of the countries hit by the AFC, however, Indonesia had the slowest recovery. Unlike other countries, Indonesia experienced a seminal political transition during this recovery period. The resulting political instability brought with it uncertainty that may have stifled economic growth. Indonesia also failed to adequately invest in infrastructure during its boom years. The period of high commodity prices and strong global demand for commodities lasted until 2008 and brought robust economic growth and revenues to the country’s coffers. However, this era was not accompanied by the intensification of infrastructure investment needed for sustained growth, nor by economic reform necessary to revive the manufacturing sector, which is vital to sustain labour-intensive growth. As a result, when the commodity boom was over, the country was unprepared for a shift in its economic structure. Meanwhile, the number of poor had not fallen as dramatically as hoped. To a certain extent, slower growth translated into slower poverty reduction. However, other factors compounded the problem, in particular increasing inequality. Economic growth accompanied by rising inequality is harmful for poverty reduction, as the benefits of growth accrue to the richest individuals.
1.2 Recent drivers of income inequality Several factors contributed to rising income inequality during the 2000s, four of which are highlighted here (Yusuf and Sumner, 2014). The first factor is the commodity boom, seeing price hikes in coal and palm oil in particular (Burke and Resosudarmo, 2012). The natural resource-driven growth was very capital-
1 Using the more recently updated national poverty line, the poverty rate in 1996 is calculated at 17.5 per cent, but since this new line is not comparable with older older data, particularly going back to the 1970’s, the old poverty
line was maintained. Source: BPS.

6
intensive and few opportunities were created for the poor as a result. Yusuf (2014) uses a Computable General Equilibrium (CGE) model to show that the changes in inequality are due to increasing world prices of mining commodities rather than estate crops such as palm oil, coffee, coconut and cocoa. Mining commodities are extractive, unlike agricultural cash crops. Both mining and agricultural commodities’ prices increased during the 2000-2008 period and likely contributed to greater inequality. Yet, the analysis suggests that the effect of the former is greater than that of the latter. Relatedly, Suryahadi et al., (2009) note that changing sectoral contributions to growth are associated with slowing poverty reduction, revealing potential changes in inequality. A second driver of inequality relates to changes in the labour market. Yusuf et al., (2013) propose a hypothesis on labour market rigidity in the formal labour market including interrelated changes in labour market regulation, such as an increase in severance payment, the strengthening of labour unions, rising minimum wages, reduced demand for unskilled labour, and an increase in informality in lower wage employment. Before the Asian Financial Crisis, the manufacturing sector was the primary source of economic growth in Indonesia. The growth of the manufacturing sector’s GDP was 11.2 per cent during 1990–1996 (while the average economic growth was 7.9 per cent) and its employment growth was 6.0 per cent (while the average national employment growth was only 2.3 per cent). Almost a decade after the crisis, the role of the manufacturing sector in generating employment seems to have halted. While its growth for the period of 2000–2008 was almost the same as the national average (4.7 per cent), its employment growth was only 0.9 per cent (Yusuf et al., 2013). Historically, employment opportunities in the formal manufacturing sector have been a haven for people in rural areas to find better paying jobs. When such opportunities are limited, there is excess supply of unskilled labour in rural areas. As the labour market in rural areas is flexible, overall rural real wages are pushed down for unskilled workers, increasing inequality in rural areas. Official data from Statistics Indonesia (Badan Pusat Statistik, BPS) suggest that real wages for agricultural workers have been declining for the past few years, due to fewer manufacturing activities, causing a lack of formal employment in the cities (Manning and Pratomo, 2013). A third driver of inequality is the price of rice. Between 2003 and 2005, the domestic price of rice increased by almost 20 per cent after having been very stable for years. This spike may have forced households to spend a larger share of their income on rice, and thus reduced the real expenditure on other items, particularly among the poor. A fourth driver of changes in inequality is regressive government expenditure. From 2003 to 2005, world oil prices rose by 70 per cent, leading to an increase of fuel subsidies from 6.5 per cent of the total state budget (Anggaran Pendapatan Belanja Negara, APBN) in 2003 to almost 16 per cent in 2005. This increased responsibility and curtailed the fiscal space for additional government social spending on the poor, while the fuel subsidy disproportionately benefited the non-poor. A structural driver that could also have contributed to rising inequality, declining poverty reduction and slower economic growth is inequality of opportunity. As the key to economic prosperity, access to better-paying or formal jobs is associated with access to better education and good health. Good quality education is available in Indonesia, but not to everyone. Basic elementary education has been universally available and accessible to everyone. However, what matters more for the job market is secondary or tertiary education. Food is also available, but not every family has access to nutritious meals and Indonesia’s progress in reducing malnutrition has been slow in comparison to other countries in South-East Asia. The following chapters of this study will shed light on the status and trends in inequality of opportunity, an area which is still relatively under-researched in Indonesia.
7
1.3 The SDG impetus Unlike other policy agendas, equalizing access to opportunities - such as health, education and basic infrastructure - is a long-run endeavor. The Sustainable Development Goals (SDGs), within the 2030 Agenda for Sustainable Development, provide a welcome and necessary global framework to set out on the path for achieving this long-term objective. With a range of very specific, measurable and relevant targets and indicators, the SDGs allow governments to set a higher level, forward-looking vision for their people. The 2030 Agenda recognizes inequality as an important dimension of poverty reduction. Not only is equitable access to services emphasized within goals relating to education, nutrition, health, gender, environmental and others, there is explicit focus on ensuring that the benefits of growth accrue to all. Goal 10 of the SDGs calls for reducing inequalities based on age, sex, disability, race, ethnicity, origin, religion or economic or other status within a country. Over two-thirds of the world’s population lives in countries where income inequality has been rising since 1980. A recent Asian Development Bank report (ADB, 2012) estimates that in most Asian countries, the wealthiest five per cent of the population account for 20 per cent of total expenditure. China’s Gini coefficient increased to 0.43 in 2010, from 0.32 in the early 1990s. In India, the Gini coefficient also rose to 0.37 from 0.33 during the same period. In an attempt to study inequality in the framework of the SDGs, we should distinguish between inequality of outcome and inequality of opportunity. Borrowing a theory by John Roemer of Yale University, inequality of outcome, such as income among members of a society, is not only a product of different degrees of effort or talent among individuals, but also of different circumstances beyond the control of the particular individuals. Unlike policies of equalizing outcome, policies of equalizing opportunity, or leveling the playing field, are more acceptable across different political spectra, from left to right. Policies that promote equality of opportunity can also more explicitly meet the needs of less privileged members of society.
8
Chapter 2. Status and trend of equality of opportunity in Indonesia
This chapter will analyse several development indicators that reflect the degree of inequality of opportunity in Indonesia. The inequality gap will be assessed by comparing the indicators across different groups within the Indonesian society. The relevant sub-groups, based on data availability and the local context, are men and women, urban and rural areas, and Java and non-Java regions. The latter distinction is made because Indonesian development has been very Java-centric and disparity between the two regions is large and persistent. A final but vital distinction is between income groups, particularly between the top 10 per cent and the bottom 40 per cent. Where data is available, indicators will be studied for the period from 2000 to 2015. The sources of data for the following sections include secondary sources and the author’s own calculations using Indonesian household survey data. The basis for the discussion can be found in Appendix 1.
2.1 Education
Net enrollment rates The average net primary school enrollment rate was already high in 2000 (92.3 per cent) and since then has steadily increased to more than 96 per cent in 2015. This level of primary net enrollment is quite comparable among ASEAN countries. There is no significant difference between males and females in primary school enrollment rate. Regionally, between urban-rural areas and Java-non-Java regions, the net primary enrollment rate has been equalized, reflecting the success of a long government programme of
Summary/Highlights from Chapter 2
This chapter reviews inequality in access to opportunities in the areas of education, health,
water and sanitation, energy and employment. Although on average, development
achievements have been positive in all areas of interest, the analysis reveals mixed progress
in terms of convergence between groups. For example, the gap in the number of schooling
years between the top 10 per cent and the bottom 40 per cent has been quite large and
seems to be worsening during the last 15 years. In the health sector, inter-regional disparity
(both between Java and non-Java, as well as between urban and rural areas) is still large and
persists over time. Access to water and sanitation between income groups (the top 10 per
cent to the bottom 40 per cent) is also very unequal. Lastly, in the area of employment,
the report finds that the degree of formality in the Indonesian labour market, even for the
country’s average, has not been improving for the last 15 years. Informality also remains
concentrated in non-Java and rural areas as well as within the 40 per cent poorest
population. Inequality of opportunity in terms of access to better employment has been
one of the hardest dimensions to tackle for contemporary Indonesian development.

9
compulsory primary education since the 1980s2. The success of the compulsory primary education programme is also proven by the minimal difference between the net primary enrollment of children from the top 10 per cent and bottom 40 per cent. This is confirmed by its low Palma ratio of net primary enrollment (of -1.0 per cent).3 Following the success of the compulsory primary education programme, the Government of Indonesia started to promote junior secondary compulsory education – and efforts have borne fruit. As a result, the average net secondary enrollment (both junior, i.e., 13-15 years of age, and senior i.e., 16-18 years of age) steadily increased to almost 80 per cent in 2015, compared to 60 per cent in 2000. In general, our research found no significant difference between male and female in net secondary enrollment. Although there is not much difference between Java and non-Java regions, a consistent gap between urban and rural areas exists. However, the gap seems to be closing with time, albeit rather slowly (from a difference of 15 per cent in 2000 to eight per cent in 2015). The biggest gap between groups with regards to net secondary enrolment can be found between the top 10 per cent and the bottom 40 per cent. The corresponding Palma ratio in 2000 was 34 percentage points, with almost twice as many children from the top 10 per cent enrolling in secondary education, compared to the bottom 40 per cent. However, the gap has been narrowing fast and today there are only 14 percentage points of difference in enrolment rates between the two groups.
Years of schooling On average, the mean years of schooling is rather low in Indonesia, compared to the Philippines or Malaysia. However, it has increased quite steadily (some 1.5 years in 15 years) to reach 8.4 years in 2015. The gap between males and females is usually one year without much change over time. Regionally, there is no gap in years between Java and non-Java regions. However, consistent with findings on net secondary enrolment, the mean years of schooling in rural areas is lower than in urban areas by some two years. The biggest gap is again to be found between the top 10 per cent and the bottom 40 per cent groups. The Palma ratio between those two groups has actually increased from some four years in 2000 to some five years at the end of the period. This difference is driven by improvements among the top 10 per cent (which has now reached almost 12 years of education on average), while the bottom 40 per cent has barely caught up, at seven years. A five year gap in years of schooling is far from insignificant and possibly a main driver of other inequalities in Indonesia.
Literacy The literacy rate has seen significant improvement over the last 15 years, from 89 per cent in 2000 to 94 per cent in 2015. The gap between men and women persists and was some five percentage points in 2015, the remains of a different era, when boys would be given preference in choices of attendance of primary school. The gap was of course larger in 2000, at some nine percentage points. Across regions, no significant gap between Java and non-Java islands can be observed. However, the gap between urban and rural areas is also some five percentage points. As with other education indicators, the biggest gap is today observed between income groups, with a nine percentage point gap in the literacy rate between the top 10 per cent
2 The program was called Wajib Belajar, which translates to “compulsory study”. In the President Soeharto era, it
was six years of basic education, but was later extended to nine years of basic education. 3 The Palma ratio in the context of this study is defined as the difference in coverage between two reference groups
(e.g. top 10 per cent and lowest 40 per cent, or urban and rural populations). For additional explanation on the
standard meaning of the Palma ratio please review Appendix 2. An Index rate of -1 per cent, as is the case here, indicates that the botton 40 per cent has a higher net enrollment rate in primary education (96.9 per cent) than the
top 10 per cent (95.8 per cent).

10
and the bottom 40 per cent, but the gap (Palma ratio of literacy rate) has generally improved over the course of the 15 year period.
Pupil-teacher ratio The pupil-teacher ratio in primary and secondary education changed only marginally in the last 13 years. In primary education, while there was one teacher for every 17 students at the beginning of the period (2000), in 2013 the number had fallen to 15. In contrast, for upper secondary and tertiary levels, the pupil-teacher ratio has notably increased. The secondary school pupil-teacher ratio, for example, increased from some 13 students per teacher in 2000 to almost 17 in 2013.
Education spending Government expenditure on education, in proportion to GDP, more than doubled from 2001 to 2011. This was the result of an amendment in the constitution which stipulated that education expenditure in the national budget needed to be at least 20 per cent of the total budget4. However, challenges remain since a greater proportion of the budget is spent on teachers’ salaries and less on school infrastructure and on the quality of the teaching including curriculum. In terms of private or household expenditure over the period of 2000-2015, the out-of-pocket education expenditure has fluctuated from three to five per cent of total expenditure. Households in urban areas generally spend a higher proportion of their expenditure on education - typically twice that of rural households over the course of the period. Similarly, compared to non-Java region, households in the Java region dedicate a higher proportion of their total expenditure on education. In the meantime, households in the bottom 40 per cent spend much less on education, equating to roughly half the spending of the top 10 per cent).
Summary: education sector Almost all indicators related to education experienced improvement for the average population over the period of 2000-2015, with inequality in education also falling in general. Between Java and non-Java regions, the education outcomes have been relatively equal. Between urban and rural areas, the outcomes have been markedly unequal. For some indicators, the urban-rural gap has been narrowing (such as in secondary net enrollment rate and literacy rate), while it tends to persist with others (years of schooling and expenditure on education) over time. Some indicators still show a gender gap to some extent, for instance in years of schooling and the literacy rate. The most serious gap is that of education outcomes between income groups, in this case between the top 10 per cent and the bottom 40 per cent. Inequality between these groups appears quite significant and in one particular case, the mean years of schooling, the gap has been widening for the last 15 years.
2.2 Health
Life expectancy Life expectancy at birth increased from 66 years in 2000 to 69 years in 2015. Female life expectancy is still higher than that of males. A Javanese individual’s life expectancy is higher than that of a non-Javanese
4 The amandement period of the constitution was between 1999-2002.

11
person, correlated with general welfare in this more developed region. Despite the difference not being that large, it seems to have persisted over the last 15 years.
Child mortality There has been good progress over the last 15 years in reducing mortality of children. Under-5 mortality has declined from 52 to 27 deaths per 1,000 children in 2015. However, children in non-Java regions still lag behind those in Java. The regional gap is considerably large suggesting more attention should be given to areas outside Java. Infant mortality In 2000, infant mortality was 47 out of 1,000 live births, but declined to 34 in 2012. However, the gap between Java and non-Java regions was quite large. For example, in Java, infant mortality was 44 in 2000, whereas in non-Java regions it could be as high as 54. More recently, while in the Java region infant mortality had dropped to 28 in 2012, it was 41 in non-Java regions; a difference of 13 live births. Thus, there seems to be widening gap between Java and non-Java region in terms of the infant mortality rate. Maternal mortality Maternal mortality in Indonesia has been declining from 265 deaths per 100,000 live births in 2003 to 126 in 20155. However, this number is not observed, but modelled by the World Bank. Other data (also included in WDI, which come from Demographic and Health Survey, DHS) suggest that maternal mortality in Indonesia has actually been worsening from 307 deaths per 100,000 live births in 2003 to 359 deaths in 2012.
Child malnutrition Malnutrition (including malnutrition prevalence, stunting, wasting or severe wasting) is the area in the health sector where Indonesia is lagging behind even relative to other neighbouring countries with less income per capita (See Box 1 for comparison of Indonesia and Cambodia). Malnutrition prevalence, for example, has not really improved for the last 15 years. It stays steadily from six to seven per cent. Moreover, the difference (in prevalence of malnutrition) between Java and non-Java is quite large and seems to persist.
Box 1 – Malnutrition, Indonesia and Cambodia compared
Comparing welfare indicators of Indonesia and Cambodia may reveal a rather disturbing anomaly. Indonesia belongs to the middle-income countries while Cambodia still falls into the category of low income countries. Indonesian per capita income is almost three times as high as Cambodia’s. Official poverty incidences of both countries also show that Indonesia is relatively better. However, health outcomes - particularly malnutrition indicators - tell a different story. Severe-wasting, for example, in Indonesia is three times higher than in Cambodia. If Cambodia is the benchmark, then income per capita and official poverty incidence seems not to be in line with indicators of malnutrition (See Table below).
5 Data from the World Development Indicators (WDI), World Bank.

12
INDONESIA 2010 2011 2012 2013
GNI per capita, PPP (constant 2011 international USD) 8,234 9,017 9,394 9,725
GNI per capita, Atlas method (current USD) 2,530 3,580 3,740 3,630
Poverty headcount ratio at national poverty lines (% of pop.) 13.3 12.0 11.4 11.3
Poverty headcount ratio at USD1.90 a day (% of pop.) 15.9
Poverty headcount ratio at USD3.10 a day (% of pop.) 46.3 41.7
Prevalence of stunting, height for age (% of children under 5) 39.2 36.4
Prevalence of severe wasting (% of children under 5) 5.4 6.7
Prevalence of wasting (% of children under 5) 12.3 13.5
CAMBODIA 2010 2012 2013 2014
GNI per capita, PPP (constant 2011 international USD) 2,397 2,647 2,777 2,924
GNI per capita, Atlas method (current USD) 750 880 960 1,020
Poverty headcount ratio at national poverty lines (% of pop.) 22.1 17.7
Poverty headcount ratio at USD1.90 a day (% of pop.) 10.0 6.2
Poverty headcount ratio at USD3.10 a day (% of pop.) 42.4 37.0
Prevalence of stunting, height for age (% of children under 5) 40.9 32.4
Prevalence of severe wasting (% of children under 5) 2.8 2.3
Prevalence of wasting (% of children under 5) 10.8 9.6
Source: World Bank’s World Development Indicator, retrieved 17 January 2016
Similarly, there has been no significant improvement in stunting prevalence and wasting for the last 15 years. Male children are slightly more likely to be stunted and wasted than female children. Both stunting and wasting prevalence is also higher in non-Java regions.
Number of physicians In the last 15 years, the number of physicians per person has more than doubled, from 0.8 in 2000, to 2.3 per 1,000 persons in 2015. No significant differences between Java and non-Java regions were observed. In fact, the Java region is slightly lower compared to non-Java regions due to the density of the total population.
Morbidity: HIV prevalence Not much data is available for morbidity in Indonesia. However, the case of HIV prevalence is quite worrying. From 2000 to 2015, the national prevalence has tripled. The prevalence has not discriminated between men and women, with male and female HIV prevalence at roughly about the same levels.
Births assisted by skilled health workers The percentage of births assisted by skilled health workers has improved. In 2000, only 63 per cent of births were assisted by skilled health workers, but that rate increased to more than 90 per cent in 2015. This progress is largely due to progress in rural areas, where previously only about half of births were attended by a skilled health worker there was quite a big gap between urban and rural areas. Evidence suggests that the urban-rural gap has been narrowing. However, between Java and non-Java regions, the

13
small gap has been widening. In terms of the difference between the top 10 per cent and the bottom 40 per cent, the Palma ratio of inequality in births assisted by skilled health workers has been declining significantly from 42 per cent in 2000 to only 13 per cent in 2015.
Out-of-pocket health expenditure In terms of private or household health expenditure over the period of 2000-2015, out-of-pocket education expenditure has been stable at some four per cent of total expenditure. There is not much difference between households in urban and rural areas. In contrast, households in the Java region generally spend a higher proportion of their expenditure on health than non-Java region households. The bottom 40 per cent households also spend a much lower proportion of their expenditure on health compared to the top 10 per cent (for example, the Palma ratio was some 3.4 percentage points in 2014), indicating a higher prioritization of health among the wealthiest families, along with a greater ability to afford more expensive healthcare.
Summary: health sector Overall progress in reducing inequalities in the health sector has been less satisfying than in the education sector. Certain indicators show slow or limited improvement (malnutrition, stunting, wasting) even for the average population. There are some overall improvements in infrastructure and services such as access to water and sanitation, number of physicians, and births being assisted by health workers. Still, inequalities in access to health services are evident and are persisting over time. Among the most notable are inequalities between Java and non-Java regions, in almost all health indicators, particularly in access to health care during birth. Improved sanitation access is still highly unequal between urban and rural areas and does not show any sign of improving. Access to water and sanitation between the top 10 per cent to the bottom 40 per cent is also very unequal.
2.3 Employment
Labour force participation rate The overall labour force participation rate has remained steady between 64 and 69 per cent from 2000 to 2015. The female labour participation rate has consistently stayed lower than the male labour participation rate over the years. In 2015, the labour force participation was 46 per cent for females and 82 per cent for males. The gender gap in labour force participation has not improved much during the last 15 years. In general, labour force participation is higher in rural areas than urban areas, and is almost the same across the non-Java and the Java region. Until 2010, the population from the bottom 40 per cent had a higher participation rate in the labour force than the top 10 per cent. This pattern is not uncommon in developing countries, where poor people cannot afford to not work. Since then, however, the top labour force participation rate of the top 10 per cent has surpassed that of the bottom 40 per cent with a slowly increasing gap.
Employment to population ratio The employment to population ratio has been relatively constant over the past 15 years. The female employment to population ratio is significantly lower than that of males by a margin of some 20 per cent. Similar to the labour force participation rate, rural areas have a higher employment to population ratio while there is not much difference between Java and non-Java regions. The Palma ratio shows an increase

14
from some five per cent in 2000 to some nine per cent in 2015, reflecting a widening gap in the employment to population ratio in favour of the top 10 per cent over the last 15 years.
Unemployment rate From 2000 to 2015 the unemployment rate has declined (4.2 per cent in 2000 to 2.5 per cent in 2015). Female and male unemployment rates are quite similar. Similarly, the unemployment rate does not differ between Java and non-Java regions as well as between the bottom 40 per cent and the top 10 per cent. The only difference is between urban and rural regions. Rural areas seem to have a lower unemployment rate than urban areas, which is consistent with the case for the labour force participation rate and employment to population ratio discussed earlier.
Informal employment Informality is complex and harder to measure than vulnerable work. It can be work in the informal sector, or “informal jobs” in the formal sector, which may mean that the worker lacks a contract, or has not been registered/is not enrolled in tax payment/welfare contribution schemes. Indonesian statistical measures define informal employment as: self-employed without any workers; self-employed with unpaid workers; working without an employer; and family workers. Informality has declined since the 1980s. However, improvement has been sluggish, particularly in the last decade. At present, 58 per cent of Indonesian workers are considered to be in informal employment. This situation has not changed much since 2000, when the figure stood at 63 per cent. Access to formal jobs has been unequal between males and females, urban and rural areas, Java and non-Java regions, and between the poor and the rich. The largest inequality can be found between the latter categories, as the top 10 per cent has seen participation in informal jobs falling faster, from 41per cent in 2000 to 30 per cent in 2015. In contrast, 70 per cent of those belonging to the bottom 40 per cent had informal jobs in 2000 and that rate increased to 72 per cent in 2015. As a result, the Palma ratio of inequality in access to formal jobs has increased considerably. Also high, although to a lesser extent, is the inequality between urban and rural areas in terms of access to formal jobs. In 2015, only 41.7 per cent of jobs in urban areas were informal, yet the rate was 73.4 per cent in rural area. The gap between men and women was also large without sign of improving over the period from 2000 to 2015. For example, while 59.8 per cent of men were in informal jobs in 2000, the rate was 67.6 per cent for women; representing a gap of 7.9 percentage points, which only slightly improved from the 8.2 percentage point gap in 2005. At the regional level, Java had a larger share of jobs in 2015, with 62.9 per cent in non-Java areas, although this gap has been closing fast over the years.
Self-employment Self-employment declined from some 46 per cent in 2000 to 36 per cent in 2015. For every three women, four men are self-employed and the gap has been falling. Still, traditional gender roles seem to be behind this ratio, whereby men are more likely to take the risk and the responsible of starting their own business. Self-employment is predominantly found in rural and non-Java regions, indicating some correlation with vulnerable – and probably not so lucrative – jobs. Between income groups, self-employment is more common among the poor (the bottom 40 per cent) and the gap has been unchanged for the last 15 years.
Summary: employment sector The Indonesian labour market is characterized by high informality, which has barely moved over the last 15 years. There is a very strong association between having a formal job and belonging to the top 10 per cent, which has also been increasing over the past 15 years. Gender stereotypes seem to keep women in

15
vulnerable jobs, or outside of the labour market altogether. That situation is in stark contrast with progress in health and in education, where gender parity has almost been achieved. Employment indicators that are related to vulnerability, such as access to the formal labour market and self-employment also reveal persistent inequalities between regions (both between Java and non-Java and urban-rural areas) and between income groups (bottom 40 per cent and the top 10 per cent). Overall, it is clear that inequalities in access to better employment opportunities are one of the most serious challenges for contemporary Indonesian development.
2.4 Water and sanitation
Water Progress in terms of access to improved drinking water has been quite significant. The percentage of households with access has increased from 57 per cent in 2000 to 75 per cent in 2015. However, coverage of rural areas is less than urban areas without any sign of the gap closing. Similarly, the coverage gap between Java and non-Java has also persisted for the last 15 years. Despite improvement in access for the Indonesian bottom 40 per cent from 49 per cent in 2000 to 67 per cent in 2015, the Palma ratio does not show any decline, implying that the gap between the top 10 per cent and the bottom 40 per cent is still prevalent. Therefore, the improvement in access to drinking water has not been equally shared across Indonesia. Sanitation
Progress has been slower for sanitation and even in 2015 almost half of the Indonesian population was without access to adequate sanitation. The inequalities are stark between urban and rural households and have remained unchanged: while some 65 per cent urban households have access to adequate sanitation, only 40 per cent have access in rural areas. When one looks at differences between income groups, the data reveal similar striking inequalities. In 2015, for example, access for the top 10 per cent is twice as high (at some 85 per cent) as access for the bottom 40 per cent (45 per cent). This gap however has narrowed considerably during the last 15 years.
2.5 Energy
Energy use Along with rapid economic growth and rising income, energy use in Indonesia has risen quite dramatically. Electric power consumption per capita, for example, has more than doubled in the last 15 years. The growth of energy use per capita however is not as rapid as electricity consumption. Indonesia has also been a net-exporter of energy (coal and natural gas), providing supply to fuel other countries’ economies, such as China and Japan. The use of renewable or alternative energy has been rising, albeit rather slowly. In 2000, six per cent of energy was supplied by alternative energy. In 2013, the alternative energy portion rose to eight per cent. As is happening in many countries, Indonesia also experienced improvement in energy intensity. Energy use per USD1,000 of GDP has declined from 127 kg-oe in 2000 to below 90 kg-oe in 2013. The fossil fuel share in the energy mix, however, has been stable at some 65 per cent in recent years.
Access to electricity

16
The percentage of households with access to electricity has risen from 86 per cent in 2000 to 97 per cent in 2015. The urban-rural gap has also narrowed, with more than 95 per cent of households in rural areas having access to electricity. The expansion of access has been so comprehensive that inequalities have been eliminated between Java and non-Java regions, as well as between income groups. For example, over the period from 2000 to 2015, electricity access for the bottom 40 per cent increased from 77 per cent to 96 per cent. This resulted in a decline of the Palma index of inequality from some 20 percentage points in 2000 to just four percentage points in 2015. The story of the development of electricity access in Indonesia is be a good example of equalization of opportunity in basic access to infrastructure and services.
2.6 Political participation Most political participation data is available only between 2004 and 2014. These data sets only cover the national level without any divisions between groups such as men and women or regions. Several important highlights from various indicators are as follows. The number of registered voters increased by some 25 per cent from 2004 to 2014, a reflection of population growth, changing demographics and possibly also greater political awareness. Voter turnout, however, the percentage of eligible voters who actually cast a ballot in an election, has been relatively stable at some 70 per cent. Voter turn-out for parliamentary election is higher than for presidential elections. The major indicators of politically-related freedom have been relatively stable for the last 10 years. The indicator of political rights for example, increased only from 26 in 2003 to 30 in 2006, but has remained stable since that year. Similarly, the indicator of civil liberties has also remained the same at 34 from 2005 to 2015. In terms of female participation in politics, the data suggest some improvement. Women’s share of government ministerial positions increased from 10 per cent in 2005 to 20 per cent in 2014, and the proportion of seats held by women in the national parliament increased by the same magnitude.
Table 1. Summary of the status and trends in equality of opportunity indicators, 2000-2015
Mean
Gap Between
Male-Female Urban-Rural
Java-Non-
Java
Top 10 – Bottom 40%
ED
UC
AT
ION
Primary net enrollment
High, Improving
Equal, constant
Equal, constant
Equal, constant
Equal, constant
Secondary net enrollment
Not so high and improving
Equal, constant
Unequal, improving
Equal, constant
Unequal, improving
Mean years of schooling
Improving Slightly unequal, persisting
Unequal, persisting
Equal, constant
Unequal, slightly worsening
Literacy rate Improving Unequal, improving
Unequal, improving
Equal, constant
Unequal, improving
Effective primary-secondary transition rate
Improving Equal, constant
NA NA NA
17
Education spending*
Constant NA Unequal, persisting
Unequal, persisting
Unequal, persisting
Life expectancy
Improving Unequal, widening
NA Unequal, slightly improving
NA
HE
AL
TH
Malnutrition Not improving
NA NA Unequal, persisting
NA
Stunting Not much improved
Relatively equal, constant
NA Unequal, persisting
NA
Wasting Not much improved
Relatively equal, constant
NA Unequal, persisting
NA
Physician per 1,000
Improving NA NA Equal, constant
NA
HIV prevalence
Seriously Worsening
Equal, constant
NA NA NA
Births assisted by skilled staff
Highly improving
NA Highly unequal, improving
Equal, widening
Unequal, improving
Improved water source
Improving NA Unequal, persisting
Unequal, persisting
Unequal, persisting
Improved sanitation
Improving NA Highly unequal, persisting
Unequal, persisting
Highly unequal, improving
EM
PL
OY
ME
NT
Labour force participation
Constant Unequal, persisting
Rural is higher
Equal, constant
Bottom 40% is higher
Employment to population ratio
Constant Unequal, persisting
Rural is higher
Equal, constant
Unequal, closing
Unemployment
Falling/ improving
Equal, constant
Rural is lower
Equal, constant
Equal, constant
Informality Stagnant Unequal, persisting
Unequal, persisting
Unequal persisting
Unequal, persisting
Self-employment
Falling/ improving
Unequal, improving
Unequal, persisting
Unequal persisting
Unequal, persisting
*Only nation-wide level data available (no disaggregation is possible)

18
Chapter 3: Inequality of opportunities facing those “furthest behind”
3.1 Multidimensional Poverty Index The common data collection and analysis approaches, which focus on national averages, can conceal certain disparities in outcomes. Therefore, there is a critical need for new and improved data approaches in measuring and analysing inequalities. Furthermore, disaggregation of the data, for example, illustrates the complex, intersecting forms of vulnerabilities faced by those “furthest behind”. This Chapter applies a recently developed methodology that incorporates various dimensions of welfare into one single index known as the Multidimensional Poverty Index (MPI). Through its construction methodology, which is discussed later, an individual can be regarded as poor in multiple dimensions if she or he is denied certain opportunities. In this case, the opportunities are access to education and health services, access to decent housing conditions, and access to decent employment. Therefore, the notion of multidimensional poverty is in line with the notion of equality of opportunity. By analysing multidimensional poverty incidence of various population groups, this analysis zooms in on those “furthest behind”, aiming to find the degree to which they are deprived in various categories of opportunities. In particular, the analysis disaggregates multidimensional poverty it into urban-rural areas, Java region - non-Java region and eastern Indonesia, female-headed households, and old-age headed households (more than 60 years of age).
3.2 Methodology Global estimates of multidimensional poverty (see Alkire and Foster, 2011; Alkire and Santos, 2014; Alkire et al., 2014) have been released annually in the UNDP Human Development Report since 2010. In Indonesia, a set of studies have also drawn attention to multidimensional poverty. For example, Sumarto and De Silva (2014) present estimates for 2004-2013. Artha and Dartanto (2014) present estimates for
Summary/Highlights from Chapter 3
Chapter 1 reviewed inequality trends in access to key opportunities and identified which
groups were generally disadvantaged in each of the studied categories. The analysis did not,
however, consider the impact that multiple deprivations might have on these disadvantaged
groups. This Chapter departs from the discussion of inequality and zooms in on those
“furthest behind”, aiming to find the degree to which they are deprived in various
categories of opportunities. The analytical framework borrows the UNDP concept of
multidimensional poverty (UNDP, 2010).
The following key observations can be drawn from the analysis in Chapter 2: (1) Indonesia
has been successful in reducing multi-dimensional poverty during the past two decades. (2)
Success, however, has not been balanced between regions: rural residents and those who
live outside Java and in the eastern regions are being left behind. (3) A concerning gender
gap persists, particularly in employment and in education, where women are notably more
deprived than men. (4) Older persons are also significantly more deprived.

19
2011. Hanandita and Tampubolon (2015) present estimates for 2003-2013. And most recently, Prakarsa (2016) has presented estimates for 2012-2014. Each of these studies use data from Susenas but with slightly differing sets of components, weightings and consequently differing estimates of multidimensional poverty are generated. This Chapter also presents a further set of estimates to cover consistently the period 1994-2014 using 11 indicators from the Susenas6 data for 1994-2014: Education 1. Household head has not completed six years of education 2. Any school-aged children (7-18 years old) are not enrolled at school Health 3. Birth is not assisted by skilled health workers
Skilled health workers include medical doctors, midwife, and other paramedics 4. Any child never received measles vaccination Standard of living and household assets 5. No access to safe drinking water
Unsafe drinking water source includes unprotected well, unprotected spring, river, rain water and others as well as water source where the nearest distance to septic tank is less than or 10 meters
6. No access to improved sanitation Inadequate sanitation is non-private or shared facility or the type of the toilet is not squatter or its final disposal is not septic tank.
7. Inadequate housing conditions (soil floor, bamboo wall, or roof made of leaves) 8. No electricity Employment 9. Unemployed 10. Employed but informal 11. Informality is defined as self-employed without any workers; self-employed with unpaid workers; working
without employer; and family workers. Underemployed (working less than 35 hours per week) We focus not only on education and health and household assets/living standards but also on employment to make a measure of multidimensional poverty that is consistent with inclusive growth. Sumarto and De Silva (2014) also include informality and unemployment as part of household assets and standard of living. We however increase the employment component to three indicators (informality; unemployment and underemployment) and weight employment as a dimension equal to the three other dimensions of education, health and assets/standards of living. As with other estimates each household is assigned a deprivation score (0-100). We use a cut-off of 33.3 per cent beyond which the household (and all family members living in it) are multidimensionally poor. Following UNDP (2010), the headcount ratio, H, is the proportion of the poor in multiple dimensions among the population:
� = 100�
�
Where q is the number of people who face multidimensional poverty and n is the total number of the population. In our estimates, the multidimensional poor are identified as follows: Each household is assigned a deprivation score according to deprivations based on 11 indicators in four dimensions (education, health, living assets and employment). The maximum score is 100. When a household deprivation score is more than 33.3 per cent that household is considered to be in multidimensional
6 See previous chapter on the discussion of SUSENAS data.

20
poverty and therefore all the household members are counted as poor. The indicator and weights can be seen from the table below. Table 1. Dimensions and indicators of our estimates of multidimensional poverty
Dimension Weight Indicators
EDUCATION (1/4) 1/8 Household head has not completed six years of education
1/8 Any school-aged children (7-18 years old) are not enrolled at school
HEALTH (1/4) 1/8 Birth is not assisted by skilled health workers Skilled health workers include medical doctors, midwife, and other paramedics
1/8 Any child never received measles vaccination
STANDARD OF LIVING AND HOUSEHOLD ASSETS (1/4)
1/16 No access to safe drinking water Unsafe drinking water source includes unprotected well, unprotected spring, river, rain water and others as well as water source where the nearest distance to septic tank is less than or 10 meters
1/16 No access to improved sanitation Inadequate sanitation is not-private or not-shared facility or
the type of the toilet is not squatter or its final disposal is not septic tank.
1/16 Inadequate housing conditions (soil floor, bamboo wall, or roof made of leaves)
1/16 No electricity
EMPLOYMENT (1/4) 1/12 Unemployed
1/12 Employed but informal Informality is defined as self-employed without any workers;
self-employed with unpaid workers; working without employer; and family workers.
1/12 Underemployed (working less than 35 hours per week)
3.3 Findings on prevalence of multidimensional poverty Regional distribution of multidimensional poverty Indonesia experienced an outstanding improvement in reducing multidimensional poverty incidence between 1994 and 2014, as shown in Figure 1. In 1994, we estimate that over half of the population (54.8 per cent) was poor in multiple dimensions, but by 2014, the headcount rate had fallen to 15.9 per cent. Despite narrowing, the gap in multidimensional poverty incidence between urban and rural areas is still quite big. In 2014, while only seven per cent of the population in urban areas was in multidimensional poverty, in rural areas the proportion was 25 per cent, more than four times as high. The development divide between urban and rural areas is not unique to Indonesia. Thailand, for example, is facing a similar situation. This divide has political implications and may create social tensions, if left unaddressed. Figure 1. Multidimensional poverty fell across all regions, but discrepancies remain, mostly in rural and Eastern regions

21
Source: BPS and authors’ calculation Comparing Java with other Indonesian islands, the difference in prevalence of multidimensional poverty is not that high, but it is important to note the persisting gap that has shown no signs of narrowing during 20 years of economic development (Figure 1c). Similarly, both the eastern and western regions of Indonesia show a declining trend in multidimensional poverty incidence. However, the western regions experience a faster rate of decline, compared to the eastern ones, and the gap is widening. As a result, twice as many households in the eastern regions were in multidimensional poverty than households in the western regions in 2014 (Figure 1d). Distribution of multidimensional poverty across population groups
Measuring multidimensional poverty across individuals is difficult due to limited data availability, that forces researchers to look to the head of the household as a proxy of analysis for the opportunities that individuals in various types of households have. Female-headed households have had slightly higher rates of multidimensional poverty, although the gap is small (Figure 2a). Similarly, families with older household heads tend to have higher prevalence of multidimensional poverty, compared to those with younger
0.00
10.00
20.00
30.00
40.00
50.00
60.00
1994 1999 2004 2009 2014
Per
cent
of popula
iton
1a. Multidimensional poverty, 1994-
2014
All
Urban
Rural
0.00
10.00
20.00
30.00
40.00
50.00
60.00
70.00
80.00
1994 1999 2004 2009 2014
Per
cent
of popula
iton
1b. Multidimensional Poverty, Rural vs.
Urban, 1994-2014
Urban Rural
0
10
20
30
40
50
60
70
1994 1999 2004 2009 2014
1c. Multidimensional Poverty in Java
vs. non-Java islands, 1994-2014
Java Non-Java
0
10
20
30
40
50
60
70
1994 1999 2004 2009 2014
1d. Multidimensional poverty in Easter
vs. Western regions, 1994-2014
Eastern Western
22
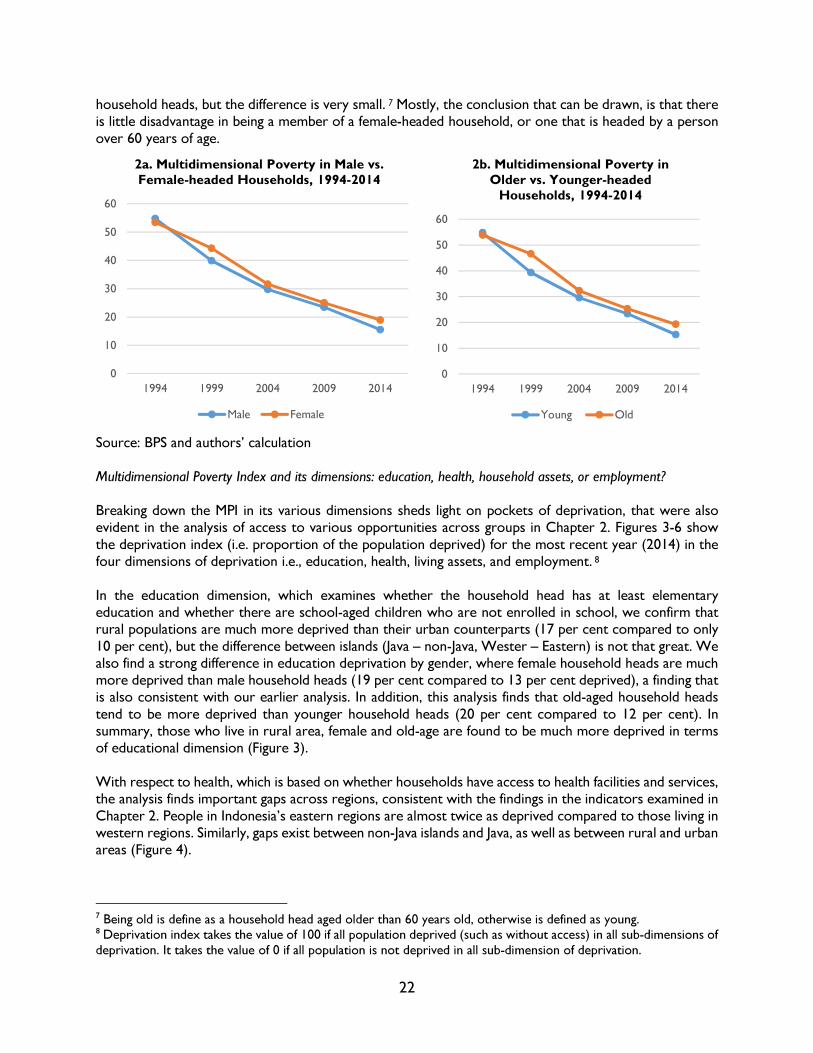
household heads, but the difference is very small. 7 Mostly, the conclusion that can be drawn, is that there is little disadvantage in being a member of a female-headed household, or one that is headed by a person over 60 years of age.
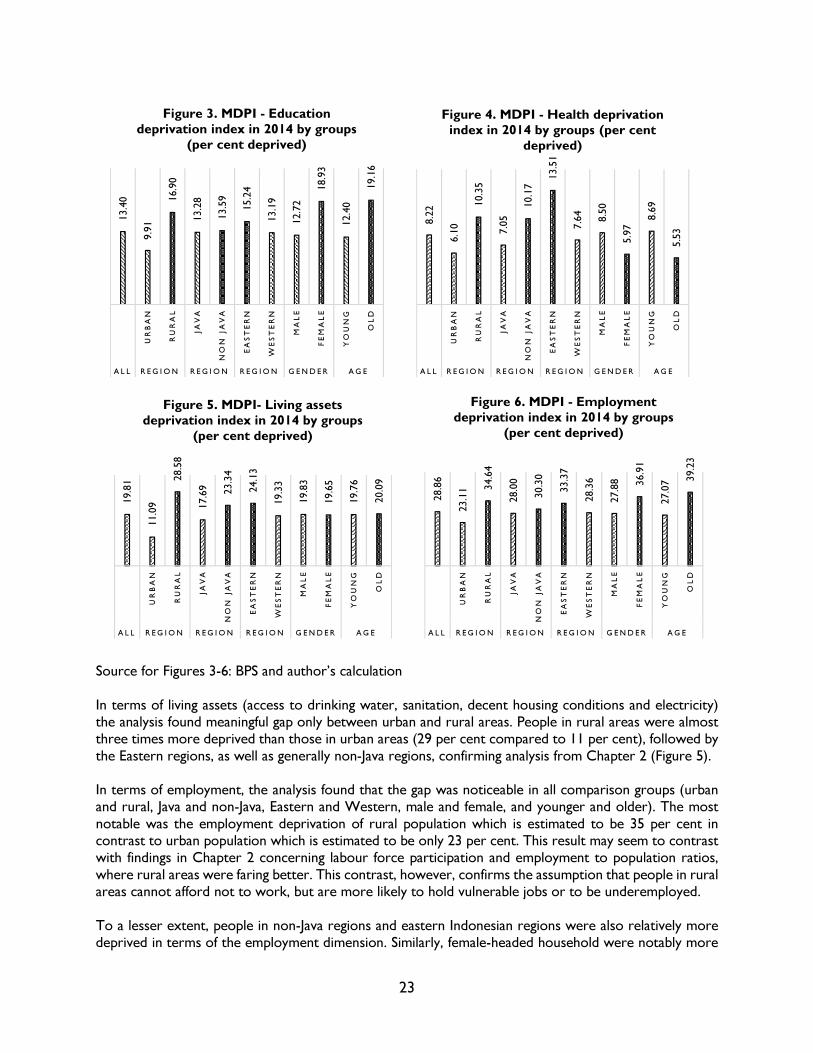
Source: BPS and authors’ calculation Multidimensional Poverty Index and its dimensions: education, health, household assets, or employment? Breaking down the MPI in its various dimensions sheds light on pockets of deprivation, that were also evident in the analysis of access to various opportunities across groups in Chapter 2. Figures 3-6 show the deprivation index (i.e. proportion of the population deprived) for the most recent year (2014) in the four dimensions of deprivation i.e., education, health, living assets, and employment. 8 In the education dimension, which examines whether the household head has at least elementary education and whether there are school-aged children who are not enrolled in school, we confirm that rural populations are much more deprived than their urban counterparts (17 per cent compared to only 10 per cent), but the difference between islands (Java – non-Java, Wester – Eastern) is not that great. We also find a strong difference in education deprivation by gender, where female household heads are much more deprived than male household heads (19 per cent compared to 13 per cent deprived), a finding that is also consistent with our earlier analysis. In addition, this analysis finds that old-aged household heads tend to be more deprived than younger household heads (20 per cent compared to 12 per cent). In summary, those who live in rural area, female and old-age are found to be much more deprived in terms of educational dimension (Figure 3). With respect to health, which is based on whether households have access to health facilities and services, the analysis finds important gaps across regions, consistent with the findings in the indicators examined in Chapter 2. People in Indonesia’s eastern regions are almost twice as deprived compared to those living in western regions. Similarly, gaps exist between non-Java islands and Java, as well as between rural and urban areas (Figure 4).
7 Being old is define as a household head aged older than 60 years old, otherwise is defined as young. 8 Deprivation index takes the value of 100 if all population deprived (such as without access) in all sub-dimensions of
deprivation. It takes the value of 0 if all population is not deprived in all sub-dimension of deprivation.
0
10
20
30
40
50
60
1994 1999 2004 2009 2014
2a. Multidimensional Poverty in Male vs.
Female-headed Households, 1994-2014
Male Female
0
10
20
30
40
50
60
1994 1999 2004 2009 2014
2b. Multidimensional Poverty in
Older vs. Younger-headed
Households, 1994-2014
Young Old
23
Source for Figures 3-6: BPS and author’s calculation In terms of living assets (access to drinking water, sanitation, decent housing conditions and electricity) the analysis found meaningful gap only between urban and rural areas. People in rural areas were almost three times more deprived than those in urban areas (29 per cent compared to 11 per cent), followed by the Eastern regions, as well as generally non-Java regions, confirming analysis from Chapter 2 (Figure 5). In terms of employment, the analysis found that the gap was noticeable in all comparison groups (urban and rural, Java and non-Java, Eastern and Western, male and female, and younger and older). The most notable was the employment deprivation of rural population which is estimated to be 35 per cent in contrast to urban population which is estimated to be only 23 per cent. This result may seem to contrast with findings in Chapter 2 concerning labour force participation and employment to population ratios, where rural areas were faring better. This contrast, however, confirms the assumption that people in rural areas cannot afford not to work, but are more likely to hold vulnerable jobs or to be underemployed. To a lesser extent, people in non-Java regions and eastern Indonesian regions were also relatively more deprived in terms of the employment dimension. Similarly, female-headed household were notably more
13.4
0
9.9
1
16.9
0
13.2
8
13.5
9
15.2
4
13.1
9
12.7
2
18.9
3
12.4
0
19.1
6
UR
BA
N
RU
RA
L
JAV
A
NO
N JA
VA
EA
ST
ER
N
WE
ST
ER
N
MA
LE
FE
MA
LE
YO
UN
G
OL
DA L L R E G I ON R E G I ON R E G I ON G END E R AG E
Figure 3. MDPI - Education
deprivation index in 2014 by groups
(per cent deprived)
8.2
2
6.1
0
10.3
5
7.0
5
10.1
7
13.5
1
7.6
4
8.5
0
5.9
7
8.6
9
5.5
3
UR
BA
N
RU
RA
L
JAV
A
NO
N JA
VA
EA
ST
ER
N
WE
ST
ER
N
MA
LE
FE
MA
LE
YO
UN
G
OL
D
A L L R E G I ON R E G I ON R E G I ON G END E R AG E
Figure 4. MDPI - Health deprivation
index in 2014 by groups (per cent
deprived)
19.8
1
11.0
9
28.5
8
17.6
9
23.3
4
24.1
3
19.3
3
19.8
3
19.6
5
19.7
6
20.0
9
UR
BA
N
RU
RA
L
JAV
A
NO
N JA
VA
EA
ST
ER
N
WE
ST
ER
N
MA
LE
FE
MA
LE
YO
UN
G
OL
D
A L L R E G I ON R E G I ON R E G I ON G END E R AG E
Figure 5. MDPI- Living assets
deprivation index in 2014 by groups
(per cent deprived)28.8
6
23.1
1 34.6
4
28.0
0
30.3
0
33.3
7
28.3
6
27.8
8
36.9
1
27.0
7 39.2
3
UR
BA
N
RU
RA
L
JAV
A
NO
N JA
VA
EA
ST
ER
N
WE
ST
ER
N
MA
LE
FE
MA
LE
YO
UN
G
OL
D
A L L R E G I ON R E G I ON R E G I ON G END E R AG E
Figure 6. MDPI - Employment
deprivation index in 2014 by groups
(per cent deprived)

24
deprived than male-headed households (37 per cent compared to 27 per cent) and an even larger gap existed between older and younger household heads (Figure 6).
3.4 Implications for inequality and differenet income groups To give a better sense of how deprivation by its various dimensions evolves over time for different socio-economic status, this section reviews the 11 indicators of deprivation embodied in the MPI by quintile of expenditure per person from 1994 to 2014. The following observations can be made (Table 2):
� Deprivation in all dimensions and indicators has fallen from 1994 to 2014 across all socioeconomic groups.
� However, relative deprivation has not always decreased, or has stagnated. Two decades of economic development have still left significant disparity between socioeconomic groups. For example, in 2014, 27.5 per cent of household heads from the lowest quintile did not have elementary schooling, compared to only 7.1 per cent from the highest quintile. There has been no progress in reducing this gap since 2004.
� Currently (in 2014), the biggest disparity is in access to improved sanitation. The proportion of households who belong to the highest quintile without access to improved sanitation is 17.3 per cent, compared to those belonging to the lowest quintile which is 60.1 per cent, forming a gap of almost 43 percentage points.
� The greatest improvement in reducing deprivation was the increase in access to electricity for the poorest households (lowest quintile). In 1994, 67 per cent of households that belonged to the lowest quintile did not have access to electricity. In 2014, the proportion had dropped to only 6.8 per cent, a reduction of 60 per cent. As a result, access to electricity in Indonesia is an equalizing force, where the gap between the highest and the lowest quintiles in 2014 was only 6 percentage points.
� Economic shocks, like what Indonesia experienced in 1997/98 during the Asian Financial Crisis (AFC), have an adverse impact on employment across all segments of society. In 1999, for example, the year when the AFC was still unfolding, the proportion of household heads in all socioeconomic groups who were underemployed was a lot higher than in five years earlier. However, among the lowest quintiles, underemployment had almost doubled between 1994 and 1999, while the increase was some 25 per cent for the richest quintile. Also, underemployment among richest households should be balanced with their increased ability to liquidate wealth or other assets to cover basic needs during times of crisis.

25
26
3.5 Concluding remarks
In this chapter, we first recognize that a high degree of inequality of opportunity translates into higher
degree of deprivation in various dimensions for certain groups, especially when those dimensions
include access to basic services relevant for sustaining livelihood such as education, health, housing,
and employment opportunity. We argue that inequality of opportunity will be higher the larger the
proportion of the population denied those opportunities, or put simply, deprived. We use UNDP’s definition of multidimensional poverty and measure its prevalence among different population groups.
The following key observations can be drawn from the analysis in Chapter 2: (1) Indonesia has been
successful in reducing multidimensional poverty during the past two decades. (2) Success, however,
has not been balanced between regions as rural residents and those who live outside Java and in the eastern regions are being left behind. (3) A concerning gender gap persists, particularly in employment
and in education, where women are notably more deprived than men. (4) Older persons are also
significantly more deprived.
27
Chapter 4. Social policies to reduce poverty and inequality in Indonesia
4.1 Social policies before the Asian Financial Crisis (AFC)
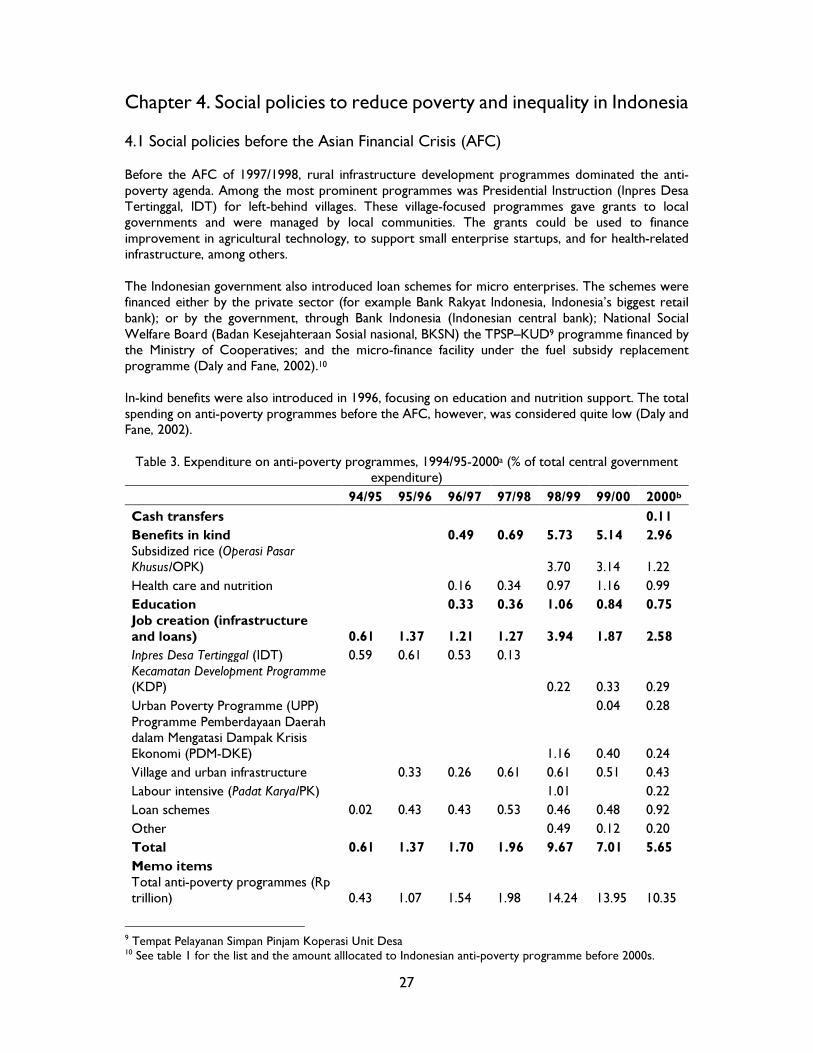
Before the AFC of 1997/1998, rural infrastructure development programmes dominated the anti-
poverty agenda. Among the most prominent programmes was Presidential Instruction (Inpres Desa
Tertinggal, IDT) for left-behind villages. These village-focused programmes gave grants to local governments and were managed by local communities. The grants could be used to finance
improvement in agricultural technology, to support small enterprise startups, and for health-related infrastructure, among others.
The Indonesian government also introduced loan schemes for micro enterprises. The schemes were financed either by the private sector (for example Bank Rakyat Indonesia, Indonesia’s biggest retail
bank); or by the government, through Bank Indonesia (Indonesian central bank); National Social
Welfare Board (Badan Kesejahteraan Sosial nasional, BKSN) the TPSP–KUD9 programme financed by the Ministry of Cooperatives; and the micro-finance facility under the fuel subsidy replacement
programme (Daly and Fane, 2002).10
In-kind benefits were also introduced in 1996, focusing on education and nutrition support. The total
spending on anti-poverty programmes before the AFC, however, was considered quite low (Daly and Fane, 2002).
Table 3. Expenditure on anti-poverty programmes, 1994/95-2000a (% of total central government expenditure)
94/95 95/96 96/97 97/98 98/99 99/00 2000b
Cash transfers 0.11
Benefits in kind 0.49 0.69 5.73 5.14 2.96
Subsidized rice (Operasi Pasar Khusus/OPK) 3.70 3.14 1.22
Health care and nutrition 0.16 0.34 0.97 1.16 0.99
Education 0.33 0.36 1.06 0.84 0.75
Job creation (infrastructure
and loans) 0.61 1.37 1.21 1.27 3.94 1.87 2.58
Inpres Desa Tertinggal (IDT) 0.59 0.61 0.53 0.13 Kecamatan Development Programme (KDP) 0.22 0.33 0.29
Urban Poverty Programme (UPP) 0.04 0.28
Programme Pemberdayaan Daerah dalam Mengatasi Dampak Krisis
Ekonomi (PDM-DKE) 1.16 0.40 0.24
Village and urban infrastructure 0.33 0.26 0.61 0.61 0.51 0.43
Labour intensive (Padat Karya/PK) 1.01 0.22
Loan schemes 0.02 0.43 0.43 0.53 0.46 0.48 0.92
Other 0.49 0.12 0.20
Total 0.61 1.37 1.70 1.96 9.67 7.01 5.65
Memo items Total anti-poverty programmes (Rp
trillion) 0.43 1.07 1.54 1.98 14.24 13.95 10.35
9 Tempat Pelayanan Simpan Pinjam Koperasi Unit Desa 10 See table 1 for the list and the amount alllocated to Indonesian anti-poverty programme before 2000s.

28
Total anti-poverty programmes (%
of GDP) 0.11 0.23 0.28 0.29 1.39 1.23 1.05
Source: Table 1 in Daly and Fane (2002).
4.2 Social policies as a response to the AFC
The reminder of the importance of social protection programmes came during the AFC in 1997/1998.
The poverty rate during that time jumped from 15 per cent in mid-1997 to 33 per cent by the end of
1998 after a disastrous economic contraction of -13 per cent in just one year. The Indonesian
government introduced the social safety net programme Jaring Pengamanan Sosial (JPS) with the
objective of protecting the poor from falling into more extreme poverty, as well as those who were vulnerable. The programme, which covered education, health, community empowerment,
employment, and staple subsidies, was unprecedented in Indonesian development. The AFC was a
hard way to learn the importance of having a social safety net in place.
Specifically, the JPS introduced in the midst of AFC had the following elements (McCawley, 1998 and
Cameron, 1999):
1. A food security component to guarantee availability and affordability of food across society, as
well as an important targeted price subsidy to buy rice from designated places, known as RASKIN
or Beras untuk orang miskin).
2. A labour-intensive public works component to reduce unemployment and encourage productive
activities to mediate the impact of the Asian Financial Crisis. 3. A social protection component to protect access to health and education facilities. USD184 million
was allocated to this component which was aimed at poor families, pregnant women and children under the age of two.
4. Promotion of the “People’s Economy” (Ekonomi Kerakyatan), particularly through support for
small and medium enterprises (SMEs), and including promotion of cottage industries at the village level.
The total cost of the programme was USD1.7 billion and it was financed directly through the development budget (Cameron, 1999). Criticism over the effectiveness and mistargeting of JPS is well-
known. For example, some critics claim that the subsidized credit programme under the heading of
“People’s Economy” lacked the controls necessary to prevent significant leakages, and that institutions
that were not cooperatives had been able to acquire cooperative status and gain access to the
subsidized funds (Cameron, 1999).
4.3 Social policies following the AFC, 2000-2014
In the years after the crisis, the government maintained several of the programmes introduced during
the AFC, while adding some new ones. In October 2005, the government first introduced the cash transfer programmes, one of the largest in developing countries.
The introduction of the cash transfers programme was linked to the sizeable fiscal burden of the fuel
subsidy (Yusuf et al., 2017). At the end of 2004, the international oil price kept on increasing, and the
total budget allotted to subsidies would have amounted to over Rp 60 trillion, or three times the size of the deficit, and 2.5 per cent of GDP. If actual oil prices turned out to be closer to the presumed
USD45/barrel initially agreed with the People’s Representative Council (Dewan Perwakilan Rakyat,
DPR), the total subsidy would have been far higher than this figure (McLeod, 2005). As a result, the new government had no choice but to allow an increase in the price of fuel.
An increase of fuel prices by an average of 29 per cent was announced at the end of February 2005
and implemented in March. This was a necessary step but not an important reform as the decision
was limited to a one-off price increase and did not restore the price setting mechanism based on

29
international oil prices. While for many years most mainstream economists had urged Indonesia to
make adjustments in line with world oil price movements, especially with the continuing increase in
world oil prices since late 2003, the decision was met with strong opposition from DPR, NGOs and
student activists, but with little concern from most of the population.
In 2005, oil prices continued to soar. On October 1, 2005, fuel prices were raised again by a weighted
average of 114 per cent, with household kerosene prices, which had been protected from past increases, nearly tripling from Rp 700/litre to Rp 2,000/litre (Sen and Steer, 2005). The price increase
led domestic prices significantly closer to—though still well below—international prices. Gasoline,
kerosene and automotive diesel were then respectively at 68 per cent, 31 per cent and 68 per cent of international prices (Sen and Steer, 2005). There were conflicting views on the implications of the
price adjustments, particularly for those most in need. Thus, the government’s decision to take the
politically difficult step of raising domestic fuel prices was commendable.
The kerosene price increased the most compared to other fuel, putting a considerable share of the
burden on the poor. To counter that effect, the government announced an unprecedented cash
compensation programme for poor and near-poor households. Given the increase in fuel prices, the
government estimated a budgetary saving of approximately Rp 25 trillion (about USD2.5 billion) for the remainder of the fiscal year. Of this amount, Rp 4.7 trillion, about one-fifth of the savings, was
allocated to the cash transfer programme. In October, Rp 300,000 per household and per quarter began flowing to 15.5 million targeted poor and near-poor households (Sen and Steer, 2005). With
over 60 million people covered, this cash transfer programme would be the largest of its kind in the
developing world.
The compensation was perceived as necessary following the earlier fuel price increase in March. Sen
and Steer (2005) found it was difficult to predict what the full effect of the October fuel price increase
on the poor would have been in the absence of the cash compensation programme, although it was
clear that overall the effects would have been negative. Yusuf and Resosudarmo (2008) also suggested that, without compensation, the reform package could have driven some five million people into
poverty. Analysis of the “what-if” scenarios suggests that, while the reduction in fuel subsidies as part
of the fuel pricing reform has a strong basis in terms of economic efficiency, its implementation can have important distributional effects. Reducing the fuel subsidy per se, without careful prior
examination on its effects on the poor, may generate adverse distributional impacts.
The criticism of the scheme focuses on its design: whether cash or in-kind transfers are the most
efficient policies in practice, whether the cash transfer scheme led to increased corruption at the local level, or whether conditional transfers (providing cash to the poor conditional upon school attendance,
participation in nutrition programmes) would have been preferred to unconditional transfers (see Box
1 for further analysis).
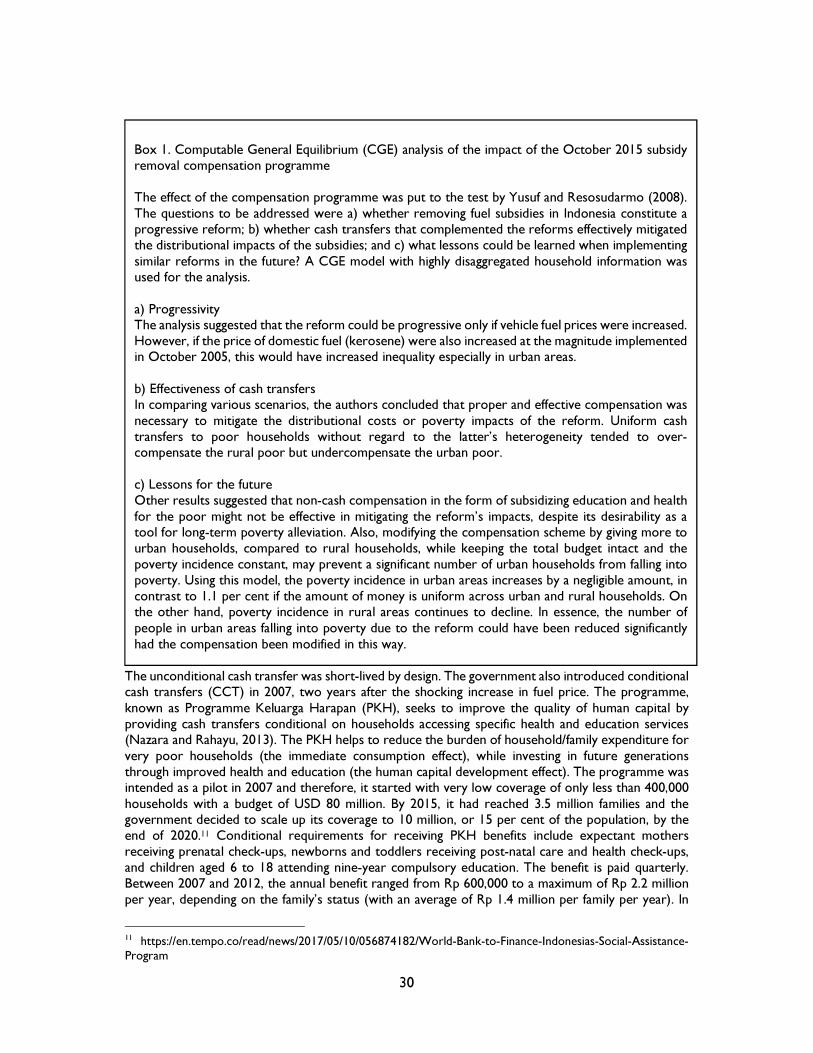
30
The unconditional cash transfer was short-lived by design. The government also introduced conditional cash transfers (CCT) in 2007, two years after the shocking increase in fuel price. The programme,
known as Programme Keluarga Harapan (PKH), seeks to improve the quality of human capital by
providing cash transfers conditional on households accessing specific health and education services (Nazara and Rahayu, 2013). The PKH helps to reduce the burden of household/family expenditure for
very poor households (the immediate consumption effect), while investing in future generations
through improved health and education (the human capital development effect). The programme was intended as a pilot in 2007 and therefore, it started with very low coverage of only less than 400,000
households with a budget of USD 80 million. By 2015, it had reached 3.5 million families and the government decided to scale up its coverage to 10 million, or 15 per cent of the population, by the
end of 2020.11 Conditional requirements for receiving PKH benefits include expectant mothers
receiving prenatal check-ups, newborns and toddlers receiving post-natal care and health check-ups,
and children aged 6 to 18 attending nine-year compulsory education. The benefit is paid quarterly.
Between 2007 and 2012, the annual benefit ranged from Rp 600,000 to a maximum of Rp 2.2 million
per year, depending on the family’s status (with an average of Rp 1.4 million per family per year). In
11 https://en.tempo.co/read/news/2017/05/10/056874182/World-Bank-to-Finance-Indonesias-Social-Assistance-
Program
Box 1. Computable General Equilibrium (CGE) analysis of the impact of the October 2015 subsidy
removal compensation programme
The effect of the compensation programme was put to the test by Yusuf and Resosudarmo (2008).
The questions to be addressed were a) whether removing fuel subsidies in Indonesia constitute a progressive reform; b) whether cash transfers that complemented the reforms effectively mitigated
the distributional impacts of the subsidies; and c) what lessons could be learned when implementing
similar reforms in the future? A CGE model with highly disaggregated household information was used for the analysis.
a) Progressivity The analysis suggested that the reform could be progressive only if vehicle fuel prices were increased.
However, if the price of domestic fuel (kerosene) were also increased at the magnitude implemented in October 2005, this would have increased inequality especially in urban areas.
b) Effectiveness of cash transfers In comparing various scenarios, the authors concluded that proper and effective compensation was
necessary to mitigate the distributional costs or poverty impacts of the reform. Uniform cash
transfers to poor households without regard to the latter’s heterogeneity tended to over-compensate the rural poor but undercompensate the urban poor.
c) Lessons for the future
Other results suggested that non-cash compensation in the form of subsidizing education and health
for the poor might not be effective in mitigating the reform’s impacts, despite its desirability as a tool for long-term poverty alleviation. Also, modifying the compensation scheme by giving more to
urban households, compared to rural households, while keeping the total budget intact and the
poverty incidence constant, may prevent a significant number of urban households from falling into
poverty. Using this model, the poverty incidence in urban areas increases by a negligible amount, in
contrast to 1.1 per cent if the amount of money is uniform across urban and rural households. On the other hand, poverty incidence in rural areas continues to decline. In essence, the number of
people in urban areas falling into poverty due to the reform could have been reduced significantly
had the compensation been modified in this way.

31
2013 there was an increase in the benefits, with the average benefit increasing to Rp1.8 million per
family per year (Nazara and Rahayu, 2013).
PKH is considered successful in influencing some development indicators (Nazara and Rahayu, 2013). A randomized household-based intervention done by the Indonesian government, found positive
average effects on a range of health indicators and education indicators. Visits to health clinics
increased by three percentage points, child growth monitoring increased by five percentage points, and immunization activities increased by 0.3 percentage points. School attendance also increased by
0.2 percentage points. Another study, conducted by the World Bank in 2011 concluded that there
were improvements in PKH areas with respect to access to health facilities. Women’s pre- and post-natal visits to health facilities in PKH areas were seven to nine percentage points higher than in the
control areas. The number of children below five years of age weighed in health facilities was also 15–
22 percentage points higher in PKH areas. Deliveries in health facilities, or assisted by health staff
(midwives or physicians), were some five to six percentage points higher in PKH compared to the
non-PKH areas.
4.4 Beyond risk-coping mechanisms
Starting from the AFC shocks through the 2005 fuel pricing reforms, the character of Indonesian social
spending was predominantly a kind of response to shocks, rather than a permanent social protection programme. The magnitude relative to the economy was also very small in comparison to other
developing countries. A recent OECD report12 found that public social expenditure was among the
lowest in the world in Indonesia, at only 2.1 per cent of GDP. This is half the level of India, for example,
which was 4.6 per cent of GDP, and less than a quarter of the nine per cent level in China (OECD,
2014). The need for a more efficient, equitable – and permanent – social protection system was urgent.
The goal is not merely to provide risk-coping mechanisms for responding to economic shocks, but
also to institute sustainable programmes that aim to help children escape the poverty of their parents
(Suryadarma and Sumarto, 2011).
The importance of this shift was recognized by subsequent governments and was documented in the 2010-2014 Indonesian medium term development plan: Rencana Pembangunan jangka Menengah
(RPJM) for 2010-2014. In the document, the emphasis was on the multi-dimensional and long-term
nature of poverty alleviation, continuing the shift from universal subsidies to targeted social protection programmes.
2010 also saw the establishment of the National Team for Accelerating Poverty Reduction (Tim national Percepatan Pengentasan Kemiskinan, TNP2K)13. TNP2K was established to coordinate the
acceleration of poverty reduction across sectors and stakeholders at the central government level. Its
main duties are developing poverty reduction policies and programmes, improving synergy of poverty
reduction programmes among ministries/agencies through synchronization, harmonization and
integration and supervising the implementation of poverty reduction programmes and activities.
Together with the establishment of TNP2K, the Indonesian government adopted the three cluster
system of social protection (www.tnp2k.go.id and Suryadarma and Sumarto, 2011):
� Cluster I constitutes the major social assistance programmes, including Raskin (Beras untuk orang miskin, or rice for the poor), the Unconditional Cash Transfers (UCTs) and CCTs; a group of
small but growing scholarship programmes; and the national community health insurance
12 OECD (2014), Society at a Glance 2014: OECD Social Indicators, OECD Publishing, Paris.
DOI: http://dx.doi.org/10.1787/soc_glance-2014-en 13 TNP2K was established by Decree of the President of the Republic of Indonesia Number 15 of 2010 on the
Acceleration of Poverty Reduction.

32
programme (Jaminan Kesehatan Masyarakat, Jamkesmas). This household-based cluster of
programmes forms the core of Indonesia’s social protection system.
� Cluster II consists primarily of the National Programme for Community Empowerment
(Programme Nasional Pemberdayaan Masyarakat, PNPM), which was formally established in 2008, building upon the successes of the World Bank’s Kecamatan (Sub-district) Development
Programme. PNPM covers approximately 70,000 villages, and is aimed at stimulating pro-poor
economic growth at the local level, while also strengthening governance and institutions. � Cluster III aims to expand the availability of credit to micro- and small-scale enterprises. The work
of TNP2K on oversight and coordination of poverty and social protection programmes, previously
under the Coordinating Ministry of Social Welfare, has been relocated to TNP2K within the office of the vice president, under Presidential Regulation 15/2010.
TNP2K has been given the responsibility of overseeing coordination of these three clusters of poverty
programmes. Under the leadership of TNP2K, the government aimed to continue moving towards a
more sustainable, integrated and coherent social protection system. TNP2K has benefited from high-level political support and included representatives of all government agencies responsible for the
planning, financing and implementation of poverty reduction programmes, under the chairmanship of the Vice President. Among other things, the presidential regulation instructed the national planning
agency, Bappenas, to secure financing of these programmes. It also established an executive secretariat
responsible for drafting policies and programmes; devising a national targeting system and setting
targets; carrying out monitoring and evaluation; conducting analysis; and providing technical and
administrative support for the team. The secretariat has also been responsible for establishing working
groups that act as internal think tanks overseeing particular aspects of poverty reduction activities
(Suryadarma and Sumarto, 2011).
One of the most remarkable achievements of TNP2K has been the unification of the national targeting
system. Individual household-based poverty reduction programmes in Indonesia previously used
different targeting approaches and relied on separate recipient databases that made targeting and monitoring difficult. TNP2K’s Targeting Working Group, in collaboration with BPS and with technical
assistance from the World Bank, aims to improve the accuracy of social programmes in reaching the
poor, through the creation of a unified database of poor households. This database includes the names and addresses of the poorest 40 per cent of the population, from which implementing agencies can
draw lists of those eligible to benefit from particular social programmes. A combination of 2010 census
data and input from the poor community in the data collection process is expected to result in good
coverage of the poorest members of the population; even those without a permanent residence will
be registered.
Another milestone of social protection policies during the 2000s was the introduction of the National
Social Security System (Sistem Jaminan Sosial Nasional, SJSN) in January 2014 (Armstrong and Rahardja, 2014). The system had actually been mandated by Law 40/2004 on Social Security, 10 years
earlier, but took a decade to be realized. The programme itself consists of two components: public health insurance (Jaminan Kesehatan Masyarakat, Jamkesmas), managed by the state’s social-security
agency (Badan Penyelenggara Jaminan Sosial , BPJS) and titled BPJS Health; and employment insurance,
managed by a new arm of BPJS and titled BPJS Manpower. The Indonesian government targeted 176 million people (72 per cent of the whole population) to get covered through Jamkemas initially.14
Ultimately, all Indonesians must participate in Jamkesmas, making this programme the biggest of its
kind in developing countries.
The introduction of the universal health coverage system in Indonesia was celebrated yet also criticized
(See Sato and Damayanti, 2015 for more elaborate discussion). For example, it was observed that
after a year of its implementation, the system ran into critical financial shortcomings that may threaten
14 For more reading on the political journey of Indonesian Universal Health Coverage (UHC), see Pisani et al.
(2017).

33
its sustainability. The high extent of informality of the Indonesian labour market is not helping
administration of BPJS. The programme requires everyone to pay a premium, which is easily
administered for the formal sector employers. However, for those who work as informal workers
either being self-employed or working for other informal activities, it is difficult for the government to enforce compulsory payment for the insurance.
4.3 Towards more sustainable social policy reform
The Medium Term Plan (2014-2019) sets a target of national poverty rate at 7-8 per cent by 2019,
and for the first time, an explicit target was added for the Gini Coefficient to reach 0.36 in 2019 (2015
= 0.41) suggesting the importance of inclusive growth is recognized within the presidential team. These targets were to be met through employment creation, basic service provision, and social protection
policies.
FIGURE 1 Growth, Inequality and Poverty in Indonesia, 2001-2019
Source: BPS and Bappenas (2014) Note: Dashed line is RPJMN target
However, from September 2014 until March 2015, the official BPS poverty headcount data marked an
increase of 0.9m people (at the March 2015 national poverty line of IDR 330,776), from 11.0 per cent to 11.2 per cent of the population. At least four reasons are to blame: economic growth continued to
slow; food prices rose, most notably the average price of rice; real wages of farm workers fell by 1.34
per cent to IDR 39,045 per day in March 2015 (BPS, 2015); and finally, the disbursement of the fuel price compensation was delayed (Programme Simpanan Keluarga Sejahtera, PSKS).
Despite setbacks, the social policy reforms in Indonesia have continued. The regressive fuel subsidy
has been directed to other social spending. At the end of 2014, the newly elected government
announced the most progressive fuel pricing policy reform so far, encompassing an increase in subsidized fuel prices of 2,000 rupiah per liter, to Rp 8,500 for gasoline (31 per cent increase) and Rp
7,500 for diesel (36 per cent increase) (Damuri and Day, 2015).
Two factors created the space for this progressive fuel subsidy reform: first, the declining oil price to
a record low; and second, strong political will. By the end of November 2014, world oil prices had
-
5
10
15
20
25
30
35
40
45
-
1
2
3
4
5
6
7
8
9
2001
2002
2003
2004
2005
2006
2007
2008
2009
2010
2011
2012
2013
2014
2015
2016
2017
2018
2019
Gini Index & Poverty Incidence (%)
Economic Growth (%)
GDP Growth (%) Gini Index Poverty Incidence (%)
Gini index
Economic growth
Poverty incidence

34
fallen by close to one-third from their level on 1st July. It so happened that the leadership at the time
realized that removing fuel subsidy is least painful during periods of declining world oil prices.
Removing fuel subsidies created significant fiscal space. Table 4a illustrates the progression of infrastructure vs. social spending since 2011. In 2014, the allocation to the fuel subsidy, excluding
electricity, was 25 per cent higher than infrastructure and 93 per cent higher than targeted social
spending. In the 2015 budget, this relationship was reversed and fuel subsidy became only a fraction of the other two categories.
Table 4a. Spending on selected programmes (Rp Trillion)
2011 2012 2013 2014 2015 2016
Health 29.79 33.41 37.93 39.68 45.02 78.64
Education 263.34 306.24 332.23 366.57 394.44 404.47 Infrastructure 114.20 145.45 155.87 177.91 290.33 307.10
Targeted social spending 41.88 46.46 67.05 76.66 74.89 72.80
Fuel subsidy 165.20 211.90 210.00 240.00 60.80 43.70
Electricity subsidy 90.40 94.60 100.00 101.80 58.30 50.70
People’s credit programme 0.64 0.80 0.82 2.80 1.45 2.17
Source: TNP2K Table 4b. Targeted social spending (Rp Trillion)
2011 2012 2013 2014 2015 2016
Rice for the poor (Raskin) 16.50 19.10 20.30 18.20 21.80 22.50
Health Insurance for the poor 6.30 7.20 8.10 19.90 20.40 25.50
Conditional Cash Transfer
(PKH) 1.50 1.80 3.40 4.40 6.40 10.10
Unconditional Cash Transfer - - 9.70 6.40 10.15 -
Poor student assistance (BSM) 3.60 4.60 13.10 8.80 14.10 14.70
Community Dev. Prog. (PNPM) 12.10 13.60 12.10 1.40 - -
Source: TNP2K
Despite relative progress, infrastructure still dominated the fiscal space created by the decrease of
fossil fuel subsidies as of 2016, while targeted social spending remained low. The association between
physical infrastructure and inequality has not been examined sufficiently so far. Infrastructure spending
is likely to generate employment and could potentially reduce spatial inequality across Indonesia.
However, the economic growth generated through infrastructure investment may not benefit the
poorer population more than it will benefit the rich. Physical infrastructure investment, for instance, could potentially enable greater access to employment opportunities for the poor. On the other hand,
infrastructure may be directed to richer areas, where there is already enough physical and human
capital, thus increasing income inequality.

35
Figure 2 Targeted social spending vs infrastructure spending (% of total budget). Source (TNP2K)
Table 5: Summary of key social protection programmes in place as of 2016
Area Title Replacing which
programme
Summary
Education School operational
assistance (Bantuan
Operasional Sekolah/BOS)
The programme
started in 2011.
BOS provides non-
personnel funding to
elementary and secondary educational units as a part
of the implementation of the nine years of
compulsory education
programme.
Education Smart Indonesian
Programme (Programme
Indonesia Pintar/PIP)
Cash Transfers for
Poor Students
(Bantuan Siswa
Miskin/BSM)
programme.
PIP gives educational
grants to all children of
school-going age (6-21
years old) who come from
poor families.
Fuel subsidy replacement
Welfare Family Saving Programme (Programme
Simpanan Keluarga
Sejahtera/PSKS)
Cash Direct Assistance (Bantuan
Langsung Tunai) or
People Direct Temporary Assistance
(Bantuan Langsung
Sementara
Masyarakat).
Provides transfers to poor households to protect the
households from rising
prices due to fuel subsidy reductions, such as the
one in November 2014.
Nutrition Beras Miskin/RASKIN The same programme
has been in place
since 1998.
RASKIN provides
subsidized rice price for
the poor.
Conditional
Cash
Transfers
Hopeful Families
Programme (Programme
Keluarga Harapan/PKH)
The programme
started in 2007 and
has been in place
since then.
PKH provides conditional
cash assistance to very
poor households, with the
long-term objective of breaking intergenerational
poverty through better
access to health and education.
3.09 3.104.04
3.334.03 3.47
8.829.75 9.44 10.01
16.0714.65
2011 2012 2013 2014 2015 2016
Perlindungan sosial bersasaran Infrastruktur

36
Health Healthy Indonesian Programme (Programme
Indonesia Sehat/PIH) or
Social Health Insurance (Jaminan Kesejahteraan
Masyarakat/JamKesNas)
Programme has been operational since 1
January 2014.
A social assistance programme that provides
healthcare for the poor
and near-poor.
Rural
infrastructure
Village Fund (Dana Desa)
implemented under the
2014 Village Law
Community
Empowerment
Programme
(Programme Nasional
Pengembangan
Masyarakat/PNPM-
Mandiri).
Central government
transfers up to 10 per cent
of total intergovernmental
grants in the state budget
to villages in the form of
village funds (Dana Desa).
The fund can be used to
finance basic infrastructure
project in some 74,000 of
Indonesian villages.
As summarized in Table 2, the main thrust of social protection schemes has continued during the past couple of decades, albeit with slightly different names and focus. Different governments in Indonesia
have maintained a similar approach to favouring targeted pro-poor social spending programmes,
possibly a result of the democratic process (Yusuf and Sumner 2015). Table 6 outlines the key differences between different programmes.
In summary, the potential of policies to reduce poverty and inequality depends on the distributional
impacts of the reallocation of fuel subsidies to infrastructure spending, which still represents a large
portion of the budget. At the same time, new focus on education and health social programmes
targeted to the poor may also prove to have some distributional impact.

37
TABLE 6 Changes to targeted social programmes
Name of Scheme Note on the
change
Target/beneficiaries Nominal assistance/target Total budget
(Rp T)
Original scheme
New scheme
Original scheme
New scheme Original scheme New scheme Original scheme
New scheme
School Operational Assistance
(BOS)
Same.
All Elementary and junior
secondary schools
Same. 580,000/students/year (SD), 710,000 (SMP)
Same. 47.4 65.7
Poor Students Assistance
(BSM)
Kartu
Indonesia Pintar (KIP)
Target is extended to school-aged
children not attending school and non-formal
school
Poor enrolled school
children (11.2M)
Poor school-aged children (20.3M)
225,000 – 500,000/students/semester
225,000 – 500,000/students/semester
9.1 15.5
Direct
Cash Assistance, People’s Temporary
Direct Assistance (BLT/BLSM)
Programme Simpanan Keluarga Sejahtera
(PSKS)
Using saving account, instead of cash.
15.5M households
Same. 150,000/ month/ household
Temporary
200,000/month/ household
Temporary
6.4 10.1
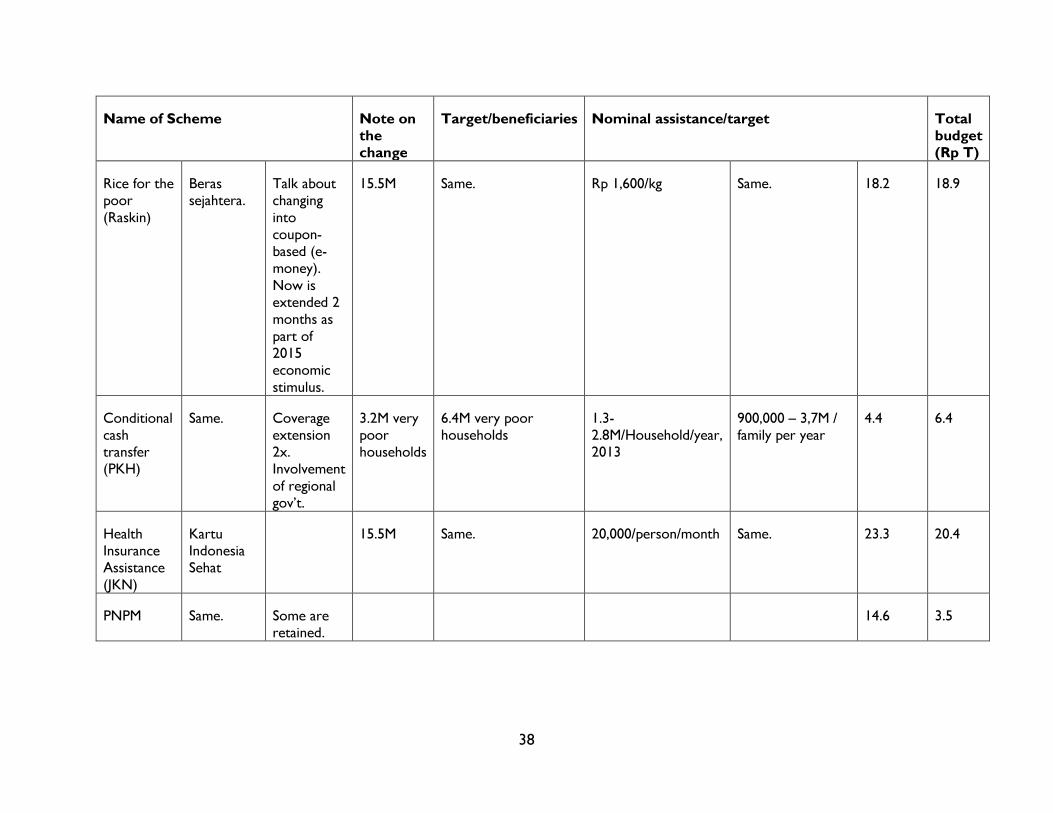
38
Name of Scheme Note on the change
Target/beneficiaries Nominal assistance/target Total budget (Rp T)
Rice for the poor
(Raskin)
Beras sejahtera.
Talk about changing
into coupon-based (e-money).
Now is extended 2 months as
part of 2015 economic
stimulus.
15.5M Same. Rp 1,600/kg Same. 18.2 18.9
Conditional cash transfer (PKH)
Same. Coverage extension 2x. Involvement
of regional gov’t.
3.2M very poor households
6.4M very poor households
1.3-2.8M/Household/year, 2013
900,000 – 3,7M / family per year
4.4 6.4
Health Insurance Assistance
(JKN)
Kartu Indonesia Sehat
15.5M Same. 20,000/person/month Same. 23.3 20.4
PNPM Same. Some are retained.
14.6 3.5

39
Name of Scheme Note on the change
Target/beneficiaries Nominal assistance/target Total budget (Rp T)
None. Village fund (Dana Desa)
Village fund programme
has been legalized since 2014
74,000 villages
280M/ village
20.8
Source: Yusuf and Sumner (2015)
40
Chapter 5. Recommended areas of action to reduce inequality of
opportunities The preceding analysis highlights that the various policies and programmes that address inequality in general, or inequality of opportunity in particular, have been partly successful in addressing some challenges:
• Despite improvements in education, there is still disparity which tends to persist between urban and rural areas. Also, inequality between the top and bottom income groups in the years of schooling has
been large and worsening. The government has increased spending on targeted education programmes for the poor, but incentives for students from poorer families to stay in school do not seem to produce many results.
• Health achievements have had less progress than education, particularly malnutrition among children, and call for urgent action and prioritization. While the rice price stabilization programmes are a start, adequate nutrition requires educating the primary caretakers of young children (parents,
grandparents, older siblings or other relatives) and managing the effects chronic under-nutrition.
• Access to water and sanitation has generally improved significantly, but large differences persist between the top and bottom income groups. This inability to achieve much progress is likely linked with little awareness among the most marginalized segments of society of the importance of clean water and particularly sanitation for health, productivity and achievement in school and at work.
• Labour informality is still high, with no sign of improving. Despite the importance of having a decent job for reducing income inequality, policies have not focused adequately on revitalizing manufacturing sectors or encouraging investments in activities that can create more formal jobs (labor-intensive in
particular).
• Despite Indonesia being successful in reducing multi-dimensional poverty in the last two decades, that success has not been balanced across regions. In particular, rural populations who live outside Java and in the eastern regions are still left behind in many dimensions. Infrastructure investments and programmes targeting villages have helped reduce the gap, but better selection of investments focused
on social objectives are needed. In light of these urgent challenges, we outline some recommended areas of actions that can be pursued in the spirit of reducing inequality of opportunity in Indonesia.
5.1 Committing to global development targets as a guiding development framework World leaders are stepping up efforts to meet the Sustainable Development Goals (SDGs) and targets by
2030. Having this common set of goals, with clear targets and indicators, helps governments turn general commitments, usually included in national development policies, into measurable and quantifiable targets. Global long-term development goals are also free from the impact of national political cycles that force a
more short-term view on policymakers and electorates. There are various SDG targets directly and indirectly related to reducing inequality of opportunities, such 1.2, 1.4, 2.1, 2.2, 3.1, 3.2, 3.7, 4.1, 4.2, 4.3, 6.1, 6.2, 7.1, 7.2, 8.8, 9c. Governments, including the Government

41
of Indonesia, will benefit from framing their development agendas in general, and inequality of opportunity reduction in particular, around the SDGs.
5.2 Increasing the share of social spending in national budget
Indonesia’s social spending has been very low by international standards.15 Public spending in some emerging economies is below the OECD average, with the lowest in India and Indonesia but highest in Brazil, where – as in OECD countries – pensions and health expenditure are important areas of social spending.16 For the last few years, the share of government spending on targeted social programmes has
been increasing despite rising share of other expenditures such as infrastructure. Policies to address inequality of opportunity require progressive taxation and spending targeted to those left behind.
Indonesia lags behind in terms of national nutrition quality, especially among low income families, jeopardizing the opportunities available to those left behind. Current government interventions will need to be re-evaluated in terms of their efficiency, as there is no evidence of significant improvement as a
result of the interventions. Intervention in the form of nutrition development for pre-school children in low income families, for example, must be urgently reassessed and optimized. The allocated budget may need to be increased, considering the fact that health expenditure is relatively low compared to other types of expenditure, such as education and infrastructure.
There is ample scientific evidence that intervention programmes on poor -and almost poor- children’s nutrition, contribute to improving the welfare of the poor and contributing to social mobility. A study
which spanned over 30 years in Guatemala showed that interventions in protein intake for poor children increased their future income by 46 per cent (Alderman et al, 2006). The Government of Indonesia has already implemented similar programmes, but there is an urgent need to assess their impact and possibly
redesign with a more innovative outlook. A second “low-hanging fruit” in terms of improving health and nutrition outcomes in Indonesia is reducing smoking prevalence among poor households. Currently. the price of cigarettes in Indonesia is among the
lowest in the world and, as a result, studies have found that cigarette consumption is the second biggest consumption item among the poor, after staple goods. Data from a large household survey in rural
Indonesia also showed that low‐income households containing at least one smoker tended to divert a
significant amount of their scarce income to tobacco products. Also, relatively more of the diversion was drawn from food than from nonfood purchases (Block and Webb, 2009). The resulting real decline in the quantity and quality of food consumed among the poorest households is associated with a statistically
significant reduction in the nutritional status of children in those households. Indonesia is among a few countries that has not ratified the WHO Framework Convention on Tobacco Control (WHO FCTC).17
5.3 Scaling up conditional cash transfers for human capital development CCTs are programmes that transfer cash, to poor households, on the condition that those households make investments in the human capital of their children. The inequality of opportunity measured by the
education and health outcome disparity among top and bottom income groups has been quite serious in Indonesia. CCTs address inequality of income (outcome), at the present time, and inequality of opportunity (future less outcome inequality) simultaneously. The effectiveness of CCTs in reducing
15http://www.thejakartapost.com/academia/2017/01/12/commentary-high-noon-for-jokowis-social-welfare-
ambitions.html 16 https://www.oecd.org/els/soc/OECD2014-Social-Expenditure-Update-Nov2014-8pages.pdf 17 http://www.who.int/fctc/signatories_parties/en/

42
poverty in developing countries has been well-documented (Fiszbein et al., 2009). In some countries, transfers generally have been well targeted to poor households, have raised consumption levels, and have
reduced poverty by a substantial amount. In Indonesia, the Family Hope Programme, also known as Programme Keluarga Harapan (PKH), has now
reached 3.2 million very poor families. As a result of this programme, severe stunting has decreased by 2.7 per cent. However, considering the high number of poor and almost poor people in Indonesia (more than 70 million people), the government may need to consider evaluating and possibly scaling-up the programme.
5.4 Identification and scaling-up of local government best practices With local governments responsible for education and health, inequality of opportunity can be reduced
by progressively increasing budget allocation toward these public services. Despite disagreement among scholars on the whether the “big-bang” decentralization has been effective in reducing regional economic disparities, political decentralization has been successful in producing innovate political leaders at the
regional and local levels. Some cities in Indonesia are led by mayors that are consistently reforming administration. Among the most well-known is the city of Surabaya’s mayor, Tri Rismaharini, who has introduced education and awareness programmes and allocated 35 per cent of city’s budget to education, which is far higher than the national standard.18
Another example is Jakarta’s former governor, Joko Widodo (currently Indonesian president), who introduced the Smart Card programme. The programme, which continues under Jakarta’s new governor,
Basuki Tjahaja Purnama, handed out vouchers of Rp 360,000 (USD31) per month, or about a quarter of their household budget, to a typical poor family of two young children in school. The programme targeted more than 300,000 students from poor families at a cost of Rp 800 billion (USD69m). The vouchers had
to be spent on education (getting the bus to school, books, uniform and so on). Evidence suggests that this policy alone could cut rising inequality in Jakarta by half.19 The City of Bandung also introduced a progressive reform to tackle inequality of employment opportunity
among the poor. Led by a progressive mayor, Ridwan Kamil, the city initiated a micro-credit scheme managed by a local government-owned bank “Bank Perkreditan Rakyat” (BPR) in Bandung. The programme, which was first launched in May 2015, targets microscale businesses, individuals or group of
individuals (Musari, 2016). The programme is named “Kredit Melati”, an abbreviation of “Melawan Rentenir”, which translates to “fighting loan sharks”. Loan shark practices have been common among micro-business in Indonesia including in Bandung city (Brau and Woller, 2004). The practice of traditional
money lenders in Indonesia has been the main source of financial capital for small scale business in Indonesia since the colonial era (Schrader, 1994). The success of Kredit Melati – in terms of significant number of beneficiaries, as well as inclusion of a minimum non-performing loan (NPL) – has inspired other regions to follow suit. For example, in early August of 2016, Bank of Solo in Central Java introduced a
scheme bearing the same name of Kredit Melati in the city of Solo. Numerous awards were received in 2017, among others the “Top Enterprises of the Association of District Government of Indonesia” and the “Association of Indonesian City Government” through the magazine Business News.
18 http://www.huffingtonpost.com/stanley-weiss/surabayas-mrs-mayor-indon_b_3785172.html 19 http://www.aljazeera.com/indepth/opinion/2014/07/indonesia-jarring-wealth-gap-2014728101920261316.html
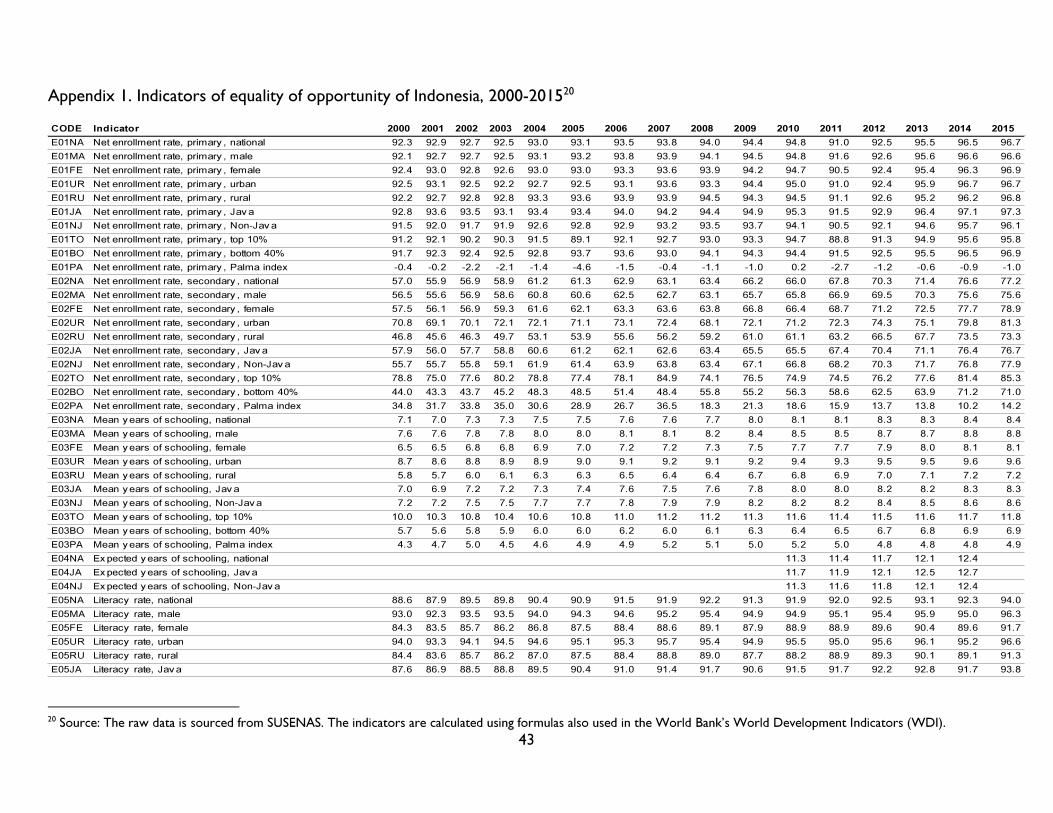
43
Appendix 1. Indicators of equality of opportunity of Indonesia, 2000-201520
20 Source: The raw data is sourced from SUSENAS. The indicators are calculated using formulas also used in the World Bank’s World Development Indicators (WDI).
CODE Indicator 2000 2001 2002 2003 2004 2005 2006 2007 2008 2009 2010 2011 2012 2013 2014 2015
E01NA Net enrollment rate, primary , national 92.3 92.9 92.7 92.5 93.0 93.1 93.5 93.8 94.0 94.4 94.8 91.0 92.5 95.5 96.5 96.7
E01MA Net enrollment rate, primary , male 92.1 92.7 92.7 92.5 93.1 93.2 93.8 93.9 94.1 94.5 94.8 91.6 92.6 95.6 96.6 96.6
E01FE Net enrollment rate, primary , female 92.4 93.0 92.8 92.6 93.0 93.0 93.3 93.6 93.9 94.2 94.7 90.5 92.4 95.4 96.3 96.9
E01UR Net enrollment rate, primary , urban 92.5 93.1 92.5 92.2 92.7 92.5 93.1 93.6 93.3 94.4 95.0 91.0 92.4 95.9 96.7 96.7
E01RU Net enrollment rate, primary , rural 92.2 92.7 92.8 92.8 93.3 93.6 93.9 93.9 94.5 94.3 94.5 91.1 92.6 95.2 96.2 96.8
E01JA Net enrollment rate, primary , Jav a 92.8 93.6 93.5 93.1 93.4 93.4 94.0 94.2 94.4 94.9 95.3 91.5 92.9 96.4 97.1 97.3
E01NJ Net enrollment rate, primary , Non-Jav a 91.5 92.0 91.7 91.9 92.6 92.8 92.9 93.2 93.5 93.7 94.1 90.5 92.1 94.6 95.7 96.1
E01TO Net enrollment rate, primary , top 10% 91.2 92.1 90.2 90.3 91.5 89.1 92.1 92.7 93.0 93.3 94.7 88.8 91.3 94.9 95.6 95.8
E01BO Net enrollment rate, primary , bottom 40% 91.7 92.3 92.4 92.5 92.8 93.7 93.6 93.0 94.1 94.3 94.4 91.5 92.5 95.5 96.5 96.9
E01PA Net enrollment rate, primary , Palma index -0.4 -0.2 -2.2 -2.1 -1.4 -4.6 -1.5 -0.4 -1.1 -1.0 0.2 -2.7 -1.2 -0.6 -0.9 -1.0
E02NA Net enrollment rate, secondary , national 57.0 55.9 56.9 58.9 61.2 61.3 62.9 63.1 63.4 66.2 66.0 67.8 70.3 71.4 76.6 77.2
E02MA Net enrollment rate, secondary , male 56.5 55.6 56.9 58.6 60.8 60.6 62.5 62.7 63.1 65.7 65.8 66.9 69.5 70.3 75.6 75.6
E02FE Net enrollment rate, secondary , female 57.5 56.1 56.9 59.3 61.6 62.1 63.3 63.6 63.8 66.8 66.4 68.7 71.2 72.5 77.7 78.9
E02UR Net enrollment rate, secondary , urban 70.8 69.1 70.1 72.1 72.1 71.1 73.1 72.4 68.1 72.1 71.2 72.3 74.3 75.1 79.8 81.3
E02RU Net enrollment rate, secondary , rural 46.8 45.6 46.3 49.7 53.1 53.9 55.6 56.2 59.2 61.0 61.1 63.2 66.5 67.7 73.5 73.3
E02JA Net enrollment rate, secondary , Jav a 57.9 56.0 57.7 58.8 60.6 61.2 62.1 62.6 63.4 65.5 65.5 67.4 70.4 71.1 76.4 76.7
E02NJ Net enrollment rate, secondary , Non-Jav a 55.7 55.7 55.8 59.1 61.9 61.4 63.9 63.8 63.4 67.1 66.8 68.2 70.3 71.7 76.8 77.9
E02TO Net enrollment rate, secondary , top 10% 78.8 75.0 77.6 80.2 78.8 77.4 78.1 84.9 74.1 76.5 74.9 74.5 76.2 77.6 81.4 85.3
E02BO Net enrollment rate, secondary , bottom 40% 44.0 43.3 43.7 45.2 48.3 48.5 51.4 48.4 55.8 55.2 56.3 58.6 62.5 63.9 71.2 71.0
E02PA Net enrollment rate, secondary , Palma index 34.8 31.7 33.8 35.0 30.6 28.9 26.7 36.5 18.3 21.3 18.6 15.9 13.7 13.8 10.2 14.2
E03NA Mean y ears of schooling, national 7.1 7.0 7.3 7.3 7.5 7.5 7.6 7.6 7.7 8.0 8.1 8.1 8.3 8.3 8.4 8.4
E03MA Mean y ears of schooling, male 7.6 7.6 7.8 7.8 8.0 8.0 8.1 8.1 8.2 8.4 8.5 8.5 8.7 8.7 8.8 8.8
E03FE Mean y ears of schooling, female 6.5 6.5 6.8 6.8 6.9 7.0 7.2 7.2 7.3 7.5 7.7 7.7 7.9 8.0 8.1 8.1
E03UR Mean y ears of schooling, urban 8.7 8.6 8.8 8.9 8.9 9.0 9.1 9.2 9.1 9.2 9.4 9.3 9.5 9.5 9.6 9.6
E03RU Mean y ears of schooling, rural 5.8 5.7 6.0 6.1 6.3 6.3 6.5 6.4 6.4 6.7 6.8 6.9 7.0 7.1 7.2 7.2
E03JA Mean y ears of schooling, Jav a 7.0 6.9 7.2 7.2 7.3 7.4 7.6 7.5 7.6 7.8 8.0 8.0 8.2 8.2 8.3 8.3
E03NJ Mean y ears of schooling, Non-Java 7.2 7.2 7.5 7.5 7.7 7.7 7.8 7.9 7.9 8.2 8.2 8.2 8.4 8.5 8.6 8.6
E03TO Mean y ears of schooling, top 10% 10.0 10.3 10.8 10.4 10.6 10.8 11.0 11.2 11.2 11.3 11.6 11.4 11.5 11.6 11.7 11.8
E03BO Mean y ears of schooling, bottom 40% 5.7 5.6 5.8 5.9 6.0 6.0 6.2 6.0 6.1 6.3 6.4 6.5 6.7 6.8 6.9 6.9
E03PA Mean y ears of schooling, Palma index 4.3 4.7 5.0 4.5 4.6 4.9 4.9 5.2 5.1 5.0 5.2 5.0 4.8 4.8 4.8 4.9
E04NA Ex pected y ears of schooling, national 11.3 11.4 11.7 12.1 12.4
E04JA Ex pected y ears of schooling, Jav a 11.7 11.9 12.1 12.5 12.7
E04NJ Ex pected y ears of schooling, Non-Jav a 11.3 11.6 11.8 12.1 12.4
E05NA Literacy rate, national 88.6 87.9 89.5 89.8 90.4 90.9 91.5 91.9 92.2 91.3 91.9 92.0 92.5 93.1 92.3 94.0
E05MA Literacy rate, male 93.0 92.3 93.5 93.5 94.0 94.3 94.6 95.2 95.4 94.9 94.9 95.1 95.4 95.9 95.0 96.3
E05FE Literacy rate, female 84.3 83.5 85.7 86.2 86.8 87.5 88.4 88.6 89.1 87.9 88.9 88.9 89.6 90.4 89.6 91.7
E05UR Literacy rate, urban 94.0 93.3 94.1 94.5 94.6 95.1 95.3 95.7 95.4 94.9 95.5 95.0 95.6 96.1 95.2 96.6
E05RU Literacy rate, rural 84.4 83.6 85.7 86.2 87.0 87.5 88.4 88.8 89.0 87.7 88.2 88.9 89.3 90.1 89.1 91.3
E05JA Literacy rate, Jav a 87.6 86.9 88.5 88.8 89.5 90.4 91.0 91.4 91.7 90.6 91.5 91.7 92.2 92.8 91.7 93.8

44
Appendix 1 (continued)
CODE Indicator 2000 2001 2002 2003 2004 2005 2006 2007 2008 2009 2010 2011 2012 2013 2014 2015
E05NJ Literacy rate, Non-Jav a 90.2 89.5 91.4 91.3 91.8 91.8 92.1 92.5 92.9 92.3 92.4 92.5 93.0 93.6 93.1 94.3
E05TO Literacy rate, top 10% 96.1 96.5 97.6 97.2 97.5 97.8 98.3 99.8 98.6 98.1 98.7 98.2 98.4 98.6 98.0 98.8
E05BO Literacy rate, bottom 40% 83.7 82.5 84.5 85.2 85.8 86.0 87.3 84.2 87.1 86.4 87.0 87.0 88.1 89.0 88.0 90.2
E05PA Literacy rate, Palma index 12.4 14.0 13.1 12.0 11.7 11.8 10.9 15.6 11.5 11.7 11.7 11.2 10.3 9.6 9.9 8.6
E06NA Effectiv e transition rate (primary to secondary ), national 78.4 81.8 83.7 78.6 88.6 98.9 91.5 92.1 89.8 89.8 96.4 91.7
E06MA Effectiv e transition rate (primary to secondary ), male 77.6 80.5 83.7 78.8 88.3 99.6 88.3 91.3 84.1 96.6 91.5
E06FE Effectiv e transition rate (primary to secondary ), femiale 79.2 83.1 83.7 78.4 89.0 98.3 95.0 92.8 96.4 96.2 91.8
E08NA Pupil-teacher ratio, primary , national 16.9 15.9 15.1 14.6 13.3 15.6 15.6 13.3 11.7 12.4 15.2 14.9
E08JA Pupil-teacher ratio, primary , Jav a
E08NJ Pupil-teacher ratio, primary , Non-Jav a
E09NA Pupil-teacher ratio, lower-secondary , national 15.5 15.1 13.9 15.0 14.9 12.9 12.9 13.7 12.5 13.0 12.9 14.3 16.1 14.4
E09JA Pupil-teacher ratio, lower-secondary , Jav a
E09NJ Pupil-teacher ratio, lower-secondary , Non-Jav a
E10NA Pupil-teacher ratio, upper-secondary , national 13.1 13.0 13.1 13.1 13.2 11.9 11.4 12.2 11.2 12.0 11.3 15.5 17.4 16.9
E10JA Pupil-teacher ratio, upper-secondary , Jav a
E10NJ Pupil-teacher ratio, upper-secondary , Non-Jav a
E11NA Pupil-teacher ratio, tertiary , national 14.4 13.9 12.6 14.7 13.1 13.5 13.7 14.3 15.4 18.4 18.4 22.5 27.5 27.0
E11JA Pupil-teacher ratio, tertiary , Jav a
E11NJ Pupil-teacher ratio, tertiary , Non-Jav a
E12NA Government education ex penditure (% of GDP), National
E12JA Government education ex penditure (% of GDP), Jav a 0.2 0.3 0.3 0.3 0.3 0.3 0.0 0.2 0.1 0.5 0.5 0.5
E12NJ Government education ex penditure (% of GDP), Non-Jav a 0.1 0.2 0.2 0.2 0.2 0.2 0.1 0.2 0.4 0.2 0.2 0.2
E13NA Out-of-pocket education ex penditure (%), National 3.6 3.2 2.7 3.3 3.5 4.0 5.9 7.0 6.2 7.9 8.5 4.1 4.2
E13UR Out-of-pocket education ex penditure (%), Urban 4.9 4.3 3.4 4.3 4.5 4.9 7.4 9.0 7.8 9.3 10.2 4.5 5.0
E13RU Out-of-pocket education ex penditure (%), Rural 2.0 1.7 1.6 2.1 2.2 2.7 3.7 4.4 3.6 5.6 5.7 3.2 2.9
E13JA Out-of-pocket education ex penditure (%), Jav a 4.1 3.6 2.9 3.7 3.9 4.5 6.7 8.3 8.0 8.8 9.5 4.7 4.7
E13NJ Out-of-pocket education ex penditure (%), Non-Jav a 2.7 2.4 2.3 2.6 2.9 3.1 4.6 5.1 3.7 6.6 7.3 3.1 3.6
E13TO Out-of-pocket education ex penditure (%), Top 10% 5.7 4.9 3.6 4.8 5.1 5.8 8.8 9.9 8.7 10.4 11.5 4.9 5.6
E13BO Out-of-pocket education ex penditure (%), Bottom 40% 2.3 2.1 1.8 2.3 2.5 2.4 3.5 4.6 4.3 6.0 5.8 3.6 3.3
E13PA Out-of-pocket education ex penditure (%), Palma Index 3.3 2.8 1.8 2.5 2.6 3.4 5.3 5.3 4.4 4.4 5.7 1.3 2.3
H01NA Infant mortality rate, National 47.0 43.0 39.0 26.0 34.0
H01JA Infant mortality rate, Jav a 43.9 36.0 32.2 21.0 28.5
H01NJ Infant mortality rate, Non-Jav a 53.7 47.2 45.2 31.4 41.2
H02NA Child-under-5 mortality rate, National 52.3 49.8 47.6 45.4 49.3 41.4 39.6 37.9 36.2 34.7 33.1 31.7 30.4 29.3 28.2 27.2
H02JA Child-under-5 mortality rate, Jav a 40.3 34.8
N02NJ Child-under-5 mortality rate, Non-Jav a 60.9 54.3
H03NA Infant mortality rate, National
H03JA Infant mortality rate, Jav a
H03NJ Infant mortality rate, Non-Jav a
45
Appendix 1 (continued)
CODE Indicator 2000 2001 2002 2003 2004 2005 2006 2007 2008 2009 2010 2011 2012 2013 2014 2015
H04NA Maternal mortality rate, National (WDI) 265.0 253.0 241.0 231.0 221.0 212.0 200.0 190.0 181.0 173.0 165.0 156.0 148.0 140.0 133.0 126.0
H05NA Maternal mortality rate, National (DHS) 307.0 228.0 359.0
H06NA Life ex pectancy at birth, NA 66.2 66.4 66.6 66.8 67.0 67.2 67.4 67.6 67.8 68.0 68.1 68.3 68.5 68.7 68.9 69.1
H06MA Life ex pectancy at birth, Male 64.6 64.7 64.8 65.0 65.1 65.2 65.4 65.6 65.7 65.9 66.1 66.3 66.5 66.7 66.9 67.0
H06FE Life ex pectancy at birth, Female 68.0 68.2 68.5 68.7 69.0 69.2 69.4 69.7 69.9 70.1 70.3 70.5 70.6 70.8 71.0 71.2
H06JA Life ex pectancy at birth, Jav a 67.8 68.7 69.3 69.5 69.6 69.8 69.9 70.1 70.2 70.4 70.6
H06NJ Life ex pectancy at birth, Non-Jav a 66.0 66.8 67.4 67.7 68.0 68.1 68.3 68.5 68.8 69.0 69.2
H07NA Malnutrition, National 18.4 17.9 19.6
H07JA Malnutrition, Jav a 14.8 14.5
H07NJ Malnutrition, Non-Jav a 21.7 21.0
H08NA Prev alence of stunting, National 36.8 35.6 37.2
H08JA Prev alence of stunting, Jav a 33.3 31.0
H08NJ Prev alence of stunting, Non-Jav a 38.7 36.6
H09NA Prev alence of w asting, National 13.6 13.3 12.1
H09JA Prev alence of w asting, Jav a 12.4 12.3
H09NJ Prev alence of w asting, Non-Jav a 15.6 13.8
H10NA Out-of-pocket health ex penditure (%), National 4.8 6.2 4.4 3.4 3.7 3.3 3.0 4.0 4.6 4.5 3.8 2.1 2.6
H10UR Out-of-pocket health ex penditure (%), Urban 5.2 6.9 4.4 3.5 3.9 3.4 3.2 4.0 5.0 4.7 3.8 2.1 2.8
H10RU Out-of-pocket health ex penditure (%), Rural 4.2 5.2 4.4 3.3 3.6 3.1 2.8 4.1 4.0 4.2 3.7 2.2 2.3
H10JA Out-of-pocket health ex penditure (%), Jav a 5.3 6.9 4.7 3.8 4.3 3.7 3.3 4.4 5.2 5.1 4.0 2.4 3.0
H10NJ Out-of-pocket health ex penditure (%), Non-Jav a 4.0 4.9 3.8 2.8 2.9 2.7 2.6 3.5 3.8 3.7 3.5 1.7 2.1
H10TO Out-of-pocket health ex penditure (%), Top 10% 6.4 8.4 4.7 4.2 4.9 5.3 3.7 4.8 6.1 5.6 4.3 3.1 4.5
H10BO Out-of-pocket health ex penditure (%), Bottom 40% 3.5 4.3 3.7 2.7 2.7 1.8 2.3 3.5 3.5 3.4 2.9 1.2 1.1
H10PA Out-of-pocket health ex penditure (%), Palma Index 2.9 4.1 1.1 1.4 2.1 3.5 1.4 1.3 2.6 2.2 1.4 1.9 3.4
H11NA Number of phy sician per 1000 population, National 0.8 0.8 0.7 1.0 1.3 1.2 1.4 1.8 1.8 1.7 1.7 1.3 2.3
H11JA Number of phy sician per 1000 population, Jav a 0.6 0.6 0.6 0.8 1.2 0.9 1.2 1.3 1.3 1.3 1.3 0.8 1.0
H11NJ Number of phy sician per 1000 population, Non-Jav a 1.0 1.0 0.9 1.3 1.5 1.6 1.7 2.4 2.4 2.3 2.3 2.0 0.9
H12NA Prev alence of HIV (Per 1000 population), National 0.1 0.1 0.2 0.2 0.2 0.3 0.3 0.4 0.4 0.4 0.4 0.4 0.4 0.4 0.4
H12MA Prev alence of HIV (Per 1000 population), Male 0.1 0.1 0.2 0.2 0.3 0.3 0.4 0.4 0.4 0.4 0.4 0.4 0.4 0.4 0.4
H12FE Prev alence of HIV (Per 1000 population), Female 0.1 0.1 0.1 0.1 0.1 0.2 0.2 0.3 0.3 0.4 0.4 0.4 0.4 0.4 0.4
H12JA Prev alence of HIV (Per 1000 population), Jav a
H12NJ Prev alence of HIV (Per 1000 population), Non-Jav a
H13NA Birth assisted by health w orker (%), National 63.5 64.2 66.7 67.9 71.5 70.5 72.4 72.5 74.9 77.3 79.8 81.3 83.4 85.3 87.1 91.5
H13UR Birth assisted by health w orker (%), Urban 82.3 83.5 83.8 85.7 85.8 84.8 87.2 88.7 88.2 90.0 90.1 90.9 91.8 92.8 93.7 96.8
H13RU Birth assisted by health w orker (%), Rural 50.8 50.7 53.7 55.4 61.0 59.3 60.9 60.6 62.9 66.0 69.7 72.0 75.2 78.1 80.6 86.3
H13JA Birth assisted by health w orker (%), Jav a 62.5 63.6 66.6 68.3 72.6 71.2 74.8 74.6 77.5 79.9 82.6 84.2 86.0 87.5 89.4 93.8
H13NJ Birth assisted by health w orker (%), Non-Jav a 64.8 65.1 66.9 67.5 70.2 69.6 69.8 70.1 71.9 74.4 76.7 78.0 80.4 82.8 84.5 88.9
H13TO Birth assisted by health w orker (%), Top 10% 91.9 94.6 95.9 93.9 95.8 92.6 95.4 97.0 95.8 97.2 97.8 96.5 97.1 97.4 97.7 99.4
H13BO Birth assisted by health w orker (%), Bottom 40% 50.1 49.8 51.9 54.4 58.7 57.2 59.4 58.4 62.2 65.4 68.9 71.9 75.2 78.2 81.2 86.6
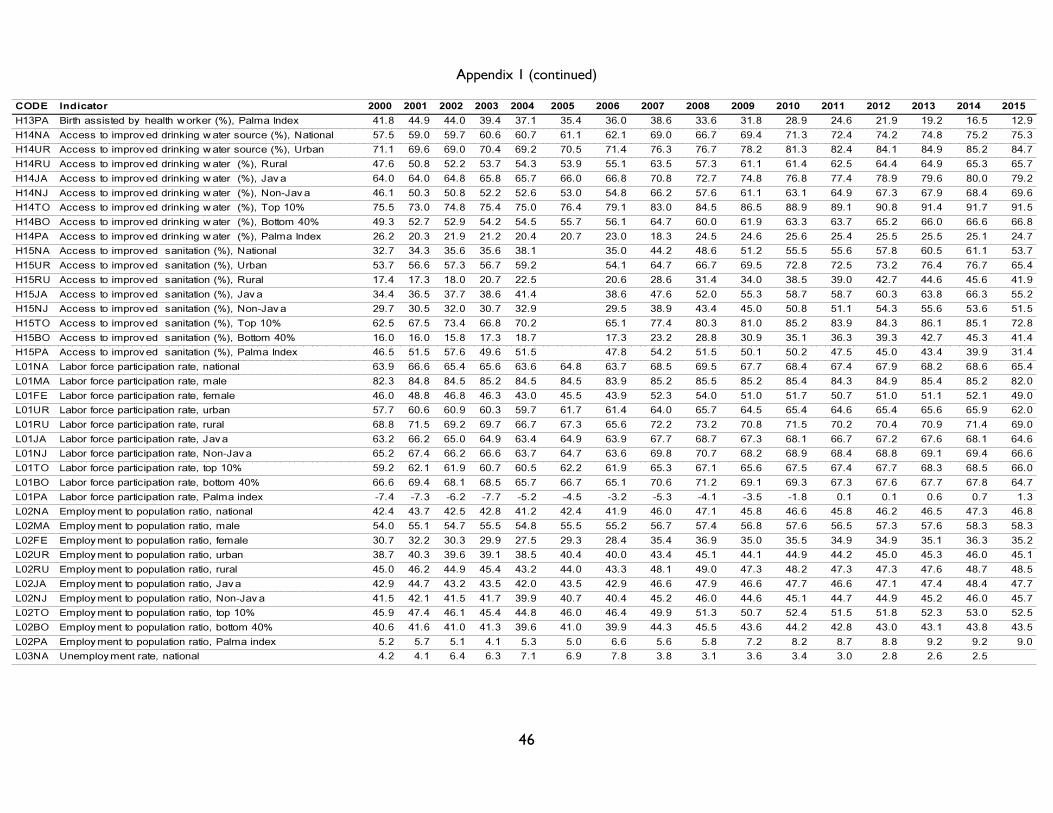
46
Appendix 1 (continued)
CODE Indicator 2000 2001 2002 2003 2004 2005 2006 2007 2008 2009 2010 2011 2012 2013 2014 2015
H13PA Birth assisted by health worker (%), Palma Index 41.8 44.9 44.0 39.4 37.1 35.4 36.0 38.6 33.6 31.8 28.9 24.6 21.9 19.2 16.5 12.9
H14NA Access to improved drinking water source (%), National 57.5 59.0 59.7 60.6 60.7 61.1 62.1 69.0 66.7 69.4 71.3 72.4 74.2 74.8 75.2 75.3
H14UR Access to improved drinking water source (%), Urban 71.1 69.6 69.0 70.4 69.2 70.5 71.4 76.3 76.7 78.2 81.3 82.4 84.1 84.9 85.2 84.7
H14RU Access to improved drinking water (%), Rural 47.6 50.8 52.2 53.7 54.3 53.9 55.1 63.5 57.3 61.1 61.4 62.5 64.4 64.9 65.3 65.7
H14JA Access to improved drinking water (%), Jav a 64.0 64.0 64.8 65.8 65.7 66.0 66.8 70.8 72.7 74.8 76.8 77.4 78.9 79.6 80.0 79.2
H14NJ Access to improved drinking water (%), Non-Jav a 46.1 50.3 50.8 52.2 52.6 53.0 54.8 66.2 57.6 61.1 63.1 64.9 67.3 67.9 68.4 69.6
H14TO Access to improved drinking water (%), Top 10% 75.5 73.0 74.8 75.4 75.0 76.4 79.1 83.0 84.5 86.5 88.9 89.1 90.8 91.4 91.7 91.5
H14BO Access to improved drinking water (%), Bottom 40% 49.3 52.7 52.9 54.2 54.5 55.7 56.1 64.7 60.0 61.9 63.3 63.7 65.2 66.0 66.6 66.8
H14PA Access to improved drinking water (%), Palma Index 26.2 20.3 21.9 21.2 20.4 20.7 23.0 18.3 24.5 24.6 25.6 25.4 25.5 25.5 25.1 24.7
H15NA Access to improved sanitation (%), National 32.7 34.3 35.6 35.6 38.1 35.0 44.2 48.6 51.2 55.5 55.6 57.8 60.5 61.1 53.7
H15UR Access to improved sanitation (%), Urban 53.7 56.6 57.3 56.7 59.2 54.1 64.7 66.7 69.5 72.8 72.5 73.2 76.4 76.7 65.4
H15RU Access to improved sanitation (%), Rural 17.4 17.3 18.0 20.7 22.5 20.6 28.6 31.4 34.0 38.5 39.0 42.7 44.6 45.6 41.9
H15JA Access to improved sanitation (%), Jav a 34.4 36.5 37.7 38.6 41.4 38.6 47.6 52.0 55.3 58.7 58.7 60.3 63.8 66.3 55.2
H15NJ Access to improved sanitation (%), Non-Jav a 29.7 30.5 32.0 30.7 32.9 29.5 38.9 43.4 45.0 50.8 51.1 54.3 55.6 53.6 51.5
H15TO Access to improved sanitation (%), Top 10% 62.5 67.5 73.4 66.8 70.2 65.1 77.4 80.3 81.0 85.2 83.9 84.3 86.1 85.1 72.8
H15BO Access to improved sanitation (%), Bottom 40% 16.0 16.0 15.8 17.3 18.7 17.3 23.2 28.8 30.9 35.1 36.3 39.3 42.7 45.3 41.4
H15PA Access to improved sanitation (%), Palma Index 46.5 51.5 57.6 49.6 51.5 47.8 54.2 51.5 50.1 50.2 47.5 45.0 43.4 39.9 31.4
L01NA Labor force participation rate, national 63.9 66.6 65.4 65.6 63.6 64.8 63.7 68.5 69.5 67.7 68.4 67.4 67.9 68.2 68.6 65.4
L01MA Labor force participation rate, male 82.3 84.8 84.5 85.2 84.5 84.5 83.9 85.2 85.5 85.2 85.4 84.3 84.9 85.4 85.2 82.0
L01FE Labor force participation rate, female 46.0 48.8 46.8 46.3 43.0 45.5 43.9 52.3 54.0 51.0 51.7 50.7 51.0 51.1 52.1 49.0
L01UR Labor force participation rate, urban 57.7 60.6 60.9 60.3 59.7 61.7 61.4 64.0 65.7 64.5 65.4 64.6 65.4 65.6 65.9 62.0
L01RU Labor force participation rate, rural 68.8 71.5 69.2 69.7 66.7 67.3 65.6 72.2 73.2 70.8 71.5 70.2 70.4 70.9 71.4 69.0
L01JA Labor force participation rate, Java 63.2 66.2 65.0 64.9 63.4 64.9 63.9 67.7 68.7 67.3 68.1 66.7 67.2 67.6 68.1 64.6
L01NJ Labor force participation rate, Non-Java 65.2 67.4 66.2 66.6 63.7 64.7 63.6 69.8 70.7 68.2 68.9 68.4 68.8 69.1 69.4 66.6
L01TO Labor force participation rate, top 10% 59.2 62.1 61.9 60.7 60.5 62.2 61.9 65.3 67.1 65.6 67.5 67.4 67.7 68.3 68.5 66.0
L01BO Labor force participation rate, bottom 40% 66.6 69.4 68.1 68.5 65.7 66.7 65.1 70.6 71.2 69.1 69.3 67.3 67.6 67.7 67.8 64.7
L01PA Labor force participation rate, Palma index -7.4 -7.3 -6.2 -7.7 -5.2 -4.5 -3.2 -5.3 -4.1 -3.5 -1.8 0.1 0.1 0.6 0.7 1.3
L02NA Employment to population ratio, national 42.4 43.7 42.5 42.8 41.2 42.4 41.9 46.0 47.1 45.8 46.6 45.8 46.2 46.5 47.3 46.8
L02MA Employment to population ratio, male 54.0 55.1 54.7 55.5 54.8 55.5 55.2 56.7 57.4 56.8 57.6 56.5 57.3 57.6 58.3 58.3
L02FE Employment to population ratio, female 30.7 32.2 30.3 29.9 27.5 29.3 28.4 35.4 36.9 35.0 35.5 34.9 34.9 35.1 36.3 35.2
L02UR Employment to population ratio, urban 38.7 40.3 39.6 39.1 38.5 40.4 40.0 43.4 45.1 44.1 44.9 44.2 45.0 45.3 46.0 45.1
L02RU Employment to population ratio, rural 45.0 46.2 44.9 45.4 43.2 44.0 43.3 48.1 49.0 47.3 48.2 47.3 47.3 47.6 48.7 48.5
L02JA Employment to population ratio, Java 42.9 44.7 43.2 43.5 42.0 43.5 42.9 46.6 47.9 46.6 47.7 46.6 47.1 47.4 48.4 47.7
L02NJ Employment to population ratio, Non-Jav a 41.5 42.1 41.5 41.7 39.9 40.7 40.4 45.2 46.0 44.6 45.1 44.7 44.9 45.2 46.0 45.7
L02TO Employment to population ratio, top 10% 45.9 47.4 46.1 45.4 44.8 46.0 46.4 49.9 51.3 50.7 52.4 51.5 51.8 52.3 53.0 52.5
L02BO Employment to population ratio, bottom 40% 40.6 41.6 41.0 41.3 39.6 41.0 39.9 44.3 45.5 43.6 44.2 42.8 43.0 43.1 43.8 43.5
L02PA Employment to population ratio, Palma index 5.2 5.7 5.1 4.1 5.3 5.0 6.6 5.6 5.8 7.2 8.2 8.7 8.8 9.2 9.2 9.0
L03NA Unemployment rate, national 4.2 4.1 6.4 6.3 7.1 6.9 7.8 3.8 3.1 3.6 3.4 3.0 2.8 2.6 2.5

47
Appendix 1 (continued)
CODE Indicator 2000 2001 2002 2003 2004 2005 2006 2007 2008 2009 2010 2011 2012 2013 2014 2015
L03MA Unemployment rate, male 4.1 3.8 5.6 5.2 6.0 5.7 6.6 3.5 2.8 3.3 3.1 3.0 2.9 2.5 2.6
L03FE Unemployment rate, female 4.5 4.6 7.8 8.3 9.3 9.1 10.0 4.2 3.5 3.9 3.8 3.1 2.8 2.6 2.4
L03UR Unemployment rate, urban 6.9 6.4 9.2 9.6 10.1 9.2 10.5 5.8 4.5 5.0 4.6 4.1 3.8 3.4 3.4
L03RU Unemployment rate, rural 2.5 2.6 4.4 4.1 5.0 5.2 5.7 2.3 1.9 2.3 2.3 2.1 1.9 1.7 1.7
L03JA Unemployment rate, Java 5.0 4.5 7.0 6.8 7.7 7.2 8.5 4.4 3.6 4.1 3.8 3.5 3.3 2.9 2.8
L03NJ Unemployment rate, Non-Java 3.1 3.6 5.6 5.6 6.3 6.5 6.6 2.8 2.4 2.7 2.8 2.3 2.2 2.1 2.2
L03TO Unemployment rate, top 10% 4.5 4.3 6.3 6.2 6.9 6.1 6.5 3.9 2.9 3.0 2.7 2.3 2.4 2.4 2.2
L03BO Unemployment rate, bottom 40% 3.8 3.6 5.8 5.7 6.7 6.7 7.7 3.3 2.8 3.4 3.4 3.2 3.1 2.7 2.6
L03PA Unemployment rate, Palma index 0.7 0.7 0.5 0.5 0.2 -0.6 -1.2 0.7 0.1 -0.4 -0.7 -0.9 -0.7 -0.3 -0.3
L04NA Informality (Vulnerable employment), national 62.6 66.7 64.0 67.3 65.7 63.4 64.7 60.1 63.5 63.4 61.4 59.7 58.9 59.4 58.7 58.0
L04MA Informality (Vulnerable employment), male 59.8 63.2 61.3 64.7 63.5 61.0 63.1 55.8 60.1 60.2 58.7 56.4 55.5 55.8 54.9 54.9
L04FE Informality (Vulnerable employment), female 67.7 72.7 69.0 72.2 70.0 67.9 67.9 66.9 68.7 68.5 65.8 65.1 64.6 65.3 64.9 63.1
L04UR Informality (Vulnerable employment), urban 43.7 45.6 43.6 46.6 45.6 44.4 45.7 43.1 47.3 46.8 43.9 43.4 42.2 43.3 43.0 41.7
L04RU Informality (Vulnerable employment), rural 74.5 80.6 78.6 80.2 79.3 77.2 78.2 72.0 77.4 77.9 77.5 74.8 74.9 74.7 73.7 73.4
L04JA Informality (Vulnerable employment), Jav a 57.1 62.8 60.1 63.2 62.2 60.4 61.7 55.4 60.5 60.7 58.9 56.8 56.1 56.5 56.1 54.3
L04NJ Informality (Vulnerable employment), Non-Java 71.6 72.8 70.4 73.4 71.0 68.3 69.2 66.8 67.7 67.2 64.9 63.7 62.9 63.3 62.4 62.9
L04TO Informality (Vulnerable employment), top 10% 41.2 36.4 30.7 36.6 33.3 31.1 32.6 32.3 32.3 32.5 27.7 29.7 29.4 29.9 30.1 29.7
L04BO Informality (Vulnerable employment), bottom 40% 70.5 78.7 77.8 79.6 79.2 78.1 78.2 70.8 77.6 77.4 77.5 75.2 74.1 74.2 72.8 72.2
L04PA Informality (Vulnerable employment), Palma index -29.3 -42.3 -47.1 -43.1 -45.9 -46.9 -45.6 -38.5 -45.3 -44.9 -49.8 -45.5 -44.7 -44.2 -42.7 -42.6
L05NA Self employment, national 46.0 42.8 43.2 44.8 44.1 43.2 44.4 42.4 39.8 39.7 37.9 37.1 36.2 36.7 36.6 36.0
L05MA Self employment, male 53.1 50.5 50.0 52.3 50.7 48.3 50.0 49.4 44.9 45.0 43.9 41.4 40.1 40.3 39.9 39.2
L05FE Self employment, female 33.4 29.7 31.0 30.9 31.1 33.3 33.3 31.4 31.8 31.2 28.1 29.9 29.8 30.8 31.4 30.6
L05UR Self employment, urban 38.7 36.1 35.7 37.6 36.9 35.7 37.1 36.6 34.3 34.2 31.5 31.3 30.2 30.8 30.8 29.1
L05RU Self employment, rural 50.5 47.3 48.6 49.4 49.1 48.6 49.6 46.5 44.5 44.5 43.8 42.4 42.0 42.4 42.2 42.5
L05JA Self employment, Jav a 44.0 40.7 41.0 42.4 41.4 40.8 41.7 40.8 37.6 37.8 36.1 34.4 33.5 34.0 34.0 33.2
L05NJ Self employment, Non-Java 49.2 46.2 46.9 48.5 48.3 47.0 48.3 44.8 42.8 42.4 40.6 40.7 40.1 40.5 40.3 39.8
L05TO Self employment, top 10% 37.6 33.5 30.0 35.1 33.1 31.1 33.7 32.1 29.9 31.0 27.3 28.7 28.4 28.2 29.0 28.2
L05BO Self employment, bottom 40% 47.1 44.0 45.4 45.7 45.8 45.7 45.8 43.6 41.4 40.9 40.5 38.7 38.0 38.5 38.2 38.4
L05PA Self employment, Palma index -9.5 -10.4 -15.4 -10.5 -12.7 -14.5 -12.1 -11.5 -11.5 -9.8 -13.2 -10.0 -9.6 -10.2 -9.2 -10.2
L06NA Contributing family w orkers, national 20.1 19.4 17.6 20.3 18.5 18.0 16.9 17.3 16.9 17.3 17.3 16.4 16.0 15.9 17.9 14.0
L06MA Contributing family w orkers, male 38.6 36.2 41.5 38.5 37.5 34.1 33.6 32.4 31.2 31.3 30.9 28.9
L06FE Contributing family w orkers, female 8.1 7.0 8.5 7.5 7.7 7.7 7.8 8.1 7.3 7.0 6.9 6.1
L07NA Employment in agriculture (%) 45.3 43.8 44.3 46.4 43.3 44.0 42.0 41.2 40.3 39.7 38.3 36.2 35.3 34.8 34.3 33.0
L08NA Employment in manufacturing (%) 17.4 18.7 18.8 17.7 18.0 18.7 18.6 18.8 18.8 18.8 19.3 20.9 21.5 20.4 21.0 21.6
L09NA Employment in serv ices (%) 37.3 37.5 36.9 35.9 38.7 37.2 39.3 39.9 40.8 41.5 42.3 43.0 43.1 44.8 44.8 45.4
F01NA Access to electricity (% of all household), national 86.3 86.3 87.6 87.9 89.0 90.6 91.5 92.7 93.5 94.2 94.8 95.8 96.5 97.0 97.5
F01UR Access to electricity (% of all household), urban 97.9 97.8 98.1 97.8 98.4 98.6 98.5 98.9 98.9 99.0 99.3 99.6 99.7 99.7 99.8
F01RU Access to electricity (% of all household), rural 77.8 77.4 79.1 81.0 82.1 84.6 86.1 86.9 88.5 89.4 90.4 92.1 93.3 94.3 95.2
F01JA Access to electricity (% of all household), Java 94.6 95.1 96.0 96.7 97.2 98.0 97.4 98.4 98.7 99.0 99.4 99.6 99.7 99.8 99.9
F01NJ Access to electricity (% of all household), Non-Jav a 71.6 71.1 72.9 73.8 75.9 79.2 82.2 84.2 85.8 86.9 88.0 90.2 91.8 93.0 94.2

48
Appendix 1 (continued)
CODE Indicator 2000 2001 2002 2003 2004 2005 2006 2007 2008 2009 2010 2011 2012 2013 2014 2015
F01TO Access to electricity (% of all household), top 10% 96.7 97.2 98.5 96.9 98.1 98.5 99.1 98.7 98.8 98.8 99.1 99.4 99.4 99.6 99.7
F01BO Access to electricity (% of all household), bottom 40% 77.7 77.5 78.3 79.8 80.8 83.9 84.7 88.0 88.7 90.2 91.1 92.8 93.8 94.8 95.6
F01PA Access to electricity (% of all household), Palma index 19.0 19.7 20.2 17.2 17.3 14.6 14.4 10.7 10.1 8.6 8.1 6.6 5.6 4.8 4.1
F02NA Access to non-solid fuel (% of all household), national 1,303.0 1,244.0 1,318.0 1,287.0 1,297.0 1,402.0 1,589.0 1,631.0 1,643.0 1,676.0 1,628.0
F02UR Access to non-solid fuel (% of all household), urban
F02RU Access to non-solid fuel (% of all household), rural
F02JA Access to non-solid fuel (% of all household), Jav a
F02NJ Access to non-solid fuel (% of all household), Non-Jav a
F02TO Access to non-solid fuel (% of all household), top 10%
F02BO Access to non-solid fuel (% of all household), bottom 40%
F02PA Access to non-solid fuel (% of all household), Palma index
F03NA Alternativ e and nuclear energy (%), national 5.9 7.1 7.0 7.0 6.9 6.8 6.7 7.1 8.2 8.5 8.4 8.4 8.2 8.3
F04NA Combustible renewables and waste (% of total energy use) 32.1 31.4 30.4 30.6 28.7 28.2 28.2 28.3 28.0 26.4 24.9 26.2 25.4 25.7
F05NA Electric power consumption (kWh per capita) 390.4 411.4 417.5 428.9 474.4 500.7 516.2 546.3 570.3 594.3 636.6 680.7 718.7 787.7
F06NA Energy imports, net (% of energy use) -52.6 -51.8 -50.3 -54.0 -50.2 -55.9 -70.8 -74.1 -73.6 -76.1 -81.4 -105.8 -107.8 -115.3
F07NA Energy use (kg of oil equiv alent), per capita, national 735.8 742.9 760.1 752.2 791.3 794.7 802.7 788.6 793.8 838.7 866.8 838.6 854.1 850.2
F08NA Energy use (kg of oil equiv alent), per $1000 GDP, national 126.7 125.2 124.2 118.9 120.7 116.2 112.7 105.5 101.5 103.9 102.4 94.5 92.0 87.9
F09NA Fossil fuel energy consumption (% of total), national 62.0 61.5 62.5 62.4 64.3 65.0 65.2 64.6 63.8 65.2 66.7 65.4 66.3 65.9
F10NA Primary Energy Consumption (Million tonnes oil equi.) 100.0 105.9 111.1 119.6 118.8 121.3 124.0 131.9 131.6 136.8 151.5 161.7 169.4 175.0 188.0 195.0
F11NA Primary Coal Ex ports (Million tonnes) 58.5 65.3 74.2 85.7 93.8 110.8 143.6 163.0 191.4 198.4 208.0 272.7 304.1 328.7 382.0 328.4
P01NA Registration: number of registered v oters (Million) 148.0 171.3 185.8
P02NA Voter Turn-out: presidential 68.5 71.9 69.6
P03NA Voter Turn-out: parliamentary 84.1 71.0 75.1
P04NA Total number of v otes cast in the election, presidential 106.2 128.0 135.0
P05NA Total number of v otes cast in the election, parliamentary 124.5 121.6 139.6
P06NA Voting Age Population 142.1 168.3
P07NA Freedom - Political Rights 26.0 25.0 29.0 30.0 30.0 30.0 30.0 30.0 30.0 30.0 30.0 30.0 30.0
P08NA Freedom - Civ il Liberties 32.0 34.0 34.0 35.0 35.0 37.0 36.0 35.0 35.0 35.0 35.0 34.0 34.0
P09NA Women's share of gov ernment ministerial position 0.1 0.1 0.1 0.2
P10NA Proportion of seats held by women in national parliament 0.1 0.2 0.2

49
Appendix 2. Data description
2.1 Data definition21
Net enrollment rate, primary
Total number of students in the theoretical age group for primary education enrolled in that level, expressed as a percentage of the total population in that age group. Divide the number of students enrolled who are of the official age group for primary education by the population for the same age group and multiply the result by 100. Net enrollment rate (NER) at each level of education should be based on enrolment of the relevant age group in all types of schools and education institutions, including public, private and all other institutions that provide organized educational programmes. A high NER denotes a high degree of coverage for the official school-age population. The theoretical maximum value is 100 per cent. Increasing trends can be considered as reflecting improving coverage at the specified level of education. When the NER is compared with the gross enrollment rate (GER), the difference between the two highlights the incidence of under-aged and over-aged enrolment. If the NER is below 100 per cent, then the complement, i.e. the difference with 100 per cent, provides a measure of the proportion of children not enrolled at the specified level of education. However, since some of these children/youth could be enrolled at other levels of education, this difference should in no way be considered as indicating the percentage of students not enrolled. To measure universal primary education, for example, adjusted primary NER is calculated on the basis of the percentage of children in the official primary school age range who are enrolled in either primary or secondary education. A more precise complementary indicator is the Age-specific enrolment ratio (ASER) which shows the participation in education of the population of each particular age, regardless of the level of education.
Net enrollment rate, secondary
Total number of students in the theoretical age group for secondary education enrolled in that level, expressed as a percentage of the total population in that age group. Divide the number of students enrolled who are of the official age group for secondary education by the population for the same age group and multiply the result by 100. NER at each level of education should be based on enrolment of the relevant age group in all types of schools and education institutions, including public, private and all other institutions that provide organized educational programmes.
Mean years of schooling
Average number of years of education received by people ages 25 and older, converted from education attainment levels using official durations of each level.
Expected years of schooling
Number of years of schooling that a child of school entrance age can expect to receive if prevailing patterns of age-specific enrolment rates persist throughout life.
Literacy rate
Percentage of the population age 15 and above who can, with understanding, read and write a short, simple statement on their everyday life. Generally, “literacy” also encompasses “numeracy”, the ability to make simple arithmetic calculations. This indicator is calculated by dividing the number of literates aged 15 years and over by the corresponding age group population and multiplying the result by 100.
Effective transition rate (primary to secondary)
Number of students admitted to the first grade of a higher level of education in a given year, expressed as a percentage of the number of students enrolled in the final grade of the lower level of education in the previous year. Divide the number of new entrants in the first grade of the specified higher cycle or level
21 The raw data were sourced from SUSENAS. The indicators were calculated by authors using formulas also used
in the World Bank’s World Development Indicators (WDI).
50
of education by the number of pupils who were enrolled in the final grade of the preceding cycle or level of education in the previous school year, and multiply by 100. High transition rates indicate a high level of access or transition from one level of education to the next. They also reflect the intake capacity of the next level of education. Inversely, low transition rates can signal problems in the bridging between two cycles or levels of education, due to either deficiencies in the examination system, or inadequate admission capacity in the higher cycle or level of education, or both. This indicator can be distorted by incorrect distinction between new entrants and repeaters, especially in the first grade of the specified higher level of education. Students who interrupted their studies for one or more years after having completed the lower level of education, together with the migrant students, could also affect the quality of this indicator.
Pupil-teacher ratio, primary
Primary school pupil-teacher ratio is the average number of pupils per teacher in primary school.
Pupil-teacher ratio, lower-secondary
Lower secondary school pupil-teacher ratio is the average number of pupils per teacher in lower secondary school.
Pupil-teacher ratio, upper-secondary
Upper secondary school pupil-teacher ratio is the average number of pupils per teacher in upper secondary school.
Pupil-teacher ratio, tertiary
Tertiary school pupil-teacher ratio is the average number of pupils per teacher in tertiary school.
Government education expenditure (% of GDP)
General government expenditure on education (current, capital, and transfers) is expressed as a percentage of GDP. It includes expenditure funded by transfers from international sources to government. General government usually refers to local, regional and central governments.
Infant mortality rate
Infant mortality rate is the number of infants dying before reaching one year of age, per 1,000 live births in a given year.
Child-under-5 mortality rate
Under-five mortality rate is the probability per 1,000 that a newborn baby will die before reaching age five, if subject to age-specific mortality rates of the specified year.
Maternal mortality rate (WDI)
Maternal mortality ratio is the number of women who die from pregnancy-related causes while pregnant or within 42 days of pregnancy termination per 100,000 live births. The data are estimated with a regression model using information on the proportion of maternal deaths among non-AIDS deaths in women aged 15-49, fertility, birth attendants, and GDP.
Maternal mortality rate (Demographic and Health Survey)22
Maternal mortality ratio is the number of women who die from pregnancy-related causes while pregnant or within 42 days of pregnancy termination per 100,000 live births. The data are estimated with a regression model using information on the proportion of maternal deaths among non-AIDS deaths in women ages 15-49, fertility, birth attendants, and GDP.
22 The DHS Program is a USAID-funded project implemented by ICF International. The project was previously implemented by ICF/Macro, Macro International Inc., ORC Macro, and Institute for Resource Development, Inc.).
The DHS Program is housed at ICF International's office in Rockville, Maryland USA. Several other organizations are
partners on The DHS Program as well. In the current phase of the contract, The DHS Program partners are Johns Hopkins University Bloomberg School of Public Health/Center for Communication Programs (Hopkins CCP), PATH,
Avenir Health, Vysnova, Blue Raster, Kimetrica, and EnCompass. http://www.dhsprogram.com

51
Life expectancy at birth
Life expectancy at birth indicates the number of years a newborn infant would live if prevailing patterns of mortality at the time of its birth were to stay the same throughout its life.
Malnutrition
Prevalence of underweight children is the percentage of children under age five whose weight for age is more than two standard deviations below the median for the international reference population aged 0-59 months. The data are based on the World Health Organization’s (WHO) new child growth standards released in 200623.
Prevalence of stunting
Prevalence of stunting is the percentage of children under age five whose height for age is more than two standard deviations below the median for the international reference population ages 0-59 months. For children up to two years old height is measured by recumbent length. For older children height is measured by stature while standing. The data are based on the WHO's new child growth standards released in 2006.
Prevalence of wasting
Wasting prevalence is the proportion of children under five whose weight for height is more than two standard deviations below the median for the international reference population ages 0-59.
Out-of-pocket health expenditure (% of expenditure)
Out of pocket expenditure is any direct outlay by households, including gratuities and in-kind payments, to health practitioners and suppliers of pharmaceuticals, therapeutic appliances, and other goods and services whose primary intent is to contribute to the restoration or enhancement of the health status of individuals or population groups. It is a part of private health expenditure.
Number of physician per 1,000 population
Physicians include generalist and specialist medical practitioners (per 1,000 population).
Prevalence of HIV (Per 1,000 population)
Prevalence of HIV is the percentage of people who are infected with HIV. Youth rates are as a percentage of the relevant age group.
Births assisted by health worker (%)
Births attended by skilled health staff are the percentage of deliveries attended by personnel trained to give the necessary supervision, care, and advice to women during pregnancy, labour, and the postpartum period; to conduct deliveries on their own; and to care for newborns.
Access to improved drinking water source (%)
Access to an improved water source refers to the percentage of the population using an improved drinking water source. The improved drinking water source includes piped water on premises (piped household water connection located inside the user’s dwelling, plot or yard), and other improved drinking water sources (public taps or standpipes, tube wells or boreholes, protected dug wells, protected springs, and rainwater collection).
Access to improved sanitation (%)
Access to improved sanitation facilities refers to the percentage of the population using improved sanitation facilities. Improved sanitation facilities are likely to ensure hygienic separation of human excreta from human contact. They include flush/pour flush (to piped sewer system, septic tank, and pit latrine), ventilated improved pit (VIP) latrine, pit latrine with slab, and composting toilet.
Labour force participation rate
23 http://www.who.int/mediacentre/news/releases/2006/pr21/en/

52
Labour force participation rate is the proportion of the population ages 15 and older that is economically active: all people who supply labour for the production of goods and services during a specified period.
Employment to population ratio
Employment to population ratio is the proportion of a country's population that is employed. Ages 15 and older are generally considered the working-age population.
Unemployment rate
Unemployment refers to the share of the labour force that is without work but available for and seeking employment. Definitions of labour force and unemployment differ by country.
Informal vulnerable employment
Informality is defined as self-employed without any workers; self-employed with unpaid workers; working without employer; and family workers. This definition is in line with Indonesian statistical standards.
Self-employment
Self-employed workers are those workers who, working on their own account or with one or a few partners or in cooperative, hold the type of jobs defined as a "self-employment jobs." I.e. jobs where the remuneration is directly dependent upon the profits derived from the goods and services produced. Self-employed workers include four sub-categories of employers, own-account workers, members of producers' cooperatives, and contributing family workers.
Contributing family workers
Contributing family workers are those workers who hold "self-employment jobs" as own-account workers in a market-oriented establishment operated by a related person living in the same household.
Employment in agriculture (%)
Employment is defined as persons of working age who were engaged in any activity to produce goods or provide services for pay or profit, whether at work during the reference period or not at work due to temporary absence from a job, or to working-time arrangement. The agriculture sector consists of activities in agriculture, hunting, forestry and fishing, in accordance with division 1 (ISIC 2) or categories A-B (ISIC 3) or category A (ISIC 4).
Employment in manufacturing (%)
Employment is defined as persons of working age who were engaged in any activity to produce goods or provide services for pay or profit, whether at work during the reference period or not at work due to temporary absence from a job, or to working-time arrangement. The industry sector consists of mining and quarrying, manufacturing, construction, and public utilities (electricity, gas, and water), in accordance with divisions 2-5 (ISIC 2) or categories C-F (ISIC 3) or categories B-F (ISIC 4).
Employment in services (%)
Employment is defined as persons of working age who were engaged in any activity to produce goods or provide services for pay or profit, whether at work during the reference period or not at work due to temporary absence from a job, or to working-time arrangement. The services sector consists of wholesale and retail trade and restaurants and hotels; transport, storage, and communications; financing, insurance, real estate, and business services; and community, social, and personal services, in accordance with divisions 6-9 (ISIC 2) or categories G-Q (ISIC 3) or categories G-U (ISIC 4).
Access to electricity (% of total household)
Access to electricity is the percentage of population with access to electricity. Electrification data are collected from industry surveys and international sources.
Access to non-solid fuel (% of total household)
Access to non-solid fuel is the percentage of population with access to non-solid fuel.
Alternative and nuclear energy (%)
53
Clean energy is non-carbohydrate energy that does not produce carbon dioxide when generated. It includes hydropower and nuclear, geothermal, and solar power, among others.
Combustible renewables and waste (% of total energy use)
Combustible renewables and waste comprise solid biomass, liquid biomass, biogas, industrial waste, and municipal waste, measured as a percentage of total energy use.
Electric power consumption (kWh per capita)
Electric power consumption measures the production of power plants and combined heat and power plants less transmission, distribution, and transformation losses and own use by heat and power plants.
Energy imports, net (% of energy use)
Net energy imports are estimated as energy use less production, both measured in oil equivalents. A negative value indicates that the country is a net exporter. Energy use refers to use of primary energy before transformation to other end-use fuels, which is equal to indigenous production plus imports and stock changes, minus exports and fuels supplied to ships and aircraft engaged in international transport.
Energy use (kg of oil equivalent), per capita
Energy use refers to use of primary energy before transformation to other end-use fuels, which is equal to indigenous production plus imports and stock changes, minus exports and fuels supplied to ships and aircraft engaged in international transport.
Energy use (kg of oil equivalent), per USD1,000 GDP
Energy use per PPP GDP is the kilogram of oil equivalent of energy use per constant PPP GDP. Energy use refers to use of primary energy before transformation to other end-use fuels, which is equal to indigenous production plus imports and stock changes, minus exports and fuels supplied to ships and aircraft engaged in international transport. PPP GDP is gross domestic product converted to 2011 constant international dollars using purchasing power parity rates. An international dollar has the same purchasing power over GDP as a U.S. dollar has in the United States.
Fossil fuel energy consumption (% of total)
Fossil fuel comprises coal, oil, petroleum, and natural gas products.
Registration: number of registered voters
The number of people who were registered for elections as reported by the national electoral management body
Voter turn-out
Voter turnout is the percentage of eligible voters who cast a ballot in an election. (Total Vote divided by Registration)
Total vote: total number of votes cast in the election, presidential
The actual number of people who voted in elections, as reported by the national electoral management body. This variable includes the number of invalid votes as well as blank votes.
Total vote: total number of votes cast in the election, parliamentary
The actual number of people who voted in elections as reported by the national electoral management body. This variable includes the number of invalid votes as well as blank votes.
Voting age population
Voting age population refers to the total number of potential voters of voting age in a given country. The VAP figure is a rough estimate and it does not take into account the fact that there might be people who are above voting age but still not enfranchised due to legal or systemic barriers. The estimate gives an approximate figure of the number of eligible people but it does not reflect the exact number. VAP might differ largely from the number of registered people since registration in many countries is voluntary or not accurate. In countries where registration is compulsory and automatic, and based on the civil register,

54
for example the Scandinavian countries, the VAP figure and the number of registered voters are quite close.
Freedom - political rights
Freedom measurements of political rights data are collected from https://freedomhouse.org/. A country or territory is awarded zero to four points for each of 10 political rights indicators and 15 civil liberties indicators, which take the form of questions; a score of zero represents the smallest degree of freedom and four the greatest degree of freedom. The political rights questions are grouped into three subcategories: electoral process (three questions), political pluralism and participation (4), and functioning of government (3).
Freedom - civil liberties
Freedom measurements of political rights data are collected from https://freedomhouse.org/. A country or territory is awarded zero to four points for each of 10 political rights indicators and 15 civil liberties indicators, which take the form of questions; a score of zero represents the smallest degree of freedom and four the greatest degree of freedom. The civil liberties questions are grouped into four subcategories: freedom of expression and belief (four questions), associational and organizational rights (3), rule of law (4), and personal autonomy and individual rights (4).
Women's share of government ministerial position
The percentage of woman in ministerial positions. The total includes deputy prime ministers and ministers. Prime ministers/heads of government were also included when they held ministerial portfolios. Vice-presidents and heads of governmental or public agencies have not been included. Source: IPU. Data obtained from national governments, permanent missions to the United Nations and *publicly available information.
Proportion of seats held by women in national parliament
The percentage of women in unicameral parliaments. (Women / Total Seats in parliaments). Source: IPU. Data obtained from national governments, permanent missions to the United Nations and *publicly available information.
Palma ratio
The Palma ratio is the ratio of the expenditure/income share of the richest 10 per cent of the population to the expenditure/income share of the poorest 40 per cent of the population. It is based on the work of Palma (2006, 2011). The Palma ratio is based on the observation that the “middle” deciles (D5-D9) tend to capture some 50 per cent of national expenditure/income, and the other half of national expenditure/income is shared between the richest 10 per cent and the poorest 40 per cent. It can be argued that the ease of interpretation of the Palma ratio provides a more policy-relevant indicator of the extent of inequality and expenditure/income concentration in each country, and may be particularly relevant to poverty reduction policy. The Palma ratio is easy to interpret. If the ratio value is 0.25 this is perfect equality. There is no upper limit of the index. If the ratio value is two, this means that the richest decile have twice the share of the national expenditure/income of the 40 per cent poorest. In this particular study, we adopt the focus of Palma ratio on the top 10 per cent and bottom 40 per cent to look at how various development indicators (other than income/expenditure that originally used for Palma ratio) are distributed among different population groups. However, since most of the indicators are in proportion or percentage, we use difference instead of ratio.
2.2 Data sources Throughout this chapter, we have used two type of data source: (1) Secondary data from various sources (2) Household survey data. The sources for the secondary data are official publications from BPS and the
55
World Bank’s World Development Indicators. The second type of data used is the National Socioeconomic Survey (Susenas) for the years 2000-2015 (15 years). Susenas are regular large-scale multi-purpose socio-economic surveys initiated between 1963–1964. Susenas has been conducted every two or three years from 1984 to 1989 and annually since. Since 1993, the Susenas survey has covered a nationally representative sample typically composed of some 200,000 households. Each survey contains a core questionnaire which consists of a household roster listing gender, age, marital status, and educational attainment of household members, supplemented by modules covering about 60,000 households that are rotated over time to collect additional information such as health care and nutrition, household income and expenditure, and labour force activity (Surbakti 1995).

56
References Alderman, Harold, John Hoddinott, and Bill Kinsey (2006). "Long term consequences of early childhood
malnutrition." Oxford economic papers 58.3: 450-474. Alkire, S. and J. E. Foster (2011). “Counting and Multidimensional Poverty Measurement”, Journal of Public
Economics 95(7): 476–87. Alkire, S., J. M. Roche, and S. Seth (2011). “Sub-National Disparities and Inter-Temporal Evolution of
Multidimensional Poverty across Developing Countries”. Oxford Poverty and Human Development Initiative (OPHI) Research in Progress 32a. Oxford: OPHI.
Alkire, S. and M. E. Santos (2014). “Measuring Acute Poverty in the Developing World: Robustness and
Scope of the Multidimensional Poverty Index”, World Development 59: 251–74. Alkire, S., J. Foster, S. Seth, M. Santos, J. Roche, and P. Ballon (2014). “Multidimensional Poverty
Measurement and Analysis: Chapter 1—Introduction, with James Foster, Suman Seth, Maria Emma Santos, Jose Manuel Roche, and Paola Ballon”. Oxford Poverty and Human Development Initiative (OPHI) Working Paper. Oxford: OPHI.
Artha, D. R. P., dan Dartanto, T (2014). “Multidimensional Approach to Poverty Measurement in
Indonesia.” LPEM-FEUI Working Paper 002. Armstrong, Shiro, and Rahardja, Sjamsu (2014). "Survey of Recent Developments." Bulletin of Indonesian
Economic Studies 50.1: 3-28. Asian Development Bank (ADB) (2012). Asian Development Outlook 2012: Confronting Rising
Inequality in Asia. Manila: ADB. Available at: https://www.adb.org/sites/default/files/publication/29704/ado2012.pdf
Bappenas (National Development Planning Agency) (2014). Rencana Pembangunan Jangka Menengah
Nasional (RPJMN) 2015–2019, buku II: Agenda pembangunan bidang [National Medium-Term Development Plan (RPJMN), book II: Field development agenda]. Jakarta: Bappenas
Badan Pusat Statistik (BPS) Statistics Indonesia. Available at: https://www.bps.go.id/ Block, Steven, andWebb, Patrick (2009). "Up in smoke: tobacco use, expenditure on food, and child malnutrition in developing countries." Economic Development and Cultural Change 58.1: 1-23. Brau, James C; Woller, Gary M (2004). The Journal of Entrepreneurial Finance and Business Ventures;
Greenwich9.1: 1-27. Burke, Paul J., and Budy P. Resosudarmo (2012). "Survey of recent developments." Bulletin of Indonesian
Economic Studies 48.3: 299-324. Cameron, Lisa (1999). “Survey of recent development.” Bulletin of Indonesian Economic Studies 35.1: 3-40. Daly, Anne, and Fane, George (2002). "Anti-poverty programmes in Indonesia." Bulletin of Indonesian
Economic Studies 38.3: 309-329.

57
Damuri, Yose R., and Day, Creina (2015). "Survey of recent developments." Bulletin of Indonesian Economic Studies 51.1: 3-27. Fiszbein, Ariel, and Norbert R. Schady (2009). “Conditional cash transfers: reducing present and future
poverty.” World Bank Publications. Hanandita, W., and Tampubolon, G (2015). “Multidimensional Poverty in Indonesia: Trend Over the Last
Decade.” Social Indicators Research, 1-29. Manning, Chris, and Devanto S. Pratomo (2013). "Do migrants get stuck in the informal sector? Findings
from a household survey in four Indonesian cities." Bulletin of Indonesian Economic Studies 49.2: 167-192.
McCawley, Peter (1998). "Development Assistance in Asia in the 1990s." Asian‐Pacific Economic Literature
12.1: 41-50. McLeod, Ross H (2005). "Survey of recent developments." Bulletin of Indonesian Economic Studies 41.2: 133-
157. Musari, Khairunnisa (2016). "Economic Sustainability For Islamic Nanofinance Through Waqf-Sukuk
Linkage Program (Case Study In Indonesia)." International Journal of Islamic Economics and Finance Studies 2.3.
Nazara, Suahasil, and Sri Kusumastuti Rahayu (2013). Programme Keluarga Harapan (PKH): Indonesian
conditional cash transfer programme. No. 42. International Policy Centre for Inclusive Growth. OECD (2014). Society at a Glance 2014: OECD Social Indicators, OECD Publishing, Paris. DOI: http://dx.doi.org/10.1787/soc_glance-2014-en OECD (2014). “Social spending is falling in some countries, but in many others it remains at historically
high levels,” Social Expenditure Update. Available at: https://www.oecd.org/els/soc/OECD2014-Social-Expenditure-Update-Nov2014-8pages.pdf
Palma, J.G., (2006). “Globalizing inequality: ‘Centrifugal’ and ‘centripetal’ forces at work.” DESA Working
Paper 35, New York: UN Department of Economic and Social Affairs. Palma, J.G., 2011, ‘Homogeneous middles vs. heterogeneous tails, and the end of the ‘Inverted-U’: The
share of the rich is what it’s all about’, Cambridge Working Papers in Economics 1111, Cambridge: University of Cambridge Department of Economics (later published in Development and Change, 42, 1, 87-153).
Prakarsa (2016). Available at: http://www.mpi-indonesia.org/ Samboh, Esther (2017). “COMMENTARY: High noon for Jokowi's social welfare ambitions.” The Jakarta
Post, 12 January 2017, Jakarta. Accessed on XXX. Available at: http://www.thejakartapost.com/academia/2017/01/12/commentary-high-noon-for-jokowis-social-welfare-ambitions.html
Sato, Yuri, and Damayanti, Arie (2015). "Survey of recent developments." Bulletin of Indonesian Economic
Studies 51.2: 165-188.

58
Schrader, Heiko (1994). "Moneylenders and merchant bankers in India and Indonesia." Financial
Landscapes Reconstructed: 341-356. Sen, Kunal, and Liesbet Steer (2005). "Survey of recent developments." Bulletin of Indonesian economic
studies 41.3: 279-304. Sumarto, S., and De Silva, I (2014). “Beyond the headcount: Examining the dynamics and patterns of
multidimensional poverty in Indonesia (No. 60379). University Library of Munich, Germany. Surbakti (1995), SUSENAS: A Continual Data Source for Analysis of Welfare Development.
http://www.rand.org/content/dam/rand/www/external/labor/bps/manualpdf/susenas/surbakti_1995_review.pdf
Suryadarma, Daniel, and Sudarno Sumarto (2011). "Survey of recent developments." Bulletin of Indonesian
Economic Studies 47.2: 155-181. Suryahadi, Asep, Daniel Suryadarma, and Sudarno Sumarto (2009). "The effects of location and sectoral
components of economic growth on poverty: Evidence from Indonesia." Journal of Development Economics 89.1: 109-117.
Tempo.co Indonesian News Portal. Accessed on XXX. Available at:
https://en.tempo.co/read/news/2017/05/10/056874182/World-Bank-to-Finance-Indonesias-Social-Assistance-Program
UNDP (2010). Human Development Report. New York: OUP Weiss, Stanley (2017). “Surabaya’s Mrs. Mayor: Indonesia’s Best-Kept Secret.” Huffington Post. Accessed
on XXX. Available at: http://www.huffingtonpost.com/stanley-weiss/surabayas-mrs-mayor-indon_b_3785172.html
WHO FCTC (2017). Parties to the WHO Framework Convention on Tobacco Control. Available at:
http://www.who.int/fctc/signatories_parties/en/ World Bank (2011). Program Keluarga Harapan: Main Findings from the Impact Evaluation of Indonesia’s
Pilot Household Conditional Cash Transfer Program, Jakarta World Development Indicators (WDI), World Bank. Accessed on 17 January 2016. Available at:
http://data.worldbank.org/indicator Yusuf, Arief, Komarulzaman, Ahmad, Purnagunawan, Raden and Resosudarmo, Budy, (2013). “Growth,
Poverty and Labor Market Rigidity in Indonesia: A General Equilibrium Investigation.” No 201304, Working Papers in Economics and Development Studies (WoPEDS), Department of Economics, Padjadjaran University. http://econpapers.repec.org/paper/unpwpaper/201304.htm
Yusuf, Arief Anshory, Arianto A. Patunru and Budy P. Resosudarmo (2017). "Reducing Petroleum Subsidy
in Indonesia: An Interregional General Equilibrium Analysis." Regional Growth and Sustainable Development in Asia. Springer International Publishing. 91-112.
59
Yusuf, Arief Anshory and Budy P. Resosudarmo (2008). "Mitigating distributional impact of fuel pricing reform: the Indonesian experience." ASEAN Economic Bulletin 25.1: 32-47.
Yusuf, Arief Anshory and Sumner, Andy (2014). “Indonesia’s jarring wealth gap.” Al Jazeera,. Accessed on
29 July 2014. Available at: http://www.aljazeera.com/indepth/opinion/2014/07/indonesia-jarring-wealth-gap-2014728101920261316.html
Yusuf, Arief Anshory and Sumner, Andy (2015). "Growth, Poverty, and Inequality under Jokowi." Bulletin
of Indonesian Economic Studies 51.3: 323-348. Yusuf, Arief Anshory (2017). “Resolving Nutrition Emergency as Precondition to Inclusive Growth, in
Revisiting Economic Policy Making in Indonesia,” Yose RIzal Damuri, Ira Setiati, dan David Christian (eds), CSIS/ERIA
Yusuf, Arief Anshory (2014). “International Commodity Prices and Inequality in Indonesia.” Working
Papers in Economics and Development Studies (WoPEDS) No. 201409. Department of Economics, Padjadjaran University. Available at: https://ideas.repec.org/p/unp/wpaper/201409.html